Insights into the evolution of the Great Plains grassland ...
Upload
independentCategory
view
2download
0
This paper was peer-reviewed for scientific content. Pages 951-960. In: D.E. Stott, R.H. Mohtar and G.C. Steinhardt (eds). 2001. Sustaining the Global Farm. Selected papers from the 10th International Soil
Conservation Organization Meeting held May 24-29, 1999 at Purdue University and the USDA-ARS National Soil Erosion Research Laboratory.
GPFARM: An Integrated Decision Support System for Sustainable Great Plains Agriculture
James C. Ascough II*, Marvin J. Shaffer, Dana L. Hoag, Gregory S. McMaster, Gale H. Dunn, Lajpat R. Ahuja and Mark A. Weltz
*James C. Ascough II, Marvin J. Shaffer, Gregory S. McMaster, Gale H. Dunn, Lajpat R. Ahuja, and Mark A. Weltz, USDA-ARS-NPA,
Great Plains Systems Research Unit, 301 S. Howes St., P.O. Box E, Fort Collins, CO 80522; Dana L. Hoag, Colorado State University, Department of Agricultural and Resource Economics, Fort Collins, CO 80523; *Corresponding Author: [email protected]
ABSTRACT The Great Plains is generally defined as North
Dakota, South Dakota, Nebraska, Kansas, Oklahoma, the Texas Panhandle, the southern part of Manitoba, Canada, and eastern regions of Colorado, Wyoming, and Montana. Throughout the Great Plains, agricultural production is limited by soil water and nutrient availability. Using and supplementing these resources to enhance production without damaging the environment is a major challenge. To meet this challenge, the GPFARM DSS was developed. GPFARM provides crop/livestock management support at the whole farm and ranch level with emphasis on water, nutrient, and pesticide management. In addition, GPFARM has strong links to economic and environmental analysis, site database generation, and site-specific management from which alternative farm and ranch agricultural management strategies can be developed and tested.
INTRODUCTION Sustainable agriculture in the Great Plains is a complex
problem that demands consideration of many interrelated factors, processes, and institutions. Great Plains producers must be able to wisely modify farm and ranch management practices to: 1) take advantage of the global economy; 2) keep abreast of new cropping, pest management, and tillage systems; and 3) comply with new legislation for protecting soil, air, and water resources. The need for a systems approach and networking of scientists for agricultural research and management in the Great Plains dates back at least 10-15 years, and was emphasized at a regional symposium “Sustainable Agriculture for the Great Plains” (Hanson et al., 1991) held in 1989 in Fort Collins, Colorado.
The feasibility of developing a decision support system (DSS) for the Great Plains has been demonstrated by simulation models such as Flexible Cropping Rotation System (FLEXCROP; Halvorson and Kresge, 1982), Nitrate Leaching and Economic Analysis Package (NLEAP; Shaffer et al., 1991), General Weed Model (GWM; Wiles et al., 1996), and Simulation Production and Utilization of Rangelands 2 (SPUR2; Hanson et al., 1992). NLEAP was used in the South Platte region of Colorado to delineate areas of high nitrate leaching and identify needed changes in management (Wylie et al., 1994). SPUR2 has been used to investigate the effect of predicted environmental change on
livestock production in the Great Plains (Hanson et al., 1993; Baker et al., 1993). In addition, agricultural DSS’s with varying capabilities have been developed in the U.S., Canada, and Australia; e.g., FARMBOOK (Alessi, 1994), Multiple Objective Decision Support System (MODSS; Yakowitz et al., 1993), Cropping Systems Simulation Model (CROPSYST; Stockle, 1994), Crop Rotation Planning System (CROPS; Stone, 1992), PLANETOR (Center for Farm Financial Management, Univ. of Minnesota, 1995), Grazing Lands Application (GLA; Stuth et al., 1991), and Model of an Integrated Dryland Agricultural System (MIDAS; Pannell, 1996). MIDAS, the Australian effort, is unique because it links management decisions for both crop and animal production on a whole-farm scale.
Discussions with a number of producers in eastern Colorado indicated that the inaccessibility of research data and difficulties in synthesizing the various management recommendations were the primary obstacles to using research results. A 1995 survey of nearly 1000 Great Plains producers supported our hypothesis that many farmers and ranchers could improve the management of their production systems if these obstacles were lessened or removed through an integrated systems approach, such as a DSS (Ascough et al., 1999; Hoag et al., 1999).
Central to these planning discussions, research was initiated to conceptualize and develop the Great Plains Framework for Agricultural Resource Management (GPFARM) computer-based DSS for Great Plains agriculture. The USDA-ARS Great Plains Systems Research Unit, in a collaborative effort with Colorado State University and other ARS units, initiated GPFARM software development in 1994. The overall goal of GPFARM is to determine the long-term effects of alternative Great Plains farming and ranching practices on environmental and economic sustainability. GPFARM (Version 1.6) is capable of analyzing both medium- and long-term management plans, and implements an integrated systems (whole farm and ranch) operational framework to address the problems of Great Plains agriculture. GPFARM is currently being tested on both irrigated and non-irrigated ARS farm cooperator sites in eastern Colorado, southeastern Wyoming, and western Kansas and Nebraska. General experimental cropping systems include rotations containing dryland corn, winter wheat, sunflower, sorghum, and millet (proso and foxtail) crops (e.g., a winter wheat-corn-millet-fallow
rotation), and continuous irrigated corn. In addition, GPFARM is being tested on integrated cropping and livestock production farms. Specific features of GPFARM include: − A combination of site-specific databases and
environmental modeling with economic analysis to provide whole farm and ranch strategic planning. GPFARM allows analysis and comparison of multiple management scenarios; these analyses may be performed on individual land management units (e.g., areas of similar soils or crop management) or combinations of land management units up through the field to whole farm and ranch hierarchy.
− GPFARM is specifically targeted for use by computer oriented producers, agricultural consultants, and Extension Service personnel. It has been designed for IBM-compatible personal computers (PCs), runs in the Microsoft WindowsTM 98/Millenium/2000-based operating environments, and is being developed under Microsoft Visual C++ 6.0TM. The target run-time goal for any given whole farm and ranch analysis is ten minutes on a Pentium III/4-based PC; initial setup of GPFARM is more time consuming.
− GPFARM consists of a graphical user interface (GUI), site-specific Microsoft AccessTM databases (currently populated for eastern Colorado climatic conditions and cropping systems), and an object-oriented (OO) framework encapsulating science (simulation) modules. Additional stand-alone modules in GPFARM include economic analysis (farm and ranch), information system, and multicriteria decision support. On-line
documentation and help systems enable users unfamiliar with GPFARM to initialize the software program, run the simulation model, and interpret the results. The objectives of this paper are to: 1) communicate the
general development approach for GPFARM; and 2) provide descriptions of the GPFARM simulation framework/model and graphical user interface (GUI).
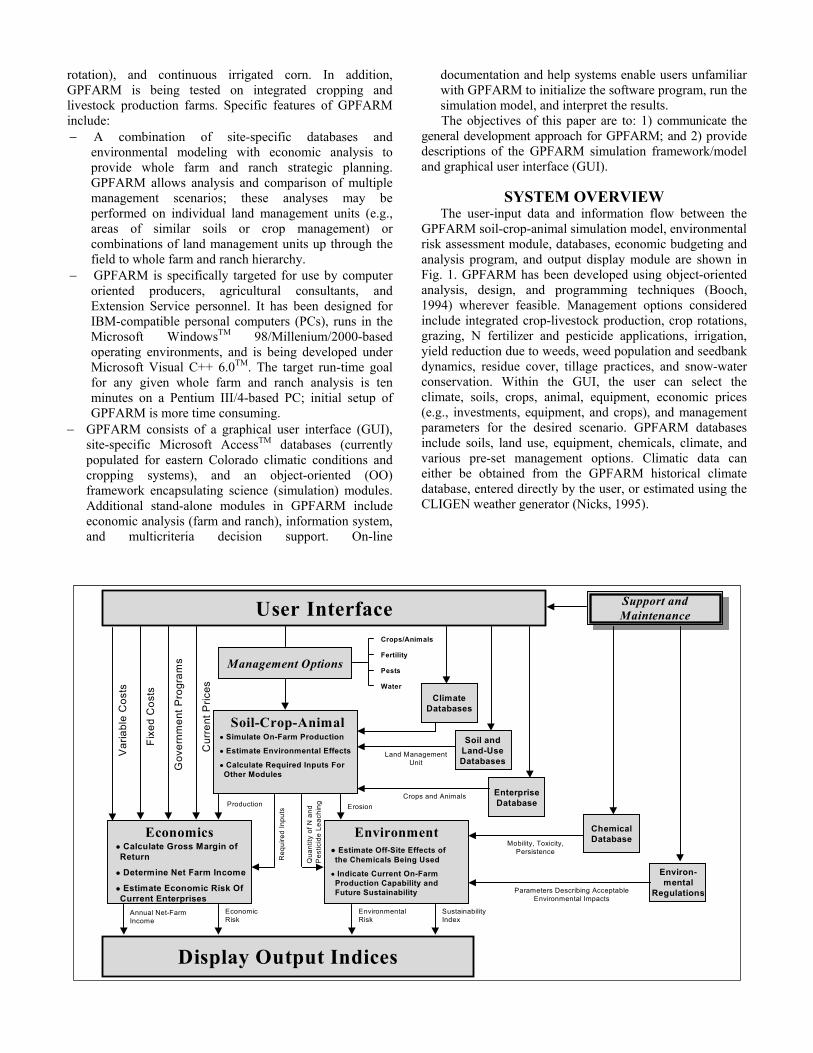
SYSTEM OVERVIEW The user-input data and information flow between the
GPFARM soil-crop-animal simulation model, environmental risk assessment module, databases, economic budgeting and analysis program, and output display module are shown in Fig. 1. GPFARM has been developed using object-oriented analysis, design, and programming techniques (Booch, 1994) wherever feasible. Management options considered include integrated crop-livestock production, crop rotations, grazing, N fertilizer and pesticide applications, irrigation, yield reduction due to weeds, weed population and seedbank dynamics, residue cover, tillage practices, and snow-water conservation. Within the GUI, the user can select the climate, soils, crops, animal, equipment, economic prices (e.g., investments, equipment, and crops), and management parameters for the desired scenario. GPFARM databases include soils, land use, equipment, chemicals, climate, and various pre-set management options. Climatic data can either be obtained from the GPFARM historical climate database, entered directly by the user, or estimated using the CLIGEN weather generator (Nicks, 1995).
User Interface
Management OptionsPests
Water
Fertility
Crops/Animals
Var
iabl
e C
osts
Fixe
d C
osts
Cur
rent
Pric
es
Support andMaintenance
Display Output Indices
Land ManagementUnit
Crops and Animals
Mobility, Toxicity,Persistence
Parameters Describing AcceptableEnvironmental Impacts
Soil-Crop-Animal
Economics Environment
Simulate On-Farm Production
Estimate Environmental Effects
Calculate Required Inputs ForOther Modules
Calculate Gross Margin ofReturn
Determine Net Farm Income
Estimate Economic Risk OfCurrent Enterprises
Estimate Off-Site Effects ofthe Chemicals Being Used
Indicate Current On-FarmProduction Capability andFuture Sustainability
Production
Req
uire
d In
puts
Qua
ntity
of N
and
Pes
ticid
e Le
achi
ng Erosion
ClimateDatabases
Soil andLand-UseDatabases
EnterpriseDatabase
ChemicalDatabase
Environ-mental
Regulations
Annual Net-FarmIncome
EconomicRisk
EnvironmentalRisk
SustainabilityIndex
Gov
ernm
ent P
rogr
ams
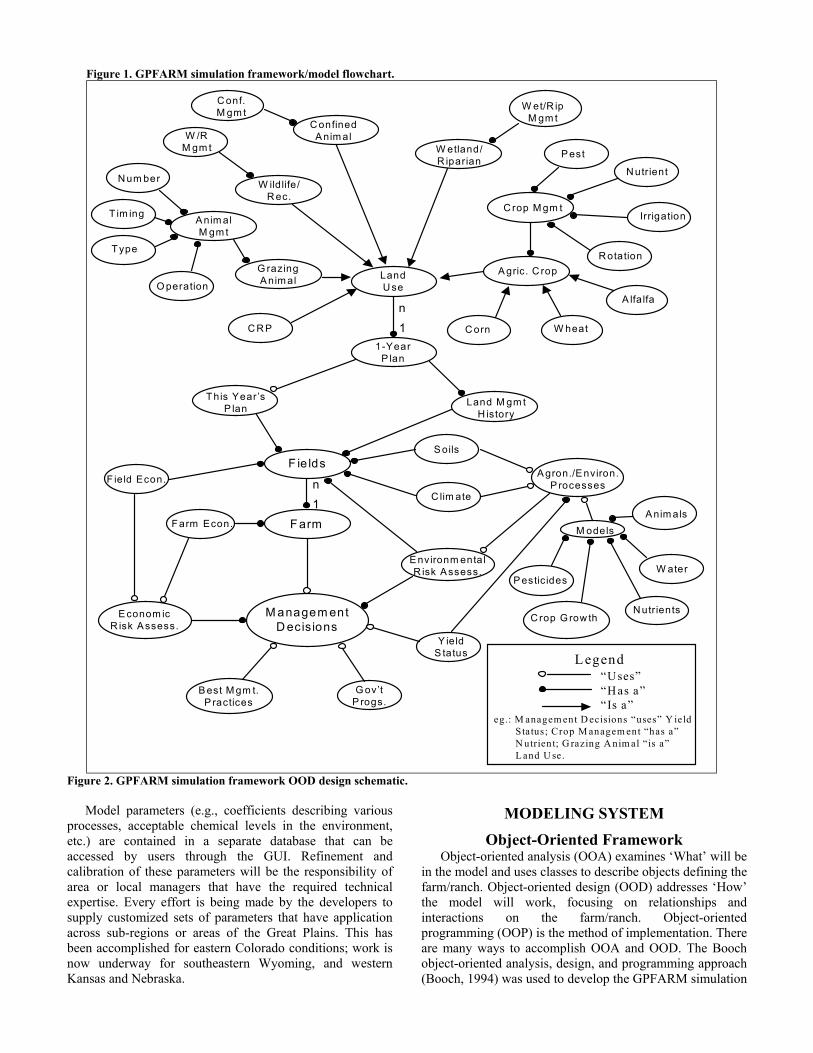
Figure 1. GPFARM simulation framework/model flowchart.
C onf.M gm t
“U ses”“H as a”“Is a”
Legend
M anagem entD ecisions
B est M gm t.P ractices
E conom icR isk Assess.
G ov’tP rogs.
Y ieldS tatus
E nvironm entalR isk Assess.
P estic ides
C rop G row thN utrients
W ater
A nim alsFarmFarm Econ.
F ie ldsF ield Econ.
C lim ate
S oils
M odels
A gron./Environ.P rocesses
This Year’sP lan Land M gm t
H istory
n1C R P
1-YearP lan
LandU se
C orn W heat
P est
N utrient
Irrigation
R otation
C rop M gm t
A gric. C rop
W etland/R iparian
G razingA nim alO peration
Type
T im ing
N um ber
A nim alM gm t
W ildlife/R ec.
W /RM gm t
C onfinedA nim al
W et/R ipM gm t
n1
A lfa lfa
eg.: M anagem ent D ecisions “uses” Y ieldStatus; Crop M anagem ent “has a” N utrient; G razing A nim al “is a” L and U se.
Figure 2. GPFARM simulation framework OOD design schematic.
Model parameters (e.g., coefficients describing various processes, acceptable chemical levels in the environment, etc.) are contained in a separate database that can be accessed by users through the GUI. Refinement and calibration of these parameters will be the responsibility of area or local managers that have the required technical expertise. Every effort is being made by the developers to supply customized sets of parameters that have application across sub-regions or areas of the Great Plains. This has been accomplished for eastern Colorado conditions; work is now underway for southeastern Wyoming, and western Kansas and Nebraska.
MODELING SYSTEM
Object-Oriented Framework Object-oriented analysis (OOA) examines ‘What’ will be
in the model and uses classes to describe objects defining the farm/ranch. Object-oriented design (OOD) addresses ‘How’ the model will work, focusing on relationships and interactions on the farm/ranch. Object-oriented programming (OOP) is the method of implementation. There are many ways to accomplish OOA and OOD. The Booch object-oriented analysis, design, and programming approach (Booch, 1994) was used to develop the GPFARM simulation
framework (Shaffer et al., 2000) and classify key places, players, and events in the whole farm system.
The object where spatial data information is stored includes the following hierarchies or spatial units: whole farm, field, and management unit (MU). The MU, defined by a unique soil, management, or land use type, is the basic spatial unit used for simulation. Temporal changes or transient objects on the MU’s (e.g., animal herds) are simulated through the use of management events (e.g., tillage or application of chemicals). The management event controller inherits information from the highest level in the framework. This control hierarchy allows events to be implemented by a calendar date, the firing of a system rule, or through interaction with another MU. In essence, the simulation framework is responsible for controlling the simulation model and connecting it to the whole farm and ranch spatial system. A schematic of the primary objects in the simulation framework is presented in Figure 2.
Simulation Model The soil-crop-animal simulation model consists of
modules for mathematically simulating the various biological, physical, and chemical processes involved in crop-animal production systems; e.g., runoff, erosion, infiltration, evapotranspiration (ET), plant and animal growth, carbon (C) and nitrogen (N) cycling and uptake, NO3 leaching, pesticide transport, etc. Intra-farm transfers of resources (e.g., manure application and feeding of forage) are allowed between MU’s. Based on the selected management options and data from the various databases, the simulation model predicts crop and animal production, water use, nutrient cycling and uptake, nutrient losses (runoff, sediment, and groundwater), erosion (water and wind), and pesticide losses (runoff, sediment, and groundwater). These quantities are used for subsequent economic and environmental risk analysis.
The GPFARM soil C and N cycling and surface residue modules simulate the C and N cycles both within the soil profile and on the soil surface. This allows for decay of residues to form soil organic matter and ammonium, conversion of ammonium to nitrates, and losses of gaseous N from the system as N2+N2O and NH3 gases. The soil nutrient modules were adapted from the NLEAP model (Shaffer et al., 1991). Extensions were added to allow improved simulation of surface residue decay and independent tracking of multiple residue applications (crop residues, manure, and other organic compounds) from soil addition or incorporation until they become part of the soil humus pools. The remainder of the carbon and nitrogen cycling processes simulated, including mineralization, immobilization, nitrification, ammonia volatilization, and denitrification, were transferred directly from the NLEAP nutrient sub-model.
The GPFARM Water Balance and Chemical Transport Module (WBCT) provides daily soil water budget and chemical balance for a layered soil profile using the equation: SWC = SWCIN + P – Q – ET – D ± S (1) where SWC is the soil water content in the root zone in any
given day (m), SWCIN is the initial soil water content in the root zone (m), P is the precipitation (m), Q is the amount of surface runoff (m), ET is the amount of evapotranspiration (m), D is the amount of percolation loss below the root zone (m), and S is the snow water content (m) [+ for snowmelt and – for snow accumulation]. Major processes considered for water movement are precipitation, snow melt, infiltration, runoff, soil water redistribution, soil water evaporation, and plant transpiration. Nitrate and pesticides are co-transported with water with possible retardation from soil adsorption. The WBCT module also allows for adjustment of soil hydraulic properties due to tillage, residue cover, soil crust, and soil macropore presence. The WBCT module is capable of simulating upward flux from a water table and it includes the effect of restrictive soil layer on water and chemical leaching.
The crop growth model in GPFARM was adapted from the Water Erosion Prediction Project (WEPP) crop growth model (Arnold et al., 1995), which is based on the Environmental Policy Integrated Climate (EPIC) crop model (Williams et al., 1989). The GPFARM crop growth model uses concepts of phenological crop development based on daily accumulated heat units, harvest index for partitioning grain yield, Montieth’s approach for determining potential biomass (Montieth, 1977), and water, N, and temperature stress adjustments. A single model is used for simulating various crops by changing model parameters. Annual crops grow from planting date to harvest date, which is estimated using accumulated heat units. Phenological development of the crop is based on daily heat unit accumulation. Heat units are computed using the equation:
j,Tb2
TTHU 1mn1,mx −
+= (2)
where HUi, Tmx,i, and Tmn,i are the values of heat units, maximum temperature, and minimum temperature in °C on day i, and Tb is the crop-specific base temperature in °C (no growth occurs at or below Tb) of crop j. A heat unit index (HUI), ranging from 0 at planting to 1 at physiological maturity, is computed by the ratio of accumulated heat units to date to heat units required to reach maturity.
The GPFARM water erosion module uses the Chemicals, Runoff, and Erosion from Agricultural Management Systems (CREAMS; Knisel, 1980) model characteristic rainfall and runoff factors for a storm to compute detachment and sediment transport. Sediment load is assumed to be limited by either the amount of sediment made available by detachment or by transport capacity. A quasi-steady state is assumed and sediment movement downslope obeys continuity of mass as expressed by the equation (Foster et al., 1980):
FLed DD
dxdq
+= (3)
where qsed is the sediment load (kg⋅m-1⋅s-1), x is distance (m), DL is the lateral sediment inflow (kg⋅m-2⋅s-1), and DF is detachment or deposition by flow (kg⋅m-2⋅s-1). In general, the algorithms for detachment-transport-deposition are slight modifications of those found in the CREAMS model. Overland flow computational segments are used to represent
major topographical (e.g., slope and surface roughness) features of an MU hillslope. The erosion computations proceed down the length of the MU through the segments. Sediment concentration for each particle type is output (calculated) for each segment and then becomes the input to the next segment in the MU hillslope sequence.
The GPFARM Weed Population Dynamics Module (WPD) simulates changes in cropland weed population density over time in response to management including chemical and mechanical weed control and crop rotation. It also estimates percent crop yield loss due to weed competition for each crop in the simulation. Currently, the WPD module is parameterized for 17 annual weed species (both herbicide and non-herbicide resistant) and five crops. Emergence is simulated for each weed species, with response to management and herbicides influencing seed production. Each weed has a unique emergence pattern over time, and the total number of plants that have emerged by a given day is the cumulative percent emergence multiplied by the potential weed pressure. The potential weed pressure is derived from user input for the first year and simulated for every year after that. The number of weeds remaining at the end of the crop competitive period (a specific number of days after crop planting, e.g., 50 days for corn) is then used to calculate the percent yield loss of the crop.
The rangeland (animal) component of the GPFARM science model consists of modules for simulating forage and livestock (beef cattle) dynamics. The forage model simulates biomass production of five functional plant groups, including warm-season grasses (C4), cool-season grasses (C3), legumes, shrubs, and forbs. Each forage group is responsive to changes in soil moisture, plant-available nitrogen, and temperature. Herd dynamics and animal growth are simulated by the livestock module. The herd consists of mature cows, pregnant cows, heifers, female calves, and male calves. Bulls are used to impregnate the cows, but their growth and dynamics are not simulated. Carrying capacity for the site is determined and the herd is culled so that overgrazing does not occur. Replacement heifers are added to the herd each year at a rate set by the user. The remaining female calves are culled and all male calves are culled as steers. Finally, any empty cows are culled and pregnant cows are culled to meet the site carrying capacity.
Cattle growth is determined by calculating the daily requirement for each class of animal. Demand for total digestible nutrient (TDN) is determined for each livestock class. This need can be met by either supplemental feed or forage. When grazing is allowed on a site (after forage production begins), both can be used to meet the animals’ demand. The maintenance energy requirement (as TDN) is also calculated based on the animal weight. Calves are given milk as the bulk of their diet. After weaning, the calves diet is determined the same as for the older classes of cattle.
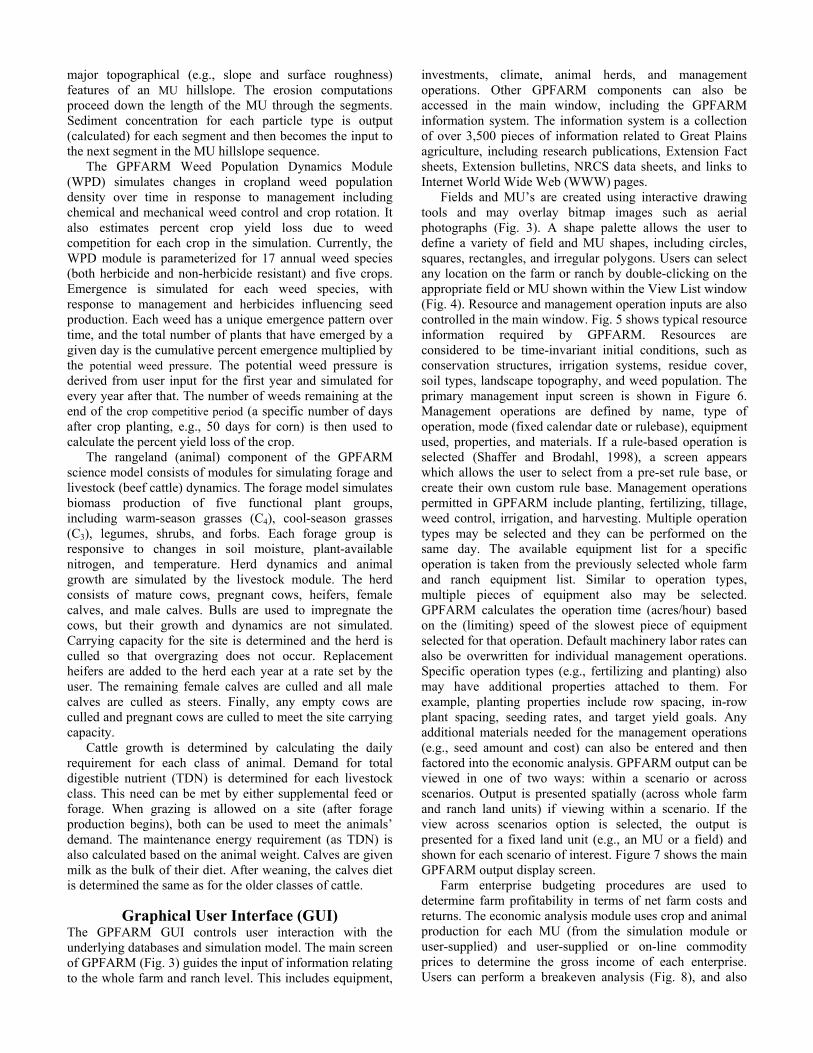
Graphical User Interface (GUI) The GPFARM GUI controls user interaction with the underlying databases and simulation model. The main screen of GPFARM (Fig. 3) guides the input of information relating to the whole farm and ranch level. This includes equipment,
investments, climate, animal herds, and management operations. Other GPFARM components can also be accessed in the main window, including the GPFARM information system. The information system is a collection of over 3,500 pieces of information related to Great Plains agriculture, including research publications, Extension Fact sheets, Extension bulletins, NRCS data sheets, and links to Internet World Wide Web (WWW) pages.
Fields and MU’s are created using interactive drawing tools and may overlay bitmap images such as aerial photographs (Fig. 3). A shape palette allows the user to define a variety of field and MU shapes, including circles, squares, rectangles, and irregular polygons. Users can select any location on the farm or ranch by double-clicking on the appropriate field or MU shown within the View List window (Fig. 4). Resource and management operation inputs are also controlled in the main window. Fig. 5 shows typical resource information required by GPFARM. Resources are considered to be time-invariant initial conditions, such as conservation structures, irrigation systems, residue cover, soil types, landscape topography, and weed population. The primary management input screen is shown in Figure 6. Management operations are defined by name, type of operation, mode (fixed calendar date or rulebase), equipment used, properties, and materials. If a rule-based operation is selected (Shaffer and Brodahl, 1998), a screen appears which allows the user to select from a pre-set rule base, or create their own custom rule base. Management operations permitted in GPFARM include planting, fertilizing, tillage, weed control, irrigation, and harvesting. Multiple operation types may be selected and they can be performed on the same day. The available equipment list for a specific operation is taken from the previously selected whole farm and ranch equipment list. Similar to operation types, multiple pieces of equipment also may be selected. GPFARM calculates the operation time (acres/hour) based on the (limiting) speed of the slowest piece of equipment selected for that operation. Default machinery labor rates can also be overwritten for individual management operations. Specific operation types (e.g., fertilizing and planting) also may have additional properties attached to them. For example, planting properties include row spacing, in-row plant spacing, seeding rates, and target yield goals. Any additional materials needed for the management operations (e.g., seed amount and cost) can also be entered and then factored into the economic analysis. GPFARM output can be viewed in one of two ways: within a scenario or across scenarios. Output is presented spatially (across whole farm and ranch land units) if viewing within a scenario. If the view across scenarios option is selected, the output is presented for a fixed land unit (e.g., an MU or a field) and shown for each scenario of interest. Figure 7 shows the main GPFARM output display screen.
Farm enterprise budgeting procedures are used to determine farm profitability in terms of net farm costs and returns. The economic analysis module uses crop and animal production for each MU (from the simulation module or user-supplied) and user-supplied or on-line commodity prices to determine the gross income of each enterprise. Users can perform a breakeven analysis (Fig. 8), and also
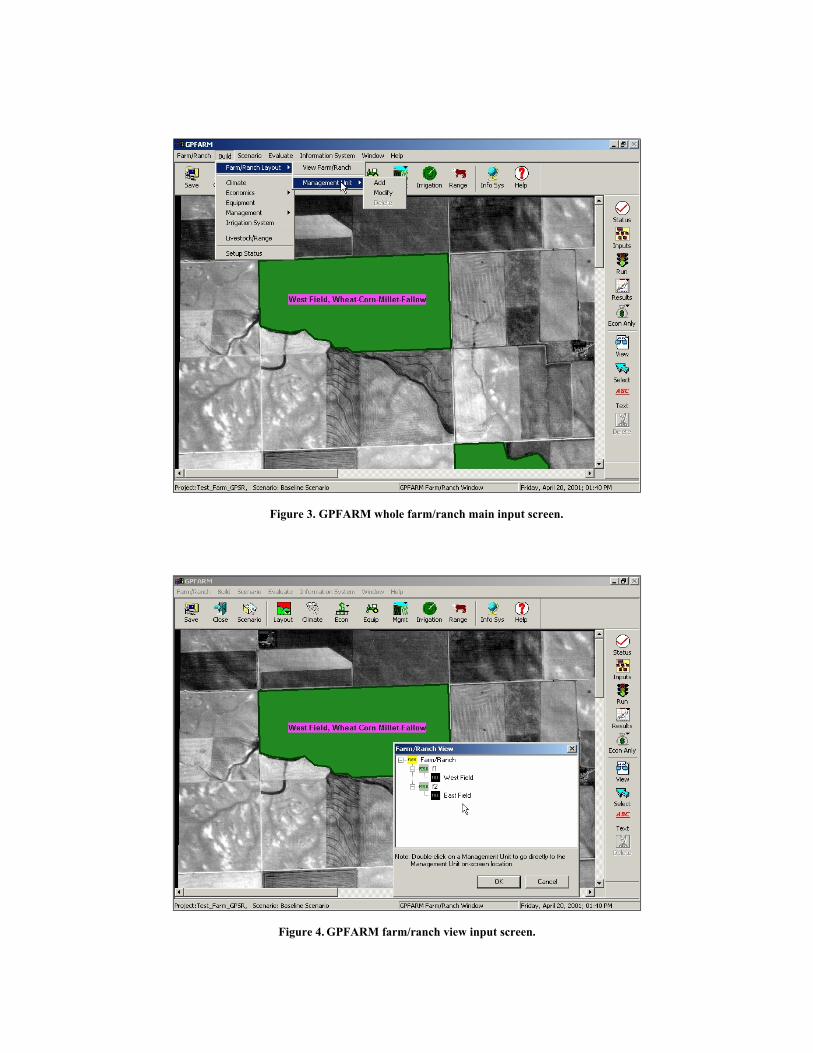
Figure 3. GPFARM whole farm/ranch main input screen.
Figure 4. GPFARM farm/ranch view input screen.
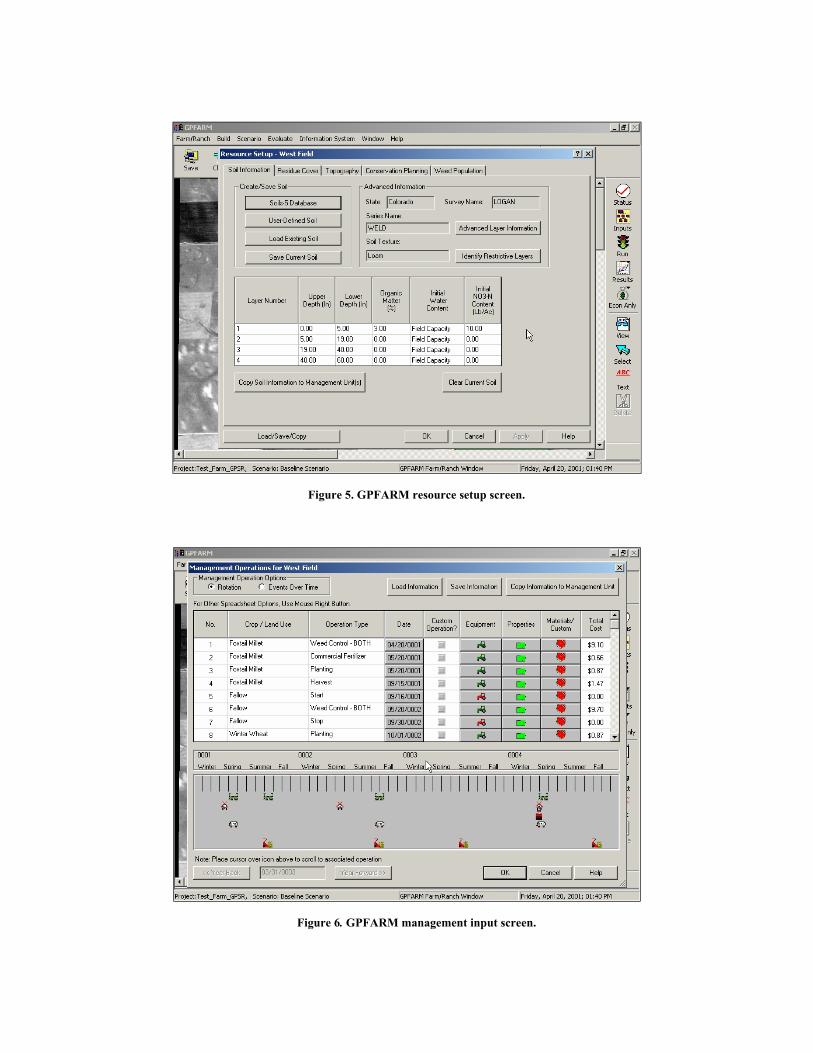
Figure 5. GPFARM resource setup screen.
Figure 6. GPFARM management input screen.
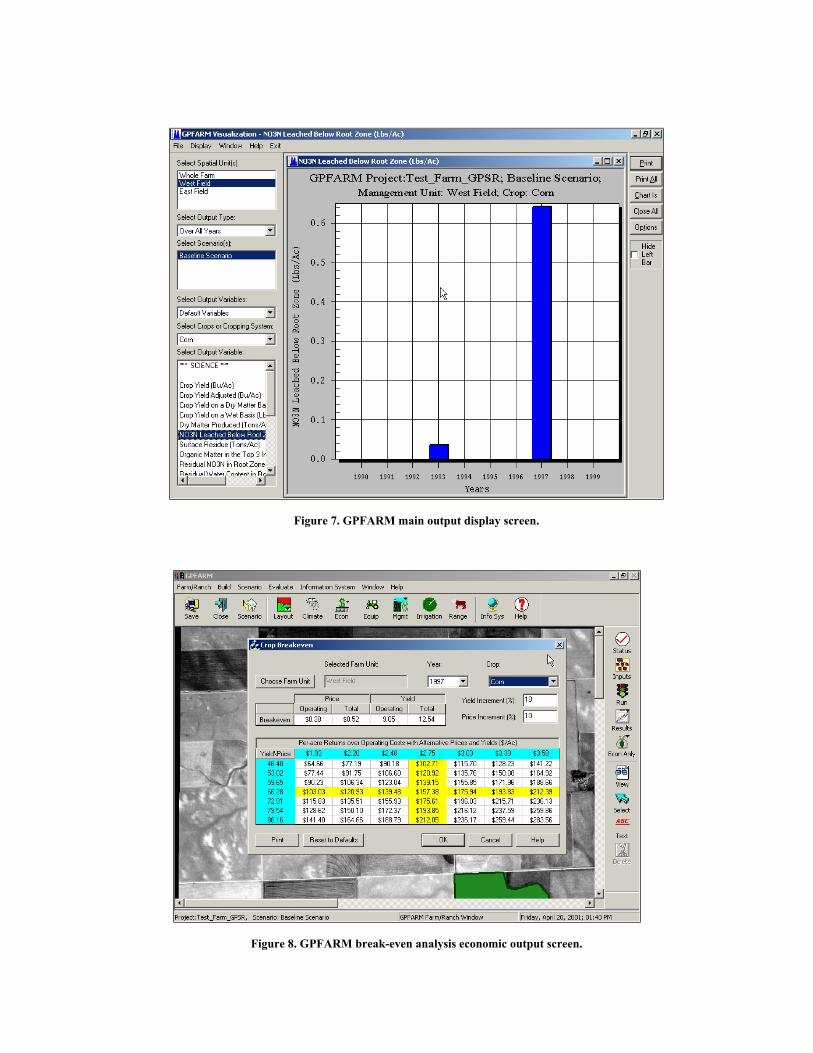
Figure 7. GPFARM main output display screen.
Figure 8. GPFARM break-even analysis economic output screen.
view a standard budget that shows costs vs. returns on an enterprise (crop rotation system), crop (individual crop) or temporal (year-by-year) basis. Variable costs for each enterprise are calculated from the required production inputs. Additionally, detailed economic output is available for machine and materials input.
Development Phases GPFARM is being developed in two distinct phases;
development effort is currently reaching the end of Phase 1. The primary Phase 1 objective is to allow cooperators (producers and consultants) to analyze their production operations using GPFARM. Phase 1 has been limited to dryland and irrigated cropping systems incorporating winter wheat, corn, proso and foxtail millet, sunflower, sorghum, fallow, and a livestock component of rangeland cattle. The region of emphasis includes eastern Colorado, southeastern Wyoming, and western Kansas and Nebraska. GPFARM evaluation and assessment by producers from these regions has been encouraging. The final Phase 1 development release will be GPFARM Version 2.0.
Phase 2 will extend the geographic area of consideration to the entire Great Plains and will incorporate additional crops (e.g., soybeans, alfalfa, etc.) and additional range options (e.g., confined livestock operations). Integration of GPFARM into a geographic information system (GIS) framework is also being considered for Phase 2. The primary objective of Phase 2 is to develop a GPFARM DSS useful for real-time management of crop and animal production systems. The GUI for input and output of information will likely be further enhanced from Version 2.0, i.e., GIS technology will be used to manage the detailed information for describing management- and field-level variability within an individual farm or ranch. The product at the end of Phase 2 will be GPFARM Version 3.0.
SUMMARY GPFARM integrates appropriate research findings and
associated economic and environmental risks into a whole farm and ranch decision support system package. Results from the DSS are providing producers, agricultural consultants, action agencies, and scientists with information for making management decisions that promote sustainable agriculture. In addition, GPFARM provides feedback concerning the most effective management technologies and practices, and assists in identifying areas requiring further research and development. This is an evolutionary process that has closely coupled research and technology transfer.
In conclusion, GPFARM accounts for production economics and environmental impacts that aid targeted users in making advanced planning decisions before alternative management strategies are implemented. GPFARM integrates crop and livestock production, and contains risk analysis modules that combine projected crop yield and animal production data with concurrent environmental impact and economic data. GPFARM will continue to be developed and tested, and has a strong potential for extension to agricultural management support on a national basis.
ACKNOWLEDGEMENTS The authors wish to thank the following individuals who
have participated in GPFARM development for their exceptional efforts: Patricia Bartling, Gerald Buchleiter, Stephen Canner, Lois Ann Deer-Ascough, Gale Dunn, Debbie Edmunds, Jon Hanson, Daniel Palic, Harriet Rector, Bruce Vandenberg, and Lori Wiles. For more information about GPFARM, please contact: Dr. Gale H. Dunn, USDA-ARS-NPA, Great Plains Systems Research Unit, 301 S. Howes St., P.O. Box E, Fort Collins, CO 80522. Phone: (970) 490-8320; Fax: (970) 490-8310; E-mail: [email protected]
REFERENCES Alessi, R.S., S. Oberle and M.E. Mayhew. 1994. Systems
engineering principles and applications for the design of a whole-farm information system. J. Prod. Agric. 7(1):135-143.
Arnold, J.G., M.A. Weltz, E.E. Alberts and D.C. Flanagan. 1995. Plant growth component. p. 8.1-8.41. In D.C. Flanagan, M.A. Nearing, and J.M. Laflen (eds.) USDA-Water Erosion Prediction Project: Hillslope Profile and Watershed Model Documentation. NSERL Report No. 10, USDA-ARS National Soil Erosion Research Laboratory, West Lafayette, IN.
Ascough II, J.C., D.L. Hoag, W.M. Frasier and G.S. McMaster. 1999. Computer use in agriculture: An analysis of Great Plains producers. Comp. Elect. Agric. 23:189-204.
Baker, B.B., J.D. Hanson, R.M. Bourdon and J.B. Eckert. 1993. Analysis of the potential effects of climate change on rangeland ecosystems. Climate Change 25:97-117.
Booch, G. 1994. Object-oriented analysis and design. Addison-Wesley Pub. Comp., Redwood City, CA. 589 pp.
Center for Farm Financial Management. 1995. Planetor user’s manual. Department of Agricultural and Applied Economics, Minnesota Extension Service, University of Minnesota, Minneapolis, MN. 117 pp.
Foster, G.R., L.J. Lane, J.D. Nowlin, J.M. Laflen and R.A. Young. 1980. A model to estimate sediment yield from field-sized areas: Development of model. p. 193-281. In W.G. Knisel (ed.) CREAMS: A Field-Scale Model for Chemicals, Runoff, and Erosion From Agricultural Management Systems, Vol. II: User Manual. Conservation Research Report No. 26., USDA-Sci. and Educ. Admin., Washington, D.C.
Halvorson, A.D. and P.O. Kresge. 1982. FLEXCROP: A dryland cropping systems model. Production Res. Rep. No. 180, USDA-Sci. and Educ. Admin., Washington, D.C. 49 pp.
Hanson, J.D., B.B. Baker and R.M. Bourdon. 1993. Comparison of the effects of different climate change scenarios on rangeland livestock production. Agric. Syst. 41:487-502.
Hanson, J.D., B.B. Baker and R.M. Bourdon. 1992. SPUR2: Model description and user guide. GPSR Technical Report No. 1, Fort Collins, CO. 243 pp.
Hanson, J.D., M.J. Shaffer, D.A. Ball and C.V. Cole (eds.). 1991. Proc. Sustainable Agriculture for the Great Plains, Fort Collins, CO. 6-8 March 1989. USDA-ARS, Publication ARS-89, Fort Collins, CO.
Hoag, D.L., J.C. Ascough II and W.M. Frasier. 1999. Farm computer adoption, use and satisfaction. J. Agric. App. Econ 31(1): 57-67.
Knisel, W.G. (ed). 1980. CREAMS: A Field-Scale Model for Chemicals, Runoff, and Erosion From Agricultural Management Systems. Conservation Research Report No. 26, USDA-Sci. and Educ. Admin., Washington, D.C. 524 pp.
Montieth, J.L. 1977. Climate and the efficiency of crop production in Britain. Phil. Trans. Res. Soc. London B. 281:277-329.
Nicks, A.D., L.J. Lane and G.A. Gander. 1995. Weather generator. p. 2.1-2.22. In D.C. Flanagan, M.A. Nearing, and J.M. Laflen (eds.) USDA-Water Erosion Prediction Project: Hillslope Profile and Watershed Model Documentation. NSERL Report No. 10, USDA-ARS National Soil Erosion Research Laboratory, West Lafayette, IN.
Pannell, D.J. 1996. Lessons from a decade of whole-farm modelling in Western Australia. Rev. Agric. Econ. 18: 373-383.
Shaffer, M.J. and M.K. Brodahl. 1998. Rule-based management for simulation in agricultural decision support systems. Comp. Elect. Agric. 21:135-152.
Shaffer, M.J., P.N.S. Bartling and J.C. Ascough II. 2000. Object-oriented simulation of integrated whole farms: GPFARM framework. Comp. Elect. Agric. 28:29-49.
Shaffer, M.J., A.D. Halvorson and F.J. Pierce. 1991. Nitrate Leaching and Economic Analysis Package (NLEAP): Model description and application. p. 285-322. In R. Follett et al. (eds.) Managing Nitrogen for Groundwater Quality and Farm Profitability. Soil Science Society of America, Madison, WI. 372 pp.
Stockle, C.O., S. Martin and G.S. Campbell. 1994. CropSyst, a cropping systems model: water/nitrogen budgets and crop yield. Agric. Syst. 46:335-359.
Stone, N.D., R.D. Buick, J.W. Roach, R.K. Scheckler and R. Rupani. 1992. The planning problem in agriculture: Farm-level crop rotation planning as an example. AI App. 6(1): 59-75.
Stuth, J.W., C.J. Scifres, W.T. Hamilton and J.R. Conner. 1991. Management systems analysis as guidance for effective interdisciplinary grazing land research. Agric. Syst. 36:43-63.
Wiles, L.J., R.P. King, E.E. Schweizer, D.W. Lybecker and S.M. Swinton. 1996. GWM: General weed management model. Agric. Syst. 50:355-376.
Williams, J.R., C.A. Jones, J.R. Kiniry and D.A. Spanel. 1989. The EPIC crop growth model. Trans. ASAE 32(2):497-511.
Wylie, B.K., M.J. Shaffer, M.K. Brodahl, D. Dubois and D.G. Wagner. 1994. Predicting spatial distributions of nitrate leaching in northeastern Colorado. J. Soil Wat. Cons. 49:288-293.
Yakowitz, D.S., J.J. Stone, L.J. Lane, P. Heilman, J. Masterson, J. Abolt and B. Imam. 1993. A decision support system for evaluating the effects of alternative farm management systems on water quality and economics. Water Sci. Tech. 28:47-54.
Copyright © 2022 FDOKUMEN