Great Plains - Natural Resources Conservation Service
37
Great Plains The Great Plains region includes the greatest expanse of grasslands in the United States. The ten plains states extend east from the Rocky Mountains (originating in Canada) to the Central Lowlands in New Mexico. The vegetation of the Great Plains is highly diverse and is a “land of marked contrasts and limitless variety: canyons carved into solid rock of an arid land by the waters of the Pecos and the Rio Grande; the seemingly endless grainfields of Kansas; the desolation of the Badlands; and the beauty of the Black Hills” (Trimble, 1980). The region boundaries (Figure 1) include the tallgrass, mixed grass, and shortgrass prairies. Although grasslands are the dominant vegetation type, shrub, forest and woodland vegetation also exists throughout the region. The northeastern portion and central area of New Mexico support more species associated with shortgrass. The Southwestern Tablelands situated in central New Mexico supports juniper-scrub-oak-grass savannahs. Biodiversity is high in the Great Plains. The USDA-NRCS NRI data set for the Great Plains includes 146 plant families and 764 plant genera. The breakdown of plant growth habit is as follows: 483 graminoids, 950 forb/herbs, 393 shrubs and subshrubs, and 174 tree species. Figure 1. Broad Regions Described in the Interpretations The grasslands in the Great Plains are associated with high productivity due to the generally reliable summer precipitation, a long growing season, and deep, fertile soils. Productivity is greatest in the eastern region (tallgrass prairie), followed by mixed grass, then shortgrass prairie. Lands that were formally grasslands, now farmed are some of the most fertile cropland in the U.S. and the world.
-
Upload
khangminh22 -
Category
Documents
-
view
0 -
download
0
Transcript of Great Plains - Natural Resources Conservation Service

Great Plains The Great Plains region includes the greatest expanse of grasslands in the United States. The ten plains states extend east from the Rocky Mountains (originating in Canada) to the Central Lowlands in New Mexico. The vegetation of the Great Plains is highly diverse and is a “land of marked contrasts and limitless variety: canyons carved into solid rock of an arid land by the waters of the Pecos and the Rio Grande; the seemingly endless grainfields of Kansas; the desolation of the Badlands; and the beauty of the Black Hills” (Trimble, 1980). The region boundaries (Figure 1) include the tallgrass, mixed grass, and shortgrass prairies. Although grasslands are the dominant vegetation type, shrub, forest and woodland vegetation also exists throughout the region. The northeastern portion and central area of New Mexico support more species associated with shortgrass. The Southwestern Tablelands situated in central New Mexico supports juniper-scrub-oak-grass savannahs. Biodiversity is high in the Great Plains. The USDA-NRCS NRI data set for the Great Plains includes 146 plant families and 764 plant genera. The breakdown of plant growth habit is as follows: 483 graminoids, 950 forb/herbs, 393 shrubs and subshrubs, and 174 tree species. Figure 1. Broad Regions Described in the Interpretations
The grasslands in the Great Plains are associated with high productivity due to the generally reliable summer precipitation, a long growing season, and deep, fertile soils. Productivity is greatest in the eastern region (tallgrass prairie), followed by mixed grass, then shortgrass prairie. Lands that were formally grasslands, now farmed are some of the most fertile cropland in the U.S. and the world.

When Lewis and Clark first visited the Great Plains in 1804-06, they observed and recorded the abundant wildlife which included large herds of bison, and elk. Lewis and Clark were in awe as to the abundance and diversity of wildlife and vegetation. Rangelands that remain uncultivated typically occur on areas that are marginally or not suitable for crop production. Settlement of the Great Plains began after Louisiana Purchase (1803) and the Lewis and Clark expedition (1806). By the mid 1800's settlement expanded rapidly with the advent of railroads and the Homestead Act of 1862. Adequate rainfall and abundant arable land attracted settlers. However, the Great Plains are susceptible to periodic droughts, which caused farms to be abandoned, economic recessions, and turned fields into dry wastelands. These events occurred several times in the 1800s and early 1900s in the mid- and southern parts of the Great Plains with the worst dust bowls occurring during the Depression years and "Dust Bowl" of the 1930s (Hurt, 1981). Major droughts occur approximately every 20 years (1890s, 1910s, 1930s, 1950s, and 1970s). The 1990s witnessed yet another period of serious drought conditions, especially in the southern Great Plains with some of the hottest and driest conditions that this region has ever experienced. In the Great Plains, summer rainfall generally occurs mostly during May–August. However, in 2012, the drought developed rapidly from May, reaching its peak intensity in August, and continuing through the fall. Records show that the 4-month cumulative rainfall deficit (averaged over a six-state area including Wyoming, Colorado, Nebraska, Kansas, Missouri, and Iowa), was the greatest since record keeping began in 1895. This drought is ranked as the most severe summertime drought 117 years, surpassing the droughts of 1988, 1934, and 1936 (Hoerling, et al., 2014). Figures 2-13 show the drought severity over the two periods nationally and by areas of states within the Great Plains. While this region was abnormally dry during both periods, the southwestern portion of the Great Plains region experienced severe to extreme drought during the more recent period (2011-2015). The figures provide context for subsequent summary results based on NRI rangeland on-site data collected over two periods, 2004-2010 and 2011-2015.

Figures 2-3. Maps of Average Drought Monitor Rating (0 to 4 scale, where 0 is mild drought and 4 is extreme) Across the Two NRI Sampling Periods Figure 2. Figure 3.
Drought severity is displayed in five categories: D0 (Abnormally Dry) D1 (Moderate Drought) D2 (Severe Drought) D3 (Extreme Drought) D4 (Exceptional Drought)
Figure 4. Average drought severity in North Dakota portion of the Great Plains.

Figure 5. Average drought severity in South Dakota portion of the Great Plains.
Figure 6. Average drought severity in Nebraska portion of the Great Plains.

Figure 7. Average drought severity in Kansas portion of the Great Plains.
Figure 8. Average drought severity in Oklahoma portion of the Great Plains.

Figure 9. Average drought severity in Texas portion of the Great Plains.
Figure 10. Average drought severity in New Mexico portion of the Great Plains.

Figure 11. Average drought severity in Colorado portion of the Great Plains.
Figure 12. Average drought severity in Wyoming portion of the Great Plains.

Figure 13. Average drought severity in Montana portion of the Great Plains.
Rangeland Health Attributes Soil and Site Stability Soil and site stability assessment in the USDA-NRCS Rangeland National Resource Inventory report showed predominantly stable conditions in the northern Great Plains, not more than 10% of non-Federal acres with moderate or greater departure from expected reference conditions for the two time periods (Figures 14-16). The southwestern area of the Great Plains was the exception, especially during the second period (2011-2015) when drought conditions in that area were severe to extreme (Figure 2). Areas of New Mexico and Texas within the southwestern Great Plains were especially affected (Figures 9-10). Within the New Mexico portion of the Great Plains, the percent of non-Federal rangeland with soil and site stability ratings of moderate or greater departure from reference conditions increased from 11.1 ±4.0 percent to 37.8 ±8.9 percent and within the Texas portion of the Great Plains the percent area increased from 4.4 ±3.8 to 32.8 ±11.0 (Figure 16). This increase coincides with increases in percent bare ground and percent of rangeland acres with vegetation canopy gaps on non-Federal rangeland (see below).

Figure 14-15. Non-Federal Rangeland Where Soil and Site Stability Shows at Least Moderate Departure from Reference Conditions (Source: Rangeland Health Table 2, Table 3) Figure 14. 2004-2010 Figure 15. 2011-2015
Figure 16. Percent non-Federal rangeland with soil site stability ratings of moderate or greater departure from reference conditions by state. Error bars represent margins of error.
0
20
40
60
80
ND SD NE KS OK TX NM CO WY MTPerc
ent N
on-F
eder
al R
ange
land
Great Plains Non-Federal Rangeland Where Soil and Site Stability Has Moderate or Greater
Departure from Reference Conditions
2004-2010 2011-2015

Hydrologic Function Trends in hydrologic function from 2004-2010 to 2011-2015 in the Great Plains were very similar to the soil and site stability results. The greatest changes were observed in the southwestern portions of the Great Plains, where the percentage of non-Federal rangeland where hydrologic function has moderate or greater departure from reference conditions increased from 14.4 ±4.3 to 47.6±8.1 percent and from 3.7 ±3.5 to 35.0 ±11.3 percent in the New Mexico and Texas portions, respectively, of the Great Plains (Figures 17-19). Figures 17-18. Non-Federal Rangeland Where Hydrologic Function Shows at Least Moderate Departure from Reference Conditions (Source: Rangeland Health Table 2, Table 3) Figure 17. 2004-2010 Figure 18. 2011-2015

Figure 19. Non-Federal rangeland where hydrologic function shows at least moderate departure from reference conditions. Error bars represent margins of error.
Biotic Integrity Biotic integrity shifts were observed within the Great Plains in Kansas, Oklahoma, Texas, and New Mexico (Figures 20-22). Biotic integrity ratings are based on indicators that include invasive plants, functional structural groups, annual production, litter amount, and reproduction. These indicator variables would have been sensitive not only to the 2012 drought, but also to the average drought conditions over 2011-2015 (Figures 2-14).
0
20
40
60
80
ND SD NE KS OK TX NM CO WY MT
Perc
ent N
on-F
eder
al R
ange
land
Great PlainsNon-Federal Rangeland Where Hydrologic
Function Has Moderate or Greater Departure from Reference Conditions
2004-2010 2011-2015

Figures 20-21. Non-Federal Rangeland Where Biotic Integrity Shows at Least Moderate Departure from Reference Conditions (Source: Table 2, Table 3)
Figure 20. 2004-2010 Figure 21.2011-2015
Figure 22. Non-Federal rangeland where biotic integrity shows at least moderate departure from reference conditions. Error bars represent margins of error.
0
20
40
60
80
ND SD NE KS OK TX NM CO WY MTPerc
ent N
on-F
eder
al R
ange
land
Great Plains Non-Federal Rangeland Where Biotic Integrity Has Moderate or Greater Departure
from Reference Conditions
2004-2010 2011-2015

Specific Indicator Discussion Bare Ground Within the north Texas area of the Great Plains, average bare ground increased from 4.2 ±1.2 to 13.9 ±3.2 percent. Within the New Mexico portion of the Great Plains, the average percent bare ground increased from 19.6 ±2.1 percent to 31.1 ±3.5 percent between years 2004-2010 and 2011-2015 (Figures 23-25) and the percent area with at least 50 percent bare ground increased from 4.4 ±3.2 to 14.6 ±5.5 percent (Figures 26-28). As described above in the soil and surface stability section, increases in bare ground, vegetative canopy gaps were associated with drought conditions during 2011-2015 (Figures 2-13). Figures 23-24. Bare Ground on Non-Federal Rangeland (Source: Bare Ground, Inter-Canopy Gaps, and Soil Aggregate Stability Table 111, Table 112) Figure 23. 2004-2010 Figure 24. 2011-2015

Figure 25. Bare ground on non-Federal rangeland in the Great Plains. Error bars represent margins of error.
Figures 26-27. Non-Federal Rangeland that is at Least 50% Bare Ground (Source: Bare Ground, Inter-Canopy Gaps, and Soil Aggregate Stability Table 114, Table 115) Figure 26. 2004-2010 Figure 27. 2011-2015
0
5
10
15
20
25
30
35
40
ND SD NE KS OK TX NM CO WY MT
Perc
ent B
are
Gro
und
Average Bare Ground on Non-Federal Rangeland in the Great Plains
2004-2010 2011-2015

Figure 28. Non-Federal rangeland in the Great Plains that is at Least 50 percent bare ground. Error bars represent margins of error.
Inter-Canopy Gaps The same area of New Mexico that had an increase in bare ground also had an increase, (from 0.9 ±0.7 percent to 10.0 ±4.6 percent) in non-Federal rangeland where canopy gaps of 2 meters or greater cover at least 20 percent of the ground and bare ground in those gaps is at least 50 percent (Figure 29-31). Increased areas with large canopy gaps and bare ground within the gaps were associated with drought conditions during 2011-2015.
0
5
10
15
20
25
30
35
40
ND SD NE KS OK TX NM CO WY MT
Perc
ent N
on-F
eder
al R
ange
land
Non-Federal Rangeland in the Great Plains That is at Least 50 Percent Bare Ground
2004-2010 2011-2015

Figures 29-30. Non-Federal Rangeland Where 2-Meter Canopy Gaps Account for at Least 20 Percent of the Land and Inter-Canopy Gaps are at Least 50% Bare Ground (Source: Bare Ground, Inter-Canopy Gaps, and Soil Aggregate Stability Table 117, Table 118) Figure 29. 2004-2010 Figure 30. 2011-2015
Figure 31. Non-Federal rangeland in the Great Plains where canopy gaps cover at least 20 percent of the land and where at least 50 percent of the land within those canopy gaps is bare ground. Error bars represent margins of error.
-5
0
5
10
15
20
ND SD NE KS OK TX NM CO WY MT
Perc
ent N
on-F
eder
al R
ange
land
Great PlainsNon-Federal Rangeland Where at 2-m Gaps
Account for at Least 20 Percent of the Land and the Intercanopy Gaps are at Least 50 Percent
Bare Ground
2004-2010 2011-2015

Non-Native Plants Although the presence of non-native plants in the Great Plains changed very little during the two time periods, within the region on non-Federal rangeland they are most widespread in Wyoming, (81.9 ±6.9 percent), South Dakota (81.2 ±3.8 percent), North Dakota (79.7 ±3.7 percent), and Montana (75.4 ±4.4 percent). Within the region they cover at least 50 percent of the soil surface on 16.7 (±3.2) percent of non-Federal rangeland in South Dakota, 12.2 (±3.2) percent in Kansas, 9.8 (±3.5) percent in North Dakota, and 8.3 (±3.0) percent in Montana (Figures 32-37). Figures 32-33. Non-Federal rangeland where non-native plant species are present (Source: Non-Native Plant Species Table 17, Table 18) Figure 32. 2004-2010 Figure 33. 2011-2015

Figure 34. Non-Federal rangeland where non-native plant species are present. Error bars represent margins of error.
Figures 35-36. Non-Federal Rangeland Where Non-Native Plant Species Cover at Least 50% of the Soil Surface (Source: Non-Native Plant Species Table 17, Table 18) Figure 35. 2004-2010 Figure 36. 2011-2015
0
20
40
60
80
100
ND SD NE KS OK TX NM CO WY MT
Perc
ent N
on-F
eder
al R
ange
land
Presence of Non-NativePlant Species on Non-Federal Rangelands in the
Great Plains
2004-2010 2011-2015

Figure 37. Great Plains non-Federal rangeland where non-native plant species cover at least 50% of the soil surface. Error bars represent margins of error.
Invasive Grasses Annual bromes (Bromus spp.) are non-native invasive grasses that are most prevalent in the northwestern and central part of the region where they are present on 74.4 (±8.0) percent of non-Federal rangeland in Wyoming, 55.8 (±5.5) percent in Kansas, 53.9 (±5.0) percent in South Dakota, 52.7(±6.0) percent in Montana, and 40.4 (±5.5) percent in Nebraska (Figures 38-40). Annual bromes cover at least 50 percent of the soil surface on 8.3 (±3.6) percent of the land in Kansas, 6.8 (±2.4) percent in South Dakota, and 6.1 (±4.6) percent in Wyoming (Figures 41-43). Among the annual bromes, cheatgrass (Bromus tectorum) is highly invasive (DiTomaso, 2000; Ogle, Reiners, & Gerow, 2003; Chambers, Roundy, Blank, Meyer, & Whittaker, 2007). It is present on 48.5 (± 8.3) percent of non-Federal rangeland in Wyoming, 45.2 (±4.9) percent in South Dakota, 31.2 (±4.9) percent in Kansas, and 27.2 (±4.7) percent in Nebraska (Figures 44-46). Cheatgrass covers at least 50 percent of the soil surface on 6.1 (±3.5) of the non-Federal rangeland in Kansas and 5.4 (±2.5) percent in South Dakota (Figures 47-49). Smooth brome (Bromus inermis) is a native perennial that has been widely planted as forage on pasture and hayland, and used for other conservation practices such as grassed waterways and field borders (Bush, Plant fact sheet for Smooth brome (Bromus inermis Leyss.), 2002; Hall, Agronomy Facts 27 Smooth Bromegrass, 2008). However, it has become invasive in many areas, including rangeland in much of the Great Plains (Figures 50-55). Within the region smooth brome is most common along its eastern boundary where it is present on non-Federal rangelands in North Dakota (47.0 ±7.0 percent), South Dakota (28.1 ±2.8 percent), Kansas (20.9 ±3.8 percent), and Nebraska (16.7 ±3.2 percent).
0
20
40
60
80
100
ND SD NE KS OK TX NM CO WY MTPerc
ent N
on-F
eder
al R
ange
land
Great Plains Non-Federal Rangelands Where Non-Native Plant Species Cover at Least 50% of
the Soil Surface
2004-2010 2011-2015

Smooth brome covers at least 50 percent of the soil surface on 8.0 (±2.2) percent of non-Federal rangeland in South Dakota, 5.6 (±2.6) percent in North Dakota, and 4.3 (±2.0) percent in Nebraska. Although Kentucky bluegrass (Poa pratensis) is commonly planted on pasturelands especially in the north central and northeastern regions of the United States as important persistent perennial cool-season forage species (Hall, 1996; Bush, Plant fact sheet for Kentucky Bluegrass (Poa pratensis L.), 2002; Wennerberg, 2004; Toledo, Sanderson, Spaeth, Hendrickson, & Printz, 2014), it is listed as an invasive weed in the Great Plains. Canada bluegrass (Poa compressa) may have spread to many areas by contaminated seed for other bluegrass species and may become weedy and invasive in some regions or habitats (St.John, Tilley, & Winslow, 2012; Toledo, Sanderson, Spaeth, Hendrickson, & Printz, 2014). In the Great Plains Kentucky and Canada bluegrasses are present on 86.0 (±3.7) percent of non-Federal rangeland in North Dakota, 62.8 (±3.5) percent in South Dakota, 39.9 (±6.2) percent in Kansas, 37.9 (±3.7) percent in Nebraska, and 31.7 (±7.3) percent in Montana (Figures 56-58). Kentucky and Canada bluegrasses are perennial sod-forming grasses that spread by strong rhizomes and seeds. These dense stands covering greater than 50 percent of the soil surface account for 38.9 (±5.8) percent of non-Federal rangeland in North Dakota and 15.1 (±3.6) percent in South Dakota (Figures 59-61). Figures 38-39. Non-Federal Rangeland Where Annual Bromes are Present (Source: Invasive Plant Species Table 21, Table 22) Figure 38. 2004-2010 Figure 39. 2011-2015
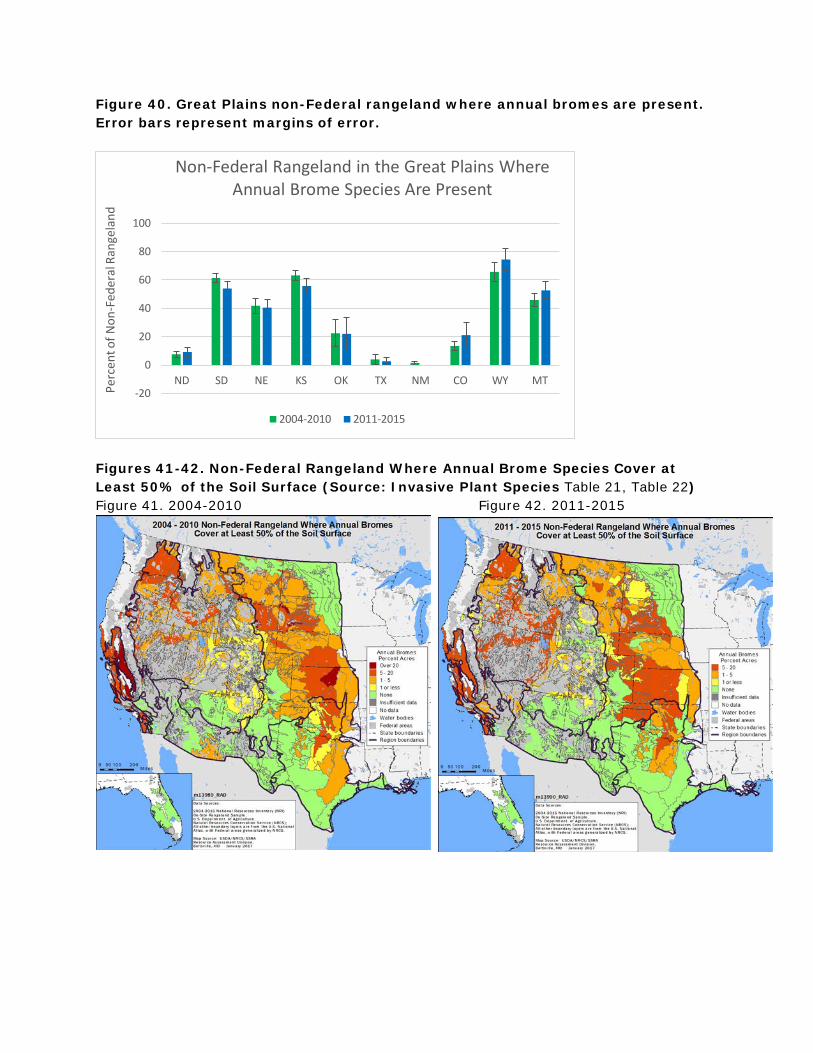
Figure 40. Great Plains non-Federal rangeland where annual bromes are present. Error bars represent margins of error.
Figures 41-42. Non-Federal Rangeland Where Annual Brome Species Cover at Least 50% of the Soil Surface (Source: Invasive Plant Species Table 21, Table 22) Figure 41. 2004-2010 Figure 42. 2011-2015
-20
0
20
40
60
80
100
ND SD NE KS OK TX NM CO WY MT
Perc
ent o
f Non
-Fed
eral
Ran
gela
nd
Non-Federal Rangeland in the Great Plains Where Annual Brome Species Are Present
2004-2010 2011-2015

Figure 43. Non-Federal rangeland where annual brome species cover at least 50% of the soil surface. Error bars represent margins of error.
Figures 44-45. Non-Federal Rangeland Where Cheatgrass is Present (Source: Invasive Plant Species Table 24, Table 25) Figure 44. 2004-2010 Figure 45. 2011-2015
0
20
40
60
80
100
ND SD NE KS OK TX NM CO WY MTPerc
ent o
f Non
-Fed
eral
Ran
gela
nd
Non-Federal Rangeland in the Great Plains Where Annual Brome Species Cover at Least 50 Percent
of the Soil Surface
2004-2010 2011-2015

Figure 46. Non-Federal rangeland where cheatgrass is present. Error bars represent margins of error.
Figures 47-48. Non-Federal Rangeland Where Cheatgrass Covers at Least 50% of the Soil Surface. (Source: Invasive Plant Species Table 24, Table 25) Figure 47. 2004-2010 Figure 48. 2011-2015
0
20
40
60
80
100
ND SD NE KS OK TX NM CO WY MT
Perc
ent o
f Non
-Fed
eral
Ran
gela
nd
Non-Federal Rangeland in the Great Plains Where Cheatgrass Is Present
2004-2010 2011-2015

Figure 49. Non-Federal rangeland where cheatgrass covers at least 50% of the soil surface. Error bars represent margins of error.
Figures 50-51. Non-Federal Rangeland Where Smooth Brome is Present (Source: Invasive Plant Species Table 30, Table 31) Figure 50. 2004-2010 Figure 51. 2011-2015
0
20
40
60
80
100
ND SD NE KS OK TX NM CO WY MT
Perc
ent o
f Non
-Fed
eral
Ran
gela
nd
Non-Federal Rangeland in the Great Plains Where Cheatgrass Covers at Least 50 Percent of the Soil
Surface
2004-2010 2011-2015

Figure 52. Great Plains non-Federal rangeland where smooth brome is present. Error bars represent margins of error.
Figures 53-54. Non-Federal Rangeland Where Smooth Brome Covers at Least 50% of the Soil Surface (Source: Invasive Plant Species Table 30, Table 31) Figure 53. 2004-2010 Figure 54. 2011-2015
0
20
40
60
80
100
ND SD NE KS OK TX NM CO WY MT
Perc
ent o
f Non
-Fed
eral
Ran
gela
nd
Non-Federal Rangeland in the Great Plains Where Smooth Brome Is Present
2004-2010 2011-2015

Figure 55. Great Plains non-Federal rangeland where smooth brome covers at least 50% of the soil surface. Error bars represent margins of error.
Figures 56-57. Non-Federal Rangeland Where Kentucky and Canada Bluegrass are Present (Source: Invasive Plant Species Table 27, Table 28) Figure 56. 2004-2010 Figure 57. 2011-2015
0
20
40
60
80
100
ND SD NE KS OK TX NM CO WY MTPerc
ent o
f Non
-Fed
eral
Ran
gela
nd
Non-Federal Rangeland in the Great Plains Where Smooth Brome Covers at Least 50 Percent of the
Soil Surface
2004-2010 2011-2015
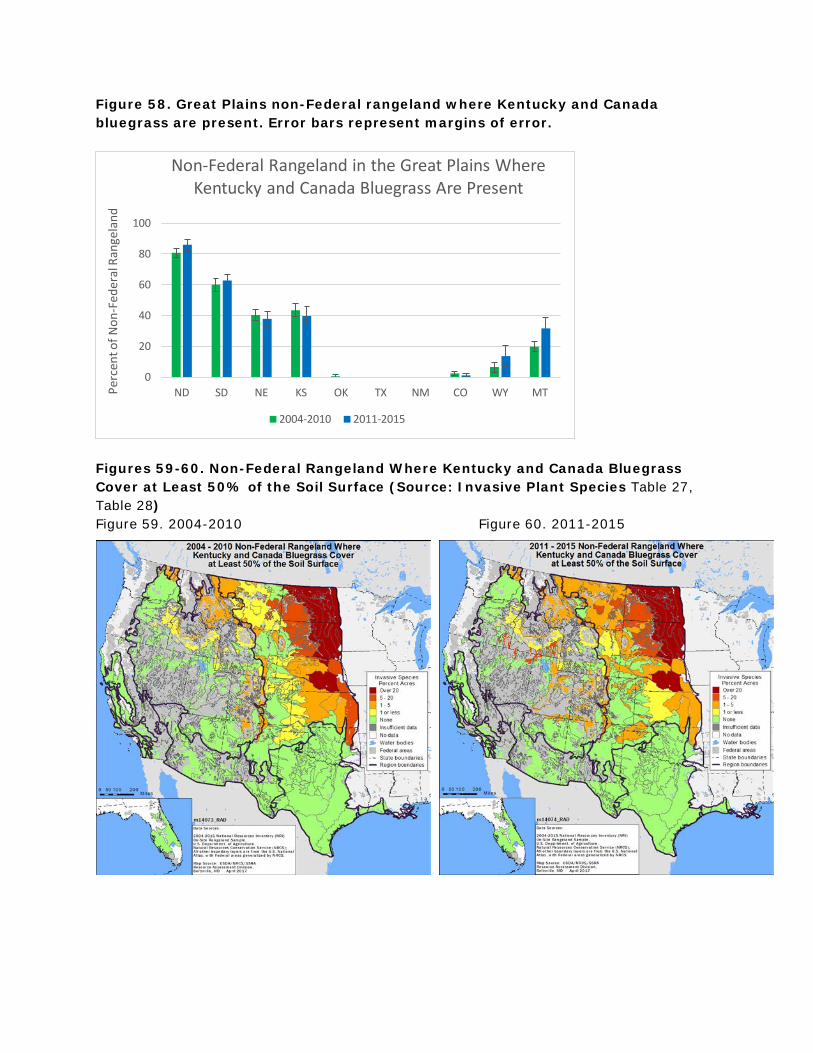
Figure 58. Great Plains non-Federal rangeland where Kentucky and Canada bluegrass are present. Error bars represent margins of error.
Figures 59-60. Non-Federal Rangeland Where Kentucky and Canada Bluegrass Cover at Least 50% of the Soil Surface (Source: Invasive Plant Species Table 27, Table 28) Figure 59. 2004-2010 Figure 60. 2011-2015
0
20
40
60
80
100
ND SD NE KS OK TX NM CO WY MTPerc
ent o
f Non
-Fed
eral
Ran
gela
nd
Non-Federal Rangeland in the Great Plains Where Kentucky and Canada Bluegrass Are Present
2004-2010 2011-2015

Figure 61. Great Plains non-Federal rangeland where Kentucky and Canada bluegrass cover at least 50% of the soil surface. Error bars represent margins of error.
Invasive Forbs In the Great Plains, Canada and bull thistles (Cirsium arvense and Cirsium vulgare) are present on 7.7 (±2.6) percent of non-Federal rangeland in North Dakota and on 4.6 (±1.9) percent in South Dakota (Figures 62-64). Leafy spurge (Euphorbia esula) is present on 9.8 (±4.0) percent of non-Federal rangeland in North Dakota (Figures 65-67). Non-native centaurea spp. (Figures 68-69) and halogeton spp. (Figures 70-71) are beginning to spread into the Great Plains, but are more common to the west.
0
20
40
60
80
100
ND SD NE KS OK TX NM CO WY MTPerc
ent o
f Non
-Fed
earl
Rang
elan
d
Non-Federal Rangeland in the Great Plains Where Kentucky and Canada Bluegrass Cover at Least 50
Percent of the Soil Surface
2004-2010 2011-2015
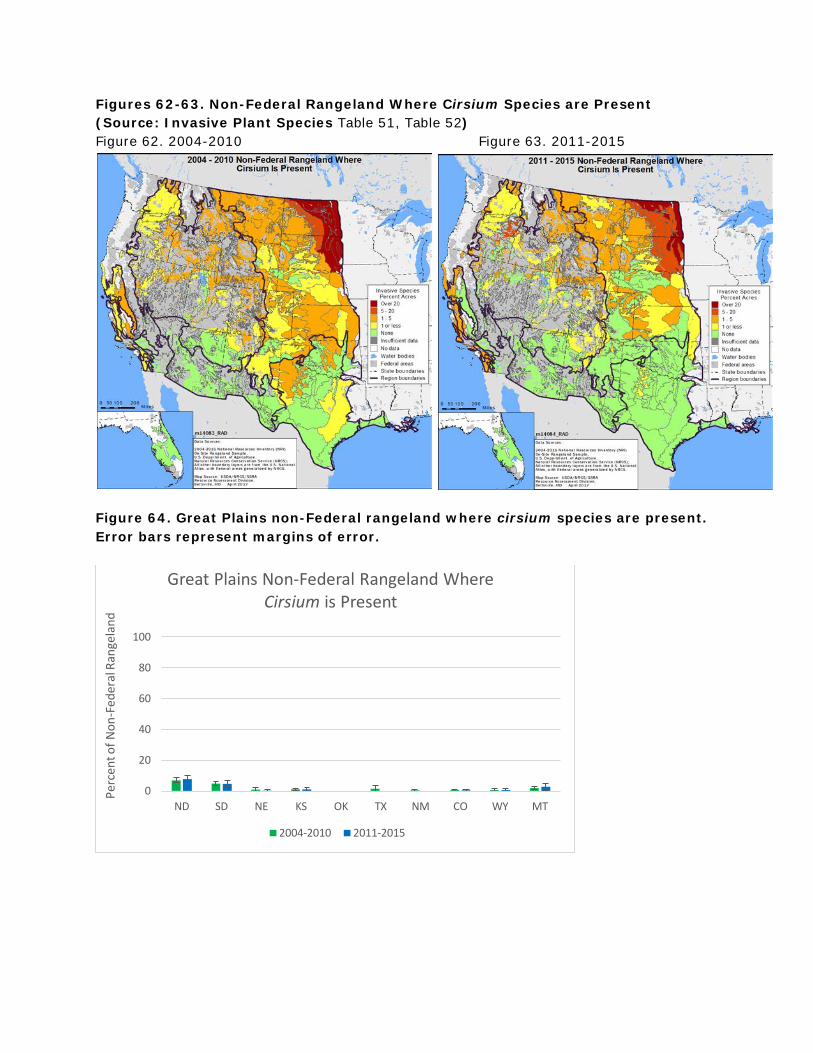
Figures 62-63. Non-Federal Rangeland Where Cirsium Species are Present (Source: Invasive Plant Species Table 51, Table 52) Figure 62. 2004-2010 Figure 63. 2011-2015
Figure 64. Great Plains non-Federal rangeland where cirsium species are present. Error bars represent margins of error.
0
20
40
60
80
100
ND SD NE KS OK TX NM CO WY MT
Perc
ent o
f Non
-Fed
eral
Ran
gela
nd
Great Plains Non-Federal Rangeland Where Cirsium is Present
2004-2010 2011-2015
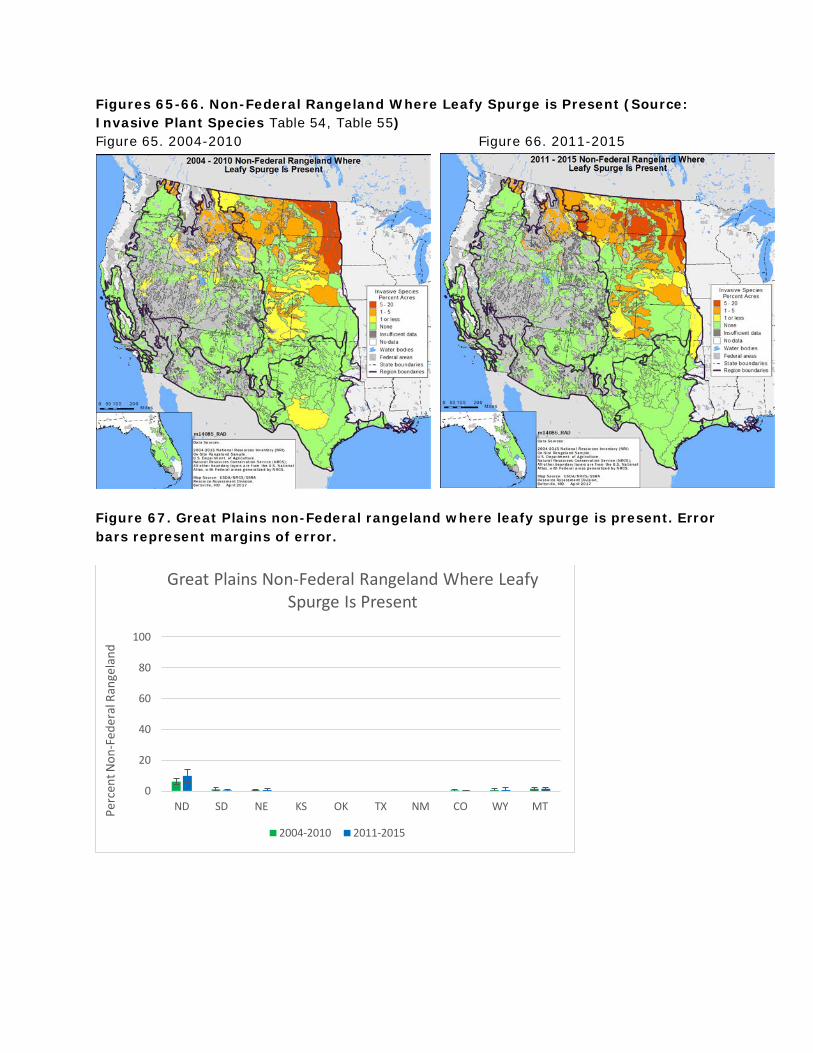
Figures 65-66. Non-Federal Rangeland Where Leafy Spurge is Present (Source: Invasive Plant Species Table 54, Table 55) Figure 65. 2004-2010 Figure 66. 2011-2015
Figure 67. Great Plains non-Federal rangeland where leafy spurge is present. Error bars represent margins of error.
0
20
40
60
80
100
ND SD NE KS OK TX NM CO WY MTPerc
ent N
on-F
eder
al R
ange
land
Great Plains Non-Federal Rangeland Where Leafy Spurge Is Present
2004-2010 2011-2015

Figures 68-69. Non-Federal Rangeland Where Centaurea Species are Present (Source: Invasive Plant Species Table 57, Table 58) Figure 68. 2004-2010 Figure 69. 2011-2015
Figures 70-71. Non-Federal Rangeland Where Halogeton Species are Present (Source: Invasive Plant Species Table 57, Table 58) Figure 70. 2004-2010 Figure 71. 2011-2015

Invasive Woody Species Presence of native juniper species (Figures 72-74) on non-Federal rangelands in the Great Plains is highest in New Mexico (14.3 ±8.4 percent) and Montana (7.6 ±4.8 present). In the region mesquite species (Figures 75-77) are present in Texas (17.5 ±7.9 percent) and New Mexico (17.4 ±6.7 percent). Figures 72-73. Non-Federal Rangeland Where Juniper Species are Present (Source: Invasive Plant Species Table 75, Table 76) Figure 72. 2004-2010 Figure 73. 2011-2015

Figure 74. Non-Federal rangeland where juniper (juniperus) species are present in the Great Plains. Error bars represent margins of error.
Figures 75-76. Non-Federal Rangeland Where Mesquite Species are Present (Source: Invasive Plant Species Table 96, Table 97) Figure 75. 2004-2010 Figure 76. 2011-2015
0
20
40
60
80
100
ND SD NE KS OK TX NM CO WY MTPerc
ent N
on-F
eder
al R
ange
land
Presence of Juniper Species on Non-Federal Rangeland in the Great Plains
2004-2010 2011-2015

Figure 77. Non-Federal rangeland where mesquite species are present in the Great Plains. Error bars represent margins of error.
Summary and Conclusions Much of the of non-Federal rangeland in Great Plains is in relatively good condition, with 10 percent or less of the area having moderate or greater departures from reference conditions for the rangeland health attributes, soil and site stability, hydrologic function and biotic integrity. In the northern and central part of the Great Plains there was little change in the proportion of non-Federal rangeland where rangeland health attribute ratings had moderate or greater departure from reference conditions. However, in southwestern portion of the Great Plains generally 10-20 percent of non-Federal rangeland had at least moderate departures for the rangeland health attributes in 2004-2010 and these percentages generally increased to 20-30 percent or more during 2011-2015. The severe to extreme drought conditions that occurred in the southwestern Great Plains during 2011-2015 undoubtedly had an effect on soil moisture, vegetative cover and composition. In this area there were corresponding increases in percentages of bare ground and inter-canopy gaps. Non-native plant species are widespread across the region. Invasive grasses including annual bromes (Bromus spp.), smooth brome (Bromus inermis), and Kentucky and Canada bluegrass (Poa pratensis and Poa compressa) are pervasive in the northern and central portions of the Great Plains. Invasive thistles (Cirsium arvense and Cirsium vulgare) are common in North and South Dakota, and leafy spurge (Euphorbia esula) is present on nearly 10 percent of non-Federal rangeland in North Dakota. Non-native Centaurea and Halogeton species, more common west of the Great Plains, are beginning to spread into the Great Plains.
0
20
40
60
80
100
ND SD NE KS OK TX NM CO WY MTPerc
ent N
on-F
eder
al R
ange
land
Presence of Mesquite Species on Non-Federal Rangeland in the Great Plains
2004-2010 2011-2015

Woody species including mesquite (Prosopis spp.) and juniper (Juniperus spp.) are common in the southern portion of the Great Plains. Although native, these species can become invasive in certain areas replacing native grasses and forbs (DiTomaso, 2000; Miller, Tausch, McArthur, & Johnson, 2008).
About the Maps The maps are constructed with NRI rangeland data collected in the field on rangeland during the periods 2004 to 2010 and 2011 to 2015. The regions are based on level IV ecoregion boundaries defined by the U.S. Environmental Protection Agency Western Ecology Division. In some cases level IV ecoregions were combined to include more sample sites. An additional category, referred to as "Insufficient data", represents areas where there were too few data points. Regions without non-Federal rangeland are described as "No data". Areas of Federal land are depicted with cross-hatching. The rangeland health maps represent various levels of departure from the reference state as described in the ecological site description for that land area based on the indicators listed in Table 1. Note that some indicators are associated with more than one attribute while others are specific to a single attribute; this is intentional and is part of the evaluation process. Although these maps portray percentages of non-Federal rangeland with specific attribute ratings, not all of the indicators associated with that attribute may will have that rating. For example, one map displays non-Federal rangeland where soil and site stability shows at least moderate departure from reference conditions. Although some of the indicators associated with soil and site stability may have been rated on a scale representing none-to-slight and slight-to-moderate departure, the median rating was at least moderate. Rangeland health assessments evaluate the function of ecological processes for rangeland sites relative to their ecological site descriptions, which define expected ecological processes based on climate and soil. For some rangeland sites, no soil survey exists and no ecological site description has been developed. For those areas the no rangeland health data are reported. Maps exclude rangeland health estimates for mapping regions where at least 10 percent of non-Federal rangeland does not report rangeland health data. Rangeland health attribute assessments in the maps are based on percentages of non-Federal rangeland where rangeland health evaluations are reported. Line point intercept data are utilized in summaries of non-native plant species, invasive plant species, and bare ground. Line point intercept data are collected along two intersecting 150-foot transects centered on each sample location. Data collectors record plant species, litter, lichen, moss, rock fragment, bedrock, and/or bare soil present at each 3-foot interval (mark). Canopy gap data are used to identify areas with large foliar inter-canopy gaps which have more exposure to erosion and may provide opportunity for invasive plants to become established. Data collectors record lengths of plant inter-canopy gaps along the two intersecting 150-foot transects.

Soil aggregate stability is a recognized indicator of soil quality and rangeland health. Data collectors water immerse soil surface peds collected at the sample site and subject the soil peds to five dipping cycles. Soil stability is rated based on the outcomes of these water exposure techniques. Ratings range from 1 (very unstable) to 6 (very stable). The source data used to construct the drought figures are from the National Drought Mitigation Center, and follow the drought monitor categories: http://droughtmonitor.unl.edu/AboutUSDM/DroughtClassification.aspx. The weekly drought monitor data were converted to a 1/8-degree grid, and the state and broad region polygons were used to clip out the grid cells within each region for the two time periods. Both the stack plots show the distribution of 1/8-degree grid cells of each drought monitor class for each year. Drought severity is displayed in five categories:
D0 (Abnormally Dry) D1 (Moderate Drought) D2 (Severe Drought) D3 (Extreme Drought) D4 (Exceptional Drought)
More Information
Bush, T. (2002). Plant fact sheet for Kentucky Bluegrass (Poa pratensis L.). USDA NRCS
Rose Lake Plant Materials Center East Lansing, Michigan. (https://plants.usda.gov/plantguide/pdf/pg_popr.pdf).
Bush, T. (2002). Plant fact sheet for Smooth brome (Bromus inermis Leyss.). USDA NRCS Rose Lake Plant Materials Center East Lansing, Michigan. (https://plants.usda.gov/factsheet/pdf/fs_brin2.pdf).
Chambers, J., Roundy, B., Blank, R., Meyer, S., & Whittaker, A. (2007). What makes Great Basin sagebrush ecosystems invasible by Bromus tectorum? Ecological Monographs. 77:117-145.
DiTomaso, J. (2000). Invasive weeds in rangelands: species, impacts, and management. Weed Science 48:255-265.
Hall, M. (1996). Agronomy Facts 50 Kentucky Bluegrass. Agronomy Facts 50 Kentucky Bluegrass. Penn State Cooperative Extension, College of Agricultural Sciences, Pennsylvania State University. (http://extension.psu.edu/plants/crops/forages/species/kentucky-bluegrass).
Hall, M. (2008). Agronomy Facts 27 Smooth Bromegrass. Penn State Cooperative Extension, College of Agricultural Sciences, Pennsylvania State University. (http://extension.psu.edu/plants/crops/forages/species/smooth-bromegrass/extension_publication_file).

Hoerling, M., Eischeid, J., Kumar, A., Leung, R., Mariotti, A., Mo, K., . . . Seager, R. (2014). Causes and predictablilty of the 2012 Great Plains drought. Bulletin of the American Meteorological Society, 95, 269-282.
Hurt, R. (1981). The Dust Bowl: An Agricultural and Social History. Chicago: Nelson-Hall. Miller, R., Tausch, R., McArthur, E., & Johnson, D. (2008). Age structure and expansion of
pinon-juniper woodlands: a regional perspective in the Intermountain West. Res. Pap. RMRS-RP-69. Fort Collins, CO: U.S. Department of Agriculture, Forest Service, Rocky Mountain Research Station. 15 p.
Ogle, S., Reiners, W., & Gerow, K. (2003). Impacts of Exotic Annual Brome Grasses (Bromus spp.) on Ecosystem Properties of Northern Mixed Grass Prairie. American Midland Naturalist 149: 46-58.
St.John, L., Tilley, D., & Winslow, S. (2012). Plant guide for Canada bluegrass (Poa compressa). USDA-Natural Resources Conservation Service, Plant Materials Center, Aberdeen, Idaho 83210 (https://plants.usda.gov/plantguide/pdf/pg_poco.pdf).
Toledo, D., Sanderson, M., Spaeth, K., Hendrickson, J., & Printz, J. (2014). Extent of Kentucky Bluegrass and Its Effect on Native Plant Species Diversity and Ecosystem Services in the Northern Great Plains of the United States. Invasive Plant Science and Management: October-December 2014, Vol. 7, No. 4, pp. 543-552. (http://dx.doi.org/10.1614/IPSM-D-14-00029.1).
Trimble, D. (1980). Cenozoic tectonic history of the Great Plains contrasted with that of the southern Rocky Mountains, a synthesis: The Mountain Geologist. 17(3), 59-69.
Wennerberg, S. (2004). Plant Guide Kentucky bluegrass. USDA NRCS National Plant Data Center, Baton Rouge, Louisiana. (https://plants.usda.gov/plantguide/pdf/pg_popr.pdf).