Tillage Versus No-Tillage. Soil Properties and Hydrology in an ...
Upload
independentCategory
view
1download
0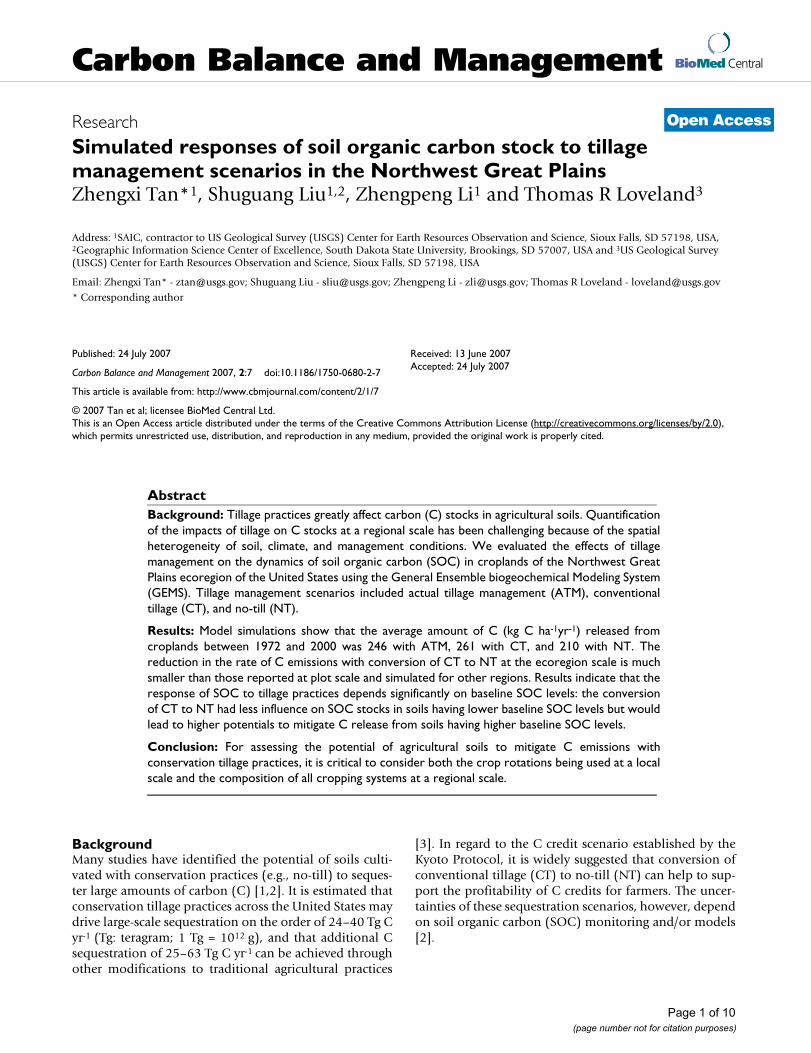
BioMed CentralCarbon Balance and Management
ss
Open AcceResearchSimulated responses of soil organic carbon stock to tillage management scenarios in the Northwest Great PlainsZhengxi Tan*1, Shuguang Liu1,2, Zhengpeng Li1 and Thomas R Loveland3Address: 1SAIC, contractor to US Geological Survey (USGS) Center for Earth Resources Observation and Science, Sioux Falls, SD 57198, USA, 2Geographic Information Science Center of Excellence, South Dakota State University, Brookings, SD 57007, USA and 3US Geological Survey (USGS) Center for Earth Resources Observation and Science, Sioux Falls, SD 57198, USA
Email: Zhengxi Tan* - [email protected]; Shuguang Liu - [email protected]; Zhengpeng Li - [email protected]; Thomas R Loveland - [email protected]
* Corresponding author
AbstractBackground: Tillage practices greatly affect carbon (C) stocks in agricultural soils. Quantificationof the impacts of tillage on C stocks at a regional scale has been challenging because of the spatialheterogeneity of soil, climate, and management conditions. We evaluated the effects of tillagemanagement on the dynamics of soil organic carbon (SOC) in croplands of the Northwest GreatPlains ecoregion of the United States using the General Ensemble biogeochemical Modeling System(GEMS). Tillage management scenarios included actual tillage management (ATM), conventionaltillage (CT), and no-till (NT).
Results: Model simulations show that the average amount of C (kg C ha-1yr-1) released fromcroplands between 1972 and 2000 was 246 with ATM, 261 with CT, and 210 with NT. Thereduction in the rate of C emissions with conversion of CT to NT at the ecoregion scale is muchsmaller than those reported at plot scale and simulated for other regions. Results indicate that theresponse of SOC to tillage practices depends significantly on baseline SOC levels: the conversionof CT to NT had less influence on SOC stocks in soils having lower baseline SOC levels but wouldlead to higher potentials to mitigate C release from soils having higher baseline SOC levels.
Conclusion: For assessing the potential of agricultural soils to mitigate C emissions withconservation tillage practices, it is critical to consider both the crop rotations being used at a localscale and the composition of all cropping systems at a regional scale.
BackgroundMany studies have identified the potential of soils culti-vated with conservation practices (e.g., no-till) to seques-ter large amounts of carbon (C) [1,2]. It is estimated thatconservation tillage practices across the United States maydrive large-scale sequestration on the order of 24–40 Tg Cyr-1 (Tg: teragram; 1 Tg = 1012 g), and that additional Csequestration of 25–63 Tg C yr-1 can be achieved throughother modifications to traditional agricultural practices
[3]. In regard to the C credit scenario established by theKyoto Protocol, it is widely suggested that conversion ofconventional tillage (CT) to no-till (NT) can help to sup-port the profitability of C credits for farmers. The uncer-tainties of these sequestration scenarios, however, dependon soil organic carbon (SOC) monitoring and/or models[2].
Published: 24 July 2007
Carbon Balance and Management 2007, 2:7 doi:10.1186/1750-0680-2-7
Received: 13 June 2007Accepted: 24 July 2007
This article is available from: http://www.cbmjournal.com/content/2/1/7
© 2007 Tan et al; licensee BioMed Central Ltd. This is an Open Access article distributed under the terms of the Creative Commons Attribution License (http://creativecommons.org/licenses/by/2.0), which permits unrestricted use, distribution, and reproduction in any medium, provided the original work is properly cited.
Page 1 of 10(page number not for citation purposes)
Carbon Balance and Management 2007, 2:7 http://www.cbmjournal.com/content/2/1/7
Recently, eddy-covariance measurements have been usedto evaluate the contribution of NT practice to C dynamicsin corn (Zea mays L.) and soybean (Glycine max (L.) Merr.)rotation ecosystems at regional and national scales [1,2].However, the relationships between net ecosystemexchange (NEE) and either terrestrial C storage or actualSOC stocks are still poorly understood, owing to theuncertainty of the redistribution of biomass in farmingproducts beyond a given C accounting region. For exam-ple, based on the assessment of NEE over six years,Hollinger et al. [2] estimated C stocks for corn/soybeanrotation ecosystems in the North Central Region of theUnited States, and observed a C sink under NT at the localscale which, however, is not necessarily true on a regionalscale. They attributed this discrepancy to regional con-sumption of grain combined with C emissions associatedwith agricultural practices.
Temporal variability in SOC stock is indicative of theresponse of ecosystems to changes in climate, land use/land cover, and land management. Because the dynamicsof SOC directly impact the availability of nutrients andmoisture to all kinds of living organisms, changes in SOCstock can transform the structure and functions of ecosys-tems, and may also result in ecosystem feedbacks on cli-mate [4]. The General Ensemble biogeochemicalModeling System (GEMS) [5] has been used by Tan et al.[6] to simulate the terrestrial C dynamics in the NorthwestGreat Plains between 1972 and 2000. Results show that Csources of croplands and the SOC balances across theecoregion depend on the proportion of cropped area tograssland. This study, however, did not take into accountthe contribution of land management to SOC dynamics.
How well we predict future atmospheric CO2 dynamicsand their response to anthropogenic CO2 emissionsdepends on our understanding of the extent to which therising atmospheric CO2 concentration can be offset by ter-restrial ecosystems through conservation agriculturalpractices. Therefore, we need to evaluate the impacts ofchange trends in land use/land cover and land manage-ment on terrestrial C source-sink relationships associatedwith specific management practices.
Sequestering C in cultivated soils managed with NT isbeing advocated as a way to assist in meeting the demandsof an international C credit system [1]. The potential ofcropland with such conservation management to mitigateCO2 emissions from mixed grass-crop ecosystems at aregional scale needs to be evaluated. In this study, we sim-ulated SOC dynamics within the top 20 cm of soil in thecropped areas of the Northwest Great Plains between1972 and 2000 with three management scenarios: actualresidue and tillage management (ATM), all cropland man-aged with CT, and all cropland managed with NT.
ResultsCroplands and tillage management historyMajor historical changes in land use/land cover within theecoregion were directly related to conversions betweencropland and grassland. In 1972 the average percentagesof cropland and grassland were 17% and 75%, respec-tively, and changed to 15% and 77%, respectively, in2000. For the study area, the average percentage of crop-land from 1972 to 2000 was 41%, 21%, 9%, and 5% inNorth Dakota, Montana, South Dakota, and Wyoming,respectively.
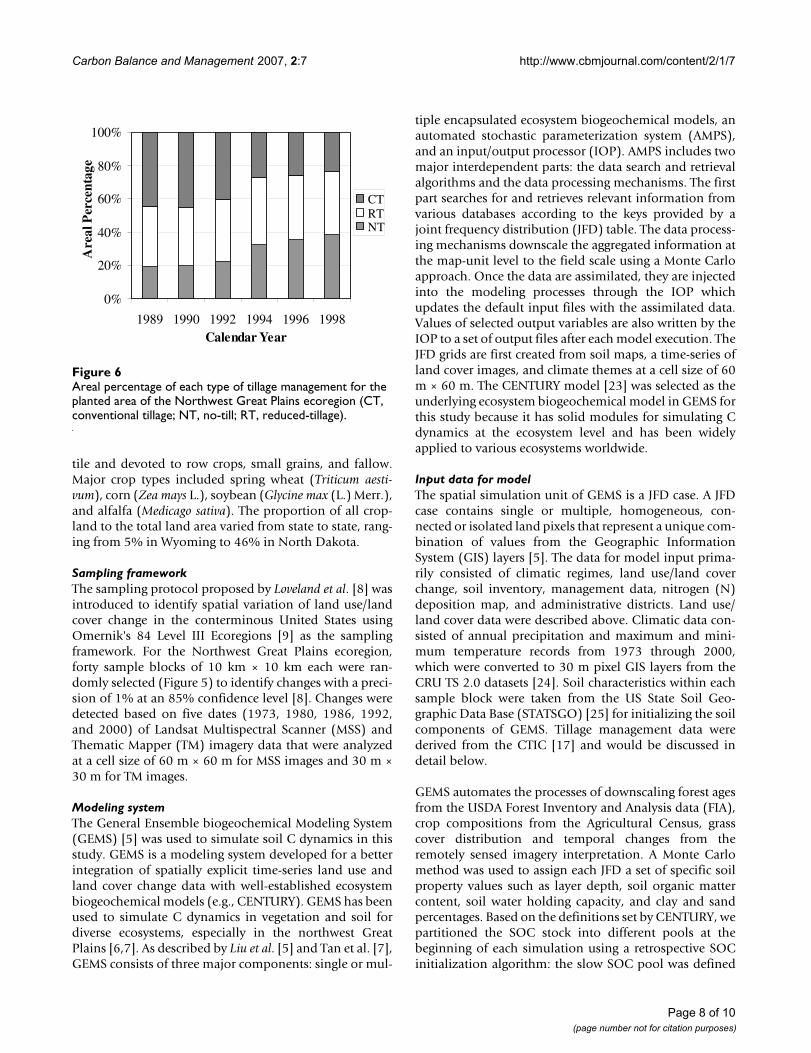
Average cropped area between 1989 and 1998 was about4.06 million ha within the ecoregion. As indicated in Fig-ure 1, the CT area was 45% in 1989 and decreased to 24%in 1998. During the same period, the area of NT increasedfrom 19% to 38%, and the reduced-tillage (RT) areachanged slightly from 36% to 38%. But the change rate ofeach tillage-managed area varied from state to state (seeFigure 1). For example, from 1989 to 1998, the NT areaincreased by 27% in North Dakota whereas it declined by10% in Wyoming.
Cropping systems and associations with tillage managementDuring the 1990s, there was little variation in the arealproportions of major cropping systems in the ecoregion,which consisted of 67% small grain crops (predominatedby wheat), 12% corn, 8% soybean, and 14% others (Table1). The areal proportion of each cropping system man-aged with NT, RT, and CT was 30%, 35%, and 35%,respectively, and not significantly different over timedespite large differences among the four states.
Changes in SOC pools with tillage management scenariosFor sample blocks with cropped area percentage greaterthan 10%, total SOC stock within the top 20 cm depth ofsoil generally tended to decrease with cultivation time,but the reduction in SOC stock was smaller under NT(210 ± 33 kg C ha-1yr-1) than under both CT (261 ± 36 kgC ha-1yr-1) and ATM (246 ± 38 kg C ha-1yr-1). The averagereduction in the rate of C release with conversion of CT toNT was about 51 kg C ha-1yr-1 during the study period. Nosignificant difference between ATM and CT was observed.The reduction in the rate of C release, however, was corre-lated with the baseline SOC levels. For example, sampleblock 04 in North Dakota had a high baseline SOC stock(66 Mg C ha-1) and was simulated to have a reduction inthe rate of C release at 104 kg C ha-1yr-1 with NT comparedwith CT. In contrast, sample block 02 in Montana had alow baseline SOC stock (34.5 Mg C ha-1) and was simu-lated to show a reduction in the rate of C emission of 56kg C ha-1yr-1 with NT in comparison with CT. Simulationresults also demonstrate that, by the year 2000, sampleblock 04 remained a C source at the rate of 330 kg C ha-
Page 2 of 10(page number not for citation purposes)

Carbon Balance and Management 2007, 2:7 http://www.cbmjournal.com/content/2/1/7
1yr-1, whereas sample block 02 turned into a C sink at therate of 9 kg C ha-1yr-1.
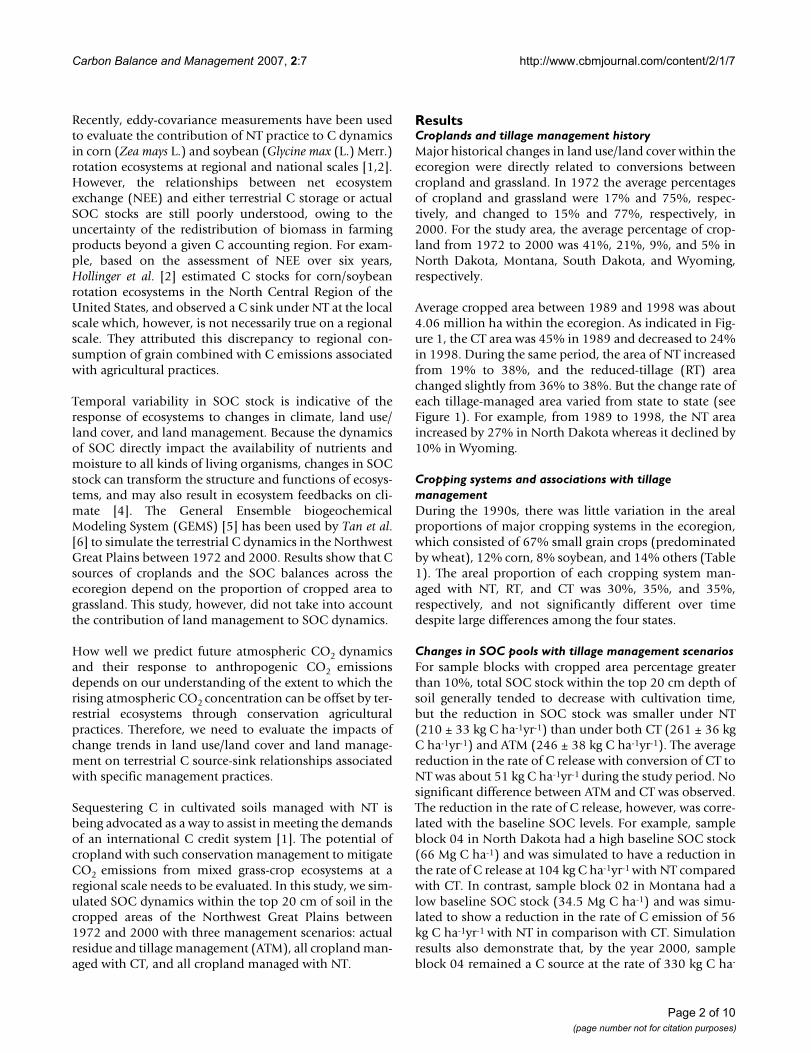
Simulation results indicate that the changes in total SOCstock with conversion of CT to NT were predominantly aresult of changes in both the labile and slow C pools. Fig-ure 2 shows that there was a relatively consistent reduc-tion (about 0.7 Mg C ha-1) in the labile SOC pool underNT in comparison with CT (and ATM); whereas the slowpool increased by 1,6 Mg C ha-1 by the year 2000. In otherwords, the conversion of CT to NT would reduce the slowC emissions at the rate of 57 kg C ha-1yr-1 in the study area.
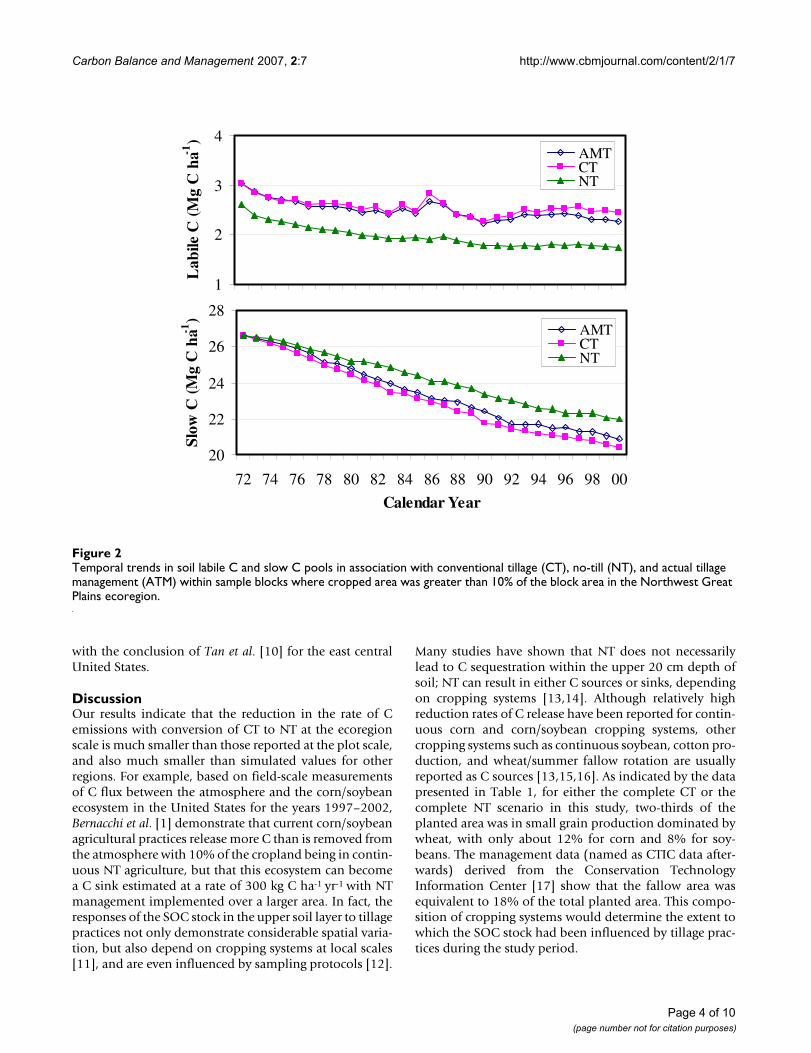
Change rate of SOC pools in relation to baseline SOC levelsThe data in Figure 3 indicate that crop production, regard-less of tillage practices, tends to remove SOC from the topsoil layer, even though there is less loss under NT thanunder CT. Responses of total SOC stock (especially of theslow C pool) to tillage management, however, depend sig-nificantly on baseline SOC levels. As illustrated in Figure4, soils with higher baseline SOC content tend to losemore C following crop cultivation. Conversely, the con-version of CT to NT has less influence on SOC stocks forsoils having lower baseline SOC levels, but would lead tohigher potentials to mitigate the C release from soils hav-ing higher baseline SOC content. This is in agreement
Changes in conventional tillage (CT) and no-till (NT) areas for each state between 1989 and 1998 in the Northwest Great Plains ecoregionFigure 1Changes in conventional tillage (CT) and no-till (NT) areas for each state between 1989 and 1998 in the Northwest Great Plains ecoregion.
25
16 14
29
4143
32
19
0
10
20
30
40
50
60
MT ND SD WYState
NT
Are
a(%
)
19891998
3842
44
53
16
26 27
43
0
10
20
30
40
50
60
MT ND SD WYState
CT
Are
a(%
)
19891998
Table 1: Percentage of individual cropping systems in the total planted area under each tillage management at the ecoregion scale.
Cropping system NT RT CT Total
Corn 4.2 3.7 3.6 11.5Small grain 20.4 24.8 21.4 66.6Soybean 2.9 2.4 3.1 8.4Other 2.7 4.5 6.9 14.0Total planteda 29.9 35.2 34.9 100.0
NT: no-till; RT: reduced tillage; CT: conventional tillage.a excluding fallow area.
Page 3 of 10(page number not for citation purposes)
Carbon Balance and Management 2007, 2:7 http://www.cbmjournal.com/content/2/1/7
with the conclusion of Tan et al. [10] for the east centralUnited States.
DiscussionOur results indicate that the reduction in the rate of Cemissions with conversion of CT to NT at the ecoregionscale is much smaller than those reported at the plot scale,and also much smaller than simulated values for otherregions. For example, based on field-scale measurementsof C flux between the atmosphere and the corn/soybeanecosystem in the United States for the years 1997–2002,Bernacchi et al. [1] demonstrate that current corn/soybeanagricultural practices release more C than is removed fromthe atmosphere with 10% of the cropland being in contin-uous NT agriculture, but that this ecosystem can becomea C sink estimated at a rate of 300 kg C ha-1 yr-1 with NTmanagement implemented over a larger area. In fact, theresponses of the SOC stock in the upper soil layer to tillagepractices not only demonstrate considerable spatial varia-tion, but also depend on cropping systems at local scales[11], and are even influenced by sampling protocols [12].
Many studies have shown that NT does not necessarilylead to C sequestration within the upper 20 cm depth ofsoil; NT can result in either C sources or sinks, dependingon cropping systems [13,14]. Although relatively highreduction rates of C release have been reported for contin-uous corn and corn/soybean cropping systems, othercropping systems such as continuous soybean, cotton pro-duction, and wheat/summer fallow rotation are usuallyreported as C sources [13,15,16]. As indicated by the datapresented in Table 1, for either the complete CT or thecomplete NT scenario in this study, two-thirds of theplanted area was in small grain production dominated bywheat, with only about 12% for corn and 8% for soy-beans. The management data (named as CTIC data after-wards) derived from the Conservation TechnologyInformation Center [17] show that the fallow area wasequivalent to 18% of the total planted area. This compo-sition of cropping systems would determine the extent towhich the SOC stock had been influenced by tillage prac-tices during the study period.
Temporal trends in soil labile C and slow C pools in association with conventional tillage (CT), no-till (NT), and actual tillage management (ATM) within sample blocks where cropped area was greater than 10% of the block area in the Northwest Great Plains ecoregionFigure 2Temporal trends in soil labile C and slow C pools in association with conventional tillage (CT), no-till (NT), and actual tillage management (ATM) within sample blocks where cropped area was greater than 10% of the block area in the Northwest Great Plains ecoregion.
20
22
24
26
28
72 74 76 78 80 82 84 86 88 90 92 94 96 98 00
Calendar Year
Slow
C(M
gC
ha-1
)
AMTCTNT
1
2
3
4
Lab
ileC
(Mg
Cha
-1)
AMTCTNT
Page 4 of 10(page number not for citation purposes)
Carbon Balance and Management 2007, 2:7 http://www.cbmjournal.com/content/2/1/7
Huggins et al. [11] assessed the effects of crop sequenceand tillage on SOC stocks using the natural 13C abun-dance of corn (Zea mays L.) and soybeans (Glycine max(L.), Merr.). Soil samples were collected after 14 yearsunder each treatment for SOC quantification. Theyobserved the influence of crop sequence on SOC (0 – 45cm depth) that occurred when tillage was reduced withchisel plow and NT. Results show that there was 15%more SOC in continuous corn than in continuous soy-bean, but all tillage treatments within continuous soy-bean systems showed little influence on SOC. Peterson etal. [18] conducted CT-NT paired experiments on wheat-dominated cropping systems in Mandan, North Dakotaand found a small annual increase rate (about 0.25%) ofthe SOC pool with NT, which is very close to our resultaveraged at the ecoregion scale.
Halvorson et al. [16] documented that the SOC stock didnot increase during 12 years under a spring wheat/fallow
system with NT in North Dakota. Compared with CT, theNT tended to lose more SOC at a rate of 50 kg ha-1yr-1 inthe upper 15 cm depth under a spring wheat/fallow sys-tem, which seems to support the conclusion that soil C inthe surface layer can be quickly lost to the atmosphere byincreasing summer fallow practice [19]. A similar resultwas also reported by Campbell et al. [20] in Canada. Hal-vorson et al. [16] suggested that conversion from crop/fal-low to more intensive cropping systems with NT is neededin order to have a positive impact on reducing CO2 emis-sions from croplands in the Northern Great Plains ecore-gion.
Based on metadata analyses with a large number of pointobservations from published works, Manley et al. [21]concluded that NT is less effective for sequestering C onthe Prairies than in other regions (e.g., in the southernUnited States and the Corn Belt), and also less effectivewith wheat than with other crops. Generally, NT for either
Magnitude of the change in the slow C pool in the top 20 cm depth of soil from 1972 to 2000 for three tillage scenarios in rela-tion to the baseline slow pool in 1972 for the sample blocks in which the cropped area percentage was greater than 10%Figure 3Magnitude of the change in the slow C pool in the top 20 cm depth of soil from 1972 to 2000 for three tillage scenarios in rela-tion to the baseline slow pool in 1972 for the sample blocks in which the cropped area percentage was greater than 10%. The inset graph illustrates the relation of the change in total SOC stock to the baseline. (ATM: actual tillage management; CT: con-ventional tillage; NT: no-till)
YNT = -10.57x + 122
R2 = 0.71
YCT = -12.58x + 110
R2 = 0.72
YAT M = -13.13x + 137
R2 = 0.81
-500
-400
-300
-200
-100
0
100
10 15 20 25 30 35 40 45 50 55 60
Slow C Pool in 1972 (Mg C ha-1)
Cha
nge
inSl
owP
oolf
rom
1972
to20
00(k
gC
ha-1
yr-1
)
ATMCTNTLinear (NT)Linear (CT)Linear (ATM)
y = -1.275x+ 136
R2
= 0.68
-600
-400
-200
0
200
100 150 200 250 300 350 400 450SOC Stock in 1972 (Mg C ha
-1)
Cha
nge
inSO
C
ATMCTNT
Page 5 of 10(page number not for citation purposes)

Carbon Balance and Management 2007, 2:7 http://www.cbmjournal.com/content/2/1/7
a continuous corn system or a corn/soybean rotation sys-tem leads to C sinks and more net C gain comes with alonger duration of NT [2], which, however, depends onbaseline SOC contents [10] and tends to level off as thesoil becomes saturated [22]. Unfortunately, this studycould not define the saturation level for the whole studyarea because we don't have enough long-term manage-ment data and necessary field observations to drive modelsimulations. Furthermore, the saturation level variesgreatly not only with specific soil but also with othermany factors.
Using historical county-level land use data for the 19thand 20th centuries to drive an ecosystem model, Parton etal. [15] conducted four case studies within the GreatPlains of the United States that were used to represent dif-ferent agro-ecosystems. Model results show that cultiva-tion of grassland results in large losses of SOC and anincrease in soil nitrogen mineralization for the first 20 to30 years of cultivation, followed by small SOC loss andnitrogen mineralization after 50 years cultivation. Theirsimulation results also indicate that the irrigated cotton
production would lead to a net C source whereas the irri-gated corn and alfalfa cropping systems would result in aC sink in the central and northern Great Plains.
Our estimate of the limited reduction in the rate of SOCrelease with conservation tillage management across theNorthwest Great Plains could be attributed to the wheat/fallow-dominated crop rotation and the composition ofall cropping systems being practiced in this ecoregion.
ConclusionOur simulated reduction in the rate of C release with con-version of CT to NT in the agricultural soils across theNorthwest Great Plains ecoregion between 1972 and2000 is much smaller than those reported from plot scalestudies and also smaller than simulated values for otherregions in general. However, similar estimates arereported by other investigators for the crop rotations andcomposition of cropping systems similar to those in ourstudy area. The changes in total SOC stock were predomi-nantly a result of the dynamics of the slow C pool at thestudy's time span. We suggest that the responses of total
Temporal trends in slow SOC pools under CT and NT in association with various baseline SOC levels in 1972 at the sample block scale within the Northwest Great Plains ecoregion (The numbers 04, 20, and 22 refer to the sample block IDs)Figure 4Temporal trends in slow SOC pools under CT and NT in association with various baseline SOC levels in 1972 at the sample block scale within the Northwest Great Plains ecoregion (The numbers 04, 20, and 22 refer to the sample block IDs. These three blocks are located in North Dakota, Montana, and North Dakota, respectively).
10
15
20
25
30
35
40
45
50
72 74 76 78 80 82 84 86 88 90 92 94 96 98 00
Calendar Year
Slow
C(M
gC
ha-1
)
CT04 NT04CT20 NT20CT22 NT22
Page 6 of 10(page number not for citation purposes)
Carbon Balance and Management 2007, 2:7 http://www.cbmjournal.com/content/2/1/7
SOC to tillage management scenarios depend signifi-cantly on the baseline SOC level. Soils with higher SOClevels tend to have higher potentials to reduce C emis-sions with conservation tillage practices, but the domi-nance of the wheat/fallow crop rotation and thecomposition of all cropping systems could be the primarycause for the limited efficiency of NT for mitigating Cemissions as simulated for the Northwest Great Plainsecoregion.
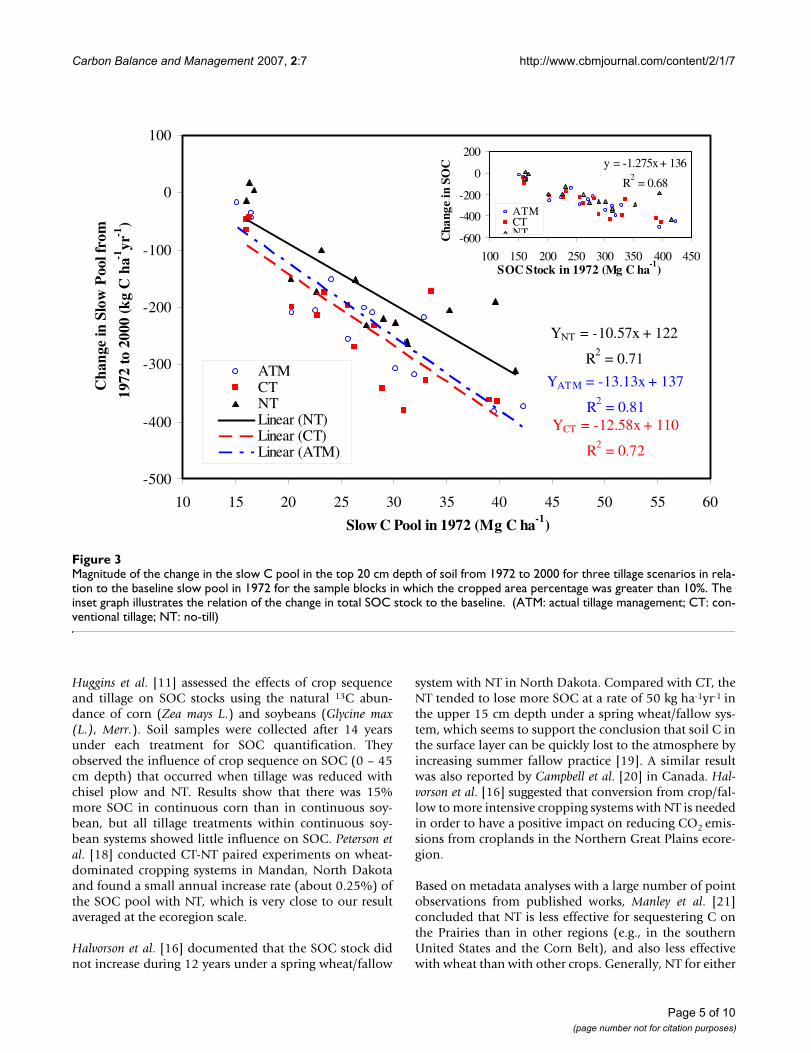
MethodsStudy areaOur study area is the Northwest Great Plains ecoregion,with a land area of 338,718 km2 (Figure 5). The averageannual precipitation from 1972 to 2000 was 400 mm(wetter in the eastern portion of the ecoregion), and the
average annual temperature was 7.2°C (warmer in thesouthern portion of the ecoregion) [6]. The mean annualtemperature was 0.67°C higher between 1986 and 2000than between 1972 and 1985.
As illustrated in Figure 5, the land cover in the ecoregionconsisted of 75% mixed grasses, 17% cropland, and 8%other land covers, on average, from 1972 to 2000 [6].Agriculture, however, has been the primary land use trans-forming this grassland-dominated ecosystem. Cumulativechange in land cover during the period accounted forabout 10% of all land area, but most of these changeswere directly related to conversions between cropland andgrassland that resulted from the implementation of theConservation Reserve Program (CRP) [6]. Cropped areaswere mainly located on level ground where soils were fer-
Study area and locations of sample blocks (After Tan et al. [7])Figure 5Study area and locations of sample blocks (After Tan et al. [7]).
Page 7 of 10(page number not for citation purposes)
Carbon Balance and Management 2007, 2:7 http://www.cbmjournal.com/content/2/1/7
tile and devoted to row crops, small grains, and fallow.Major crop types included spring wheat (Triticum aesti-vum), corn (Zea mays L.), soybean (Glycine max (L.) Merr.),and alfalfa (Medicago sativa). The proportion of all crop-land to the total land area varied from state to state, rang-ing from 5% in Wyoming to 46% in North Dakota.
Sampling frameworkThe sampling protocol proposed by Loveland et al. [8] wasintroduced to identify spatial variation of land use/landcover change in the conterminous United States usingOmernik's 84 Level III Ecoregions [9] as the samplingframework. For the Northwest Great Plains ecoregion,forty sample blocks of 10 km × 10 km each were ran-domly selected (Figure 5) to identify changes with a preci-sion of 1% at an 85% confidence level [8]. Changes weredetected based on five dates (1973, 1980, 1986, 1992,and 2000) of Landsat Multispectral Scanner (MSS) andThematic Mapper (TM) imagery data that were analyzedat a cell size of 60 m × 60 m for MSS images and 30 m ×30 m for TM images.
Modeling systemThe General Ensemble biogeochemical Modeling System(GEMS) [5] was used to simulate soil C dynamics in thisstudy. GEMS is a modeling system developed for a betterintegration of spatially explicit time-series land use andland cover change data with well-established ecosystembiogeochemical models (e.g., CENTURY). GEMS has beenused to simulate C dynamics in vegetation and soil fordiverse ecosystems, especially in the northwest GreatPlains [6,7]. As described by Liu et al. [5] and Tan et al. [7],GEMS consists of three major components: single or mul-
tiple encapsulated ecosystem biogeochemical models, anautomated stochastic parameterization system (AMPS),and an input/output processor (IOP). AMPS includes twomajor interdependent parts: the data search and retrievalalgorithms and the data processing mechanisms. The firstpart searches for and retrieves relevant information fromvarious databases according to the keys provided by ajoint frequency distribution (JFD) table. The data process-ing mechanisms downscale the aggregated information atthe map-unit level to the field scale using a Monte Carloapproach. Once the data are assimilated, they are injectedinto the modeling processes through the IOP whichupdates the default input files with the assimilated data.Values of selected output variables are also written by theIOP to a set of output files after each model execution. TheJFD grids are first created from soil maps, a time-series ofland cover images, and climate themes at a cell size of 60m × 60 m. The CENTURY model [23] was selected as theunderlying ecosystem biogeochemical model in GEMS forthis study because it has solid modules for simulating Cdynamics at the ecosystem level and has been widelyapplied to various ecosystems worldwide.
Input data for modelThe spatial simulation unit of GEMS is a JFD case. A JFDcase contains single or multiple, homogeneous, con-nected or isolated land pixels that represent a unique com-bination of values from the Geographic InformationSystem (GIS) layers [5]. The data for model input prima-rily consisted of climatic regimes, land use/land coverchange, soil inventory, management data, nitrogen (N)deposition map, and administrative districts. Land use/land cover data were described above. Climatic data con-sisted of annual precipitation and maximum and mini-mum temperature records from 1973 through 2000,which were converted to 30 m pixel GIS layers from theCRU TS 2.0 datasets [24]. Soil characteristics within eachsample block were taken from the US State Soil Geo-graphic Data Base (STATSGO) [25] for initializing the soilcomponents of GEMS. Tillage management data werederived from the CTIC [17] and would be discussed indetail below.
GEMS automates the processes of downscaling forest agesfrom the USDA Forest Inventory and Analysis data (FIA),crop compositions from the Agricultural Census, grasscover distribution and temporal changes from theremotely sensed imagery interpretation. A Monte Carlomethod was used to assign each JFD a set of specific soilproperty values such as layer depth, soil organic mattercontent, soil water holding capacity, and clay and sandpercentages. Based on the definitions set by CENTURY, wepartitioned the SOC stock into different pools at thebeginning of each simulation using a retrospective SOCinitialization algorithm: the slow SOC pool was defined
Areal percentage of each type of tillage management for the planted area of the Northwest Great Plains ecoregion (CT, conventional tillage; NT, no-till; RT, reduced-tillage)Figure 6Areal percentage of each type of tillage management for the planted area of the Northwest Great Plains ecoregion (CT, conventional tillage; NT, no-till; RT, reduced-tillage).
0%
20%
40%
60%
80%
100%
1989 1990 1992 1994 1996 1998Calendar Year
Are
alP
erce
ntag
e
CTRTNT
Page 8 of 10(page number not for citation purposes)
Carbon Balance and Management 2007, 2:7 http://www.cbmjournal.com/content/2/1/7
from the NPP for each land cover type and soil inventorydata; the difference between the total SOC and the slowpool was then used to initialize the passive SOC pool; andthe active SOC pool was set at about 2% of the total SOCstorage [7].
Ensemble simulationsGEMS generates site-level inputs with a Monte Carloapproach from regional data sets. Any single simulationof a JFD case is unique combination of randomly pickedforest age, crop species, and soil properties from regional-level datasets, so that the output of a single simulation runof a JFD might be biased. Therefore, ensemble simula-tions of each JFD were executed to incorporate the varia-bility of inputs and to average uncertainties of simulationresults. In general, the averages of ensemble simulationsbecome more stable when increasing the the times of run.We made 20 repeat runs for each JFD case in this study,which reduced the relative error to about 2%. The aver-aged JFD output from the 20 runs was then aggregated atsample block scale, and the simulation uncertainty wasevaluated on both sample block and the ecoregion scales.In this study, values of selected output variables were writ-ten to a set of output files after each model execution, andthen aggregated at four spatial levels: pixel (60 m × 60 m)→ land use category → sample block (10 km × 10 km) →ecoregion.
Tillage management data and actual tillage management scenarioTillage management data were collected from the CTIC[24] for areas of annual CT, RT and conservational tillagepractices (including mulch, ridge, and NT) and 8 croptypes at a county scale for the period from 1989 to 1998.The areas for each combination of cropping system andtillage management were documented for individualcounties at a two-year interval. For each combination ofcounty, year, and crop type, the area extents were deter-mined for the three tillage options.
The actual tillage management (ATM) information formodel simulations was based on the CTIC data with anassumption that all planted area was managed with CT in1972 and then converted to NT and RT until 1989 at apace similar to that estimated from the CTIC data for theperiod between 1989 and 1998. The areas under ATM forall cropped lands are presented in Figure 6. The probabil-ity for each tillage management option for the years after1998 was assumed to be the same as that in 1998. Tillageinformation for each crop was read in from the CTIC data-set to determine the three proportions of the total plantedarea for CT, RT, and NT. For a certain type of crop (e.g.,corn), the fraction of each tillage type in 1992 wasassigned as 0.5, 0.3, and 0.2 to planted areas managedwith CT, RT, and NT, respectively.
CT and NT scenarios for model simulationsTo evaluate the effects of different tillage options on SOCdynamics across the ecoregion, we defined two extremetillage scenarios for model simulations: (1) complete CT,which assumed that all planted areas were managed withconventional tillage since 1972, and (2) complete NT, inwhich all planted areas were assumed to be managed withno-till since 1972.
List of abbreviations usedATM – actual tillage management
CT – conventional tillage
GEMS – General Ensemble biogeochemical Modeling Sys-tem
NT – no-till
RT – reduced tillage
SOC – soil organic carbon
Competing interestsThe author(s) declare that they have no competing inter-ests.
Authors' contributionsZT designed this study, prepared model input, analyzedresults, and drafted the manuscript. SL supervised thisresearch and did model debug as the developer of GEMS.ZL was in charge of programming for incorporating tillagemanagement data into model simulations and modeldebug. TRL provided the time-series land use/land coverchange trends data and comments on the manuscript for-mulation. All authors read and approved the final manu-script.
AcknowledgementsThis research was part of the U.S. Carbon Trends Program that was sup-ported by the Geographic Analysis and Monitoring Program of the U.S. Geological Survey. We thank Norman Bliss for his constructive suggestions and technical review. We also thank Bruce Wylie, John Hutchinson, and four anonymous reviewers for their valuable comments. Work of ZT, SL, and ZL performed under USGS contract 03CRCN0001.
References1. Bernacchi CJ, Hollinger SE, Tilden M: The conversion of the corn/
soybean ecosystem to no-till agriculture may result in a car-bon sink. Global Change Biology 2005, 11:1867-1872. doi: 101111/j1365-2486200501050x
2. Hollinger SE, Bernacchi CJ, Meyers TP: Carbon budget of matureno-till ecosystem in North Central Region of the UnitedStates. Agricultural and Forest Meteorology 2005, 130:59-69.
3. Lal R, Kimble JM, Follett RF, Cole CV, (eds): The Potential of USCropland to Sequester Carbon and Mitigate the GreenhouseEffect. Volume 128. New York: Lewis Publishers; 1999.
4. Hayden BP: Ecosystem feedbacks on climate at the landscapescale. Philosophical Transactions of the Royal Society of London, Series B– Biological Sciences 1998, 353:5-18.
Page 9 of 10(page number not for citation purposes)
Carbon Balance and Management 2007, 2:7 http://www.cbmjournal.com/content/2/1/7
Publish with BioMed Central and every scientist can read your work free of charge
"BioMed Central will be the most significant development for disseminating the results of biomedical research in our lifetime."
Sir Paul Nurse, Cancer Research UK
Your research papers will be:
available free of charge to the entire biomedical community
peer reviewed and published immediately upon acceptance
cited in PubMed and archived on PubMed Central
yours — you keep the copyright
Submit your manuscript here:http://www.biomedcentral.com/info/publishing_adv.asp
BioMedcentral
5. Liu S, Loveland TR, Kurtz TR: Contemporary Carbon Dynamicsin Terrestrial Ecosystems in the Southeastern Plains of theUnited States. Environmental Management 2004, 33:442-456.
6. Tan Z, Liu S, Johnston CA, Loveland TR, Tieszen LL, Liu J, Kurtz R:Soil organic carbon dynamics as related to land use historyin the northwestern Great Plains. Global Biogeochem Cycles 2005,19:. doi:101029/2005GB002536
7. Tan Z, Liu S, Johnston CA, Liu J, Tieszen LL: Analysis of ecosystemcontrols on soil carbon source-sink relationships in thenorthwest Great Plains. Global Biogeochem Cycles 2006,20:GB4012. doi:101029/2005GB002610
8. Loveland TR, Sohl TL, Stehman SV, Gallant AL, Sayler KL, Napton DE:A strategy for estimating the rates of recent United Statesland-cover changes. Photogrammetric Engineering & Remote Sensing2002, 68:1091-1099.
9. Omernik JM: Ecoregions of the conterminous United States.Annals of the Association of American Geographers 1987, 77:118-125.
10. Tan Z, Lal R, Liu S: Using experimental and geospatial data toestimate regional carbon sequestration potential under no-till practice. Soil Science 2006, 171:950-959.
11. Huggins DR, Allmaras RR, Clapp CE, Lamb JA, Randall GW: Corn-Soybean Sequence and Tillage Effects on Soil CarbonDynamics and Storage. Soil Sci Soc Am J 2007, 71:145-154.doi:102136/sssaj20050231
12. Dolan MS, Clapp CE, Allmaras RR, Baker JM, Molina J: Soil organiccarbon and nitrogen in a Minnesota soil as related to nitro-gen, tillage, residue and nitrogen management. Soil & TillageResearch 2006, 89:221-231.
13. Sainju UM, Lenssen AW, Caesar T, Waddell JT: Tillage and croprotation effects on dryland soil and residue carbon and nitro-gen. Soil Sci Soc Am J 2006, 70:668-678.
14. West TO, Post WM: Soil organic carbon sequestration rates bytillage and crop rotation: A global data analysis. Soil Sci Soc AmJ 2002, 66:1930-1946.
15. Parton WJ, Gutmann M, Williams SA, Easter M, Ranchhod V: TheEcological Impact of Historical Land Use Patterns in theGreat Plains: A Methodological Assessment. Ecological Applica-tions 2005, 15:1915-1928.
16. Halvorson AD, Wienhold BJ, Black AL: Tillage, Nitrogen, andCropping System Effects on Soil Carbon Sequestration. SoilSci Soc Am J 2002, 66:906-912.
17. Conservation Technology Information Center (CTIC): Nationalcrop residue management survey data. [http://www.conservationinformation.com/].
18. Peterson GA, Halvorson AD, Havlin JL, Jones OR, Lyon DJ, TanakaDL: Reduced tillage and increasing cropping intensity in thegreat plains conserves soil C. Soil Till Res 1998, 47:207-218.
19. Curtin D, Wang H, Selles F, McConkey BG, Campbell CA: TillageEffects on Carbon Fluxes in Continuous Wheat and Fallow-Wheat Rotations. Soil Sci Soc Am J 2000, 64:2080-2086.
20. Campbell CA, Zentner RP, Liang B-C, Roloff G, Gregorich EC, Blom-ert B: Organic C accumulation in soil over 30 years in semi-arid southwestern Saskatchewan--Effect of crop rotationsand fertilizers. Can J Soil Sci 2000, 80:179-192.
21. Manley J, van Kooten GC, Moeltner K, Johnson DW: Creating Car-bon Offsets in Agriculture through No-Till Cultivation: AMeta-Analysis of Costs and Carbon Benefits. In Climatic ChangeVolume 68. Issue 1-2 Department of Economics University of Victoria;2005:41-65.
22. Antle JA, McCarl BA: The Economics of Carbon Sequestrationin Agricultural Soils. In The International Yearbook of Environmentaland Resource Economics 2002/2003 Edited by: Tietenberg T, Folmer H.Cheltenham, UK: Edward Elgar; 2002:278-310.
23. Parton WJ, Scurlock MO, Ojima DS, Gilmanov TG, Scholes RJ,Schimel DS, Kirchner T, Menau J-C, Seastedt T, Moya EG, KamnalrutA, Kinyamario JI: Observations and modeling of biomass andsoil organic matter dynamics for the grassland biome world-wide. Global Biogeochem Cycles 1993, 7:785-809.
24. Climatic Research Unit: CRU TS 2.0 datasets. [http://www.cru.uea.ac.uk/cru/data/hrg.htm].
25. USDA-NRCS: State Soil Geographic (STATSGO) Data Base:Data use information. Miscellaneous Publication 1492 1994.
Page 10 of 10(page number not for citation purposes)
Copyright © 2022 FDOKUMEN