Characterizing the Networks of Digital Information that Support Collaborative Adaptive Forest...
18
1 23 Environmental Management ISSN 0364-152X Environmental Management DOI 10.1007/s00267-015-0497-x Characterizing the Networks of Digital Information that Support Collaborative Adaptive Forest Management in Sierra Nevada Forests Shufei Lei, Alastair Iles & Maggi Kelly
-
Upload
ucberkeley -
Category
Documents
-
view
0 -
download
0
Transcript of Characterizing the Networks of Digital Information that Support Collaborative Adaptive Forest...

1 23
Environmental Management ISSN 0364-152X Environmental ManagementDOI 10.1007/s00267-015-0497-x
Characterizing the Networks of DigitalInformation that Support CollaborativeAdaptive Forest Management in SierraNevada Forests
Shufei Lei, Alastair Iles & Maggi Kelly
1 23
Your article is protected by copyright and all
rights are held exclusively by Springer Science
+Business Media New York. This e-offprint is
for personal use only and shall not be self-
archived in electronic repositories. If you wish
to self-archive your article, please use the
accepted manuscript version for posting on
your own website. You may further deposit
the accepted manuscript version in any
repository, provided it is only made publicly
available 12 months after official publication
or later and provided acknowledgement is
given to the original source of publication
and a link is inserted to the published article
on Springer's website. The link must be
accompanied by the following text: "The final
publication is available at link.springer.com”.
Characterizing the Networks of Digital Information that SupportCollaborative Adaptive Forest Management in Sierra NevadaForests
Shufei Lei1 • Alastair Iles1 • Maggi Kelly1,2
Received: 30 October 2014 / Accepted: 8 April 2015
� Springer Science+Business Media New York 2015
Abstract Some of the factors that can contribute to the
success of collaborative adaptive management—such as
social learning, open communication, and trust—are built
upon a foundation of the open exchange of information
about science and management between participants and
the public. Despite the importance of information trans-
parency, the use and flow of information in collaborative
adaptive management has not been characterized in detail
in the literature, and currently there exist opportunities to
develop strategies for increasing the exchange of infor-
mation, as well as to track information flow in such con-
texts. As digital information channels and networks have
been increased over the last decade, powerful new infor-
mation monitoring tools have also been evolved allowing
for the complete characterization of information products
through their production, transport, use, and monitoring.
This study uses these tools to investigate the use of various
science and management information products in a case
study—the Sierra Nevada Adaptive Management Project—
using a mixed method (citation analysis, web analytics, and
content analysis) research approach borrowed from the
information processing and management field. The results
from our case study show that information technologies
greatly facilitate the flow and use of digital information,
leading to multiparty collaborations such as knowledge
transfer and public participation in science research. We
conclude with recommendations for expanding information
exchange in collaborative adaptive management by taking
advantage of available information technologies and
networks.
Keywords Citation analysis � Collaborative adaptive
management � Information flow � Information networks �SNAMP � Web analytics
Introduction
Public forestlands in the US West are currently managed
by the US Forest Service through complex and often
contentious partnerships between public and private enti-
ties. In recent decades, the collaborative adaptive man-
agement approach has been increasingly adopted to address
the conflicts among diverse environmental stakeholders
(Wondolleck and Yaffee 2000; Scarlett 2013). The success
(and failure) of such management is often related to the
ways in which information is controlled, is accessed, and
moves between parties (Kelly et al. 2012). However, the
role and impact of information in forest management have
not been systematically examined in previous studies. This
study attempts to provide a quantitative characterization of
knowledge transfer in a case study of collaborative adap-
tive management in publically managed forests in
California by tracking the flow of digital information
products.
Managing social–ecological systems such as forests is
challenging due to the ecological uncertainties and social
complexities inherent in these systems (Berkes et al. 1998).
To effectively address uncertainties in natural processes,
Holling (1978) formalized the adaptive management pro-
cess. This process aims to reduce uncertainties by learning
from science-based, policy experimentation (Walters and
& Maggi Kelly
1 University of California, Berkeley, 130 Mulford Hall, #3114,
Berkeley, CA 94720-3114, USA
2 Geospatial Innovation Facility, University of California,
Berkeley, CA 94720-3114, USA
123
Environmental Management
DOI 10.1007/s00267-015-0497-x
Author's personal copy
Holling 1990). As with adaptive approaches to natural
processes, policy experimentation follows an iterative,
structured decision-making process that defines the prob-
lem; identifies and prioritizes objectives; identifies and
implements management policies; monitors and evaluates
outcomes; and adapts management policies based on im-
plementation results (Allen et al. 2011). There is growing
recognition that the social complexities in natural resource
management can act as forces of fragmentation that prevent
management success (Conklin 2006). Natural resource
managers have looked to adaptive co-management (Fisher
et al. 2007; Plummer and FitzGibbon 2007; Armitage et al.
2008)—management by sharing power among participat-
ing environmental stakeholders—to diminish the forces of
fragmentation and, hence, to produce better partnership and
to improve management outcomes because co-manage-
ment is good for linking different types and levels of or-
ganizations and individuals together, facilitating exchange
of resources, and providing conflict resolution mechanisms
(Carlsson and Berkes 2005). However, since power sharing
is not always politically or legally feasible, an alternative
management scheme called collaborative adaptive man-
agement (CAM henceforth) has been developed to create a
partnership among diverse environmental stakeholders
based on co-management strategies and techniques without
sharing management power.
One of the key building blocks for collaboration is social
learning, defined as ‘‘the collective action and reflection
that occurs among different individuals and groups as they
work to improve the management of human and environ-
ment interrelations’’ (Keen et al. 2005). Pickerton (1994)
claimed that collaboration would be more likely to succeed
if a social learning process occurred among different
stakeholders. To understand how social learning helped
collaboration succeed, Schusler et al. (2003) showed that
social learning, by means of deliberation, contributed to
identifying common purpose and developing collaborative
relationships in their study of the Lake Ontario Islands
Search Conference. Extending those findings, Plummer and
FitzGibbon (2007) argued that ‘‘deliberation that enables
social learning may produce social capital,’’ which would
in turn lead to more collective action and social learning
(Berkes 2009). Berkes (2009) further argued that social
learning was ‘‘one of these tasks, essential both for the
cooperation of partners and an outcome of the co-operation
of partners’’ when he examined the role of knowledge
generation, bridging organizations and social learning in
the evolution of co-management. In sum, social learning
can increase the chances for collaboration by identifying
common purposes, developing collaborative relationships,
producing social capital, and fostering co-operation among
partners.
Central to studies of social learning in the environmental
management context is the production, transfer, and use of
knowledge, as Weber and Khademian (2008) argued that
knowledge sending, receiving, and integrating were critical
tasks for achieving network effectiveness in dealing with
‘‘wicked’’ problems (Rittel and Webber 1973), such as
managing social–ecological systems. In his review of the
co-management literature, Berkes (2009) focused on
knowledge generation and social learning because these
two elements were key to ‘‘moving co-management for-
ward.’’ One of Berkes’ central points was that knowledge
ought to be co-produced and shared among multiple parties
at different scales in order to bridge different levels of
organizations. In discussing scale dynamics in linked hu-
man-environmental systems, Cash et al. (2006) went be-
yond the conventional scales (i.e., spatial, temporal, and
jurisdictional scales) and portrayed knowledge as a scale in
itself, highlighting the importance of facilitating knowl-
edge scale crossing and level crossing to overcome scale
challenges in managing such systems.
Despite its importance to dealing with ‘‘wicked prob-
lems,’’ some scholars have found that studies on learning in
the context of adaptive management and co-management
remain poorly formulated and vague. Armitage et al.
(2008) argued that there exists a ‘‘paradox of learning’’ in
collaborative environmental management, that is, while the
importance of learning is emphasized, managers still
struggle to learn from experience and adapt. Fabricius and
Cundill (2014) argued that learning had not been critically
analyzed in a practical context; as a result, ‘‘researchers
and practitioners are no clearer about who learns during the
process, what they learn about, and the processes that
support the kind of learning outcomes observed or
recorded.’’ The lack of clarity is attributable to the very real
difficulties in following the movement of information, as
physical forms of information (e.g., a printed environ-
mental report) do not readily produce an information trail,
that is, who has read it and how many times it has been
read.
The advancement of information technologies on the
Internet (Castells 1996) has dramatically changed this
situation, and environmental governance and management
are increasingly facilitated by information systems that
perform data and information tracking (Mol 2006).
Numerous useful (and often free or inexpensive) web
analytics tools have been emerged in the past decade that
enable us to better track and analyze the use and flow of
digital information (Kaushik 2010). Environmental man-
agement systems such as CAM have benefited from these
developments (Mol 2008). There have been numerous re-
cent studies on the flow of information through social
networks (Bodin and Norberg 2005; Knoot and Rickenbach
Environmental Management
123
Author's personal copy
2011) and information collection and distribution via in-
formation systems and technologies on the Internet (Helly
et al. 2001; Kearns et al. 2003; Pedersen et al. 2007; Moore
et al. 2011; Kelly et al. 2012), but less has been done using
these tools to focus on CAM. Thus, there is a great need for
a thorough and rigorous characterization of the use and
flow of digital information on the Internet for CAM.
This study attempts to provide a quantitative charac-
terization of knowledge transfer by tracking the flow of
digital information products in the Sierra Nevada Adaptive
Management Project (SNAMP). Tracking the flow of
digital information products is used here as a surrogate
measure of knowledge transfer processes because infor-
mation acquisition generally takes place before knowledge
formation (Ackoff 1989; Bellinger et al. 2004). The
tracking process follows a devised information flow
framework inspired by Timmerman et al. (2000) who de-
vised an information cycle framework for water quality
monitoring. While the Timmerman framework focused
more on the production and monitoring of information, this
study examines four important stages in the information
cycle: production, transport, use, and monitoring. At the
production stage, the key aspects of information products
are when information is produced; and where and how it is
distributed. In the transport stage, information is charac-
terized by travel rate, distance, and movement pattern. At
the use stage, the consumption and impact of information
are investigated. And in the monitoring stage, the impor-
tance and methods for monitoring information are dis-
cussed. In this framework, the production, transport, and
use stages proceed sequentially, while the monitoring stage
intervenes throughout the information flow cycle. This
systematic tracking and analysis of information flow will
enable a more accurate study of the influence of
information.
We had three objectives in characterizing the flow cycle
of digital information on the Internet in the SNAMP pro-
ject. The primary objective was to evaluate whether and
how online digital information had improved collaboration
in CAM. The second objective was to examine how much
information technologies and systems facilitated digital
information use and flow. Finally, we sought to verify the
effectiveness of using a mixed method approach to mea-
sure and evaluate the online digital information in CAM.
Case Study: Digital Information in SNAMP
Responding to the call from the 2004 Sierra Nevada Forest
Plan Amendment (U.S. Forest Service 2004) to manage the
forest ‘‘using the best available scientific information,’’ the
Sierra Nevada Adaptive Management Project (SNAMP)
began in 2005 to study the impact of forest fuel treatment
strategy—Strategically Placed Landscape Area Treatments
(Collins et al. 2010) on forest health, fire mitigation, and
prevention, Pacific fishers (Martes pennanti) and California
Spotted Owls (Strix occidentalis), and water quality and
quantity in two study areas (called Last Chance and Sugar
Pine) in the mixed conifer Sierra Nevada forests of
northern California. The US Forest Service initiated the
creation of a partnership among three broad groups of
participants: federal and state natural resource agencies
(e.g., U.S. Forest Service, US Fish & Wildlife Service,
CalFire, California Department of Fish & Wildlife
California Natural Resource Agency, California Depart-
ment of Water Resources, and California Department of
Food and Agriculture); environmental advocacy groups
(e.g., Sierra Forest Legacy, Sierra Club, Defenders of
Wildlife, etc.) and local communities; and university sci-
entists from UC Berkeley, UC Merced, UC Davis,
University of Minnesota, and UC Cooperative Extension,
collectively serving as an independent third party (Bales
et al. 2010). To foster collaboration among the diverse
participants in SNAMP, the Public Participation Team
(PPT), which consisted of University of California Coop-
erative Extension specialists, university scientists, infor-
mation technology experts, and experienced researchers in
the field of natural resource management, was tasked to
facilitate dialogs in public meetings (e.g., field trip, all
stakeholders annual meetings, workshops, and others) (Lei
and Kelly 2015) and to make the SNAMP information
transparent and accessible to all participants.
Given the diversity of participants, the PPT employed a
number of digital information systems and networks to
achieve information transparency and accessibility. The on-
line information distribution backbone for SNAMP was its
official website, which aimed to provide comprehensive in-
formation about the project to the public and all parties in-
volved (Kelly et al. 2012). Visitors to the website could find
information about what groups were involved in the project,
updates on the latest research activities and findings, a list of
upcoming events, and archives of past events and documents.
Among these archived documents were founding documents,
meeting notes and presentations, maps, and news articles from
public news media. To increase the appeal of the content, the
website also hosted photos of fishers, owls, research sites, and
interaction among participants in public meetings, as well as
videos that explained the SNAMP process, forest treatments
activities, fisher research, and others. As an attempt to reach
more people with the SNAMP information, the PPT also
utilized a number of community-driven web applications,
such as Flickr, YouTube, and Facebook. For a more detailed
discussion of the development and maintenance of the website
see Kelly et al. (2012).
In addition to using web technologies, the SNAMP also
made information transparent by publishing research
Environmental Management
123
Author's personal copy

results to peer-reviewed scientific journals and posting
short summaries of research goals, methods, and results on
the SNAMP website. The primary target audiences for the
scientific information were research scientists and forest
managers. Another way to digitally publicize the SNAMP
information was promoting the SNAMP outreach and re-
search activities to online newspapers and weblogs. The
main goal of publicizing the SNAMP information to online
media was to inform and engage local communities and
environmental advocacy groups. The full spectrum of
digital information produced and tracked is found in
Table 1.
Methods
We analyzed the flow of digital information in a wide
variety of digital information products and distribution
channels in SNAMP (Table 2) through a mixed research
methods including citation analysis (Garfield 1972; Bar-
Ilan 2006), web analytics (Kaushik 2010; Clifton 2012),
and content analysis (Neuendorf 2002).
Citation Analysis
Citation analysis was used to track the use of SNAMP
peer-reviewed publications. Despite long-running debate
over the validity of the citation analysis method (Garfield
1972; MacRoberts and MacRoberts 1989), citation analysis
remains an effective quantitative method for analyzing
connections among scientific publications and scholars by
taking advantage of the structured citation information
(Small 1999; Rorissa and Yuan 2012). Our citation analysis
began with collecting publicly accessible articles that had
cited SNAMP publications1 by searching their titles on
Google Scholar, a citation search engine. Using only
Google Scholar was sufficient for this study because it
returned more citation search results than other citation
search engines, such as Web of Knowledge and CiteSeerX
(Walters 2007). It also sourced citations from both aca-
demic and non-academic publications, which could depict
more accurately the movement of information among
participants and the public. These search results were en-
tered into a spatially enabled, relational database, modeled
by the Unified Modeling Language (UML) to represent
entities (i.e., articles, authors, search engines, affiliated
organizations, and sources of the articles) and their rela-
tionships. A web interface for inputting the collected ci-
tation articles was built on Django, an open-source, rapid
web development framework.
Once the citation results were entered into the structured
database via the web interface, pieces of the citation data
could be queried from the dataset to evaluate the impact of
SNAMP publications in terms of time, relative knowledge
domain, and geographic location. In particular, to calculate
the rate of formal knowledge adoption, the time lapses
between SNAMP publications and their first citations
published by authors unaffiliated with SNAMP were
measured. Document types were examined to check whe-
ther these academic publications were cited only within
academic circles. Similarly, the primary knowledge do-
mains of the SNAMP publications were compared with
those of their citations in order to see how much SNAMP-
produced knowledge was adopted and/or extended by other
researchers. Lastly, the locations of the citations articles,
according to the institutions of their first authors, were
visualized on a map in order to gauge how far in geo-
graphic terms knowledge could travel.
Web Analytics
While peer-reviewed journal publications from SNAMP
were studied by citation analysis, other SNAMP informa-
tion products, such as its website, photos on Flickr, social
network on Facebook, and its videos on YouTube, were
measured by their respective web analytics. The technique
of ‘‘multiplicity’’ (Kaushik 2010), or using multiple web
analytics tools to synthesize and analyze interaction and
consumption of web contents, was applied to SNAMP in-
formation portals and channels on the Internet. Thus, the
official SNAMP website was measured by Google
Analytics, Facebook page by Facebook Insights, YouTube
videos by YouTube Analytics, and Flickr photos by Flickr
stats. The evaluation metrics for these four web analytics
tools included the number of pageviews of the content,
location of visitors, information consumption patterns, and
the statistics for visitors’ social engagement (i.e., sharing
information with others).
Content Analysis
Content analysis, ‘‘the systematic, objective, quantitative
analysis of message characteristics’’ (Neuendorf 2002),
was performed on online newspaper and weblog articles
that have mentioned SNAMP. Most of the traditional pa-
per-based newspapers now offer digital version of their
content on the Internet to increase their readership. Many
of the news articles had already been collected and stored
in the News and Other Media sections of the SNAMP
website over the course of the project. Additional news-
paper articles about SNAMP were collected from searching
the keyword phrases ‘‘Sierra Nevada Adaptive Manage-
ment Project’’ and ‘‘SNAMP’’ on the LexisNexis database,
1 The full list of SNAMP publications is available on the SNAMP
website at http://snamp.cnr.berkeley.edu/.
Environmental Management
123
Author's personal copy
which contained archived digital news content from
newspapers. The newspapers that covered SNAMP were
primarily local newspapers near the SNAMP study sites,
such as Sierra Star, Sacramento Bee, Modesto Bee, Merced
Sun-Star, and others. Besides traditional news sources,
journalism is extended by the popularization of weblogs, a
grassroots journalism platform (Gillmor 2004). To search
the blogosphere, the Google Blog Search was a more
suitable search engine than the standard Google Web
Search because it returned more relevant results based on
their content, as well as more articles from the past.
The weblogs that cited SNAMP came mostly from non-
profit environmental organizations. The content of the
newspaper and weblog articles typically fell into three
categories: re-posting upcoming SNAMP events and ac-
tivities, publicizing new research findings from SNAMP,
and linking SNAMP findings with current issues (e.g.,
linking the use of rodenticide in marijuana growth on
federal lands to the death of fishers). The collected
newspaper and blog articles were coded in two dimen-
sions—according to the authorship of the articles, i.e.,
SNAMP team members (Self), bloggers (Blog), and news
outlets (News), and according to the theme of the articles,
i.e., General, Fisher, FFEH (Fire & Forest Ecosystem
Health), PPT (Public Participation Team), Spatial, Water,
and Owl. The coded articles were then plotted on a timeline
for visualization and analysis.
Results
Scientific Knowledge Networks
As of December 31, 2013, the SNAMP Science Team had
produced 25 peer-reviewed journal papers: 23 papers were
published, while two were accepted or in press. Among the
23 published papers, 19 were cited at least once, with a
total of 190 citations (see Table 2). The five most cited
Table 1 Public engagement techniques and quantitative evaluation methods evaluated in this work
Target Dataset used Evaluation method
SNAMP website Website content, use Google analytics
SNAMP science products Peer-reviewed journal articles; newsletters Content analysis; citation analysis
SNAMP digital products Media articles Content analysis; citation analysis
SNAMP web services Facebook, Flickr, YouTube Web analytics
Table 2 Citations’ first
authors’ affiliated organization
type and their counts (as of
February 19, 2014)
Publications Academic Federal Foreign Industry NGO Research Total
Pub#4 37 2 2 2 43
Pub#1 13 24 2 1 40
Pub#2 9 10 1 1 1 22
Pub#6 17 2 1 20
Pub#7 11 1 12
Pub#17 1 6 1 1 9
Pub#18 5 3 8
Pub#12 4 3 7
Pub#14 3 1 1 5
Pub#10 2 1 1 4
Pub#13 2 2 4
Pub#16 2 2 4
Pub#5 2 1 3
Pub#3 1 1 2
Pub#9 2 2
Pub#19 1 1 2
Pub#8 1 1
Pub#21 1 1
Pub#24 1 1
Total 110 53 14 1 4 8 190
Environmental Management
123
Author's personal copy

SNAMP publications were Pub#4 (43 times), Pub#1 (40),
Pub#2 (22), Pub#6 (20), and Pub#7 (12). Pub#1 and Pub#4
were the first two publications from SNAMP (on 1/1/10
and 6/1/10, respectively), and Pub#2, Pub#6, and Pub#7
were also among the earlier publications. In terms of
content, Pub#1 and Pub#2 studied the impact of fuel
treatments on fire in forested landscape, while Pub#4,
Pub#6, and Pub#7 discussed the methodology of using the
emerging LiDAR technology. The affiliated organizations
of the first authors on papers citing SNAMP were catego-
rized as academic institutions (Academic, 110 citations),
federal organizations (Federal, 53), foreign research insti-
tutes (Foreign, 14),2 research institutes (Research, 8), Non-
Government Organizations (NGO, 4), and industry or
companies (Industry, 1). Among the 53 Federal citations,
24 of them were citing publication #1, ten citing publica-
tion #2, and six citing publication #17.
The publications citing SNAMP research came in a
variety of types including book sections (2), conference
papers (7), journal articles (138), petitions (2), professional
paper (1), environmental reports (19), theses (16), a user
guide (1), white papers (2), and workshop documents (2).
While the majority of the citations (86 %) belonged to the
academic and scientific sectors, 18 out of the 19 citations
were found in environmental management reports that
were produced by research scientists in the U.S. Forest
Service. The notable examples among these reports are the
General Technical Reports (Mclver et al. 2010; Calkin
et al. 2011) and Science Synthesis Reports (Long et al.
2013). The goals of these reports are to synthesize and
deliver the latest scientific research findings to land man-
agers, so that they can make better management decisions.
As the citations in these environmental reports indicate a
transfer of information from the SNAMP to the U.S. Forest
Service, they may mark the completion of one of the
SNAMP goals, which is to increase environmental man-
agers’ scientific knowledge for managing social–ecological
systems.
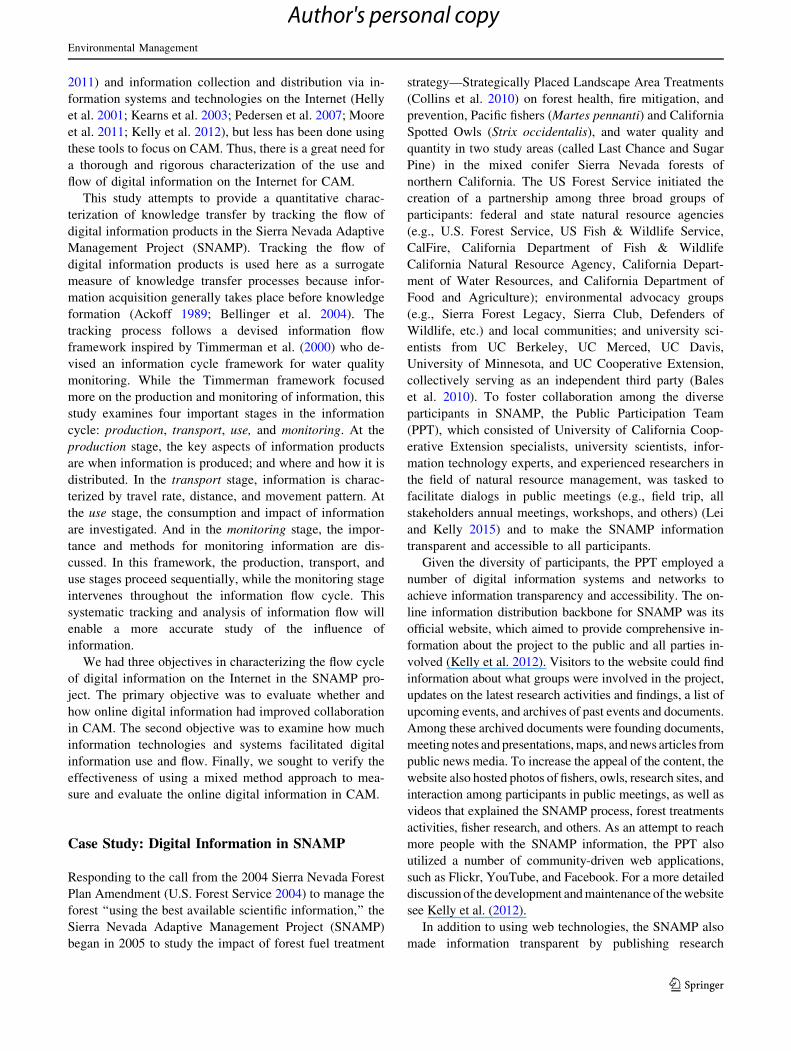
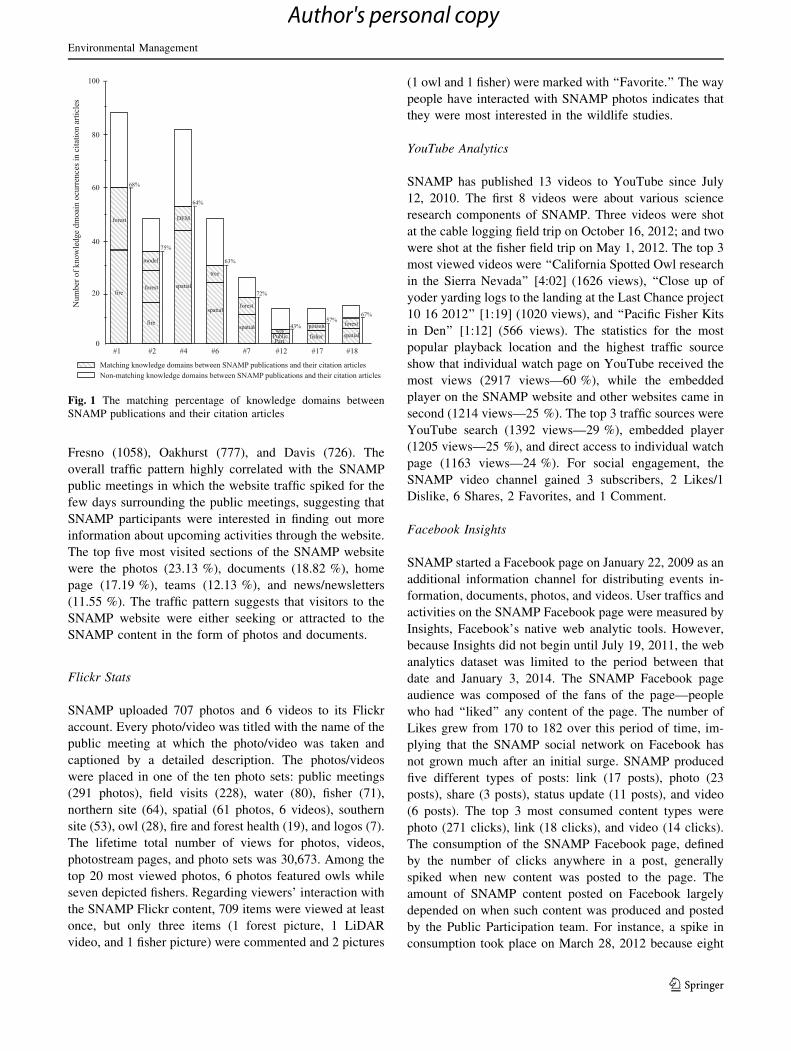
The knowledge domains (or areas of research focus) of
the SNAMP publications and their citation articles are il-
lustrated in Fig. 1. The knowledge domains of the citation
articles generally matched those of the SNAMP publica-
tions (more than 50 % matching for 7 of 8 publications),
implying that SNAMP publications have led to greater
depth of knowledge in the same knowledge domains.
Nevertheless, some of the SNAMP publications were cited
by studies in other knowledge domains. For example,
Publication #2, which focused on forest, fire, and models,
was cited by research projects that studied other aspects of
the forest, such as greenhouse gas, biomass, carbon, fisher,
and water. By other scholars applying research methods
and knowledge developed in SNAMP to their own re-
search, the SNAMP process was able to expand knowledge
beyond the scope of the project. The finding validates the
efficacy of information transparency and accessibility for
knowledge production and expansion.
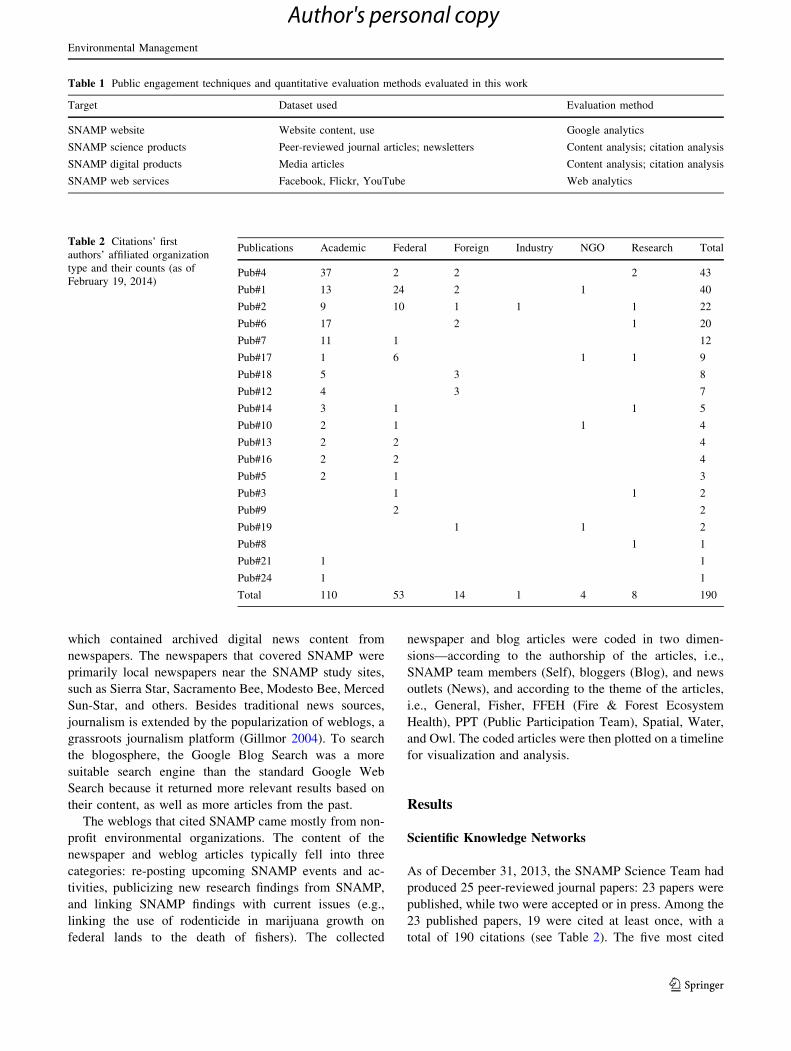
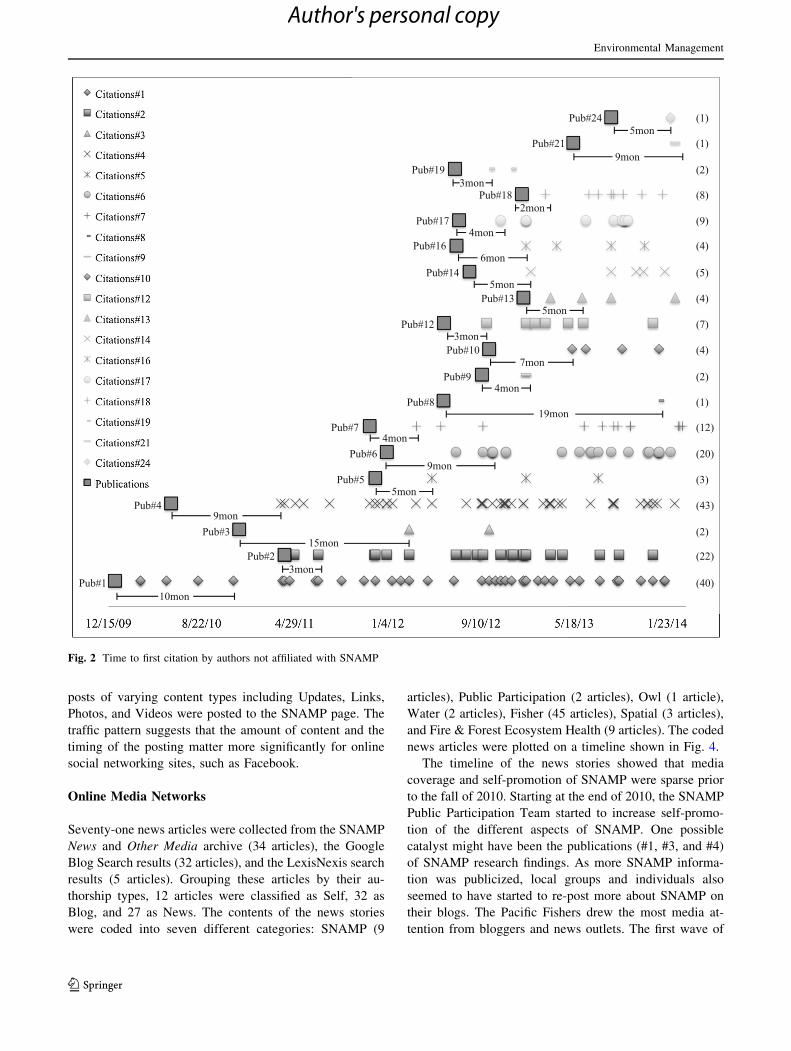
The SNAMP publications and their citations are plotted
on a timeline according to their publication dates3 in Fig. 2.
By highlighting the time lapse between SNAMP publica-
tions and their respective first citation articles that were
authored by scientists unaffiliated with SNAMP, the rates
of information adoption were calculated to range from 2 to
19 months, with the majority of them (17 out of 19) under
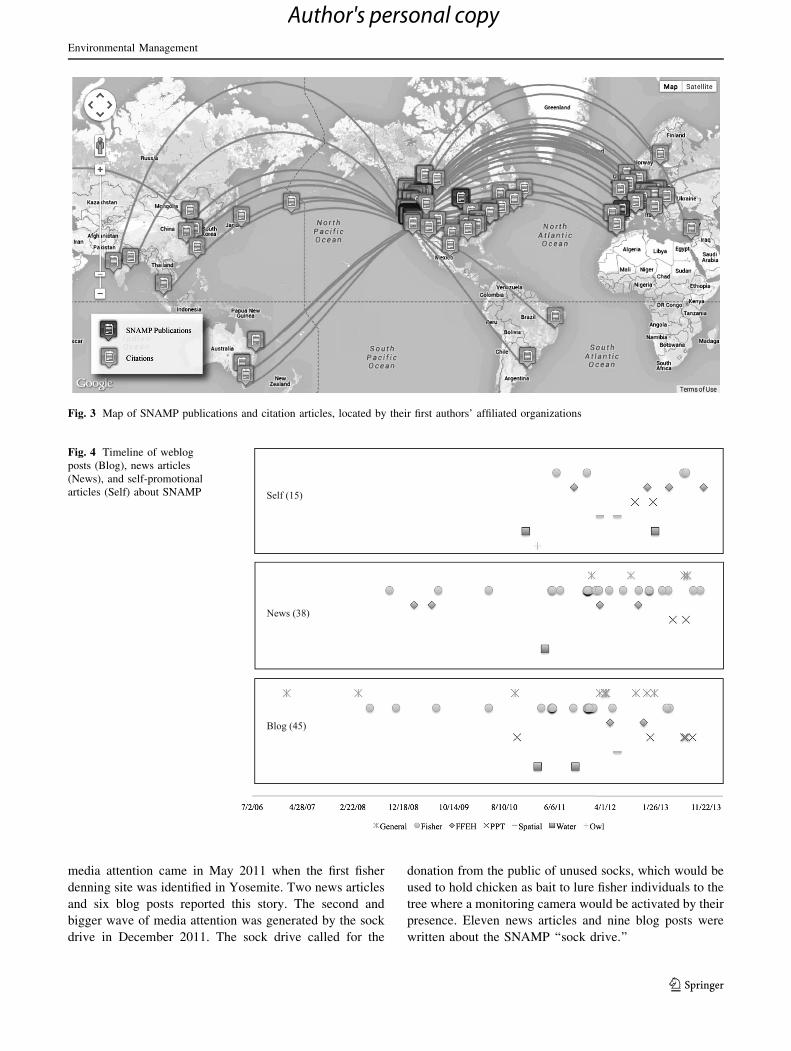
a year. Mapping the citations according to the locations of
their first authors’ institutions—found in the author infor-
mation section of the journal articles—on the Google Map
interface rendered a visual representation of where
SNAMP publications were produced and where they were
cited (see Fig. 3). The flight lines aim to provide a sense of
approximate ‘‘travel distances’’ for SNAMP publication
information transfer. The spatial distribution patterns var-
ied among SNAMP publications, but generally speaking,
publications were cited far outside of their originating in-
stitution. Publications focusing on forest landscapes (i.e.,
Publication# 1, 2, and 13) and wildlife (Publication# 3, 8,
9, 10, 16, 17, 19, and 21) in the Sierra Nevada forests were
primarily cited within the United States, while publications
focusing on LiDAR technologies (Publication# 4, 5, 6, 7,
14, 18, and 24) and website development (Publication #12)
were more globally cited. This suggests that method- and
technique-based information is more transferrable and less
restricted by the context in which the information is
produced.
Web Applications and Services Networks
Google Analytics
The SNAMP website went online in January 2006. The
Web statistics collected by Google Analytics reports that
the SNAMP website received 42,661 sessions of visits
between October 1, 2007 (the start of the website traffic
data collection) and January 31, 2014, which averages to
569 sessions per month. On average, website visitors
stayed for 3 min and clicked on four pages per visit. The
majority (83.65 %) of the visitors came from the United
States, and more than two-thirds (67.42 %) of them from
California. The top eight cities that generated the most
number of sessions were Sacramento (2661), San Francisco
(1649), Berkeley (1332), O Neals (1276), Merced (1235),
2 A foreign educational institution is classified under Academic not
Foreign.
3 The first day of the month is chosen for publications that have only
the month and year.
Environmental Management
123
Author's personal copy
Fresno (1058), Oakhurst (777), and Davis (726). The
overall traffic pattern highly correlated with the SNAMP
public meetings in which the website traffic spiked for the
few days surrounding the public meetings, suggesting that
SNAMP participants were interested in finding out more
information about upcoming activities through the website.
The top five most visited sections of the SNAMP website
were the photos (23.13 %), documents (18.82 %), home
page (17.19 %), teams (12.13 %), and news/newsletters
(11.55 %). The traffic pattern suggests that visitors to the
SNAMP website were either seeking or attracted to the
SNAMP content in the form of photos and documents.
Flickr Stats
SNAMP uploaded 707 photos and 6 videos to its Flickr
account. Every photo/video was titled with the name of the
public meeting at which the photo/video was taken and
captioned by a detailed description. The photos/videos
were placed in one of the ten photo sets: public meetings
(291 photos), field visits (228), water (80), fisher (71),
northern site (64), spatial (61 photos, 6 videos), southern
site (53), owl (28), fire and forest health (19), and logos (7).
The lifetime total number of views for photos, videos,
photostream pages, and photo sets was 30,673. Among the
top 20 most viewed photos, 6 photos featured owls while
seven depicted fishers. Regarding viewers’ interaction with
the SNAMP Flickr content, 709 items were viewed at least
once, but only three items (1 forest picture, 1 LiDAR
video, and 1 fisher picture) were commented and 2 pictures
(1 owl and 1 fisher) were marked with ‘‘Favorite.’’ The way
people have interacted with SNAMP photos indicates that
they were most interested in the wildlife studies.
YouTube Analytics
SNAMP has published 13 videos to YouTube since July
12, 2010. The first 8 videos were about various science
research components of SNAMP. Three videos were shot
at the cable logging field trip on October 16, 2012; and two
were shot at the fisher field trip on May 1, 2012. The top 3
most viewed videos were ‘‘California Spotted Owl research
in the Sierra Nevada’’ [4:02] (1626 views), ‘‘Close up of
yoder yarding logs to the landing at the Last Chance project
10 16 2012’’ [1:19] (1020 views), and ‘‘Pacific Fisher Kits
in Den’’ [1:12] (566 views). The statistics for the most
popular playback location and the highest traffic source
show that individual watch page on YouTube received the
most views (2917 views—60 %), while the embedded
player on the SNAMP website and other websites came in
second (1214 views—25 %). The top 3 traffic sources were
YouTube search (1392 views—29 %), embedded player
(1205 views—25 %), and direct access to individual watch
page (1163 views—24 %). For social engagement, the
SNAMP video channel gained 3 subscribers, 2 Likes/1
Dislike, 6 Shares, 2 Favorites, and 1 Comment.
Facebook Insights
SNAMP started a Facebook page on January 22, 2009 as an
additional information channel for distributing events in-
formation, documents, photos, and videos. User traffics and
activities on the SNAMP Facebook page were measured by
Insights, Facebook’s native web analytic tools. However,
because Insights did not begin until July 19, 2011, the web
analytics dataset was limited to the period between that
date and January 3, 2014. The SNAMP Facebook page
audience was composed of the fans of the page—people
who had ‘‘liked’’ any content of the page. The number of
Likes grew from 170 to 182 over this period of time, im-
plying that the SNAMP social network on Facebook has
not grown much after an initial surge. SNAMP produced
five different types of posts: link (17 posts), photo (23
posts), share (3 posts), status update (11 posts), and video
(6 posts). The top 3 most consumed content types were
photo (271 clicks), link (18 clicks), and video (14 clicks).
The consumption of the SNAMP Facebook page, defined
by the number of clicks anywhere in a post, generally
spiked when new content was posted to the page. The
amount of SNAMP content posted on Facebook largely
depended on when such content was produced and posted
by the Public Participation team. For instance, a spike in
consumption took place on March 28, 2012 because eight
100
40
60
80
20
forest
fire
68%
#1
Num
ber o
f kno
wle
dge
dmoa
in o
curr
ence
s in
cita
tion
artic
les
0
Matching knowledge domains between SNAMP publications and their citation articlesNon-matching knowledge domains between SNAMP publications and their citation articles
forest
fire
75%
model
#2
spatial
64%
DEM
#4
tree
spatial
63%
#6
forest
spatial
72%
#7
PublicPart.
43%
#12
webfisher
57%
#17
poisonspatial
67%
#18
forest
Fig. 1 The matching percentage of knowledge domains between
SNAMP publications and their citation articles
Environmental Management
123
Author's personal copy
posts of varying content types including Updates, Links,
Photos, and Videos were posted to the SNAMP page. The
traffic pattern suggests that the amount of content and the
timing of the posting matter more significantly for online
social networking sites, such as Facebook.
Online Media Networks
Seventy-one news articles were collected from the SNAMP
News and Other Media archive (34 articles), the Google
Blog Search results (32 articles), and the LexisNexis search
results (5 articles). Grouping these articles by their au-
thorship types, 12 articles were classified as Self, 32 as
Blog, and 27 as News. The contents of the news stories
were coded into seven different categories: SNAMP (9
articles), Public Participation (2 articles), Owl (1 article),
Water (2 articles), Fisher (45 articles), Spatial (3 articles),
and Fire & Forest Ecosystem Health (9 articles). The coded
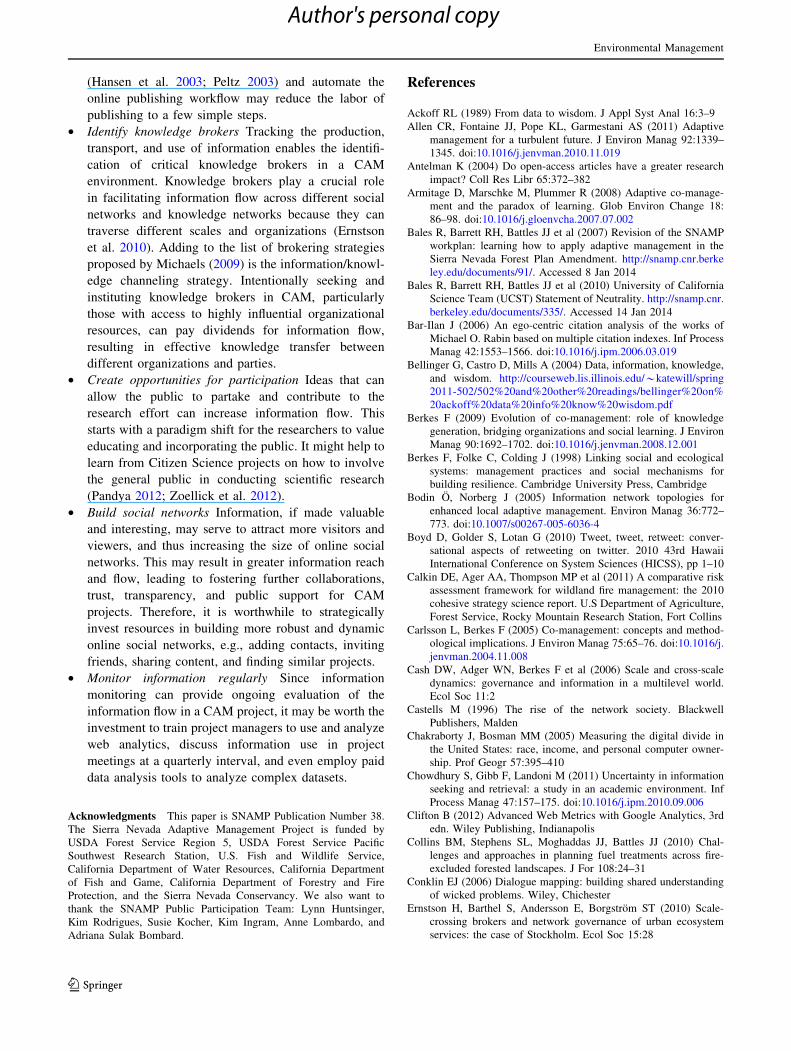
news articles were plotted on a timeline shown in Fig. 4.
The timeline of the news stories showed that media
coverage and self-promotion of SNAMP were sparse prior
to the fall of 2010. Starting at the end of 2010, the SNAMP
Public Participation Team started to increase self-promo-
tion of the different aspects of SNAMP. One possible
catalyst might have been the publications (#1, #3, and #4)
of SNAMP research findings. As more SNAMP informa-
tion was publicized, local groups and individuals also
seemed to have started to re-post more about SNAMP on
their blogs. The Pacific Fishers drew the most media at-
tention from bloggers and news outlets. The first wave of
2mon
3mon
Pub#1
Pub#2
Pub#3
Pub#4
Pub#5
Pub#6
Pub#7
Pub#8
Pub#9
Pub#10
Pub#12
Pub#13
Pub#14
Pub#16
Pub#17
Pub#18
Pub#19
Pub#21
Pub#24
(40)
(22)
(2)
(43)
(3)
(20)
(12)
(1)
(2)
(4)
(7)
(4)
(5)
(4)
(9)
(8)
(2)
(1)
(1)
10mon
3mon
15mon
9mon
5mon
9mon
4mon
4mon
19mon
7mon
3mon
5mon
5mon
6mon
5mon
9mon
4mon
Fig. 2 Time to first citation by authors not affiliated with SNAMP
Environmental Management
123
Author's personal copy
media attention came in May 2011 when the first fisher
denning site was identified in Yosemite. Two news articles
and six blog posts reported this story. The second and
bigger wave of media attention was generated by the sock
drive in December 2011. The sock drive called for the
donation from the public of unused socks, which would be
used to hold chicken as bait to lure fisher individuals to the
tree where a monitoring camera would be activated by their
presence. Eleven news articles and nine blog posts were
written about the SNAMP ‘‘sock drive.’’
Fig. 3 Map of SNAMP publications and citation articles, located by their first authors’ affiliated organizations
Self (15)
News (38)
Blog (45)
Fig. 4 Timeline of weblog
posts (Blog), news articles
(News), and self-promotional
articles (Self) about SNAMP
Environmental Management
123
Author's personal copy

Discussion
The mixed methods approach to the information products,
channels, and networks in SNAMP generated many useful
results that better characterized the digital information flow
cycle in a CAM project. The following discussion focuses
on the four stages of the devised information flow frame-
work: production, transport, use, and monitoring.
Information Production
Timing of Information Production and Distribution
Because public participation is the key to the success of
CAM, timely information production and distribution is very
critical for involving the public. In the case of SNAMP, the
commitment to information availability and transparency
was made at the outset of the project (Bales et al. 2007),
which was implemented by making meeting notes, par-
ticipant discussions, and science findings accessible on the
SNAMP website in a timely manner. Even the research
process was transparent to the public, so that the public could
understand the scientific processes and results and provide
feedback to the scientists and managers about the science in
the project. This shows that the timeliness of developing
information policies that are supported by multiparty
stakeholders is very important. Due to freshness and time-
liness of the SNAMP content, weblogs and news outlets
found the information valuable enough to re-publish. We
found that various types of information about SNAMP, when
made available on its website, were re-published in blog
posts and news articles. This follows the information rule
that ‘‘information is costly to produce but cheap to repro-
duce’’ (Shapiro and Varian 1999). Because information
technologies have made reproducing information cheaper
and easier, information can be made available in digital
formats quickly and has a higher chance of re-distribution.
The growing number of blog posts and newspaper articles
reporting about SNAMP over the years also indicated that
the public found the project increasingly interesting and
relevant because bloggers were more inclined to re-post new
and helpful knowledge (Hsu and Lin 2008; Yu et al. 2010).
Directions and Channels of Information Distribution
The direction of information distribution can also affect in-
formation sharing and participation in a CAM project. In a
traditional adaptive management setup, the knowledge and
information produced is targeted at primary participants
such as resource managers and environmental stakeholders
(Holling 1978; Walters 1986). However, the flow of infor-
mation and communication must be ‘‘multi-directional’’ in
CAM projects in order to increase learning and to foster
understanding and trust among multiparty stakeholders.
Having multiple information channels can significantly in-
crease information sharing because it can lower the time cost
and effort for seeking information (Hardy 1982). To make
SNAMP information more accessible to the public via multiple
channels, the PPT published events information, photos, and
videos to various web services and online weblogs and news-
papers. A particularly important and effective channel of in-
formation was peer-reviewed journals, which allowed
researchers in various research institutions and government
agencies to access and utilize the scientific knowledge produced
by SNAMP for their own work. Another effective channel of
information was the USDA Digital Collections. Although
publishing to the USDA Digital Collections was only available
to U.S. Forest Service staff, it held two SNAMP publications
(Publication #1 and #2), which were cited by researchers in the
U.S. Forest Service. It effectively facilitated knowledge transfer
between academic and government researchers.
One of the major gains for the U.S. Forest Service in
creating multiple information and communication channels
was the increase in trust from the public. The effort toward
information transparency and communication with the
public demonstrated their commitment to keep the public
informed and involved throughout the management pro-
cess. This trust is critical in a contentious environmental
management context like public forest management,
especially since management decision-making power was
not shared with the public. The U.S. Forest Service also
gained from receiving feedback from a larger knowledge
network, as more people were reached through different
information and communication channels.
Information Transport
The movement and behavior of digital information flow
through various online information networks can be char-
acterized by the rate, distance, and pattern of travel.
Rate
Information transport rate refers to how fast a piece of
information is used after it is made available to the public.
We used a broad definition for the use of information in
this study: it could be a visit to a web page, a click to a post
to the Facebook page, or a citation of a publication; and
thus the information transport rate varied based on infor-
mation channels. For instance, a post to the SNAMP
Facebook page could be viewed within minutes, while it
might take between 2 months to more than 1 year for a
peer-reviewed journal publication to be cited. Information
transport rate has a double edge: while some channels are
much faster in reaching people, the value of their
Environmental Management
123
Author's personal copy

information can decay much quicker. For instance, infor-
mation became obsolete much faster on Facebook (i.e., on
the order of minutes) than on peer-reviewed journals (i.e.,
on the order of years) (Nicholas et al. 2005). Understanding
information transport time, as well as the persistence length
of information value, for different information channels
could help environmental management project managers
decide what information channels would be more appro-
priate for which kinds of information. For a multi-year
CAM project like SNAMP, the time lag in the peer-re-
viewed journal system would be acceptable to project
participants who were committed to the duration of the
project. For other environmental management projects with
shorter project timelines, different information channels for
knowledge validation and transfer should be considered.
Distance
Digital information can travel long distances in a short time
(Fig. 2), yet barriers to access can hinder information
transport distance. One type of barrier is content accessi-
bility. For instance, most citations of SNAMP articles were
found in academic institutions that had access to peer-re-
viewed research journals available online. This pattern
suggests two things: scientific journals can be too expen-
sive for individuals to subscribe to, but they are often
provided by university libraries; and scientific information
travels more easily within the academic community be-
cause the social networks among scientists can be small,
with only one or two connections away from one another
(Newman 2001). One potential solution to these barriers
might be open access publishing (Antelman 2004), which
would allow the public to access a scientific publication
without paying for journal subscription. Another barrier to
the transport of digital information is the digital divide
leading to differential access to information technologies
(Chakraborty and Bosman 2005). As indicated by the
website traffic pattern in the results section, much of the
SNAMP website traffic came from large cities or university
towns, such as Sacramento, San Francisco, Berkeley, and
Merced, which might had better Internet coverage. Another
information transport barrier might be related to the project
participants’ lack of familiarity with online information
channels, such as Facebook, Flickr, and YouTube, at the
time of the project. Thus, these web applications and ser-
vices generated very little engagement from SNAMP par-
ticipants and did not achieve the goal of information
propagation through online social network.
Pattern
The transport of information can also be a function of how
information travels through various information products
and channels. The ability to easily link information in
various channels via hyperlinks and mashup is a distin-
guishing feature of web technologies. Web mashups can
enhance user interface and experience, add value to in-
formation by aggregation, improve user interaction with
the information, and increase credibility of the information
(Murugesan 2007; Robins and Holmes 2008). SNAMP
took advantage of the mashable feature of the web tech-
nology by embedding SNAMP videos hosted on YouTube
and SNAMP photos hosted on Flickr on the SNAMP
website. The result was a better user interface and a better
way of organizing information for the SNAMP event
pages, and opened up multiple pathways to access a piece
of information.
Another travel pattern that facilitated information flow
was to take advantage of the people–people connections in
online social networks and communities provided by
Facebook, Flickr, and YouTube. For example, besides
serving as an online photo repository, Flickr enables pho-
tographers to easily share their photos with other Flickr
members (Shirky 2009). Motivations for sharing informa-
tion include increasing reputations (Wasko and Faraj
2005), enjoying one’s ability to provide valuable infor-
mation/knowledge (Lu and Hsiao 2007), and remaining in
a conversation (Boyd et al. 2010). Such motivations and
actions enable information to reach more people as well as
validate the value of the information.
Information Use
After information passes through various information
channels, information recipients may use it or interact with
it in different ways: through consumption, information
sharing, information extension, and participation.
Basic Consumption
Basic consumption of information refers to visiting a web
page, viewing/reading, clicking the ‘‘like’’ button, or
submitting a very simple comment. This type of infor-
mation use generally requires very little time and in-
vestment from users. Much of the information use in
SNAMP fell into this category because most of the in-
formation was created for the purpose of informing
SNAMP participants. For example, meeting agenda and
notes informed SNAMP participants about public meet-
ings; science briefs provided latest research findings;
photos showed pictures of wildlife as well as human in-
teractions at public meetings; and video documented
some of the SNAMP processes. This type of use usually
ends the flow of information and does not generate par-
ticipation or collaboration (Kelly et al. 2012).
Environmental Management
123
Author's personal copy

Generating New Knowledge
New knowledge can be generated from existing informa-
tion through synthesis, analysis, applications, or other
methods of information processing. The process to gener-
ate new knowledge from existing information requires
greater intellectual involvement as well as time and re-
source investment by information users. It also requires the
information to be in a synthesizable and analyzable form.
An example of generating new knowledge in SNAMP was
when SNAMP publications were cited in scientific publi-
cations—a process in which researchers obtained SNAMP
publications, acquired the scientific knowledge in them,
and synthesized the SNAMP information with other in-
formation to generate new scientific publications. This
process took place primarily in the larger scientific com-
munity, but it also happened among scientists within
SNAMP (e.g., Publication #2 produced by the Fire and
Forest Ecosystem Health team was cited by Publication
#16 produced by the Fisher team).
Participation
Participation entails responding to information that ex-
plicitly calls for an action or actions. This type of ‘‘ac-
tionable’’ information provides clear goals and instructions
for participation and collaboration. The SNAMP sock drive
was a good example of mobilized public participation. It
began with a simple poster that asked for the donation of
single socks, which would be used to hold the bait to entice
Pacific fishers to come before a monitoring camera. The
sock drive drew much attention in SNAMP’s online social
media networks, and drove much traffic to the website’s
Fisher Team pages. More significantly, it mobilized the
public to contribute to the fisher monitoring and research
effort through socks donation (Kocher et al. 2013). In re-
turn, the public benefitted from increasing knowledge
about fishers, which was not a well-known animal species,
by having more direct communication and interaction with
fisher research scientists. And there was an increase of
public interests for the animal, as the Fisher Team page,
two fisher photos, and a fisher news post on the SNAMP
website were among the most visited pages during the
period of sock drive.
Information Monitoring
The fourth phase of the information cycle is information
monitoring, which played a critical role in the CAM in-
formation flow. First, information monitoring may help
project managers identify, more quantitatively, what is of
interest or concern to the public at the aggregate level. This
is a helpful feedback mechanism for project managers
since they may not know the interests of a diverse group of
environmental stakeholders at the beginning of a project or
how their interests change over the course of a project. In
the SNAMP, project managers used sophisticated and free
digital information monitoring tools, such as Google
Analytics, to track what content has been accessed and how
many times it has been accessed. The consumption of
SNAMP information was reported in quarterly reports and
at regular public meetings to demonstrate the ongoing
public engagement. In addition, information monitoring
can provide clues for the effectiveness of public meetings
by measuring online activities after an event. For example,
a surge in the number of documents download or online
questions/comments after a public meeting might indicate
that the meeting was effective in generating participants’
engagement—whether it be interests or concerns. Lastly,
information monitoring can also ensure information sys-
tems performance (Wang et al. 2005), and alert managers
to system failures or malicious attacks. For example, a
sudden drop in website traffic might signal a system fail-
ure—hardware or software—that would require project
managers’ immediate attention. This may prove important
to projects that lack the budget for technical staff to
regularly maintain information systems.
Conclusions
By tracking and analyzing the flow of digital information in
a collaborative adaptive management project (SNAMP)
using mixed research methods, we were able to charac-
terize information use and flow across numerous online
information channels, systems, and technologies. As a re-
sult, we gained three broad insights into the value and
contributions of tracking information. First, we found that
increasing the flow of information could positively con-
tribute to collaboration in CAM. The increase of infor-
mation flow was accomplished by delivering project
information to specific audiences via different information
channels including scientific knowledge networks (peer-
reviewed journals and USDA Digital Collections), web
services and applications (the SNAMP website, Flickr,
YouTube, and Facebook), and online media networks
(blogs, newspapers, and SNAMP news). These created
many more channels for distribution, thereby increasing
information availability, accessibility, and discoverability.
Second, we learned that information flow takes par-
ticular patterns that can affect CAM, depending on which
channels are used and in what combinations. In general,
information technologies dramatically increased the speed
and the distance that information could travel. Information
traveled at different rates depending on the information
channel. For example, SNAMP peer-reviewed publications
Environmental Management
123
Author's personal copy

had, on average, a time lapse of around 7 months before
their first citations, but they persisted much longer in sci-
entific knowledge networks than a status update on the
Facebook page, thus supporting future learning and col-
laboration. Some channels, such as peer-reviewed journals,
seemed to lend credibility and provide validation to
SNAMP scientific results. Significantly, networks of in-
formation systems—not just networks of people—could
help sustain collaborative learning by enabling certain
SNAMP participants to transfer knowledge across multiple
organizations. This happened in SNAMP when academic
journal articles were published also in the USDA Digital
Collections. Critically, as information was transformed into
an actionable form (e.g., knowledge transfer between sci-
entists and resource managers; and making requests to the
public for assistance), greater collaboration, and increased
public participation in contributing to science research took
place.
Finally, we found that using mixed research methods
(citation analysis, web analytics, and content analysis) to
measure and evaluate digital information in CAM was an
effective way of monitoring and analyzing information use
and flow in real time, not just after a project has ended.
These methods provided quantitative measurements for
information use, unearthed the relationships between dif-
ferent information networks, and even identified knowl-
edge brokers important to the project. They could also
inform project managers whether information supplies had
met information demands, which could contribute to
maintaining trust and collaboration over the course of a
CAM project.
However, although information technologies have af-
forded us the opportunities to analyze the flow of infor-
mation in a CAM project, the evidence is thin on whether
and how information—delivered via web applications/
services or academic publications—was used by envi-
ronmental managers to adjust their management plans and
strategies. While this question about the influence of in-
formation on management decisions is beyond the scope
of this research, it is of paramount importance because
the feedback loop in adaptive management is finally
closed when managers adjust management decisions
based on new information. Web analytics and citation
analysis can perhaps move us toward answering this
question, but it would require future research to track and
identify whether and how information impacts manage-
ment decisions.
Recommendations Based on Lessons Learned
Here, we present a list of recommendations for facilitating
the flow of digital information in a CAM or other col-
laborative project.
• Identify information channels Information channels are
growing as hardware and software technologies ad-
vance. Information flow can increase greatly if infor-
mation can flow through multiple channels. Traditional
channels such as newspapers, electronic library
databases of peer-reviewed literature, and institutional
websites (all of which emphasize delivering informa-
tion to audiences) can be augmented with Web 2.0 web
services include micro-blogging sites (e.g., Twitter),
online social networks (e.g., Facebook and Google?),
and online media sharing sites (e.g., Flickr, YouTube,
and Vimeo), which empower audiences to participate
much more actively in deciding what information
matters. If location information is available, social
mapping services (e.g., WikiMapia) can add to the mix
of information channels. Publishing to open access
journals (Harnad and Brody 2004; Antelman 2004) can
make information more available to the academic and
scientific community as well as the public.
• Design information architecture for web tools and
channels Given the increasing role and variety of web
tools for management, designing information architec-
ture is important at the planning stage of a CAM
project. Some of the factors that affect the design
include audience of information, modes of interaction,
and speed, distance, and persistency of information
(Lazar 2001). For example, a traditional website might
not be the best information portal because a Facebook
page could provide many of the website features and
other interactive community features. However, it is
advisable to have a centralized location that holds all
the information produced in a project because it can
reduce the uncertainty in information seeking for
project participants (Chowdhury et al. 2011).
• Publish information early It is advisable to communi-
cate with the public about the project as soon as a CAM
project begins (Schindler and Cheek 1999). While there
may not be any meaningful research results to share
early on, preliminary findings, research plans, and
similar previous research works by other scientists,
when made transparent and accessible, may foster
public interest, engagement, and trust. In addition,
frequent repetition of general project information via
press releases or online media channels may serve as
good reminders to the existing participants and intro-
ductions to new participants.
• Automate publishing workflow Since publishing infor-
mation to multiple channels can be time, labor, and
resource intensive, developing a publishing workflow at
the outset of a project could increase the efficiency of
publishing. The workflow provides instructions on what
information is published to which channel at what time.
Building a system that can integrate web services
Environmental Management
123
Author's personal copy
(Hansen et al. 2003; Peltz 2003) and automate the
online publishing workflow may reduce the labor of
publishing to a few simple steps.
• Identify knowledge brokers Tracking the production,
transport, and use of information enables the identifi-
cation of critical knowledge brokers in a CAM
environment. Knowledge brokers play a crucial role
in facilitating information flow across different social
networks and knowledge networks because they can
traverse different scales and organizations (Ernstson
et al. 2010). Adding to the list of brokering strategies
proposed by Michaels (2009) is the information/knowl-
edge channeling strategy. Intentionally seeking and
instituting knowledge brokers in CAM, particularly
those with access to highly influential organizational
resources, can pay dividends for information flow,
resulting in effective knowledge transfer between
different organizations and parties.
• Create opportunities for participation Ideas that can
allow the public to partake and contribute to the
research effort can increase information flow. This
starts with a paradigm shift for the researchers to value
educating and incorporating the public. It might help to
learn from Citizen Science projects on how to involve
the general public in conducting scientific research
(Pandya 2012; Zoellick et al. 2012).
• Build social networks Information, if made valuable
and interesting, may serve to attract more visitors and
viewers, and thus increasing the size of online social
networks. This may result in greater information reach
and flow, leading to fostering further collaborations,
trust, transparency, and public support for CAM
projects. Therefore, it is worthwhile to strategically
invest resources in building more robust and dynamic
online social networks, e.g., adding contacts, inviting
friends, sharing content, and finding similar projects.
• Monitor information regularly Since information
monitoring can provide ongoing evaluation of the
information flow in a CAM project, it may be worth the
investment to train project managers to use and analyze
web analytics, discuss information use in project
meetings at a quarterly interval, and even employ paid
data analysis tools to analyze complex datasets.
Acknowledgments This paper is SNAMP Publication Number 38.
The Sierra Nevada Adaptive Management Project is funded by
USDA Forest Service Region 5, USDA Forest Service Pacific
Southwest Research Station, U.S. Fish and Wildlife Service,
California Department of Water Resources, California Department
of Fish and Game, California Department of Forestry and Fire
Protection, and the Sierra Nevada Conservancy. We also want to
thank the SNAMP Public Participation Team: Lynn Huntsinger,
Kim Rodrigues, Susie Kocher, Kim Ingram, Anne Lombardo, and
Adriana Sulak Bombard.
References
Ackoff RL (1989) From data to wisdom. J Appl Syst Anal 16:3–9
Allen CR, Fontaine JJ, Pope KL, Garmestani AS (2011) Adaptive
management for a turbulent future. J Environ Manag 92:1339–
1345. doi:10.1016/j.jenvman.2010.11.019
Antelman K (2004) Do open-access articles have a greater research
impact? Coll Res Libr 65:372–382
Armitage D, Marschke M, Plummer R (2008) Adaptive co-manage-
ment and the paradox of learning. Glob Environ Change 18:
86–98. doi:10.1016/j.gloenvcha.2007.07.002
Bales R, Barrett RH, Battles JJ et al (2007) Revision of the SNAMP
workplan: learning how to apply adaptive management in the
Sierra Nevada Forest Plan Amendment. http://snamp.cnr.berke
ley.edu/documents/91/. Accessed 8 Jan 2014
Bales R, Barrett RH, Battles JJ et al (2010) University of California
Science Team (UCST) Statement of Neutrality. http://snamp.cnr.
berkeley.edu/documents/335/. Accessed 14 Jan 2014
Bar-Ilan J (2006) An ego-centric citation analysis of the works of
Michael O. Rabin based on multiple citation indexes. Inf Process
Manag 42:1553–1566. doi:10.1016/j.ipm.2006.03.019
Bellinger G, Castro D, Mills A (2004) Data, information, knowledge,
and wisdom. http://courseweb.lis.illinois.edu/*katewill/spring
2011-502/502%20and%20other%20readings/bellinger%20on%
20ackoff%20data%20info%20know%20wisdom.pdf
Berkes F (2009) Evolution of co-management: role of knowledge
generation, bridging organizations and social learning. J Environ
Manag 90:1692–1702. doi:10.1016/j.jenvman.2008.12.001
Berkes F, Folke C, Colding J (1998) Linking social and ecological
systems: management practices and social mechanisms for
building resilience. Cambridge University Press, Cambridge
Bodin O, Norberg J (2005) Information network topologies for
enhanced local adaptive management. Environ Manag 36:772–
773. doi:10.1007/s00267-005-6036-4
Boyd D, Golder S, Lotan G (2010) Tweet, tweet, retweet: conver-
sational aspects of retweeting on twitter. 2010 43rd Hawaii
International Conference on System Sciences (HICSS), pp 1–10
Calkin DE, Ager AA, Thompson MP et al (2011) A comparative risk
assessment framework for wildland fire management: the 2010
cohesive strategy science report. U.S Department of Agriculture,
Forest Service, Rocky Mountain Research Station, Fort Collins
Carlsson L, Berkes F (2005) Co-management: concepts and method-
ological implications. J Environ Manag 75:65–76. doi:10.1016/j.
jenvman.2004.11.008
Cash DW, Adger WN, Berkes F et al (2006) Scale and cross-scale
dynamics: governance and information in a multilevel world.
Ecol Soc 11:2
Castells M (1996) The rise of the network society. Blackwell
Publishers, Malden
Chakraborty J, Bosman MM (2005) Measuring the digital divide in
the United States: race, income, and personal computer owner-
ship. Prof Geogr 57:395–410
Chowdhury S, Gibb F, Landoni M (2011) Uncertainty in information
seeking and retrieval: a study in an academic environment. Inf
Process Manag 47:157–175. doi:10.1016/j.ipm.2010.09.006
Clifton B (2012) Advanced Web Metrics with Google Analytics, 3rd
edn. Wiley Publishing, Indianapolis
Collins BM, Stephens SL, Moghaddas JJ, Battles JJ (2010) Chal-
lenges and approaches in planning fuel treatments across fire-
excluded forested landscapes. J For 108:24–31
Conklin EJ (2006) Dialogue mapping: building shared understanding
of wicked problems. Wiley, Chichester
Ernstson H, Barthel S, Andersson E, Borgstrom ST (2010) Scale-
crossing brokers and network governance of urban ecosystem
services: the case of Stockholm. Ecol Soc 15:28
Environmental Management
123
Author's personal copy

Fabricius C, Cundill G (2014) Learning in adaptive management:
insights from published practice. Ecol Soc. doi:10.5751/ES-
06263-190129
Fisher R, Prabhu R, McDougall C (2007) Adaptive collaborative
management of community forests in Asia: experiences from
Nepal, Indonesia and the Philippines. Center for International
Forestry Research, Bogor
Garfield E (1972) Citation analysis as a tool in journal evaluation.
Science 178:471–479
Gillmor D (2004) We the media : grassroots journalism by the people,
for the people. O’Reilly, Sebastopol
Hansen M, Madnick S, Siegel M (2003) Data integration using web
services. In: Bressan S, Lee M, Chaudhri A et al (eds) Efficiency
and effectiveness of XML tools and techniques and data
integration over the web. Springer, Berlin, pp 165–182
Hardy AP (1982) The selection of channels when seeking informa-
tion: cost/benefit vs least-effort. Inf Process Manag 18:289–293.
doi:10.1016/0306-4573(82)90014-0
Harnad S, Brody T (2004) Comparing the impact of open access (OA)
vs. non-OA articles in the same journals. D-Lib Magazine 10:6
Helly JJ, Kelly NM, Sutton D, Elvins TT (2001) Collaborative
management of natural resources in San Diego Bay. Coast
Manag 29:117–132. doi:10.1080/089207501750069614
Holling CS (1978) Adaptive environmental assessment and manage-
ment. John Wiley & Sons, Chichester
Hsu C-L, Lin JC-C (2008) Acceptance of blog usage: the roles of
technology acceptance, social influence and knowledge sharing
motivation. Inf Manag 45:65–74. doi:10.1016/j.im.2007.11.001
Kaushik A (2010) Web analytics 2.0: the art of online accountability
& science of customer centricity. Wiley, Indianapolis
Kearns FR, Kelly NM, Tuxen KA (2003) Everything happens
somewhere: using WebGIS as a tool for sustainable natural
resource management. Front Ecol Environ 1:541–548
Keen M, Brown VA, Dyball R (eds) (2005) Social learning: a new
approach to environmental management. In: Social learning in
environmental management: towards a sustainable future. Earth-
scan, London, pp 3–21
Kelly NM, Ferranto S, Lei S et al (2012) Expanding the table: the web
as a tool for participatory adaptive management in California
forests. J Environ Manag 109:1–11. doi:10.1016/j.jenvman.2012.
04.035
Knoot TG, Rickenbach M (2011) Best management practices and
timber harvesting: the role of social networks in shaping
landowner decisions. Scand J For Res 26:171–182. doi:10.
1080/02827581.2010.545827
Kocher S, Lombardo A, Sweitzer R (2013) Using social media to
involve the public in wildlife research—the SNAMP Fisher Sock
Collection Drive. J Ext 51:1IAW3
Lazar J (2001) User-centered web development. Jones & Bartlett
Learning, Burlington
Lei S, Kelly NM (2015) Evaluating adaptive collaborative management
in Sierra Nevada forests by exploring public meeting dialogues
using Self-Organizing Maps. Soc Natur Resour (accepted)
Long J, Skinner C, North M et al (2013) Science synthesis to promote
resilience of social-ecological systems in the Sierra Nevada and
southern Cascades. Department of Agriculture, Forest Service,
Pacific Southwest Research Station, Albany
Lu H-P, Hsiao K-L (2007) Understanding intention to continuously
share information on weblogs. Internet Res 17:345–361. doi:10.
1108/10662240710828030
MacRoberts MH, MacRoberts BR (1989) Problems of citation
analysis: a critical review. J Am Soc Inf Sci 40:342–349.
doi:10.1002/(sici)1097-4571(198909)40:5\342:aid-asi7[3.0.
co;2-u
Mclver JD, Brunson M, Bunting SC et al (2010) The sagebrush steppe
treatment evaluation project (SageSTEP): a test of state-and-
transition theory. U.S Department of Agriculture, Forest Service,
Rocky Mountain Research Station, Fort Collins
Michaels S (2009) Matching knowledge brokering strategies to
environmental policy problems and settings. Environ Sci Policy
12:994–1011. doi:10.1016/j.envsci.2009.05.002
Mol APJ (2006) Environmental governance in the information age:
the emergence of informational governance. Environ Plan C Gov
Policy 24:497–514
Mol APJ (2008) Environmental reform in the information age : the
contours of informational governance. Cambridge University
Press, Cambridge
Moore CT, Lonsdorf EV, Knutson MG et al (2011) Adaptive
management in the U.S. National Wildlife Refuge System:
science-management partnerships for conservation delivery.
J Environ Manag 92:1395–1402. doi:10.1016/j.jenvman.2010.
10.065
Murugesan S (2007) Understanding Web 2.0. IT Prof 9:34–41.
doi:10.1109/MITP.2007.78
Neuendorf KA (2002) The content analysis guidebook. Sage Publi-
cations Inc, Thousand Oaks
Newman MEJ (2001) Scientific collaboration networks. I. Network
construction and fundamental results. Phys Rev E 64:8. doi:10.
1103/PhysRevE.64.016131
Nicholas D, Huntington P, Dobrowolski T et al (2005) Revisiting
‘‘obsolescence’’ and journal article ‘‘decay’’ through usage data:
an analysis of digital journal use by year of publication. Inf
Process Manag 41:1441–1461. doi:10.1016/j.ipm.2005.03.014
Pandya RE (2012) A framework for engaging diverse communities in
citizen science in the US. Front Ecol Environ 10:314–317.
doi:10.1890/120007
Pedersen B, Kearns F, Kelly NM (2007) Methods for facilitating web-
based participatory research informatics. Ecol Inform 2:33–42.
doi:10.1016/j.ecoinf.2007.02.003
Peltz C (2003) Web services orchestration and choreography.
Computer 36:46–52. doi:10.1109/mc.2003.1236471
Pinkerton EW (1994) Local fisheries co-management: a review of
international experiences and their implications for salmon
management in British Columbia. Can J Fish Aquat Sci
51:2363–2378. doi:10.1139/f94-238
Plummer R, FitzGibbon J (2007) Connecting adaptive co-manage-
ment, social learning and social capital through theory and
practice. In: Berkes F, Armitage DR, Doubleday N (eds)
Adaptive co-management : collaboration, learning, and multi-
level governance. UBC Press, Vancouver, pp 55–78
Rittel HWJ, Webber MM (1973) Dilemmas in a general theory of
planning. Policy Sci 4:155–169. doi:10.1007/bf01405730
Robins D, Holmes J (2008) Aesthetics and credibility in web site design.
Inf Process Manag 44:386–399. doi:10.1016/j.ipm.2007.02.003
Rorissa A, Yuan X (2012) Visualizing and mapping the intellectual
structure of information retrieval. Inf Process Manag 48:120–135.
doi:10.1016/j.ipm.2011.03.004
Scarlett L (2013) Collaborative adaptive management: challenges and
opportunities. Ecol Soc. doi:10.5751/ES-05762-180326
Schindler B, Cheek KA (1999) Integrating citizens in adaptive
management: a propositional analysis. Ecol Soc 3:9
Schusler TM, Decker DJ, Pfeffer MJ (2003) Social learning for
collaborative natural resource management. Soc Nat Resour
16:309–326. doi:10.1080/08941920390178874
Shapiro C, Varian HR (1999) Information rules: a strategic guide to
the network economy. Harvard Business School Press, Boston
Shirky C (2009) Here comes everybody. Penguin Group, New York
Small H (1999) Visualizing science by citation mapping. J Am Soc
Inf Sci 50:799–813. doi:10.1002/(sici)1097-4571(1999)50:
9\799:aid-asi9[3.0.co;2-g
Timmerman JG, Ottens JJ, Ward RC (2000) The information cycle as
a framework for defining information goals for water-quality
Environmental Management
123
Author's personal copy
monitoring. Environ Manag 25:229–239. doi:10.1007/s002679
910018
U.S. Forest Service (2004) Sierra Nevada Forest Plan amendment:
final supplemental environmental impact statement. U.S. Forest
Service, Region 5, Vallejo
Walters CJ (1986) Adaptive management of renewable resources.
Collier Macmillan, New York
Walters WH (2007) Google Scholar coverage of a multidisciplinary
field. Inf Process Manag 43:1121–1132. doi:10.1016/j.ipm.2006.
08.006
Walters CJ, Holling CS (1990) Large-scale management experiments
and learning by doing. Ecology 71:2060–2068
Wang X, Abraham A, Smith KA (2005) Intelligent web traffic mining
and analysis. J Netw Comput Appl 28:147–165. doi:10.1016/j.
jnca.2004.01.006
Wasko MM, Faraj S (2005) Why should i share? Examining social
capital and knowledge contribution in electronic networks of
practice. MIS Q 29:35–57
Weber EP, Khademian AM (2008) Wicked problems, knowledge
challenges, and collaborative capacity builders in network
settings. Public Adm Rev 68:334–349. doi:10.1111/j.1540-
6210.2007.00866.x
Wondolleck JM, Yaffee SL (2000) Making collaboration work:
lessons from innovation in natural resource management. Island
Press, Washington, DC
Yu T-K, Lu L-C, Liu T-F (2010) Exploring factors that influence
knowledge sharing behavior via weblogs. Comput Hum Behav
26:32–41. doi:10.1016/j.chb.2009.08.002
Zoellick B, Nelson SJ, Schauffler M (2012) Participatory science and
education: bringing both views into focus. Front Ecol Environ
10:310–313. doi:10.1890/110277
Environmental Management
123
Author's personal copy