
THE MANUFACTURING STRUCTURE OF CANADIAN CITIES by ...
91
THE MANUFACTURING STRUCTURE OF CANADIAN CITIES by ANTHONY CECIL 0'CARROLL B,A, (Hons.) University of London, 1962 A THESIS SUBMITTED IN PARTIAL FULFILMENT OF THE REQUIREMENTS FOR THE DEGREE OF MASTER OF ARTS in the Department of Geography We accept this thesis as conforming to the required standard THE UNIVERSITY OF BRITISH COLUMBIA 1970
-
Upload
khangminh22 -
Category
Documents
-
view
0 -
download
0
Transcript of THE MANUFACTURING STRUCTURE OF CANADIAN CITIES by ...

THE MANUFACTURING STRUCTURE
OF CANADIAN CITIES
by
ANTHONY CECIL 0'CARROLL
B,A, (Hons.) University of London, 1962
A THESIS SUBMITTED IN PARTIAL FULFILMENT OF
THE REQUIREMENTS FOR THE DEGREE OF
MASTER OF ARTS
in the Department of
Geography
We accept this thesis as conforming to the
required standard
THE UNIVERSITY OF BRITISH COLUMBIA
1970

In presenting this thesis in partial fulfilment of the requirements f.
an advanced degree at the University of B r i t i s h Columbia, I agree tha
the Library shall make it freely available for reference and study.
I further agree that permission for extensive copying of this thesis
for scholarly purposes may be granted by the Head of my Department or
by his representatives. It is understood that copying or publication
of this thesis for financial gain shall not be allowed without my
written permission.
Department of ' 0 ~ ^ C O
(A
The University of B r i t i s h Columbia
Vancouver 8, Canada
Date ^ C w N ^ m O
i
Abstract
The overall purpose of this study i s to provide new insights into
the Canadian urban system through an analysis of economic a c t i v i t i e s at
the inter-urban scale. The thesis analyses the urban system i n terms
of secondary economic a c t i v i t i e s , more spe c i f i c a l l y through the manufac
turing industries of 41 Canadian c i t i e s with a population of over 30,000
i n 1961.
The investigation contains elements of traditional c l a s s i f i c a t i o n
oriented and economic base approaches to urban economic functional
analysis. However, an attempt i s made to use the idea of the urban
system to provide a more productive analysis of inter-urban economic
functions.
Correlation and bonding techniques are used to establish patterns of manufacturing s i m i l a r i t i e s , upon which to base further analysis. Eight sets of c i t i e s and five distinct types of manufacturing pro f i l e are identified for the 41 c i t i e s , and the structural-spatial regulari t i e s identified are f e l t to be consistent with a center-periphery model of the general overall manufacturing structure of the Canadian economy.
The analysis i s pursued i n terms of the investigation of the relationships between predominant manufacturing s i m i l a r i t i e s of c i t i e s and various aspects of city size and location. Forward stepwise regression was considered an appropriate s t a t i s t i c a l procedure for the purpose of examining these relationships. From this analysis s i m i l a r i t i e s between the c i t i e s are p a r t i a l l y related to factors of size, relative location and h i s t o r i c a l evolution.
i i
CHAPTER
I
TABLE OF CONTENTS
PAGE
INTRODUCTION . . . . . . . . . . . . . . . . . . . . . 1
Statement of Problem . . . . . . . . . . . . . . . 2
II ANALYSIS OF URBAN ECONOMIC FUNCTIONS . . . . . . . . . 5
C i t y Functional C l a s s i f i c a t i o n . . . . . . . . . . 6
Economic Base Studies . . . . . . . . . . . . . . 10
The Urban System . . . . . . . . . . . . . . . . . 12
Summary . . . . . . . . . . . . . . . . . . . . . 14
Canada: The Context of the Study . . . . . . . . . 16
III THE MANUFACTURING STRUCTURE OF LARGER CANADIAN
CITIES, 1961 . . . . . . . . . . . . . . . . . . .
Data Sources and Techniques . . . . . . . . . . .
Procedures . . . . . . . . . . . . . . . . . . . . 20
Results . . . . . . . . . . . . . . . . . . . . . 24
Summary . . . . . . . . . . . . . . . . . . . . . 42
IV ANALYSIS OF INTER-CITY SIMILARITIES IN MANUFACTURING
STRUCTURE . . . . . . . . . . . . . . . . . . . . 45
Hypotheses . . . . . . . . . . . . . . . . . . . . 45
Size . . . . . . . . . . . . . . o . . . . . . . . 46
Relat ive Location . . . . . . . . . . . . . . . . 48
H i s t o r i c a l Evolution . . . . . . . . . . . . . . . 50
Data: Manufacturing S i m i l a r i t i e s . . . . . . . . . 52
Operational D e f i n i t i o n of Independent Variables , 54
20
20

X X I
CHAPTER
S i z e . . . . . . . . . . . . . . . . . ° .
R e l a t i v e L o c a t i o n . . . . . . . . . . . .
H i s t o r i c a l E v o l u t i o n . . . . . . . . . . .
T e s t s o f Hypotheses . . . . . . . . . . . . .
A n a l y s i s o f r e s i d u a l s . . . . . . . . . .
Q u a l i f i c a t i o n s t o a G e o g r a p h i c a l A n a l y s i s
Summary . . . . . . . . . . . . . . . . . . .
V CONCLUSIONS . . . . . . . . . . . . . . . . . . .
BIBLIOGRAPHY . . . . . . . . . . . . . . . . . . . . . . . .
APPENDIX T a b l e . o f L o c a t i o n Q u o t i e n t s . . . . . . . . . . .
PAGE
54
54
55
56
62
65
71
72
77
82

i v
LIST OF TABLES
TABLE PAGE
I S i m i l a r i t i e s of Manufacturing Structure of Canadian
C i t i e s , 1961, i n Rank Order of Size . . . . . . . 25
II Basic Pairs and Sets . „ . . . . . . . . . . . . . . . 29
III Summary of D i v e r s i f i c a t i o n and S p e c i a l i z a t i o n of
Industry i n Larger Canadian C i t i e s . . . . . . . . 41
IV D i v e r s i f i c a t i o n and S p e c i a l i z a t i o n i n Canadian Urban
Manufacturing 1961 by C i t y Size Class . . . . . . 48
V Processing, Fabr ica t ing , D i v e r s i f i c a t i o n and S p e c i a l
i z a t i o n of the Heartland and Periphery: Canada, 1961 51
VI Model I Stepwise Regression of 108 Obs„ at 95% C L . . 60
VII Model II Stepwise Regression of 63 Obs. at 95% C L . . 61
VIII Residuals from Model I i n Quarti les . . . . . . . . . 63
IX Residuals from Model II i n Quarti les . . . . . . . . . 63
X Signif icant Residuals from Model I (Over I . S . D . ) . , . 66
XI S ignif icant Residuals from Model II (Over I . S . D . ) . . 67
XII Correlat ion Coeff ic ients of Independent Variables i n
Model I . . . . . . . . . . . . . . . . . . . . . 68
XIII Correlat ion Coeff ic ients of Independent Variables i n
Model II . . . . . . . . . . . . . . . . . . . . . 68
XIV Ratio of Possible to Actual S i m i l a r i t i e s (Signif icant
Correlations) i n the Heartland and Periphery . . . 75

LIST OF FIGURES
Location of 41 C i t i e s over 30,000, 1961 . . . . .
Bonding Between Peripheral C i t i e s at the 99%
Confidence Level „ „ . » . . . . » . . . » . .
Bonding Between Heartland C i t i e s at the 99%
Confidence Level ~ . . . . . . . . . . . .
Bonding Between Peripheral and Heartland C i t i e s at
the 99% Confidence Level „ . » . . . . . . . .
Scatter P l o t s of Manufacturing S i m i l a r i t i e s . . .

v i
LIST OF GRAPHS
GRAPH PAGE
1 Manufacturing P r o f i l e : Type A. Calgary - Regina . . . 31
2 Manufacturing P r o f i l e : Type B. Sudbury - Sydney . . . 31
3 Manufacturing P r o f i l e : Type C, Windsor - Moncton , . 31
4 Manufacturing P r o f i l e : Type D. Hamilton - Welland . . 31
5 Manufacturing P r o f i l e : Type D. Cornwall - Trois
Rivieres « . » , . . » . . . « « . » . , . . . . . 32
6 Manufacturing P r o f i l e : Type D. Sherbrooke - Brantford 32
7 Manufacturing P r o f i l e : Type E. Montreal - Quebec . . 32
8 Manufacturing Pr o f i l e : Type E. B e l l e v i l l e -
Peterborough . . . . . . . . „ . . . . . . . . . . 32

Acknowled gment s
Thanks are due to many people f o r
t h e i r help and advice during various stages
of research and w r i t i n g , i n p a r t i c u l a r to
Dr. R. Leigh, my adviser and Mr, George Cho
for drawing the maps and graphs.

CHAPTER I
INTRODUCTION
The purpose of the thesis i s to describe and explain aspects
of the Canadian Urban System, especially i n terms of the manufacturing
ac t i v i t i e s of i t s metropolitan areas and larger c i t i e s . It i s also
hoped to develop a valid and reliable method of comparing c i t i e s i n
terms of these a c t i v i t i e s , which can then be u t i l i z e d In further i n
vestigations covering a wider range of economic a c t i v i t i e s . The
contribution of this thesis i t i s hoped w i l l be thus both substantive
and methodological. In one sense i t i s a p i l o t study for an Investi
gation of Canadian Urban economic geography.
The significance of any such investigation, and indeed of this thesis, i s the u t i l i z a t i o n of primary and/or secondary economic a c t i v i t i e s i n the analysis of the relationship between urban structure and urban location. U n t i l recently most studies of urban location have approached analysis by focusing on tertiary economic a c t i v i t i e s . The large amount of "Central Place" studies has been the result. While Central Place Theory remains the most sophisticated theory of urban location, i t provides only one view of the problem. By adding primary and secondary industrial sectors to the analysis, a multi-layered view-point w i l l be developed.
Berry has recently pointed out that urban location theories should develop from the three stages of economic act i v i t y that support

^ How-c i t i e s , v i z . , e x t r a c t i v e , processing and d i s t r i b u t i v e a c t i v i t i e s .
ever, i n d u s t r i a l l o c a t i o n theory has not. e x p l i c i t l y developed towards
explaining the r e l a t i o n s h i p between r e a l world regional patterns of
manufacturing a c t i v i t y and urban l o c a t i o n s . So f a r , the theory has been
generally concerned with the analysis of the e f f e c t s of l o c a t i o n a l
factors f o r s p e c i f i c i n d u s t r i e s . However, Ray f e e l s that " l o c a t i o n 2
theories should r e l a t e urban functions to l o c a t i o n , " thus i n d u s t r i a l
l o c a t i o n theory should be extended to the analysis of urban i n d u s t r i a l
structure and c i t y l o c a t i o n , and t h i s i s the primary purpose of t h i s
t h e s i s . Statement of Problem
I t i s recognized that economic a c t i v i t i e s are only one sector
of the various elements which characterize a c i t y . They are, however,
a prominent element. Lampard suggests a symbiotic r e l a t i o n s h i p between
s o c i a l and economic forces when he writes "The modern c i t y i s a mode of 3
s o c i a l organization which furthers e f f i c i e n c y i n economic a c t i v i t y . "
Higbee expresses s i m i l a r ideas when he states "The average American c i t y
J . L . B e r r y , T h e o r i e s of U r b a n L o c a t i o n , Commiss ion on C o l l e g e Geography R e f e r e n c e Paper #1, ( W a s h i n g t o n , 1 9 6 8 ) .
2 D. M . R a y , " U r b a n Growth and t h e Concept o f t h e F u n c t i o n a l
R e g i o n , " i n Urban S t u d i e s : A C a n a d i a n P e r s p e c t i v e , e d s , N . L i t h w i c k and G. P a c q u e t , ( T o r o n t o , 1 9 6 8 ) , p . 4 6 .
3 E . Lampard, " H i s t o r y o f C i t i e s i n t h e E c o n o m i c a l l y Advanced
A r e a s , " i n R e g i o n a l Development and P l a n n i n g , e d s , J . F r i e d m a n n and W. A l o n s o , ( M a s s a c h u s e t t s , 1 9 6 4 ) , p . 3 3 2 .

3
of our time i s a working c i t y = Economically the main job i s j o b s . " ^
If economic a c t i v i t y i s one of the c i t y ' s main reasons for existence,
i t s use i n the analysis of urban locat ion i s j u s t i f i e d , A l l Canadian
c i t i e s have a range of economic a c t i v i t i e s and this study w i l l direc t
invest igat ion v i a the analysis of manufacturing a c t i v i t i e s at the i n t e r
urban scale .
The choice of manufacturing rather than the whole range of
economic a c t i v i t y i s determined by the scope of this t h e s i s . It i s
f e l t that i n l i m i t i n g the study to a specia l ized aspect of economic
a c t i v i t y , greater substantive and methodological returns w i l l be made.
Manufacturing industry i s perhaps a sounder choice than other groups
of industry as i t i s more obviously connected with c i t i e s , rather than
r u r a l areas and small centers of population, which are not c l a s s i f i e d
as c i t i e s . In connection with this F i e l d and Kerr have writ ten "Manu
facturing i s e s s e n t i a l l y an urban phenomenon which i s d is t r ibuted
through the urban hierarchy."" '
The "economic a c t i v i t y " approach to urban analysis has long been
established by functional c i t y c l a s s i f i c a t i o n s and by economic base
studies. More recently mult ivariate analysis at the nat ional and
metropolitan levels has Isolated economic a c t i v i t i e s as d i s t i n c t com
ponents of the c u l t u r a l landscape. It Is f e l t , however, that an urban
E. HIgbee, The Squeeze, (New York, 1960), p. 29. 5
N. C. F i e l d and D. P. Kerr, Geographical Aspects of Industr ia l Growth i n the Metropolitan Toronto Region, unpublished manuscript, (Toronto, 1968), p. 1.
4
"systems" approach to such an analysis may be more productive than
e x i s t i n g approaches i n the analysis of urban economic functions.
The next chapter discusses some t r a d i t i o n a l approaches to the
study of the r e l a t i o n s h i p between the l o c a t i o n of manufacturing
a c t i v i t i e s and the l o c a t i o n and functions of c i t i e s . I t also discusses
the p a r t i c u l a r case of Canada, as a prologue to the d e s c r i p t i o n and
analysis of aspects of Canadian urban manufacturing. In a d d i t i o n , the
notion of an "urban systems" approach to the analysis of urban economic
functions i s discussed. I t Is f e l t that t h i s thesis i s not i d e n t i c a l
with the t r a d i t i o n a l approaches summarized, although I t i s a l l i e d to
them, but i s concerned more with the s p e c i a l i z e d economic functions
of the larger c i t i e s i n the Canadian urban system.

CHAPTER II
ANALYSIS OF URBAN ECONOMIC FUNCTIONS
Approaches to the analysis of urban economic functions have
hitherto been mainly from two d i r e c t i o n s . The f i r s t can be termed
" c l a s s i f i c a t i o n - o r i e n t e d , " where the purpose of the work seems to be
i n the production of a c l a s s i f i c a t i o n of settlements based on economic
functions . The underlying concept i s that c i t i e s have d i s t i n c t and
charac ter is t i c economic functions, and consequently most of the work
has been directed towards the i d e n t i f i c a t i o n and measurement of these
functions . L i t t l e attempt has been made to re la te the functions to
other variables i n order to determine s p a t i a l r e g u l a r i t i e s and r e l a t i o n
ships . ̂
The second approach, the analysis of the urban "economic base , "
provides a framework to describe the economic funct ional structure of
c i t i e s and their re la t ionships with other c i t i e s and with other l o c a -
t i o n a l v a r i a b l e s . Urban economic base studies attempt to define the
c i t y as an economic region i n terms of i t s inputs and outputs, which
implies relat ionships external to the c i t y . Exis t ing work has been
directed towards both precise measurement of the economic functions of
the c i t y (or region) and to the determination of the re la t ionship of
Although some authors write as though the purpose of c i t y c l a s s i f i c a t i o n s i s to allow such later analysis to be made.
6 2
the c i t y (or region) to other c i t i e s (regions) within the nat ion,
Both these approaches are related to a cer ta in degree. Some con
cepts and methods, such as the basie-nonbasic concept and the base
r a t i o , are used extensively i n both approaches. The chief difference
appears to be the emphasis placed upon the economic and l o c a t i o n a l
relat ionships of c i t y (or region) with the rest of the nat ion ; t h i s
tends to be greater i n economic base s tudies . A t h i r d approach draws
elements from both these t r a d i t i o n a l approaches and i s termed an
"urban systems" approach. These approaches are evaluated more thorough
l y i n the following sections,
C i t y Functional C l a s s i f i c a t i o n
Ci ty funct ional c l a s s i f i c a t i o n s have been based almost exclusively
on the examination of urban economic a c t i v i t i e s . Comprehensive summaries 3
have been made of these c l a s s i f i c a t i o n s by many wri te rs , notably Smith,
4 5 Maxwell and Garner. Generally i t Is concluded that no one c l a s s i f i c a
t ion method i s the best and that several methods can be employed to
^Reviews of Economic Base Studies are given by: R. Murphy, American C i t i e s , (New York, 1966); C. Tiebout, The Community Economic Base Study, Supplementary Paper 16, (New York, 1962).
3 R. H. T . Smith, "Methods and Purposes i n Functional Town
C l a s s i f i c a t i o n s , " Annals of A . A . G . , (1965), pp. 539-548. 4
J . Maxwell, "A Functional C l a s s i f i c a t i o n of Canadian C i t i e s , " (unpublished Master's Thesis , The Universi ty of B r i t i s h Columbia, 1964).
"*B. Garner, "Models of Urban Geography and Settlement L o c a t i o n , " i n Models i n Geography, eds, R. Chorley and P. Haggett, (London, 1967), Chapter 9.

achieve an "optimum" c l a s s i f i c a t i o n . However, Smith and others further
attack these c l a s s i f i c a t i o n s on the grounds that c l a s s i f i c a t i o n per se
does not play a v a l i d ro le i n s c i e n t i f i c i n v e s t i g a t i o n . This i s a
c r u c i a l point , as a l l c l a s s i f i c a t i o n s tend to conceal s i g n i f i c a n t
r e l a t i o n s h i p s . It i s , therefore, v i t a l to develop a c l a s s i f i c a t i o n
that w i l l reveal most c l e a r l y the p a r t i c u l a r re la t ionships which are
to be invest igated. Any evaluation of c i t y c l a s s i f i c a t i o n s must keep
th is i n mind.
Functional c l a s s i f i c a t i o n schemes have often approached the
problem of group assignment by providing a pre-determined base measure
to act as the discr iminat ing c r i t e r i o n . This base measure has been pro
duced by q u a l i t a t i v e and quantitat ive techniques, although generally
6 7
the l a t t e r have been most prominent. Aurousseau and Harr is derived
their bench-mark from a q u a l i t a t i v e assessment of d i s t i n c t i v e c i t y types.
C i t i e s were then assigned Into single funct ional groups. These simple
c l a s s i f i c a t i o n s are inevi tably imprecise, as most c i t i e s display m u l t i
funct ional c h a r a c t e r i s t i c s . More important, the basis of the "bench
mark" i s not v a l i d l y established by such q u a l i t a t i v e assessment of
d i s t i n c t i v e types of economic functions.
M u l t i - f u n c t i o n a l and quantitative c l a s s i f i c a t i o n s have countered
some of the above objections. These c l a s s i f i c a t i o n s , by using employment
M. Aurousseau, "The D i s t r i b u t i o n of Populations: A Constructive Problem," Geographical Review, II (1921), pp. 563-592.
7 C . H a r r i s , "A Functional C l a s s i f i c a t i o n of C i t i e s i n the United States , " Geographical Review, 33 (1943), pp. 86-99.
8
i n selected i n d u s t r i e s , assign c i t i e s to groups by means of a quanti tat ive
'd iscr iminat ing c r i t e r i o n ' . An example i s Nelson's c l a s s i f i c a t i o n of
American c i t i e s . Ten categories of c i t y economic a c t i v i t y were estab
l i s h e d , and c i t i e s assigned to one or more category i f the i r employment
totals were higher than one standard deviat ion from the category mean.
It i s in teres t ing to compare the c l a s s i f i c a t i o n of Harris and Nelson,
as Murphy has done. It Is seen that many c i t i e s are given d i f f e r e n t
ra t ings ; for instance, Pi t tsburg i s a manufacturing c i t y i n H a r r i s '
scheme and a d i v e r s i f i e d one i n Nelson 's . A major c r i t i c i s m of Nelson's
(multiple) method i s that the use of the standard deviat ion hides a
s i g n i f i c a n t groupings of functions. Thus, while i t may be more v a l i d
and r e l i a b l e than the s ingle function c l a s s i f i c a t i o n , i t may also con
ceal as much as i t reveals .
Maxwell developed a more sophisticated c l a s s i f i c a t i o n scheme
for Canadian c i t i e s . " ^ He established thir teen categories of c i t y
economic function and produced three discr iminat ing c r i t e r i a , v i z . ,
two types of funct ional importance ('dominant' and ' d i s t i n c t i v e ' func
tions) and a ' s p e c i a l i z a t i o n index ' . These c r i t e r i a were derived from
minimum requirements measures, where ' b a s i c ' employment i s separated
from 'nonbasic' by the use of ' threshold values ' as c l a s s i f i c a t o r y
minima, to give groups of town characterized by maximum within-group and
H. Nelson, "A Service C l a s s i f i c a t i o n of American C i t i e s , " Economic Geography, 31, (1955), pp. 189-210.
9
R. Murphy, op_. c i t .
" ^ J . Maxwell, op_. c i t .

minimum between-group homogeneity i n terms of basic-nonbasic a c t i v i t i e s .
However, the basic-nonbasic concept (and r a t i o ) has been under consider
able attack from many w r i t e r s for some time and thus the weaknesses of 11
the concept must be kept i n mind when i n t e r p r e t i n g the r e s u l t s .
Maxwell's scheme can be further c r i t i c i z e d f or i t s acceptance of
Ullman and Dacey's minimum requirements equations, which were derived 12
from United States census f i g u r e s ; also group assignment i s made on
the basis of a r b i t r a r i l y determined cut-off points, which, as previously
mentioned, may conceal s i g n i f i c a n t f u n c t i o n a l r e l a t i o n s h i p s . I t can be
concluded that whatever i t s merits, the use of t h i s method adds an
element of uncertainty to analysis of urban economic functions.
Recently optimal groupings of c i t i e s into classes has been
achieved by m u l t i v a r i a t e s t a t i s t i c a l a n a l y s i s . The value of t h i s
approach Is In the reduction and manipulation of masses of data and i n
the precise measurements which can be given to s i g n i f i c a n t r e l a t i o n
ships. Factor analysis Is one of the more useful d e s c r i p t i v e techniques
employed by t h i s approach. I t helps to uncover r e l a t i o n s h i p s which
might not be obvious by q u a l i t a t i v e assessment, by i d e n t i f y i n g the basic 13
dimensions of the system under ana l y s i s . However, there has been a 11
The basic-nonbasic concept w i l l be discussed i n the next section, 12
E. Ullman and M, Dacey, "The Minimum Requirements Approach to the Urban Economic Base," Papers and Proceedings of the Regional Science Association, V ol. 6 (1960), pp. 175-194,
13 Two of the e a r l i e s t of such studies i n the urban context were
C. Moser and W, Scott, B r i t i s h Towns, (London, 1961); Q. Ahmad, Indian C i t i e s , (Chicago, 1965),
tendency to produce those studies without any theore t i ca l background to
the research f i e l d being investigated. King points this out and stresses
the need for further inves t igat ion between exis t ing theory and the
empirical f indings of a n a l y s i s . 1 4
In h is study, King analyses 106 Canadian c i t i e s which i n 1951
had populations i n excess of 10,000. Data i s u t i l i z e d for 52 economic,
demographic, s o c i a l and l o c a t i o n a l charac ter is t i cs for 1951 and 1961,
These two sets of data are reduced by factor analysis and c l a s s i f i e d by
a grouping algorithm. It can be argued that the use of such diverse
variables does not f a c i l i t a t e formulation of hypotheses concerning
urban structure and urban l o c a t i o n . However, the groupings derived
from factor analysis do provide empirical evidence upon which to develop
hypotheses, and suggests that the use of more precise var iables ( e . g . ,
economic a c t i v i t i e s ) may f a c i l i t a t e the development of hypothesis con
cerning urban s t r u c t u r a l - l o c a t i o n a l r e l a t i o n s h i p s .
Economic Base Studies
A second approach to urban economic analysis can be loosely
termed the economic-base approach. This usually surveys the economic
base of i n d i v i d u a l c i t y or groups of c i t i e s by q u a l i t a t i v e and quanti
tat ive methods, which are largely based on the basic-nonbasic concept.
Murphy^""* has outlined four methods which, e s s e n t i a l l y , measure the
L . J . King, "Cross Sectional Analysis of Canadian Urban Dimensions: 1 9 5 1 - 1 9 6 1 , " Canadian Geography, 1 0 , ( 1 9 6 6 ) , pp. 2 0 5 - 2 2 4 .
15 R. Murphy, op_. c i t .

11
economic base of a c i t y or region:
1. The "approximation method", which compares the employment
pattern of the area under study with that of the nation and
assumes that the population of a p a r t i c u l a r urban area
consumes Its proportional share of the nat ional to ta ls of
goods and services and that production beyond this amount
i s b a s i co The method i s quantif ied by using loca t ion
quotients.
2. The "economic survey and base study" makes a deta i led input -
output analysis of an area, i n order to discover firms
making sales to other areas.
3. The " s i g n i f i c a n t enterprises method" t r i e s to evaluate by
means of a qual i ta t ive assessment which are the most
s i g n i f i c a n t (export) enterprises . Study of these then gives
an i n d i c a t i o n of what i s happening to the communities'
economic base as a whole.
4. The "minimum-requirements" method which makes a s t a t i s t i c a l
estimate of l o c a l employment, counting the surplus as bas ic .
The dependence on the basic-nonbasic concept i s a major weakness of
those c l a s s i f i c a t i o n schemes which use the basic-nonbasic r a t i o or the
minimum-requirements method to Identify the " r e a l " economy of the c i t y ,
16
since the concept I t s e l f has several weaknesses. Bluemenfeld, one of
16
H, Bluemenf e l d , "The Economic Bas-e of the M e t r o p o l i s , " Journal of American Insti tute of Planners, V o l , 21, (1955), pp. 114-132.

12
i t s f i r s t c r i t i c s , pointed out that nonbasic i n d u s t r i e s were eventually
more important than basic ones as c i t i e s could develop new "export"
i n d u s t r i e s , given an adequate nonbasic service structure, Roterus and 17
Calef demonstrated that s i z e of c i t y a f f e c t s the base r a t i o and
suggested, i n f a c t , that the only v a l i d measurement unit was the nation.
Further c r i t i c i s m has pointed out that as c i t i e s are f u n c t i o n a l l y i n t e r
r e l a t e d i n a highly complex manner a d e f i n i t i v e r a t i o i s impossible; that
employment cannot be divided into basic and nonbasic as e a s i l y as the
concept impli e s ; that time can allow change of nonbasic a c t i v i t i e s i n t o
basic ones. More p r a c t i c a l c r i t i c i s m s are of the e f f e c t s of v a r i a t i o n s
i n base areas and of techniques of analysis on base estimation which, at
l e a s t , make r a t i o comparisons open to some doubt. Garner points out i n
h i s review of the economic base approach that i f the concept i s to be
accepted and applied c o n s i s t e n t l y , development of s a t i s f a c t o r y methods 18
of procedure i s c r u c i a l .
The Urban System
A t h i r d approach to the analysis of urban economic functions i s
concerned with the interdependence of economic functions of a n a t i o n a l
set of c i t i e s . Leigh i n a study of aspects of movement i n the urban
system f e e l s that the urban places of a n a t i o n a l taken together show
" . , . a c o l l e c t i v e structure and behavior and can be described as a
V. Roterus and W. Calef, "Notes on the Basic-Nonbasic Employment Ratio," Economic Geography, 31, (1955), pp. 17-20.
18 B. Garner, op_. c i t . , p. 332.

13
19 'system'," This "systems" approach includes elements of f u n c t i o n a l
c l a s s i f i c a t i o n s , ( v i z , , i s o l a t i o n of a c i t y ' s economic function w i t h i n
the nation),
Descriptions of the t y p i c a l s t r u c t u r a l and behavioral character
i s t i c s of the urban system i n a large modern I n d u s t r i a l i z e d nation have 20
been given by Berry, These descriptions are, i n part, derived from
i n d u s t r i a l l o c a t i o n theory but are, perhaps, over-generalized. There
i s a need here, f o r research on s p e c i f i c economic functions w i t h i n the
urban system, to provide more evidence for the presently a v a i l a b l e
rather i m p r e s s i o n i s t i c notions, and to elaborate further on the s t r u c
t u r a l and behavioral c h a r a c t e r i s t i c s of the urban system.
Associated with t h i s "systems" approach i s "commodity flow"
a n a l y s i s , which o f f e r s a possible method of i n v e s t i g a t i o n . By measuring
the s p a t i a l flows of goods, money and services i n an economy i t i s
possible to group the complexities of economic st r u c t u r e . Berry has
analysed the s p a t i a l structure of the Indian economy by t r e a t i n g commod
i t y flows as observations, and devising r e l a t i v e measures of t h e i r 21
c h a r a c t e r i s t i c s , o r i g i n s and destinations. Although h i s study i s con
cerned with regional economic structure, the concept and techniques are
R. Leigh, "Aspects of Movement i n Urban Systems," (unpublished manuscript, The U n i v e r s i t y of B r i t i s h Columbia, 1969).
20 B. J. L. Berry, Theories of Urban Location, Commission on
College Geography, Reference Paper #1, (Washington, 1968). 21
Bo J, L, Berry, Essays on Commodity Flows and the S p a t i a l Structure of the Indian Economy, (Chicago, 1966).

14
e q u a l l y a p p l i c a b l e to the economic s t r u c t u r e of c i t i e s i f the data p r o b l e m c o u l d be s o l v e d . Stone t h i n k s that
, , , t h e most s e n s i t i v e i n d i c a t o r s of the p e r f o r m a n c e of m e t r o p o l i t a n f u n c t i o n s among a s e t o f u r b a n a g g l o m e r a t i o n s w o u l d be p r o v i d e d by the d a t a on f l o w s of c o m m o d i t i e s and s e r v i c e s among the c e n t e r s ;22
Of c o u r s e , t h e h a n d i c a p h e r e i s the g r e a t l a c k of t y p e - s p e c i f i c and
l o c a t i o n - s p e c i f i c f l o w d a t a f o r a l m o s t a l l n a t i o n s .
Summary
A n a l y s i s o f c i t i e s i n terms of t h e i r economic f u n c t i o n s i s a
u s e f u l a p p r o a c h i n I n v e s t i g a t i n g t h e l o c a t i o n a l a s p e c t s o f c i t i e s .
The e x i s t i n g approaches to such an a n a l y s i s , as r e v i e w e d i n t h i s
c h a p t e r , p r e s e n t c o n c e p t u a l and p r a c t i c a l problems w h i c h i n f l u e n c e
f u t u r e c h o i c e s o f a p p r o a c h t o t h e p r o b l e m . C l a s s i f i c a t i o n o f economic
f u n c t i o n s f o r i t s own sake may n o t f a c i l i t a t e i n v e s t i g a t i o n o f l o c a t i o n a l
a s p e c t s o f t h e c i t i e s t h u s c l a s s i f i e d . Any g r o u p i n g o f f u n c t i o n s o r
c i t i e s must be made up w i t h t h e s p e c i f i c r e s e a r c h p r o b l e m i n v i e w and
t h i s o m i t s t h e use o f c l a s s i f i c a t i o n s d e v e l o p e d f r o m o t h e r a n a l y s e s .
I n e v i t a b l y , g r o u p i n g means l o s s o f I n f o r m a t i o n , b u t i t can a l s o r e s u l t
I n c l a r i t y and s i m p l i c i t y o f a n a l y s i s and e x p l a n a t i o n . M u l t i v a r i a t e
t e c h n i q u e s , i f s u i t a b l e t o t h e p r o b l e m and c o r r e c t l y a p p l i e d , o f f e r
g r e a t e r r e t u r n s t o i n v e s t i g a t i o n .
L. 0 , S t o n e , Urban Development i n Canada, ( O t t a w a , 1 9 6 7 ) , p . 187.

15
Economic base studies, at t h e i r best, may be suggestive of
r e l a t i o n s h i p s between c i t y and c i t y but these are often d i f f i c u l t to
i n t e r p r e t due to the underlying d i f f i c u l t i e s of the basic-nonbasic
concept. Commcdity-flow a n a l y s i s , while o f f e r i n g the greatest p o t e n t i a l
returns has several drawbacks at the present time. F i r s t , while such
analysis does measure the s i g n i f i c a n c e of industry as a whole, i t con
ceals the s i g n i f i c a n c e of the component parts of economic a c t i v i t y .
Generally commodity-flow analysis w i l l best explain economic processes
between c i t i e s , rather than i n t e r n a l v a r i a t i o n i n t h e i r economic
structure. Inter-industry linkage a n a l y s i s , however, may reduce t h i s
l i m i t a t i o n . The second point Is concerned with the p r a c t i c a l problem
of data c o l l e c t i o n . Generally data are i n s u f f i c i e n t and often not
suited to the nature of the problem. For these reasons economic base
and commodity-flow analysis are not considered applicable to the problem
of urban structure and urban l o c a t i o n , as I t Is considered here. Analy
s i s of the urban economic functions of a nation may perhaps be most
productively conducted through a "systems" approach. This allows an
i n v e s t i g a t i o n of s p e c i f i c f u n c t i o n a l aspects of c i t i e s w i t h i n the
national set of urban places, while preserving a sense of t h e i r i n t e r
dependence w i t h i n the nation.
Before the precise problem of t h i s thesis i s o u t l i n e d , a review
of research on Canadian urban functions w i l l be made, from both method
o l o g i c a l and substantive points of view. The l a t t e r viewpoint w i l l
i s o l a t e manufacturing from the range of economic, s o c i a l and demographic
functions which are found In the published studies, since manufacturing
i s the focus of t h i s study.

Canada: The Context of the Study-
Canada provides a good opportunity to r e l a t e urban manufacturing
functions to urban l o c a t i o n , due to the absence of a highly s p a t i a l l y
integrated megalopolis such as found In the United States of America
and Western Europe-, However, there are s u r p r i s i n g l y few studies of
manufacturing functions at the inter-urban scale- Most studies have 23
concentrated on the analysis of a sin g l e c i t y or small region. Varied 24
aspects of the Canadian urban system have been described by Maxwell 25
and King. The techniques that were employed have already been re
viewed and evaluated. They f a l l under the heading " c l a s s i f i c a t i o n -
oriented" as they are mainly concerned with the development of group
ings of c i t i e s . In t h i s section t h e i r substantive conclusions w i l l be 26
reviewed. In addition to these i n v e s t i g a t i o n s , Ray has recently
produced a study of regional development and c u l t u r a l d i fference i n
Canada for 1961 which has some relevance for t h i s study of manufactur
ing a c t i v i t i e s i n Canadian c i t i e s .
Maxwell i d e n t i f i e d a "heartland-periphery" pattern i n h i s
a n a l y s i s . This pattern showed two d i s t i n c t features: s p e c i a l i z a t i o n 23 See Canadian Council on Urban & Regional Research, Urban &_
Regional References, 1945-62; Supplemental 1963-64, 1965-67, (Ottawa). ^J. Maxwell, op, c i t , 25
L. J , King, op_, c i t , 26 D. M, Ray, "The S p a t i a l Structure of Regional Development and
Cu l t u r a l Differences: A F a c t o r i a l Ecology of Canada 1961," (Paper presented to Regional Science Association, November, 1968).
17
of c i t y f u n c t i o n g e n e r a l l y i n c r e a s e s w i t h t h e i n c r e a s e d i m p o r t a n c e o f
m a n u f a c t u r i n g i n c i t y s t r u c t u r e , and h e a r t l a n d c i t i e s ( i . e . , c i t i e s o f
South O n t a r i o and South Quebec) a r e g e n e r a l l y more s p e c i a l i z e d t h a n t h e
p e r i p h e r a l c i t i e s . L i t t l e a t t e m p t I s made by M a x w e l l t o e x p l a i n t h e
p a t t e r n I n terms o f i n d u s t r i a l l o c a t i o n and c e n t r a l - p l a c e t h e o r y , a l
though some r e l a t i o n s h i p s a r e h i n t e d a t . F o r e x a m p l e , F o r t W i l l i a m -
P o r t A r t h u r a r e " p e r i p h e r y " c i t i e s w h i c h show s i g n i f i c a n t m a n u f a c t u r i n g
f u n c t i o n s , due t o b o t h l o c a l advantages ( i . e . , b r e a k - o f - b u l k f u n c t i o n )
and p o s i t i o n as a r e g i o n a l c a p i t a l . However, t h e s e c i t i e s a r e grouped
by M a x w e l l w i t h C h i c o u t i m i , w h i c h does not e x h i b i t t h o s e same l o c a t i o n a l
f a c t o r s , and no a t t e m p t i s made t o e x p l a i n t h i s seeming anomaly . I n
f a c t , o n l y a g e n e r a l d e s c r i p t i v e e x p l a n a t i o n I s advanced t o e x p l a i n t h e
t e n d e n c i e s f o r r e g i o n a l groups o f c i t i e s t o be s i m i l a r i n f u n c t i o n a l
s t r u c t u r e . M a x w e l l h i m s e l f s t a t e s " . . . t h e c i t y g r o u p i n g s d e v e l o p e d
do not a l l o w an e x h a u s t i v e a n a l y s i s o f c i t y f u n c t i o n a l s t r u c t u r e t o be
made.
E i g h t o f K i n g ' s 54 v a r i a b l e s i n t h e 1951 s t u d y were m a n u f a c t u r i n g
employment c a t e g o r i e s ; t h u s a s t r u c t u r e based on m a n u f a c t u r i n g i s l a r g e l y
o v e r l a i d by o t h e r u r b a n d i m e n s i o n s i n h i s a n a l y s i s . One s i g n i f i c a n t
f i n d i n g , however , was a group of " f r o n t i e r i n d u s t r i a l c i t i e s " , w h i c h i t
i s s u g g e s t e d r e f l e c t e d t h e " . . . r e l a t i v e i m m a t u r i t y o f t h e u r b a n
s y s t e m and ( o f ) t h e f a c t t h a t as a network t h e s y s t e m i s n o t a h i g h l y
J . Maxwell, "The Functional Structure of Canadian C i t i e s , A C l a s s i f i c a t i o n of C i t i e s , " Geographical B u l l e t i n , 17 , ( 1 9 6 5 ) , p. 9 5 .
18
developed one," 2^ In terms of manufacturing there were few other d i s t i n c t
groups i n King's analys is , although the more general patterns found do,
i n part , r e f l e c t latent manufacturing funct ions . In this sense the
groups of Southern Ontario, Quebec, the P r a i r i e Provinces and the
Maritimes, bear further analys is , i n terms of the i r manufacturing
functions .
Ray based his groupings on data col lec ted f o r the 229 census
d i v i s i o n s i n Canada i n 1961. The invest igat ion i s , therefore, not
s t r i c t l y speaking, at the inter-urban scale . However, the f indings are
relevant and regional economic development does p a r t i a l l y r e f l e c t the
manufacturing structure of the nat ion 's c i t i e s . Ray's interest i n
manufacturing was slanted towards the effect of non-Canadian ownership
of industry on regional and economic development. In this respect h is
f indings suggested a " m u l t i p l e - n u c l e i i " pattern of i n d u s t r i a l l o c a t i o n s ,
although this i t s e l f r e f l e c t s , " . . . a c c e s s i b i l i t y to market, proximity
to U. S. Corporation head o f f i c e s and access to raw materials and
n29 energy.
Ray l a t e r points out that the m u l t i p l e - n u c l e i i pattern used i n
his analysis i s inappropriate for manufacturing industry , which he goes
on to describe i n center-peripheral terms la ter i n the paper.
A l l these writers conclude that more questions have been raised
than answered and suggest that analysis of s p e c i f i c groups of i n d u s t r i a l
'L. J . King, op_, c i t , , p. 221.
D. M. Ray, op_. c i t . , p. 2.

19
a c t i v i t i e s should provide clearer explanations of some of t h e i r pro
vocative f i n d i n g s . Concentration of analysis on one such group of
a c t i v i t i e s , manufacturing industry, i s the express purpose of t h i s
i n v e s t i g a t i o n .
The fo l l o w i n g two chapters i n v e s t i g a t e aspects of Canadian urban
manufacturing structure. Chapter I I I e x p l i c i t l y compares larger
Canadian c i t i e s i n terms of manufacturing functions only, using 1961
data, something not previously done i n the l i t e r a t u r e ; s i m i l a r i t i e s and
differences between c i t i e s are r e l a t e d to the locations of c i t i e s and
evaluated i n terms of the center-periphery model, and other hypotheses
of Canadian urbanism. This i n v e s t i g a t i o n , while more re f i n e d than
previous studies of Canadian manufacturing at the inter-urban l e v e l ,
i s , nevertheless, l i m i t e d i n scope by i t s use of the coarsest data.
This comprises the 20 Standard I n d u s t r i a l C l a s s i f i c a t i o n (S.I.C.) manu
factur i n g categories for 41 c i t i e s which had a population of over 30,000
i n 1961. Chapter IV suggests a v a r i a b l e index of i n t e r - c i t y manufactur
ing s i m i l a r i t y , and t r i e s to develop a model that explains i n t e r - c i t y
s i m i l a r i t y i n manufacturing structure i n r e l a t i o n to c i t y r e l a t i v e
l o c a t i o n , c i t y s i z e and c i t y h i s t o r y . The notion that we are dealing
with c i t i e s that are s p e c i a l i z e d components i n a larger urban system
i s i m p l i c i t throughout the following chapters.

CHAPTER I I I
THE MANUFACTURING STRUCTURE OF LARGER CANADIAN C I T I E S , 1961
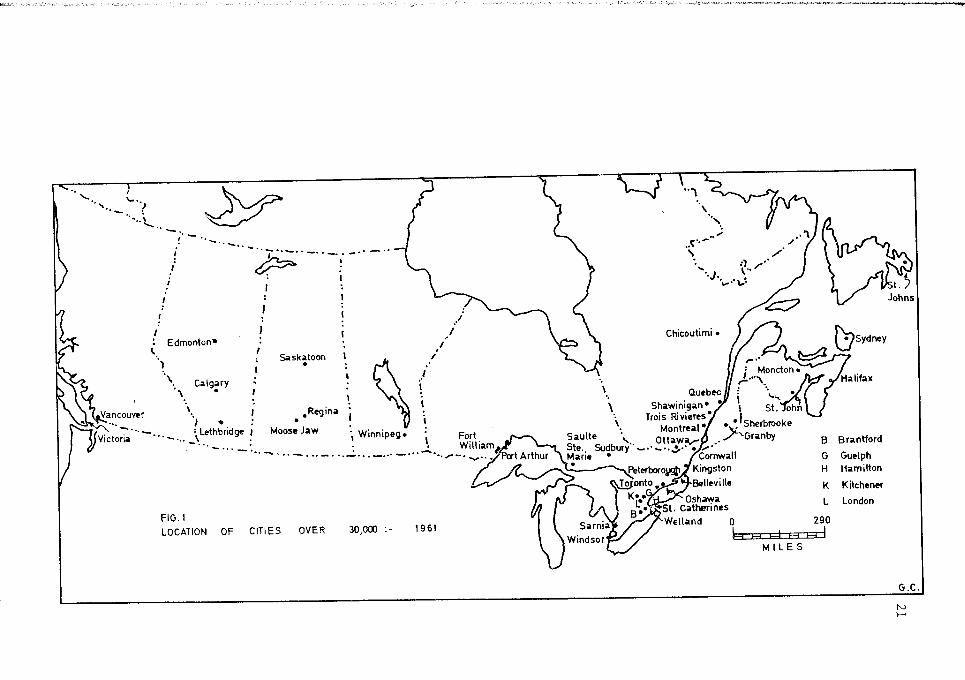
D a t a S o u r c e s and T e c h n i q u e s
The c i t i e s s t u d i e d h e r e a r e t h e 18 Census M e t r o p o l i t a n A r e a s
and t h e 23 c i t i e s o f Canada w i t h p o p u l a t i o n s o f o v e r 3 0 , 0 0 0 i n t h e
1961 census of C a n a d a , 1 (see F i g u r e 1 ) .
P r o c e d u r e s
The m a n u f a c t u r i n g s t r u c t u r e o f t h e c i t i e s i s r e p r e s e n t e d i n t h e
f i r s t p l a c e by t h e employment f i g u r e s f o r t h e 20 major S t a n d a r d I n -
2 d u s t r i a l C l a s s i f i c a t i o n ( S . I . C . ) m a n u f a c t u r i n g c a t e g o r i e s . The d a t a
can be v i s u a l i z e d as a r r a n g e d i n a 40 x 20 m a t r i x , each column a c i t y ,
3 each row an employment c a t e g o r y . Each column i s i n e f f e c t a p r o f i l e
D o m i n i o n Bureau o f S t a t i s t i c s , C a n a d i a n C e n s u s , 1961 , V o l . I l l ,
Labour F o r c e , ( O t t a w a , 1 9 6 5 ) .
2 T h e S t a n d a r d I n d u s t r i a l C l a s s i f i c a t i o n ( S . I . C . ) c a t e g o r i e s a r e :
1. Food and beverages 11 . P r i n t i n g , p u b l i s h i n g and a l l i e d
2. Tobacco p r o d u c t s i n d u s t r i e s
3 . Rubber i n d u s t r i e s 12. P r i m a r y m e t a l s
4 . L e a t h e r i n d u s t r i e s 13 . M e t a l f a b r i c a t i n g
5 . T e x t i l e I n d u s t r i e s 14. M a c h i n e r y i n d u s t r i e s
6. K n i t t i n g m i l l s 15. T r a n s p o r t a t i o n equipment
7. C l o t h i n g i n d u s t r i e s 16. E l e c t r i c a l p r o d u c t s
8 . Wood i n d u s t r i e s 17. N o n m e t a l l i c m i n e r a l p r o d u c t s
9 . F u r n i t u r e and f i g u r e s 18, P e t r o l e u m - c o a l p r o d u c t s
10. Paper and a l l i e d i n d u s t r i e s 19. C h e m i c a l p r o d u c t s Paper and a l l i e d i n d u s t r i e s 2 0 . M i s c e l l a n e o u s
The c i t i e s o f P o r t A r t h u r and F o r t W i l l i a m a r e combined as t h i s seems a l o g i c a l way i n w h i c h t o p r o c e s s t h e d a t a more e f f i c i e n t l y . The d a t a m a t r i x i s thus a 20 x 40 i n s t e a d o f a 20 x 41 o n e . M a x w e l l comb i n e d t h e two c i t i e s f o r h i s a n a l y s i s ,
22
of the manufacturing structure or "manufacturing mix" of that designated
c i t y . The f i r s t step i n the analysis i s the determination of s i m i l a r i t y
or d i s s i m i l a r i t y of the c i t i e s i n terms of t h i s s t ructure , i . e . com
parison of the "columns" of the matrix. In order to remove the d i s
tor t ing effect of v a r i a t i o n i n c i t y population s i z e , i n affect to sharpen
the i n t e r - c i t y d i f f e r e n t i a l s , the employment totals are converted into 4
r e l a t i v e measures ( location quotients) .
If the 40 c i t i e s are considered " v a r i a b l e s " and the 20 employment
categories "observations" the product moment c o r r e l a t i o n c o e f f i c i e n t
between each c i t y pair over the employment categories, can be regarded
4 The l o c a t i o n quotient can be used according to Isard et a l . ,
Methods of Regional A n a l y s i s : An Introduction to Regional Science, (Mass., 1966), p. 125.
. . . as a rough benchmark In the analysis of a region's exports and imports . . ,
The formula for i t s computation for a given c i t y i s :
C i / C t T U
Ni7¥ w h e r e
C i i s the number of employees i n manufacturing industry i i n a given c i t y ;
C i s the number of employees i n a l l manufacturing Industries i n a given c i t y ;
Ni i s the number of employees i n manufacturing industry i i n the nat ion; and
N i s the number of employees In a l l manufacturing industr ies i n the nat ion.
By using locat ion quotients an economic base element i s introduced (in other words, c i t y s i m i l a r i t y i s viewed i n economic base terms). See Appendix 1 for Table of Location Quotients,
23
as a measure of i n t e r - c i t y s i m i l a r i t y of manufacturing industry."' The
r e s u l t i n g c o r r e l a t i o n c o e f f i c i e n t matrix summarizes the complete p a i r -
wise i n t e r - c i t y comparison i n these terms.
I t could be generally hypothesized that s i m i l a r i t i e s between
c i t y manufacturing p r o f i l e s i n d i c a t e common sets of l o c a t i o n factors
i n c i t i e s f or urban industry. To develop s p e c i f i c hypotheses concerning
these f a c t o r s , i t i s necessary to explore " i n t e r c i t y s i m i l a r i t y " i n
manufacturing structure i n more d e t a i l . Bonding methods provide a
simple and convenient method of i n i t i a l grouping of " s i m i l a r c i t i e s " and
have h e u r i s t i c pay-offs. Two techniques, basic p a i r s and p- c l u s t e r s , are
u t i l i z e d to group the c i t i e s .
In the former technique, each v a r i a b l e w i t h i n the "basic p a i r " i s
more highly correlated with the other than with any other v a r i a b l e . They
form the n u c l e i ! of a set, which subsequently contains the highest
correlated variables with either of the p a i r . As t h i s technique does not
describe a l l the bonds, and thus may conceal s i g n i f i c a n t r e l a t i o n s h i p s ,
the p-cluster technique i s also used. In t h i s case, a l l c o r r e l a t i o n s at
a given l e v e l of s i g n i f i c a n c e are shown; as the locations of the c i t i e s
are known, the bonds can be drawn d i r e c t l y on a map.
De t a i l s of computations are found i n J . H. B j e r r i n g , J . R, H. Dempster, and R. H. H a l l , U.B.C_. TRIP, U, B. C. Computing Centre, (1968). The data was normalized by a log-transformation. A discussion of normalization of data for human geography i s found i n P, Haggett, Locational Analysis i n Human Geography, tLondon, 1965), pp. 287-289. In the a n a l y s i s , zero l o c a t i o n quotients are represented by a nominal score of .001 before transformation,
6 See P, Haggett, op_. c i t . , pp. 283-286-,
24
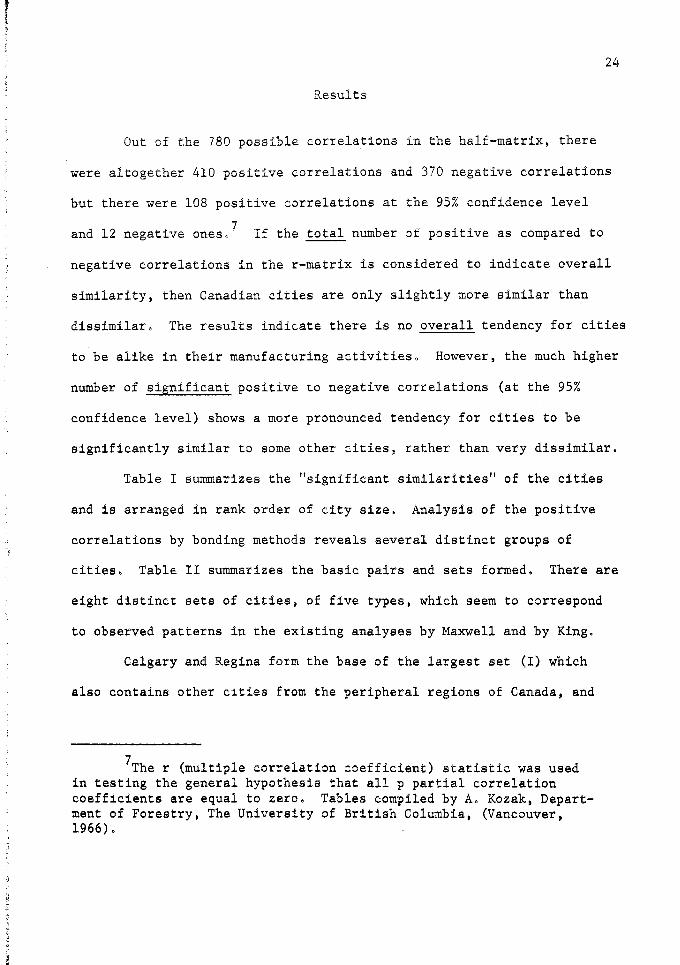
Results
Out of the 780 possible c o r r e l a t i o n s i n the h a l f - m a t r i x , there
were altogether 410 p o s i t i v e c o r r e l a t i o n s and 370 negative c o r r e l a t i o n s
but there were 108 p o s i t i v e c o r r e l a t i o n s at the 95% confidence l e v e l
and 12 negative ones.'' I f the t o t a l number of p o s i t i v e as compared to
negative c o r r e l a t i o n s i n the r-matrix i s considered to i n d i c a t e o v e r a l l
s i m i l a r i t y , then Canadian c i t i e s are only s l i g h t l y more s i m i l a r than
d i s s i m i l a r . The r e s u l t s i n d i c a t e there i s no o v e r a l l tendency f o r c i t i e s
to be a l i k e i n t h e i r manufacturing a c t i v i t i e s . However, the much higher
number of s i g n i f i c a n t p o s i t i v e to negative c o r r e l a t i o n s (at the 95%
confidence l e v e l ) shows a more pronounced tendency for c i t i e s to be
s i g n i f i c a n t l y s i m i l a r to some other c i t i e s , rather than very d i s s i m i l a r .
Table I summarizes the " s i g n i f i c a n t s i m i l a r i t i e s " of the c i t i e s
and i s arranged i n rank order of c i t y s i z e . Analysis of the p o s i t i v e
c o r r e l a t i o n s by bonding methods reveals several d i s t i n c t groups of
c i t i e s . Table I I summarizes the basic p a i r s and sets formed. There are
eight d i s t i n c t sets of c i t i e s , of f i v e types, which seem to correspond
to observed patterns i n the e x i s t i n g analyses by Maxwell and by King,
Calgary and Regina form the base of the largest set (I) which
also contains other c i t i e s from the peripheral regions of Canada, and
The r (multiple c o r r e l a t i o n c o e f f i c i e n t ) s t a t i s t i c was used i n t e s t i n g the general hypothesis that a l l p p a r t i a l c o r r e l a t i o n c o e f f i c i e n t s are equal to zero. Tables compiled by A. Kozak, Department of Forestry, The U n i v e r s i t y of B r i t i s h Columbia, (Vancouver, 1966).

25
TABLE I SIMILARITIES OF MANUFACTURING STRUCTURE OF CANADIAN CITIES,
1961, IN RANK ORDER OF POPULATION SIZE
C i t y Number of S i g n i f i c a n t Correlations at 95% C L .
S i g n i f i c a n t C orrelations at 95% C L ,
Montreal 1 Quebec ,55 Toronto 3 B e l l e v i l l e -55, London .55,
Brantford ,50 Vancouver 7 V i c t o r i a 66*, Edmonton ,57*,
Saskatoon .57*, Calgary ,55, St, John ,49, Moose Jaw .47, Regina ,46
Winnipeg 11 Edmonton ,62*, Saskatoon .58*, Ha l i f a x .57*, Calgary .55, Moose Jaw .52, Lethbridge ,50, St, John .49, St. John's .48, Regina ,46, Moncton .46, Windsor ,45
Ottawa 2 Pt, Arthur/Ft, William .52, Lethbridge ,46
Hamilton 5 Welland ,70*. Sydney .58*, Sudbury ,53, Chlcoutimi .45, Saulte Ste, Marie .45
Quebec 1 Montreal ,55 Edmonton 10 Calgary ,90*. Regina .87*,
Moose Jaw ,83*, Saskatoon .81*, Sarnia ,79*. H a l i f a x .69*, St. John ,67*, Winnipeg .62*. Vancouver ,57*, St. John's .46
Calgary 11 Regina ,93*. Edmonton ,90*, Saskatoon ,88*. Moose Jaw ,84*, Ha l i f a x .83*, St. John ,79*. Sarnia .72*, Winnipeg .55, Vancouver ,55, Lethbridge ,53, St, Johns ,51
Windsor 7 Moncton .77*, St, Catherines ,72*, Oshawa ,59*. V i c t o r i a ,54, St. John ,50, H a l i f a x .46, Winnipeg ,45
26
TABLE I (Continued)
H a l i f a x
London
Kitchener V i c t o r i a
Regina
Sudbury
St, John
11
2 4
14
Saskatoon 11
St, John's
Pt. Arthur/ Ft, William
Calgary ,83*, Moose Jaw ,82*, St, John =82*, Regina ,75*, Edmonton - 69*, Saskatoon ,68*, Sarnia ,62*, Moncton ,57*, Winnipeg ,57*. St, Johnfe ,49, Windsor ,46 Toronto ,55, Kitchener ,51, B e l l e v i l l e ,48 Sherbrooke .56*, London ,51 Moncton .73*, Vancouver .66*, St, Johns ,56, Windsor .54 Calgary ,93*, Moose Jaw ,88*, Edmonton .87*, Saskatoon .83*, H a l i f a x ,75*. St, John ,73*, Sarnia ,72*, Vancouver .46, Winnipeg ,46 Sydney ,97*, Chicoutimi ,95*, Saulte Ste, Marie ,92*, Kingston ,58*, Welland .58, Hamilton .53 Ha l i f a x ,83*, Calgary .79*, Regina ,73*, Edmonton .67*. Moose Jaw .66*, F t , William/ Pt, Arthur ,64*, Saskatoon .61*, Sarnia ,55, Windsor .50, Winnipeg ,49, Vancouver ,49, Moncton .47, St, John's .46, St, Catharines ,45 Calgary ,88*, Edmonton .83*, Lethbridge .78*, Moose Jaw ,77*, Regina ,73*, St. John's .71*, H a l i f a x ,68*, St. John ,61*, Winnipeg ,58*, Vancouver ,57*, Sarnia ,45 Lethbridge ,80*, Saskatoon ,71*, Moncton .70*. V i c t o r i a ,56, Calgary .51, Hal i f a x .49, Winnipeg ,48, St, John ,46, Edmonton .46 St., John .64*, St, Catharines .56, Ottawa ,52
27
TABLE I ( C o n t i n u e d )
S t . C a t h a r i n e s 4 W i n d s o r . 7 2 * , P t . A r t h u r / F t . W i l l i a m . 5 5 , M o n c t o n . 4 9 , S t . J o h n ,45
S h e r b r o o k e 3 B r a n t f o r d , 6 6 * , K i t c h e n e r . 5 6 * ,
W e l l a n d .47
Oshawa 2 W i n d s o r . 5 9 * , M o n c t o n .52
B r a n t f o r d 2 S h e r b r o o k e . 6 6 * , T o r o n t o .50
K i n g s t o n 7 W e l l a n d . 6 3 * , Sudbury . 5 8 * , Sydney . 5 8 * , C h i c o u t i m i . 5 7 * , S a u l t e S t e , M a r i e , 5 3 , T r o i s R i v i e r e s , 4 7 , S h a w i n i g a n .45
T r o i s R i v i e r e s 2 C o r n w a l l . 7 3 * , K i n g s t o n .47
S a r n i a 7 Edmonton . 7 9 * . R e g i n a . 7 2 * , C a l g a r y . 7 2 * , Moose Jaw . 7 0 * , H a l i f a x . 6 2 * , S t . J o h n . 5 5 , S a s k a t o o n .45
P e t e r b o r o u g h 1 B e l l e v i l l e . 7 0 *
M o n c t o n 9 Windsor , 7 7 * , V i c t o r i a . 7 3 * . S t . J o h n s , 7 0 * , H a l i f a x . 5 7 * , L e t h b r i d g e . 5 5 , Oshawa . 5 2 , S t , C a t h a r i n e s . 4 9 , S t . J o h n . 4 7 , W i n n i p e g .46
C o r n w a l l 2 T r o i s R i v i e r e s . 7 3 * , S h a w i n i g a n . 6 1 *
S a u l t e S t e . M a r i e 6 C h i c o u t i m i . 9 2 * . Sudbury . 9 2 * , Sydney , 9 1 * , W e l l a n d . 5 7 * , K i n g s t o n , 5 3 , H a m i l t o n .45
G u e l p h 1 B e l l e v i l l e .67*
W e l l a n d 7 H a m i l t o n , 7 0 * , Sydney . 6 5 * , K i n g s t o n , 6 3 * . Sudbury . 5 8 * , S a u l t e S t e . M a r i e . 5 7 * , C h i c o u t i m i . 5 2 , S h e r b r o o k e .47
L e t h b r i d g e 6 S a s k a t o o n . 7 8 * , S t . John's . 7 0 * , Moncton , 5 5 , C a l g a r y . 5 3 , W i n n i p e g . 5 0 , Ottawa ,46
28
TABLE I (Continued)
Sydney 6 Sudbury ,97*, Chicoutimi ,93*, Saulte S t e , Marie ,92*, Welland ,65*, Hamilton ,58*, Kingston ,58*
Moose Jaw 9 Regina ,88*, Calgary .84*, Edmonton ,83*, Halifax .82*, Saskatoon .77*, Sarnia .70*, St. John ,66*, Winnipeg .52, Vancouver ,47
Shawinigan 2 Cornwall ,61*, Kingston ,45
Chicoutimi 6 Sudbury ,94*. Sydney .93*, Saulte Ste, Marie .92*, Kingston ,57*. Welland .52, Hamilton ,45
Granby 0 B e l l e v i l l e 4 Peterborough ,70*, Guelph .67*,
Toronto ,55, London ,48
r - .444 at 95% Confidence Level *r • .561 at 99% Confidence Level
29
TABLE II
BASIC PAIRS AND SETS
Set No.
Set Type
C i t i e s
I I
I I I
IV
V I
V I I
V I I I
Saskatoon -*- l e t h b r i d g e «- St. John's
Winnipeg L
+
Edmonton • | CALGARY «•+ REGINA
Sarnia IA
H a l i f a x «- St . John «- P t . A r t h u r / F t . W i l l i a m «- Ottawa
SUDBURY SYDNEY C h i c o u t i m i + S a u l t e Ste. — I M a r i e
Oshawa St. i a t h a r i n e s - ^ WINDSOR MONCTON
HAMILTON-f-v WELLAND
-^-Victoria -> Vancouver
••-Kingston
CORNWALL <- •TROIS RIVIERES K i t c h e n e r
SHERBROOKE +• BRANTFORD
MONTREAL-^QUEBEC
London •>
Toronto-* BELLEVILLE-* -^PETERBOROUGH
SET TYPE A - N o n - s p e c i a l i z e d p e r i p h e r a l (the c i t i e s have between 2 to 4 r e g i o n a l r e s o u r c e based i n d u s t r i e s ) .
B - S p e c i a l i z e d p e r i p h e r a l ( " f r o n t i e r i n d u s t r i a l c i t i e s " , s p e c i a l i z i n g i n one o r two metal r e f i n i n g i n d u s t r i e s ) .
C » S p e c i a l i z e d h e a r t l a n d and p e r i p h e r a l c i t i e s ( e s p e c i a l l y i n t r a n s p o r t equipment).
D • S p e c i a l i z e d h e a r t l a n d (the c i t i e s have a unique s p e c i a l i z a t i o n i n s e v e r a l n o n - r e g i o n a l r e s o u r c e based i n d u s t r i e s ) .
E • D i v e r s i f i e d h e a r t l a n d (the c i t i e s have more than the a v e r age n a t i o n a l employment i n seven or more i n d u s t r i e s ) .

30
corresponds to Maxwell's i d e n t i f i c a t i o n of "periphery" c i t i e s . These
c i t i e s are characterized by l o c a l and regional resource based industr ies
and may be thought of as non-special ized rather than d i v e r s i f i e d i n
thei r manufacturing p r o f i l e . The l a t t e r d i s t i n c t i o n avoids the objec
tions that most of the group do not exhibit a range of manufacturing
a c t i v i t i e s (as, for example, do the large metropolitan centers of
Montreal and Toronto), Graph 1 i l l u s t r a t e s the p r o f i l e of the c i t i e s
at the center of th is set . It i s i n effect the histogram of the two
sets of untransformed observations f o r Calgary and Regina,
A second peripheral set (II) i s formed around the Sudbury and
Sydney basic p a i r . C i t i e s i n th is set are characterized by concentra
t i o n of employment i n metal r e f i n i n g and primary metal products, and
corresponds to the two groups which King i d e n t i f i e d as " f r o n t i e r indus
t r i a l c i t i e s " (see Chapter I I ) .
The remaining sets (III to VIII) generally indicate a s p e c i a l i z a
tion-uniqueness pattern, and are consistent i n function and loca t ion with
Maxwell'B " i n d u s t r i a l heart land" . There are three funct ional types of
c i t y i n these remaining sets , each characterized by a d i s t i n c t i v e specia l
i z a t i o n i n one or two non-resource based i n d u s t r i e s . The manufacturing
p r o f i l e s of the c i t y groups vary considerably (see Graphs 3 to 8). The
Bellevil le-Peterborough (VIII) and Quebec-Montreal (VII) sets apparently
Ottawa i s the only inconsistency here. Maxwell considers Ottawa to be i n the "heartland" group of c i t i e s . In th is thesis i t i s included i n the "periphery" group aB i t seems to share the loca t ional character is t i c s of this group. From now on this basic Canadian urban dichotomy i s termed "heartland" and " p e r i p h e r a l " , following the d e f i n i t i o n of these areas used by Maxwell, with the exception noted.

GRAPH 1 : TYPE A CALGARY - REGINA
Calgary Regina J]
10.05
5.64
1 2 3 4 5 6 7 91011 12 13 U 15 16 17 18 19 20
GRAPH 3 : TYPE C WINDSOR - MONCTON
1 2 3 4 5 6 7 8 9 10 11 12 13 14 15 16 17 18 19 20
10.5
Horizontal axis : 1 Food and Beverage 2 Tobacco 3 Rubber 4 Leather 5 Textiles 6 Knitting 7 Clothing 8 Wood 9 Furniture
10 Paper 11 Printing 12 Primary Metals 13 Metal Fabrication 14 Machinery 15 Transportation
Equipment 16 Electrical Products 17 Non-Metallic
Minerals 18 Petroleum 19 Chemicals 20 Miscellaneous
Vertical axis refers to Location Quotients
GRAPH 2 : TYPE B SUDBURY -
SYDNEY
Sydney Qgj Sudbury j j
P « --1W i l 2 3 4 5 6 7 9 10 11 12 13 U 15 16 17 18 19 20
4.0
GRAPH 4 : TYPE D
ran
HAMILTON - WELLAND
Hamilton | ]
Welland Uj
I. 1 2 3 4 5 6 7 8 9 1 0 11 12 13 H 15 16 17 18 19 20
GRAPH 5 : TYPE D CORNWALL - TROIS-RIVIERES
Cornwall \M Trois Rivieres [TJ
• l j j i u l j l r i r
GRAPH 6 : TYPE D SHERBROOKE - BRANTFORD
Sherbrooke Brentford HO
I I 2 3 < 5 6 7 10 11 t2 13 K 15 16 17 18 19 20
GRAPH 7 : TYPE E MONTREAL - QUEBEC
Montreal
an Quebec
1 .0 Horizontal axis :
1 Food and Beverage 2 Tobacco , 3 Rubber ° - s l 4 Leather 5 Textiles 6 Knitting 7 Clothing 8 Wood 9 Furniture
10 Paper 11 Printing 12 Primary Metals 13 Metal Fabrication U Machinery 15 Transportation
Equipment 16 Electrical Products 17 Non-Metallic
Minerals 18 Petroleum 19 Chemicals 20 Miscellaneous
Vertical axis refers to Location Quotients
1 2 3 4 5 10 11 12 13 U 15 16 17 18 19 20
GRAPH 8 : TYPE E BELLEVILLE - PETERBOROUGH
1 2 3 4 5 6 7 8 9 10 11 12 13 14 15 16 17 1& 19 20 1 2 3 4 5 6 7 9 10 11 12 13 K 15 16 17 18 19 20
GC.I
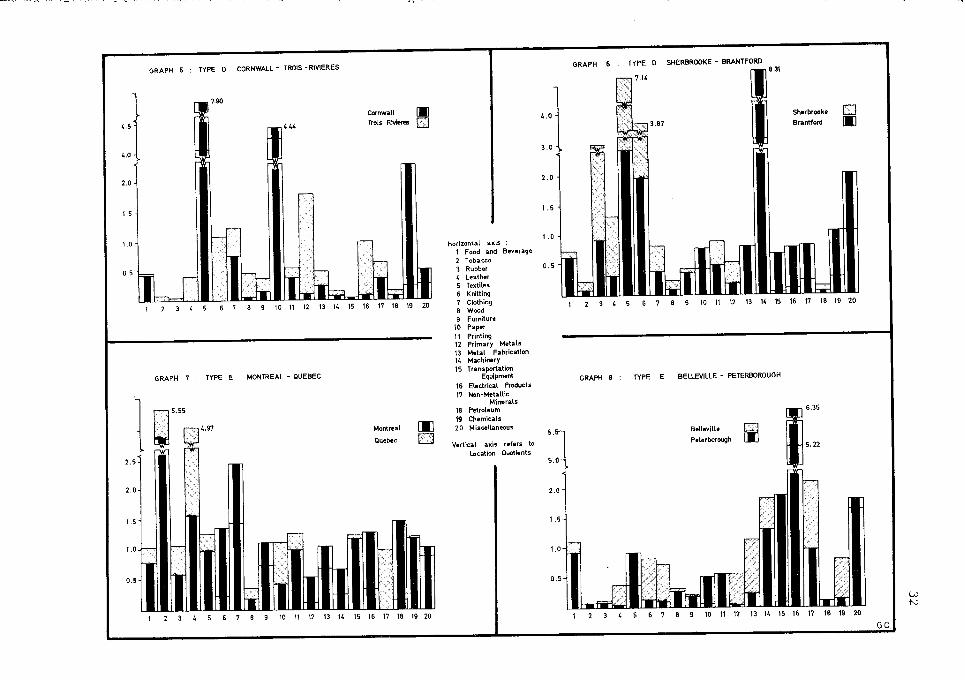
33
have a wider range of a c t i v i t i e s than the other heartland sets , and
are thus seen as variants of the manufacturing c i t y type "E" ( d i v e r s i
f i e d heartland c i t i e s ) , High concentrations of employment i n one
a c t i v i t y ( e l e c t r i c a l equipment for the former, and tobacco i n the l a t t e r
case), helps cause the s i g n i f i c a n t correlat ions that d i f f e r e n t i a t e them.
Several anomalies can be seen at th is l e v e l of analys is . Sarnia
i s grouped with the peripheral c i t i e s , although i t s o v e r a l l manufacturing
p r o f i l e i s of the specia l ized Industr ia l type, charac ter is t i c of the
heartland. This i s e n t i r e l y due to i t s heavy concentration of employment
i n petroleum r e f i n i n g and chemical i n d u s t r i e s , conditions which are also
found i n the peripheral p r a i r i e c i t i e s , where the industry i s generally
l o c a l resource based. However, the peripheral c i t i e s are a c t u a l l y much
less special ized than Sarnia. Thus, the l a t t e r should be more properly
included i n the heartland. The Windsor-Moncton based set provides
another anomaly but one readi ly explained by analysis of the relevant
manufacturing employment data. This set i s formed of c i t i e s which seem
to belong to both periphery and heartland. Their " s i m i l a r i t y " i s due
to the high concentration of employment i n transportation equipment. In
the case of Windsor, Oshawa and St. Catharine's this i s automobile
manufacturing, i n Moncton railway stock and V i c t o r i a , s h i p - b u i l d i n g .
The automobile industry i s a specia l ized non-resource based a c t i v i t y ,
t y p i c a l of the heartland, while railway stock f a b r i c a t i o n and s h i p - b u i l d
ing are more ubiquitous i n their general locations i n the sense that they
are found i n both periphery and heartland.

34
By manipulating the same corre la t ion matrix data another way, i t
can be seen that p-c lusters confirm the heartland-periphery contrast of
c i t y structure i n Canada, expecial ly when the anomalies are taken into
9
consideration,
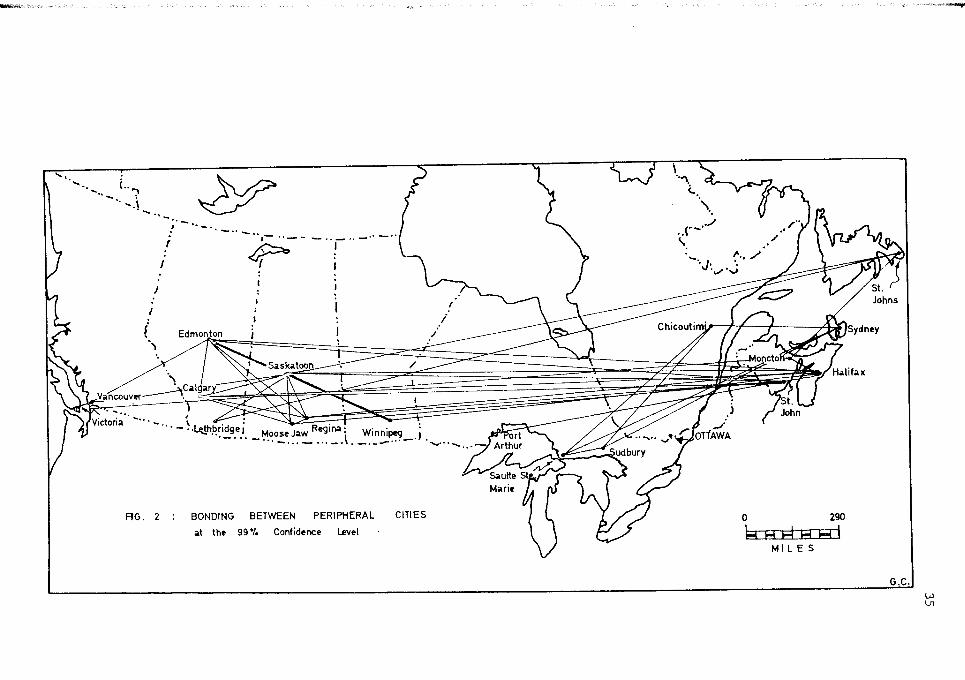
Figure 2 i l l u s t r a t e s the pattern of the resource based non-
s p e c i a l i s t peripheral c i t i e s . On the map a l i n e l i n k s each c i t y with
the c i t i e s i t i s s i g n i f i c a n t l y " l i k e " ; peripheral c i t i e s are seen to
have quite a l o t i n common, either d i r e c t l y or i n d i r e c t l y (through
other c i t i e s ) . These s i m i l a r i t i e s are national as much as regional
( i . e . , with distant peripheral c i t i e s as w e l l as close ones) but the
mutual s i m i l a r i t i e s among p r a i r i e c i t i e s should be noted, A few more
points can be added here. These c i t i e s tend to be Isolated and many
serve as p r o v i n c i a l and regional centers. In addi t ion , Ottawa serves
as federal c a p i t a l . The " f r o n t i e r Indust r ia l c i t i e s " , however, are a
d i s t i n c t sub-group. P-c luster ing l i n k s them i n th is context with the
Hamilton-Welland set , due to a high corre la t ion caused by high r e l a t i v e
employment i n primary metal and metal f a b r i c a t i o n . This corre la t ion
disguises the nature of the l o c a t i o n a l factors a f fec t ing the involved
indust r ies , which are e n t i r e l y d i s s i m i l a r . For example, Sudbury and
Hamilton are s i g n i f i c a n t l y s imilar due to a high concentration of t o t a l
equipment i n the primary metal category. The underlying loca t ional
factors are, however, greatly d i s s i m i l a r . In the case of Sudbury
P-c luster ing i s done for (selected) l i n k s at the 99% confidence l e v e l only. Lowering the C L , to 95% (or lower) increases the complexi t y of the maps without adding any heuristic•advantages,

36
employment i s concentrated almost e n t i r e l y i n the n i c k e l and copper
r e f i n e r i e s which are based on l o c a l deposits , Hamilton, on the other
hand, has, amongst other industries such as rubber and tobacco, a high
concentration of employment i n the i r o n and s t e e l industry which i s not
based on l o c a l resources.
The other sets i d e n t i f i e d i n bonding analysis (heartland groups)
tend to remain discreet with p-c lus ter ing a n a l y s i s , due to the greater
v a r i a t i o n In the p r o f i l e s of the c i t i e s involved (see Figure 3). The
c i t i e s are, i n comparison to the peripheral c i t i e s , non- isola ted . These
heartland c i t y sets show several interes t ing funct ional charac ter is t i cs
when examined c l o s e l y .
The sparci ty of linkage between and within the "heartland" sets
of c i t i e s , cannot be interpreted as showing no s i m i l a r i t y i n respect of
the general type of Industry found i n the heartland. Rather i t reveals
the unique pattern of s p e c i a l i z a t i o n of small sets of c i t i e s within a
broader group of Industries having s imilar l o c a t i o n a l requirements.
Thus a group comprising Hamilton, Welland and Kingston specia l izes i n
the primary metal category and their locat ion along the Great Lakes/St .
Lawrence waterway Implies s imilar loca t ional needs ( v i z . , cheap transport
and h y d r o - e l e c t r i c i t y ) . Other sets of "heartland" c i t i e s with s imilar
l o c a t i o n a l character is t ics but di f ferent specia l izat ions between sets
are: Windsor, St. Catharines and Oshawa (transport equipment); Cornwall,
Trois Rivieres and Shawinigan (pulp and paper, t e x t i l e s and chemicals);
and Sarnia (petroleum, and chemicals).

G.C.

38
Another .set of heartland c i t i e s , containing Kitchener, Guelph,
B e l l e v i l l e , Sherbrooke, Peterborough and Brantford, i s characterized
by a range i n the l i g h t e r type of industry, each c i t y having more than
the average n a t i o n a l employment i n three or mere of the fol l o w i n g i n
d u s t r i e s : food and beverages, tobacco, rubber, leather, t e x t i l e s ,
k n i t t i n g , c l o t h i n g , machinery, e l e c t r i c a l products and miscellaneous
i n d u s t r i e s . Because of the v a r i a t i o n i n s p e c i a l i z a t i o n , each c i t y i n
t h i s group has few l i n k s with the others. The c i t i e s of Granby, London,
Quebec, Montreal and Toronto are not linked to t h i s set, although they
are characterized by a s i m i l a r wide range of the l i g h t e r type of industry.
This i s due to the much wider range of i n d u s t r i e s found i n these l a t t e r
c i t i e s (each c i t y having more than the average n a t i o n a l employment i n
seven or more of the above mentioned categories). Many of these l a t t e r
c i t i e s act as p r o v i n c i a l and regional centers, which may, p a r t l y ,
explain t h e i r greater d i v e r s i f i c a t i o n of industry.
The impression given above of an i n t r i c a t e d i v i s i o n of labour
among c i t i e s i n a r e l a t i v e l y confined area o f f e r s support f o r the " d i s -
persed-city" hypothesis, i n which a group of c i t i e s " . . . although
separated by t r a c t s of a g r i c u l t u r a l land, function together economically
as a s i n g l e urban u n i t , " ^ This " u n i t " i d e n t i f i e d as Southern Ontario
by Burton, contains I n d u s t r i a l plants with market areas that equal that
of a si n g l e and larger metropolis. Location of such i n d u s t r i e s outside
I , Burton, "A Restatement of the Dispersed C i t y Hypothesis," Annals of the Association of American Geographers, 53 (1963), p. 285.

39
the larger metropolises a l l e v i a t e s the diseconomies due to agglomeration,
while maintaining the b e n e f i t s of proximity to the larger centers.
Links between heartland and peripheral c i t i e s are shown i n Figure
4, These l i n k s have already been explained i n terms of (I) coarseness
of the data; (2) the lack of d i s t i n c t i o n i n function between the
" f r o n t i e r I n d u s t r i a l c i t i e s " s p e c i a l i z i n g In primary metal production
based on l o c a l resources and those c i t i e s i n the heartland s p e c i a l i z i n g
i n the same industry category but whose raw materials are "imported",^
The l i n k s between heartland and peripheral c i t i e s were not drawn on the
maps (Figures 2 and 3, pp. 35 and 37), as i t was f e l t they did not
contribute to the explanations of manufacturing s i m i l a r i t i e s , except i n
a negative way.
I t might be expected that c i t y s i z e i s somehow connected with
patterns of c i t y s i m i l a r i t y so f a r i d e n t i f i e d . However, i t i s impossible
from t h i s analysis to gauge the e f f e c t s of s i z e on manufacturing s t r u c
ture, to any degree of accuracy. T h e o r e t i c a l l y , small c i t i e s are
supposed to have l e s s d i v e r s i f i e d manufacturing p r o f i l e s , but t h i s i s
not c l e a r l y evident from the analysis so f a r i n terms of c i t y s i m i l a r
i t i e s . Table I I I summarizes the " d i s t i n c t i v e " and "dominant" manufactur
ing functions of the c i t i e s . A " d i s t i n c t i v e " industry has a l o c a t i o n
quotient of more than 1.10 ( i . e . , j u s t above the average i n comparison
with the national figure) and a "dominant" industry i s one with a quotient
n S e e page 33 for d e t a i l s of the f i r s t argument and page 34 for the second.

.S
J. /
CHICOUTIMI* 'SYDNEY
^.MONCTON^
'HALIFAX
SAULTE
, MARIE . S U b B U R Y - . . ^ /
'KINGSTON
'HAMILTON
> WELLAND 290 rH i - H E C l M I L E S
G.C. O

41
TABLE III
SUMMARY OF DIVERSIFICATION AND SPECIALIZATION OF INDUSTRY IN LARGER CANADIAN CITIES
-Population C i t y
L . Q . more than 1.10
L . Q . morel than 1.50
S p e c i a l i z a t i o n Index
2,000,000 Montreal 9 3 15 2,000,000 Toronto 8 4 16
750,000 Vancouver 6 2 33
500,000 Winnipeg 7 4 22 Ottawa 5 3 40 Hamilton 7 4 37 Quebec 8 2 25 Edmonton 7 3 32 Calgary 5 4 36
250,000 Windsor 2 2 48 250,000 Hal i fax 4 4 45 London 8 6 30 Kitchener 7 6 32 V i c t o r i a 4 3 45 Regina 5 5 41 Sudbury 1 1 58
100,000 St. John 7 6 42 100,000 Saskatoon 4 4 50 St. John's 3 2 43 Pt . A r t h u r / F t . Will iam 2 2 52 St . Catharines 4 3 48 Sherbrooke 5 3 44 Oshawa 4 2 61 Brantford 4 4 39 Kingston 2 2 51 Trois Rivieres 4 3 46 Sarnia 3 3 59
50,000 Peterborough 4 3 41 Moncton 3 3 48 Cornwall 3 2 66 Saulte Ste. Marie 2 1 75 Guelph 6 5 36 Welland 3 3 59 Lethbridge 3 2 11 Sydney 2 1 66 Moose Jaw 4 2 49 Shawinigan 5 5 58 Chicoutimi 1 1 57 Granby 7 4 52
L B e l l e v i l l e 6 4 37 Location quotient more than 1.10 = D i s t i n c t i v e Industry Location quotient more than 1.50 = Dominant Industry

42
of more than 1,50 ( i . e . , a half as much again i n comparison with the
national t o t a l ) , A l l c i t i e s have at least one dominant manufacturing
function, with most having more than one. This aspect of c i t y manu
facturing structure does not seem related to size. However, a simple
ratio of dominant to distinctive industries does appear related to size.
Large c i t i e s tend to have more distinctive functions and, consequently,
a higher proportion of distinctive functions to dominant ones, than do
smaller or medium sized c i t i e s . These tendencies are given support by
the specialization index which indicated that larger c i t i e s are less 12
specialized than smaller ones.
Summary
Analysis of the correlation coefficients between the 40 c i t i e s reveals eight classes of c i t i e s and five associated patterns of manufacturing a c t i v i t y , i.e., five types of c i t i e s similar i n manufacturing structure. The f i r s t two types can be designated as dimensions of peripheral c i t i e s , the next three index c i t i e s of the "heartland" of Canada. Cities of the f i r s t type are typically medium to large size and isolated. Manufacturing industry i s based on local and regional resources and the pr o f i l e i s non-specialized rather than diversified, suggesting the development of industry to meet regional and local rather than national needs. The second cit y type i s composed of typically
The Specialization Index was obtained by summing the positive or negative differences i n employment from the average for the 40 c i t i e s . It i s thus a measure of deviation from the average manufacturing p r o f i l e and ranges from 0 to 100.
43
small to medium sized isola ted c i t i e s with highly spec ia l ized industry
based on l o c a l meta l l i c resources. The f i n a l three types of c i t y can
be thought of as part of an interconnected group, which i s quite complex.
A l l c i t i e s i n i t spec ia l ize i n one or more manufacturing a c t i v i t i e s , and
thei r p r o f i l e s tend to be unique. Industry i s not generally based on
l o c a l or regional resources but i n part may be dependent on c i t y s i z e .
The larger Metropolitan areas In this o v e r a l l group tend to be more
d i v e r s i f i e d than the smaller and medium-sized c i t i e s . The c i t i e s are
non- isola ted , with some acting as regional centres and p r o v i n c i a l c a p i t a l s .
There i s some evidence to suggest that many of the c i t i e s function as part
of a regional ly " d i s p e r s e d - c i t y " .
These f indings are consistent with exis t ing empirical evidence of
Canadian urban manufacturing structure and behavior. The work of Maxwell,
King and Burton has already been mentioned and their relevance to th is
thesis evaluated.
The f indings are also not inconsistent with loca t ion theory. In
d u s t r i a l locat ion theory has not, u n t i l recently , examined the r e l a t i o n -13
ship of primary and secondary manufacturing to the settlement hierarchy, 14
and i n fact the market-oriented networks established by C h r i s t a l l e r and
15 Lb'sch i n their respective models of central places and market areas,
13 F. Ian Hamilton, "Models of Industr ia l Location" i n Models i n
Geography, eds, R. Chorley and P. Haggett, (London, 1967), Chap. 10. 14
W, C h r i s t a l l e r , Central Places i n Southern Germany, trans. C. W. Baskin, (New Jersey, 1966).
15 A. Losch, The Economics of Location, (New Haven, 1954).

44
are not applicable when primary and secondary manufacturing i s i n t r o
duced into the settlement hierarchy. The presence of sporadical ly
d is t r ibuted manufacturing industr ies (the majority of manufacturing
industr ies) weakens the conformity of the C h r i s t a l l e r - L o s c h systems to
r e a l i t y , though rank-size i s not excluded as an important way of ordering
the d i s t r i b u t i o n of manufacturing industr ies throughout the hierarchy.
In pract ice other factors modify th is pattern i n a c a p i t a l i s t economy and
this i s the impression we get from our a n a l y s i s . For example, manufactur
ing industry can be attracted either to the s i t e of the raw materials
(where the materials are bulky or perishable) or to urban places (where
market advantages and agglomeration economies e x i s t ) , depending upon the
s p e c i f i c economies or advantages the entrepreneur i s seeking. The l a t t e r
loca t ion can be further modified by the "sharing" of industr ies by
smaller c i t i e s around the larger metropolis (the " d i s p e r s e d - c i t y " ) .
F i n a l l y , a c i t y ' s manufacturing s p e c i a l i z a t i o n can influence the develop
ment of i t s neighbors, by encouraging the growth of a s imi lar type of
industry , or a general economic development which can resul t i n new
manufacturing industr ies being established.
This chapter has described s i m i l a r i t i e s i n the Canadian urban manu
facturing system. The system can be described i n terms of a center-
periphery model, modified by a "dispersed c i t y " operating i n the center
and by some regional specia l izat ions i n the periphery. The next chapter
w i l l i s o l a t e and expand on some of these notions and attempt to explain
the i d e n t i f i e d i n t e r - c i t y manufacturing s i m i l a r i t i e s i n Canada.
CHAPTER IV
ANALYSIS OF INTER-CITY SIMILARITIES IN MANUFACTURING STRUCTURE
The Canadian inter-urban manufacturing structure i s a composite
resul t of many p h y s i c a l , c u l t u r a l , h i s t o r i c a l and economic condit ions.
To understand their i n t e r - r e l a t i o n s h i p s completely would be impossible.
In order to proceed with the analys is , several prominent related factors
have been hypothesized as underlying c i t y manufacturing structure and
i n t e r - c i t y manufacturing s i m i l a r i t i e s , and an attempt i s made to assess
their r e l a t i v e s ignif icance by s t a t i s t i c a l techniques.
Hypotheses
Industr ia l locat ion theory would suggest that c i t i e s s imilar In
terms of s i z e , r e l a t i v e locat ion and h i s t o r i c a l development might be
expected to have a s i m i l a r manufacturing structure . A measure of
s i m i l a r i t y i n manufacturing structure i s provided by the product-moment
corre la t ion c o e f f i c i e n t between pairs of c i t i e s taken from the 40 x 40
i n t e r - c i t y corre la t ion matrix based on employment i n the cities." '"
V a r i a t i o n among these r - c o e f f i c i e n t s can hypothet ical ly be explained i n
part by v a r i a t i o n i n s i z e , r e l a t i v e locat ion and h i s t o r i c a l development
between the pair of c i t i e s which the r - c o e f f i c i e n t l i n k s . Thus the
r - c o e f f i c i e n t s form the dependent variable i n the following analysis .
Table I (page 25), l i s t s the s t a t i s t i c a l l y s i g n i f i c a n t s i m i l a r i t i e s taken from the matrix. From now on correla t ion c o e f f i c i e n t s are referred to as r - c o e f f i c i e n t s .
46
Size
The size of c i t y , i n terms of i t s tot a l population, affects the
manufacturing structure, primarily by providing certain input and market
advantages. It could thus be hypothesised that c i t i e s of the same size
would have more similar manufacturing structures than c i t i e s of different
sizes. This notion, derived i n i t i a l l y from the work of LSsch and
Christal l e r , i s based on the connection between cit y size and fulfillment
of a succession of market thresholds. Pred has pointed to empirical
evidence for the United States of America which reveals that d i v e r s i f i -2
cation of manufacturing increases with growth i n ci t y population. He
also points out that this does not necessarily mean, . . , that similar-sized c i t i e s w i l l have identical manufacturing structures for no centers are l i k e l y to possess equivalent i n i t i a l advantages for the same industries . . ,3
however, size sim i l a r i t y might be associated with functional s i m i l a r i t y
to some degree. Market advantages are not the only result of size. Pred feels
that
. » . the locational attraction exerted by external agglomeration economies (or localization and urbanization economies) increases functionally rather than arithmetically.^
A, Pred, "Industrialization, I n i t i a l Advantage and American Metropolitan Growth." Geographical Review, 40 (1965), pp. 158-185.
3 l b i d . , p. 169. 4 I b i d , , p. 172,
47
Big c i t i e s or metropolises at t ract many non-market oriented industr ies
by these means, and as Pred points out an analysis of them Is " . . . a
key to disparate i n d u s t r i a l structures i n metropolises of nearly equal
s i z e . " 5
Preliminary analysis of the re la t ionship between s ize and
manufacturing structure i n Canada has been done on the basis of d i v e r
s i f i c a t i o n and s p e c i a l i z a t i o n In industry (see Table I I , page 29).
However, a clearer picture of the re la t ionship between s ize of c i t y
and manufacturing structure can be obtained by ca lcula t ing for c i t y
s ize classes the average indices of d i v e r s i f i c a t i o n ( L . Q . ' s greater
than 1.10) and s p e c i a l i z a t i o n ( spec ia l iza t ion index) and the average
number of s i g n i f i c a n t manufacturing s i m i l a r i t i e s ( s igni f i cant r - c o e f f i -
cients between each c i ty ) for each c lass . Table IV summarizes these
average values for s ix c i t y s ize classes . It indicates that the smaller
the c i t y , the less d i v e r s i f i e d and, conversely, the more specia l ized
i t s manufacturing structure becomes. Small c i t i e s also tend to have
a more unique manufacturing structure than big c i t i e s (they have fewer
s i g n i f i c a n t manufacturing s i m i l a r i t i e s compared to other c i t i e s ) a l
though this charac ter is t ic i s shared by the two large metropolises of
Montreal and Toronto. Size , then, can be expected to be related to
v a r i a t i o n i n the manufacturing structure between a pair of c i t i e s .
It i s s p e c i f i c a l l y hypothesized here that var iat ions i n the r - c o e f f i -
cient between c i t y pairs are inversely related to the variat ions i n
A. Pred, I b i d . , p. 173.
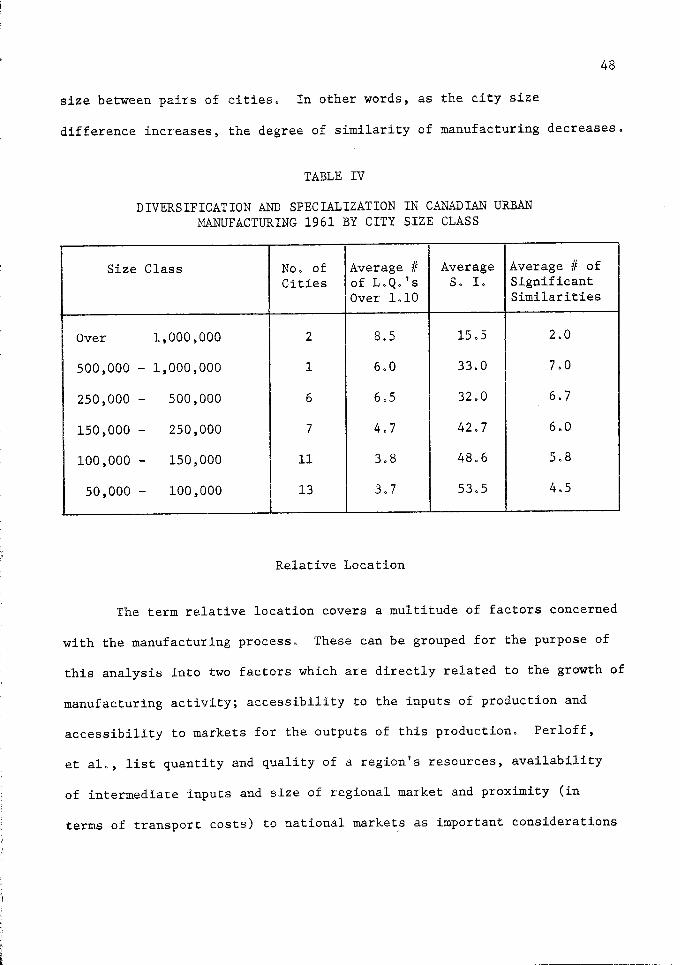
48
size between pairs of c i t i e s . In other words, as the city size
difference increases, the degree of simi l a r i t y of manufacturing decreases.
TABLE IV DIVERSIFICATION AND SPECIALIZATION IN CANADIAN URBAN
MANUFACTURING 1961 BY CITY SIZE CLASS
Size Class No. of Cities
Average # of L.Q.'s Over 1.10
Average S. I.
Average # of Significant Similarities
Over 1,000,000 2 8.5 15.5 2.0
500,000 - 1,000,000 1 6.0 33.0 7.0
250,000 500,000 6 6.5 32.0 6.7
150,000 250,000 7 4.7 42.7 6.0
100,000 150,000 11 3.8 48.6 5.8
50,000 100,000 13 3.7 53.5 4.5
Relative Location
The term relative location covers a multitude of factors concerned with the manufacturing process. These can be grouped for the purpose of this analysis into two factors which are directly related to the growth of manufacturing a c t i v i t y ; accessibility to the inputs of production and accessibility to markets for the outputs of this production. Perloff, et a l . , l i s t quantity and quality of a region's resources, a v a i l a b i l i t y of intermediate inputs and size of regional market and proximity (in terms of transport costs) to national markets as important considerations

49
i n explaining a city's a b i l i t y to attract a c t i v i t i e s of specified types. It i s unnecessary, given the scope of this analysis, to break down these general considerations into more specific location factors. Instead a number of general concepts and indicators of acces s i b i l i t y (relative location) were developed and tested i n this study.
Preliminary analysis has revealed that a "heartland-periphery" pattern characterizes Canadian manufacturing. Location i n either heartland or periphery i s reflected i n the manufacturing structure of a c i t y by the amount of specialization and type of industry. The heartland offers the greatest market potential i n Canada i n terms of size of regional and national markets, ̂ As a result both overall industrial d i v e r s i f i c a t i o n , but specific city specialization, would be expected i n this area. Location i n the heartland i s related to accessibility to regional and national markets, to a v a i l a b i l i t y of intermediate outputs and to agglomeration economies.
The periphery c i t i e s with smaller local markets would be expected to display less overall d i v e r s i f i c i a t i o n , with specialization largely confined to processing of local or regional raw materials. This contrasts with the predominance of fabricating industries and with the processing of minerals not l o c a l l y or regionally accessible, i n the heartland c i t i e s . This pattern i s evident on close analysis of the
H. S. Perloff, et a l , , Regions, Resources and Economic Growth, (Lincoln, Neb., 1960), p. 75.
7See Market Potential Index, 1961 i n D. Ray, op_. c i t . , Figure 1.
50
location quotients for the twenty industries for processing and
fabricating industries. Table V summarizes this analysis. Processing
i s , on the average, more prominent i n the periphery c i t i e s and f a b r i
cation i n the heartland. The c i t i e s of the latter have a greater range
of industries but tend to have a more unique manufacturing structure.
It can be hypothesized then that variations i n the r-coefficient
between any pair of c i t i e s i s directly related to s i m i l a r i t i e s i n
a c c e s s i b i l i t y , that i s to say, to similar location i n the heartland
or periphery for that pair of c i t i e s ,
In addition, quality and quantity of a region's resources play
an Important role i n influencing regional s i m i l a r i t i e s or differences
across Canada, Accessibility to forest and carboniferous resources
might be thought to be a significant factor i n explaining variation i n
the Canadian urban manufacturing structure. It was, therefore,
hypothesized that variation i n the r-coefficient for the c i t y pair
varies directly with similar accessibility to forest resources and
similar accessibility to carboniferous resources for the pair.
Historical Evolution
The h i s t o r i c a l evolution of manufacturing accounts for certain aspects of the present structure. It might be expected that c i t i e s of a similar age would be characterized by a similar manufacturing structure, since they were founded at a period characterized by the relative dominance of certain industries i n the national economy, although the amount of Industry might vary considerably, Pred uses the umbrella term

51
TABLE V PROCESSING, FABRICATING, DIVERSIFICATION AND
SPECIALIZATION OF THE HEARTLAND AND PERIPHERY: CANADA 1961
I Manufacturing Characteristic Cities of Heartland
Cities of Periphery
Number of Cities 22 18
Average L.Q. for Processing Industries 1.07 1.38
Average L.Q. for Fabricating Industries 1.83 .50
Average Number of L.Q.'s over 1.10 (Diversified) 5.20 3.90
Average Specialization Index 43.20 46.30
Average Number of Significant Similarities 3.10 8.20

52
' i n i t i a l advantage' . . .
to cover three overlapping ideas, that existing locations are usually characterized by tremendous i n e r t i a and a temporal compounding of advantages; that existing locations often exert considerable influence on plant-location decisions; and that once concentration i s i n i t i a t e d i t i s self-perpetuating.^
These forces sometimes result i n apparent contradictions of
theoretical patterns based on present size and relative location. The
age of the cit y may then offer some clue i n explaining variation to
the expected manufacturing structure. It i s , therefore, hypothesized
that variation i n the r-coefficient between any c i t y pair are inversely
related to the difference i n age between the pair of c i t i e s . In
other words, c i t i e s alike i n age are hypothetically alike also i n
manufacturing structure.
Data: Manufacturing Similarities
As described e a r l i e r , the pattern of manufacturing sim i l a r i t y
across Canada was established by computing correlation coefficients
for every pair of c i t i e s over 30,000, and applying bonding techniques 9
to isolate the dominant associations. The bonding pattern was drawn from the significant correlations at the 95% and 99% confidence levels and i t i s these values which form the dependent variable for the
A. Pred, op_, c i t , , p, 160, *See Chapter I I I .

53
analysis-. Two sets of observations are used, comprising the 108 r - c o
ef f i c i e n t s at the 95% confidence l e v e l and the 63 at the 99% l e v e l ,
Both sets of observations ( r - c o e f f i c i e n t s ) have been normalized by a
logarithmic transformation.
It i s f e l t that these observations constitute a more v a l i d array
for analysis than the complete population (or a sample of i t ) of
pos i t ive correlat ions from the 40 x 40 i n t e r c i t y cor re la t ion matrix. As
the number of o r i g i n a l observations ( i , e , , the 20 S . I . C , categories) i s
small , one or two very high locat ion quotients w i l l cause a high standard
deviation from the mean. While this does not i n t e r f e r e with the s t a t i s
t i c a l v a l i d i t y of the r - c o e f f i c i e n t s , i t makes them d i f f i c u l t to
interpret geographically. For example, Granby has no s i g n i f i c a n t
posi t ive correlat ions (or i n other words, i t has a unique manufacturing
s tructure) . This i s caused by two very high loca t ion quotients i n
tobacco and rubber i n d u s t r i e s , employment conditions which are not
shared by any other c i t y . However, i t could be s a i d , geographically
speaking, that Granby's manufacturing structure i s s imi lar to several
other c i t i e s i n terms of i t s low d i v e r s i f i c a t i o n of industry .
In order to minimize this problem, only the most s i g n i f i c a n t
correlat ions were selected, as they more c l e a r l y indicate general
s t ructural s i m i l a r i t i e s upon which to describe and analyze the manufactur
ing structure of Canadian c i t i e s . The observations used i n the comparison
of Canadian c i t i e s are thus to a certain extent a r b i t r a r i l y chosen, a l
though i t i s a s t a t i s t i c a l l y correct procedure. From this i t can be
See Table I, page 25,

54
pointed out that the following analysis i s of 'predominant c i t y manufac
turing s i m i l a r i t i e s , ' rather than an overall analysis of manufacturing
s i m i l a r i t y , " ^
Operational Definitions of Independent Variables
As the dependent variable i s a measure of association between two
c i t i e s , the values for a l l independent variables are taken for the same
pair of c i t i e s .
Size: The measure of size used i n testing the f i r s t hypothesis i s the
difference of total population i n thousands between the two c i t i e s i n 12
1961. This was found to be the best measure of size difference-sim i l a r i t y after experimentation with other versions of this variable. Relative Location:
Relative location, i n terms of location i n the heartland or
periphery and access to natural resources, i s d i f f i c u l t to quantify.
Dummy variables were used to overcome this d i f f i c u l t y and were defined
in the following manner:
11 A preliminary analysis revealed that a sample of 100 r - c o e f f i -
cients (city pairs), randomly drawn from the whole correlation matrix did not provide any significant relationships with the hypothesized variables. This j u s t i f i e s , empirically speaking, the use of the more significant r-coefficients or, i n other words, limiting the analysis to the 'predominant structural s i m i l a r i t i e s . '
12 Dominion Bureau of S t a t i s t i c s , Canadian Census 1961, (Ottawa 1965).

(a) the pair of c i t i e s take the value 1 i f both are located
i n the heartland, or both i n the periphery, and 0 i f they . 13 are not,
(b) The pair of c i t i e s take the value 1 i f both are accessible
resources and 0 i f they are not.
(c) The pair of c i t i e s take the value 1 i f both are accessible
to carboniferous resources and 0 i f they are not.
Accessibility to forest resources was defined as being within
50 miles of forested land and to carboniferous resources as being within
50 miles of a major o i l or coal producing f i e l d . ^
Other measures of relative location were included in preliminary
analysis but later excluded as they showed no relationship with the
dependent variables. These Included an e x p l i c i t measure of s i m i l a r i t y
i n accessibility to market potential and to transport systems and
'zoned' locations i n the periphery.
Historical Evolution: It i s f e l t that the date of ci t y incorporation offers an important
'benchmark' i n the economic development of Canadian c i t i e s . The measure of h i s t o r i c a l evolution used i n testing the last hypothesis i s the
See Chapter I I I for details of heartland and peripheral c i t i e s . The definition of heartland and periphery follows Maxwell (1965).
"^Forest and carboniferous resources are identified i n the Oxford Regional Economic Atlas U.S.A. and Canada, (Oxford 1967), pp. 76-77, pp. 92-93, and the distances are measured from the atlas.

difference i n years between the date of incorporation between the two ... 15 c i t i e s .
Tests of Hypotheses
Preliminary analysis was applied to test for the existence, nature and degree of the hypothesized relationships. Scatter plots of dependent against each independent variable did not reveal distinct linear relationships, A l l hypothesized variables are to some extent relevant i n the explanation of manufacturing s i m i l a r i t y , and i t i s l i k e l y that there are others. A logarithmic transformation of the c i t y incorporation differences reduced variance from the mean and thus produced a better ' f i t ' for this variable. Models 1 #1 and 1 #2 (page 57) show the relationship of logged r-coefficients to size difference, and to logged cit y incorporation difference: the relationship of the dependent variable to the 'dummy' independent variables cannot be shown sensibly on graphs and none are presented.
The five independent variables were subsequently treated simultaneously to determine the relationship between the r-coefficient and the hypothesized factors. To remove the p o s s i b i l i t y that one or more of the Independent variables are not significantly related with the dependent variable when variations i n the remaining variables have been
The dates of ci t y incorporation are taken from several editions of the Canada Year Book, (Ottawa), Chapter I I I , population.
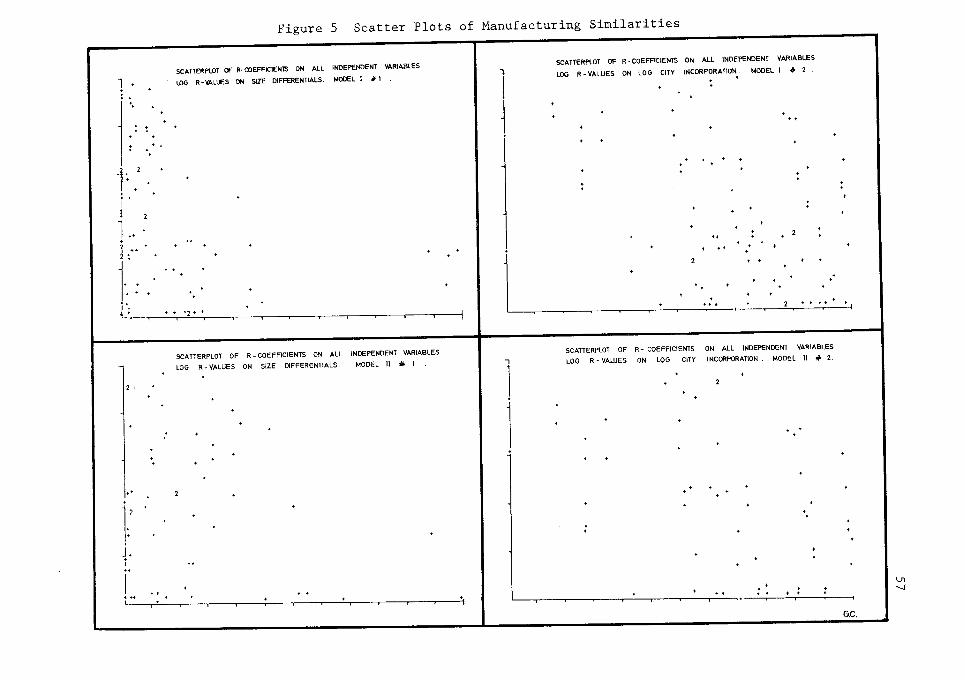
Figure 5 Scatter Plots of Manufacturing Similarities
SCATTERPLOT OF R-COEFFIC1ENTS ON ALL INDEPENDENT VARIABLES
LOG R-VALUES ON SIZE DIFFERENTIALS. MODEL 1 #1 .
SCATTERPLOT OF R-COEFFICIENTS ON ALL INDEPENDENT VARIABLES
LOG R- VALUES ON LOG CITY INCORPORATION . MODEL 1 # 2 .
SCATTERPLOT OF R - COEFFICIENTS ON ALL INDEPENDENT VARIABLES
LOG R-VALUES ON SIZE DIFFERENTIALS MODEL II * 1 .
SCATTERPLOT OF R- COEFFICIENTS ON ALL INDEPENDENT VARIABLES
LOG R - VALUES ON LOG CITY INCORPORATION. MODEL II # 2.
J.
G.C.
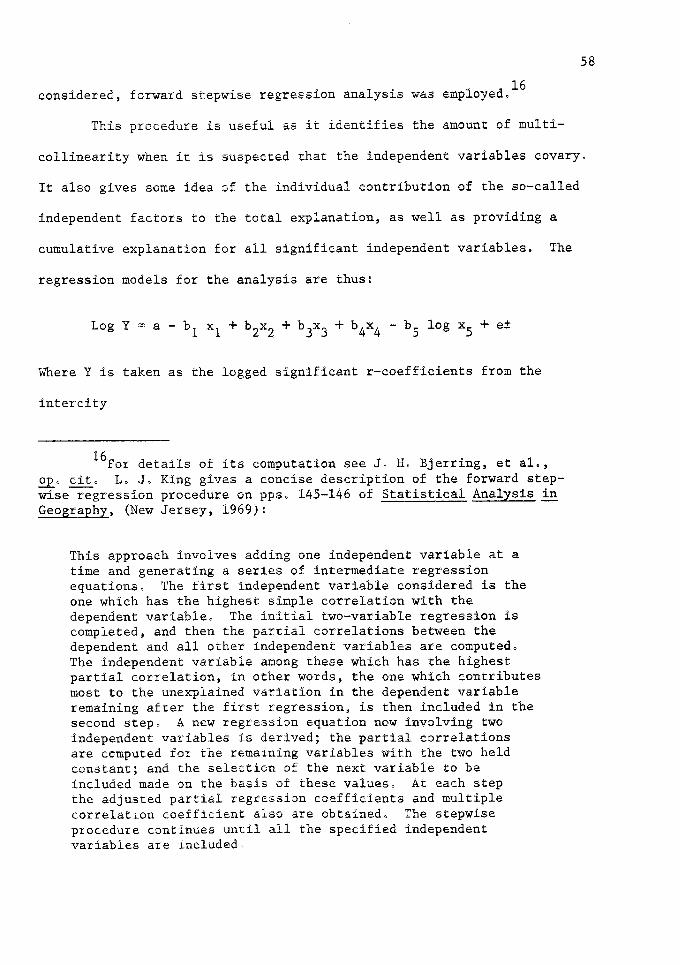
considered, forward stepwise regression analysis was employed."1""
This procedure i s useful as i t identifies the amount of multi-
c o l l i n e a r i t y when i t i s suspected that the independent variables covary
It also gives some idea of the individual contribution of the so-called
independent factors to the total explanation, as well as providing a
cumulative explanation for a l l significant independent variables. The
regression models for the analysis are thus:
Log Y = a - b 1 + ^2 X2 + ^3*3 + ^4 X4 " ^5 "*"°§ x5 + e ±
Where Y i s taken as the logged significant r-coefficients from the
int e r c i t y
1 DFor details of i t s computation see J. H. Bjerring, et a l . , op. c i t . L. J , King gives a concise description of the forward stepwise regression procedure on pps. 145-146 of S t a t i s t i c a l Analysis i n Geography, (New Jersey, 1969):
This approach involves adding one independent variable at a time and generating a series of intermediate regression equations. The f i r s t independent variable considered i s the one which has the highest simple correlation with the dependent variable. The i n i t i a l two-variable regression i s completed, and then the pa r t i a l correlations between the dependent and a l l other independent variables are computed. The independent variable among these which has the highest p a r t i a l correlation, in other words, the one which contributes most to the unexplained variation in the dependent variable remaining after the f i r s t regression, i s then included i n the second step. A new regression equation now involving two independent variables i s derived; the p a r t i a l correlations are computed for the remaining variables with the two held constant; and the selection of the next variable to be included made on the basis of these values. At each step the adjusted p a r t i a l regression coefficients and multiple correlation coefficient also are obtained. The stepwise procedure continues u n t i l a l l the specified Independent variables are included.
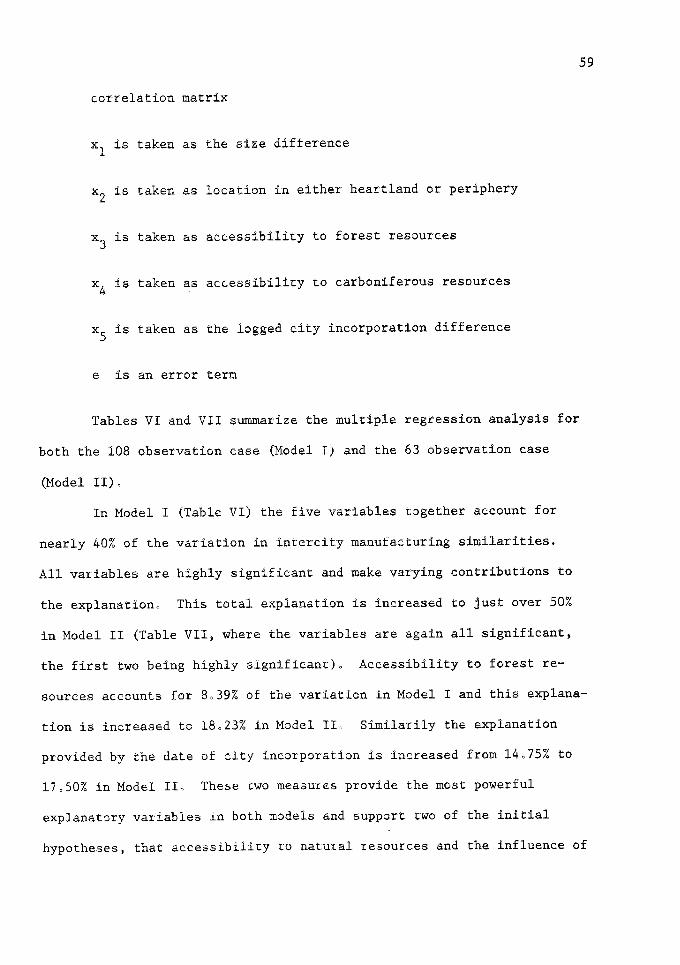
59
correlation matrix
x^ i s taken as the size difference
x^ i s taken as location i n either heartland or periphery
x^ i s taken as accessibility to forest resources
x^ i s taken as access i b i l i t y to carboniferous resources
x^ i s taken as the logged c i t y incorporation difference
e i s an error term
Tables VI and VII summarize the multiple regression analysis for
both the 108 observation case (Model I) and the 63 observation case
(Model I I ) .
In Model I (Table VI) the five variables together account for nearly 40% of the variation in intercity manufacturing s i m i l a r i t i e s . A l l variables are highly significant and make varying contributions to the explanation. This total explanation i s increased to just over 50% in Model I I (Table VII, where the variables are again a l l significant, the f i r s t two being highly significant). Accessibility to forest resources accounts for 8.39% of the variation i n Model I and this explanation i s increased to 18,23% in Model I I , Similarily the explanation provided by the date of cit y incorporation i s increased from 14,75% to 17,50% i n Model I I , These two measures provide the most powerful explanatory variables i n both models and support two of the i n i t i a l hypotheses, that accessibility to natural resources and the influence of

60
TABLE-VI
MODEL I STEPWISE REGRESSION OF 108 OB&. AT 95% C. L . (Variables l i s t e d i n order of entry into model)
Variables Relationship Cumulative RSQ
Addi t ion to RSQ
Sy
Y with x 5 C i t y incorporation Inverse 14,75 14.75 0.0908
A c c e s s i b i l i t y to forest resources Direct 23,14 8.39* 0.0866
x^ Size Inverse 28,99 5,85* 0.0837
x^ Location i n heartland/ periphery Direct 34,63 5.65 0.0807
x^ A c c e s s i b i l i t y to carboniferous resources Direct 39,39 5,75* 0.0781
TOTAL 39,39 39.39
* S ignif icant at 99% C, L .
Log Y = -0.1597 - 0,0660 log x $ + 0,0706 x 3
-0,0001 X ; L + 0.0616 x 2 + 0,1315

61
TABLE VII
MODEL II STEPWISE REGRESSION OF 63 OBS. AT 95% C. L . (Variables l i s t e d i n order of entry into model)
Variables Relationship Cumulative RSQ
Addit ion to RSQ
Sy
Y with A c c e s s i b i l i t y to forest resources Direct 18.23 18.23* 0.0650
x 5 C i t y Incorporation Inverse 35.73 17.50* 0.0581
*2 Location i n heartland/ periphery Direct 41.59 5.86 0.0559
x^ A c c e s s i b i l i t y to carboniferous resources Direct 47.13 5.54 0.0536
x^ Size Inverse 50.65 3.52 0.0523
TOTAL 50.65 50.65
* S ignif icant at 99% C. L ,
Log Y = -0.1332 + 0.0750 x 3 - 0.0478 log x 5
+0.0583 x 2 + 0.0872 x 4 - 0.0001 x 1

62
h i s t o r i c a l factors can help i n explaining in t e r c i t y manufacturing
s i m i l a r i t i e s , The i n i t i a l hypotheses are also a l l supported by the
direction of the regression relationships of the remaining independent
variables, although their individual contribution to the t o t a l explan
ation i n either case Is not high. Except for a decrease i n the
explanatory power of size i n Model I I , the hypothesized independent
variables of size, location i n heartland or periphery, and ac c e s s i b i l i t y
to carboniferous resources add approximately 5%% each to the t o t a l 17
explanation. Before making any further geographical inferences,
analysis of the regression residuals may suggest additional explanatory
variables, or the inadequacy of the existing ones. Analysis of Residuals:
Analysis of residuals by conventional mapping techniques i s d i f f i c u l t , as the residual value i s always a measure between a pair of c i t i e s . Tables VIII and IX summarize the unexplained variance i n the models by breaking down the residuals into quartiles. Evaluation of these shows that the unexplained variance i s distributed f a i r l y evenly, and there i s l i t t l e marked deviation from the average relationship. Furthermore, the even distribution of positive and negative residuals (in other words, under prediction and over prediction of the average relationship) do not indicate any serious inconsistency i n the model. These points would suggest that the hypothesized independent variables
The increase in total explanation i n Model II should be noted as i t suggests that the use of the more significant correlations, or observations, permits a more powerful explanation (see footnote 11, p. 54).
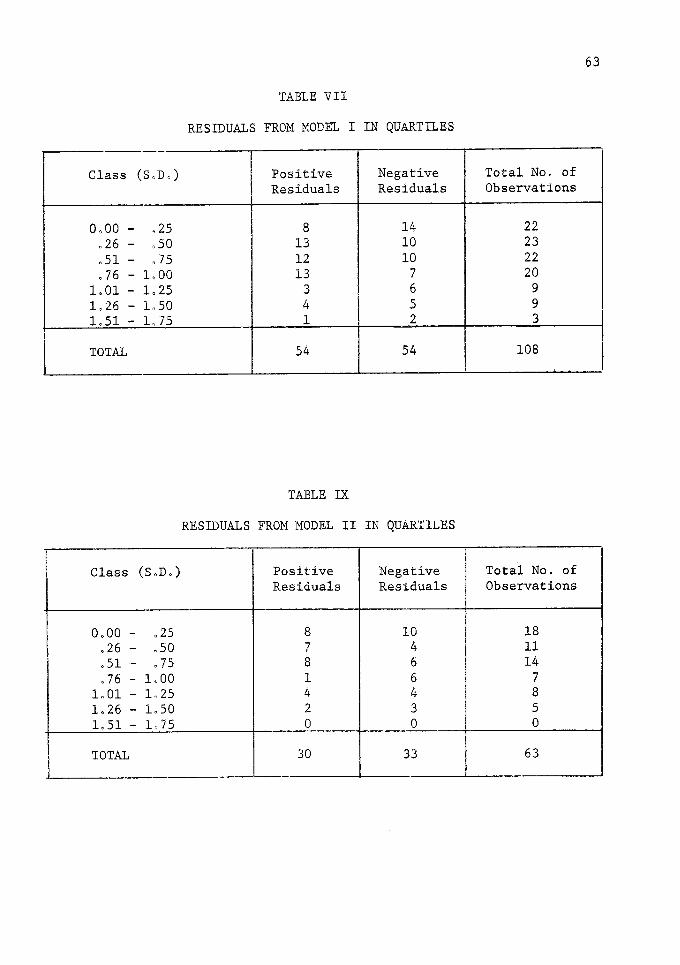
63
TABLE V I I
RESIDUALS FROM MODEL I IN QUARTILES
Class (S,D,) P o s i t i v e Negative Total No. of Class (S,D,) Residuals Residuals Observations
0,00 - ,25 8 14 22 .26 - .50 13 10 23 .51 - ,75 12 10 22 ,76 - 1,00 13 7 20
1,01 - 1,25 3 6 9 1.26 - 1,50 4 5 9 1,51 - 1.75 1 2 3
TOTAL 54 54 108
TABLE IX
RESIDUALS FROM MODEL I I IN QUARTILES
I Class (S.D,) P o s i t i v e Negative T o t a l No. of Residuals Residuals Observations
0,00 - ,25 8 10 18 .26 - .50 7 4 11 ,51 - .75 8 6 14 . 7 6 - 1 . 0 0 1 6 7
1.01 - 1,25 4 4 8 1,26 - 1.50 2 3 5 1,51 - 1.75 0 0 0
TOTAL 30 33 63
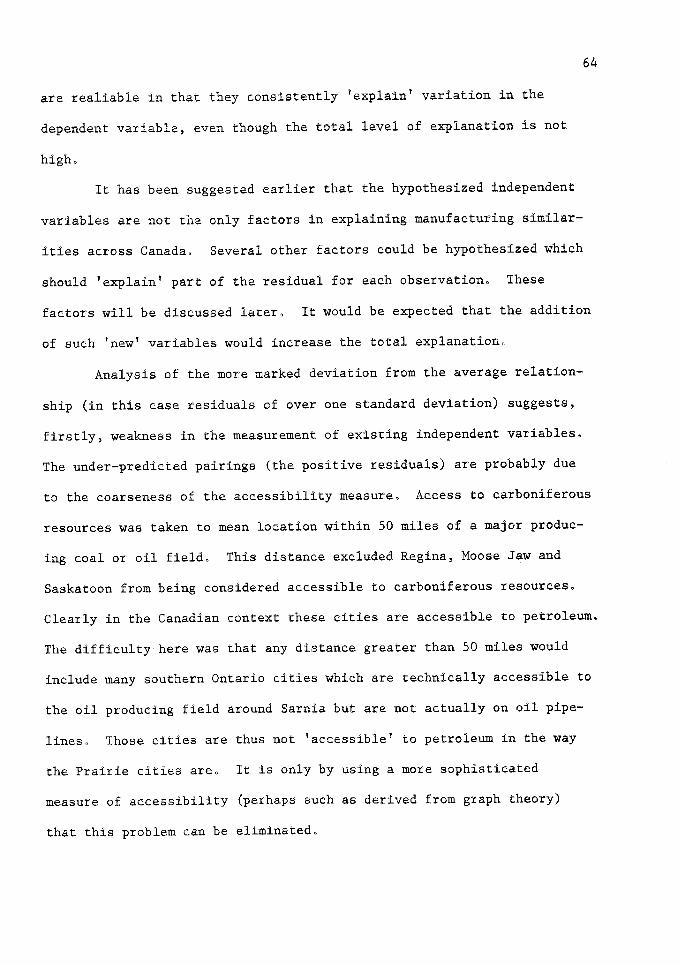
64
are realiable i n that they consistently 'explain' variation i n the
dependent variable, even though the total level of explanation i s not
high.
It has been suggested earlier that the hypothesized independent variables are not the only factors i n explaining manufacturing similari t i e s across Canada. Several other factors could be hypothesized which should 'explain' part of the residual for each observation. These factors w i l l be discussed later. It would be expected that the addition of such 'new' variables would increase the total explanation.
Analysis of the more marked deviation from the average relationship (in this case residuals of over one standard deviation) suggests, f i r s t l y , weakness in the measurement of existing independent variables. The under-predicted pairings (the positive residuals) are probably due to the coarseness of the access i b i l i t y measure. Access to carboniferous resources was taken to mean location within 50 miles of a major producing coal or o i l f i e l d . This distance excluded Regina, Moose Jaw and Saskatoon from being considered accessible to carboniferous resources. Clearly i n the Canadian context these c i t i e s are accessible to petroleum. The d i f f i c u l t y here was that any distance greater than 50 miles would include many southern Ontario c i t i e s which are technically accessible to the o i l producing f i e l d around Sarnia but are not actually on o i l pipelines. Those c i t i e s are thus not 'accessible' to petroleum i n the way the Prairie c i t i e s are. It i s only by using a more sophisticated measure of accessibility (perhaps such as derived from graph theory) that this problem can be eliminated.

Tables X and XI l i s t the marked deviations i n terms of c i t y
pairs, Apart from the weakness just mentioned, i t i s , i n fact, not
easy to spot additional explanations for the residuals. The over-
predicted pairings (the negative residuals) do suggest that some measure
of provincial or regional capitals may provide a p a r t i a l explanation.
This i s partly a reflection of the higher location quotients i n the
printing and publishing S,I,C. category i n such towns that are associated
with a provincial capital, or large university or regional capital
function.
Qualifications to a Geographical Analysis:
Further analysis of the regression models i s necessary i n order to validate their geographical implications. This can be partly done by evaluation of the correlation coefficients between the hypothesized independent variables. Tables XII and XIII show the correlation half-matrix for the 'independent' variables for Models I and I I respectively. It can be seen that c i t y incorporation i s not correlated to any degree with the other variables. Location i n the heartland or periphery i s somewhat correlated with size and with accessibility to forest and carboniferous resources (although not significantly) i n Model I, In Model II relative location i s significantly correlated with accessibility to carboniferous resources.
These multiple correlations mean that i t i s impossible to ascribe with any precision the exact amount of geographical 'explanation' that these variables add to the total explanation. This could be expected;

66
TABLE X
SIGNIFICANT RESIDUALS FROM MODEL I (OVER X.SJD.)
City Pair Type of Residual
Calgary - Halifax Positive
Calgary - Regina Positive
Calgary - St. John Positive
Calgary - Saskatoon Positive
Calgary - Moose Jaw Positive
Halifax - Regina Positive
Halifax - Moose Jaw Positive
Sudbury - Sydney Positive
Vancouver - Regina Negative
Winnipeg - Regina Negative
Winnipeg - St, John's Negative
Winnipeg - Moncton Negative
Edmonton - St. John's Negative
Calgary - St. John's Negative London - B e l l e v i l l e Negative
Victoria - St. John Negative
St, John - St, John's Negative
Saskatoon - Sarnia Negative Sherbrooke - Welland Negative
Kingston - Trois Rivieres Negative
Kingston - Shawinigan Negative [

67
TABLE XI SIGNIFICANT RESIDUALS FROM MODEL I I (OVER l.S.D.)
City Pair Type of Residual
Calgary - Halifax Positive
Calgary - Regina Positive
Calgary - St. John Positive
Calgary - Saskatoon Positive
Calgary - Sarnia Positive
Halifax - Moose Jaw Positive
Winnipeg - Halifax Negative
Halifax - Moncton Negative
Kitchener - Sherbrooke Negative
St. John - Port Arthur/Fort William Negative
Sherbrooke - Brantford Negative
Saulte Ste. Marie - Welland Negative
Guelph - B e l l e v i l l e Negative

68
TABLE XII
CORRELATION COEFFICIENTS OF INDEPENDENT VARIABLES IN MODEL I
Variable Mean SD X l x 2 X 3 X4
x 5
X l 220.0 346,2 1,000
x 2 0.7222 ,4500 0.1748 1,000
x 3 0.1204 ,3269 -0.0648 0.1659 1.000
X 4 0,0278 ,1651 -0,0236 -0.1468 - .0625 1.000
x5 1,380 ,5178 -0,0457 -0.1551 0.0515 -0.0740 1.000
Signif i cant r = ,195 at 95% C L .
Signif icant r - .254 at 99% C L .
TABLE XIII
CORRELATION COEFFICIENTS OF INDEPENDENT VARIABLES IN MODEL II
Variable Mean SD x l X 2 X 3 x 4
x 5
x l 128.5 144.7 1.000
x 2 0.7937 0,4079 0.0866 1.000
x 3 0.1429 0.3527 0.0575 0.2082 1.000
x 4 0.0476 0,2147 0,0678 -0.2543 -0.0913 1.000
x 5 1.290 0,5685 0.0509 -0.0410 0.0007 - ,0538 1.000
Signif icant r = .250 at 95% C L ,
Signif icant r =* .325 at 99% C L .

69
for example, the heartland/periphery concept i s partly derived from the 'accessibility to natural resources,' which characterizes the periphery. Thus there are essentially two overlapping measures of ac c e s s i b i l i t y i n the models, However, i t has been pointed out above that location i n the heartland or periphery has many other influences upon manufacturing s i m i l a r i t i e s , which are not measured by accessibility to natural resources. It i s thus important to try to separate out these two aspects of relative location.
Forward stepwise regression to some extent clears up this problem by eliminating part of the variance due to a particular variable at each step. However, much depends on the choice of variables to include a step-model and the strategy of variable entry into the model. In this analysis 'free entry' was allowed, but the choice of the most s t a t i s t i c a l l y s i g nificant variable to start the regression model does not necessarily make the most geographical sense. For this analysis i t probably would be more val i d to specify the order of entry of variables and to calculate the regression s t a t i s t i c s with the specific a c c e s s i b i l i t y measures preceding the location to heartland or periphery measure. This procedure would, thus, put the more simple geographical concept, v i z . , accessibili t y to natural resources, ahead of the more complex one, v i z . , location i n the heartland or periphery. However, this s t i l l does not necessarily make geographical sense, although i t helps to eliminate the p o s s i b i l i t y of one variable explaining more than i t should. Accessibility to forest resources enters before location i n the heartland or periphery in Model I and after i t in Model I I , with accessibility to carboniferous
resources coming after the location measure i n both models. For this reason, i t i s impossible to ascribe more than an approximate value to the influence of these variables on c i t y functional s i m i l a r i t y . The problem w i l l remain u n t i l location i n the heartland or periphery and areas i n resources etc., can be operationalized i n alternate and non-overlapping ways.
Another problem concerns the correlation of the five hypothesized independent variables with similar or different explanatory measures not e x p l i c i t l y considered. It i s impossible to test what the independent variable may actually measure, i n addition to what they hypothetically measure. Some investigation of this problem has been attempted for the accessibility measures, where, in addition to the e x p l i c i t l y tested variables, a c c e s s i b i l i t y to metallic resources and to s a l t water was correlated also. It was found that accessibility to forest resources
was significantly correlated with accessibility to metallic resources 18
and to salt water. The hypothesized variable of a c c e s s i b i l i t y to forest resources thus reflects more than the influence of such resources upon the r-coefficient. To some extent, accessibility to mineral resources and/or salt water i s surreptitiously included, and could be explaining part of the variation in the r-coefficients explained by accessibility to forest resources. As the correlation coefficients are
The correlation coefficients between accessibility to forest resources and metallic resources and salt water were computed at 0.2613 and 0,5062 respectively for Model I and 0,311 and 0.4518 respectively for Model I I ,
71
not high, the amount of explanation the former could add may be
insignificant»
Summary
The two regression models provide a p a r t i a l explanation for
observed s i m i l a r i t i e s i n the Canadian urban manufacturing system. The
relationship between inter-urban manufacturing s i m i l a r i t i e s and the
hypothesized influences of size, relative location and h i s t o r i c a l
evolution i s not a simple linear function, and consequently multiple
regression techniques and transformed data were employed to describe i t .
The to t a l variance reduction, while not high, offered a consistent
p a r t i a l explanation for s i m i l a r i t i e s i n the manufacturing structure of
Canadian c i t i e s . The most important factors affecting c i t y s i m i l a r i t y
appeared to be accessibility to natural resources and h i s t o r i c a l
advantages; other factors of location and size were less important but
were related to inter-city manufacturing s i m i l a r i t i e s i n the expected
manner. The concluding chapter w i l l point to several ways i n which a
higher level of explanation could be attained.
CHAPTER V
CONCLUSIONS
The overall purpose of the investigation was to provide new
insights into the Canadian urban system, through analysis of economic
a c t i v i t i e s at the inter-urban scale. This has been p a r t i a l l y achieved
by limiting investigation to the analysis of manufacturing industries
of the forty-one Canadian c i t i e s of over 30,000 i n 1961. It i s possible
to replicate this investigation for a wider range of economic a c t i v i t i e s .
This thesis then, offers a methodological contribution to the analysis
of urban systems as well as a substantive contribution to Canadian
urban economic geography. In methodological terms, this investigation contains elements
of the traditional classification-oriented and economic base approaches to urban economic functional analysis. It i s suggested that the approach taken here, through the urban system, provides a more productive analysis of inter-urban economic functions, The purpose of the correlation and bonding techniques employed i n Chapter I I I was to establish a valid and reliable structure of manufacturing similari t i e s upon which to base further analysis. The grouping of c i t i e s which was consequently established can only be viewed i n terms of the purpose of this further analysis. This analysis i s limited to the investigation of the relationships between the predominant manufacturing s i m i l a r i t i e s and various locational factors. Forward stepwise regression was considered an appropriate s t a t i s t i c a l procedure for the purpose of investigating these relationships.

73
The foregoing statements point to the consciously l i m i t e d scope
of the i n v e s t i g a t i o n . Other s t a t i s t i c a l techniques, such as facto r
analysis and mu l t i p l e discriminant a n a l y s i s , could provide more or other
i n s i g h t s into the structure of urban manufacturing i n Canada, One major
weakness i n t h i s i n v e s t i g a t i o n i s the d i f f i c u l t y i n i n t e r p r e t i n g the
40 x 40 I n t e r - c i t y c o r r e l a t i o n matrix. This matrix summarizes a l l
i n t e r - c i t y manufacturing s i m i l a r i t i e s but the d i f f i c u l t y of i n t e r p r e t i n g
the low (non-significant) c o r r e l a t i o n s has been pointed out.
I t was found that the s t a t i s t i c a l l y s i g n i f i c a n t c o r r e l a t i o n s were
more r e a d i l y interpreted, and that the s t r u c t u r a l associations of
manufacturing which were derived from them agreed with other empirical
f i n d i n g s . Manufacturing at the inter-urban l e v e l i n Canada can be
thought of In center-periphery terms. The i n v e s t i g a t i o n revealed the
existence of eight classes or sets and f i v e d i s t i n c t types of urban
manufacturing centres. Four of these types (A, B, D and E) are re l a t e d
to l o c a t i o n a l f a c t o r s , and the remaining one (C) i s ' s t a t i s t i c a l ' , i , e . ,
i s caused by grouping a l l employment i n transportation equipment i n the
same labor force category of the Canadian Census, Two of these types of
manufacturing centres (A and B) are termed 'peripheral', the others (part
of a complex group of s e t s ) , are termed 'Heartland', Most of the
peripheral c i t i e s (type A) are characterized by possession of a s i m i l a r
range of regional resource based i n d u s t r i e s , but a group of f r o n t i e r
i n d u s t r i a l c i t i e s (of type B) s p e c i a l i z i n g only i n primary metal production
See Table I I , page 29,
i s also diseemable. Heartland c i t i e s either have a f a i r l y diversified
industrial structure (type E) or specialize i n a few non-regional
resource based industries (types C and D), It i s these heartland c i t i e s
that form the 'group of sets' of c i t i e s similar i n industrial character,
but different i n details of their industrial mix. Table XIV, for
example, indicates that the number of significant correlations i s
weighted towards the periphery c i t i e s . This i s because the periphery
c i t i e s have, i n s t a t i s t i c a l terms, a more similar manufacturing 'mix'
than that of the heartland c i t i e s , In geographical terms, however,
many of the heartland c i t i e s have a similar manufacturing character
( i . e . , they are specialized i n two or three different industry cate
gories) but their specialization makes them individually unique i n
functional terms. Consequently the product-moment correlation co
efficients are usually non-significant and such cit y pairs are not
included i n the later analysis, This basis weakness i n the dependent variable must be kept i n
mind i n interpreting this study although i t does not invalidate the explanation of the 'observed' manufacturing s i m i l a r i t i e s . Thus, i n the comparative part of the study i t was found that location to natural resources and the influence of h i s t o r i c a l factors, such as i n i t i a l
advantage and i n e r t i a , were the chief factors of those considered found 2
associated with inter-city manufacturing s i m i l a r i t i e s .
See Tables VI and VII, pps, 60, 61,

75
TABLE XIV
RATIO OF POSSIBLE TO ACTUAL SIMILARITIES (SIGNIFICANT CORRELATIONS) IN THE
HEARTLAND AND PERIPHERY
No. of C i t i e s
Possible S i m i l a r i t i e s
No, of S i g n i f i cant S i m i l a r i t i e s at
95%
Approx, Ratio
No, of S i g n i f i cant S i m i l a r i t i e s at
99%
Approx, Ratio
S i m i l a r i t i e s between:
C i t i e s of Heartland 22 231 18 13:1 9 26:1
C i t i e s of Periphery 18 153 60 3:1 41 4:1
C i t i e s of Heartland and Periphery 396 30 13:1 13 30:1
TOTAL: 40 780 108 7:1 63 12:1

A higher level of explanation for i n t e r - c i t y s i m i l a r i t i e s could
be attained i n two ways, F i r s t , the coarseness of the original data,
especially i n the transportation equipment category, caused an i n i t i a l
l imitation on the potential explanation. The definition and measurement
of several of the independent variables (the measures of relative
location) was also crude and s i m i l a r i l y detracted from the potential 3
explanation. Improvement i n these data should result i n an increased level of explanation. Second, i t was stated at the beginning of the analysis of i n t e r - c i t y manufacturing s i m i l a r i t i e s (Chapter IV) that an understanding of the tot a l relationship of manufacturing industry to geographical conditions would be impossible. Several factors were ignored at that stage, which would probably add to the general explanation, although at what level the writer i s not sure. The reason for their exclusion was the d i f f i c u l t y of obtaining accurate data on them. These factors would include 'the economic shadow effect', a v a i l a b i l i t y of sites, labor and capital and government influence. 4 It i s premature to suggest that the achievement of a very high level of explanation i s possible. There i s much evidence to show that the location of industry i s not a simple matter, even though the several factors mentioned above may play a large role in influencing the location decision and thus the similarity of c i t i e s that are the focus of manufacturing a c t i v i t i e s .
For comments on these data problems see pages 33 and 69. D. Ray, i n The Spatial Structure of Regional Development and
Cultural Differences - A Factorial Ecology, 1968, considers economic shadow and a v a i l a b i l i t y of energy as two important factors i n influencing the location of manufacturing ac t i v i t y across Canada,

77
Bibliography
A. Books
Ahmad, Q. Indian C i t i e s , Chicago Research Publications, Chicago: University of Chicago, Dept, of Geography, 1965,
Alexandersson, G, The Industrial Structure of American C i t i e s , Lincoln, Nebraska: University of Nebraska Press, 1956,
. Geography of Manufacturing, New Jersey, Prentice-Hall Inc,, 1967,
Berry, B, J, L, Essays on Commodity Flows and the Spatial Structure of the Indian Economy, Chicago Research Publications, Chicago: University of Chicago, Dept, of Geography, 1966,
° Theories of Urban Location, Commission on College Geography, Resource Paper No, 1., Washington D.C, Association of American Geographers, 1968,
Bunge, W. Theoretical Geography, Lund Studies i n Geography, Series C General and Mathematical Geography No, 1,, Lund: Gleerup, 1962,
Camu, P„, Z,W, Sametz and E, P, Weeks, Economic Geography of Canada. Toronto: Macmillan of Canada, 1964,
C h r i s t a l l e r , W, Central Places i n Southern Germany, (Trans, C W, Baskin), Prentice-Hall Inc., Englewood C l i f f s , New Jersey, 1966,
Garner, B, "Models of Urban Geography and Settlement Location," i n Ro Chorley & P, Huggett, (eds.) Models in Geography, London, Methuen & Co, Ltd,, 1967, p, 303,
Haggett, P, Locational Analysis i n Human Geography. London: Edward Arnold (Publishers) Ltd,,, 1965,
Hamilton, F, Ian, "Models of Industrial Location," i n R, Chorley & P, Haggett, (eds,.), Models in Geography, London: Methuen & Co. Ltd,, 1967, p- 361,
Higbee, E, The Squeeze, Toronto, George J, McLeod Ltd,, 1960,

78
Isard, W, Methods of Regional A n a l y s i s : An Introduction'to Regional Science, Cambridge, Mass.- The M, 1,1- Press, 1966,
King, L, J , S t a t i s t i c a l Analysis i n Geography. Englewood C l i f f s , New Jersey, P r e n t i c e - H a l l Inc, , 1969c
Lampard, E, "History of C i t i e s i n the Economically Advanced Areas," i n J , Friedmann and W, Alonsc, (eds,) Regional Development and Planning, Cambridge, Massachusetts, The M„I,X,T, Press, 1964,
Lithwiek, N,, and G Paquet, (eds,). Urban Studies: A Canadian Perspective, Toronto, Mettner Pubs,, 1968,
Losch, A, The Economics of Location, New Haven, Yale U n i v e r s i t y Press, 1954,
Moser, C. and W„ Scott, B r i t i s h Towns, London, O l i v e r and Boyd, 1961.
Murphy, R, The American C i t y , New York, McGraw-Hill Inc., 1966,
P e r l o f f , H„, et a l , Reg_Lons_, Resources and Economic Growth. Baltimore, John Hopkins Press, Resources for the Future Inc., 1960.
Pfouts, R. (ed,). The Techniques of Urban Economic Analysis. West Trenton, New Jersey> Chandler-Davis Publishing Co,, 1960,
P i t t s , F„ (ed.). Urban Systems and Economic Development, Eugene, Oregon, U n i v e r s i t y of Oregon Press, 1962,
Ray, D. M. "Urban Growth and the Concept of Functional Region," i n N, Lithwiek and G, Paquet (eds.) Urban Studies: A Canadian Perspective. Toronto, Methen P u b l i c a t i o n s , 1968,
Stone, L, 0. Urban Development i n Canada, Ottawa, Queens P r i n t e r s , 1967,
Stevens, B, and Bc Brackett^ Bibliography of I n d u s t r i a l Location. Bibliography Series No, 3, P h i l a d e l p h i a Regional Science Research I n s t i t u t e , 1967,
B, P e r i o d i c a l s
Alexander, J , "Basic-Nonbasle Concepts of Urban Economic Functions," Economic Geography, Vol, 30, (1954), pp, 246-261,
, "Location of Manufacturing: Methods cf Measurement," Annals oi the Association oi_ American Geographers Vol- 48 1X9587, pp 20-26,
79
Alexander, J, and J , Lindberg, "Measurements of Manufacturing: Coe f f i c i e n t s of C o r r e l a t i o n , " Journal t f Regional Science. Vol-. 3, (1961), pp, 71-81,
Ambrose, P, "Some Techniques for Measuring Change i n Employment Structures," T i j d s c h r i f t Voor Economische en Sociale Geografie, V o l , 58 (1967), pp, 76-81,
Aurousseau, M, "The D i s t r i b u t i o n of Population: A Constructive Problem," Geographical Review, V o l , I I (1921), pp, 563-592.
Berry, B, J , L, " C i t i e s as Systems w i t h i n Systems of C i t i e s , " Papers and Proceedings of the Regional Sciences A s s o c i a t i o n . V o l , 13, (1964), pp, 147-163,
Bluemenfeld, H, "The Economic Base of the Metropolis," Journal of the American I n s t i t u t e of Planners, V o l , 21, (1955), pp, 114-132,
Burton, I, "A Restatement o f the Dispersed C i t y Hypothesis," Annals of the Association of American Geographers, V o l , 53 (1963), pp, 285-9,
H a r r i s , C, "A Functional C l a s s i f i c a t i o n of C i t i e s i n the United States," Geographical Review, 33 (1943), pp, 86-99,
, "A Functional C l a s s i f i c a t i o n of C i t i e s , " Geographical B u l l e t i n , V o l , 7, (1965), pp. 79-104,
King, L. J , "Cross Sectional Analysis of Canadian Urban Dimensions: 1951-1961," Canadian Geography, V o l , 10, 1966, pp, 205-224.
Maxwell, J . "The Functional Structure of Canadian C i t i e s , A C l a s s i f i c a t i o n of C i t i e s , " Geographical B u l l e t i n , 17, (1965), p, 95,
Mo r r i s s e t t , I, "The Economic Structure of American C i t i e s , " Papers and P£_cceedings of the Regional Science Association, V o l , 4 (1968), pp, 239-256,
Nelson, H, "A Service C l a s s i f i c a t i o n of American C i t i e s , " Economic Geography, Vol, 31 (1955), pp, 189-210.
Pred, A, " I n d u s t r i a l i z a t i o n , I n i t i a l Advantage and American Metrop o l i t a n Growth," Geographical Review, V o l , 40, (1965), pp, 158-185
Roterus, V, and W, Calef, "Notes on the Basic-Nonbasic Employment Ratio," Economic Geography, V o l , 31 (1955), pp, 17-20,
8 0
Slater, D, "Trends i n Industrial Location in Canada," Resources for Tomorrow.. Vol-. 1 ( 1 9 6 1 ) , pp, 4 0 9 - U 7 ,
Smith, D, "A Theoretical Framework for Geographical Studies of Industrial Location," Economic Geography, Vol, 4 2 , ( 1 9 6 6 ) ,
pp, 9 5 - 1 1 3 ,
Smith, R, "Method and Purpose in Functional Town Classification," Annals of the Association of American Geographers, Vol, 5 5 , ( 1 9 6 5 ) , pp, 5 3 9 - 5 4 8 ,
Stewart, C, "The Size and Spacing of C i t i e s , " Geographical Review. Vol, 4 8 , ( 1 9 5 8 ) , pp, 2 2 2 - 2 4 5 ,
Ullman, E, and M, Dacey "The Minimum Requirements Approach to the Urban Economic Base," Papers and Proceedings of the Regional Science Association. Vol, 6 , ( 1 9 6 0 ) , pp- 1 7 5 - 1 9 4 ,
Von Boventer, E, "Towards a United Theory of Spatial Economic Structure," Pap_ers_ and Proceedings of the Regional Science Association, Vol, 1 0 , ( 1 9 6 3 ) , pp 1 6 3 - 1 8 7 ,
Ward, B. "City Structure and Interdependence," Papers and Proceedings c i the Regional Science Association. Vol, 1 0 , ( 1 9 6 3 ) , pp, 2 0 7 - 2 2 1 , '
C. Government Documents, Theses, Unpublished Papers,
Ballabon, M, "Area! Differentiations of the Manufacturing Belt i n Central Canada." Unpublished Ph,D, Dissertation, McGill University, Montreal, 1 9 5 6 ,
Bjerring, J,H„, J.R.H, Dempster and R, H, Hall, UJhC° TRIP, U,B,C, Computing Centre, 1968.
Canadian Council on Urban & Regional Research. Urban &_ Regional References, 1945-62_t Supplemental 1 9 6 3 2 6 4 , 1 9 6 5 - 6 7 . Ottawa,
Dominion Bureau of Statistics- Canada Census, 1961., Labour Force, Vol, I I I , Par II (Bulletin 2 and 3 ) , Ottawa. Dominion Bureau of S t a t i s t i c s , 1 9 6 3 .
Field, N. and D, Kerr- "Geographical Aspects of Industrial Growth in the Metropolitan Toronto Region," Unpublished Manuscript. Department cl Geography, University cf Toronto, 1 9 6 8 ,
Dominion Bureau oi Statistics. Canada Yearbook. Ottawa, Queen's Printer -
81
Leigh, R, "Aspects of Movement i n Urban Systems," Unpublished Manuscript, Department of Geography, University of B r i t i s h Columbia, 1969,
L i s t e r , R- "Relationships between Regional Manufacturing Growth and Its Structural Components in Central Canada, 1951-61," Unpublished M, A, Thesis, McGill University, Montreal, 1965.
Maxwell, J, "A Functional Classification of Canadian C i t i e s , " Unpublished M, A, Thesis, University of B r i t i s h Columbia, 1964,
Oxford Regional Economic Atlas, United States and Canada, Oxford, Clarendon Press, 1967,
Ray, D„ M, "The Spatial Structure of Regional Development and Cultural Differences: A Factorial Ecology of Canada, 1961," Paper presented at the Annual Regional Science Association Meeting, November, 1968,

TABLE OF LOCATION QUOTIENTS
Food
and
Beve
rage
s
Toba
cco
Prod
ucts
Ru
bber
In
dust
ries
Le
athe
r In
dust
ries
Te
xtil
e In
dust
ries
Kn
itti
ng
Mills
Clot
hing
In
dust
ries
Wo
od
Indu
stri
es
Furn
itur
e and
Figu
res
Pape
r and
alli
ed
Indu
stri
es
Printing.Pub
lishing
& Al
lied
Ind.
Primary
Meta
ls
Meta
l Fa
bric
atin
g Ma
chin
ery
Indu
stri
es
Tran
spor
ta
tion E
quip
ment
El
ectr
ical
Pr
oduc
ts
Non-metallic
Mineral
Prod
ucts
L 3 co CD +J rH O O 3 H r + O
4J <do CD O M
ftcjfv Chemical
Prod
ucts
Miscellan
eous
0.79 3.18 0.58 1.53 0.97 1.39 2.47 0.16 1.14 0.41 1.00 0.53 1.07 0.66 1.18 1.29 0.98 1.47 1.18 1.01 0.80 0.36 1.47 0.72 0.50 0.80 1.08 0.17 1.13 0.63 1.81 0.38 1.39 1.86 0.73 1.68 0.89 0.68 1.35 2.18 1.28 0.03 0.20 0.21 0.33 0.39 0.45 3.56 1.40 0.90 1.36 0.46 1.23 0.76 0.62 0.39 0.59 1.67 0.45 0.72 1.43 0.03 0.05 0.58 0.37 0.44 2.13 0.31 1.85 0.50 1.56 0.32 1.22 0.82 1.58 0.48 0.90 1.44 0.53 0.76 1.25 0.13 0.07 0.54 0.13 0.32 0.39 0.57 0.52 3.26 2.73 0.25 0.72 0.58 0.08 0.78 1.26 0.15 0.79 2.10 0.58 1.38 1.93 0.31 0.64 0.53 0.24 0.15 0.26 0.37 0.53 4.18 1.48 2.45 0.63 1.86 1.46 0.29 0.72 0.65 1.04 5.55 1.07 4.97 1.26 0.21 1.45 0.35 0.74 1.14 1.28 0.10 0.67 0.24 1.25 0.33 0.97 0.13 1.21 0.87 1.94 0.03 0.12 0.16 0.10 0.04 1.00 0.75 1.35 0.29 1.23 0.70 1.44 0.46 0.48 0.11 1.40 5.28 1.84 0.66 2.02 0.02 0.49 0.19 0.22 0.05 0.24 0.57 0.93 0.34 1.94 0.34 1.38 0.68 0.83 0.26 2.12 5.64 0.90 0.77 0.88 0.04 0.14 0.02 0.12 0.01 0.21 0.12 0.25 0.04 0.67 0.29 1.78 0.91 6.21 0.12 0.37 0.09 0.66 0.72 2.09 0.02 0.10 0.02 0.10 0.01 0.22 0.23 0.21 0.23 1.88 0.05 0.55 0.13 2.99 0.91 0.99 5.51 0.54 0.59 1.52 0.08 2.23 1.66 0.08 2.67 0.35 0.24 0.38 0.72 1.51 0.36 1.21 1.37 0.54 2.82 0.52 0.13 0.75 0.74 1.03 0.09 8.05 4.18 1.96 0.90 0.78 0.31 2.44 0.11 0.42 0.30 1.67 1.47 0.22 1.53 0.36 0.05 0.27 0.93 1.12 0.00 0.00 0.01 0.11 0.04 0.14 4.04 0.49 0.17 2.16 0.07 0.42 0.13 2.90 0.09 0.49 0.12 0.85 0.63 1.97 0.07 0.25 0.05 0.13 0.02 0.40 0.32 0.43 0.42 2.19 1.09 1.38 0.43 0.23 0.18 2.18 10.05 0.47 0.70 0.85 0.06 0.07 0.03 0.02 0.01 0.13 0.59 0.17 0.09 0.75 10.01 0.52 0.15 0.04 0.08 0.62 0.23 0.61 0.29 1.60 0.00 0.07 0.02 0.02 0.02 0.12 0.51 0.19 1.60 0.99 0.26 1.60 0.18 2.47 0.06 1.40 3.81 0.50 1.51 3.43 0.04 0.06 0.03 0.24 0.04 0.36 0.48 0.73 0.12 2.10 0.09 0.94 0.61 0.04 0.15 1.58 2.71 0.37 0.75 3.13 0.00 0.03 0.05 1.14 0.13 0.36 0.58 0.32 0.21 1.97 0.30 0.76 0.55 0.78 0.02 0.50 0.46 0.74 0.85 0.44 0.01 0.22 0.11 0.33 1.35 0.12 0.16 0.21 1.96 0.40 0.25 2.13 0.55 4.75 0.71 0.53 0.05 0.33 0.94 0.75 0.22 3.03 1.33 7.14 3.87 0.83 0.23 0.42 0.42 0.90 0.53 0.80 3.12 0.03 0.10 0.24 0.14 0.28 1.05 0.13 0.00 0.89 2.97 0.16 0.04 0.08 0.09 0.48 0.08 0.70 1.23 0.45 0.08 7.55 0.13 1.40 0.00 0.17 0.15 0.62 0.07 0.91 0.31 2.44 1.96 0.37 0.06 0.36 0.78 0.47 0.19 0.80 8.31 0.69 0.77 0.83 0.04 1.05 2.03 0.54 0.04 0.03 0.80 5.75 0.03 0.07 0.21 0.48 0.09 0.85 5.44 0.30 0.10 0.90 0.19 1.09 0.09 0.86 0.27 0.46 0.08 0.03 0.42 4.06 1.06 1.24 0.45 0.36 4.25 0.54 1.80 0.48 0.13 0.03 0.98 0.63 0.14 0.23 0.25 0.22 0.00 0.03 0.01 0.02 0.00 0.03 0.02 0.14 0.00 0.47 0.45 0.77 0.07 0.61 0.03 1.62 23.24 9.07 0.13 0.94 0.07 0.08 0.05 0.93 0.11 0.07 0.25 0.16 0.50 0.55 0.02 0.20 1.30 1.90 6.35 0.97 0.11 0.14 1.83
Port Arthur/Fort William 0.89 0.05 0.01 0.04 0.31 0.01 0.08 0.67 0.33 6.35 0.91 0.05 0.52 0.21 2.04 0.04 0.62 0.89 0.21 0.21 2.23 0.00 0.24 0.05 0.53 0.04 0.13 0.46 0.41 0.19 1.76 0.20 0.65 0.08 3.98 0.15 0.44 0.09 0.59 0.06 0.41 0.00 0.00 0.01 7.90 0.01 0.75 0.03 0.13 4.44 0.37 0.10 0.24 0.06 0.15 0.06 0.35 0.05 2.29 0.49 0.23 0.02 0.01 0.01 0.03 0.00 0.05 0.89 0.07 1.13 0.40 11.57 0.37 0.03 0.04 0.01 0.04 0.09 0.17 0.06 0.59 0.50 0.31 0.71 2.44 1.67 1.82 0.12 0.39 0.14 0.57 1.22 1.51 0.70 0.07 4.52 0.94 0.03 0.44 0.70 0.29 0.03 3.48 0.12 3.02 0.87 0.14 0.03 0.08 0.10 0.26 8.16 1.81 0.91 0.11 0.68 0.26 0.01 0.91 0.06 3.79 0.10 0.00 0.00 0.16 0.51 0.15 0.36 0.57 0.01 1.88 0.03 1.19 0.44 0.36 0.25 1.21 0.22 0.15 0.81 0.61 0.00 0.17 0.01 0.01 0.00 0.03 0.21 0.06 0.04 0.55 11.31 1.14 0.02 0.14 0.01 0.19 0.19 0.29 0.07 2.90 0.00 0.00 0.03 0.33 0.00 1.11 0.66 0.18 0.02 1.34 0.26 0.24 0.30 0.74 0.02 0.90 13.52 0.39 0.18 0.25 0.04 0.02 0.65 1.75 0.41 0.87 0.29 0.18 1.59 0.21 1.69 0.09 0.00 0.03 0.67 1.63 0.06 8.75 0.14 0.93 0.08 0.07 0.57 0.01 0.11 0.25 0.30 0.43 0.58 0.88 9.67 0.45 0.06 0.01 0.06 0.63 0.17 0.12 0.17 0.61 14.23 8.90 0.04 6.33 1.35 0.63 0.14 0.56 0.10 0.46 0.03 1.12 0.07 0.03 2.52 0.12 0.10 0.20 1.11 1.11 0.00 0.12 0.36 0.36 0.82 0.72 0.32 0.20 0.04 0.55 0.55 1.14 1.84 0.09 5.22 2.12 0.11 0.80 1.67