Probabilistic Liquefaction Hazard Analysis for Four Canadian Cities
12
Probabilistic Liquefaction Hazard Analysis for Four Canadian Cities by Katsuichiro Goda, Gail M. Atkinson, Jim A. Hunter, Heather Crow, and Dariush Motazedian Abstract Changes to building codes in the last decade, lowering the probability at which design ground motions for geotechnical applications are defined, have led to an urgent need for a probabilistic approach/tool for liquefaction potential assessment. We propose a consistent approach for probabilistic liquefaction hazard analysis (PLHA) that is based on probabilistic seismic hazard analysis and incorporates a reliability- based liquefaction potential evaluation method based on shear-wave velocity data. The method directly takes the joint probability distribution of peak ground accelera- tion and moment magnitude into account. We demonstrate the method for four Canadian cities, employing our interim updated seismic hazard models for eastern and western Canada. Using the developed method and representative site profiles, PLHA is implemented for four major cities across Canada with the aim of investigating the impact of regional seismic characteristics on liquefaction hazard assessment. Sensitivity analysis indicates that different magnitude ranges of dominant contributing seismic events have significant impact on the extent of liquefaction hazard. More specifically, for a given seismic excitation level, the relatively high hazard contribu- tions from small-to-moderate earthquakes in eastern Canada leads to less significant liquefaction potential, in comparison with similar sites in western Canada. Introduction Ground failure due to large earthquakes may have disastrous consequences on structures and infrastructure, particularly building foundations and buried pipes. One of the major ground failure phenomena is soil liquefaction, which has been observed and studied for decades (1964 Niigata earthquake, 1989 Loma Prieta earthquake, 1995 Kobe earthquake, 1999 Chi-Chi earthquake, and 1999 Ko- caeli earthquake; see Kramer and Elgamal, 2001 and Idriss and Boulanger, 2008). Seismic losses due to liquefaction can be extremely high. To mitigate liquefaction-related distur- bances, geotechnical engineers have developed methods to evaluate liquefaction potential and guidelines to protect im- portant structures (Youd et al., 2001; Kramer and Elgamal, 2001; Bird and Bommer, 2004; Idriss and Boulanger, 2008). Recent changes incorporated in seismic provisions of North American building codes, including the National Building Code of Canada (NBCC), have lowered the prob- ability at which design ground motions are defined. In the 2005 NBCC, design ground-motion levels are specified as a response spectrum having 2% probability of exceedance in 50 yr (i.e., return period of 2475 yr) (Adams and Halchuk, 2003). Earlier codes were based on ground motions with 10% probability of exceedance in 50 yr. Consequently, design ground-motion levels in terms of peak ground accel- eration (PGA) and spectral accelerations were increased from the 1995 NBCC to the 2005 NBCC. The changes have brought confusion and concern regarding liquefaction poten- tial assessment to the geotechnical community, as the design PGA levels at many locations were increased significantly (Finn and Wightman, 2007), implying higher required lique- faction resistance. One of the causes for the confusion can be attributed to the use of probabilistic ground-motion levels in a deterministic geotechnical method (Salloum, 2008). There are several methods that combine probabilistic ground motions with conventional liquefaction potential procedures, such as the stress-based simplified method of Seed and Idriss (1971) (e.g., Atkinson et al., 1984; Kramer and Mayfield, 2007; Finn and Wightman, 2007; Juang et al., 2008; Salloum, 2008). These methods typically utilize a seis- mic hazard curve in terms of PGA and deaggregation results, which are obtained from probabilistic seismic hazard analy- sis (PSHA), to account for the joint probability distribution of PGA and moment magnitude M of earthquake scenarios; both of which are key inputs in the stress-based simplified methods. We note that it is the unconditional liquefaction potential assessment that provides a complete picture of liq- uefaction hazard, taking all possible scenarios into account, rather than the conditional one (i.e., liquefaction potential evaluation carried out for a specific scenario or ground- motion level). For Canadian sites, such unconditional as- sessments are restricted by availability of seismic hazard information, as seismic hazard estimates and deaggregation 190 Bulletin of the Seismological Society of America, Vol. 101, No. 1, pp. 190–201, February 2011, doi: 10.1785/0120100094
-
Upload
independent -
Category
Documents
-
view
1 -
download
0
Transcript of Probabilistic Liquefaction Hazard Analysis for Four Canadian Cities

Probabilistic Liquefaction Hazard Analysis for Four Canadian Cities
by Katsuichiro Goda, Gail M. Atkinson, Jim A. Hunter,Heather Crow, and Dariush Motazedian
Abstract Changes to building codes in the last decade, lowering the probability atwhich design ground motions for geotechnical applications are defined, have led to anurgent need for a probabilistic approach/tool for liquefaction potential assessment. Wepropose a consistent approach for probabilistic liquefaction hazard analysis (PLHA)that is based on probabilistic seismic hazard analysis and incorporates a reliability-based liquefaction potential evaluation method based on shear-wave velocity data.The method directly takes the joint probability distribution of peak ground accelera-tion and moment magnitude into account. We demonstrate the method for fourCanadian cities, employing our interim updated seismic hazard models for easternand western Canada. Using the developed method and representative site profiles,PLHA is implemented for four major cities across Canada with the aim of investigatingthe impact of regional seismic characteristics on liquefaction hazard assessment.Sensitivity analysis indicates that different magnitude ranges of dominant contributingseismic events have significant impact on the extent of liquefaction hazard. Morespecifically, for a given seismic excitation level, the relatively high hazard contribu-tions from small-to-moderate earthquakes in eastern Canada leads to less significantliquefaction potential, in comparison with similar sites in western Canada.
Introduction
Ground failure due to large earthquakes may havedisastrous consequences on structures and infrastructure,particularly building foundations and buried pipes. One ofthe major ground failure phenomena is soil liquefaction,which has been observed and studied for decades (1964Niigata earthquake, 1989 Loma Prieta earthquake, 1995Kobe earthquake, 1999 Chi-Chi earthquake, and 1999 Ko-caeli earthquake; see Kramer and Elgamal, 2001 and Idrissand Boulanger, 2008). Seismic losses due to liquefaction canbe extremely high. To mitigate liquefaction-related distur-bances, geotechnical engineers have developed methods toevaluate liquefaction potential and guidelines to protect im-portant structures (Youd et al., 2001; Kramer and Elgamal,2001; Bird and Bommer, 2004; Idriss and Boulanger, 2008).
Recent changes incorporated in seismic provisions ofNorth American building codes, including the NationalBuilding Code of Canada (NBCC), have lowered the prob-ability at which design ground motions are defined. In the2005 NBCC, design ground-motion levels are specified asa response spectrum having 2% probability of exceedancein 50 yr (i.e., return period of 2475 yr) (Adams and Halchuk,2003). Earlier codes were based on ground motions with10% probability of exceedance in 50 yr. Consequently,design ground-motion levels in terms of peak ground accel-eration (PGA) and spectral accelerations were increased fromthe 1995 NBCC to the 2005 NBCC. The changes have
brought confusion and concern regarding liquefaction poten-tial assessment to the geotechnical community, as the designPGA levels at many locations were increased significantly(Finn and Wightman, 2007), implying higher required lique-faction resistance. One of the causes for the confusion can beattributed to the use of probabilistic ground-motion levels ina deterministic geotechnical method (Salloum, 2008).
There are several methods that combine probabilisticground motions with conventional liquefaction potentialprocedures, such as the stress-based simplified method ofSeed and Idriss (1971) (e.g., Atkinson et al., 1984; Kramerand Mayfield, 2007; Finn and Wightman, 2007; Juang et al.,2008; Salloum, 2008). These methods typically utilize a seis-mic hazard curve in terms of PGA and deaggregation results,which are obtained from probabilistic seismic hazard analy-sis (PSHA), to account for the joint probability distribution ofPGA and moment magnitude M of earthquake scenarios;both of which are key inputs in the stress-based simplifiedmethods. We note that it is the unconditional liquefactionpotential assessment that provides a complete picture of liq-uefaction hazard, taking all possible scenarios into account,rather than the conditional one (i.e., liquefaction potentialevaluation carried out for a specific scenario or ground-motion level). For Canadian sites, such unconditional as-sessments are restricted by availability of seismic hazardinformation, as seismic hazard estimates and deaggregation
190
Bulletin of the Seismological Society of America, Vol. 101, No. 1, pp. 190–201, February 2011, doi: 10.1785/0120100094

results are available only at a few return period levels for areference soil condition (National Earthquake HazardsReduction Program [NEHRP] site class C). This is indeeda significant limitation in extending the method to promotea performance-based earthquake engineering framework forliquefaction potential evaluation (Kramer and Elgamal,2001; Kramer and Mayfield, 2007).
This study aims at developing a consistent probabilisticmethod for liquefaction potential evaluation, which takesuncertainties in both seismic hazard (i.e., earthquake occur-rence and ground-motion intensity) and soil resistance (i.e.,materials and their subsurface conditions, such as water-saturation and overburden stress) into account. The methodcombines a liquefaction potential evaluation method basedon measured shear-wave velocity (VS) data (Andrus andStokoe, 2000; Juang et al., 2005) with a simulation-basedPSHA method for Canadian locations (Goda et al., 2010;Atkinson and Goda, 2011), and evaluates the probabilityof liquefaction by considering all possible earthquakes thatcould induce liquefaction. Then we apply the developedmethod to assess liquefaction potential at four majorcities across Canada (Montreal, Ottawa, Quebec City, andVancouver) by considering representative site profiles. Ourprimary focus is to investigate the impact of regional seismiccharacteristics (i.e., ground-motion levels and contributingearthquake scenarios) on liquefaction hazard assessment.We note that similar investigations were carried out byKramer and Mayfield (2007) for American cities by consid-ering the standard penetration test (SPT)-based method(Cetin et al., 2002, 2004). Our approach differs fromtheir approach in that a VS-based method is adopted andprobabilistic liquefaction hazard analysis (PLHA) is devisedusing the simulation-based PSHA method by directly con-sidering the joint probability distribution of PGA andM. Furthermore, we probe the causes of regional differencesof liquefaction potential evaluation by taking advantageof updated seismic hazard assessments for four cities in east-ern and western Canada (Atkinson and Goda, 2011). Ourinvestigation is tailored for Canadian seismotectonic envi-ronments and thus should be relevant to Canadian profes-sionals. We recognize that there are several unresolved issuesin conducting such PLHA investigations. The conventionalliquefaction potential evaluation procedures that werederived for active seismic regions may not be directly applic-able to soft soil sites in eastern Canada, where different siteamplification effects are expected due to sharp contrast ofmaterial properties between bedrock and ground surface(Motazedian et al., 2010). Moreover, we do not attemptto assess such issues as the potential massive flow failureof sensitive marine clay (Aylsworth et al., 2000), which isbeyond the scope of this study.
In the following, a brief overview of the VS-based PLHAis given. Subsequently, we describe representative siteprofiles that are derived from VS data in the Fraser Riverdelta and Ottawa–Montreal regions (Hunter et al., 1998,2007). Then we investigate the impact of regional seismic
hazard characteristics on liquefaction hazard assessmentby placing the representative site profiles at four cities acrossCanada.
Liquefaction Potential Evaluation
General Approach
Soil liquefaction is induced by sudden disturbance ofcohesionless saturated soils under undrained conditions.The generation of excess pore pressure severely weakens soillayers; consequently, softened soil layers are unable to sus-tain static shear stresses without causing deformations undersloping ground conditions. One of the most popular methodsfor assessing the cyclic stress ratio (CSR), which is an essen-tial input for liquefaction potential evaluation, is the simpli-fied method developed by Seed and Idriss (1971).Liquefaction of a soil layer at a certain depth is predictedif CSR is greater than the cyclic resistance ratio (CRR).Similar methods have been developed based on several geo-technical/geophysical measures, such as SPT blow counts,cone penetration test (CPT) data, and VS data (e.g., Seedet al., 1985; Robertson andWride, 1998; Andrus and Stokoe,2000; Youd et al., 2001). SPT-based or CPT-based liquefac-tion resistance assessment is generally preferred to VS-basedassessment, because of more abundant case histories and in-duced large strain phenomenon in the soil. One of the notabletrends in recent developments of liquefaction potentialassessment is a probabilistic approach, and various tech-niques/methods have been devised, including logistic regres-sion analysis (Liao et al., 1988), Bayesian mapping analysis(Juang et al., 2001, 2002), Bayesian regression analysis(Cetin et al., 2002, 2004; Moss et al., 2006), and first-orderreliability methods (FORM) (Juang et al., 2005). Juang et al.(2002) showed that, starting from the same case historydataset, the logistic regression approach and Bayesian map-ping approach produce similar results for the SPT-based,CPT-based, and VS-based procedures. The use of Bayesianregression analysis and FORM is advantageous, because bothparametric uncertainty of input variables and uncertainty as-sociated with an adopted CRR model can be incorporated.
To achieve higher correlation between liquefactionpredictions based on the simplified methods and fieldmanifestations/evidences at the ground surface (e.g., sandboils, lateral spreads, and settlements of structures), Iwasakiet al. (1978) proposed the liquefaction potential index (LPI)ILP, which accounts for thickness, proximity, and extent ofliquefied soil layers. The LPI is useful for representing lique-faction potential of soil layers over depth by a single measureand for developing regional liquefaction hazard maps (Hol-zer et al., 2006; Cramer et al., 2008). Critical values of ILPwere calibrated based on field observations of liquefactionoccurrences (Toprak and Holzer, 2003). For example, ILP �5 can be considered as a threshold value for moderate lique-faction hazard (e.g., sand boils), whereas ILP � 12–15 can
Probabilistic Liquefaction Hazard Analysis for Four Canadian Cities 191

be taken as a threshold value for major liquefaction hazard(e.g., lateral spreads).
Shear-Wave Velocity-Based LiquefactionPotential Evaluation
The magnitude-corrected cyclic stress ratio CSR7:5 at aparticular depth z (m) is given by Seed and Idriss (1971) as
CSR7:5 � 0:65PGAg
σv
σ0v
rd�z�MSF�M� ; (1)
where PGA (g) represents the geometric mean of peak groundaccelerations of two horizontal components at the groundsurface (Youd et al., 2001); g is the gravitational accelera-tion; σ0
v and σv are the initial effective vertical overburdenstress and the total overburden stress at the depth z, respec-tively; MSF (M) is the magnitude scaling factor and is givenby MSF�M� � �M=7:5��2:56 (Youd et al., 2001); and rd�z�is the shear stress reduction factor and is given by Liao et al.(1988) and Youd et al. (2001) as
rd�z� ��1:0 � 0:00765z for z ≤ 9:15 �m�1:174 � 0:0267z for 9:15 < z ≤ 23 �m� : (2)
Note that improved factors for MSF�M� and rd�z�, devel-oped by Cetin et al. (2002, 2004), can be useful for reducinguncertainties associated with triggering prediction of seismicsoil liquefaction.
The magnitude-adjusted cyclic resistance ratio CRR7:5
for uncemented Holocene soils was developed by Andrusand Stokoe (2000):
CRR7:5 � 0:022
�VS1;cs
100
�2
� 2:8
�1
215 � VS1;cs� 1
215
�;
(3)
where VS1;cs �m=s� is the clean soil equivalence of the stress-corrected shear-wave velocity. A value of 215 m=s inequation (3) corresponds to the upper limit of VS1;cs for li-quefaction occurrence. The value of VS1;cs can be calculatedby using
VS1;cs � VS1KFC � VS min��Pa=σ0v�0:25; 1:4�KFC; (4)
where VS1 is the overburden-stress-corrected shear-wave ve-locity; VS is the in situ shear-wave velocity; Pa is the refer-ence stress; and KFC is the adjustment factor for the finescontent FC (%) and is given by Juang et al. (2001):
KFC �8<:1:0 for FC ≤ 5%
1:0� �FC � 5� × T for 5% < FC < 35%
1:0� 30T for FC ≥ 35%
;
(5)
in which T � 0:009 � 0:0109�VS1=100� � 0:0038�VS1=100�2. The deterministic implementation of the method
predicts liquefaction occurrence if the factor of safety,FS � CRR7:5=CSR7:5, is less than unity. By using Bayesianmapping analysis, Juang et al. (2002) developed a relationshipbetween the probability of liquefaction PL and FS:PL � 1=�1� �FS=0:73�3:4�; thus, the CRR model shown inequation (3) corresponds to PL � 0:26 when FS is equalto unity.
Juang et al. (2005) extended the conventional determi-nistic approach into a reliability-based probabilistic methodby considering parametric uncertainty of input variables (i.e.,M, PGA, σ0
v, σv, VS, and FC) and by calibrating model un-certainty associated with the CRR model to eliminate the con-servative bias (so that FS � 1:0 corresponds to PL � 0:50).In the probabilistic framework, all input parameters areassumed to be lognormally distributed and correlated; thevalues of the coefficient of variation (CoV) and correlationcoefficients suggested by Juang et al. (2005) are summarizedin Table 1 (see Juang et al., 2005 for additional informationon probabilistic characteristics of the input parameters). Tocalibrate the model uncertainty, Juang et al. (2005) consid-ered the following limit state function gL:
gL�c;M; PGA; σ0v; σv; VS; FC� � cCRR7:5 � CSR7:5; (6)
where c is the model uncertainty parameter and is approxi-mated by the lognormal distribution. They determined themean and CoV of c by trial and error, comparing PL basedon Bayesian mapping analysis with PL based on FORManalysis (Nowak and Collins, 2000). The calibration resultsindicate that the mean and CoVof c, associated with the CRRmodel of Andrus and Stokoe (2000) (i.e., equation 3), can betaken as 1.4 and 0.15–0.2, respectively. We note that theimproved factors for MSF�M� and rd�z� are not used in thisstudy; our rationale is to maintain internal consistency of thelimit state function considered by Juang et al. (2005) and thecalibrated model uncertainty parameter c.
To succinctly capture liquefaction damage potential forsubsurface structures, Iwasaki et al. (1978) proposed theliquefaction potential index ILP, which is given by
ILP �Z
20
0
Fw�z�dz; (7a)
Table 1Coefficient of Variation and Correlation Coefficient of Input
Variables (Juang et al., 2005)
Correlation Coefficient
InputVariables
Coefficient ofVariation M PGA σ0
v σv VS FC
M 0.05 1.0 0.9 0 0 0 0PGA 0.10 0.9 1.0 0 0 0 0σ0v 0.15 0 0 1.0 0.95 0.50 0
σv 0.10 0 0 0.95 1.0 0.47 0VS 0.10 0 0 0.50 0.47 1.0 0FC 0.10 0 0 0 0 0 1
192 K. Goda, G. M. Atkinson, J. A. Hunter, H. Crow, and D. Motazedian
where F equals 1 � FS if FS ≤ 1 and 0 otherwise, andw�z� � 10 � 0:5z. The liquefaction potential index ILP takesa value between 0 and 100. The original version of ILP wasproposed based on the SPT-based method of Seed and Idriss(1971), for which critical threshold values of ILP equal to 5and 15 were suggested for modest and severe liquefaction,respectively. Recently, Toprak and Holzer (2003) calibratedthis index with field observations in California based on theCPT-based method of Robertson and Wride (1998) (thismethod is relatively unbiased according to Andrus et al.,2004), and suggested critical threshold ILP values equal to5 and 12–15 for sand boils and lateral spreads, respectively.It is noteworthy that the threshold values depend on theadopted methods for calibration, as conservatism associatedwith the simplified methods differs. For the VS-based meth-od, critical threshold values of ILP equal to 5 and 12–15 maybe used for manifestation of sand boils and lateral spreads,respectively, if F�
S � 1:4 × CRR7:5=CSR7:5, rather thanFS � CRR7:5=CSR7:5, is considered, which approximatelygives PL equal to 0.5 for F�
S � 1:0. For unbiased liquefactionpotential evaluation, we use I�LP, which is given by
I�LP �Z
20
0
F�w�z�dz; (7b)
where F� equals 1 � F�S if F�
S ≤ 1 and 0 otherwise.
Probabilistic Liquefaction Hazard Analysis
The previously mentioned deterministic/probabilisticmethods are applicable for a specific performance level orearthquake scenario; however, they do not address overallliquefaction potential by taking all possible earthquakescenarios into account. By contrast, Atkinson et al. (1984)introduced integration of liquefaction potential evaluationinto PSHA (i.e., PLHA). Recently, Kramer and Mayfield(2007) and Juang et al. (2008) further extended the methodol-ogy for American sites by using available seismic hazard in-formation (i.e., seismic hazard curves and deaggregationresults) provided by the U.S. Geological Survey (USGS) toassess total liquefaction potential. A similar approachwas dis-cussed by Finn and Wightman (2007) for Canadian sites.
Based on the PLHA framework, the total liquefactionpotential for a given exposure time (typically a year) in termsof LPI, ν�I�LP > i�lp�, is given by
ν�I�LP > i�lp� �ZΩPGA;M
P�I�LP > i�lpjPGA;M�
× fPGA;M�PGA;M�dPGAdM; (8)
where P�I�LP > i�lpjPGA;M� represents the probability that asoil column experiences I�LP greater than a threshold value i
�lp
conditioned on PGA and M; fPGA;M�PGA;M� is the jointprobability density function of PGA and M; and ΩPGA;M
is the domain of PGA and M. A liquefaction hazard curveis described by ν�I�LP > i�lp� and is useful for characterizingliquefaction hazard in the performance-based earthquake en-
gineering framework. One can consider other liquefactionpotential measures in equation (8).
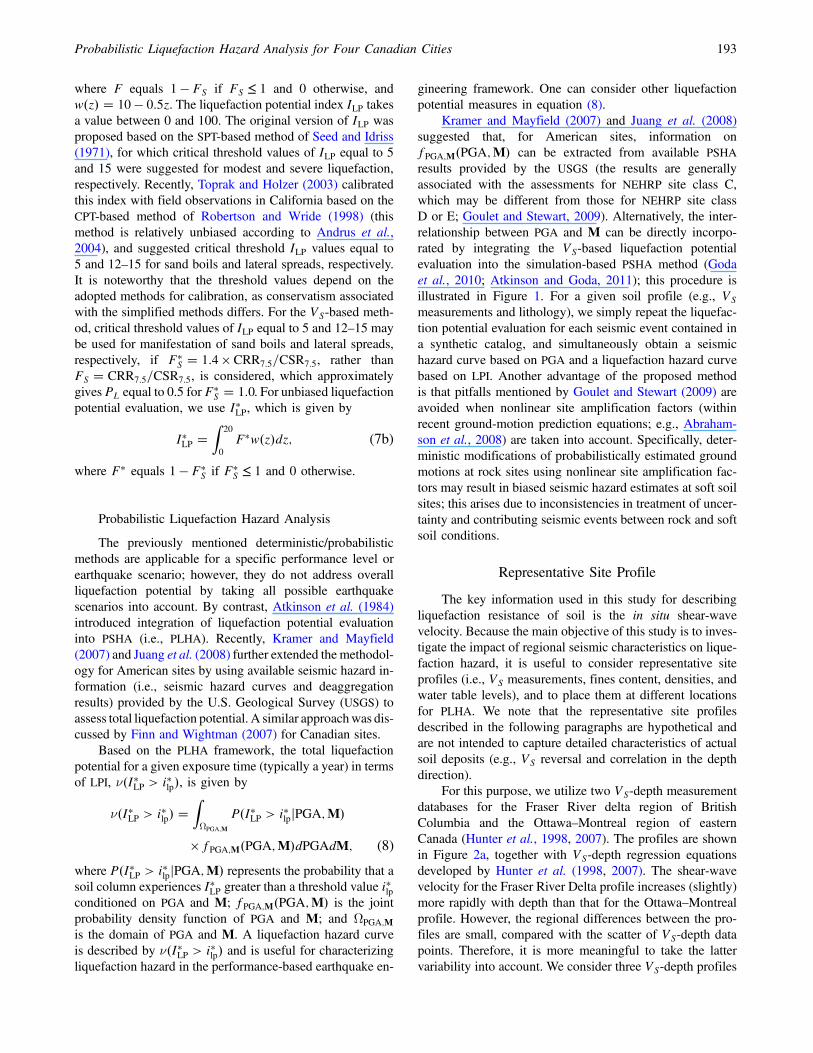
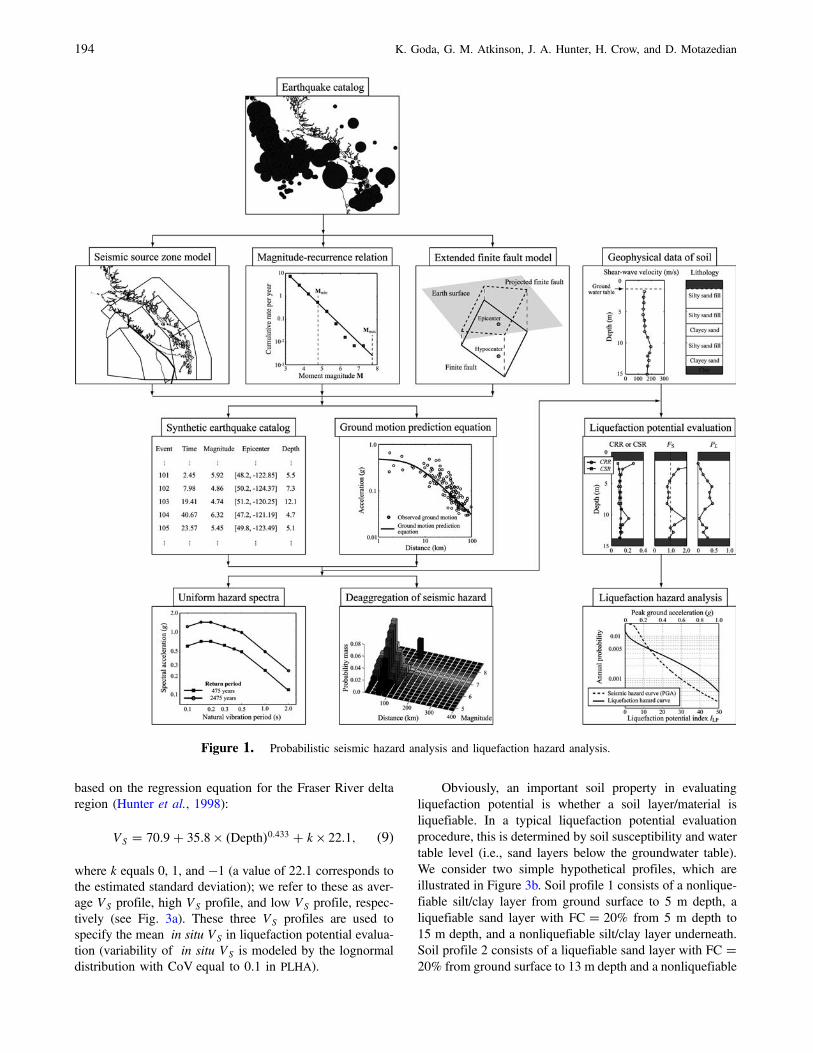
Kramer and Mayfield (2007) and Juang et al. (2008)suggested that, for American sites, information onfPGA;M�PGA;M� can be extracted from available PSHAresults provided by the USGS (the results are generallyassociated with the assessments for NEHRP site class C,which may be different from those for NEHRP site classD or E; Goulet and Stewart, 2009). Alternatively, the inter-relationship between PGA and M can be directly incorpo-rated by integrating the VS-based liquefaction potentialevaluation into the simulation-based PSHA method (Godaet al., 2010; Atkinson and Goda, 2011); this procedure isillustrated in Figure 1. For a given soil profile (e.g., VS
measurements and lithology), we simply repeat the liquefac-tion potential evaluation for each seismic event contained ina synthetic catalog, and simultaneously obtain a seismichazard curve based on PGA and a liquefaction hazard curvebased on LPI. Another advantage of the proposed methodis that pitfalls mentioned by Goulet and Stewart (2009) areavoided when nonlinear site amplification factors (withinrecent ground-motion prediction equations; e.g., Abraham-son et al., 2008) are taken into account. Specifically, deter-ministic modifications of probabilistically estimated groundmotions at rock sites using nonlinear site amplification fac-tors may result in biased seismic hazard estimates at soft soilsites; this arises due to inconsistencies in treatment of uncer-tainty and contributing seismic events between rock and softsoil conditions.
Representative Site Profile
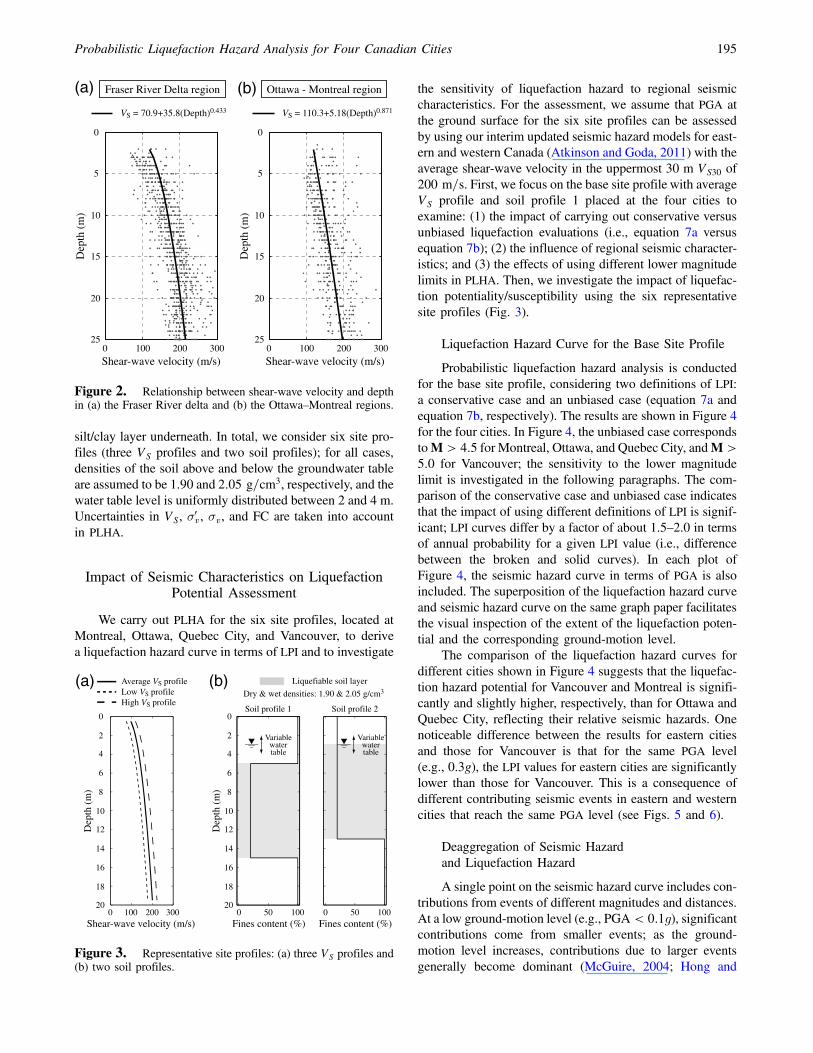
The key information used in this study for describingliquefaction resistance of soil is the in situ shear-wavevelocity. Because the main objective of this study is to inves-tigate the impact of regional seismic characteristics on lique-faction hazard, it is useful to consider representative siteprofiles (i.e., VS measurements, fines content, densities, andwater table levels), and to place them at different locationsfor PLHA. We note that the representative site profilesdescribed in the following paragraphs are hypothetical andare not intended to capture detailed characteristics of actualsoil deposits (e.g., VS reversal and correlation in the depthdirection).
For this purpose, we utilize two VS-depth measurementdatabases for the Fraser River delta region of BritishColumbia and the Ottawa–Montreal region of easternCanada (Hunter et al., 1998, 2007). The profiles are shownin Figure 2a, together with VS-depth regression equationsdeveloped by Hunter et al. (1998, 2007). The shear-wavevelocity for the Fraser River Delta profile increases (slightly)more rapidly with depth than that for the Ottawa–Montrealprofile. However, the regional differences between the pro-files are small, compared with the scatter of VS-depth datapoints. Therefore, it is more meaningful to take the lattervariability into account. We consider three VS-depth profiles
Probabilistic Liquefaction Hazard Analysis for Four Canadian Cities 193
based on the regression equation for the Fraser River deltaregion (Hunter et al., 1998):
VS � 70:9� 35:8 × �Depth�0:433 � k × 22:1; (9)
where k equals 0, 1, and �1 (a value of 22.1 corresponds tothe estimated standard deviation); we refer to these as aver-age VS profile, high VS profile, and low VS profile, respec-tively (see Fig. 3a). These three VS profiles are used tospecify the mean in situ VS in liquefaction potential evalua-tion (variability of in situ VS is modeled by the lognormaldistribution with CoV equal to 0.1 in PLHA).
Obviously, an important soil property in evaluatingliquefaction potential is whether a soil layer/material isliquefiable. In a typical liquefaction potential evaluationprocedure, this is determined by soil susceptibility and watertable level (i.e., sand layers below the groundwater table).We consider two simple hypothetical profiles, which areillustrated in Figure 3b. Soil profile 1 consists of a nonlique-fiable silt/clay layer from ground surface to 5 m depth, aliquefiable sand layer with FC � 20% from 5 m depth to15 m depth, and a nonliquefiable silt/clay layer underneath.Soil profile 2 consists of a liquefiable sand layer with FC �20% from ground surface to 13 m depth and a nonliquefiable
Figure 1. Probabilistic seismic hazard analysis and liquefaction hazard analysis.
194 K. Goda, G. M. Atkinson, J. A. Hunter, H. Crow, and D. Motazedian
silt/clay layer underneath. In total, we consider six site pro-files (three VS profiles and two soil profiles); for all cases,densities of the soil above and below the groundwater tableare assumed to be 1.90 and 2:05 g=cm3, respectively, and thewater table level is uniformly distributed between 2 and 4 m.Uncertainties in VS, σ0
v, σv, and FC are taken into accountin PLHA.
Impact of Seismic Characteristics on LiquefactionPotential Assessment
We carry out PLHA for the six site profiles, located atMontreal, Ottawa, Quebec City, and Vancouver, to derivea liquefaction hazard curve in terms of LPI and to investigate
the sensitivity of liquefaction hazard to regional seismiccharacteristics. For the assessment, we assume that PGA atthe ground surface for the six site profiles can be assessedby using our interim updated seismic hazard models for east-ern and western Canada (Atkinson and Goda, 2011) with theaverage shear-wave velocity in the uppermost 30 m VS30 of200 m=s. First, we focus on the base site profile with averageVS profile and soil profile 1 placed at the four cities toexamine: (1) the impact of carrying out conservative versusunbiased liquefaction evaluations (i.e., equation 7a versusequation 7b); (2) the influence of regional seismic character-istics; and (3) the effects of using different lower magnitudelimits in PLHA. Then, we investigate the impact of liquefac-tion potentiality/susceptibility using the six representativesite profiles (Fig. 3).
Liquefaction Hazard Curve for the Base Site Profile
Probabilistic liquefaction hazard analysis is conductedfor the base site profile, considering two definitions of LPI:a conservative case and an unbiased case (equation 7a andequation 7b, respectively). The results are shown in Figure 4for the four cities. In Figure 4, the unbiased case correspondstoM > 4:5 for Montreal, Ottawa, and Quebec City, andM >5:0 for Vancouver; the sensitivity to the lower magnitudelimit is investigated in the following paragraphs. The com-parison of the conservative case and unbiased case indicatesthat the impact of using different definitions of LPI is signif-icant; LPI curves differ by a factor of about 1.5–2.0 in termsof annual probability for a given LPI value (i.e., differencebetween the broken and solid curves). In each plot ofFigure 4, the seismic hazard curve in terms of PGA is alsoincluded. The superposition of the liquefaction hazard curveand seismic hazard curve on the same graph paper facilitatesthe visual inspection of the extent of the liquefaction poten-tial and the corresponding ground-motion level.
The comparison of the liquefaction hazard curves fordifferent cities shown in Figure 4 suggests that the liquefac-tion hazard potential for Vancouver and Montreal is signifi-cantly and slightly higher, respectively, than for Ottawa andQuebec City, reflecting their relative seismic hazards. Onenoticeable difference between the results for eastern citiesand those for Vancouver is that for the same PGA level(e.g., 0.3g), the LPI values for eastern cities are significantlylower than those for Vancouver. This is a consequence ofdifferent contributing seismic events in eastern and westerncities that reach the same PGA level (see Figs. 5 and 6).
Deaggregation of Seismic Hazardand Liquefaction Hazard
A single point on the seismic hazard curve includes con-tributions from events of different magnitudes and distances.At a low ground-motion level (e.g., PGA < 0:1g), significantcontributions come from smaller events; as the ground-motion level increases, contributions due to larger eventsgenerally become dominant (McGuire, 2004; Hong and
0
5
10
15
20
25
Dep
th (
m)
0 200 300100Shear-wave velocity (m/s)
VS = 70.9+35.8(Depth)0.433
Fraser River Delta region
VS = 110.3+5.18(Depth)0.871
Ottawa - Montreal region
0
5
10
15
20
25
Dep
th (
m)
0 200 300100Shear-wave velocity (m/s)
(a) (b)
Figure 2. Relationship between shear-wave velocity and depthin (a) the Fraser River delta and (b) the Ottawa–Montreal regions.
0 200 300100Shear-wave velocity (m/s)
0 10050Fines content (%)
0 10050Fines content (%)
0
4
2
6
8
10
12
14
18
16
20
Dep
th (
m)
0
4
2
6
8
10
12
14
18
16
20
Dep
th (
m)
Soil profile 1 Soil profile 2
Variablewatertable
Variablewatertable
Average VS profileLow VS profileHigh VS profile
Dry & wet densities: 1.90 & 2.05 g/cm3
Liquefiable soil layer(b)(a)
Figure 3. Representative site profiles: (a) three VS profiles and(b) two soil profiles.
Probabilistic Liquefaction Hazard Analysis for Four Canadian Cities 195

Goda, 2006). To show seismic event characteristics contrib-uting to a specified probability level, seismic deaggregationresults based on PGA at the ground surface for the returnperiod of 2475 yr are shown in Figure 5 for the four cities.For Montreal, significant contributions to PGA comefrom events with small-to-moderate magnitudes (M < 6:5)and short distances. On the other hand, for Ottawa andQuebec City, contributions to PGA come from two majorsources, local events with small-to-moderate magnitudesand more distant events with large magnitudes (6:5 ≤M ≤ 7:5); the latter correspond to the characteristic IRMzone in the updated seismic hazard model (Atkinson andGoda, 2011). For Vancouver, dominant contributions toPGA are due to deep inslab events at moderate distances(hypocentral distances of about 40–80 km), while contribu-tions to PGA from shallow crustal events (hypocentral dis-tances of about 0–40 km) and interface Cascadia events(magnitudes greater than 8.0) are not as significant. Notethat these deaggregation results are for PGA (i.e., a short-vibration-period parameter).
We compare the characteristics of contributing seismicevents for PGA, as shown in Figure 5, with those for LPI, asshown in Figure 6. For all four cities, contributions to LPI dueto larger earthquakes are much more significant than those toPGA; in particular, the effects due to the Cascadia events arehighlighted in Figure 6d. The drastic change from the deag-gregation results for PGA to those for LPI is caused by themagnitude scaling factor MSF�M� shown in equation (1);this factor adds more weight to larger earthquakes, in com-parison with smaller earthquakes, to reflect the long durationeffects of larger earthquakes on liquefaction potential.
In the previous analyses, we applied the magnitudescaling factor of Youd et al. (2001) to all ranges of momentmagnitudes from M � 4:5 to M � 7:5 for eastern Canadaand from M � 5:0 to M � 9:0 (Cascadia subduction zone)for western Canada. These ranges are wider than that recom-mended byYoud et al. (2001), which is betweenM � 5:5 andM � 8:0–8:5. To investigate the sensitivity of liquefactionhazard evaluation to the lower magnitude limit in PLHA,the analyses are repeated with different lower magnitude
Ann
ual p
roba
bilit
y
0.1
0.01
0.02
0.05
0.001
0.0001
0.0002
0.0005
0.002
0.005
Peak ground acceleration (g)0.01 0.02 0.05 0.1 0.2 0.5 1
Liquefaction potential index1 2 5 10 20 50 100
(a)
PGA
Conservative LPIUnbiased LPI (M > 4.5)Unbiased LPI (M > 5.0)Unbiased LPI (M > 5.5)
MontrealAverage VS profile
Soil profile 1
Conservative LPIUnbiased LPI (M > 4.5)Unbiased LPI (M > 5.0)Unbiased LPI (M > 5.5)
Ann
ual p
roba
bilit
y
0.1
0.01
0.02
0.05
0.001
0.0001
0.0002
0.0005
0.002
0.005
Peak ground acceleration (g)0.01 0.02 0.05 0.1 0.2 0.5 1
Liquefaction potential index1 2 5 10 20 50 100
PGA
(b)
OttawaAverage VS profile
Soil profile 1
Conservative LPIUnbiased LPI (M > 4.5)Unbiased LPI (M > 5.0)Unbiased LPI (M > 5.5)
Quebec CityAverage VS profile
Soil profile 1
Ann
ual p
roba
bilit
y
0.1
0.01
0.02
0.05
0.001
0.0001
0.0002
0.0005
0.002
0.005
Peak ground acceleration (g)0.01 0.02 0.05 0.1 0.2 0.5 1
Liquefaction potential index1 2 5 10 20 50 100
(c)
PGA
Ann
ual p
roba
bilit
y
0.1
0.01
0.02
0.05
0.001
0.0001
0.0002
0.0005
0.002
0.005
Peak ground acceleration (g)0.01 0.02 0.05 0.1 0.2 0.5 1
Liquefaction potential index1 2 5 10 20 50 100
(d)
Conservative LPIUnbiased LPI (M > 5.0)Unbiased LPI (M > 5.5)
PGA
VancouverAverage VS profile
Soil profile 1
Figure 4. Liquefaction hazard curves for the average VS profile and soil profile 1 by considering two definitions of LPI and differentlower magnitude limits: (a) Montreal, (b) Ottawa, (c) Quebec City, and (d) Vancouver; PGA is at the ground surface.
196 K. Goda, G. M. Atkinson, J. A. Hunter, H. Crow, and D. Motazedian

limits. The results are included in Figure 4; for eastern cities,two additional caseswithM � 5:0 and 5.5 are considered andfor Vancouver, one additional case with M � 5:5 is consid-ered. By inspecting the LPI curves with different lower mag-nitude limits (Fig. 4), we observe noticeable differences forMontreal, but only marginal differences for the other threecities. This is expected from the seismic hazard deaggregationresults shown in Figure 5, as smaller events contributemore tooverall seismic hazard for Montreal than for other cities.
Impact of Liquefaction Potentiality/SusceptibilityUsing Six Representative Site Profiles
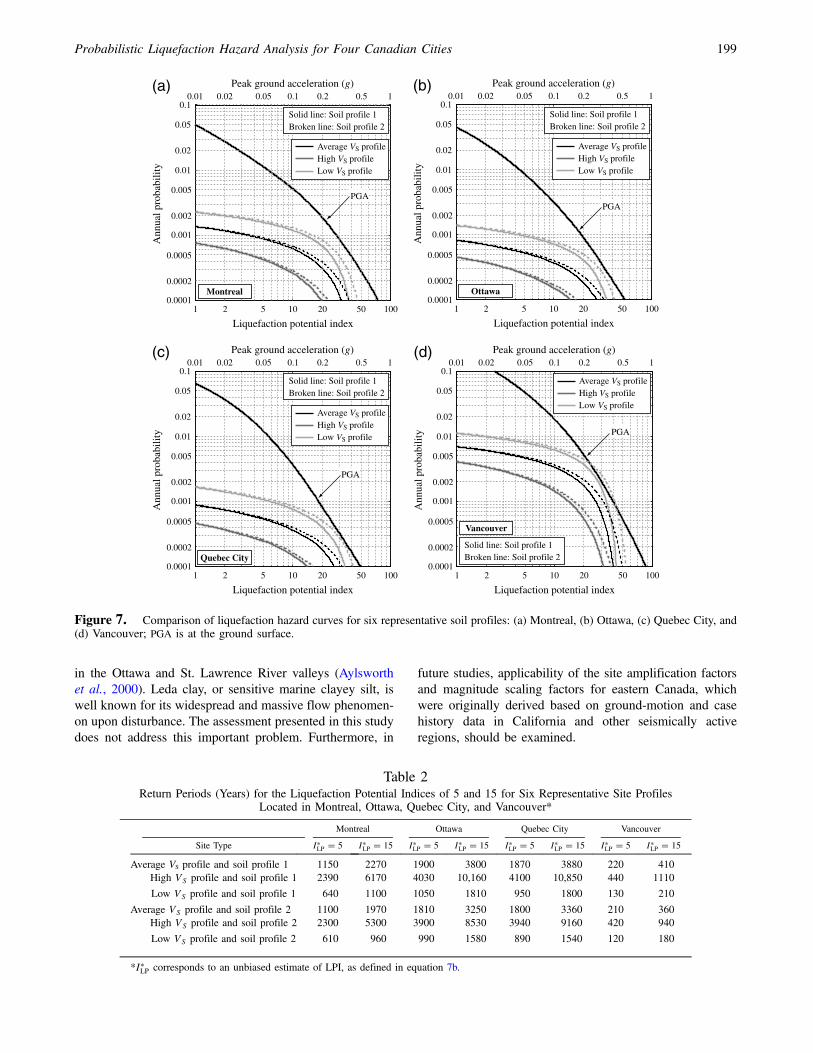
Figure 7 shows PLHA results for the six representativesite profiles (Fig. 3) for the four cities. For all cities, the LPIcurves for the three VS profiles differ significantly. By con-trast, the LPI curves for the two soil profiles 1 and 2 aresimilar at small LPI values, but become increasingly differentas the LPI value increases. The results highlight the impact ofVS profiles on liquefaction potential evaluation. We note thatfor the worst scenario (extremely rare cases), soil profile 1
may attain an LPI value of 50, whereas soil profile 2 mayattain an LPI value of 68.75.
To compare the results shown in Figure 7 quantitatively,we calculated the return period levels that correspond to theLPI of 5 and 15 (i.e., occurrence of sand boils and lateralspreads, respectively) for the six site profiles; the resultsare summarized in Table 2. For the low VS profile, majorliquefaction hazard (i.e., I�LP � 15) is indicated for easterncities with liquefaction return periods in the range of 600–2000 yr. For the average and high VS profiles, eastern citieshave relatively low major liquefaction hazard (i.e., returnperiods in the range of 1000–10,000 yr). By contrast, for Van-couver, major liquefaction hazard is indicated for all six siteprofiles with liquefaction return periods in the range of 200–1000 yr. This is attributed to relatively high seismic hazard inwestern Canada, driven by the potential for large earthquakes.
Discussion and Conclusions
We implemented a direct and consistent probabilisticapproach for liquefaction potential evaluation. The methodcombines the simulation-based PSHA method with the
MontrealSeismic hazard deaggregation
Return period: 2475 yearsPeak ground acceleration: 0.427 g
Prob
abili
ty
0.05
0.04
0.03
0.02
0.01
0.00
300Hypocentraldistance (km)
400
8.0
7.0
6.0Moment
magnitude5.0200
100
(a) OttawaSeismic hazard deaggregation
Return period: 2475 yearsPeak ground acceleration: 0.294 g
Prob
abili
ty
0.05
0.04
0.03
0.02
0.01
0.00
300Hypocentraldistance (km)
400
8.0
7.0
6.0Moment
magnitude5.0200
100
(b)
Quebec CitySeismic hazard deaggregation
Return period: 2475 yearsPeak ground acceleration: 0.271 g
Prob
abili
ty
0.05
0.04
0.03
0.02
0.01
0.00
300Hypocentraldistance (km)
400
8.0
7.0
6.0Moment
magnitude5.0200
100
(c) VancouverSeismic hazard deaggregation
Return period: 2475 yearsPeak ground acceleration: 0.550 g
Prob
abili
ty0.05
0.04
0.03
0.02
0.01
0.00
Hypocentraldistance (km)
50
150200
100
250
Momentmagnitude
9.0
8.0
7.0
6.0
5.0
(d)
Figure 5. Seismic hazard deaggregation based on PGA at the ground surface for the return period of 2475 yr: (a) Montreal, (b) Ottawa,(c) Quebec City, and (d) Vancouver.
Probabilistic Liquefaction Hazard Analysis for Four Canadian Cities 197
reliability-based liquefaction potential evaluation methodbased on shear-wave velocity data. Advantages of the pro-posed method include: (1) the joint probability distributionof PGA and moment magnitude is directly incorporated inthe assessment; (2) all possible earthquake scenarios (i.e.,seismic hazard uncertainty) are considered; and (3) bothparametric and model uncertainties of soil resistance to earth-quake-induced cyclic stress load are taken into account.Moreover, we utilized interim updated seismic hazard mod-els for eastern and western Canada, which are described in acompanion paper (Atkinson and Goda, 2011), to incorporateup-to-date seismicity rates and new ground-motion predic-tion models in the assessment. Using the developed method,we investigated the impact of regional seismic characteristics(i.e., ground-motion levels and contributing earthquakescenarios) on liquefaction hazard assessment for Canadiancities. For this purpose, we generated six representative siteprofiles and conducted PLHA by placing them at four loca-tions across Canada. Based on the sensitivity analysis results,we conclude that:
1. The use of a conservative definition of LPI results inbiased liquefaction potential evaluation. The discrepancybetween a traditional conservative estimate and an un-
biased estimate is approximately a factor of 1.5–2.0 interms of annual probability for a given LPI value.
2. The seismic hazard level and magnitude range of contri-buting events have a direct impact on liquefaction poten-tial assessment. Larger earthquakes have longer durationsof significant stress cycles; such effects are modeled bythe magnitude scaling factor in liquefaction potentialassessment procedures. More specifically, for the sameseismic excitation level, liquefaction hazard for westernCanada is generally higher than that for eastern Canada,because of the greater seismic hazard contributions dueto large earthquakes. The influence of the magnitudescaling factor on liquefaction hazard analysis can bevisually inspected by comparing seismic hazard deaggre-gation results with liquefaction hazard deaggregationresults.
3. Typical soil profiles characterized by low shear-wavevelocities pose a major liquefaction hazard for cities ineastern and western Canada. Profiles with average orhigh shear-wave velocities pose a major liquefactionhazard for western cities.
Finally, we point out that there is an important unsolvedissue regarding earthquake-induced landslides of Leda clay
Prob
abili
ty
0.05
0.04
0.03
0.02
0.01
0.00
300Hypocentraldistance (km)
400
8.0
7.0
6.0Moment
magnitude5.0200
100
MontrealAverage VS profile & soil profile 1
Return period: 2475 yearsLiquefaction potential index: 16.4
(a) (b)
Prob
abili
ty
0.05
0.04
0.03
0.02
0.01
0.00
300Hypocentraldistance (km)
400
8.0
7.0
6.0Moment
magnitude5.0200
100
OttawaAverage VS profile & soil profile 1
Return period: 2475 yearsLiquefaction potential index: 8.8
(c) Quebec CityAverage VS profile & soil profile 1
Return period: 2475 yearsLiquefaction potential index: 8.6
Prob
abili
ty
0.05
0.04
0.03
0.02
0.01
0.00
300Hypocentraldistance (km)
400
8.0
7.0
6.0Moment
magnitude5.0200
100
VancouverAverage VS profile & soil profile 1
Return period: 2475 yearsLiquefaction potential index: 33.6
Prob
abili
ty
0.05
0.04
0.03
0.02
0.01
0.00
Hypocentraldistance (km)
50
150200
100
250
Momentmagnitude
9.0
8.0
7.0
6.0
5.0
(d)
Figure 6. Liquefaction hazard deaggregation based on LPI for the return period of 2475 yr by considering the average VS profile and soilprofile 1: (a) Montreal, (b) Ottawa, (c) Quebec City, and (d) Vancouver.
198 K. Goda, G. M. Atkinson, J. A. Hunter, H. Crow, and D. Motazedian
in the Ottawa and St. Lawrence River valleys (Aylsworthet al., 2000). Leda clay, or sensitive marine clayey silt, iswell known for its widespread and massive flow phenomen-on upon disturbance. The assessment presented in this studydoes not address this important problem. Furthermore, in
future studies, applicability of the site amplification factorsand magnitude scaling factors for eastern Canada, whichwere originally derived based on ground-motion and casehistory data in California and other seismically activeregions, should be examined.
Ann
ual p
roba
bilit
y
0.1
0.01
0.02
0.05
0.001
0.0001
0.0002
0.0005
0.002
0.005
Peak ground acceleration (g)0.01 0.02 0.05 0.1 0.2 0.5 1
Liquefaction potential index
1 2 5 10 20 50 100
(a)
Average VS profileHigh VS profileLow VS profile
Solid line: Soil profile 1Broken line: Soil profile 2
PGA
Montreal
Average VS profileHigh VS profileLow VS profile
Solid line: Soil profile 1Broken line: Soil profile 2
Quebec City
(c)
Ann
ual p
roba
bilit
y
0.1
0.01
0.02
0.05
0.001
0.0001
0.0002
0.0005
0.002
0.005
Peak ground acceleration (g)0.01 0.02 0.05 0.1 0.2 0.5 1
Liquefaction potential index
1 2 5 10 20 50 100
PGA
Ann
ual p
roba
bilit
y
0.1
0.01
0.02
0.05
0.001
0.0001
0.0002
0.0005
0.002
0.005
Peak ground acceleration (g)0.01 0.02 0.05 0.1 0.2 0.5 1
Liquefaction potential index
1 2 5 10 20 50 100
(d)
PGA
Vancouver
Solid line: Soil profile 1Broken line: Soil profile 2
Average VS profileHigh VS profileLow VS profile
Average VS profileHigh VS profileLow VS profile
Solid line: Soil profile 1Broken line: Soil profile 2
PGA
Ann
ual p
roba
bilit
y
0.1
0.01
0.02
0.05
0.001
0.0001
0.0002
0.0005
0.002
0.005
Peak ground acceleration (g)0.01 0.02 0.05 0.1 0.2 0.5 1
Liquefaction potential index
1 2 5 10 20 50 100
(b)
Ottawa
Figure 7. Comparison of liquefaction hazard curves for six representative soil profiles: (a) Montreal, (b) Ottawa, (c) Quebec City, and(d) Vancouver; PGA is at the ground surface.
Table 2Return Periods (Years) for the Liquefaction Potential Indices of 5 and 15 for Six Representative Site Profiles
Located in Montreal, Ottawa, Quebec City, and Vancouver*
Montreal Ottawa Quebec City Vancouver
Site Type I�LP � 5 I�LP � 15 I�LP � 5 I�LP � 15 I�LP � 5 I�LP � 15 I�LP � 5 I�LP � 15
Average VS profile and soil profile 1 1150 2270 1900 3800 1870 3880 220 410High VS profile and soil profile 1 2390 6170 4030 10,160 4100 10,850 440 1110
Low VS profile and soil profile 1 640 1100 1050 1810 950 1800 130 210
Average VS profile and soil profile 2 1100 1970 1810 3250 1800 3360 210 360High VS profile and soil profile 2 2300 5300 3900 8530 3940 9160 420 940
Low VS profile and soil profile 2 610 960 990 1580 890 1540 120 180
*I�LP corresponds to an unbiased estimate of LPI, as defined in equation 7b.
Probabilistic Liquefaction Hazard Analysis for Four Canadian Cities 199
Data and Resources
All data used in this paper came from published sourceslisted in the references.
Acknowledgments
The financial support and postdoctoral fellowship award provided bythe Natural Sciences and Engineering Research Council of Canada and theCanadian Seismic Risk Network are gratefully acknowledged. We appreci-ate the constructive review comments of two anonymous reviewers.
References
Abrahamson, N. A., G. M. Atkinson, D. M. Boore, Y. Bozorgnia,K. W. Campbell, B. S. J. Chiou, I. M. Idriss, W. J. Silva, andR. R. Youngs (2008). Comparisons of the NGA ground-motionrelations, Earthquake Spectra 24, 45–66.
Adams, J., and S. Halchuk (2003). Fourth generation seismic hazard maps ofCanada: Values for over 650 Canadian localities intended for the 2005National Building Code of Canada, Open-File Rept. 4459, GeologicalSurvey of Canada, Ottawa, Canada.
Andrus, R. D., and K. H. Stokoe II (2000). Liquefaction resistance ofsoils from shear wave velocity, J. Geotech. Geoenviron. Eng. 126,1015–1025.
Andrus, R. D., P. Piratheepan, B. S. Ellis, J. Zhang, and C. H. Juang (2004).Comparing liquefaction evaluation methods using penetration-VS
relationships, Soil Dynam. Earthquake Eng. 24, 713–721.Atkinson, G. M., and K. Goda (2011). Effects of seismicity models and new
ground motion prediction equations on seismic hazard assessment forfour Canadian cities, Bull. Seismol. Soc. Am. 101, 176–189.
Atkinson, G. M., W. D. L. Finn, and R. G. Charlwood (1984). Simplecomputation of liquefaction probability for seismic hazard applica-tions, Earthquake Spectra 1, 107–123.
Aylsworth, J. M., D. E. Lawrence, and J. Guertin (2000). Did two massiveearthquakes in the Holocene induce widespread landsliding and near-surface deformation in part of the Ottawa Valley, Canada?, Geology28, 903–906.
Bird, J. F., and J. J. Bommer (2004). Earthquake losses due to ground failure,Eng. Geol. 75, 147–179.
Cetin, K. O., A. Der Kiureghian, and R. B. Seed (2002). Probabilistic modelsfor the initiation of seismic soil liquefaction, Struct. Saf. 24, 67–82.
Cetin, K. O., R. B. Seed, A. Der Kiureghian, K. Tokimatsu, L. F. Harder Jr.,R. E. Kayen, and R. E. S. Moss (2004). Standard PenetrationTest-based probabilistic and deterministic assessment of seismic soilliquefaction potential, J. Geotech. Geoenviron. Eng. 130, 1314–1340.
Cramer, C. H., G. J. Rix, and K. Tucker (2008). Probabilistic liquefactionhazard maps for Memphis, Tennessee, Seismol. Res. Lett. 79, 416–423.
Finn, W. D. L., and A. Wightman (2007). Logical evaluation of liquefactionpotential using NBCC 2005 probabilistic ground accelerations, inProc. of the 9th Canadian Conf. on Earthquake Eng., Ottawa, Canada,1984–1993.
Goda, K., H. P. Hong, and G. M. Atkinson (2010). Impact of using updatedseismic information on seismic hazard in western Canada, Canadian J.Civil Eng. 37, 562–575.
Goulet, C. A., and J. P. Stewart (2009). Pitfalls of deterministic applicationof nonlinear site factors in probabilistic assessment of ground motions,Earthquake Spectra 25, 541–555.
Holzer, T. L., M. J. Bennett, T. E. Noce, A. C. Padovani, and J. C. Tinsley III(2006). Liquefaction hazard mapping with LPI in the greater Oakland,California, area, Earthquake Spectra 22, 693–708.
Hong, H. P., and K. Goda (2006). A comparison of seismic-hazard and riskdeaggregation, Bull. Seismol. Soc. Am. 96, 2021–2039.
Hunter, J. A., R. A. Burns, R. L. Good, J. M. Aylsworth, S. E. Pullan,D. Perret, and M. Douma (2007). Borehole shear wave velocity mea-surements of Champlain Sea sediments in the Ottawa–Montreal
region, Open File Rept. 5345, Geological Survey of Canada, Ottawa,Canada.
Hunter, J. A., R. A. Burns, R. L. Good, and C. F. Pelletier (1998). A com-pilation shear wave velocities and borehole geophysical logs in uncon-solidated sediments of the Fraser River delta, Open File 3622,Geological Survey of Canada, Ottawa, Canada.
Idriss, I. M., and R. W. Boulanger (2008). Soil Liquefaction duringEarthquakes, Earthquake Engineering Research Institute, Oakland,California.
Iwasaki, T., F. Tatsuoka, K. Tokida, and S. Yasuda (1978). A practicalmethod for assessing soil liquefaction potential based on case studiesat various sites in Japan, in Proc., 2nd Int. Conf. on Microzonation,San Francisco, California, 885–896.
Juang, C. H., C. J. Chen, and T. Jiang (2001). Probabilistic framework forliquefaction potential by shear wave velocity, J. Geotech. Geoenviron.Eng. 127, 670–678.
Juang, C. H., T. Jiang, and R. D. Andrus (2002). Assessing probability-basedmethods for liquefaction potential evaluation, J. Geotech. Geoenviron.Eng. 128, 580–589.
Juang, C. H., D. K. Li, S. Y. Fang, Z. Liu, and E. H. Khor (2008). Simplifiedprocedure for developing joint distribution of amax and Mw forprobabilistic liquefaction hazard analysis, J. Geotech. Geoenviron.Eng. 134, 1050–1058.
Juang, C. H., S. H. Yang, and H. Yuan (2005). Model uncertainty of shearwave velocity-based method for liquefaction potential evaluation,J. Geotech. Geoenviron. Eng. 131, 1274–1282.
Kramer, S. L., and A. W. Elgamal (2001). Modeling soil liquefactionhazards for performance-based earthquake engineering, PEER Report2001/13, Pacific Earthquake Engineering Research Center, Berkeley,California.
Kramer, S. L., and R. T. Mayfield (2007). Return period of soil liquefaction,J. Geotech. Geoenviron. Eng. 133, 802–813.
Liao, S. S. C., D. Veneziano, and R. V. Whitman (1988). Regression modelsfor evaluating liquefaction probability, J. Geotech. Eng. 114, 389–411.
McGuire, R. K. (2004). Seismic Hazard and Risk Analysis, EarthquakeEngineering Research Institute, Oakland, California.
Moss, R. E. S., R. B. Seed, R. E. Kayen, J. P. Stewart, A. Der Kiureghian,and K. O. Cetin (2006). CPT-based probabilistic and deterministicassessment of in situ seismic soil liquefaction potential, J. Geotech.Geoenviron. Eng. 132, 1032–1051.
Motazedian, D., J. A. Hunter, M. Belvaux, S. Sivathayalan, A. Pugin,L. Chouinard, K. Khaheshi Banab, H. Crow, M. Tremblay, D. Perret,and P. Rosset (2010). Seismic microzonation of Montreal and Ottawa,Canada, in Proc. of the 9th U.S. Nat. 10th Canadian Conf. onEarthquake Eng., Toronto, Canada, Paper 1594.
Nowak, A. S., and K. R. Collins (2000). Reliability of Structures,McGraw-Hill, New York, New York.
Robertson, P. K., and C. E. F. Wride (1998). Evaluating cyclic liquefactionpotential using the cone penetration test, Canadian Geotech. J. 35,442–459.
Salloum, T. (2008). Probabilistic assessments of soil liquefaction hazard,Ph.D. Thesis, Carleton University, Ottawa, Canada.
Seed, H. B., and I. M. Idriss (1971). Simplified procedure for evaluatingsoil liquefaction potential, J. Soil Mech. Found. Div. 97, 1249–1273.
Seed, H. B., K. Tokimatsu, L. F. Harder, and R. Chung (1985). The influenceof SPT procedures in soil liquefaction resistance evaluations,J. Geotech. Eng. 111, 1425–1445.
Toprak, S., and T. L. Holzer (2003). Liquefaction potential index: Fieldassessment, J. Geotech. Geoenviron. Eng. 129, 315–322.
Youd, T. L., I. M. Idriss, R. D. Andrus, I. Arango, G. Castro, J. T. Christian,R. Dobry, W. D. L. Finn, L. F. Harder Jr., M. E. Hynes, K. Ishihara, J.P. Koester, S. S. C. Liao, W. F. Marcuson III, G. R. Martin, J. K. Mitch-ell, Y. Moriwaki, M. S. Power, P. K. Robertson, R. B. Seed, and K. H.Stokoe II (2001). Liquefaction resistance of soils: Summary reportfrom the 1996 NCEER and 1998 NCEER/NSF workshops on evalua-tion of liquefaction resistance of soils, J. Geotech. Geoenviron. Eng.127, 817–833.
200 K. Goda, G. M. Atkinson, J. A. Hunter, H. Crow, and D. Motazedian
Department of Civil EngineeringUniversity of BristolQueen’s Building, University WalkBristol, BS8 1TR, United [email protected]
(K.G.)
Department of Earth SciencesUniversity of Western Ontario1151 Richmond Street, LondonOntario N6A 5B7, [email protected]
(G.M.A.)
Geological Survey of Canada601 Booth Street, OttawaOntario K1A 0E8, [email protected]@NRCan‑RNCan.gc.ca
(J.A.H., H.C.)
Department of Earth SciencesCarleton University1125 Colonel DriveOttawa K1S 5B6, [email protected]
(D.M.)
Manuscript received 9 April 2010
Probabilistic Liquefaction Hazard Analysis for Four Canadian Cities 201