Liquefaction Phenomena Induced by the 26 November 2019 ...
29
geosciences Article Liquefaction Phenomena Induced by the 26 November 2019, Mw = 6.4 Durrës (Albania) Earthquake and Liquefaction Susceptibility Assessment in the Affected Area Spyridon Mavroulis 1, *, Efthymios Lekkas 1 and Panayotis Carydis 2 Citation: Mavroulis, S.; Lekkas, E.; Carydis, P. Liquefaction Phenomena Induced by the 26 November 2019, Mw = 6.4 Durrës (Albania) Earthquake and Liquefaction Susceptibility Assessment in the Affected Area. Geosciences 2021, 11, 215. https://doi.org/10.3390/ geosciences11050215 Academic Editors: Jesus Martinez-Frias and Salvatore Grasso Received: 5 April 2021 Accepted: 12 May 2021 Published: 14 May 2021 Publisher’s Note: MDPI stays neutral with regard to jurisdictional claims in published maps and institutional affil- iations. Copyright: © 2021 by the authors. Licensee MDPI, Basel, Switzerland. This article is an open access article distributed under the terms and conditions of the Creative Commons Attribution (CC BY) license (https:// creativecommons.org/licenses/by/ 4.0/). 1 Department of Dynamic Tectonic Applied Geology, Faculty of Geology and Geoenvironment, National and Kapodistrian University of Athens, 15784 Athens, Greece; [email protected] 2 European Academy of Sciences and Arts, A-5020 Salzburg, Austria; [email protected] * Correspondence: [email protected] Abstract: On 26 November 2019, an Mw = 6.4 earthquake struck the central-western part of Albania. Its impact comprises secondary earthquake environmental effects (EEE) and severe building damage within the Periadriatic and the Tirana Depressions. EEE comprised mainly liquefaction phenomena in coastal, riverine, and lagoonal sites of the earthquake-affected area. From the evaluation of all available earthquake-related data, it is concluded that liquefaction sites are not randomly distributed within the affected area but are structurally and lithologically controlled. The affected areas are distributed within NW–SE striking zones formed in graben-like syncline areas with NW–SE trending fold axes. These graben-like areas are bounded by NW–SE striking marginal thrust faults and are filled with geological formations of Neogene to Quaternary age. These NW–SE striking zones and structures coincide with the NW–SE striking seismogenic thrust fault of the November 2019 earthquake as it is derived from the provided fault plane solutions. An approach for liquefaction susceptibility assessment is applied based on geological and seismological data and on liquefaction inventory. From the comparison of the compiled liquefaction inventory and the susceptibility maps, it is concluded that the majority of the observed liquefaction has been generated in very high and high susceptible areas. Keywords: earthquake environmental effects; liquefaction phenomena; liquefaction susceptibility; sand boils; ground cracks; Periadriatic Depression; Tirana Depression 1. Introduction On 26 November 2019, an Mw = 6.4 earthquake struck the central-western Albania (Figure 1) with impact on the local population, the natural environment, buildings and life- lines [1,2]. Earthquake environmental effects comprising mainly liquefaction phenomena as well as severe structural and non-structural building damage have been observed in the municipalities of Durrës, Tirana, Krujë, Shijak, Kamëz, Kavajë, Kurbin, and Lezhë [1,3,4] (Figure 1). Geosciences 2021, 11, 215. https://doi.org/10.3390/geosciences11050215 https://www.mdpi.com/journal/geosciences
-
Upload
khangminh22 -
Category
Documents
-
view
3 -
download
0
Transcript of Liquefaction Phenomena Induced by the 26 November 2019 ...

geosciences
Article
Liquefaction Phenomena Induced by the 26 November 2019,Mw = 6.4 Durrës (Albania) Earthquake and LiquefactionSusceptibility Assessment in the Affected Area
Spyridon Mavroulis 1,*, Efthymios Lekkas 1 and Panayotis Carydis 2
�����������������
Citation: Mavroulis, S.; Lekkas, E.;
Carydis, P. Liquefaction Phenomena
Induced by the 26 November 2019,
Mw = 6.4 Durrës (Albania)
Earthquake and Liquefaction
Susceptibility Assessment in the
Affected Area. Geosciences 2021, 11,
215. https://doi.org/10.3390/
geosciences11050215
Academic Editors: Jesus Martinez-Frias
and Salvatore Grasso
Received: 5 April 2021
Accepted: 12 May 2021
Published: 14 May 2021
Publisher’s Note: MDPI stays neutral
with regard to jurisdictional claims in
published maps and institutional affil-
iations.
Copyright: © 2021 by the authors.
Licensee MDPI, Basel, Switzerland.
This article is an open access article
distributed under the terms and
conditions of the Creative Commons
Attribution (CC BY) license (https://
creativecommons.org/licenses/by/
4.0/).
1 Department of Dynamic Tectonic Applied Geology, Faculty of Geology and Geoenvironment,National and Kapodistrian University of Athens, 15784 Athens, Greece; [email protected]
2 European Academy of Sciences and Arts, A-5020 Salzburg, Austria; [email protected]* Correspondence: [email protected]
Abstract: On 26 November 2019, an Mw = 6.4 earthquake struck the central-western part of Albania.Its impact comprises secondary earthquake environmental effects (EEE) and severe building damagewithin the Periadriatic and the Tirana Depressions. EEE comprised mainly liquefaction phenomenain coastal, riverine, and lagoonal sites of the earthquake-affected area. From the evaluation of allavailable earthquake-related data, it is concluded that liquefaction sites are not randomly distributedwithin the affected area but are structurally and lithologically controlled. The affected areas aredistributed within NW–SE striking zones formed in graben-like syncline areas with NW–SE trendingfold axes. These graben-like areas are bounded by NW–SE striking marginal thrust faults andare filled with geological formations of Neogene to Quaternary age. These NW–SE striking zonesand structures coincide with the NW–SE striking seismogenic thrust fault of the November 2019earthquake as it is derived from the provided fault plane solutions. An approach for liquefactionsusceptibility assessment is applied based on geological and seismological data and on liquefactioninventory. From the comparison of the compiled liquefaction inventory and the susceptibility maps,it is concluded that the majority of the observed liquefaction has been generated in very high andhigh susceptible areas.
Keywords: earthquake environmental effects; liquefaction phenomena; liquefaction susceptibility;sand boils; ground cracks; Periadriatic Depression; Tirana Depression
1. Introduction
On 26 November 2019, an Mw = 6.4 earthquake struck the central-western Albania(Figure 1) with impact on the local population, the natural environment, buildings and life-lines [1,2]. Earthquake environmental effects comprising mainly liquefaction phenomenaas well as severe structural and non-structural building damage have been observed in themunicipalities of Durrës, Tirana, Krujë, Shijak, Kamëz, Kavajë, Kurbin, and Lezhë [1,3,4](Figure 1).
Geosciences 2021, 11, 215. https://doi.org/10.3390/geosciences11050215 https://www.mdpi.com/journal/geosciences
Geosciences 2021, 11, 215 2 of 29Geosciences 2021, 11, x FOR PEER REVIEW 2 of 30
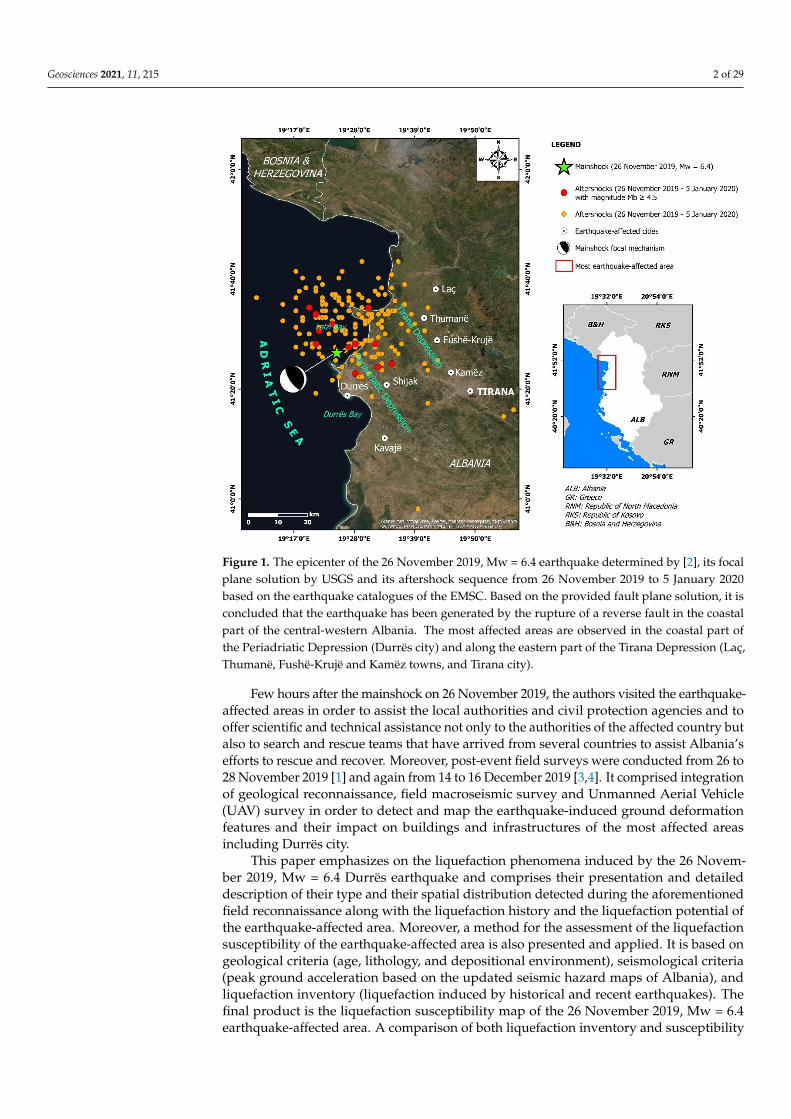
Figure 1. The epicenter of the 26 November 2019, Mw = 6.4 earthquake determined by [2], its focal plane solution by USGS and its aftershock sequence from 26 November 2019 to 5 January 2020 based on the earthquake catalogues of the EMSC. Based on the provided fault plane solution, it is concluded that the earthquake has been generated by the rupture of a reverse fault in the coastal part of the central-western Albania. The most affected areas are observed in the coastal part of the Periadriatic Depression (Durrës city) and along the eastern part of the Tirana Depression (Laç, Thumanë, Fushë-Krujë and Kamëz towns, and Tirana city).
This paper emphasizes on the liquefaction phenomena induced by the 26 November 2019, Mw = 6.4 Durrës earthquake and comprises their presentation and detailed descrip-tion of their type and their spatial distribution detected during the aforementioned field reconnaissance along with the liquefaction history and the liquefaction potential of the earthquake-affected area. Moreover, a method for the assessment of the liquefaction sus-ceptibility of the earthquake-affected area is also presented and applied. It is based on geological criteria (age, lithology, and depositional environment), seismological criteria (peak ground acceleration based on the updated seismic hazard maps of Albania), and liquefaction inventory (liquefaction induced by historical and recent earthquakes). The final product is the liquefaction susceptibility map of the 26 November 2019, Mw = 6.4 earthquake-affected area. A comparison of both liquefaction inventory and susceptibility map is also conducted in order to draw conclusions on the spatial distribution of the liq-uefaction phenomena induced by the earthquake. Additionally, the factors controlling the distribution of the ground deformation features are also studied and discussed.
2. The 26 November 2019, Mw = 6.4, Durrës (Albania) Earthquake On 26 November 2019, at 02:54:12 GMT (03:54:12 CET), an earthquake struck the cen-
tral western part of Albania (Figure 1). It was assessed as Mw = 6.4 [2]. Based on P and S phases recorded mainly in Greek stations and by using velocity models, Papadopoulos et al. [2] recalculated the hypocenter location and found an epicenter (41.4453° N, 19.4141°
Figure 1. The epicenter of the 26 November 2019, Mw = 6.4 earthquake determined by [2], its focalplane solution by USGS and its aftershock sequence from 26 November 2019 to 5 January 2020based on the earthquake catalogues of the EMSC. Based on the provided fault plane solution, it isconcluded that the earthquake has been generated by the rupture of a reverse fault in the coastalpart of the central-western Albania. The most affected areas are observed in the coastal part ofthe Periadriatic Depression (Durrës city) and along the eastern part of the Tirana Depression (Laç,Thumanë, Fushë-Krujë and Kamëz towns, and Tirana city).
Few hours after the mainshock on 26 November 2019, the authors visited the earthquake-affected areas in order to assist the local authorities and civil protection agencies and tooffer scientific and technical assistance not only to the authorities of the affected country butalso to search and rescue teams that have arrived from several countries to assist Albania’sefforts to rescue and recover. Moreover, post-event field surveys were conducted from 26 to28 November 2019 [1] and again from 14 to 16 December 2019 [3,4]. It comprised integrationof geological reconnaissance, field macroseismic survey and Unmanned Aerial Vehicle(UAV) survey in order to detect and map the earthquake-induced ground deformationfeatures and their impact on buildings and infrastructures of the most affected areasincluding Durrës city.
This paper emphasizes on the liquefaction phenomena induced by the 26 Novem-ber 2019, Mw = 6.4 Durrës earthquake and comprises their presentation and detaileddescription of their type and their spatial distribution detected during the aforementionedfield reconnaissance along with the liquefaction history and the liquefaction potential ofthe earthquake-affected area. Moreover, a method for the assessment of the liquefactionsusceptibility of the earthquake-affected area is also presented and applied. It is based ongeological criteria (age, lithology, and depositional environment), seismological criteria(peak ground acceleration based on the updated seismic hazard maps of Albania), andliquefaction inventory (liquefaction induced by historical and recent earthquakes). Thefinal product is the liquefaction susceptibility map of the 26 November 2019, Mw = 6.4earthquake-affected area. A comparison of both liquefaction inventory and susceptibility

Geosciences 2021, 11, 215 3 of 29
map is also conducted in order to draw conclusions on the spatial distribution of theliquefaction phenomena induced by the earthquake. Additionally, the factors controllingthe distribution of the ground deformation features are also studied and discussed.
2. The 26 November 2019, Mw = 6.4, Durrës (Albania) Earthquake
On 26 November 2019, at 02:54:12 GMT (03:54:12 CET), an earthquake struck the centralwestern part of Albania (Figure 1). It was assessed as Mw = 6.4 [2]. Based on P and S phasesrecorded mainly in Greek stations and by using velocity models, Papadopoulos et al. [2]recalculated the hypocenter location and found an epicenter (41.4453◦ N, 19.4141◦ E) locatedoffshore, in Lalzi Bay, but close to the coast, at a distance of about 17 km north of Dürres(Figure 1).
From regional tectonics, the causal fault is a NW–SE striking and E–NE dippingreverse fault [2], implying that the affected area is situated at the hangingwall domainof the causative fault. The rupture was complex. One main patch was observed at thesouth and a second one at the north with maximum slips of ~1.5 and ~1 m, respectively [2].As regards the prevailing component of the rupture process, the thrust-type componentprevailed as the rake vector at the main slip area was 99◦ [2].
Based on [5], the earthquake occurred deep in the crust on a low-angle (23◦) faultdipping towards E, with a centroid at 16.5 km depth, while the best-fitting length andwidth of the fault are 22 and 13 km, and the reverse slip, 0.55 m. Its geometry coincideswith a blind thrust fault that may root on the main basal thrust, along the thrust front thatseparates Adria–Apulia from Eurasia.
Based on the preliminary report on the 26 November 2019, Mw = 6.4 Durrës earth-quake and the analysis of its aftershock sequence conducted by [6], it is concluded that theslow decrease in the number of aftershocks with time is characterized by several repeatedgaps, which have been subsequently followed by an increase in the observed magnitude.The aftershock sequence until 5 January 2020, based on the earthquake catalogues providedby the EMSC, included 173 aftershocks with magnitude 3.0 ≤ ML ≤ 4.5 and 8 aftershockswith magnitude ML > 4.5 (Figure 1). Taking into account the focal mechanism solution us-ing the moment tensor inversion applied to all aftershocks with local magnitude ML > 3.8conducted by [6], it is concluded that the majority of the aftershocks has been generated byrupture of a thrust fault. From the horizontal projection of slip and the distribution of therecorded aftershocks, it is concluded that the deformation area coincides with the area ofaftershocks determined by the EMSC [2].
The Albania main shock was felt in the neighboring Bosnia and Herzegovina, Mon-tenegro, Serbia, North Macedonia, and Greece, especially in Corfu Island located at thenorthern part of the Ionian Islands, fortunately without fatalities and effects on the naturaland built environment. In Albania, the most affected areas were the port city of Durrësand the town of Thumanë at the central-western Albania, while damage was also reportedin Tirana, Krujë, Shijak, Kamëz, Kavajë, Kurbin, and Lezhë areas [1,3,4] (Figure 1). Thedestruction has been attributed to the synergy of several factors comprising strong groundmotion (maximum peak ground acceleration = 192 cm/s2 in Durrës), soil liquefaction, siteamplification, poor building workmanship and construction quality, aging of buildingmaterials, impact of the previous 21 September 2019, Mw = 5.6 foreshock on buildings, andpre-existing stress on buildings sustaining differential displacements because of soft soilconditions in their foundations [1,2]. In the most affected areas of Durrës and Thumanë,the estimated maximum seismic intensity was VIII–IX based on the Modified MercalliIntensity scale and the European Macroseismic Scale 1998 (EMS-98) [2].
Unfortunately, the earthquake claimed the lives of 51 people. The number of injuredwere large reaching more than 900. More than 900 families have been evacuated fromthe affected areas and were in post-earthquake shelters and assembly areas for the firstdays of the emergency phase and later in unaffected hotel facilities in the adjacent Vloraarea. Based on the emergency report of the International Federation of Red Cross and Red

Geosciences 2021, 11, 215 4 of 29
Crescent Societies, the total number of people affected in terms of damage in property isestimated to be 80,000–100,000.
3. Geology of the Earthquake-Affected Areas3.1. Western Most Affected Area
The alpine basement of Durrës area is composed of formations of the Ionian geo-tectonic unit (Figure 2). The central and western parts of the Ionian unit constitute thePeriadriatic Depression, which is mainly filled with Neogene formations comprising clays,marls, conglomerates and sandstones (Figure 2). One of the main tectonic characteristicsof the Periadriatic Depression is the occurrence of the successive linear relatively narrowanticlines and wide synclines of Miocene–Pliocene age [7,8], corresponding to hilly areasand flat lowlands respectively [8]. Two such structures are observed in Durrës city andits surroundings: (i) the Durrës anticline corresponding to Durrës and Bishti i Palles hillslocated west and north of the city and (ii) the Spitalia syncline corresponding to Durrësplain [7,8] (Figure 2).
Geosciences 2021, 11, x FOR PEER REVIEW 4 of 30
of the Periadriatic Depression is the occurrence of the successive linear relatively narrow anticlines and wide synclines of Miocene–Pliocene age [7,8], corresponding to hilly areas and flat lowlands respectively [8]. Two such structures are observed in Durrës city and its surroundings: (i) the Durrës anticline corresponding to Durrës and Bishti i Palles hills located west and north of the city and (ii) the Spitalia syncline corresponding to Durrës plain [7,8] (Figure 2).
Figure 2. The geological map of the area affected by the 26 November 2019, Mw = 6.4 Durrës earthquake. The impact on the natural and built environment was observed in Durrës area located in the Periadriatic Depression and in Laç, Thumanë, Fushë-Krujë, Kamëz, and Tirana areas located in the Tirana Depression. Both affected areas are composed of Quaternary deposits comprising marine, alluvial and marshy deposits and of Neogene deposits comprising Miocene deposits. Marshy deposits are observed in swamps of Durrës, Laç, and Thumanë areas where major dam-age was recorded. The alpine deposits occur along the eastern margin of the Tirana Depression. The main active faults are also presented and comprise mainly reverse faults along the coastal part of the affected area as well as strike-slip and normal faults. The epicenter of the main shock and its fault plane solution are also presented. DS: Durrës syncline, RL: Rinia–Fllakë Lagoon, PL: Patok Lagoon.
The Durrës anticline is composed of Miocene formations and Pliocene deposits (Fig-ure 2). The Miocene formations comprise Messinian molassic formations including clay, siltstone, sandstone and gypsum, with thickness reaching 3 km and dip 60° to 70° to the east. They outcrop along the western side of Durrës hills and Bishti i Palles hills close to Pali Cape at the southern end of Lalzi Bay (Figure 2). The central and eastern part of Dur-rës hills are composed of Pliocene deposits (Figure 2) including the Helmesi formation, which is composed mainly of sandstones, conglomerates and clays with sandstone lenses, with total thickness of 1200 to 1300 m.
The Durrës hills corresponding to Durrës anticline is separated from the Durrës plain corresponding to Spitalia syncline by an active NW–SE striking thrust fault (Durrës back-thrust) (Figure 2), which belongs to the Ionian-Adriatic longitudinal seismogenic zone re-sponsible for the high historical and recent seismicity of the study area [9]. This fault is observed onshore in the eastern side of Durrës hills and it disrupts the formations of the
Figure 2. The geological map of the area affected by the 26 November 2019, Mw = 6.4 Durrës earthquake. The impact on thenatural and built environment was observed in Durrës area located in the Periadriatic Depression and in Laç, Thumanë,Fushë-Krujë, Kamëz, and Tirana areas located in the Tirana Depression. Both affected areas are composed of Quaternarydeposits comprising marine, alluvial and marshy deposits and of Neogene deposits comprising Miocene deposits. Marshydeposits are observed in swamps of Durrës, Laç, and Thumanë areas where major damage was recorded. The alpinedeposits occur along the eastern margin of the Tirana Depression. The main active faults are also presented and comprisemainly reverse faults along the coastal part of the affected area as well as strike-slip and normal faults. The epicenter of themain shock and its fault plane solution are also presented. DS: Durrës syncline, RL: Rinia–Fllakë Lagoon, PL: Patok Lagoon.
The Durrës anticline is composed of Miocene formations and Pliocene deposits(Figure 2). The Miocene formations comprise Messinian molassic formations includingclay, siltstone, sandstone and gypsum, with thickness reaching 3 km and dip 60◦ to 70◦ tothe east. They outcrop along the western side of Durrës hills and Bishti i Palles hills closeto Pali Cape at the southern end of Lalzi Bay (Figure 2). The central and eastern part of

Geosciences 2021, 11, 215 5 of 29
Durrës hills are composed of Pliocene deposits (Figure 2) including the Helmesi formation,which is composed mainly of sandstones, conglomerates and clays with sandstone lenses,with total thickness of 1200 to 1300 m.
The Durrës hills corresponding to Durrës anticline is separated from the Durrësplain corresponding to Spitalia syncline by an active NW–SE striking thrust fault (Durrësbackthrust) (Figure 2), which belongs to the Ionian-Adriatic longitudinal seismogeniczone responsible for the high historical and recent seismicity of the study area [9]. Thisfault is observed onshore in the eastern side of Durrës hills and it disrupts the formationsof the Pali Cape (Figure 2). Its northward and southward offshore extensions withinLalzi Bay and Durrës Bay respectively are displaced by strike-slip faults (Figure 2). Morespecifically, its northward offshore extension within Lalzi Bay is terminated against a NE–SW striking active strike-slip fault, while its southward offshore extension within DurrësBay is displaced to the west by a NE–SW striking active strike-slip fault [7] (Figure 2).
The Spitalia syncline, under the Durrës plain area, is filled up with the PlioceneHelmesi formation (Figure 2). This formation represents the basements of the overlainQuaternary deposits. These deposits include alluvial, lagoonal, and coastal marine depositswith a total thickness of 130 m. More specifically, alluvial deposits are composed ofintercalations of gravels, sands, clayey sands, and clays with maximum total thicknessof about 70 m. Lagoonal deposits are observed above the alluvial ones and represent themarshy deposits of the Durrës plain area, where the Durrës swamp was formed beforeits artificial draining (Figure 2). The marshy deposits include clay, clayey loam, and sandand they are full of organic material. Their maximum thickness has been measured at thecentral part of the former swamp and is about 50 m.
The lowlands of Durrës used to be a swamp, which has been temporarily influencedby the Adriatic Sea. This temporary interaction was terminated after the construction ofthe road leading from Porto Romano to the Bishti i Palles hills (Figure 2), which acted asa barrier. Nowadays, due to the low morphological slope of these lowlands, the water isdrained into the sea through artificial drainage channels and pumping stations. A largepart of the former swamp has been illegally inhabited due to the fact that the area hassuffered from rapid and uncontrolled urbanization and population growth attributed tointernal immigration of population from the northern parts of Albania.
The Holocene marine deposits of the Durrës plain occurred along the coastal partof the affected area and especially along the coast of the Lalzi Bay in the northern partof Durrës, along the Porto Romano coastal area and along the coastal area south of themetropolitan area of Durrës (Figure 2). They consist of sands and clayey sands withmaximum thickness of about 20 m.
As regards the hydrology of the western earthquake-affected area, it constitutes a partof the Erzeni River basin (Figure 2). The Erzeni River basin in the earthquake affected area iscomposed of Quaternary alluvial deposits comprising gravels with thickness ranging from2 to 5 m [10]. As regards its hydrogeological features, it is characterized by the formationof the Rogozhina aquifer. In terms of its water potential, this aquifer is the second mostsignificant in Albania, following the Quaternary alluvial aquifers. It is composed ofpermeable sandstones, conglomerates, and intercalations of impermeable clays [11,12].These formations belong to the Pliocene formations of the Periadriatic Depression [11,12].Its basement is composed of impermeable clays, while its top is covered by semi-permeableQuaternary deposits [11,12]. The semi-permeable Quaternary deposits covering the aquifercomprise alluvial deposits including sandy clays, silts, silty sands, sands, gravels andpebbles, marshy deposits including loam, clays, silts, sands, and organic material indecomposition as well as marine sediments composed mainly of sands [12]. Due to thishydrogeological setting, it constitutes a multilayered aquifer under typically artesianconditions [11]. Unfortunately, this aquifer has been overexploited in Durrës area due toits aforementioned rapid population growth and uncontrolled urban development andexpansion [7] especially in the coastal and the littoral zone.

Geosciences 2021, 11, 215 6 of 29
3.2. Eastern Most Affected Area
The Laç, Thumanë, Fushë-Krujë, and Kamëz towns and the Tirana city are founded inthe eastern inland part of the Periadriatic Depression. As mentioned above, the PeriadriaticDepression is characterized by narrow anticlines and wide synclines [7,8]. In the inlandearthquake affected area, such structure is the Tirana syncline [7,8], which is commonlyreferred as Tirana Depression (Figure 2).
The Tirana Depression is a NW–SE trending basin with length of about 60 km andwidth ranging from 10 to 20 km. It is located at the front of the west-verging Dinaricthrust belt and it corresponds to an asymmetric syncline, which is considered as a foredeepfilled up with a mainly deep-marine sedimentary succession in the offshore Albania. Thepresent Tirana Depression is composed mainly of continental and shallow marine deposits,while its deep marine formations of Oligocene—Early Miocene and Middle—Late Miocenecrop out along its western margin [13] (Figure 2). The sedimentary sequence of the TiranaDepression comprises deposits of Aquitanian—Burdigalian—Helvetian—Tortonian age onits western part and of Tortonian age on its eastern part [14]. The deposits of the westernpart of the Tirana Depression lie unconformably on Oligocene formations. They alsopresent unconformities between Aquitanian and Burdigalian formations and at the base ofTortonian [13]. On the eastern part of the depression the sequence lies unconformably onOligocene and Cretaceous formations [13].
The Tirana Depression is bounded to the east by an active thrust (Dajti thrust)(Figure 2) and to the west by an active backthrust (Preza backthrust) [7] (Figure 2). Theseactive tectonic structures are clearly discernible and form impressive escarpments. Morespecifically, the backthrust along the western margin of the Tirana Depression or along theflank of the Tirana plain forms a morphological discontinuity between the Tirana plainwith elevation of few meters above sea level and the Preza monocline with elevation ofabout 300 m above sea level. These active structures constitute a zone responsible for thegeneration of many earthquakes.
The aforementioned most affected residential areas are located along the easternmargin of the Tirana Depression and close to the morphological discontinuity formedbetween the Tirana plain area and the adjacent semi-mountainous and mountainousareas of Kruja unit [15] (Figure 2). The alpine basement of the eastern margin comprisesOligocene flysch and Upper Cretaceous limestone, while Miocene formations are overlyingthe alpine basement. Pliocene and Holocene deposits are overlying Miocene formations.The most affected towns along the eastern margin of the Tirana Depression are foundedmainly on Holocene deposits.
4. Historical and Recent Seismicity of the November 2019 DurrësEarthquake-Affected Area
Albania is one of the most seismic active countries of Europe [16–18]. Its seismicity ischaracterized by an intensive seismic microactivity (1.0 < M ≤ 3.0), many small earthquakes(3.0 < M ≤ 5.0), rare medium-sized earthquakes (5.0 < M ≤ 7), and rare large earthquakes(M > 7.0) [19–21]. The majority of the historical and recent seismicity have been generatedalong well defined seismogenic zones (Figure 3), including the NW–SE trending Ionian-Adriatic longitudinal seismogenic coastal zone in western Albania among others [9,22,23].The Ionian-Adriatic seismogenic zone marks the boundary between the Adriatic microplateand the Albanian orogen [9] (Figure 3). It extends from the NE-SW trending Shkodra-Pejaseismogenic zone located northwards to the Lushnja-Elbasan-Diber transversal seismogeniczone [9]. The maximum expected magnitude along the Ionian-Adriatic zone is M = 6.9,while the seismicity gradually declines from the folded front to the east.

Geosciences 2021, 11, 215 7 of 29Geosciences 2021, 11, x FOR PEER REVIEW 7 of 30
Figure 3. Earthquakes in Albania from 2004 to 2020 based on the earthquake catalogues of the EMSC. The epicenters are distributed within the main seismogenic zones of Albania. The distribu-tion of the seismogenic zones of Albania is based on [9].
Durrës city is located within the Ionian-Adriatic seismogenic zone (Figure 3). The ancient Durrës city was founded in 627 BC by Greek colonists from Corinth (eastern Cen-tral Greece) and Corfu (northern part of the Ionian Islands) and is one of the oldest inhab-ited areas of Albania. Through the years, Durrës has been affected not only by the benefi-cial effects of its conquerors, but also by the destructive impact of natural phenomena due to its geomorphological and geological setting described above. These natural phenomena comprise mainly earthquakes and their effects on its natural and built environment [16,18,24–29]. Based on the aforementioned sources, Durrës has been almost totally de-stroyed by earthquakes generated on 177 BC, 58 BC, 334 AD, 346 AD, 506 AD, 521, 1273, 1279, 1869, and 1870 resulting in severe human and economic losses [18,29]. More specif-ically, the earthquakes of 334, 345 and 506 AD with maximum Medvedev–Sponheuer–Karnik (MSK or MSK-64) intensity IMAX = VIII–IXMSK-64, the 1273 and 1926 earthquakes with IMAX = IXMSK-64 forced the local population to abandon the devastated Durrës [18,29]. Espe-cially for the 1273 earthquake, Durrës with population of 25,000 people has been totally destroyed. Many fatalities were reported and the affected survivors left the town seeking for other places to live. After this earthquake the importance of Durrës as a city port in the Adriatic Sea has been diminished.
Apart from these earthquakes that have razed Durrës to the ground, the city has been also affected by earthquakes with lower macroseismic intensities and slight damage. These events were generated on 26 August 1852, 16 May 1860, 4 February 1934, 19 August 1970, and 9 January 1988 resulting in maximum macroseismic intensities IMAX = VIMSK-64 [30].
The most significant seismic events that have affected the eastern part of Tirana De-pression are the 1617 Kruja earthquake with Io = VIIIMSK-64, the 26 August 1852 earthquake in Rodoni Cape with Io = VIIIMSK-64, the 16 May 1860 earthquake in Beshiri Bridge with Io = VIIIMSK-64, the 4 February 1934 Ndroq earthquake with magnitude Ms = 5.6, the 19 August
Figure 3. Earthquakes in Albania from 2004 to 2020 based on the earthquake catalogues of the EMSC.The epicenters are distributed within the main seismogenic zones of Albania. The distribution of theseismogenic zones of Albania is based on [9].
Durrës city is located within the Ionian-Adriatic seismogenic zone (Figure 3). Theancient Durrës city was founded in 627 BC by Greek colonists from Corinth (easternCentral Greece) and Corfu (northern part of the Ionian Islands) and is one of the oldestinhabited areas of Albania. Through the years, Durrës has been affected not only by thebeneficial effects of its conquerors, but also by the destructive impact of natural phenom-ena due to its geomorphological and geological setting described above. These naturalphenomena comprise mainly earthquakes and their effects on its natural and built en-vironment [16,18,24–29]. Based on the aforementioned sources, Durrës has been almosttotally destroyed by earthquakes generated on 177 BC, 58 BC, 334 AD, 346 AD, 506 AD, 521,1273, 1279, 1869, and 1870 resulting in severe human and economic losses [18,29]. Morespecifically, the earthquakes of 334, 345 and 506 AD with maximum Medvedev–Sponheuer–Karnik (MSK or MSK-64) intensity IMAX = VIII–IXMSK-64, the 1273 and 1926 earthquakeswith IMAX = IXMSK-64 forced the local population to abandon the devastated Durrës [18,29].Especially for the 1273 earthquake, Durrës with population of 25,000 people has beentotally destroyed. Many fatalities were reported and the affected survivors left the townseeking for other places to live. After this earthquake the importance of Durrës as a cityport in the Adriatic Sea has been diminished.
Apart from these earthquakes that have razed Durrës to the ground, the city has beenalso affected by earthquakes with lower macroseismic intensities and slight damage. Theseevents were generated on 26 August 1852, 16 May 1860, 4 February 1934, 19 August 1970,and 9 January 1988 resulting in maximum macroseismic intensities IMAX = VIMSK-64 [30].
The most significant seismic events that have affected the eastern part of Tirana De-pression are the 1617 Kruja earthquake with Io = VIIIMSK-64, the 26 August 1852 earthquakein Rodoni Cape with Io = VIIIMSK-64, the 16 May 1860 earthquake in Beshiri Bridge withIo = VIIIMSK-64, the 4 February 1934 Ndroq earthquake with magnitude Ms = 5.6, the 19 Au-

Geosciences 2021, 11, 215 8 of 29
gust 1970 Vrapi earthquake with magnitude Ms = 5.5 and Io = VIIMSK-64, the 16 September1975 Rodoni Cape earthquake with magnitude Ms = 5.3, the 22 November 1985 Drini Gulfearthquake with magnitude Ms = 5.5, and the 11 January 1988 Tirana earthquake withmagnitude Ms = 5.4 and Io = VII–VIIIMSK-64 [31,32].
5. Liquefaction Induced by the November 2019 Durrës Earthquake
The 26 November 2019, Mw = 6.4 Durrës earthquake induced secondary earthquakeenvironmental effects comprising slope movements and liquefaction phenomena. Inthis chapter, emphasis is given on the induced liquefaction phenomena along with theliquefaction history, the expected surface deformation and the liquefaction potential of theearthquake-affected areas.
5.1. Liquefaction History of the Area Affected by the November 2019 Earthquake
During strong earthquakes of the 20th century in Albania, earthquake-induced lique-faction phenomena have been observed mainly in the Periadriatic Depression [18,33–37](Figure 4). The main types of observed liquefaction phenomena from 1905 to 1979 comprise:(i) lateral spreading and ground settlements, (ii) ejection of liquefied material from groundcracks and formation of sand boils and (iii) failure of riverbanks [18,28] (Figure 4). Charac-teristic earthquakes that have triggered liquefaction along the western part of Albania arethe 1905, 1926, 1948, 1959, 1962, and 1979 earthquakes [18,28,34].
Geosciences 2021, 11, x FOR PEER REVIEW 8 of 30
1970 Vrapi earthquake with magnitude Ms = 5.5 and Io = VIIMSK-64, the 16 September 1975 Rodoni Cape earthquake with magnitude Ms = 5.3, the 22 November 1985 Drini Gulf earthquake with magnitude Ms = 5.5, and the 11 January 1988 Tirana earthquake with magnitude Ms = 5.4 and Io = VII–VIIIMSK-64 [31,32].
5. Liquefaction Induced by the November 2019 Durrës Earthquake The 26 November 2019, Mw = 6.4 Durrës earthquake induced secondary earthquake
environmental effects comprising slope movements and liquefaction phenomena. In this chapter, emphasis is given on the induced liquefaction phenomena along with the lique-faction history, the expected surface deformation and the liquefaction potential of the earthquake-affected areas.
5.1. Liquefaction History of the Area Affected by the November 2019 Earthquake During strong earthquakes of the 20th century in Albania, earthquake-induced liq-
uefaction phenomena have been observed mainly in the Periadriatic Depression [18,33–37] (Figure 4). The main types of observed liquefaction phenomena from 1905 to 1979 comprise: (i) lateral spreading and ground settlements, (ii) ejection of liquefied material from ground cracks and formation of sand boils and (iii) failure of riverbanks [18,28] (Fig-ure 4). Characteristic earthquakes that have triggered liquefaction along the western part of Albania are the 1905, 1926, 1948, 1959, 1962, and 1979 earthquakes [18,28,34].
Figure 4. Earthquake-induced liquefaction phenomena from 1905 to 1979 in western Albania. They have been observed mainly in the Periadriatic Depression. The 2019 liquefaction phenomena in the area of Durrës are also presented.
5.2. Deformation Expected in Durrës Affected Area and its Liquefaction Potential Based on the microzonation map of Durrës city expressed through seismic intensity
in degrees of the MSK-64 scale [18], it is concluded that the Durrës city is an area, where big deformations on the free surface are expected in the event of an earthquake including
Figure 4. Earthquake-induced liquefaction phenomena from 1905 to 1979 in western Albania. Theyhave been observed mainly in the Periadriatic Depression. The 2019 liquefaction phenomena in thearea of Durrës are also presented.
5.2. Deformation Expected in Durrës Affected Area and its Liquefaction Potential
Based on the microzonation map of Durrës city expressed through seismic intensityin degrees of the MSK-64 scale [18], it is concluded that the Durrës city is an area, wherebig deformations on the free surface are expected in the event of an earthquake includingliquefaction phenomena among others. Moreover, three smaller areas within Durrës city

Geosciences 2021, 11, 215 9 of 29
are also observed with different predominant periods and expected seismic intensities(Figure 5):
1. Areas of big deformation on free surface, with predominant periods larger than0.5–0.6 s and seismic intensities larger than IXMSK-64.
2. Areas with predominant periods equal to 0.4–0.5 s and seismic intensities rangingfrom VIII 1
2 MSK-64 to IXMSK-64.3. Steep slopes more than 15◦.
Geosciences 2021, 11, x FOR PEER REVIEW 9 of 30
liquefaction phenomena among others. Moreover, three smaller areas within Durrës city are also observed with different predominant periods and expected seismic intensities (Figure 5):
1: Areas of big deformation on free surface, with predominant periods larger than 0.5–0.6 sec and seismic intensities larger than IXMSK-64.
2: Areas with predominant periods equal to 0.4–0.5 sec and seismic intensities rang-ing from VIII½MSK-64 to IXMSK-64.
3: Steep slopes more than 15°.
Figure 5. Durrës city is an area, where big deformations on surface are expected in the event of an earthquake including liquefaction phenomena based on [18,28]. The maximum expected MSK-64 intensities are larger than IX. Based on the liquefaction potential of Durrës, three areas can be dis-tinguished: (1) highly, (2) moderately, and (3) lowly susceptible areas (from [28], modified).
Taking into account the geological and tectonic setting of Durrës area described above, the spatial distribution of the induced liquefaction phenomena along the western coastal part of the Periadriatic Depression [28] and from analytical approaches performed by [28] for the assessment of liquefaction potential in Durrës city, it is concluded that it is an area with high potential for liquefaction (Figure 5). More specifically, three areas with different potential for liquefaction can be distinguished in the city: (i) areas highly suscep-tible, (ii) areas moderately susceptible, and (iii) areas of low susceptibility to liquefaction [28] (Figure 5). The highly susceptible area is the metropolitan area of Durrës comprising the port and the surrounding areas (Figure 5), which is composed by Holocene marshy deposits. The area with moderate potential to liquefaction consists of Holocene alluvial deposits, while the area with low susceptibility to liquefaction comprises Pliocene depos-its with clays and conglomerates [14].
5.3. Liquefaction Phenomena Induced by the November 2019 Earthquake 5.3.1. Liquefaction Phenomena in the Coastal Part of Southern Durrës
The fact that the coastal part of Durrës is a dynamic terrain subjected to ongoing changes and processes affecting the natural and built environment was strongly con-firmed after the 2019 Mw = 6.4 earthquake by the induced environmental effects and the
Figure 5. Durrës city is an area, where big deformations on surface are expected in the event ofan earthquake including liquefaction phenomena based on [18,28]. The maximum expected MSK-64 intensities are larger than IX. Based on the liquefaction potential of Durrës, three areas can bedistinguished: (1) highly, (2) moderately, and (3) lowly susceptible areas (from [28], modified).
Taking into account the geological and tectonic setting of Durrës area described above,the spatial distribution of the induced liquefaction phenomena along the western coastalpart of the Periadriatic Depression [28] and from analytical approaches performed by [28]for the assessment of liquefaction potential in Durrës city, it is concluded that it is an areawith high potential for liquefaction (Figure 5). More specifically, three areas with differentpotential for liquefaction can be distinguished in the city: (i) areas highly susceptible,(ii) areas moderately susceptible, and (iii) areas of low susceptibility to liquefaction [28](Figure 5). The highly susceptible area is the metropolitan area of Durrës comprisingthe port and the surrounding areas (Figure 5), which is composed by Holocene marshydeposits. The area with moderate potential to liquefaction consists of Holocene alluvialdeposits, while the area with low susceptibility to liquefaction comprises Pliocene depositswith clays and conglomerates [14].
5.3. Liquefaction Phenomena Induced by the November 2019 Earthquake5.3.1. Liquefaction Phenomena in the Coastal Part of Southern Durrës
The fact that the coastal part of Durrës is a dynamic terrain subjected to ongoingchanges and processes affecting the natural and built environment was strongly confirmedafter the 2019 Mw = 6.4 earthquake by the induced environmental effects and the resultedbuilding damage. Post-earthquake disaster survey was conducted in the field including

Geosciences 2021, 11, 215 10 of 29
also the deployment of an Unmanned Aircraft System. The system comprised a DJI Mavic2 Zoom UAV, a ground controller and a smartphone. The flight plan was designed to coverthe wider area of the detected liquefaction phenomena. Thus, the detected phenomena andtheir impact were observed by using not only field but also aerial information.
Liquefaction phenomena were generated in the southern coastal part of the Durrëscity, in a distance of about 2 km east of the port (Figure 6) and almost 16 km south ofthe epicenter. More specifically, they were observed along the coastal road SH4 leadingfrom Durrës to Shkëmbi I Kavajes (Figure 6). This area is overpopulated. Many structures,including multistorey hotels and residential buildings are built on the littoral zone of thearea, in a small distance from the shoreline. These structures have shallow foundationsembedded to the upper part of the soil, usually at a depth of 2.0 to 4.0 m.
Geosciences 2021, 11, x FOR PEER REVIEW 10 of 30
resulted building damage. Post-earthquake disaster survey was conducted in the field in-cluding also the deployment of an Unmanned Aircraft System. The system comprised a DJI Mavic 2 Zoom UAV, a ground controller and a smartphone. The flight plan was de-signed to cover the wider area of the detected liquefaction phenomena. Thus, the detected phenomena and their impact were observed by using not only field but also aerial infor-mation.
Liquefaction phenomena were generated in the southern coastal part of the Durrës city, in a distance of about 2 km east of the port (Figure 6) and almost 16 km south of the epicenter. More specifically, they were observed along the coastal road SH4 leading from Durrës to Shkëmbi I Kavajes (Figure 6). This area is overpopulated. Many structures, in-cluding multistorey hotels and residential buildings are built on the littoral zone of the area, in a small distance from the shoreline. These structures have shallow foundations embedded to the upper part of the soil, usually at a depth of 2.0 to 4.0 m.
(a) (b)
(c) (d)
Figure 6. Cont.

Geosciences 2021, 11, 215 11 of 29Geosciences 2021, 11, x FOR PEER REVIEW 11 of 30
(e) (f)
(g)
Figure 6. Liquefaction phenomena observed in the littoral part east of Durrës port (a). (b) Drone view of the totally col-lapsed Mira Mare hotel. Liquefaction phenomena were generated close to the collapsed hotel. The observed damage can be attributed partially to liquefaction. (c,d) Pavements close to the collapsed Mira Mare hotel were covered by liquefied material. (e) Sand boils were also observed. Liquefied material was also ejected through NW–SE trending ground cracks (f,g).
Liquefied material comprising sand and water was ejected from ground cracks with length of up to 2 m resulting in formation of sand boils with diameter of about 20 cm and pavements covered with liquefied material (Figure 6). The site is located in a distance of only 35 m from the shoreline and is composed mainly of coastal marine deposits of the Durrës Bay. The main lithologies prevailing at this site are sands and silts. As regards the hydrogeology of this area, the groundwater level is shallow. It is significant to note that slight liquefaction phenomena have been observed in this coastal part by the 21 September 2019, Mw = 5.6 Durrës earthquake and comprised small scale subsidence detected along pavements close to the sea shore without any impact on the built environment [38].
These liquefaction phenomena were observed in an area where buildings with rein-forced concrete frame and infill brick walls suffered from very heavy structural damage including collapse and tilting, while the adjacent buildings suffered only non-structural damage (Figures 6 and 7). These buildings were the Villa Verde, Mira Mare, and Lubjana hotels (Figures 6 and 7). The Mira Mare hotel was about 30 m from the liquefaction site and entirely collapsed. The liquefaction phenomena observed in this site may contribute
Figure 6. Liquefaction phenomena observed in the littoral part east of Durrës port (a). (b) Drone view of the totally collapsedMira Mare hotel. Liquefaction phenomena were generated close to the collapsed hotel. The observed damage can beattributed partially to liquefaction. (c,d) Pavements close to the collapsed Mira Mare hotel were covered by liquefied material.(e) Sand boils were also observed. Liquefied material was also ejected through NW–SE trending ground cracks (f,g).
Liquefied material comprising sand and water was ejected from ground cracks withlength of up to 2 m resulting in formation of sand boils with diameter of about 20 cm andpavements covered with liquefied material (Figure 6). The site is located in a distance ofonly 35 m from the shoreline and is composed mainly of coastal marine deposits of theDurrës Bay. The main lithologies prevailing at this site are sands and silts. As regards thehydrogeology of this area, the groundwater level is shallow. It is significant to note thatslight liquefaction phenomena have been observed in this coastal part by the 21 September2019, Mw = 5.6 Durrës earthquake and comprised small scale subsidence detected alongpavements close to the sea shore without any impact on the built environment [38].
These liquefaction phenomena were observed in an area where buildings with rein-forced concrete frame and infill brick walls suffered from very heavy structural damageincluding collapse and tilting, while the adjacent buildings suffered only non-structuraldamage (Figures 6 and 7). These buildings were the Villa Verde, Mira Mare, and Lubjanahotels (Figures 6 and 7). The Mira Mare hotel was about 30 m from the liquefaction siteand entirely collapsed. The liquefaction phenomena observed in this site may contributeto the initial sinking and tilting of the building that led to its final pancake collapse. Thetwo lower floors of the Villa Verde hotel, located about 100 m from the liquefaction site,

Geosciences 2021, 11, 215 12 of 29
collapsed during the November earthquake, while the upper floors of the structure re-mained almost intact (Figure 7). The Lubjana hotel, about 75 m from the liquefaction site,presented tilting due to failure of the ground floor columns in the back of the building(Figure 7). All buildings were demolished few days after the completion of the search andrescue operations and the rubbles were completely removed.
Geosciences 2021, 11, x FOR PEER REVIEW 12 of 30
to the initial sinking and tilting of the building that led to its final pancake collapse. The two lower floors of the Villa Verde hotel, located about 100 m from the liquefaction site, collapsed during the November earthquake, while the upper floors of the structure re-mained almost intact (Figure 7). The Lubjana hotel, about 75 m from the liquefaction site, presented tilting due to failure of the ground floor columns in the back of the building (Figure 7). All buildings were demolished few days after the completion of the search and rescue operations and the rubbles were completely removed.
(a) (b)
(c) (d)
Figure 7. (a) Drone view of one of the most affected areas by the 26 November 2019, Mw = 6.4 Durrës earthquake. Three hotels suffered very heavy damage. (b) Vila Verde Hotel partially collapsed. (c) Lubjana Hotel tilted after damage of the failure of the columns in the ground floor. (d) Mira Mare Hotel totally collapsed. The adjacent buildings suffered only non-structural damage.
The area with the three heavily damaged hotels is close to the sea and is composed of unconsolidated recent deposits that constitute the soft ground of the area. The soft ground usually suffers differential displacements including subsidence among others [7,39]. The multistorey buildings are constantly trying to adapt to these displacements and restabilize. This adaptation and restabilization of the buildings is putting more strain on their structural and non-structural elements resulting in either slight deformation or fail-ure of these elements. When a strong earthquake occurs in a distance from the soft ground and from the founded multistorey buildings, then the synergy of several factors may re-sult in destruction. The most significant detected factors for this earthquake affected area comprise the earthquake loading along with the local soil conditions, the shallow ground-water table, and its saline conditions due to the sea proximity, the subsidence of the area due to neotectonic activity, aquifer and hydrocarbon exploitation, the construction de-fects, and the pre-existing stress of the building. These structures suffer also from materi-als ageing processes more than those founded on hard and consolidated soil.
In this case, the hotels were founded on soft ground in a distance of about 25 km from the earthquake epicenter. The underground water table was shallow due to the proximity
Figure 7. (a) Drone view of one of the most affected areas by the 26 November 2019, Mw = 6.4 Durrës earthquake. Threehotels suffered very heavy damage. (b) Vila Verde Hotel partially collapsed. (c) Lubjana Hotel tilted after damage of thefailure of the columns in the ground floor. (d) Mira Mare Hotel totally collapsed. The adjacent buildings suffered onlynon-structural damage.
The area with the three heavily damaged hotels is close to the sea and is composed ofunconsolidated recent deposits that constitute the soft ground of the area. The soft groundusually suffers differential displacements including subsidence among others [7,39]. Themultistorey buildings are constantly trying to adapt to these displacements and restabilize.This adaptation and restabilization of the buildings is putting more strain on their structuraland non-structural elements resulting in either slight deformation or failure of theseelements. When a strong earthquake occurs in a distance from the soft ground andfrom the founded multistorey buildings, then the synergy of several factors may result indestruction. The most significant detected factors for this earthquake affected area comprisethe earthquake loading along with the local soil conditions, the shallow groundwater table,and its saline conditions due to the sea proximity, the subsidence of the area due toneotectonic activity, aquifer and hydrocarbon exploitation, the construction defects, andthe pre-existing stress of the building. These structures suffer also from materials ageingprocesses more than those founded on hard and consolidated soil.
In this case, the hotels were founded on soft ground in a distance of about 25 km fromthe earthquake epicenter. The underground water table was shallow due to the proximityto the sea and to the October and November pre-earthquake high precipitation, which isthe maximum precipitation of the year in this coastal area of Albania.

Geosciences 2021, 11, 215 13 of 29
As indicated above, this area is characterized by shallow underground water tableand variation of the relief of the basement beneath the recent deposits. According to [40],the seismic intensity may increase by two degrees due to the synergy of the shallowunderground water level and the variety of the relief (Figure 8).
Geosciences 2021, 11, x FOR PEER REVIEW 13 of 30
to the sea and to the October and November pre-earthquake high precipitation, which is the maximum precipitation of the year in this coastal area of Albania.
As indicated above, this area is characterized by shallow underground water table and variation of the relief of the basement beneath the recent deposits. According to [40], the seismic intensity may increase by two degrees due to the synergy of the shallow un-derground water level and the variety of the relief (Figure 8).
Figure 8. Intensity variation depending on ground condition (from [40], modified).
Similar increase of the seismic intensity could have been generated due to local ground conditions in this coastal part of the Durrës city, as also supported by [18,28]. Moreover, the pre-existing stress of the buildings is attributed to their adaptation on the differential movements of the soft ground and their restabilization resulting in small dam-age, which is homologous to earthquake-induced damage. Thus, the November earth-quake hit structures overstrained not only from these differential movements but also from the 21 September 2019, Mw = 5.6 Durrës foreshock.
5.3.2. Liquefaction Phenomena in Rinia—Fllakë Lagoon The Lalzi Bay is located north of the Durrës plain area (Figure 9). Its coastal part ex-
tends with a length of about 10 km from the Pali Cape in its southern end to the Rodoni Cape in its northern end. From the geological point of view, the coastal part is composed of Tertiary and Quaternary deposits [14]. More specifically, Pali Cape comprises Mes-sinian molasse including sands, conglomerates, clays, and silts [41]. Moreover, Rodoni Cape is composed mainly of Messinian formations and secondarily of Pliocene formations [41]. As regards the present geomorphology of the coastal part of the Lalzi Bay, the Erzeni River is the main sediment supplier of the coastal zone (Figure 9), and one of the factors controlling the distribution of Quaternary deposits in the area. The Quaternary is repre-sented by Holocene lagoonal and marine deposits in the outer part of the coastal zone and by Holocene alluvial deposits in the inner part. The alluvial deposits include conglomer-ates, sands and clays, the lagoonal deposits comprise sands, silt, and clays and the marine ones mainly sand [14].
Figure 8. Intensity variation depending on ground condition (from [40], modified).
Similar increase of the seismic intensity could have been generated due to local groundconditions in this coastal part of the Durrës city, as also supported by [18,28]. Moreover,the pre-existing stress of the buildings is attributed to their adaptation on the differentialmovements of the soft ground and their restabilization resulting in small damage, which ishomologous to earthquake-induced damage. Thus, the November earthquake hit structuresoverstrained not only from these differential movements but also from the 21 September2019, Mw = 5.6 Durrës foreshock.
5.3.2. Liquefaction Phenomena in Rinia—Fllakë Lagoon
The Lalzi Bay is located north of the Durrës plain area (Figure 9). Its coastal partextends with a length of about 10 km from the Pali Cape in its southern end to the RodoniCape in its northern end. From the geological point of view, the coastal part is composedof Tertiary and Quaternary deposits [14]. More specifically, Pali Cape comprises Messinianmolasse including sands, conglomerates, clays, and silts [41]. Moreover, Rodoni Cape iscomposed mainly of Messinian formations and secondarily of Pliocene formations [41]. Asregards the present geomorphology of the coastal part of the Lalzi Bay, the Erzeni River isthe main sediment supplier of the coastal zone (Figure 9), and one of the factors controllingthe distribution of Quaternary deposits in the area. The Quaternary is represented byHolocene lagoonal and marine deposits in the outer part of the coastal zone and byHolocene alluvial deposits in the inner part. The alluvial deposits include conglomerates,sands and clays, the lagoonal deposits comprise sands, silt, and clays and the marine onesmainly sand [14].
As regards the tectonic setting, the southwestern coastal part of the Lalzi Bay is locatedat the northern part of the Durrës syncline, which is filled up with Quaternary depositslying over the folded Miocene—Pliocene formations [7] and bounded by NW–SE strikingactive thrust faults [7] (Figure 2).

Geosciences 2021, 11, 215 14 of 29Geosciences 2021, 11, x FOR PEER REVIEW 14 of 30
Figure 9. Drone view of the Rinia–Fllakë Lagoon. The sites with the detected liquefaction phenom-ena are also noted along with the main geomorphological features of the lagoon.
As regards the tectonic setting, the southwestern coastal part of the Lalzi Bay is lo-cated at the northern part of the Durrës syncline, which is filled up with Quaternary de-posits lying over the folded Miocene—Pliocene formations [7] and bounded by NW–SE striking active thrust faults [7] (Figure 2).
The coastline of the Lalzi Bay is vulnerable to erosion processes and related phenom-ena resulting in coastal retreat [41,42]. The observed coastal erosion and retreat is at-tributed mainly to the intense, illegal and uncontrolled aggregate mining taking place along the Erzeni River bed after 1990 [41,42]. This mining is due to the rapidly increasing demand for construction material due to the rapid urbanization and development and significant demographic increase and population growth along the coast during the last 20 years following the fall of the communist era and the related political and socio-eco-nomic abrupt changes in Albania in general and in the earthquake-affected area in partic-ular.
Moreover, a significant feature in the morphology of this area, which is also affected by the aforementioned environmental, political, and economic changes is the Rinia–Fllakë Lagoon (Figure 9). This lagoon extends from east of Pali Cape to west of the Erzeni River delta (Figure 9). It is a very shallow lagoon, which is separated from the sea by a narrow sandy beach in its western side and from the adjacent agricultural fields by a wide line of pine trees (Figure 9). Rinia town is located at its southern part, while hotel facilities along the narrow sandy barrier are also accessible through a road leading from Rinia town to the outer barrier of the lagoon.
UAV post-earthquake disaster survey was also conducted in the Rinia–Fllakë La-goon. This survey contributed not only to observe the total distribution of the induced phenomena, but also to overcome difficulties in approaching inaccessible liquefaction sites of the lagoon.
The liquefaction phenomena included typical forms, such as individual sand boils, alignment of sand boils as well as water and sand fountains (Figures 10–13) observed in the central part of the lagoon (Figure 9). Individual sand boils were formed by the ejection of liquefied material comprising mainly sand and water on the surface (Figures 10–13). Their diameter was of several tens to hundreds of centimeters varying from 1 to 7 m. The large size of the observed sand boils indicates repeated cycles of liquefaction and the in-tensity of the observed phenomena. The distances of the liquefaction localities in Rinia–Fllakë Lagoon from the earthquake epicenter extend from 4.64 to 4.90 km.
Figure 9. Drone view of the Rinia–Fllakë Lagoon. The sites with the detected liquefaction phenomenaare also noted along with the main geomorphological features of the lagoon.
The coastline of the Lalzi Bay is vulnerable to erosion processes and related phenomenaresulting in coastal retreat [41,42]. The observed coastal erosion and retreat is attributedmainly to the intense, illegal and uncontrolled aggregate mining taking place along theErzeni River bed after 1990 [41,42]. This mining is due to the rapidly increasing demandfor construction material due to the rapid urbanization and development and significantdemographic increase and population growth along the coast during the last 20 yearsfollowing the fall of the communist era and the related political and socio-economic abruptchanges in Albania in general and in the earthquake-affected area in particular.
Moreover, a significant feature in the morphology of this area, which is also affectedby the aforementioned environmental, political, and economic changes is the Rinia–FllakëLagoon (Figure 9). This lagoon extends from east of Pali Cape to west of the Erzeni Riverdelta (Figure 9). It is a very shallow lagoon, which is separated from the sea by a narrowsandy beach in its western side and from the adjacent agricultural fields by a wide line ofpine trees (Figure 9). Rinia town is located at its southern part, while hotel facilities alongthe narrow sandy barrier are also accessible through a road leading from Rinia town to theouter barrier of the lagoon.
UAV post-earthquake disaster survey was also conducted in the Rinia–Fllakë Lagoon.This survey contributed not only to observe the total distribution of the induced phe-nomena, but also to overcome difficulties in approaching inaccessible liquefaction sites ofthe lagoon.
The liquefaction phenomena included typical forms, such as individual sand boils,alignment of sand boils as well as water and sand fountains (Figures 10–13) observed in thecentral part of the lagoon (Figure 9). Individual sand boils were formed by the ejection ofliquefied material comprising mainly sand and water on the surface (Figures 10–13). Theirdiameter was of several tens to hundreds of centimeters varying from 1 to 7 m. The largesize of the observed sand boils indicates repeated cycles of liquefaction and the intensityof the observed phenomena. The distances of the liquefaction localities in Rinia–FllakëLagoon from the earthquake epicenter extend from 4.64 to 4.90 km.

Geosciences 2021, 11, 215 15 of 29Geosciences 2021, 11, x FOR PEER REVIEW 15 of 30
(a) (b)
(c) (d)
(e) (f)
(g)
Figure 10. (a) Drone view of the central part of the Rinia–Fllakë Lagoon with the first liquefaction site. Sand boils (b–g) were observed. They caused tilting to electrical pillars (e–g).
Figure 10. (a) Drone view of the central part of the Rinia–Fllakë Lagoon with the first liquefactionsite. Sand boils (b–g) were observed. They caused tilting to electrical pillars (e–g).

Geosciences 2021, 11, 215 16 of 29Geosciences 2021, 11, x FOR PEER REVIEW 16 of 30
(a) (b)
(c) (d)
(e)
Figure 11. (a) Drone panoramic view of the central part of the Rinia–Fllakë Lagoon with the second liquefaction site (b). Sand boils were generated (c–e). They were arranged along an N–S trending line almost parallel to the adjacent lagoon channel (c–e).
The observed liquefaction phenomena did not cause structural damage due to the fact that there are no buildings because of the lagoon. They caused only slight damage to infrastructures including tilting of electrical pillars (Figure 10). They were observed not only in dry parts of the lagoon, but also in shallow parts covered by stagnant waters ( Figures 12 and 13). The elongated/aligned multiple sand boils were observed in the central part along almost N–S trending ground cracks with length of up to 100 m (Figures 12 and 13). The water and sand fountains in still waters were reported by locals, who have visited the area for fishing and were at the liquefaction affected area at the time of the earthquake.
The main factors controlling these phenomena are the shallow water level and the soft and unconsolidated lagoonal sediments. Moreover, the small distance from the epi-center and the proximity to the active thrust faults bounding the Rinia—Fllakë Lagoon from west and east could adversely contribute to the generation of these phenomena.
Figure 11. (a) Drone panoramic view of the central part of the Rinia–Fllakë Lagoon with the second liquefaction site (b).Sand boils were generated (c–e). They were arranged along an N–S trending line almost parallel to the adjacent lagoonchannel (c–e).
The observed liquefaction phenomena did not cause structural damage due to thefact that there are no buildings because of the lagoon. They caused only slight damageto infrastructures including tilting of electrical pillars (Figure 10). They were observednot only in dry parts of the lagoon, but also in shallow parts covered by stagnant wa-ters (Figures 12 and 13). The elongated/aligned multiple sand boils were observed inthe central part along almost N–S trending ground cracks with length of up to 100 m(Figures 12 and 13). The water and sand fountains in still waters were reported by locals,who have visited the area for fishing and were at the liquefaction affected area at the timeof the earthquake.
The main factors controlling these phenomena are the shallow water level and the softand unconsolidated lagoonal sediments. Moreover, the small distance from the epicenterand the proximity to the active thrust faults bounding the Rinia—Fllakë Lagoon from westand east could adversely contribute to the generation of these phenomena.

Geosciences 2021, 11, 215 17 of 29Geosciences 2021, 11, x FOR PEER REVIEW 17 of 30
(a) (b)
(c) (d)
Figure 12. (a) Drone view of the central part of the Rinia–Fllakë Lagoon with the third liquefaction site. (b) Sand boils were generated not only in dry but also in shallow parts of the lagoon. They were arranged along N–S trending ground cracks (c,d). Yellow double arrow lines indicate the N–S direction of the detected ground cracks.
Figure 13. Close view of liquefaction phenomena generated along ground cracks in Figure 12. They were observed not only in dry, but also in shallow parts of the Rinia–Fllakë Lagoon.
Figure 12. (a) Drone view of the central part of the Rinia–Fllakë Lagoon with the third liquefaction site. (b) Sand boils weregenerated not only in dry but also in shallow parts of the lagoon. They were arranged along N–S trending ground cracks(c,d). Yellow double arrow lines indicate the N–S direction of the detected ground cracks.
Geosciences 2021, 11, x FOR PEER REVIEW 17 of 30
(a) (b)
(c) (d)
Figure 12. (a) Drone view of the central part of the Rinia–Fllakë Lagoon with the third liquefaction site. (b) Sand boils were generated not only in dry but also in shallow parts of the lagoon. They were arranged along N–S trending ground cracks (c,d). Yellow double arrow lines indicate the N–S direction of the detected ground cracks.
Figure 13. Close view of liquefaction phenomena generated along ground cracks in Figure 12. They were observed not only in dry, but also in shallow parts of the Rinia–Fllakë Lagoon.
Figure 13. Close view of liquefaction phenomena generated along ground cracks in Figure 12. They were observed not onlyin dry, but also in shallow parts of the Rinia–Fllakë Lagoon.

Geosciences 2021, 11, 215 18 of 29
5.3.3. Liquefaction Phenomena in the Lower Course of the Erzeni River
As mentioned above, the Erzeni River flood plain is located at the northeastern endof the Rinia–Fllakë Lagoon. The area is mainly composed from sediments supplied fromthe Erzeni River, which along with its main tributaries drain a broad NW–SE alignedplain stretching 10–15 km inland from the coast, which correspond to the northern part ofNW–SE trending Durrës plain area (Figure 14).
Geosciences 2021, 11, x FOR PEER REVIEW 18 of 30
5.3.3. Liquefaction Phenomena in the Lower Course of the Erzeni River As mentioned above, the Erzeni River flood plain is located at the northeastern end
of the Rinia–Fllakë Lagoon. The area is mainly composed from sediments supplied from the Erzeni River, which along with its main tributaries drain a broad NW–SE aligned plain stretching 10–15 km inland from the coast, which correspond to the northern part of NW–SE trending Durrës plain area (Figure 14).
(a) (b)
(c) (d)
Figure 14. Liquefaction phenomena were also generated in the Erzeni River estuary (a, b). Ejection of liquefied material (c) was generated along ENE–WSW trending ground cracks (c, d) in fields of the area.
Liquefaction phenomena were generated along the river banks of the Erzeni River at distances varying from 4.57 to 8.63 from the mainshock epicenter and more specifically close to the river mouth. They comprise ejection of liquefied material along NE–SW trend-ing ground cracks with length varying from 10 to 80 m and formation of sand boils along ground cracks in the floodplain of the Erzeni River (Figure 14). ENE–WSW trending ground cracks with length of up to 130 m attributed to lateral spreading were also formed parallel to the Erzeni river bed and resulted vertical offset varying from 5 to 20 cm (Figure 14).
Liquefaction phenomena were also observed in the area of the Rushkull and Jubë villages located at a distance of almost 4.5 km east of the Erzeni River mouth and almost 3 km from the aforementioned liquefaction sites (Figure 14). Rushkull village is located north of the river bed, while Jubë village south of it. This area is mainly composed of water
Figure 14. Liquefaction phenomena were also generated in the Erzeni River estuary (a,b). Ejectionof liquefied material (c) was generated along ENE–WSW trending ground cracks (c,d) in fields ofthe area.
Liquefaction phenomena were generated along the river banks of the Erzeni River atdistances varying from 4.57 to 8.63 from the mainshock epicenter and more specifically closeto the river mouth. They comprise ejection of liquefied material along NE–SW trendingground cracks with length varying from 10 to 80 m and formation of sand boils alongground cracks in the floodplain of the Erzeni River (Figure 14). ENE–WSW trending groundcracks with length of up to 130 m attributed to lateral spreading were also formed parallelto the Erzeni river bed and resulted vertical offset varying from 5 to 20 cm (Figure 14).
Liquefaction phenomena were also observed in the area of the Rushkull and Jubëvillages located at a distance of almost 4.5 km east of the Erzeni River mouth and almost3 km from the aforementioned liquefaction sites (Figure 14). Rushkull village is locatednorth of the river bed, while Jubë village south of it. This area is mainly composed of watersaturated clayey silts lying over alluvial river deposits. Liquefaction comprised ejection of

Geosciences 2021, 11, 215 19 of 29
liquefied material from ground cracks, formation of sand boils, and lateral spreading alongthe Erzeni River banks. It is significant to note that liquefaction started with the ejection ofmany gravels from the underlying alluvial river deposits and the sandy material followed.The liquefaction phenomena in the observed sites caused slight non-structural damage tobuildings. Moreover, they also affected water wells in the same sites.
The main factors controlling these phenomena is the shallow water level, the watersaturated river sediments around the river bed and the instability conditions along theriver banks. Moreover, the small distance from the mainshock epicenter and the proximityto the active thrust fault below the Erzeni river estuary could adversely contribute to theamplification of these phenomena.
5.3.4. Liquefaction Phenomena Close to the Mati River Estuary
Favorable conditions for the generation of liquefaction phenomena were also detectedin the eastern part of the earthquake-affected area located within the Tirana Depression.Characteristic examples are the area around Patok Lagoon and more specifically the Taleand Fushë Kuqe areas located north and south of the Mati River bed. This area presentgeological conditions similar to the aforementioned Rinia–Fllakë Lagoon. In this case, theMati River to the north and the Ishem River to the south are the main rivers supplyingsediments and controlling the distribution of Quaternary deposits in this area (Figure 2).The Quaternary is represented by Holocene lagoonal deposits within the Patok Lagoonand Holocene alluvial deposits in the surrounding flood plain [14].
Similar to the coastal environment of the Rinia–Fllakë Lagoon, the Mati outlet hasdrastically changed in recent years due to natural processes and human interventions.The Mati River mouth has moved southwards and the adjacent seashores suffer erosionattributed to dams and uncontrolled aggregate mining from its riverbed. These processesresulted in the enlargement of Patok Lagoon [43].
Liquefaction phenomena were also generated in the Tale area at a distance of about30 km from the mainshock epicenter. They comprised ejection of liquefied material of sandand water from ground cracks. Based on Google Earth satellite image, it is clearly shownthat the distribution of liquefaction in this area coincides with abandoned and filled bendsof Mati River. Despite the fact that these phenomena were observed close to residentialbuildings, warehouses and water supply drilling works, they did not cause any damage.
6. Liquefaction Susceptibility Mapping6.1. Approach for Liquefaction Susceptibility Assessment in the Earthquake-Affected Area
For the liquefaction susceptibility assessment in the area affected by the 26 November2019, Mw = 6.4 Durrës earthquake, the used approach combines the main features of themethodologies applied by [44–47].
Papathanassiou et al. classified Greece in liquefaction susceptibility zones based ongeological, geomorphological, and seismological data and historical and recent informationon respective liquefaction phenomena [44]. They initially classified the Quaternary depositsin susceptibility categories based on their age, their depositional environment, the peakground acceleration and the liquefaction inventory of historical and recent earthquakes inGreece as published by [48]. Papathanassiou et al. applied the same methodology not atcountry, but at local level [45], in particular at the coastal area of Corinth Gulf characterizedby medium to high seismicity and related liquefaction phenomena.
Lozios et al. and Mavroulis et al., in the frame of scientific applied research projects inCentral Macedonia (Northern Greece) and the Ionian Islands (Western Greece), respectively,applied a methodology for liquefaction susceptibility assessment by using lithologicalproperties of the study areas [46,47]. The alpine formations were considered as solidbasement rocks and were excluded from the susceptibility assessment. The Neogene andQuaternary deposits were classified into very low, low, medium, and high susceptibleto liquefaction based on the evaluation of their lithology, age, and other physical andmechanical characteristics.
Geosciences 2021, 11, 215 20 of 29
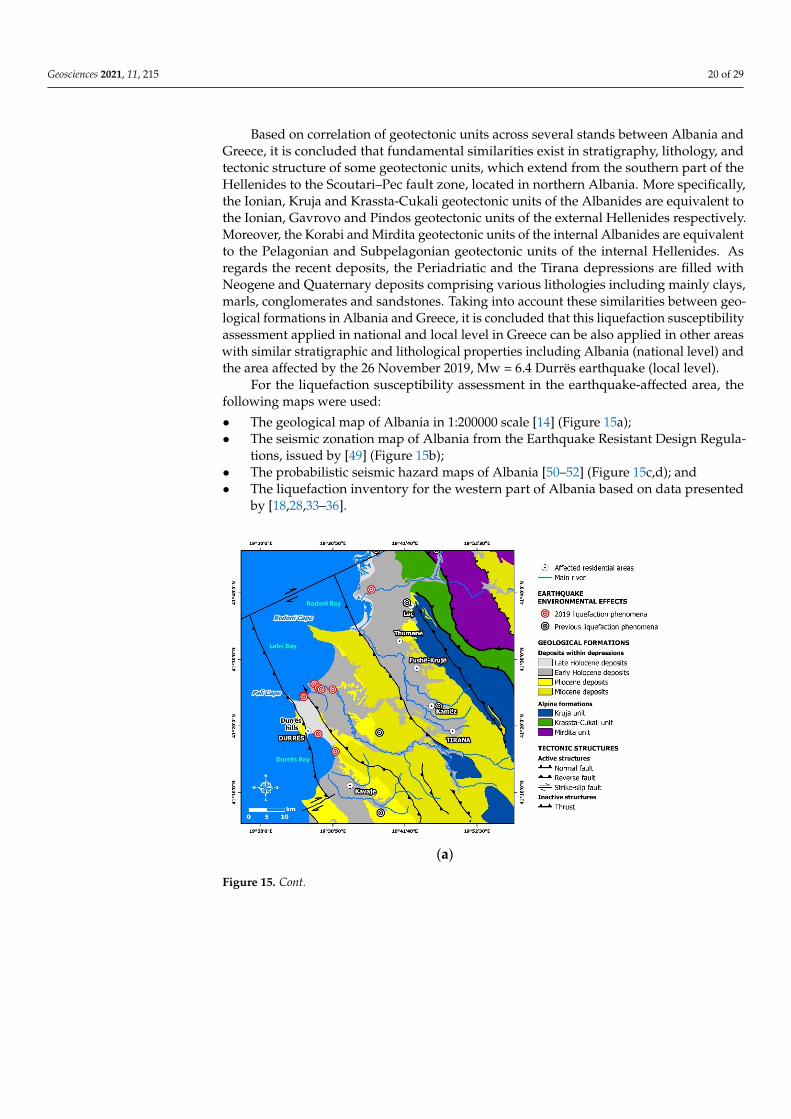
Based on correlation of geotectonic units across several stands between Albania andGreece, it is concluded that fundamental similarities exist in stratigraphy, lithology, andtectonic structure of some geotectonic units, which extend from the southern part of theHellenides to the Scoutari–Pec fault zone, located in northern Albania. More specifically,the Ionian, Kruja and Krassta-Cukali geotectonic units of the Albanides are equivalent tothe Ionian, Gavrovo and Pindos geotectonic units of the external Hellenides respectively.Moreover, the Korabi and Mirdita geotectonic units of the internal Albanides are equivalentto the Pelagonian and Subpelagonian geotectonic units of the internal Hellenides. Asregards the recent deposits, the Periadriatic and the Tirana depressions are filled withNeogene and Quaternary deposits comprising various lithologies including mainly clays,marls, conglomerates and sandstones. Taking into account these similarities between geo-logical formations in Albania and Greece, it is concluded that this liquefaction susceptibilityassessment applied in national and local level in Greece can be also applied in other areaswith similar stratigraphic and lithological properties including Albania (national level) andthe area affected by the 26 November 2019, Mw = 6.4 Durrës earthquake (local level).
For the liquefaction susceptibility assessment in the earthquake-affected area, thefollowing maps were used:
• The geological map of Albania in 1:200000 scale [14] (Figure 15a);• The seismic zonation map of Albania from the Earthquake Resistant Design Regula-
tions, issued by [49] (Figure 15b);• The probabilistic seismic hazard maps of Albania [50–52] (Figure 15c,d); and• The liquefaction inventory for the western part of Albania based on data presented
by [18,28,33–36].
Geosciences 2021, 11, x FOR PEER REVIEW 20 of 30
Quaternary deposits were classified into very low, low, medium, and high susceptible to liquefaction based on the evaluation of their lithology, age, and other physical and me-chanical characteristics.
Based on correlation of geotectonic units across several stands between Albania and Greece, it is concluded that fundamental similarities exist in stratigraphy, lithology, and tectonic structure of some geotectonic units, which extend from the southern part of the Hellenides to the Scoutari–Pec fault zone, located in northern Albania. More specifically, the Ionian, Kruja and Krassta-Cukali geotectonic units of the Albanides are equivalent to the Ionian, Gavrovo and Pindos geotectonic units of the external Hellenides respectively. Moreover, the Korabi and Mirdita geotectonic units of the internal Albanides are equiva-lent to the Pelagonian and Subpelagonian geotectonic units of the internal Hellenides. As regards the recent deposits, the Periadriatic and the Tirana depressions are filled with Neogene and Quaternary deposits comprising various lithologies including mainly clays, marls, conglomerates and sandstones. Taking into account these similarities between ge-ological formations in Albania and Greece, it is concluded that this liquefaction suscepti-bility assessment applied in national and local level in Greece can be also applied in other areas with similar stratigraphic and lithological properties including Albania (national level) and the area affected by the 26 November 2019, Mw = 6.4 Durrës earthquake (local level).
For the liquefaction susceptibility assessment in the earthquake-affected area, the fol-lowing maps were used: • The geological map of Albania in 1:200000 scale [14] (Figure 15a); • The seismic zonation map of Albania from the Earthquake Resistant Design Regula-
tions, issued by [49] (Figure 15b); • The probabilistic seismic hazard maps of Albania [50–52] (Figure 15c,d); and • The liquefaction inventory for the western part of Albania based on data presented
by [18,28,33–36].
(a)
Figure 15. Cont.

Geosciences 2021, 11, 215 21 of 29Geosciences 2021, 11, x FOR PEER REVIEW 21 of 30
(b)
(c)
(d)
Figure 15. Cont.

Geosciences 2021, 11, 215 22 of 29Geosciences 2021, 11, x FOR PEER REVIEW 22 of 30
(e)
Figure 15. (a) Geological map with geological formations, tectonic structures and liquefaction phe-nomena induced by the November 2019 earthquake. (b) The seismic zonation map of Albania from the Earthquake Resistant Design Regulations, issued by [49]. (c) Probabilistic seismic hazard map of the study area based on the respective map of Albania by [50–52], modified (PGA with 10% probability of exceedance in 10 years). (d) Probabilistic seismic hazard map of the study area based on the respective map of Albania by [50–52], modified (PGA with 10% probability of ex-ceedance in 50 years). (e) Liquefaction susceptibility map of the earthquake-affected area with 5 zones of liquefaction susceptibility: (1) very high, (2) high, (3) moderate, (4) low, (5) very low. The alpine basement (gray areas) were excluded from the assessment.
6.1.1. Classification of Geological Formations Geological formations were digitized and classified into three major categories: (a)
the formations belonging to the geotectonic units of the external Albanides (Ionian, Kruja, Krasta–Cukali units), (b) the formations belonging to the geotectonic units of the internal Albanides (Mirdita unit) and (c) the recent deposits of Neogene and Quaternary age. This classification aimed to the analysis of the recent deposits, since geological formations with age older than Pleistocene are little or no susceptible at all to liquefaction [53].
In particular, the Neogene and Quaternary deposits were further classified into (Fig-ure 15a): • Late Holocene deposits comprises marshy deposits with sand, gravels and peat and
coastal marine deposits with sand and gravels; • Early Holocene deposits includes alluvial deposits with sand and gravels and mixed
alluvial and marshy deposits; • Pleistocene deposits; • Pliocene deposits, comprising clays, sandstones, and conglomerates; • Miocene deposits comprising Lower Aquitanian marine clays, moraines and coal,
Burdigalian marls, clays and limestones, Tortonian sandstones, clays and conglom-erates and Messinian sandstones, clays, and sandstones.
6.1.2. Liquefaction Inventory Map of the 26 November 2019, Mw = 6.4 Earthquake-Af-fected Area
Liquefaction inventory maps for the earthquake affected area were created using data from the study on the environmental effects induced from historical and recent earth-quakes in Western Albania. Data includes liquefaction sites and types induced by histor-ical and recent earthquakes, as well as qualitative and quantitative information related to
Figure 15. (a) Geological map with geological formations, tectonic structures and liquefactionphenomena induced by the November 2019 earthquake. (b) The seismic zonation map of Albaniafrom the Earthquake Resistant Design Regulations, issued by [49]. (c) Probabilistic seismic hazardmap of the study area based on the respective map of Albania by [50–52], modified (PGA with 10%probability of exceedance in 10 years). (d) Probabilistic seismic hazard map of the study area basedon the respective map of Albania by [50–52], modified (PGA with 10% probability of exceedancein 50 years). (e) Liquefaction susceptibility map of the earthquake-affected area with 5 zones ofliquefaction susceptibility: (1) very high, (2) high, (3) moderate, (4) low, (5) very low. The alpinebasement (gray areas) were excluded from the assessment.
6.1.1. Classification of Geological Formations
Geological formations were digitized and classified into three major categories: (a)the formations belonging to the geotectonic units of the external Albanides (Ionian, Kruja,Krasta–Cukali units), (b) the formations belonging to the geotectonic units of the internalAlbanides (Mirdita unit) and (c) the recent deposits of Neogene and Quaternary age. Thisclassification aimed to the analysis of the recent deposits, since geological formations withage older than Pleistocene are little or no susceptible at all to liquefaction [53].
In particular, the Neogene and Quaternary deposits were further classified into(Figure 15a):
• Late Holocene deposits comprises marshy deposits with sand, gravels and peat andcoastal marine deposits with sand and gravels;
• Early Holocene deposits includes alluvial deposits with sand and gravels and mixedalluvial and marshy deposits;
• Pleistocene deposits;• Pliocene deposits, comprising clays, sandstones, and conglomerates;• Miocene deposits comprising Lower Aquitanian marine clays, moraines and coal, Bur-
digalian marls, clays and limestones, Tortonian sandstones, clays and conglomeratesand Messinian sandstones, clays, and sandstones.
6.1.2. Liquefaction Inventory Map of the 26 November 2019, Mw = 6.4Earthquake-Affected Area
Liquefaction inventory maps for the earthquake affected area were created using datafrom the study on the environmental effects induced from historical and recent earthquakesin Western Albania. Data includes liquefaction sites and types induced by historical andrecent earthquakes, as well as qualitative and quantitative information related to theresulted geoforms based on [18,28,33–36]. Earthquake-induced liquefaction phenomena

Geosciences 2021, 11, 215 23 of 29
have been mainly observed in the Periadriatic Depression during strong earthquakesof the 20th century [18,28,33–36] (Figure 15a) as already mentioned in the respectivechapters above.
6.1.3. Seismic Hazard and Seismic Zonation of the 26 November 2019, Mw = 6.4Earthquake-Affected Area
The third examined criterion was the classification of areas based on the seismiczonation and the seismic hazard maps of Albania [49–52].
In the seismic zonation map of Albania, the country is classified into zones basedon seismic intensities and not on design accelerations. In particular, three zones aredelineated based on the observed maximum intensities according to the MSK-64 scale: (a)the VIIIMSK-64 zone, (b) the VIIMSK-64 zone, and (c) the VIMSK-64 zone (Figure 15b). Thewestern part of the earthquake affected area belongs to the first zone with VIIIMSK-64, whileits eastern part to the second zone with VIIMSK-64 (Figure 15b).
In the probabilistic seismic hazard maps of Albania [50–52], the country is classifiedinto zones based on the: (a) the peak ground acceleration for 10-percent probability ofexceedance in 10 years (return period of 95 years) (Figure 15c); and (b) peak groundacceleration for 10-percent probability of exceedance in 50 years (return period of 475 years)(Figure 15d). Based on the first seismic hazard map, the western part of the earthquakeaffected area located in coastal Durrës area is characterized by PGA ranging from 0.12 to0.14 g, while the eastern part of the earthquake affected area located in Tirana depression ischaracterized by PGA ranging from 0.14 to 0.16 g for 10-percent probability of exceedancein 10 years (return period of 95 years) (Figure 15c). Based on the second seismic hazardmap, the western part of the earthquake affected area is characterized by PGA rangingfrom 0.24 to 0.30 g, while the eastern part by PGA ranging from 0.30 to 0.36g for 10-percentprobability of exceedance in 50 years (return period of 475 years) (Figure 15d).
6.2. Liquefaction Susceptibility Classes
Initially, susceptibility classes were assigned based on geological criteria (age anddepositional environment) and seismological criteria (peak ground acceleration based onthe updated seismic hazard maps of Albania). In particular:
• The latest Holocene deposits in the Periadriatic and Tirana depressions (marshydeposits with sand gravel and peat and coastal marine deposits with sand and gravels)are classified into very highly, highly, and moderately susceptible formations, whenthey are located in areas with expected PGA values of 0.30–0.36 g, 0.24–0.30 g, and0.16–0.24 g respectively.
• The early Holocene deposits (alluvial deposits with sand and gravels as well as mixedalluvial and marshy deposits) are classified into highly susceptible formations inseismic zones of 0.30–0.36 g and moderately susceptible formations in seismic zonesof 0.24–0.30 g and 0.16–0.24 g, respectively.
• The Pleistocene deposits are classified into low and very low susceptible formationsin areas where the expected peak ground acceleration values are 0.30–0.36 g and0.24–0.30 g for the low and 0.16–0.24 g for the very low susceptibility.
• The Pliocene and Miocene deposits are classified into formations with no liquefactionsusceptibility.
• The formations of the Kruja, Krassta, and Mirdita units are considered as solid base-ment formations and are excluded from the liquefaction susceptibility assessment.
Then, the occurrence of liquefaction phenomena due to historical and recent earth-quakes in the earthquake-affected area was studied and the susceptibility to liquefactionwas redefined and updated. If liquefaction was induced by a historical or recent earthquakein a site, then the liquefaction susceptibility of the affected deposits is upgraded to thenext susceptibility class. For example, liquefaction phenomena were generated in Shijakarea in Miocene formations considered as formations with no liquefaction susceptibility.For this reason, the liquefaction susceptibility of the Miocene deposits in this area is up-

Geosciences 2021, 11, 215 24 of 29
graded to the next susceptibility class, which is the very low susceptibility. The same casewas observed in Lekaj area, located southeast of Kavaje. Liquefaction phenomena weregenerated in Pliocene deposits and consequently they are classified as deposits with lowliquefaction susceptibility.
At the end of the above classification, five categories of liquefaction susceptibilityresulted from geological criteria, seismological parameters, and information on historicaland recent liquefaction phenomena (Figure 15e):
1. Very high susceptibility in areas comprising latest Holocene deposits in zones ofexpected PGA with values 0.30–0.36 g.
2. High susceptibility in areas comprising latest Holocene deposits in zones of expectedPGA with values 0.24–0.30 g and early Holocene deposits in zones of expected PGAwith values 0.30–0.36 g.
3. Moderate susceptibility in areas including latest Holocene deposits in zones of ex-pected PGA with values 0.16–0.24 g and early Holocene deposits in zones of expectedPGA with values 0.24–0.30 g and 0.16–0.24 g.
4. Low susceptibility in areas including Pleistocene deposits in zones of expected PGAwith values 0.30–0.36 g and 0.24–0.30 g.
5. Very low susceptibility in areas composed of Pleistocene deposits located in zones ofexpected PGA with values 0.16–0.24 g.
Taking into account the abovementioned classes, a liquefaction susceptibility map ofthe 26 November 2019, Mw = 6.4 earthquake-affected area was compiled (Figure 15e).
6.3. Liquefaction Phenomena and Susceptible Zones
From the spatial distribution of the liquefaction phenomena induced by the 26 Novem-ber 2019, Mw = 6.4 Durrës earthquake and the liquefaction susceptibility map, it is con-cluded that the observed phenomena were generated in zones of very high and highsusceptibility to liquefaction (Figure 15e). More specifically, the liquefaction phenomena inthe coastal part of Durrës city were generated within zones with very high liquefactionsusceptibility, while liquefaction in the Erzeni River estuary, in Rinia–Fllakë Lagoon as wellas in Jubë and Tale areas were distributed within zones with high liquefaction susceptibility(Figure 15e).
7. Discussion
Taking into account the spatial distribution of the liquefaction phenomena induced bythe 26 November 2019, Mw = 6.4 Durrës earthquake, it is concluded that all liquefactionphenomena were not randomly distributed in the affected areas, but they were lithologicallyand structurally controlled. This is indicated by the fact that they were generated inlocalities of the western and the eastern earthquake-affected areas, which present similargeological setting, lithology, macrostructures, and marginal faults (Figure 16).
The western most affected area corresponds to the Spitalia syncline with a NW–SEtrending fold axis. It is bounded to the west and east by active NW–SE striking thrustfaults. It is composed of soft alluvial, lagoonal and marine coastal deposits of Holoceneage overlaying the alpine basement, while swampy soils constitute the lowlands of theplain. This syncline forms a NW–SE trending zone (Figure 16) with orientation similarto the orientation of macrostructures (synclines and anticlines with NW–SE trending foldaxis) and active tectonic structures (marginal NW–SE striking backthrusts and thrusts) ofthe western affected area (Figure 16). Moreover, this NW–SE trending zone have the sametrend with the NW–SE striking seismogenic thrust fault of the 26 November 2019 Mw = 6.4earthquake as it is derived from the provided fault plane solutions. The epicenter of themainshock is located also within this NW–SE trending zone and in small distances fromthe liquefied sites.

Geosciences 2021, 11, 215 25 of 29
Geosciences 2021, 11, x FOR PEER REVIEW 25 of 30
the mainshock is located also within this NW–SE trending zone and in small distances from the liquefied sites.
Figure 16. Environmental effects induced by the November 2019 earthquake in the central western part of Albania along with the major tectonic structures of the affected area and the areas with considerable building damage. All liquefaction phenomena and building damage (in Durrës, Laç, Thumanë, Fushë-Krujë, Kamëz, and Tirana) were observed in sites composed of resent soft allu-vial, marine, lagoonal, and marshy deposits. Moreover, they were observed in zones with the same NW–SE trend with the macrostructures (synclines and anticlines with NW–SE fold axis) and the active thrust faults (NW–SE striking thrusts and backthrusts) in the affected area.
The liquefaction localities induced in the western most affected area are located within the Spitalia syncline. As regards, the impact of the mainshock in the environment, landslides, ground cracks and hydrological anomalies were also observed in this syncline [1,54]. It is significant to note that the environmental effects induced by the September 21, 2019, Mw = 5.6 Durrës foreshock were also observed on the southward extension of the aforementioned NW–SE trending zone. More specifically, landslides were induced at slopes along the road leading from Durrës to Kavajë (Shkembi i Kavajës), located south-east of Durrës [38] (Figure 16). The landslide affected area comprises steep slopes formed by Pliocene clays. The mobilized material temporarily blocked the road without any other serious effects on the road asphalt surface, vehicles and drivers [38].
Similar conditions from the geological and lithological point of view occur at the east-ern most affected area (Figure 16), where environmental effects comprising liquefaction, landslides, ground cracks, and hydrological anomalies were also induced by the Novem-ber 2019 mainshock. These affected sites are over the Tirana syncline with a NW–SE trend-ing fold axis and active NW–SE striking thrust faults along its margins. It is composed of soft Holocene alluvial deposits and swampy soils in lowlands east of Laç and Thumanë areas. Taking into account the spatial distribution of the liquefaction and the building damage localities in the Tirana Depression [1], it is concluded that they are also arranged within a NW–SE trending zone (Figure 16). The orientation of this zone is similar to the orientation of macrostructures (synclines and anticlines with NW–SE trending fold axis)
Figure 16. Environmental effects induced by the November 2019 earthquake in the central westernpart of Albania along with the major tectonic structures of the affected area and the areas withconsiderable building damage. All liquefaction phenomena and building damage (in Durrës, Laç,Thumanë, Fushë-Krujë, Kamëz, and Tirana) were observed in sites composed of resent soft alluvial,marine, lagoonal, and marshy deposits. Moreover, they were observed in zones with the sameNW–SE trend with the macrostructures (synclines and anticlines with NW–SE fold axis) and theactive thrust faults (NW–SE striking thrusts and backthrusts) in the affected area.
The liquefaction localities induced in the western most affected area are located withinthe Spitalia syncline. As regards, the impact of the mainshock in the environment, land-slides, ground cracks and hydrological anomalies were also observed in this syncline [1,54].It is significant to note that the environmental effects induced by the 21 September 2019,Mw = 5.6 Durrës foreshock were also observed on the southward extension of the afore-mentioned NW–SE trending zone. More specifically, landslides were induced at slopesalong the road leading from Durrës to Kavajë (Shkembi i Kavajës), located southeast ofDurrës [38] (Figure 16). The landslide affected area comprises steep slopes formed byPliocene clays. The mobilized material temporarily blocked the road without any otherserious effects on the road asphalt surface, vehicles and drivers [38].
Similar conditions from the geological and lithological point of view occur at theeastern most affected area (Figure 16), where environmental effects comprising liquefaction,landslides, ground cracks, and hydrological anomalies were also induced by the November2019 mainshock. These affected sites are over the Tirana syncline with a NW–SE trendingfold axis and active NW–SE striking thrust faults along its margins. It is composed ofsoft Holocene alluvial deposits and swampy soils in lowlands east of Laç and Thumanëareas. Taking into account the spatial distribution of the liquefaction and the buildingdamage localities in the Tirana Depression [1], it is concluded that they are also arrangedwithin a NW–SE trending zone (Figure 16). The orientation of this zone is similar to theorientation of macrostructures (synclines and anticlines with NW–SE trending fold axis)and active tectonic structures (marginal NW–SE striking backthrusts and thrusts) of theeastern affected area (Figure 16).
All these properties and characteristics give the western and eastern most affectedareas a high susceptibility and potential for the generation of liquefaction phenomena

Geosciences 2021, 11, 215 26 of 29
with great impact on the highly populated parts, as it clearly shown from the environ-mental effects induced by historical and recent earthquakes generated in western Albania.Moreover, the liquefaction by the 26 November 2019, Mw = 6.4 Durrës earthquake wasgenerated in areas with heavy structural and non-structural damage to buildings andinfrastructures corresponding to maximum intensities of VIII–IXEMS-98. This fact indicatesthat the Albanian antiseismic building code has to integrate the security factor againstliquefaction in its upcoming updates and revisions.
8. Conclusions
As regards the liquefaction phenomena, several factors control their generation, type,and size. These factors are related to the earthquake parameters, to the site conditions andthe soil properties [55]. In this paper, the spatial distribution and type of the liquefactionphenomena induced by the 26 November 2019, Mw = 6.4 Durrës earthquake are presentedamong others and the factors controlling their distribution are discussed.
The main characteristics of liquefaction distribution worldwide is that these phenom-ena often occur in areas with saturated and loose sandy soils and are distributed near theearthquake epicenter [56]. The saturated ground is a precondition for liquefaction to takeplace and when the groundwater is close to the surface, liquefaction can easily start [57].Most liquefaction phenomena are generally observed near rivers, lakes, lagoons, or coastalareas, owing to soil property and groundwater level there [56]. Such liquefaction distribu-tion examples in coastal, riverside and lakeside areas have occurred worldwide [58–63].Taking into account other historical and recent earthquakes and their impact in westernAlbania, it is concluded that liquefaction phenomena mainly comprising sand boils, groundfissures, lateral spreading, and ground settlements have been distributed along coasts andriver banks of the Adriatic coastal part of Albania [28].
Similar liquefaction distributions have been also observed in adjacent earthquake-affected areas and countries surrounding Albania with similar lithological, geological, andseismological characteristics and properties with the November 2019 earthquake-affectedarea. Characteristic examples have been induced by earthquakes generated in the CentralIonian Islands and the Northwestern Peloponnese, both located in the adjacent westernGreece. This area is located in a distance of about 300 to 400 km south of Durrës and itis characterized by similar alpine formations, post-alpine deposits, and lithologies withWestern Albania, as it is concluded by the study of the major tectonic and geologicalunits of the western Balkan and the surrounding regions of the Carpathians, Dinarides,and Hellenides presented by [64]. The liquefaction phenomena induced by the 8 June2008, Mw = 6.4 Andravida earthquake in Northwestern Peloponnese were exclusivelyobserved along coastal areas, river banks, and lake shores [65]. Liquefaction induced bythe 26 January and 3 February 2014, Mw = 6.0 earthquakes in Cephalonia Island wereexclusively along the coastal parts of the most affected areas [66,67]. Moreover, liquefactioninduced by the 17 November 2015, Mw = 6.4 earthquake in Lefkada Island was alsoobserved in waterfront port structures of the affected area [68].
This is also the case for the liquefaction phenomena triggered by the 26 November2019, Mw = 6.4 Durrës earthquake. Liquefaction phenomena were induced in the westerncoastal part of the Periadriatic Depression and along the eastern margin of the TiranaDepression. Liquefaction in the first area was generated along the coastal part of Durrëscity, in the central part of the Rinia–Fllakë Lagoon and close to the Erzeni River estuary,while in the second area liquefaction was generated in Tale area, close the Mati Riverestuary. They included typical forms such as individual sand boils, alignment of sandboils along cracks and water and sand fountains. Based on the orientation of the observedground cracks in the studied sites, it is concluded that there is no preferred trend. Theobserved phenomena contributed to the generation of very heavy structural damage in thecoastal part of Durrës city, slight non-structural damage to buildings close to the ErzeniRiver estuary and slight damage to lifelines in the Rinia–Fllakë Lagoon.

Geosciences 2021, 11, 215 27 of 29
The farthest liquefaction feature induced by the 26 November 2019, Mw = 6.4 Durrësearthquake was generated in Tale area at a distance of about 31 km away from the earth-quake epicenter. This site is far away in relation to the other sites observed in the coastalpart of the Periadriatic Depression, whose distances range from 4.5 to 16 km. All recordeddistances are clearly smaller than the maximum epicentral distance predicted by empiricalrelationships between magnitude and distance for liquefaction proposed by [69,70] forearthquakes and induced liquefaction phenomena worldwide.
Author Contributions: Conceptualization, S.M. and E.L.; methodology, S.M.; validation, S.M.;investigation, S.M. and E.L.; data curation, S.M.; writing—original draft preparation, S.M.; writing—review and editing, S.M., E.L. and P.C.; visualization, S.M.; supervision, S.M. and E.L. All authorshave read and agreed to the published version of the manuscript.
Funding: This research received no external funding.
Acknowledgments: This paper is a contribution to the Post-Graduate Program “Environmental,Disaster, and Crises Management Strategies”, Department of Dynamic, Tectonic and Applied Geology,Faculty of Geology and Geoenvironment, National and Kapodistrian University of Athens, Greece,which supported the post-event field surveys.
Conflicts of Interest: The authors declare no conflict of interest.
References1. Lekkas, E.; Mavroulis, S.; Papa, D.; Carydis, P. The 26 November 2019 Mw = 6.4 Durrës (Albania) earthquake. Newsl. Environ.
Disaster Cris. Manag. Strateg. 2019, 15, 80. [CrossRef]2. Papadopoulos, G.A.; Agalos, A.; Carydis, P.; Lekkas, E.; Mavroulis, S.; Triantafyllou, I. The 26 November 2019 Mw = 6.4 Albania
destructive earthquake. Seismol. Res. Lett. 2020, 91, 3129–3138. [CrossRef]3. Stefanidou, S.; Tsiatas, G.; Baltzopoulos, G.; Giarlelis, C.; Markogiannaki, O.; Skoulidou, D.; Fragiadakis, M.; Lombardi, L.;
Mavroulis, S.; Plaka, A.; et al. Structural and Geotechnical damage due to Albania Earthquake (26.11.2019) based on Rapid VisualScreening. In Proceedings of the 2020 International Symposium on Durrës Earthquakes and Eurocodes, Polytechnic University ofTirana, Tirana, Albania, 11 April 2020.
4. Sextos, A.; Lekkas, E.; Stefanidou, S.; Baltzopoulos, G.; Fragkiadakis, M.; Giarlelis, C.; Lombardi, L.; Markogiannaki, O.; Mavroulis,S.; Plaka, A.; et al. Albania Earthquake of 26 November 2019. Report on Structural and Geotechnical Damage; Hellenic Association ofEarthquake Engineering: Athens, Greece, 2020; 47p. [CrossRef]
5. Ganas, A.; Elias, P.; Briole, P.; Cannavo, F.; Valkaniotis, S.; Tsironi, V.; Partheniou, E.I. Ground deformation and seismic faultmodel of the M6.4 Durres (Albania) Nov. 26, 2019 earthquake, based on GNSS/INSAR observations. Geosciences 2020, 10, 210.[CrossRef]
6. Moshou, A.; Dushi, E.; Argyrakis, P. A Preliminary Report on the 26 November 2019, Mw = 6.4 Durres, Albania; European-Mediterranean Seismological Centre: Essonne, France, 2019; 12p.
7. Aliaj, S.; Baldassarre, G.; Shkupi, D. Quaternary subsidence zones in Albania: Some case studies. Bull. Eng. Geol. Environ. 2001,59, 313–318. [CrossRef]
8. Skrami, J. Structural and neotectonic features of the Periadriatic Depression (Albania) detected by seismic interpretation. Bull.Geol. Soc. Greece 2001, 34, 1601–1609. [CrossRef]
9. Aliaj, S.; Melo, V.; Hyseni, A.; Skrami, J.; Mehillka, L.L.; Muço, B.; Sulstarova, E.; Prifti, K.; Pasko, P.; Prillo, S. Neotectonic Structureof Albania. Final Report; Archive of Seismological Institute of Academy of Sciences: Tirana, Albania, 1996.
10. Puca, N. Scientific Report: Monitoring of Groundwater in the Main Aquifers of Albania-Erzen–Ishmi Aquifer; Archives of GeologicalSurvey of Albania: Tirana, Albania, 2005.
11. Eftimi, R. Permeability features of Rrogozhina suite. Bull. Albanian Geol. Surv. 1984, 3, 57–73.12. Hyseni, A. Structure and Geodynamic Evaluation of Pliocene Molasses of Pre-Adriatic Depression. Ph.D. Thesis, Polytechnic
University of Tirana, Tirana, Albania, 1995.13. Gelati, R.; Diamanti, F.; Prence, J.; Cane, E.H. The stratigraphic record of Neogene events in the Tirana Depression. Riv. Ital.
Paleontol. Stratigr. 1997, 103, 81–100.14. Institute of Geosciences. Geological Map of Albania in 1:200000 Scale; Institute of Geosciences: Tirana, Albania, 1983.15. Hysenaj, R.; Naco, P.; Bojaxhiu, M.; Ahmeti, H. Deep subsurface geological phenomena and related processes in the Elbasani-
Tirana region, Albania. J. Int. Environ. Appl. Sci. 2009, 4, 191–197.16. Papazachos, B.C.; Savvaidis, A.S.; Papazachos, C.B.; Papaioannou, C.; Kiratzi, A.A.; Muco, B.; Koçiu, S.; Sulstarova, E. Atlas of
Isoseismal Maps for Shallow Earthquakes in Albania and Surrounding Area (1851–1990); Publication No 10; Aristotle University ofThessaloniki, Geophysical Laboratory: Thessaloniki, Greece, 2001.
17. Ambraseys, N. Earthquakes in the Mediterranean and Middle East: A Multidisciplinary Study of Seismicity up to 1900; CambridgeUniversity Press: Cambridge, UK, 2009.

Geosciences 2021, 11, 215 28 of 29
18. Aliaj, S.; Koçiu, S.; Muço, B.; Sulstarova, E. Seismicity, Seismotectonics and Seismic Hazard Assessment in Albania; Academy ofSciences of Albania: Tirana, Albania, 2010.
19. Muço, B.; Kiratzi, A.; Aliaj, S.; Sulstarova, E.; Koçiu, S.; Peçi, V. Seismic hazard assessment of Albania using probabilistic approach.In Proceedings of the 28th General Assembly of European Seismological Society, Book of Abstracts, University of Genoa, Genoa,Italy, 1–6 September 2002.
20. Sulstarova, E.; Koçiaj, S.; Muço, B.; Peci, V. The Albanian Earthquakes Catalogue for Historical and Instrumental Data with MagnitudeM ≥ 4.5; Internal Report (on behalf of NATO Project “Seismotectonic and Seismic Hazard Assessment in Albania”, 1999–2002);Seismological Institute: Tirana, Albania, 2003.
21. Fundo, A.; Duni, L.; Kuka, S.; Begu, E.; Kuka, N. Probabilistic seismic hazard assessment of Albania. Acta Geod. Geophys. Hung.2012, 47, 465–479. [CrossRef]
22. Sulstarova, E.; Koçiaj, S.; Aliaj, A. Seismic Zonation of Albania; Archive of Seismological Institute: Tirana, Albania, 1980.23. Aliaj, S. Seismic Source Zones in Albania. In Proceedings of the Albanian Seminar, Paris, France, 26–28 June 2003; Archive of
Seismological Institute: Tirana, Albania, 2003.24. Sulstarova, E.; Koçiaj, S. The Dibra (Albania) earthquake of November 30, 1967. Tectonophysics 1980, 67, 333–343. [CrossRef]25. Carydis, P.G.; Vougioukas, E.A. The Tirana, Albania, Earthquake of January 9, 1988; Special Earthquake Report; Earthquake
Engineering Research Institute: Oakland, CA, USA, 1988.26. Papazachos, B.; Papazachou, C. The Earthquakes of Greece; Ziti Publications: Thessaloniki, Greece, 1997.27. Sulstarova, E.; Koçiu, S.; Muço, B.; Peçi, V. The Revised Catalogue of Albanian Earthquakes with Ms ≥ 4.5 (Prepared into the Framework
of NATO’s ALB-SEIS Project); Institute of Seismology: Tirana, Albania, 2001.28. Koçiu, S. Induced seismic impacts observed in coastal area of Albania: Case studies. In Proceedings of the 5th International
Conference on Case Histories in Geotechnical Engineering, Missouri University of Science and Technology, New York, NY, USA,13–17 April 2004.
29. Duni, L.L.; Kuka, N. The earthquake of September 5, 2007 (Mw = 4.8) in Albania. Analysis of the accelerographic data recorded inDurresi town. In Proceedings of the 14th World Conference on Earthquake Engineering, Beijing, China, 12–17 October 2008.
30. Sulstarova, E.; Koçiaj, S. The Catalogue of Albanian Earthquakes; Academy of Sciences of Albania: Tirana, Albania, 1975.31. Koçiu, S.; Pitarka, A. A check-up on seismic hazard assessment: Tirana case study. Nat. Hazards 1990, 3, 293–305.32. Duni, L.; Bozo, L.; Kuka, N.; Begu, E. An upgrade of the microzonation study of the centre of Tirana city. In Proceedings of the
5th International Conference on Recent Advances in Geotechnical Earthquake Engineering and Soil Dynamics and Symposiumin Honor of Professor I.M. Idriss, San Diego, CA, USA, 24–29 May 2010. Paper No. 6.05b.
33. Petrovski, J.; Paskalov, T. The Earthquake of Montenegro-Yugoslavia of April 15, 1979; IEEES: New York, NY, USA, 1980; p. 65.34. Koçiaj, S.; Sulstarova, E. The earthquake of June 1, 1905, Shkodra, Albania. Tectonophysics 1980, 67, 319–332. [CrossRef]35. Shehu, V.; Dhima, N. The influence of engineering–geological conditions on the intensity distribution of the April 15, 1979
earthquake in Shkodra-Lezha region. In The Earthquake of April 15, 1979; The “8 Nentori” Publishing House: Tirana, Albania, 1983.36. Dibra, Z. Some phenomena of the soil liquefaction of the April 15, 1979 earthquake. In The Earthquake of April 15, 1979; The “8
Nentori” Publishing House: Tirana, Albania, 1983.37. Papathanassiou, G.; Pavlides, S.; Christaras, B.; Pitilakis, K. Liquefaction case histories and empirical relations of earthquake
magnitude versus distance from the broader Aegean Region. J. Geodyn. 2005, 40, 257–278. [CrossRef]38. Lekkas, E.; Mavroulis, S.; Filis, C.; Carydis, P. The September 21, 2019 Mw 5.6 Albania earthquake. Newsl. Environ. Disaster Cris.
Manag. Strateg. 2019, 13. [CrossRef]39. Lamaj, M.; Frashëri, N.; Bushati, S.; Moisiu, L.; Beqiraj, G.; Avxhi, A. Application of differential interferometry for analysis of
ground movements in Albania. In Proceedings of the 9th International Workshop Fringe 2015 Advances in the Science andApplications of SAR Interferometry and Sentinel-1 InSAR Workshop, ESA-ESRIN, ESA SP-731, Frascati, Italy, 23–27 March 2015.
40. Medvedev, S.V. Engineering Seismology; Moscow, English Translation; Israel Program for Scientific Translation: Jerusalem,Israel, 1965.
41. Bedini, E.; Naco, P. Automated change detection from remote sensing data. A case study at the Pali Cape—Erzen River MouthCoastal Sector. In Conference on Water Observation and Information System for Decision Support; Morell, M., Popovska, C., Morell, O.,Stojov, V., Kostoski, G., Dimitrov, D., Drobot, R., Radic, Z., Selenica, A., Eds.; BALWOIS: Ohrid, North Macedonia, 2008.
42. De Leo, F.; Besio, G.; Zolezzi, G.; Bezzi, M.; Floqi, T.; Lami, I. Coastal erosion triggered by political and socio-economical abruptchanges: The case of Lalzit Bay, Albania. In Proceedings of the 35th Conference on Coastal Engineering, Antalya, Turkey,17–20 November 2016. [CrossRef]
43. Bruci, E.; Kay, R.; Adhami, E.; Gjini, J.; Brew, D.; Mucaj, L.; Mullaj, A.; Ndini, M.; Diku, A.; Laci, S.; et al. Identification andImplementation of Adaptation Response Measures in the Drini–Mati River Deltas; Project Synthesis Support; Global Environment Fund(GEF), Albanian Government and United Nations Development Program (UNDP): Tirana, Albania, 2013.
44. Papathanassiou, G.; Valkaniotis, S.; Chaztipetros, A.; Pavlides, S. Liquefaction susceptibility map of Greece. Bull. Geol. Soc. Greece2010, 43, 1383–1392. [CrossRef]
45. Papathanassiou, G.; Kiratzi, A.; Valkaniotis, S.; Pavlides, S. Scenario liquefaction hazard map of the gulf of Corinth. In Proceedingsof the 2nd European Conference on Earthquake and Engineering Seismology, Istanbul, Turkey, 25–29 August 2014; pp. 639–647.

Geosciences 2021, 11, 215 29 of 29
46. Lozios, S.; Lekkas, E.; Mavroulis, S.; Alexoudi, V.; Sretskovits, M. Actions to Reduce Seismic Risk of the Katerini Municipality—Planning, Selection, Definition Organization of Emergency Shelters; Applied Research Program, National and Kapodistrian Universityof Athens: Athens, Greece, 2016; 285p.
47. Mavroulis, S.; Diakakis, M.; Kotsi, E.; Vassilakis, E.; Lekkas, E. Susceptibility and hazard assessment in the Ionian Islands forhighlighting sites of significant earthquake-related hazards. In Proceedings of the 6th International Conference on Civil Protection& New Technologies, Safe Corfu 2019, Corfu, Greece, 6–9 November 2019; pp. 21–24, ISSN 2654-1823.
48. Papathanassiou, G.; Pavlides, S. GIS-based database of historical liquefaction occurrences in the broader Aegean Region, DALOv1.0. Quat. Int. 2011, 242, 115–125. [CrossRef]
49. Ministry of Construction. Earthquake Resistant Design Regulations; Ministry of Construction, Department of Design, Academy ofScience of Albania, Seismic Center: Tirana, Albania, 1989.
50. Glavatovic, B.; Akkar, S.; Hoxha, I.; Kuk, V.; Zoranic, A.; Garevski, M.; Kovacevic, S. NATO SfP Project Number 983054.Harmonization of Seismic Hazard Maps for the Western Balkan Countries (BSHAP). Final Report. NATO. Available online:http://www.seismo.co.me/documents/NATO%20SfP%20No.983054%20FINAL%20REPORT.pdf (accessed on 30 January 2020).
51. Gülerce, Z.; Šalic, R.; Kuka, N.; Markušic, S.; Mihaljevic, J.; Kovacevic, V.; Sandıkkaya, A.; Milutinovic, Z.; Duni, L.; Stanko, D.;et al. Seismic hazard maps for the Western Balkan. Inženjerstvo Okoliša 2017, 4, 7–17.
52. Salic, R.; Gülerce, Z.; Kuka, N.; Markusic, S.; Mihaljevic, J.; Kovacevic, V.; Sandikaya, A.; Milutinovic, Z.; Duni, L.; Stanko, D.;et al. Harmonized seismic hazard maps for the western Balkan countries. In Proceedings of the 16th European Conference onEarthquake Engineering, Thessaloniki, Greece, 18–21 June 2018.
53. Youd, T.L. Screening Guide for Rapid Assessment of Liquefaction Hazard at Highway Bridge Site; Technical Report; MultidisciplinaryCenter for Earthquake Engineering Research (MCEER-98-0005): Buffalo, NY, USA, 1998; 58p.
54. Vittori, E.; Blumetti, A.M.; Comerci, V.; Di Manna, P.; Piccardi, L.; Gega, D.; Hoxha, I. Geological effects and tectonic environmentof the 26 November 2019, Mw = 6.4 Durres earthquake (Albania). Geophys. J. Int. 2021, 225, 1174–1191. [CrossRef]
55. Tang, X.-W.; Hu, J.-L.; Qiu, J.-N. Identifying significant influence factors of seismic soil liquefaction and analyzing their structuralrelationship. KSCE J. Civ. Eng. 2016, 20, 2655–2663. [CrossRef]
56. Huang, Y.; Yu, M. Chapter 2: Macroscopic characteristics of seismic liquefaction. In Hazard Analysis of Seismic Soil Liquefaction;Springer Natural Hazards; Springer: Singapore, 2017. [CrossRef]
57. Faculty of Societal Safety Sciences of Kansai University. Chapter 8—Liquefaction with the Great East Japan Earthquake. In TheFukushima and Tohoku Disaster—A Review of the Five-Year Reconstruction Efforts; Elsevier Science: Amsterdam, The Netherlands,2018; pp. 147–159. [CrossRef]
58. Cao, Z.; Youd, T.L.; Yuan, X. Gravelly soils that liquefied during 2008 Wenchuan, China earthquake, Ms = 8.0. Soil Dyn. Earthq.Eng. 2011, 31, 1132–1143. [CrossRef]
59. Cubrinovski, M.; Robinson, K.; Taylor, M.; Hughes, M.; Orense, R. Lateral spreading and its impacts in urban areas in the2010–2011 Christchurch earthquakes. N. Z. J. Geol. Geophys. 2012, 55, 255–269. [CrossRef]
60. Yamaguchi, A.; Mori, T.; Kazama, M.; Yoshida, N. Liquefaction in Tohoku district during the 2011 off the Pacific Coast of TohokuEarthquake. Soils Found. 2012, 52, 811–829. [CrossRef]
61. Dong, L.; Hu, W.; Cao, Z.; Yuan, X. Comparative analysis of soil liquefaction macro-phenomena in Bachu earthquake. J. Earthq.Eng. Eng. Vib. 2010, 30, 179–187.
62. Shi, Z.; Wang, G.; Wang, C.-Y.; Manga, M.; Liu, C. Comparison of hydrological responses to the Wenchuan and Lushanearthquakes. Earth Planet. Sci. Lett. 2014, 391, 193–200. [CrossRef]
63. Quigley, M.; Hughes, M.; Bradley, B.; van Ballegooy, S.; Reid, C.; Morgenroth, J.; Horton, T.; Duffy, B.; Pettinga, J. The 2010–2011Canterbury earthquake sequence. Environmental effects, seismic triggering thresholds and geologic legacy. Tectonophysics 2016,672–673, 228–274. [CrossRef]
64. Schmid, S.M.; Bernoulli, D.; Fügenschuh, B.; Matenco, L.; Schefer, S.; Schuster, R.; Tischler, M.; Ustaszewski, K. The Alpine-Carpathian-Dinaridic orogenic system: Correlation and evolution of tectonic units. Swiss J. Geosci. 2008, 101, 139–183. [CrossRef]
65. Mavroulis, S.D.; Fountoulis, I.G.; Skourtsos, E.N.; Lekkas, E.L.; Papanikolaou, I.D. Seismic intensity assignments for the 2008Andravida (NW Peloponnese, Greece) strike-slip event (June 8, Mw = 6.4) based on the application of the Environmental SeismicIntensity scale (ESI 2007) and the European Macroseismic scale (EMS-98). Geological structure, active tectonics, earthquakeenvironmental effects and damage pattern. Ann. Geophys. 2013, 56, S0681. [CrossRef]
66. Lekkas, E.L.; Mavroulis, S.D. Earthquake environmental effects and ESI 2007 seismic intensities of the early 2014 Cephalonia(Ionian Sea, Western Greece) earthquakes (January 26 and February 3, Mw 6.0). Nat. Hazards 2015, 78, 1517–1544. [CrossRef]
67. Lekkas, E.L.; Mavroulis, S.D. Fault zones ruptured during the early 2014 Cephalonia Island (Ionian Sea, Western Greece)earthquakes (January 26 and February 3, Mw 6.0) based on the associated co-seismic surface ruptures. J. Seismol. 2016, 20, 63–78.[CrossRef]
68. Lekkas, E.; Mavroulis, S.; Carydis, P.; Alexoudi, V. The 17 November 2015 Mw = 6.4 Lefkas (Ionian Sea, Western Greece)Earthquake: Impact on Environment and Buildings. Geotech. Geol. Eng. 2018, 36, 2109–2142. [CrossRef]
69. Papadopoulos, G.A.; Lefkopoulos, G. Magnitude-distance relations for liquefaction in soil from earthquakes. Bull. Seismol. Soc.Am. 1993, 83, 925–938.
70. Galli, P. New empirical relationships between magnitude and distance for liquefaction. Tectonophysics 2000, 324, 169–187.[CrossRef]