Exploring China's Investments and Development Assistance ...
Dorota Ciesielska, The Macrotheme Review 3(1)A, Spring 2014
214
The Macrotheme Review A multidisciplinary journal of global macro trends
Polish Foreign Direct Investments – trends, patterns and determinants
Dorota Ciesielska Warsaw School of Economics,
Collegium of Business Administration,
Institute of Value Management
The publication is a part of the project financed by The National Science Center, Poland based on the decision number D2012/05/B/HS4/04218
Abstract
The aim of this article is to shed light on the current characteristic of Polish OFDI
investments during the period 2000–2012 as well as to present the possible prospects of
its development in light of the current theories and existing research. The value of Polish
Outward Foreign Direct Investments (OFDI) stock has risen dynamically from USD 1.01
billion in 2000 to USD 57.4 billion in 2012. This new phenomenon reflects the desire of
many Polish companies to strengthen their position in the regional, more distant markets,
as well as to gain an access to resources that they are lacking. Even during the recent
global economic crisis despite growing flows of FDI in the world, Poland was among
these countries that experienced an increase of outward FDI stock possessed by Polish
companies.
Keywords: Foreign Direct Investments, Poland
1. Introduction
The value of Polish Outward Foreign Direct Investments (OFDI) stock has risen dynamically from USD
1.01 billion in 2000 to USD 57.4 billion in 2012. Nowadays according to the OECD (2013) Poland is the
main foreign direct investor in the CEE region. Polish OFDI outward stock was much larger than that of
Hungary (USD 34 billion) which is the second largest direct investor, and the Czech Republic (USD 15.47
billion). What is more, the value of OFDI stock in the case of Poland was increasing apart from the
worsening of global economic condition. To compare in 2009 the OFDI stock for Poland amounted to
USD 29 billion. However, it should be noted that apart from the growing importance of Polish OFDI the
value of their stock expressed as a percent of GDP is still low in comparison to the EU average and lower
than in case of some CEE economies. Moreover the geographical scope as well as motives and
determinants of Polish OFDI still indicate the initial level of these investments.
The aim of this study is to present the current characteristic of Polish OFDI investments during the period
2000–2012 as well as to present the possible prospects of its development in light of the current theories
and existing research.
Because of the relatively small scale of Polish outward foreign direct investment (OFDI) this problem was
not a subject of many analyses. However because the development of Polish MNEs and their growing
activity on foreign markets this issue is attracting more and more attention. This subject is particularly
Dorota Ciesielska, The Macrotheme Review 3(1)A, Spring 2014
215
interesting because according to the Investment Development Path (IDP) concept, Poland is moving
forward the stages of internationalization, which should result in the growing value of OFDI, which is also
going to be analyzed in this study.
This paper is divided into three parts. In the first part the theoretical framework for the IDP concept and
other theories concerning the internationalization are presented. The second part of the article is devoted
to the theoretical analysis of the existing literature and research in the field of Polish outward FDI. The
third part of the paper is devoted to the empirical analysis of the Polish OFDI which is based on the
existing macro and micro data.
2. Theoretical overview
There are several traditional theories explaining FDI and the development of multinationals both on the
micro and macro levels. One of the most important theories which explains the internationalization of
companies on the macro level is the investment development path (IDP). This concept of was created by
Dunning (Dunning, 1981, 1986) and Narula (Dunning and Narula, 1996; 2002, Dunning, Lundan 2008). It
was also an issue of study for many other researchers (Lee, Slater 2007; Narula, Guimón, 2010; Gorynia
et al. 2009, Gorynia et al. 2010).
The main thesis of IDP is that with the country development, a structural change takes place in the
conditions faced by domestic and
.
The aim of the IDP is to explain investment patterns among countries using macro-economic variables. It
is based on five major stages. Changes in the volume and structure of FDI lead to different values in the
’ N O v NO NO b
value of gross outward direct investment stock and the value of gross inward direct investment stock.
Changes in NOIP also lead to a different stage on the IDP. Countries which are classified at stages 1 to 3
are perceived as developing economies while ones which have reached stages 4 and 5 are developed
economies (Durán and Ubeda, 2005).
S 1 ’ v v b
resources. At this stage the number of outward and inward FDI is very low, as is the asset accumulation.
The country engages mainly in imports and exports in resource-based and low and medium created asset-
intensive sectors. At this stage the NOIP is close to zero or negative, and its negative value grows.
The second stage is also called the investment-led stage of development. The country attracts more inward
FDI, but still the number and importance of foreign outward investment is low. The value-added activities
develop. The size of the domestic market is grows as the capabilities and productivity of local resources
ameliorate. This happens partially because of the need to face growing competition. The structure of a
’ v v v -scale, capital-intensive
sectors which are basic chemicals, iron, steel and some smaller-scale and specialised mechanical
engineering activities; as well as the manufacturing of labour-intensive and moderately knowledge-
intensive consumer goods, such as electrical products, clothing, leather goods, processed foods. At this
stage NOIP still decreases, but the rate of the decrease is slower because of the growth of outward FDI.
Countries at the third stage of IDP are close to economic maturity. This can be seen both in the income
level as well as the structure of the industry which is similar to the one characteristic for highly developed
countries. There is a change from growth based on investment to development through innovations. The
advantages and the position of companies do not rely only on access to natural resources but more and
more on their intangible assets. It is a stage when the companies begin to internationalize because of a
growing competitive advantage. This internationalization strategy begins thru exports, and then develops
by outward direct investment when they increase the sales in foreign markets or if the costs of production
in the home country are growing. The third stage is the point when companies do not only look for
Dorota Ciesielska, The Macrotheme Review 3(1)A, Spring 2014
216
resource- or market-seeking investment but start to develop in efficiency-seeking and strategic asset-
acquiring MNE activity. The NOIP grows because of the increase of outward FDI and a slowdown in
inward FDI.
At stage 4, the inward investments are sequential, and efficiency or strategic asset-seeking kinds.
Countries have high expenditure on R&D and a high service share in the finished output. Economies
v v ‘ - ’ k b NO
the 0 level and becomes positive because of the rising outward FDI stock.
The fifth and final stage of IDP is typical for highly developed countries such as the US, Japan and
Sweden. At this stage the companies invest abroad to increase their efficiency and because they are
seeking strategic assets. There is still an inflow as well as an outflow of FDI but according to Dunning and
Narula hypothesis, the fluctuating net foreign investment position is at this stage around zero (Dunning,
Lundan 2008). This is the moment when usually both inward and outward FDI increase.
According to Juan and Úbeda (2005) the variables that define countries at different stages of IDP can be
divided into different groups. In the first three stages the main variable is the inflow of FDI. The fourth-
stage countries are defined by the growing stock of outward FDI, while for the fifth-stage countries the
main characteristic is their net investment position (NOI), which is around zero.
IDP theory is strictly connected with the configuration of the Ownership-Location-Internalisation (OLI)
advantage (Dunning, 2001) which is one of the most important frameworks to analyze the development of
multinational enterprises and foreign direct investments flow. According to the OLI paradigm the
company must have specific advantages, named ownership advantages, to be more competitive in
comparison to domestic firms which have lower costs of operation and their advantage because of good
knowledge of the local market. These advantages, such as better access to markets, operational skills, high
knowledge of their human resources, or a broader access to financial markets, are in most cases based on
intangible assets, and the company can profit from them while operating abroad. Also the host country
should possess specific advantages called locational advantages which influence the place where
companies will invest. These advantages include a highly educated and low cost labour force, access to a
high income market, infrastructure etc. These location advantages are the differences between the home
country and potential host countries. If these did not exist, the company would rather operate in its own
country and export its products/services to foreign markets. Thirdly, according to the OLI paradigm, there
are internalization advantages connected with strategic alliances and operating in the business networks.
These advantages are also connected with the reduction of transaction costs. They include the reduction of
the cost of searching for suppliers and negotiating prices, risk of abuse, asymmetric information, risk
contracts, quality assurance, etc. IDP stages of economic development are characterized by different
location advantages that attract FDI as well as ownership advantages of local firms that enhance OFDI.
Also, the concept of the IDP assumes that inward FDI contributes to the am ’
v ’ v v
FDI and OFDI in the future.
According to these theories, economic development has huge implications on the FDI flows. As it
proceeds the net inward direct investment will grow and then after some time fall. At the beginning the
’ b v v “ k ”
investment. However there should be a growth in the number and value of such investment with the
economic growth of the country. Over time outward FDI will also emerge. Growing operational costs
enhances domestic companies to shift the labour-intensive segments of the production process to cheaper
locations. They will also develop competitive advantage which will help them to compete successfully in
the foreign markets of less-developed countries. (Barry et all, 2002). When this happens the moment will
’ b v will be reduced because of the growth of labour and
other production costs. This will be an incentive for domestic firms to engage in vertical FDI. At the same
time it will also reduce the incentive for vertical inward investment. With its economic development the
Dorota Ciesielska, The Macrotheme Review 3(1)A, Spring 2014
217
b v v b b z “ k k ”
incentive and technology-sourcing possibilities then because of the cost reasons (Barry et all, 2003).
The most important limitation of the IDP model is that it is based only on the gross domestic product as an
indicator of development. This indicator does not contain many important variables that influence the
country stage on the IDP (Gorynia et al, 2009). This is a reason why the relat b ’
NOIP and its gross domestic product GDP or gross domestic product per capita should be interpreted
carefully (Narula, Guimón 2010) and the stages of the IDP should not be treated as categorical but rather
as indicative. The countries at a similar level of GDP per capita may not always be at similar stages of the
IDP (Duran et al. 2001). This is caused by the fact that there are many factors other than GDP that
influence the inward and outward FDI which affects the NOIP position. This is why the IDP as a tool to
analyze the interaction between FDI and development interpretation should be analyzed rather in the
broader sense. This broad version of the IDP means taking into consideration other variables apart from
FDI flow and GDP or GNP per capita(Bell M., Marin 2004). The most important ones that should be
taken into consideration are socio-economic and political level of development, external economic
b v ’ profile. More attention should
be also paid to the heterogeneity of FDI as well as to the influence of policy orientations (Narula, Guimón
2010).
Much research shows that some emerging economies have leapfrogged along the development path and
have originated more OFDI than the path would have predicted (Narula, Dunning 2000; Kalotay, 2008;
Liu et al., 2007). This means that they have reached the stage of strategic asset-seeking outward
investment before it is suggested by their level of economic development. This is caused by the fact that
some domestic companies have acquired a competitive advantage which is rather caused by the possession
of ownership advantages rather than by the level of the economic development of their home country.
However when inward FDI is combined with the introduction of an industrial policy that aims at
increasing education and technological capacity, the level of competitiveness of national companies can
be ameliorated and they can raise their outward FDI move more quickly then resulting from their
IDP(Hoesel, 1999; Lee, Slater 2007). Apart from the countries that have leapfrogged along the
development path there are many examples of the countries which have not achieved a high level of
outward FDI, typical for the fourth or fifth stage of IDP, despite achieving high levels of development.
(Narula, Guimón 2010). Apart from these facts the relationship between FDI and economic development
which is presented in the IDP concept is still relevant, but this relation may be different in cases of
different countries. The IDP may be perceived as a concept that is country-specific (Boudier-Bensebaa,
2008).
There are other also models which concern internationalization theory that are based on a micro-level
approach. Many of them show the evolutionary characteristic of internationalization which indicates the
relationship between stage of development and investment of a company. An example of this is the
Uppsala model (see Johanson and Vahlne, 1977 and Johanson and Vahlne, 2009), which shows that the
process of internationalization of enterprises goes through several stages of development, from various
forms of export to the greater involvement of the capital including the development of production for
abroad. The key to this model is the accumulation of experience, which is the basis for the creation of the
company's ability to expand internationally. Another interesting proposal for an evolutionary approach
was made by Dunning and Lundam (2008), who point not only to several stages of development
investment, depending on the stage of development of the company, but also involve the various stages of
the motives and characteristics of foreign investment.
3. Studies on Polish OFDI
Outward FDI from European transition and post-transition economies is the issue that has lately attracted
much attention from economic researchers and policy makers. The interest in this field is caused by the
Dorota Ciesielska, The Macrotheme Review 3(1)A, Spring 2014
218
increasing value and number of investments which is a result of the growing competitiveness of the
companies operating in this region. However, in the case of Poland there was not much research
conducted in this field. However, it should be mentioned that a growing number of studies in this field
appear after the year 2009.
In this part of the paper the main results of the literature review are presented. They are based on an
analysis of 14 studies devoted to the OFDI from Poland. The analyzed studies were selected and divided
into two main groups according to their main research topic and scope of the study. The research in the
first group is mostly devoted to the macro trend analysis. The second group of study is those based on
micro data and case studies. It should be noted that some of the studies are included into both groups. The
majority of the analyzed research strictly concerns Poland but some of them also take into account other
CEE countries. It should be noted that from the studies which are devoted to the CEE region only the ones
directly approaching Poland were chosen.
The first group of the studies is those based on macro data analyses which are concentrated on the Polish
IDP and the major trends in Polish OFDI. This includes the papers of Boudier-Bensebaa; 2008; Gorynia et
9; G 1 ; G 1 ; R ł S 1 ; R ł 1 ; R ł C k 13;
Zimny, 2013; Buczkowski 2013.
Gorynia et al. (2009) have analyzed polish NOIP in the period of 1990-2006 in a holistic approach which
took into account geographic, sectorial and industrial patterns of FDI. The research has shown that in the
’ NO v v S
half of the 1990s Poland has been in Stage 2 of its IDP. This conclusion was also confirmed in the study
of Boudier-B b 8 R ł S 1 ; R ł 1 H v G 9 v
mentioned at the moment of their analysis there were some symptoms that Poland was approaching stage
3 of IDP. This was mostly caused by an increasing number of investments towards the EU. As well as the
’ NO b v k
the CEE countries. The researc j ’ b
even classified as Stage 4 (Gorynia et al. 2009). The Gorynia et al (2009) research was re-visited by the
same authors in 2010. The main aim of the study was to analyze the CEE-10 countries progress along their
IDPs in the period of 1990-2008 as well as to reveal the factors that influenced the position of particular
countries or groups of countries on their IDPs. The study has shown that apart from the deteriorating
macroeconomic conditions Poland and the majority of other CEE countries have moved through the third
stage of the IDP. However the authors underlined that this conclusion should be confirmed in the coming
period of time because such a result may be clearly visible only in a long term analysis. The fact that the
global crisis did not affect their investment development path was perceived as an important outcome for
G 1 A R ł 1
economic crisis which had resulted in a diminishing of OFDI flows, in the case of Polish companies was
not as high as expected. It can be seen by the fact that in the years 2008 and 2009, Polish companies have
made a relatively high number of cross-border deals. What is more, expansion of Polish companies based
on OFDI accelerated in 2010. According to research conducted by Zimny (2013) the growth of number
and value of OFDI from Poland which started in 2005 was mostly caused by the appearance of Polish
MNEs. This tendency was strengthened by a laissez-faire policy which in combination with relative
economic and political stability in recent years, observed even during the resent global crisis, help Polish
firms to internationalize. Similarly to the previously mentioned researchers, Zimny underlines that this
tendency is going to continue because more and more firms acknowledge the benefits from investing
abroad.
Gorynia et. al (2012) have confirmed the previous conclusions that Poland is at the beginning of its IDP
stage three in a study which covers the period from 1990-2009. The researchers have underlined that the
movement of Poland through the next stage of development may be caused by the fact that Polish firms
are increasing competitive advantage which allows them to expand into foreign markets. Such a tendency
was also confirmed by Zimny (2013)
Dorota Ciesielska, The Macrotheme Review 3(1)A, Spring 2014
219
Gorynia et al. (2012) research underlines that Polish companies are still in the early stages of foreign
expansion, which is the most important reason why Polish OFDI is mainly located in Europe with the
main destination and the higher growth rate in CEE countries. This geographical concentration of OFDI
seems to be caused by the fact that Poland is an emerging market. Polish firms are just starting to build
their comp v v z v A ’
’ v b v v v CEE
from the knowledge of the environment and the lack or short psychic distance than in case of the western
European countries. These firms are still building competences which will allow them to enter markets
which are more far away from Poland and that are offering larger sales and expansion possibilities, such
as China, India, and the United States. The fact that Polish companies primarily expand into the regional
k C E S E G b R ł
1 ; R ł ; C k 13; B zk k 13
Thi b b W ń k 13
CEE k v z W ń k
that acquisitions of firms from highly developed countries are at the moment relatively rare. It is one of
the reasons why it is difficult to accelerate the learning process and the use of globally known brands.
W ń k 13 k b NE
The majority of the analyzed studies underlines that important reasons for the growing number and value
O v R ł 1 Z 13
R ł C k 13 G 1 h can be seen both in the geographical and sectorial
concentration of Polish OFDI.
Concerning the sectorial concentration analyzed studies show that the share of the service sector in the
OFDI in Poland OFDI is dominant over the manufacturing sector, which is typical for mature developed
economies, as well as underline that the growing amount of OFDI is in the field of accounting, consulting,
management, and legal services. This trend may be perceived as a sign that Polish firms are acquiring a
new knowledge-based competitive advantage in Poland and that they may develop their specialization in
the field of business process outsourcing (Gorynia et al. 2012; Zimny 2013; Radlo Ciesielska 2013). The
large number of OFDI in the services sector may be caused by the fact that most Polish companies have
started to invest abroad to support their exports and that is why they set FDI to develop their trading
activities Zimny (2013). Also Buczkowski (2013) has shown that Polish OFDI are still realized to support
export activity of these companies because they are mostly commercial offices and retail outlets.
Another group of studies concerns the determinants and models of OFDI and is based on the micro level
data or based on case studies such as Karaszewski et al. (2009) K k R ł 1 R ł 1
Gotz (2011), Klimek (2009).
According to a study conducted by Kraszewski et al. (2009), which covers a group of about 486 polish
companies dealing with OFDI, the main motive for their internationalization was market seeking. The
second most important factor was cost reasons which were important for the countries investing in the
CEE region. The results of the study have also confirmed the importance of institutional incentives for the
Polish outward investors. In the majority of cases Polish OFDI had a positive impact on the investor
competitiveness in relation to the position on both the home and foreign market. The greatest benefits of
investing abroad were in the field of sales and marketing. As a result of the OFDI companies have
improved their access to markets and increased knowledge about the needs and preferences of customers.
These investments have also positively affected the image and reputation of the company as well as
increased brand recognition. According to Kraszewski et al. (2009) the main factor that enables global
expansion of Polish companies was the quality of offered products and services.
K k R ł 1 the determinants of foreign investments and entry
modes of the Polish multinational companies in the years 2003-2010 as well as the motivation for foreign
investments of Polish companies across various sectors. According to their analysis, the main motives for
Dorota Ciesielska, The Macrotheme Review 3(1)A, Spring 2014
220
OFDI realized by Polish companies was market seeking, which is consistent with theses from Dunning
and Lundam (2008) that in the early stages of internationalization the companies are motivated mainly by
market and resource seeking. K k R ł 1 v stressed that the motives for
internationalization vary depending on the sector and entry mode. Market seeking motives were more
important in the case of FDI projects in industrial sectors, including manufacturing, for all modes of entry,
meaning mergers and acquisitions (M&A) as well as green field investments. However these factors were
not important for enterprises in service sectors which were entering foreign markets through M&A.
Market seeking motives proved to be important for firms representing all sectors which decided to realize
green field investment. Significance of resource seeking motives was visible in case of companies
representing service sectors - these companies invested mainly in countries characterized by a higher
quality of human resources. The result of the research has shown that Polish multinationals prefer to invest
in host countries that are close to their home countries, as was also underlined by Karaszewski et
9 ; G 1 A K k R ł 13 especially
for Greenfield FDI and M&A in industrial sectors, including manufacturing.
K k R ł 1 b v
between the manufacturing and service sector in case of Polish companies. The ones that were classified
as the industrial and manufacturing sector developed consistency with the evolutionary Uppsala model.
The different development pattern was in the case of service companies, which seemed to be able to move
faster through the phases z K k R ł 13 v
may be a tendency that the multinational companies from emerging markets apply more advanced
internationalization strategies faster than it was in case of developed multinationals but this happens
mostly in the case of service sectors and on a regional scale.
Another aspect connected with Polish OFDI was analyzed by Klimek (2009). His empirical research was
aimed at identifying the main characteristics of Polish manufacturing companies which had established a
k ’ z
which were productivity, age and size. The results have shown that only the most productive firms
establish production plants in foreign countries. It is caused by the fact that in comparison to companies
operating on local markets they face less favorable conditions. Also the age of companies shown was
statistically coefficient with the internationalization process. However, his research did not show the
importance of the size of company for the internationalization process. As a general assumption FDI
should be easier to realize by large companies but in the case of Polish companies in the manufacturing
industry the research has shown the negative influence of the size on the likelihood of undertaking foreign
production. It may be explained by the characteristics of Polish manufacturing companies. Many of them
were previously state-owned and they were large size but started the production abroad because of the
inefficient structure and low competitiveness.
Another study presented by Gotz (2013) has defined the patterns for expansion for Polish companies in
Western Europe. The results of the study shows that OFDI is in many cases treated as a guarantee of a
’ x b k
“b b ” v
thanks to networking, joint ventures and non-equity forms of internationalization. Gotz also states that the
b ’
or may refer to the know-how, experience, and capital acquir b ’ b

Dorota Ciesielska, The Macrotheme Review 3(1)A, Spring 2014
221
4. Current trends analysis
4.1. Main characteristics of OFDI from Poland
The transition process of the Central and Eastern European (CEE) countries has led not only to the
growing attractiveness of these economies for inward foreign direct investments but also contributed to
the emergence of outward foreign direct investment (OFDI) from that region.
While analyzing the OFDI and the IDP of Poland and other Central and Eastern European countries
(CEECs), it is important to underline that they were influenced by a specific historical and political
context. The IDP of the countries from the CEE region was strongly influenced by the transition from
socialism to capitalism as well as by accession to the EU. It makes that comparing IDP of CEE countries
with other developed or developing countries may not be reasonable. Before 1990 both inward and
outward FDI in these post-socialist economies was very limited because of the political and economic
system. This situation caused that in spite of the relatively high GDP per capita levels typical for the
countries at stage 2 and 3 of IDPs, NOI, IFDI and OFDI were as low as in stage 1 countries (Narula,
Guimón 2010). The radical change of this situation was caused by the transition from a socialist to a
market-driven system in the 1990s which was an unprecedented phenomenon in modern economic
history. Poland and other CEE economies went through the process of privatization of state own
companies which was related to the restructuration of existing companies which were at that moment
unable to compete effectively with foreign firms. The next crucial moment was the process of European
integration which aimed to achieve a well-functioning market economy able to face the competitive
pressure of the EU single market. These changes caused that inward FDI increased drastically from 1990
to 2012, much faster than in the case of Western European countries or developing countries from other
regions. At the same time the growth of outward FDI was also dynamic but much lower in value than in
the case of onward FDI.
According to the OECD (2013), Poland is the largest foreign direct investor in the CEE region. In 2012
the FDI outward stock of Poland exceeded USD 57 billion. It was much more than in case of Hungary, the
second largest direct investor in the region with OFDI outward stock of USD 34 billion, and almost four
times more than in case of the Czech Republic (USD 15.47 billion). The value of polish OFDI stock is
increasing apart from the worsening of global economic condition. To compare in 2009 the OFDI stock
for Poland amounted to USD 29 billion.
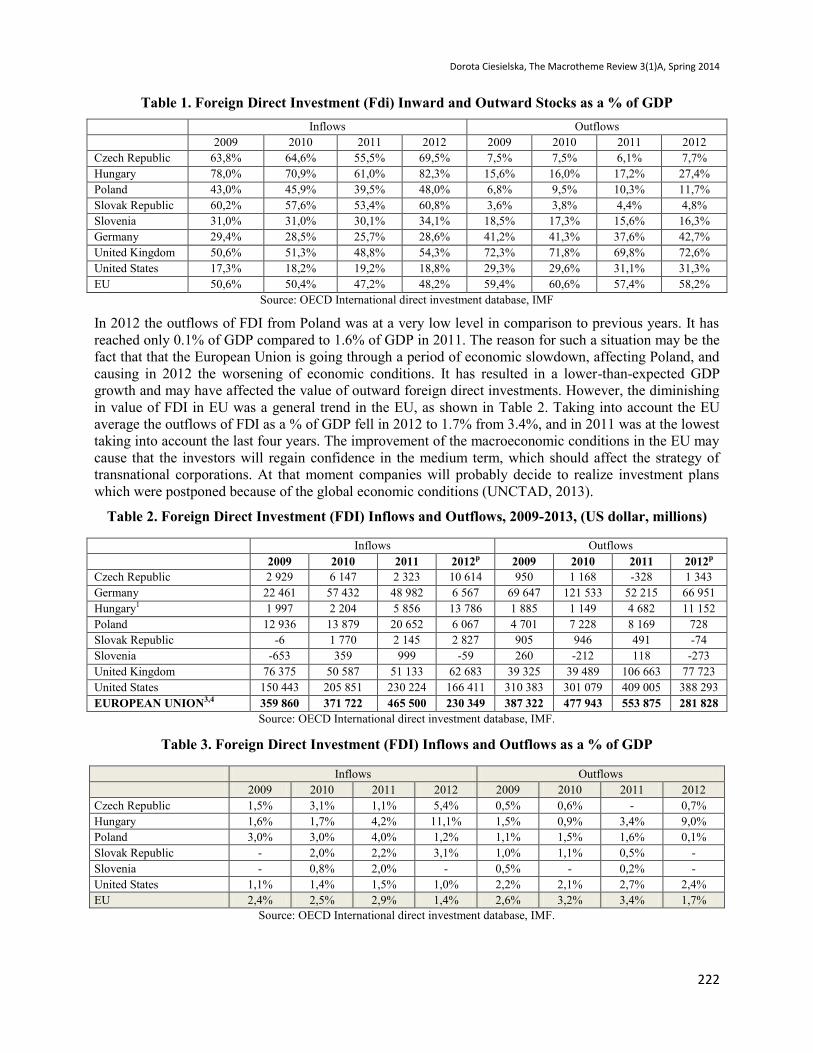
Apart from the growing importance of polish OFDI the value of their stock expressed as a percent of GDP
is still low in comparison to the EU average and lower than in case of some CEE economies. In 2012 it
amounted 11.7% of GDP and it was not only much lower than in the case of Germany (42.7%), United
Kingdom (72.6%) but also less than in Hungary (27.4%) and Slovenia(16.3%).
In Poland as well as the other CEE countries there is still a huge disproportion between the stock of the
inflow FDI and the outflow. In 2012 the stock of inward FDI in Poland reached 48% which was close to
the EU average and much lower than in other CEE countries such as Hungary (82%), the Czech Republic
(69%) and the Slovak Republic (60%).
Dorota Ciesielska, The Macrotheme Review 3(1)A, Spring 2014
222
Table 1. Foreign Direct Investment (Fdi) Inward and Outward Stocks as a % of GDP
Inflows Outflows
2009 2010 2011 2012 2009 2010 2011 2012
Czech Republic 63,8% 64,6% 55,5% 69,5% 7,5% 7,5% 6,1% 7,7%
Hungary 78,0% 70,9% 61,0% 82,3% 15,6% 16,0% 17,2% 27,4%
Poland 43,0% 45,9% 39,5% 48,0% 6,8% 9,5% 10,3% 11,7%
Slovak Republic 60,2% 57,6% 53,4% 60,8% 3,6% 3,8% 4,4% 4,8%
Slovenia 31,0% 31,0% 30,1% 34,1% 18,5% 17,3% 15,6% 16,3%
Germany 29,4% 28,5% 25,7% 28,6% 41,2% 41,3% 37,6% 42,7%
United Kingdom 50,6% 51,3% 48,8% 54,3% 72,3% 71,8% 69,8% 72,6%
United States 17,3% 18,2% 19,2% 18,8% 29,3% 29,6% 31,1% 31,3%
EU 50,6% 50,4% 47,2% 48,2% 59,4% 60,6% 57,4% 58,2%
Source: OECD International direct investment database, IMF
In 2012 the outflows of FDI from Poland was at a very low level in comparison to previous years. It has
reached only 0.1% of GDP compared to 1.6% of GDP in 2011. The reason for such a situation may be the
fact that that the European Union is going through a period of economic slowdown, affecting Poland, and
causing in 2012 the worsening of economic conditions. It has resulted in a lower-than-expected GDP
growth and may have affected the value of outward foreign direct investments. However, the diminishing
in value of FDI in EU was a general trend in the EU, as shown in Table 2. Taking into account the EU
average the outflows of FDI as a % of GDP fell in 2012 to 1.7% from 3.4%, and in 2011 was at the lowest
taking into account the last four years. The improvement of the macroeconomic conditions in the EU may
cause that the investors will regain confidence in the medium term, which should affect the strategy of
transnational corporations. At that moment companies will probably decide to realize investment plans
which were postponed because of the global economic conditions (UNCTAD, 2013).
Table 2. Foreign Direct Investment (FDI) Inflows and Outflows, 2009-2013, (US dollar, millions)
Inflows Outflows
2009 2010 2011 2012p 2009 2010 2011 2012p
Czech Republic 2 929 6 147 2 323 10 614 950 1 168 -328 1 343
Germany 22 461 57 432 48 982 6 567 69 647 121 533 52 215 66 951
Hungary1 1 997 2 204 5 856 13 786 1 885 1 149 4 682 11 152
Poland 12 936 13 879 20 652 6 067 4 701 7 228 8 169 728
Slovak Republic -6 1 770 2 145 2 827 905 946 491 -74
Slovenia -653 359 999 -59 260 -212 118 -273
United Kingdom 76 375 50 587 51 133 62 683 39 325 39 489 106 663 77 723
United States 150 443 205 851 230 224 166 411 310 383 301 079 409 005 388 293
EUROPEAN UNION3,4 359 860 371 722 465 500 230 349 387 322 477 943 553 875 281 828
Source: OECD International direct investment database, IMF.
Table 3. Foreign Direct Investment (FDI) Inflows and Outflows as a % of GDP
Inflows Outflows
2009 2010 2011 2012 2009 2010 2011 2012
Czech Republic 1,5% 3,1% 1,1% 5,4% 0,5% 0,6% - 0,7%
Hungary 1,6% 1,7% 4,2% 11,1% 1,5% 0,9% 3,4% 9,0%
Poland 3,0% 3,0% 4,0% 1,2% 1,1% 1,5% 1,6% 0,1%
Slovak Republic - 2,0% 2,2% 3,1% 1,0% 1,1% 0,5% -
Slovenia - 0,8% 2,0% - 0,5% - 0,2% -
United States 1,1% 1,4% 1,5% 1,0% 2,2% 2,1% 2,7% 2,4%
EU 2,4% 2,5% 2,9% 1,4% 2,6% 3,2% 3,4% 1,7%
Source: OECD International direct investment database, IMF.

Dorota Ciesielska, The Macrotheme Review 3(1)A, Spring 2014
223
4.2. Poland’s IDP analysis 2002-2012
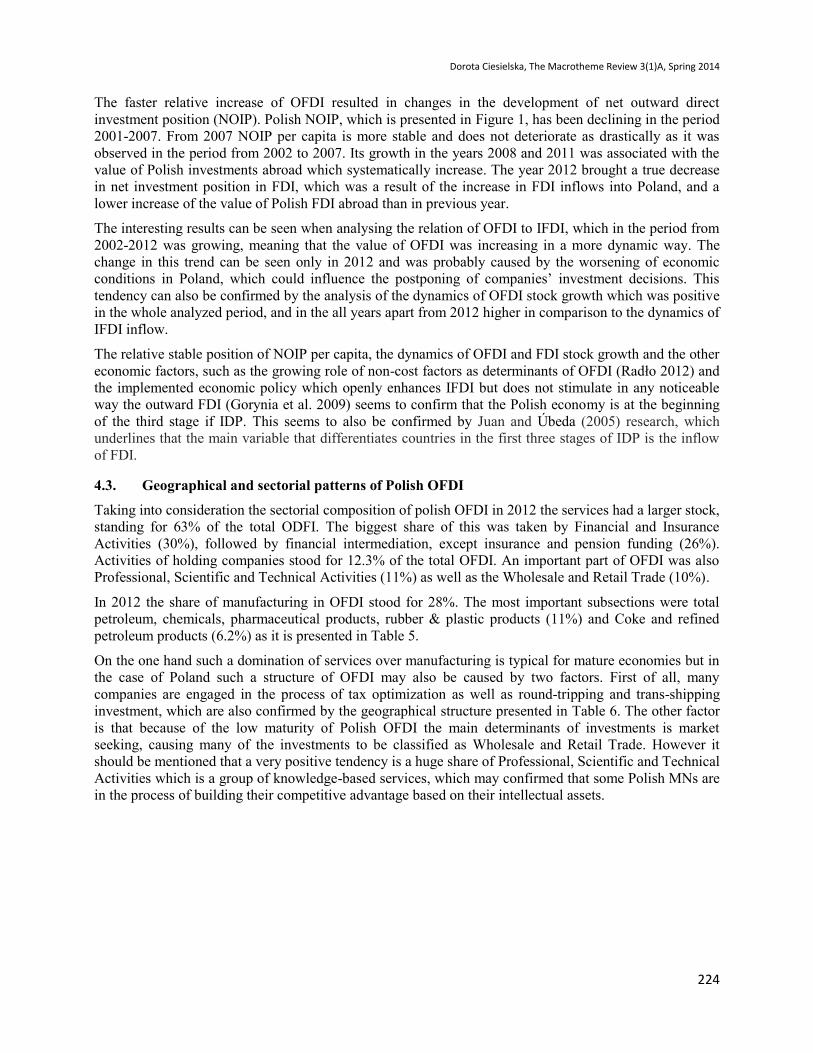
As shown in Figure 1 the value of Polish OFDI stock has dynamically increased, from USD 1.01 billion in
2000 to USD 57.4 billion in 2012. However, the value of OFDI stock is much lower in comparison to the
value of inward FDI stock which amounted to USD 235 billion in 2012 .It is worth mentioning that in the
analyzed period the value of inward OFDI has also risen but at much lower pace than in the case of OFDI.
The value of Polish OFDI gradually began to grow after 2003, with the positive aspects of the accession to
the European Union. However in practice it is difficult to directly connect to an increase in the
international activity of Polish enterprises in entering the EU. It is, rather, the consequence of
strengthening the competitiveness of domestic enterprises and their growth. Increase in the activity of
Polish investors abroad was not even slowed down by the global economy in 2007. In the years 2008-
2009, which was a period of global slowdown and crisis in the global economy, the Polish economy and
investing companies were in a relatively good condition. The value of OFDI flow declined in 2008 by
about 25 % compared to the previous year, but in 2009, there was a reversal of this trend. The year 2010
saw a continuation of the growth of OFDI. The same situation may happen after the decline in the flows of
Polish OFDI which took place in 2012. With the gradual amelioration of economic projections for Poland
at the end of 2013 Polish companies should begin to abandon or postpone foreign investment projects.
Figure 1. Net Outward Investment Position (NOIP) of Poland; 2000-2012 (billions of USD)
Source: Own estimations based on National Bank of Poland statistic data
Table 4. Poland’s NOIP and NOIP per capita in the period 2002-2012
OFDI/F
DI
OFDI (previous
year 100%)
IFDI (previous
year 100%)
OFDI stock
(mln USD)
IFDI stock
(mln USD)
NOIP
(mln USD)
NOIP per
capita (USD)
2002 0,030 100% 100% 1,46 48,32 -46,86 -1225,43
2003 0,037 147% 120% 2,15 57,88 -55,73 -1458,25
2004 0,039 156% 150% 3,35 86,76 -83,41 -2183,91
2005 0,069 188% 105% 6,31 90,88 -84,57 -2215,34
2006 0,114 228% 138% 14,39 125,78 -111,39 -2919,22
2007 0,119 148% 142% 21,32 178,41 -157,09 -4120,37
2008 0,147 113% 92% 24,10 164,31 -140,21 -3678,59
2009 0,158 122% 113% 29,31 185,20 -155,90 -4087,91
2010 0,206 152% 116% 44,44 215,64 -171,20 -4485,38
2011 0,260 119% 94% 52,85 203,11 -150,26 -3899,86
2012 0,244 109% 116% 57,37 235,11 -177,75 -4612,15
-33,2 -40,1 -46,9 -55,7 -83,4 -84,6
-111,4
-157,1 -140,2 -155,9 -171,2 -150,3
-177,7
1,0 1,2 1,5 2,1 3,4 6,3 14,4 21,3 24,1 29,3 44,4 52,8 57,4
34 41 48 58 87 91
126
178 164 185
216 203 235
-200,0
-150,0
-100,0
-50,0
0,0
50,0
100,0
150,0
200,0
250,0
300,0
2000 2001 2002 2003 2004 2005 2006 2007 2008 2009 2010 2011 2012
NOIP (Net Outward Investment Position) Outward FDI Inward FDI
Dorota Ciesielska, The Macrotheme Review 3(1)A, Spring 2014
224
The faster relative increase of OFDI resulted in changes in the development of net outward direct
investment position (NOIP). Polish NOIP, which is presented in Figure 1, has been declining in the period
2001-2007. From 2007 NOIP per capita is more stable and does not deteriorate as drastically as it was
observed in the period from 2002 to 2007. Its growth in the years 2008 and 2011 was associated with the
value of Polish investments abroad which systematically increase. The year 2012 brought a true decrease
in net investment position in FDI, which was a result of the increase in FDI inflows into Poland, and a
lower increase of the value of Polish FDI abroad than in previous year.
The interesting results can be seen when analysing the relation of OFDI to IFDI, which in the period from
2002-2012 was growing, meaning that the value of OFDI was increasing in a more dynamic way. The
change in this trend can be seen only in 2012 and was probably caused by the worsening of economic
’ v
tendency can also be confirmed by the analysis of the dynamics of OFDI stock growth which was positive
in the whole analyzed period, and in the all years apart from 2012 higher in comparison to the dynamics of
IFDI inflow.
The relative stable position of NOIP per capita, the dynamics of OFDI and FDI stock growth and the other
economic factors, such as the growing role of non- O R ł 1
the implemented economic policy which openly enhances IFDI but does not stimulate in any noticeable
way the outward FDI (Gorynia et al. 2009) seems to confirm that the Polish economy is at the beginning
of the third stage if IDP. This seems to also be confirmed by Juan and Úbeda (2005) research, which
underlines that the main variable that differentiates countries in the first three stages of IDP is the inflow
of FDI.
4.3. Geographical and sectorial patterns of Polish OFDI
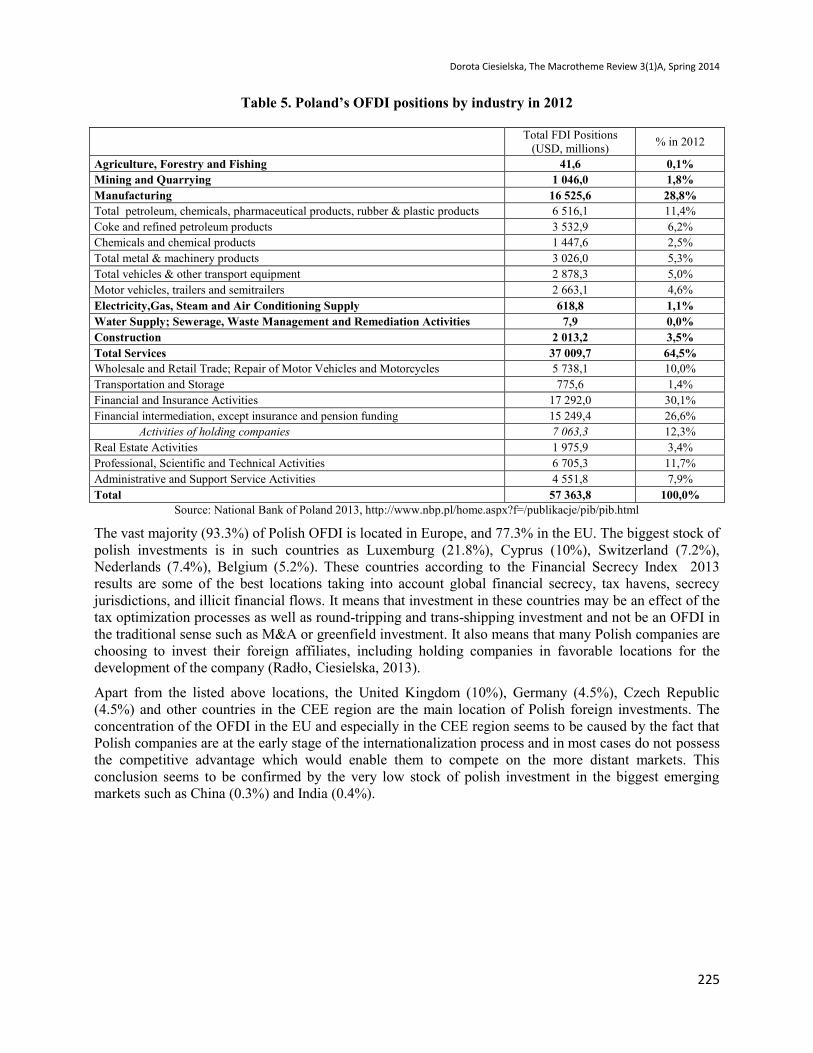
Taking into consideration the sectorial composition of polish OFDI in 2012 the services had a larger stock,
standing for 63% of the total ODFI. The biggest share of this was taken by Financial and Insurance
Activities (30%), followed by financial intermediation, except insurance and pension funding (26%).
Activities of holding companies stood for 12.3% of the total OFDI. An important part of OFDI was also
Professional, Scientific and Technical Activities (11%) as well as the Wholesale and Retail Trade (10%).
In 2012 the share of manufacturing in OFDI stood for 28%. The most important subsections were total
petroleum, chemicals, pharmaceutical products, rubber & plastic products (11%) and Coke and refined
petroleum products (6.2%) as it is presented in Table 5.
On the one hand such a domination of services over manufacturing is typical for mature economies but in
the case of Poland such a structure of OFDI may also be caused by two factors. First of all, many
companies are engaged in the process of tax optimization as well as round-tripping and trans-shipping
investment, which are also confirmed by the geographical structure presented in Table 6. The other factor
is that because of the low maturity of Polish OFDI the main determinants of investments is market
seeking, causing many of the investments to be classified as Wholesale and Retail Trade. However it
should be mentioned that a very positive tendency is a huge share of Professional, Scientific and Technical
Activities which is a group of knowledge-based services, which may confirmed that some Polish MNs are
in the process of building their competitive advantage based on their intellectual assets.
Dorota Ciesielska, The Macrotheme Review 3(1)A, Spring 2014
225
Table 5. Poland’s OFDI positions by industry in 2012
Total FDI Positions
(USD, millions) % in 2012
Agriculture, Forestry and Fishing 41,6 0,1%
Mining and Quarrying 1 046,0 1,8%
Manufacturing 16 525,6 28,8%
Total petroleum, chemicals, pharmaceutical products, rubber & plastic products 6 516,1 11,4%
Coke and refined petroleum products 3 532,9 6,2%
Chemicals and chemical products 1 447,6 2,5%
Total metal & machinery products 3 026,0 5,3%
Total vehicles & other transport equipment 2 878,3 5,0%
Motor vehicles, trailers and semitrailers 2 663,1 4,6%
Electricity,Gas, Steam and Air Conditioning Supply 618,8 1,1%
Water Supply; Sewerage, Waste Management and Remediation Activities 7,9 0,0%
Construction 2 013,2 3,5%
Total Services 37 009,7 64,5%
Wholesale and Retail Trade; Repair of Motor Vehicles and Motorcycles 5 738,1 10,0%
Transportation and Storage 775,6 1,4%
Financial and Insurance Activities 17 292,0 30,1%
Financial intermediation, except insurance and pension funding 15 249,4 26,6%
Activities of holding companies 7 063,3 12,3%
Real Estate Activities 1 975,9 3,4%
Professional, Scientific and Technical Activities 6 705,3 11,7%
Administrative and Support Service Activities 4 551,8 7,9%
Total 57 363,8 100,0%
Source: National Bank of Poland 2013, http://www.nbp.pl/home.aspx?f=/publikacje/pib/pib.html
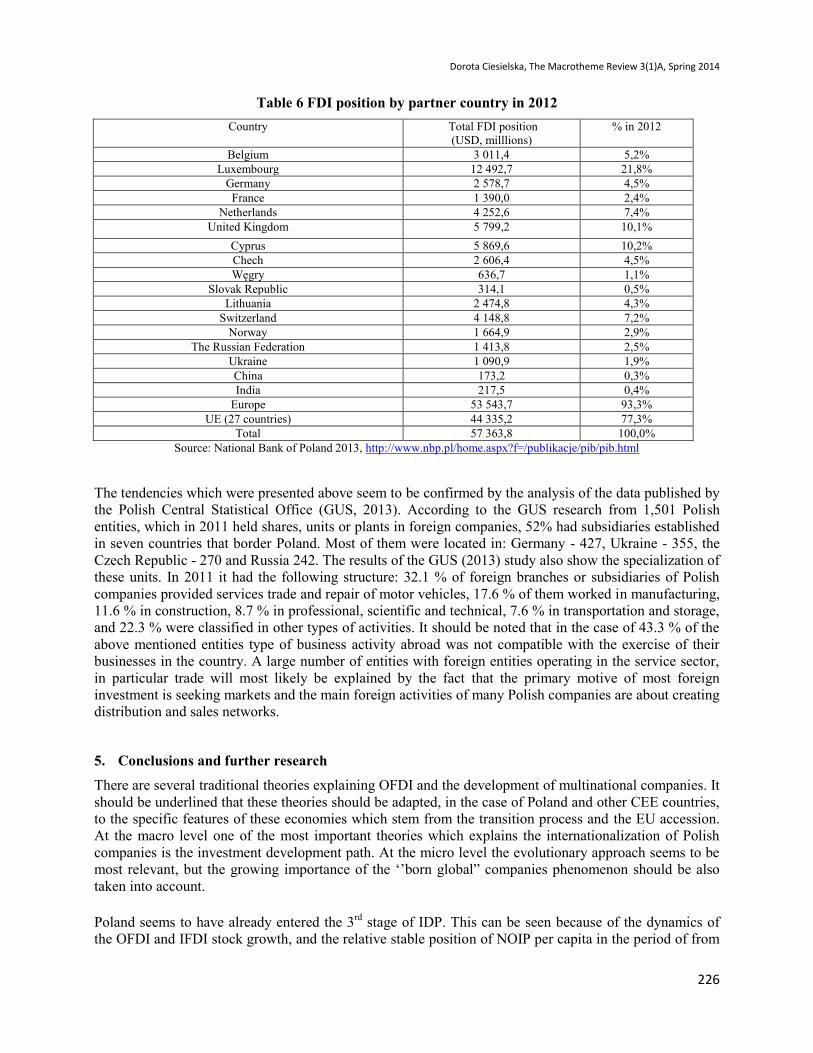
The vast majority (93.3%) of Polish OFDI is located in Europe, and 77.3% in the EU. The biggest stock of
polish investments is in such countries as Luxemburg (21.8%), Cyprus (10%), Switzerland (7.2%),
Nederlands (7.4%), Belgium (5.2%). These countries according to the Financial Secrecy Index 2013
results are some of the best locations taking into account global financial secrecy, tax havens, secrecy
jurisdictions, and illicit financial flows. It means that investment in these countries may be an effect of the
tax optimization processes as well as round-tripping and trans-shipping investment and not be an OFDI in
the traditional sense such as M&A or greenfield investment. It also means that many Polish companies are
choosing to invest their foreign affiliates, including holding companies in favorable locations for the
development of R ł C k 13
Apart from the listed above locations, the United Kingdom (10%), Germany (4.5%), Czech Republic
(4.5%) and other countries in the CEE region are the main location of Polish foreign investments. The
concentration of the OFDI in the EU and especially in the CEE region seems to be caused by the fact that
Polish companies are at the early stage of the internationalization process and in most cases do not possess
the competitive advantage which would enable them to compete on the more distant markets. This
conclusion seems to be confirmed by the very low stock of polish investment in the biggest emerging
markets such as China (0.3%) and India (0.4%).
Dorota Ciesielska, The Macrotheme Review 3(1)A, Spring 2014
226
Table 6 FDI position by partner country in 2012
Country Total FDI position
(USD, milllions)
% in 2012
Belgium 3 011,4 5,2%
Luxembourg 12 492,7 21,8%
Germany 2 578,7 4,5%
France 1 390,0 2,4%
Netherlands 4 252,6 7,4%
United Kingdom 5 799,2 10,1%
Cyprus 5 869,6 10,2%
Chech 2 606,4 4,5%
Wę 636,7 1,1%
Slovak Republic 314,1 0,5%
Lithuania 2 474,8 4,3%
Switzerland 4 148,8 7,2%
Norway 1 664,9 2,9%
The Russian Federation 1 413,8 2,5%
Ukraine 1 090,9 1,9%
China 173,2 0,3%
India 217,5 0,4%
Europe 53 543,7 93,3%
UE (27 countries) 44 335,2 77,3%
Total 57 363,8 100,0%
Source: National Bank of Poland 2013, http://www.nbp.pl/home.aspx?f=/publikacje/pib/pib.html
The tendencies which were presented above seem to be confirmed by the analysis of the data published by
the Polish Central Statistical Office (GUS, 2013). According to the GUS research from 1,501 Polish
entities, which in 2011 held shares, units or plants in foreign companies, 52% had subsidiaries established
in seven countries that border Poland. Most of them were located in: Germany - 427, Ukraine - 355, the
Czech Republic - 270 and Russia 242. The results of the GUS (2013) study also show the specialization of
these units. In 2011 it had the following structure: 32.1 % of foreign branches or subsidiaries of Polish
companies provided services trade and repair of motor vehicles, 17.6 % of them worked in manufacturing,
11.6 % in construction, 8.7 % in professional, scientific and technical, 7.6 % in transportation and storage,
and 22.3 % were classified in other types of activities. It should be noted that in the case of 43.3 % of the
above mentioned entities type of business activity abroad was not compatible with the exercise of their
businesses in the country. A large number of entities with foreign entities operating in the service sector,
in particular trade will most likely be explained by the fact that the primary motive of most foreign
investment is seeking markets and the main foreign activities of many Polish companies are about creating
distribution and sales networks.
5. Conclusions and further research
There are several traditional theories explaining OFDI and the development of multinational companies. It
should be underlined that these theories should be adapted, in the case of Poland and other CEE countries,
to the specific features of these economies which stem from the transition process and the EU accession.
At the macro level one of the most important theories which explains the internationalization of Polish
companies is the investment development path. At the micro level the evolutionary approach seems to be
most relevant, but the growing ‘’b b ” b
taken into account.
Poland seems to have already entered the 3rd
stage of IDP. This can be seen because of the dynamics of
the OFDI and IFDI stock growth, and the relative stable position of NOIP per capita in the period of from
Dorota Ciesielska, The Macrotheme Review 3(1)A, Spring 2014
227
2007 till 2012. It should be noted that the relation of OFDI to IFDI was growing, meaning that the value
of outward FDI was increasing in a more dynamic way that the inward FDI, which is also relevant to this
stage of development. Other important economic factors that affect the stage of Polish IDP are the
growing role of non-cost factors as determinants of OFDI and the increasing share of knowledge-intensive
services in the OFDI structure.
Apart from the above-mentioned trends it should be stated that the process of the capital
internationalization of Polish companies is still in the initial phase. This can be seen because of the
geographical concentration of the investment in the EU region. This is caused by two main factors. First of
all, the large share of OFDI located in the countries which offer favorable tax and financial regulation.
Secondly, Polish companies seem to be not competitive enough to be able to successfully expand into
more distant locations. It may mean that they still need to acquire more knowledge about foreign
operations.
The amount of research in the field of Polish OFDI is growing but this issue still needs more attention.
There is a very limited scope of research based on micro data and case studies. Future research questions
z ’
and value. It would be also important to analyze the structure of ownership of Polish investors as well as
other factors that affect implementation of the internationalization strategy based on capital flows. Such
research may lead to the identification of the patterns of the most successful internationalization strategy.
Also, the phenomenon of born global companies based on the particular case studies of Polish companies
should be paid more attention to.
References
Barry, F., Goerg, H., McDowell, A. (2003), Outward FDI and the investment development path of a late-
industrializing economy: evidence from Ireland, Regional Studies, Vol. 37, No. 4, pp. 341-349.
Boudier-Bensebaa, F.2(2008), FDI-assisted development in the light of the investment development path paradigm:
Evidence from Central and Eastern European countries, Transnational Corporations, Vol. 17, No. 1, pp.38-68.
Buczkowski B.(2013), Polands outward foreign direct investment, The Journal of the Faculty of Economics -
Economic, Vol. 1/2013, pp. 72-81.
Dunning, J.H. (1986), The Investment Development Cycle Revisited, Weltwirtschaftliches Archiv, 122, pp. 667-677.
Dunning, J.H. (1993), Global Business: The Challenge of 1990 (London and New York: Routledge).
Dunning, J.H. (1981), Explaining the International Direct Investment Position of Countries: Towards a Dynamic or
Developmental Approach, Weltwirtschaftliches Archiv 117, no. 1:pp. 30–64.
Dunning, J.H. (2001) The eclectic (OLI) paradigm of international production: past, present and future, International
Journal of Economics and Business, 8(2),pp. 173-190.
Dunning, J.H. and Narula, R. (2002), The Investment Development Path Revisited, in J.H. Dunning, Theories and
Paradigms of International Business Activity. The Selected Essays of John H. Dunning, Volume 1, Cheltenham, UK
and Northhampton, MA: Edward Elgar, pp. 138-172.
Dunning, J.H., Narula R. (1996), The Investment Development Path Revisited: Some Emerging Issues, In Foreign
Direct investment and Governments, ed. J.H. Dunning and R. Narula, pp.1–41. London: Routledge.
Dunning, J.H., Lundam, M.L., (2008), Multinational Enterprises and the Global Economy, Second Edition, Edward
Elgar: Cheltenham, Northampton.
Durán, J.J., Ubeda, F. (2001). The investment development path: a new empirical approach and some theoretical
issues, Transnational Corporations, 10(2), pp. 1, 34.
Dorota Ciesielska, The Macrotheme Review 3(1)A, Spring 2014
228
Durán, J.J., Ubeda, F. (2005). The investment development path of newly developed countries. International Journal
of the Economics of Business, 12(1), 123-137.
Gorynia M., Nowak J., Wolniak R. 9 ’ v v : synthesis, Int. J.
Economic Policy in Emerging Economies, Vol. 2, No. 2, pp. 153-174.
Gorynia M., Nowak J., Wolniak R. (2010), Foreign direct investment of Central and Eastern European countries, and
the investment development path revisited, Eastern Journal Of European Studies Volume 1, Issue 2, pp.21-36.
Gorynia M., Nowak J., Wolniak R. (2012), Emerging Profiles of Polish Outward Foreign Direct Investment, Journal
of East-West Business, 18: pp. 132–156.
Gotz M. (2011), Polish Foreign Direct Investment, Przegląd Zachodni, No 3, pp.309-330.
Hoesel, R.V., (1999), New Multinational Enterprises from Korea and Taiwan, Routledge, London.
Johanson, J., Vahlne J.E., (1977), The Internationalization Process of the Firm-A Model of Knowledge Development
and Increasing Foreign Market Commitments, Journal of International Business Studies, 8 (1), pp. 23-32.
Johanson, J., Vahlne J.E., (2009), The Uppsala internationalization process model revisited: From liability of
Foreignness to Liability of Outsidership, Journal of International Business Studies, 40 (9), 1411-1431.
Juan J. , Úbeda D.F. (2005) The investment development path of newly developed countries, International Journal
of the Economics of Business, 12:1, pp. 123-137.
Kalotay, K. (2004), New FDI patterns for the old continent? Research in International Business and Finance 18, pp.
27–49.
Karaszewski W. et al. (2009) Foreign Direct Investment of Polish Companies: its scale, structure, determinants,
influence on the competitiveness, Wydawnictwo Naukowe Uniwersytetu k ł j K k ń
Klimek A. (2009), The Determinants of Outward Foreign Direct Investment: the Case of Poland, Available at
http://www.etsg.org/ETSG2009/papers/klimek.pdf
K k O R ł -J., (2012), Determinants of FDI and Entry Modes of Polish Multinational Enterprises:
Beyond Current Evolutionary Models of Internationalization, Available at SSRN: http://ssrn.com/abstract=2145866
or http://dx.doi.org/10.2139/ssrn.2145866
Lee J., Slater J. (2007), Dynamic capabilities, entrepreneurial rent-seeking and the investment development path: The
case of Samsung, Journal of International Management 13, pp. 241–257.
Liu, X, Buck, T., Shu, C (2005), Chinese economic development, the next stage: outward FDI?, International
Business Review, 14, pp. 97-115.
L E L 1 R k O ’ OL /E Multinational Business
Review, Vol. 18 Iss: 2, pp.13 – 34.
Narula R., Guimon J. (2010), The investment development path in a globalised world: implications for Eastern
Europe, Eastern Journal Of European, Studies Volume 1, Issue 2, December 2010, pp.5-19.
Narula, R. (1996), Multinational Investment and Economic Structure, Routledge, London.
Narula, R., Dunning, J.H. (2000), Industrial development, globalization and multinational enterprises: new realities
for developing countries, Oxford Development Studies, Vol. 28, No. 2, pp. 141-167.
R ł -J. Sass, M., (2012), Outward foreign direct investments and emerging multinationals from Central and
Eastern Europe: case of visegrad countries, East European Economics 50(2), 5-21.
R ł -J., 2012. Emerging multinationals and outward FDI development: case of Poland, Eastern European
Economics 50(2), 59-84.
R ł -J., Ciesielska, D. Polska w pułapce średniego dochodu, Difin, Warszawa 2013.
W ń k W W W K b z C E E C
Firms? Comparative Economic Research. Volume 16, Issue 2, Pages 25–43, ISSN (Print) 1508-2008, DOI:
10.2478/cer-2013-0010, August 2013.

Dorota Ciesielska, The Macrotheme Review 3(1)A, Spring 2014
229
Zimny Z. (2013), Outward FDI from Poland and its policy context, 2012, Country profiles of inward and outward
foreign direct investment issued by the Vale Columbia Center on Sustainable International Investment, Available at
Copyright © 2022 FDOKUMEN