POLISH ANNALS OF MEDICINE
128
Vol. 25 • No 2 • JUNE 2018 ISSN 1230 – 8013 Available online at www.paom.pl POLISH ANNALS OF MEDICINE Polish Medical Association Warmia and Mazury Medical Chamber in Olsztyn University of Warmia and Mazury in Olsztyn
-
Upload
khangminh22 -
Category
Documents
-
view
1 -
download
0
Transcript of POLISH ANNALS OF MEDICINE

Vol. 25 • No 2 • JUNE 2018 ISSN 1230 – 8013
Available online at www.paom.pl
POLISH ANNALS O F M E D I C I N E
Polish Medical Association
Warmia and Mazury Medical Chamberin Olsztyn
University of Warmia and Mazuryin Olsztyn

4%4%
7%
59%
8%
18%
Australia China Poland Rest of World United Kingdom United States
ScienceDirect Usage: Top 5 Countries Last Year
POLISH ANNALS OF MEDICINE DOWNLOADS
SOURCE: SCOPUS, ELSEVIER
LATEST MONTH INCLUDED DEC 2017
ScienceDirect Usage: Top 5 Countries Last Year
4%4%
7%
59%
8%
18%
Australia China Poland Rest of World United Kingdom United States
Top 5 Countries 2012–2017
Top 5 Countries 2017

POLISH ANNALS O F M E D I C I N E
Editor-in-ChiefProf. Ireneusz M. Kowalski, MD, PhD
Vol. 25 • No 2 • JUNE 2018

Published by Warmia and Mazury Medical Chamber in Olsztyn on behalf of University of Warmia and Mazury in Olsztyn
To publish your article in Polish Annals of Medicine send your papers via https://www.editorialsystem.com/paom/
Editorial OfficeWarmińsko-Mazurska Izba Lekarska
10-561 Olsztynul. Żołnierska 16 C
www.paom.plE-mail: [email protected]
This journal and the individual contributions contained in it are licensed under a Creative Commons Attribution – NonCommercial – NoDerivatives 4.0 International License.
You are free to share – copy and redistribute the material in any medium or format. The licensor cannot revoke these freedoms as long as you follow the license terms.
Under the following terms:•
Attribution — You must give appropriate credit, provide a link to the license, and indicate
if changes were made. You may do so in any reasonable manner, but not in any way that suggests the licensor endorses you or your use.
• NonCommercial
– You may not use the material for commercial purposes.•
NoDerivatives – If you remix, transform, or build upon the material,
you may not distribute the modified material.•
No additional restrictions – You may not apply legal terms or technological measures
that legally restrict others from doing anything the license permits.
The paper used in this publication meets the requirements of ANSI/NISO Z39.48-1992 (Permanence of Paper).

Vol. 25 • No 2 • JUNE 2018
POLISH ANNALS O F M E D I C I N E
Polish Medical Association
Warmia and Mazury Medical Chamberin Olsztyn
University of Warmia and Mazuryin Olsztyn

Editor-in-ChiefProf. Ireneusz M. KowalsKI, MD, PhD
Department of Rehabilitation, School of Medicine, Collegium Medicum, University of Warmia and Mazury in Olsztyn, Poland
Deputy Editor-in-ChiefProf. Katarzyna GlińsKa-lewczuK, PhD
University of Warmia and Mazury in Olsztyn, Poland
Editory Boardanna westfelD – Journal Manager, Statistical Editor
Joanna lewczuK – Publishing EditorMałGorzata lePczyńsKa – Language Editor
Michael thoene – Native Speaker
Executive Editors
Editorial Board
Wanda BadowskaDepartment of Clinical Pediatrics, School of Medicine, Collegium Medicum, University of Warmia and Mazury in Olsztyn, PolandRegional Children’s Specialized Hospital in Olsztyn, PolandChristina CiecierskiDepartment of Economics, Northeastern Illinois University, Chicago, USAEwa DzikaDepartment of Medical Biology, Faculty of Medical Sciences,University of Warmia and Mazury in Olsztyn, PolandTomasz GiżewskiDepartment of Materials Science and Metallurgy, MacromolecularMaterials Laboratory, University of Cambridge, United KingdomWaldemar GrzegorzewskiDepartment of Pharmacology and Toxicology, School of Medicine, Collegium Medicum, University of Warmia and Mazury in Olsztyn, PolandEwa lżycka-ŚwieszewskaDepartment of Pathology and Neuropathology, Medical University ofGdańsk, PolandWojciech KiebzakFaculty of Medical Sciences, The Jan Kochanowski University ofHumanities and Sciences in Kielce, PolandJan MicińskiDepartment of Cattle Breeding and Milk Evaluation, Faculty of AnimalBioengineering, University of Warmia and Mazury in Olsztyn, PolandSergiusz NawrockiDepartment of Oncology, School of Medicine, Collegium Medicum, University of Warmia and Mazury in Olsztyn, PolandAgnieszka Owczarczyk-SaczonekDepartment of Dermatology, Sexually Transmitted Diseases andClinical Immunology, School of Medicine, Collegium Medicum, Uni-versity of Warmia and Mazury in Olsztyn, PolandMunicipal Hospital in Olsztyn, PolandBogusław PierożyńskiDepartment of Chemistry, University of Warmia and Mazuryin Olsztyn, Poland
Waldemar PlacekChair and Department of Dermatology, Sexually Transmitted Diseasesand Clinical Immunology, School of Medicine, Collegium Medicum, University of Warmia and Mazury in Olsztyn, PolandJuozas RaistenskisFaculty of Medicine, Vilnius University, LithuaniaJadwiga SnarskaDepartment of General Surgery, School of Medicine, Collegium Medi-cum, University of Warmia and Mazury in Olsztyn, PolandJoanna SowaWarmia and Mazury Medical Chamber in Olsztyn, PolandTomasz StompórDepartment of Internal Medicine, Clinic of Nephrology,Hypertension and Internal Medicine, School of Medicine, Collegium Medicum, University of Warmia and Mazury in Olsztyn, PolandBirutė StrukčinskienėFaculty of Health Sciences, Klaipeda University, LithuaniaEdyta SzurowskaSecond Department of Radiology, Medical University of Gdańsk,PolandMichael ThoeneDepartment of Medical Biology, Faculty of Medical Sciences,University of Warmia and Mazury in Olsztyn, PolandJoanna WojtkiewiczDepartment of Neurology and Neurosurgery and Stem Cell ResearchLaboratory, Faculty of Medical Sciences, University of Warmia andMazury in Olsztyn, PolandKatarzyna Zaborowska-SapetaDepartment of Rehabilitation, Faculty of Medical Sciences,University of Warmia and Mazury in OlsztynAnna ŻuradaDepartment of Anatomy, School of Medicine, Collegium Medicum, University of Warmia and Mazury in Olsztyn, Poland
Elżbieta Bandurska-StankiewiczClinic of Endocrinology, Diabetes and Internal Diseases, Department of Internal Diseases, School of Medicine, Collegium Medicum, University of Warmia and Mazury in Olsztyn, PolandJan D BosDepartment of Dermatology, University of Amsterdam, NetherlandsThomas BrodowiczGraduate Business Economist Medical University Vienna,General Hospital Internal Medicine, Vienna, Austria
Riki BrownBeit Rivka Geriatric Rehabilitation Center Day Hospital, Petach Tikva,IsraelRobert BuckiDepartment of Physiology, University of Pennsylvania, Philadelphia, USAArie BurstinBeit Rivka Geriatric Rehabilitation Center Day Hospital, Petach Tikva, Israel

Wen Chieh ChenDepartment of Dermatology and Allergy, München University, GermanyAaron A. Cohen-GadolDepartment of Neurological Surgery, Indiana University, Indianapolis, USAKrzysztof CzajaDepartment of Veterinary and Comparative Anatomy, Pharmacologyand Physiology, Washington, USAMargaret CzartUniversity of Illinois at Chicago Department of Medical Education –Distant Medical Education Office, Chicago, USAWaldemar DebinskiBrain Tumor Center of Excellence, Department of Neurosurgery,Wake Forest University School of Medicine, Winston-Salem,North Carolina, USAAntoni DutkiewiczDepartment of Surgery, School of Medicine, Collegium Medicum, University of Warmia and Mazury in Olsztyn, PolandIstván GeraDepartment of Periodontology, Semmelweis University, Budapest,HungaryJerzy GieleckiDepartment of Anatomy, School of Medicine, Collegium Medicum, University of Warmia and Mazury in Olsztyn, PolandMonika L. GloviczkiGonda Vascular Center, Mayo Clinic, Rochester, USARobert GniadeckiDepartment of Dermatology D, University of Copenhagen,Bispebjerg Hospital, Copenhagen, DenmarkMichał HadałaFisioterapia y Medicina Aplicada al Deporte, Profesor Internacionalde Kinetic Control y Performance Stability Licenciado en Fisioterapia,Valencia, SpainJana HercogováDepartment of Dermatovenereology, Charles University andBulovka Hospital, Praha, Czech RepublicRudolf Walter HoffmannClinic for Fish and Reptiles, University of Munich, Munich, GermanyElżbieta Jarocka-CyrtaDepartment of Clinical Pediatrics, Regional Children’s Specialized Hospital in Olsztyn, University of Warmia and Mazury in Olsztyn, PolandMarcin JózwikFrauenklinik und Brustzentru Gynakologische OnkologieBeckenbodenrekonstruktion Ostalb – Klinikum, Aalen, GermanyJudyta JuranekDepartment of Medicine, New York University Langone Medical Center, New York, USAMarek K. JurkowskiDepartment of Medical Physics, Maria Skłodowska-Curie MemorialCancer Center and Institute of Oncology, Gliwice, PolandJanis KisisDepartment of Infectology and Dermatology Riga Stradins University,LatviaJoanna KitlinskaGeorgetown University, Department of Biochemistry and Molecularand Cellular Biology, Washington, USAZbigniew KmiećDepartment of Histology, Medical University of Gdańsk, Gdańsk, PolandWojciech KlocDepartment of Neurology and Neurosurgery, School of Medicine, Collegium Medicum, University of Warmia and Mazury in Olsztyn, Poland
Jaroslaw KrejzaDepartment of Radiology, Division of Neuroradiology, University ofPennsylvania, Philadelphia, USAAleksandras KriščiūnasDepartment of Rehabilitation, Lithuanian University of Health Sciences, Kaunas, LithuaniaJanus KulikowskiFaculty of Life Sciences University of Manchester, Manchester, UKVaiva LesauskaitėLaboratory of Molecular Cardiology, Lithuanian University of HealthSciences, Kaunas, LithuaniaMarios LoukasDepartment of Anatomical Sciences, St. George’s University School ofMedicine, Grenada, West IndiesMariusz MajewskiDepartment of Human Physiology, School of Medicine, Collegium Medicum, University of Warmia and Mazury in Olsztyn, PolandVladimer MargvelashviliDepartment of Stomatology and Maxillo-Facial Surgery,Faculty of Medicine, Tbilisi State University, GeorgiaMiroslav MaršálekDepartment of Animal Husbandry, University of South Bohemia,České Budějovice, Czech RepublicPaulius MatusevičiusDepartment of Animal Science, Lithuanian Veterinary Academy,Kaunas, LithuaniaZilvinas PadaigaDean of the International Relations and Study Center, LithuanianUniversity of Health Sciences, Kaunas, LithuaniaDariusz PawlakDepartment of Pharmacodynamics, Medical University in Białystok,Białystok, PolandAnna PawłowskaDepartment of Pediatrics, City of Hope, Duarte, California, USAMaciej PechStellvertretender Klinikdirektor Klinik för Radiologie undNuklearmedizin Universitatsklinikum Magdeburg AoR,Magdeburg, GermanyDmitry Yu. PinchukCity Centre of Rehabilitation Treatment for Children withPsychoneurological Disabilities, St. Petersburg, RussiaMarcia Ramos-e-SilvaSector of Dermatology University Hospital and School of MedicineFederal University of Rio de Janeiro, BrazilMark J. RatainCenter for Personalized Therapeutics, Associate Director for ClinicalSciences, Comprehensive Cancer Center, The University of Chicago,Chicago, USAJohannes RingDepartment of Dermatology and Allergology Biederstein,University of Munich, Munich, GermanyRalf SchmidsederUniversity Medical Center of the Johannes Gutenberg University Mainz, GermanyNeil ShahGreat Ormond Street Hospital and Catholic University of Leuven,Leuven, BelgiumNikolai SharkovDepartment of Pediatric Dental Medicine, Medical University,Sofia, BulgariaAndrzej SlominskiDepartment of Pathology and Laboratory Medicine,University of Tennessee Health Science Center, Memphis, USA

Vasiliy B. SmychekScientifi c Research Institute for Medical and Social Assessment andRehabilitation, National Medical University, Minsk, BelarusJerzy StanekDepartment of Pathology and Laboratory Medicine, University ofCincinnati, Cincinnati, USAMarian SulikDepartment of Pathomorphology, School of Medicine, Collegium Medicum, University of Warmia and Mazury in Olsztyn, PolandMiguel Angel Torres TorresCentro de Rehabilitacion, Guadalajara, MexicoRichard Shane TubbsPediatric Neurosurgery, Children’s Hospital, Birmingham, USADariusz UryszkaOrthopaedic Department of District Hospital, Lincolnshire,United KingdomPiotr WalczakThe Russell H. Morgan Department of Radiology and RadiologicalScience, Johns Hopkins University School of Medicine, Baltimore, USAYanusz WegrowskiLaboratoire de Biochimie Médicale et Biologie Moléculaire,Interaction Celluels-Microenvironnment, Faculté de Médecine,Université de Reims-Champagne-Ardenne, Reims, France
Theresa WhitesideDepartament of Pathology, Hillman Cancer Intitue, University ofPittsburgh, Pittsburgh, USAlwona WlodarskaDepartment of Human Genetics, Laboratory for Genetics of MalignantDisorders, KU Leuven, BelgiumAgnieszka Wozniak,Department of Oncology, Laboratory of Experimental Oncology,KU Leuven, BelgiumNermin YamalikDepartment of Periodontology, Faculty of Dentistry, University ofHacettepe, Ankara, TurkeyJiří ZemenPrivate practice specialized for oral surgery and temporomandibulardisorders, Plzeň, Czech RepublikAlireza ZolfaghariSenior Research Scientist, University of Alberta, Edmonton,Alberta, Canada
Advisory BoardMarek BladowskiDepartment of Human Physiology, School of Medicine, Collegium Medicum, University of Warmia and Mazury in Olsztyn, PolandJerzy GórnyDepartment of Internal Medicine, Gastroenterology, Cardiologyand Infectiology, School of Medicine, Collegium Medicum, University of Warmia and Mazury in Olsztyn, PolandPiotr B. JurkowskiDepartment of Pediatrics, School of Medicine, Collegium Medicum,University of Warmia and Mazury in Olsztyn, PolandRyszard PaczuskiDepartment of Immunology, Genetics and Microbiology,School of Medicine, Collegium Medicum, University of Warmia and Mazury in Olsztyn, PolandKrystyna SkibniewskaChair of Foundations of Safety, Faculty of Technical Sciences,University of Warmia and Mazury in Olsztyn, PolandMarek K. StefanowiczDepartment of Gynaecology, Specialist Provincial Hospital in Olsztyn,Poland
Ewa Szwałkiewicz-WarowickaDepartment of Clinical Pediatrics, School of Medicine, Collegium Medicum, University of Warmia and Mazury in Olsztyn, PolandRyszard TargońskiDepartment of Nursing, Faculty of Health Sciences, Collegium Medi-cum, University of Warmia and Mazury in Olsztyn, PolandZbigniew TarkowskiDepartment of Pathology and Rehabilitation of Speech, Faculty ofNursing and Health Sciences, Medical University of Lublin, PolandAndrzej TutajDepartment of Neurology and Neurosurgery, School of Medicine, Collegium Medicum, University of Warmia and Mazury in Olsztyn, PolandKrzysztof TytmanDepartment of Internal Medicine, Gastroenterology, Cardiologyand Infectiology, School of Medicine, Collegium Medicum, University of Warmia and Mazury in Olsztyn, Poland

CONTENTS
Original articlesMapping of stem cell research in India during 2009–2014: A bibliometric analysisManoj Mishra, Mahesh Chandra Sahu, Dola Babu Ramesh 173
Genetic polymorphism of CYP2C9 and VKORC1 in the Nigerian population: Significance for warfarin therapy in the populationAyorinde Adehin, Oluseye Oladotun Bolaji, Simran Maggo, Martin A. Kennedy 180
Effect of γ-oryzanol on hyperlipidemia and thrombus formation in mice treated with poloxamer-407Shital S. Panchal, Apurva Bhatt, Neha Mishra, Abhishek B. Jha, Shital B. Butani 184
Association between the effects of body mass index on lung volumes among students in Jiangsu ProvinceTaha Hussein Musa, Wei Li, Wenjuan Yan, Yan Guo, Xiaoshan Li, Hassan Hussein Musa, Lovel Fornah, Pu Yuepu, Pingmin Wei1 190
The expression of Bax protein in the early stages of spinal cord injury in the sperm cells of ratsAyoob Rostamzadeh, Tayyeb Ghadimi, Azra Allahveisi, Mohsen Mohammadi, Shohreh Rezaei, Mohammad Jafar Rezaie 196
Effect of smoking on cyanide, IL-2 and IFN-γ levels in saliva of smokers and nonsmokersSamaneh Rahimi, Afra Khosravi, Sanaz Aazami 203
Croatia and Slovenia have a maximum peak in multiple sclerosis prevalence at 7.54°CErnest Lad Heisten IV 207
Multiple sclerosis prevalence in Italy associated with temperature variation towards 8.60°CErnest Lad Heisten IV 212
Asymptomatic gall stone disease: A clinicopathological correlationPratima Baisakh, Gyanranjan Nayak, Sitanshu Kumar Panda, Mahesh Chandra Sahu 218
Human embryonic stem cell-conditioned medium induces cell cycle arrest in HL60 cells by unknown soluble factor(s) in vitroFatemeh Adeli, Ameneh Alikarami, Shohreh Fakhari, Seyed Hadi Anjamrooz, Ali Jalili, Ayoob Rostamzadeh, Mohsen Mohammadi, Daem Roshani, Mohammad Jafar Rezaie 224
Influence of odontogenic cysts on immune system – cytometric analysis of T lymphocytes subpopulationMansur Rahnama, Izabela Jastrzębska-Jamrogiewicz, Rafał Jamrogiewicz, Janusz Kocki 231
Case reportsA rare case of IGF2 mediated hypoglycemia in a diabetic patient – a praneoplastic manifestation of an adrenal tumorSameer K. Mehta, Reetu Singh, Satish K. Prasad, Narain Pandey 237
Celiac disease presenting as fever of unknown origin in the adult: The role of undiagnosed celiac disease in systemic atherosclerosisGabriele Cioni 241
The asymmetry of the laryngeal ventricle – the very rare cases and review of the literatureKrzysztof Piersiala, Piotr Przymuszała, Monika Sykutera, Anna Bartochowska, Joanna Jackowska, Małgorzata Wierzbicka 245
Successful endoscopic excision of nasal plasmacytoma: Lesson learntJeyasakthy Saniasiaya, Mohan Kameswaran, Murali Susruthan, Baharudin Abdullah 250

Suspension of the spinal dura mater to the corpectomy cage with tack-up sutures for bleeding control and prevention of epidural hematoma: Operative techniqueMürteza Çakır, Atilla Yilmaz, Hakan H. Kadıoğlu, Çağatay Çalıkoğlu 254
Problems with child care after successful pregnancy in a patient with spinal cord injury – a case studyBeata Tarnacka, Justyna Frasuńska, Krzysztof Wasiak, Paweł Baranowski 258
MRI in diagnostic of diffuse axonal injuryUrszula Kościuczuk, Andrzej Siemiątkowski, Adam Łukasiewicz 262
Review articlesReliability of diaphragmatic mobility assessment: A systematic reviewVikram Mohan, Aatit Paungmali, Patraporn Sitilerpisan, Sulaiman Md Dom, Ummi Farhana Hashim, Siti Nor Binti Daud, Manikumar Muthiah 266
Effects of exercise on blood glucose levels in type 2 diabetic patients – Literature reviewApolinary Ginszt, Michał Ginszt, Piotr Majcher, Zbigniew Tarkowski 272
Efficacy of stretching in physiotherapy and sportsTomasz Michalski, Piotr Michalik, Magdalena Dąbrowska-Galas, Tomasz Król, Magdalena Rutkowska, Michał Hadała 277
Letter to the EditorPoland may be a high risk area for multiple sclerosis based on weather patternsErnest Lad Heisten IV 283
Reviewer Acknowledgment 286

Guide for Authors:• All articles are subject to double blind peer review• Disclosure of any actual or potential conflict of interest (any financial, personal or other relationships with other people or orga-
nizations), ethics and funding should be provided in separate file attached to the article (Acknowledgement)• Upon acceptance of an article, authors will be asked to transfer copyright to the owner of the journal• Submission of an article implies that the work described has not been published previously that it is not under consideration
for publication elsewhere, that its publication is approved by all authors and tacitly or explicitly by the responsible authorities where the work was carried out, and that, if accepted, it will not be published elsewhere in the same form, in English or in any other language, including electronically without the written consent of the copyright-holder
• A statement that all authors have approved the final article should be true and included in the disclosure (authors are obliged to provide details about authors’ contribution)
Authors are requested to submit their manuscripts at http://ees.elsevier.com/poamed There are online tutorials for authorsand reviewers available at http://support.elsevier.com/app/epsupport
Submission checklist
Ensure that the following items are present:
One author has been designated as the corresponding author with contact details:• Authors’ names• E-mail address• Full postal address• Telephone and fax numbers
All necessary files have been uploaded, and contain:• Keywords (5-10)• High resolution figures in separate graphic files• All figure captions• All tables (including title, description, footnotes)• Manuscript in editable format (word or LaTeX), no pdf files are allowed
Further considerations• Manuscript has been ‚spell-checked’ and ‚grammar-checked’• References are in the correct format for this journal• All references mentioned in the Reference list are cited in the text, and vice versa• Permission has been obtained for use of copyrighted material from other sources (including the Web) For any further informa-
tion please visit our customer support site at http://support.elsevier.com.
Please consult Guide for Authors for further details of any item.
∞ The paper used in this publication meets the requirements of ANSI/NISO Z39.48-1992 (Permanence of Paper).


173 Pol ann MeD. 2018;25(2):173–179
Original article
Manoj Mishra1, Mahesh Chandra Sahu2, Dola Babu Ramesh3
1 Central Library, Institute of Medical Science and SUM Hospital, Siksha ‘O’ Anusandhan University, Bhubaneswar, Odisha, India2 Directorate of Medical Research, Institute of Medical Science and SUM Hospital, Siksha ‘O’ Anusandhan University, Bhubaneswar,
Odisha, India3 Central Library, Siksha ‘O’ Anusandhan University, Bhubaneswar, Odisha, India
Corresponding author: Mahesh Chandra Sahu, Directorate of Medical Research, Institute of Medical Science and SUM Hospital, Siksha ‘O’ Anusandhan University, K8, Kalinganagar, Bhubaneswar-751003, Odisha, India.
E-mail address: [email protected].
Mapping of stem cell research in India during 2009–2014: A bibliometric analysis
article info
Art ic l e h i s toryReceived 26 December 2016Accepted 10 June 2017Available online 13 April 2018
Keywords Stem cellsBibliometricPluripotentTotipotencyUndifferentiated cell
Doi10.29089/2017.17.00033
User l i cense This work is licensed under a Creative Commons Attribution –NonCommercial – NoDerivatives 4.0 International License.
abstract
Introduct ion: Stem cell is a miracle for treatment of all diseases including anomalies for its multi-potency nature of cell differentiation. There are several articles published on stem cell research and its applications. In this study, we ana-lyze the stem cell research articles from January 2009 to December 2014, indexed in Scopus database.
Aim: To find out the status and number of published stem cell articles with bibliometric analysis indexed in the Scopus database in Indian scenario.
Mater ia l and methods : In this retrospective study, the number of publica-tions on stem cell research, citation, distributions of journals of Scopus databa-se were analyzed. Bibliometric indicators including total articles, independent articles, collaborative articles, first author articles and corresponding author articles were analyzed to compare publications between different countries and organizations. All the data and information were retrieved from the Scopusdata base on 27 October 2015 for a period of 2009 to 2014.
Resu l t s and d i scuss ion: The number of articles on stem cell research in-creased year by year from 2009 to 2014. Similarly, from total articles, the number of original articles is more as compared to other articles. It is found that the artic-les from the medicine subjects are more than the other subjects. A total number of 221 publications are cited by numerous authors in the field of stem cell. It is found that the Indian authors published these documents with the collaboration of other authors staying abroad. According to our study, Cell Adhesion and Migra-tion journal published more articles in comparison to other journals. The impact of top articles changed from year to year.
Conc lus ions : The comprehensive analysis of highly cited articles in the stem cell field could identify milestones and important contributors, giving a historic perspec-tive on scientific progress.
Journal homepage: https://www.paom.pl
Polish Annals of Medicine

174 Pol ann MeD. 2018;25(2):173–179
1. INTRODUCTION
Research on stem cell is a biomedical field of great expecta-tions. It was 1949 when scientist John Hammond discov-ered the method to maintain mouse embryos in culture in vitro. Since, research with stem cells has developed to the point where it holds very hopeful perspectives for the treat-ment of thus far incurable diseases. At present, research is mainly oriented towards developing new therapies for he-matological, cardiovascular, neurodegenerative and genetic diseases, as well as cancer and diabetes, among others.1–4 Its intrinsic nature makes stem cell research transcend to other fields as diverse as politics, ethics, culture, and law, placing it in the arena of social controversy. The use of bibliomet-ric studies to comprehend and analyze scientific domains,5 together with the development and fine tuning of new tech-niques and tools, facilitates decision-making in areas of sci-entific policy and reflects the ‘state of the art’ of research at a given time. These processes, necessary for the evaluation of science6,7 are a responsibility that no country can elude8 the evident connections between advancement through re-search activity, economic growth, progress and the enhanced well-being of society.9 The number of scientific disciplines interrelated by stem cell research lends it an interesting yet complicated characters.10 Its interdisciplinarity presents a great challenge when delimiting and analyzing its thematic composition, demanding a very precise analysis. Precisely to face this challenge, bibliometrics has complementary tools that more recently include social network analysis11 and the visualization of scientific domains.12–14
When searching for reliable information, studies of this nature have traditionally used bibliographic databases as the most usual source.15 As it is not designed for this pur-pose, the information they offer has demonstrated its bib-liometric potential. However, they present limitations when resolving specific matters, for example the precise definition and delimitation of a topic. It is therefore essential to re-veal the semantic structure established among documents by means of the bibliographic information contained in a database.
2. AIM
To find out the status and number of published stem cell ar-ticles with bibliometric analysis indexed in Scopus database in Indian scenario.
3. MATERIAL AND METHODS
Data used in this retrospective study were retrieved from the Scopus database on 27 October 2015 for a period of 2009 to 2014. The database was searched under the keywords ‘stem cell,’ ‘pluripotency’ and ‘totipotency’ in terms of topic (title, abstract, author keywords, and Key Words Plus) with-in the publication year with a limit of 2009 to 2014. Key
Words Plus supplied additional search terms extracted from the titles of articles cited by authors in their bibliographies, database and substantially augmented title word and author keyword indexing.16 Non-article-type documents such as reviews, meeting abstracts, editorial materials, proceeding papers, letters, book chapters, news items, corrections and notes were also included. The final filter was the front page, in which only the articles having the search keywords in their first page including article title, abstract, and author keywords were retained.17 The number of citations of an ar-ticle in a single year, for example 2012, was referred to as the C2012 and the total number of citations since publication up to 2012 was referred to as the TC2012.18–19 The collabo-ration type was determined by the address of the authors. Collaboration could be classified as either a single-country article, in which all authors’ address were from the same country, or an international collaborative article, which was co-authored by researchers from multiple countries.20 The records were downloaded and reorganized using Mi-crosoft Excel 2010. In the Scopus database, the correspond-ing author was designated as the ‘reprint’ author; this study instead used the term ‘corresponding author.’ In a single author article where authorship was unspecified, the single author was both first author and corresponding author. Sim-ilarly, for a single institution article, the institution was clas-sified as the first author’s institution and the corresponding author’s institution.
4. RESULTS
After retrieving the data i.e. numbers of articles published in the field of stem cell were documented from the year 2009 to 2014. It is revealed from the analysis that in each year the articles on stem cell research were published and the maxi-mum numbers of articles are published particularly in the year 2013. It is documented in the Table 1. In total 221 num-bers of articles were published during the studied period. The average growth percentage of the published documents is 20.79 (Table 1).
It is observed that documents on stem cell research were 7 types (Table 2). Among the 7 varieties of articles the origi-nal article i.e. full length articles were 186 (Table 2). It is
Table 1. Year wise distribution of published documents.
Year Number of documents Percentage Growth percentage
2009 19 8.61%
2010 30 13.57% 57.89%
2011 33 14.93% 9.09%
2012 44 19.91% 33.33%
2013 50 22.62% 13.64%
2014 45 20.36% –10.00%
Total 221 100 Average growth percentage = 20.79

175 Pol ann MeD. 2018;25(2):173–179
revealed that the original articles are 84% and rest articles are 16% (Table 2). The documents are from different area of the science. There are 143 articles published from the field of medicine, which is the highest number from the other area. Whereas, it is found that only 1 document is published in each field of dentistry, environmental science, health pro-fession and multidisciplinary (Table 3). Different articles are cited with number of publications. In our study, it is revealed that 1 article is cited 121 times whereas 47 articles have no citations (Table 4). All articles are published by the Indian researchers but few researchers from other countries are also collaborative authors. Among the collaborative authors, USA was the highest number of publications i.e. 23 (Table 5). All these Indian research papers on stem cell are published through different sources. Cell Adhesion and Migration is the highest preferred journal with more than 48% of publications and PLOS ONE is in the second posi-tion with 12 nos of publications, where as 20 journals hav-ing 2 publications each (Table 6). There are many Indian
researchers publish 221 papers in different journals. Among them Mohanty occupies the top position with 11 nos of pub-lications to his credit. Gupta, Verma and Bhonde are com-bine in second position with 10 numbers of publications to justify their performance and 13 researchers have 1 docu-ment each (Table 7).
Table 4. Indian research papers cited by other authors.
Number of articles
Frequency of citation
Number of articles
Frequency of citation
47 0 3 26
23 1 1 27
17 2 4 28
16 3 2 31
13 4 1 33
10 5 2 34
9 6 1 36
5 7 1 37
11 8 1 38
6 9 1 41
3 10 1 48
3 11 1 51
6 12 1 53
6 13 1 54
2 14 1 55
1 15 1 56
3 16 1 58
2 17 1 61
1 19 1 63
2 20 1 94
1 21 1 114
3 22 1 121
2 25 Total no. of documents = 221
Table 2. Different types of published documents.
Type Number of documents Percentage
Article 186 84.06%
Review 29 13.12%
Conference paper 2 0.91%
Book chapter 1 0.45%
Article in press 1 0.45%
Letter 1 0.45%
Short survey 1 0.45%
Total 221 99.99%
Table 3. Distribution of documents into different subjects.
Subject Number of documents
Medicine 143
Biochemistry, genetics and molecular biology 136
Engineering 27
Materials science 17
Pharmacology, toxicology and pharma-ceutics 16
Agricultural and biological sciences 14
Chemical engineering 14
Neuroscience 13
Immunology and microbiology 9
Chemistry 4
Physics and astronomy 3
Veterinary 3
Nursing and social sciences 2
Dentistry, Environmental Science, Health Professions and Multidisci-plinary
1Table 5. Geographical distribution of authors.
Name of the country Number of authors
India 221
USA 23
Malaysia 9
South Korea 5
Germany 4
Singapore 4
Australia, Denmark and Saudi Arabia 3
Japan, Mexico and Spain 2
Belgium, Canada, Iran, Italy, Slovenia, Switzerland and United Kingdom 1

176 Pol ann MeD. 2018;25(2):173–179
Table 6. Documents published in different sources.
Name of the sourceNumber of docu-ments
Cumu-lative
number of docu-ments
Percent-age
Cumu-lative
percent-age
PLOS ONE 12 12 5.42% 5.42%Stem Cells and Development 8 20 3.61% 9.03%Cytotherapy 7 27 3.16% 12.19%Cell and Tissue Research 7 34 3.16% 15.35%Stem Cell Research and Therapy 4 38 1.80% 17.15%
BMJ Case Reports 4 42 1.80% 18.95%Neurology India 4 46 1.80% 20.75%Cell Biology International 4 50 1.80% 22.55%Cytotechnology 3 53 1.36% 23.91%Cell Transplantation 3 56 1.36% 25.27%Biochemical and Biophysical Research Communications 3 59 1.36% 26.63%
International Journal of Stem Cells 3 62 1.36% 27.99%
International Wound Journal 3 65 1.36% 29.35%Journal of Stem Cells 3 68 1.36% 30.71%Stem Cells International 3 71 1.36% 32.07%Trends in Biomaterials and Artificial Organs 3 74 1.36% 33.43%
Hepatology International 2 76 0.91% 34.34%Cancer Research 2 78 0.91% 35.25%Human Cell 2 80 0.91% 36.16%International Journal of Phar-macy and Technology 2 82 0.91% 37.07%
Cell Biochemistry and Function 2 84 0.91% 37.98%Cell Proliferation 2 86 0.91% 38.89%International Journal of Phar-maceutical Sciences Review and Research
2 88 0.91% 39.80%
Journal of Tissue Engineering and Regenerative Medicine 2 90 0.91% 40.71%
Journal of Translational Medicine 2 92 0.91% 41.62%
Journal of the Indian Medical Association 2 94 0.91% 42.53%
Nanomedicine 2 96 0.91% 43.44%Current Stem Cell Research and Therapy 2 98 0.91% 44.35%
Phytomedicine 2 100 0.91% 45.26%Biomedical Journal 2 102 0.91% 46.17%Research Journal of Phar-maceutical Biological and Chemical Sciences
2 104 0.91% 47.08%
Biomaterials 2 106 0.91% 47.99%Journal of Cellular Biochemistry 2 108 0.91% 48.90%Stem Cells and Cloning Ad-vances and Applications 2 110 0.91% 49.81%
International Journal of Pharma and Bio Sciences 2 112 0.91% 50.72%
Journal of Stem Cells and Regenerative Medicine 2 114 0.91% 51.63%
Cell Adhesion and Migration 107 221 48.40% 100%
Table 7. Number of documents produced by each author.
Cumulative percentageNumber of docu-ments
Name of the authorNumber of docu-ments
Mohanty S 11 Bajaj M 2Bhonde R 10 Dhanasekaran M 2Verma RS 10 Hardikar AA 2Gupta PK 10 Balaraju S 2Trivedi HL 9 Mandal BB 2Totey S 9 Dixit A 2Dave SD 8 Mohapatra PC 2Mukhopadhyay A 8 Chullikana A 2Rajkumar JS 7 Murthy TVRK 2Indumathi S 7 Lissa RP 2Vanikar AV 7 Nath A 2Majumdar AS 7 Pande G 2Dhanasekaran M 7 Panilaitis B 2Sudarsanam D 7 Paspala SAB 2Thakkar UG 5 Phadnis SM 2Guhathakurta S 5 Polisetti N 2Jan M 5 Poojitha R 2Cherian KM 5 Das B 2Kale VP 5 Chopra G 2Prabhakar S 5 Prasad K 2Mathews S 5 Kirkland MA 2Marwaha N 5 Rallapalli S 2Varma HK 5 Ramakrishna S 2Das AK 4 Ramakrishnan M 2Anand A 4 Ramesh T 2Balasubramanian S 4 Routray P 2Pal R 4 Roy P 2Afrin F 4 Roy S 2Limaye LS 4 Sachdeva N 2John A 4 Sangeetha VM 2Harikrishnan R 4 Chelluri LK 2Sreejit P 4 Sarkar C 2Bishi DK 4 Seetharam RN 2Ta M 4 Kumar A 2Tripathi RP 4 Bhansali A 2Venkataramana NK 4 Jindal N 2Venugopal P 4 Sharma MC 2Zakaria Z 4 Sharma RR 2Khandelwal N 4 Singh R 2Amarpal 4 Bhartiya D 2Nair MB 4 Srivastava A 2Pawde AM 3 Srivastava S 2Mamidi MK 3 Airan B 2Gopal SC 3 Suri A 2Chaklader M 3 Suri V 2Das M 3 Surolia A 2Law S 3 Mathapati S 2Kadalmani B 3 Kumar SR 2Aithal HP 3 Hinge A 2Das P 3 Thej C 2

177 Pol ann MeD. 2018;25(2):173–179
5. DISCUSSION
In 2000, the Japanese government released a report that had been on hold for a longer period of time. The report en-dorsed the use of human stem cells in research-work.21 The draft report outlined a process for both publicly and pri-vately funded scientists to follow in deriving and working with stem cells. However, the number of stem cell research collaboration in the UK and USA has not been affected by the different national stem cell policies or regulatory mechanisms that motivate international stem cell research including other countries with which the USA and UK are most often collaborated.22
Proffesor Shinya Yamanaka of Kyoto University of Japan and the Gladstone Institutes, USA received the Nobel Prize in physiology or medicine in 2012 for the discovery that ma-ture cells can be reprogrammed to become pluripotent. In ad-dition, Yamanaka has published 57 pluripotent stem cell ar-
ticles of which 4 articles ranked in the top 10 for TC2012 and C2012, respectively, including the top ranked article entitled Induction of pluripotent stem cells from mouse embryonic and adult fibroblast cultures by defined factors23 and second ranked article entitled Induction of pluripotent stem cells from adult human fibroblasts by defined factors.24 A steep slope could be found with these two distinguished patterns of citations per year. It has been noticed that in the highest percentile, the top 0.1% of authors, a significant percentage have won the Nobel Prize or eventually proceeded to win the award in later years.25 Nobel Prizes are the gold standard of quality in scientific achievement in the fields where they are given.26 Furthermore, a high correlation between the biblio-metric indicators and the number of Nobel Prize achieve-ments was found in peace, economics, chemistry, medicine/physiology and physics.27,28 This bibliometric investigation of articles on pluripotent stem cell-related research has re-vealed some interesting findings. In total, 221 articles were published in Scopus indexed journal of 2009–2014 with keyword ‘stem cell,’ ‘pluripotent’ and ‘totipotency.’ Arti-cles were published in 37 journal categories in the science edition till 2014. Stem Cells and PLOS ONE were the most common journals in pluripotent stem cell research. There was a sharp increase in articles annually after 2012. Articles without the required search words on their front page could be still found in Scopus which is designed for researchers to find literature but not for bibliometric study. The citation lives of the top articles in total citations as well as in pub-lication year and recent year showed that the impact of top articles in a research field might alter according to novelty and not only time. In general, the so-called ‘classic’ articles had low citations in their publication year. The countries like G7 (Canada, France, Germany, Italy, Japan, the United Kingdom, and the United States) were part of the top ten countries in terms of publication. It was noted that the USA, as a country, contributed the most independent and inter-nationally collaborative articles, as well as the most first and corresponding author articles. Institutionally, Harvard Uni-versity published the most inter-institutional articles and overall articles, while Kyoto University published the most first and corresponding author articles. The papers of the Nobel Prize winner in 2012, Prof. Shinya Yamanaka, who published four articles ranked among the top ten in terms of total citations and citations in the most recent year, have followed a distinguished pattern with steep slopes indicat-ing rapidly increasing citation counts. Studies on induced pluripotent stem cells and embryonic stem cells have been found to be the most popular research focus in recent years in pluripotent stem cell research. As seen by the popularity of stem cell research in various countries and the acknowl-edgment of the potential of pluripotent stem cells to aid in patient specific therapies in our ever increasing elderly popu-lation, regenerative medicine will continue to progress with the advent of new research findings. With utologous hemat-opoietic stem cell transplantation, the palifermin decreased the incidence of severe oral mucositis (grade 3–4 WHO) by 19% (44% vs. 63%), however it did not contribute to the du-
Cumulative percentageNumber of docu-ments
Name of the authorNumber of docu-ments
Al-Nbaheen M 3 Thrichelvam ST 2Aldahmash A 3 Tiwari A 2Gangenahalli G 3 Dubey PK 2Gokulchandran N 3 Mathew SA 2Chandra T 3 Jacob VC 2Pal R 3 Bansal A 2Bhonde RR 3 Kumar AA 2Pereira JA 3 Vemuganti GK 2Kinjavdekar P 3 Maiwall R 2Kulkarni P 3 Mishra R 2Potdar PD 3 Gottipamula S 2Seth T 3 Vidyasekar P 2Sharma A 3 Gupta V 2Sharma M 3 Viswanathan C 2Dutta RK 3 Walia R 2Basak P 3 Yadav PK 2Taru Sharma G 3 Sarang S 2Chaudhuri S 3 Bhaskaran S 1Chatterjee S 3 Bhatia A 1Behari M 3 Bhatia R 1Vishnubalaji R 3 Bhatnagar S 1Ghaskadbi SM 2 Bhattacharya AK 1Kanmani A 2 Bhuvanalakshmi GB 1Kannan S 2 Biju H 1Gil ES 2 Binas B 1Habeeb MA 2 Boccaccini AR 1Kaplan DL 2 Bodakhe S 1Badhe P 2 Bokara KK 1Campos-Neto A 2 Borena BM 1Jain KG 2 Boroujeni ME 1
Table 7. No of documents produced by each author.

178 Pol ann MeD. 2018;25(2):173–179
ration of oral mucositis and total parenteral nutrition use. There were no differences in opioid use, incidence of fever of unknown origin, severe infection, engraftment and gas-trointestinal hemorrhage between groups. Five-year overall survival was better in patients treated with palifermin. Only in one patient generalized, itching rash was observed after palifermin administration.29 In an another study, it was re-vealed that the divergences are attributed to differences in cell preparations, the large number of stem cell types under investigation in different clinical settings, timing, methods of cell administration and characteristics of patients.30
6. CONCLUSIONS
The impact of top articles changed from year to year with their citation. Top cited articles in previous publication years were not the same as recent years. ‘Induced pluripo-tent stem cell(s)’ and ‘embryonic stem cell(s)’ were the most used author keywords in stem cell research. In addition, the winner of the Nobel Prize in physiology or medicine in 2012, Prof. Shinya Yamanaka, published four of the top ten most frequently cited articles.
References
1 Martínez-serrano a, Björklund a. Protection of the neostriatum against excitotoxic damage by neuro-trophin-producing, genetically modified neural stem cells. J Neurosci. 1996;16(15):4604–4616. https://doi.org/10.1523/JNEUROSCI.16-15-04604.1996.
2 Bishop AE, Buttery LDK, Polak JM. Embryonic stem cells. J Patholo. 2002;197(4):424–429. https://doi.org/10.1002/path.1154.
3 Cao QL, Benton RL, Whittemore SR. Stem cell repa-ir of central nervous system injury. J Neurosci Res. 2002;68(5):501–510. https://doi.org/10.1002/jnr.10240.
4 Di Giorgio FP, Carrasco MA, Siao MC, Maniatis T, Eg-gan K. Non-cell autonomous effect of glia on motor neu-rons in an embryonic stem cell-based ALS model. Nat Neurosci. 2007;10(5):608–614. https://doi.org/10.1038/nn1885.
5 Hjørland B, Albrechtsen H. Toward a new horizon in in-formation science: domain analysis. J Amer Societ Inf Sci. 1995;46(6):400–425. https://doi.org/10.1002/(SICI)1097--4571(199507)46:6<400::AID-ASI2>3.0.CO;2-Y.
6 Camí J, Zulueta MA, Fernández MI, Bordons M, Gó-mez I. [Spanish scientific production in biomedicine and health sciences during the period 1990-1993 (Scien-ce Citation Index and Social Science Citation Index) and comparison to period 1986-1989]. Med Clin (Barc). 1997;109(13):481–496 [in Spanish].
7 Bordons M, Zulueta MA. [Evaluation of the scientific activity through bibliometric indices]. Rev Esp Car-diol. 1999;52(10):780–800 [in Spanish]. https://doi.org/10.1016/S0300-8932(99)75008-6.
8 Krauskopf D. [La construccion social de la Ciencia y la Tecnología]. Boletín SEBBM. 2000;130:12–16 [in Spa-nish].
9 Chinchilla-Rodríguez Z, Moya-Anegón F. La investi-gación científica española (1995-2002): una aproximación métrica. Granada: Universidad de Granada; 2007.
10 Zhao D, Strotmann A. Intellectual structure of stem cell research: a comprehensive author co-citation analysis of a highly collaborative and multidisciplinary field. Scien-tometrics. 2011;87(1):115–131. https://doi.org/10.1007/s11192-010-0317-2.
11 Perianes-Rodríguez A, Olmeda-Gómez C, Ovalle-Per-andones MA, Chinchilla-Rodríguez Z, Moya-Anegón F. R&D collaboration in 50 major Spanish compa-nies. Aslib Proceedings. 2011;63(1):5–27. https://doi.org/10.1108/00012531111103759.
12 Wasserman S, Faust K. Social network analysis: methods and applications. Cambridge: University Press; 1998.
13 Leydesdorff L, Rafols I. A global map of science ba-sed on the ISI subject categories. J Am Soc Inf Sci Tech. 2009;60(2):348–362. https://doi.org/10.1002/asi.20967.
14 Rafols I, Porter AL, Leydesdorff L. Science overlay maps: a new tool for research policy and library mana-gement. J Am Soc Inf Sci Tech. 2010; 61(9):1871–1887. https://doi.org/10.1002/asi.21368.
15 Fernández MT, Cabrero A, Zulueta MA, Gómez I. Con-structing a relational database for bibliometric analy-sis. Res Eval. 1993;3(1):55–62. https://doi.org/10.1093/rev/3.1.55.
16 Garfield E. Keywords plus: ISI’s breakthrough retrieval method. Part 1. Expanding your searching power on cur-rent contents on diskette. Curr Cont. 1990;32:295–299.
17 Fu HZ, Wang MH, Ho YS. The most frequently cited ad-sorption research articles in the Science Citation Index (Expanded). J Colloid Interface Sci. 2012;379(1):148–156. https://doi.org/10.1016/j.jcis.2012.04.051.
18 Chuang KY, Wang MH, Ho YS. High-impact papers pre-sented in the subject category of water resources in the Essential Science Indicators database of the Institute for Scientific Information. Scientometrics. 2011;87(3):551–562. https://doi.org/10.1007/s11192-011-0365-2.
19 Wang MH, Fu HZ, Ho YS. Comparison of universities’ scientific performance using bibliometric indicators. Malaysian Journal of Library & Information Science. 2011; 6(2):1–19.
20 Chiu WT, Ho YSh. Bibliometric analysis of homeopathy research during the period of 1991 to 2003. Scientome-trics. 2005;63(1):3–23. https://doi.org/10.1007/s11192-005-0201-7.
21 Normile D. Stem cells. Report would open up rese-arch in Japan. Science. 2000;287(5455):949. https://doi.org/10.1126/science.287.5455.949a.
22 Luo JY, Flynn JM, Solnick RE, Ecklund EH, Matthews KR. International stem cell collaboration: how dispa-rate policies between the United States and the United Kingdom impact research. PloS One. 2011;6(3):e17684. https://doi.org/10.1371/journal.pone.0017684.

179 Pol ann MeD. 2018;25(2):173–179
23 Takahashi K, Yamanaka S. Induction of pluripotent stem cells from mouse embryonic and adult fibroblast cultures by defined factors. Cell. 2006;126(4):663–676. https://doi.org/10.1016/j.cell.2006.07.024.
24 Takahashi K, Tanabe K, Ohnuki M, et al. Induction of pluripotent stem cells from adult human fibroblasts by defined factors. Cell. 2007;131(5):861–872. https://doi.org/10.1016/j.cell.2007.11.019.
25 Garfield E, Welljamsdorof A. Of Nobel class: a cita-tion perspective on high impact research authors. The-or Med. 1992;13(2):117–135. https://doi.org/10.1007/BF02163625.
26 Shelton RD, Holdridge GM. The US-EU race for le-adership of science and technology: qualitative and qu-antitative indicators. Scientometrics. 2004;60(3):353–363. https://doi.org/10.1023/B:SCIE.0000034379.75236.d9.
27 Rodriguez-Navarro A. Measuring research excellence Number of Nobel Prize achievements versus conventio-nal bibliometric indicators. J Doc. 2011;67(4):582–600. https://doi.org/10.1108/00220411111145007.
28 Nichols J, Zevnik B, Anastassiadis K, et al. Formation of pluripotent stem cells in the mammalian embryo depends on the POU transcription factor Oct4. Cell. 1998; 5(3):379–391. https://doi.org/10.1016/S0092-8674(00)81769-9.
29 Jezierska-Woźniak K, Wojtkiewicz J. Stem cells in clinical practice for cardiovascular diseases. Pol Ann Med. 2016;23(1):49–56. https://doi.org/10.1016/j.po-amed.2015.09.001.
30 Czyżewski K, Styczyński J, Dębski R, Krenska A, Wy-socki M. Keratinocyte growth factor decreases inci-dence of severe oral mucositis in children undergoing autologous hematopoietic stem cell transplantation. Pol Ann Med. 2015;22(1):18–22. https://doi.org/10.1016/j.poamed.2015.04.003.

180 Pol ann MeD. 2018;25(2):180–183
Original article
Ayorinde Adehin1, Oluseye Oladotun Bolaji1, Simran Maggo2, Martin A. Kennedy2
1 Department of Pharmaceutical Chemistry, Faculty of Pharmacy, Obafemi Awolowo, University, Ile-Ife, Osun State, Nigeria2 Department of Pathology and Carney Centre for Pharmacogenomics, University of Otago, Christchurch, New Zealand
Corresponding author: Ayorinde Adehin, Department of Pharmaceutical Chemistry, Faculty of Pharmacy, Obafemi Awolowo University, Ile-Ife, Osun State, Nigeria. Tel.: +2348022013470.
E-mail address: [email protected].
Genetic polymorphism of CYP2C9 and VKORC1 in the Nigerian population: significance for warfarin therapy in the population
article info
Art ic l e h i s toryReceived 10 March 2017Accepted 28 October 2017Available online 28 May 2018
Keywords CYP2C9VKORC1PolymorphismsNigerians
Doi 10.29089/2017.17.00041
User l i cense This work is licensed under a Creative Commons Attribution –NonCommercial – NoDerivatives 4.0 International License.
abstract
Introduct ion: CYP2C9 and VKORC1 are important pharmacogenes for war-farin dosing. Variability in response to warfarin therapy, which may carry fatal consequences, have been explained by the presence of functionally relevant va-riants of these genes.
Aim: This study investigated the prevalence and highlights the clinical im-plications of some relevant variants of CYP2C9 and VKORC1 in the Nigerian population as they affect the safe administration of warfarin.
Mater ia l and methods : Genotype analysis via a Sequenom iPLEX platform and direct Sanger sequencing was carried out in 158 healthy, unrelated subjects, drawn from the main Nigerian ethnicities. The alleles screened for comprised CYP2C9*2 (rs1799853), *3 (rs1057910) and *8 (rs7900194). Subjects were also genotyped for VKORC1*3 (rs7294) allele.
Resu l t s and d i scuss ion: All the studied alleles were in Hardy-Weinberg equilibrium, and CYP2C9*8 was the most prevalent CYP2C9 allele with a frequ-ency of 0.073 in the population. The other CYP2C9 alleles, CYP2C9*2 and *3, occurred at frequencies of 0.006 and 0.003, respectively. VKORC1*3, however, was observed at a frequency of 0.437.
Conc lus ions : Although all alleles detected in the population are significan-tly related to warfarin dosing, VKORC1*3 might be the most critical owing to its high prevalence (108 out of 158) across individuals from different Nigerian ethnicities. Plasma warfarin-level monitoring may also be desirable in instances where individuals carry both the CYP2C9*8 and VKORC1*3 alleles, an occur-rence observed in 9% of the studied individuals.
Journal homepage: https://www.paom.pl
Polish Annals of Medicine

181 Pol ann MeD. 2018;25(2):180–183
1. INTRODUCTION
Warfarin is a widely-prescribed anticoagulant characterised by a narrow therapeutic index and interindividual differ-ences in response to its therapy. Its use spans the preven-tion and treatment of deep-vein thrombosis, pulmonary embolism, stroke and myocardial infarction.1,2 The drug is often administered as a racemate with S-warfarin, one of its enantiomers almost exclusively metabolised by CYP2C9, predominating the exaction of warfarin’s inhibitory effect on its target enzyme. This target enzyme, vitamin K1 2,3 epoxide reductase (VKOR), is encoded by vitamin K1 epox-ide reductase complex subunit 1 (VKORC1).3
The activity of VKOR usually generates reduced vitamin K which is a cofactor for γγ-glutamyl-carboxylase, a critical en-zyme in the blood coagulation process that activates the pre-cursor-forms of blood clotting factors.4 Warfarin’s inhibition of VKOR and by extension a disruption of the blood coagulation process underpins its delicate rational use as an anticoagulant. Unfortunately, wide variations in plasma levels of warfarin does carry a potential risk of major or fatal bleeding in humans, thus necessitating the monitoring of prothrombin time (PT) often expressed as an international normalised ratio (INR). The INR is an index derived from the measurement of the sum of activ-ity of the vitamin K dependent coagulation factors.1,5
Although warfarin plasma levels is known to be affected by gender, dietary intake of vitamin K, age and disease such as liver dysfunction, genetic variability in genes encoding CYP2C9 and VKOR, warfarin’s metabolic enzyme and tar-get, respectively, impacts significantly on the safety of war-farin therapy.1,6 Functional polymorphisms in the CYP2C9 gene, especially the *2, *3 and *8 alleles which have previ-ously been shown to result in decreased metabolism of CY-P2C9 substrates, are potential sources of alteration in initial warfarin dose sensitivity which often delays the attainment stable maintenance doses, and increases the risk of adverse events.5,7,8 In the same vain, genetic variants of VKORC1 have been noted to be predictive of warfarin phenotypes and such polymorphisms in this gene have been reported to account for about 25% of variance in stabilized warfarin dose.9 These findings have reinforced the notion that the safe administra-tion of warfarin may benefit hugely from pharmacogenetics.
2. AIM
A study of the prevalence of the main genetic contributors to warfarin therapy in Nigerians, a population for which genetic data for her many ethnicities is sparse, was hence carried out to evaluate the potential usefulness of pharmaco-genetics in warfarin therapy in the population.
3. MATERIAL AND METHODS
Ethical approval for this study was provided by the Ethics Committee of Obafemi Awolowo University Teaching Hos-
pital, Ile-Ife, Nigeria. Study subjects – 158 non-related Ni-gerians drawn from the main ethnicities (20 Hausa, 31 Igbo, 95 Yoruba, and 12 from some other minor ethnicities), who had provided written informed consent – participated in this study by providing 5 mL of blood which were collected in EDTA bottles. Genomic DNA was extracted from blood samples by a phenol-chloroform method and screened for CYP2C9*2 (rs1799853), *3 (rs1057910) and *8 (rs7900194) through the Sequenom MassARRAY platform (kits and chemicals supplied by Agena Bioscience, San Diego, CA, USA). VKORC1*3 was screened for by directly amplifying the corresponding VKORC1 locus and subsequently Sanger sequencing the amplicons. The population data was assessed for Hardy-Weinberg equilibrium with a Fisher’s exact test, inferring statistical significance from P < 0.05.
4. RESULTS
Alleles detected in the population were all in Hardy-Wein-berg equilibrium, and a detailed description of the popula-tion data is provided in Table 1. CYP2C9*2 and *3 were not detected in the Igbo and Hausa ethnicities, whereas the CYP2C9*8 allele was most frequent in Yoruba with a prevalence of 0.095. VKORC1*3 was detected across all eth-nicities with a cumulative allele frequency of 0.437 in the Nigerian population. In 158 studied individuals 14 were, however, carriers of both CYP2C9*8 and VKORC1*3.
5. DISCUSSION
CYP2C9*2 and *3, alleles which had been predominantly reported in Caucasians,10,11 occurred at frequencies below 1% in the Nigerian population. Although these alleles had previously been shown to necessitate a 20% reduction in warfarin dose for CYP2C9*212 and 75% in Caucasians who were homozygous carriers of CYP2C9*3,13 their overall im-portance for warfarin dosing in Nigerians may be limited owing their low prevalence in the population. CYP2C9*8, an allele quite prevalent across Nigerian ethnicities, may be more critical for warfarin therapy instead. This allele is known to exhibit significantly-lower catalytic activity for S-warfarin compared with the wild-type from a study which used recombinant CYP2C9 protein.8 The likely importance of this allele for warfarin dosing in the Nigerian population is further reinforced by previous studies in South African patients14 which found correlation between CYP2C9*8 and warfarin variability, and in African-Americans by Cavallari et al.15 which observed a 19% reduction in median warfa-rin dose (34.4 vs 42.5 mg/week) for homozygous and het-erozygous CYP2C9*8 carriers. In addition, a similar study of the role of CYP2C9*8 in warfarin therapy in another African-American population by Liu et al.16 observed a 30% reduction in the unbound oral clearance of S-warfarin and 25% lower R- to S-warfarin plasma levels in carriers of CYP2C9*8 compared to the wildtype allele carriers. Among

182 Pol ann MeD. 2018;25(2):180–183
other findings from this group, as much as 30% lower intrin-sic clearance of S-warfarin was also seen with the cDNA-expressed CYP2C9*8 protein.
VKORC1*3 (rs7294), another allele critical for warfarin dosing, was found to be quite prevalent across Nigerian eth-nicities, occurring in about 68% of the subjects, compris-ing of 30 homozygous carriers and 78 heterozygous carri-ers. This variant has been reported to impact significantly on warfarin efficacy, especially at the early stages of therapy commencement, in a study of 460 Chinese patients.17 The same study observed suboptimal INR values in about 90% of patients who were carriers of VKORC1*3 after 7 days of daily 2.5 mg warfarin administration. Another study in Su-danese subjects who had been on warfarin for at least three months showed that the mean daily dose was about 14% higher in homozygous and heterozygous VKORC1*3 carri-ers,18 while variability in warfarin plasma levels and an ex-pected adjustment of warfarin doses was also explainable by VKORC1*3 in addition to CYP2C9*8 in South Africans.14 D’Andrea et al.,19 however, reported a 24% increase in mean daily warfarin dose for homozygous VKORC1*3 carriers in a Caucasian cohort whereas dose requirements were similar for heterozygotes and wild type carriers.
In the context of the Nigerian population, VKORC1*3 (rs7294) would appear to be the most critical genetic fac-tor for consideration in warfarin dosing owing to its preva-lence. Consequently, upward adjustment of maintenance doses to achieve INR values indicative of optimal clinical response would seem logical when suboptimal responses are observed. However, the less prevalent CYP2C9*8 relative to the VKORC1*3 allele in the population calls for a cautious approach. Ideally, the presence of this allele, as shown from previous data, would necessitate a downward dose adjust-ment in therapy with warfarin. Incidentally, this is further complicated by the likelihood of carriers of both CYP2C9*8 and VKORC1*3 in the population as seen in about 9% of
our study population. Such interesting occurrence of both alleles in Nigerians emphasizes the huge relevance of ge-netic screening prior to commencement of warfarin ther-apy. Since there is no data, to date, quantifying the effect of the co-presence CYP2C9*8 and VKORC1*3 on warfarin maintenance doses, it becomes imperative that drug levels be monitored until stability is achieved in individuals with these alleles.
It is, however, worth noting that the small sample sizes of the Igbo and Hausa samples analysed in the present study may limit statistical projections for these ethnicities. In any case, cohort studies which take into the consideration the polymorphic forms of these genes, especially their co-inheritance in individuals, while also monitoring response to warfarin therapy in the population appears necessary.
6. CONCLUSIONS
In conclusion, this study reports that CYP2C9*8 and VKORC1*3 are prevalent pharmacogenes of warfarin ther-apy in the Nigerian population. The distribution of these alleles in the population clearly makes a strong case for genetic screening prior to warfarin dosing, and drug levels monitoring afterwards until stability is achieved in patients.
Conflicts of interest The authors declare no conflict of interest.
References1 Wadelius M, Sörlin K, Wallerman O, et al. Warfarin sensi-
tivity related to CYP2C9, CYP3A5, ABCB1 (MDR1) and other factors. Pharmacogenomics J. 2004;4(1):40–48. https://doi.org/10.1038/sj.tpj.6500220.
Table 1. Prevalence and distribution of allelic variants of CYP2C9 and VKORC1 in the Nigerian population.
Nigerian ethnicities
Hausa n = 20
Igbo n = 31
Yoruba n = 95
Others* n = 12
Total n = 158
Allele prevalence
CYP2C9*2 (rs1799853) 1 – 1 – 2
CYP2C9*3 (rs1057910) – – 1 – 1
CYP2C9*8 (rs7900194) 1 3 12 1 17
VKORC1*3 (rs7294) 13 19 70 6 108
CYP2C9*2/VKORC1*3 1 – – – 1
CYP2C9*3/VKORC1*3 – – 1 – 1
CYP2C9*8/VKORC1*3 – 2 12 – 14
Allele frequencies
CYP2C9*2 (rs1799853) 0.025 – 0.005 – 0.006
CYP2C9*3 (rs1057910) – – 0.005 – 0.003
CYP2C9*8 (rs7900194) 0.025 0.048 0.095 0.042 0.073
VKORC1*3 (rs7294) 0.425 0.387 0.474 0.292 0.437
Comments: * Isoko (n = 1), Bini (n = 4), Urhobo (n = 2), Ebira (n = 3), Ibibio (n = 2).

183 Pol ann MeD. 2018;25(2):180–183
2 Pirmohamed M. Warfarin: almost 60 years old and still cau-sing problems. Br J Clin Pharmacol. 2006;62(5):509–511. https://doi.org/10.1111/j.1365-2125.2006.02806.x.
3 Herman D, Locatelli I, Grabnar I, et al. Influence of CYP2C9 polymorphisms, demographic factors and conco-mitant drug therapy on warfarin metabolism and mainte-nance dose. Pharmacogenomics J. 2005;5(3):193–202. https://doi.org/10.1038/sj.tpj.6500308.
4 Linder MW. Genetic mechanisms for hypersensitivity and resistance to the anticoagulant Warfarin. Clin Chim Acta. 2001;308(1–2):9–15. https://doi.org/10.1016/S0009--8981(01)00420-X.
5 Choi JR, Kim JO, Kang DR, et al. Proposal of pharmacoge-netics-based warfarin dosing algorithm in Korean patients. J Hum Genet. 2011;56(4):290–295. https://doi.org/10.1038/jhg.2011.4.
6 Wadelius M, Pirmohamed M. Pharmacogenetics of warfa-rin: current status and future challenges. Pharmacogenomics J. 2007;7(2):99–111. https://doi.org/10.1038/sj.tpj.6500417.
7 Scott SA, Jaremko M, Lubitz SA, et al. CYP2C9*8 is pre-valent among African-Americans: implications for pharma-cogenetic dosing. Pharmacogenomics. 2009;10(8):1243–1255. https://doi.org/10.2217/pgs.09.71.
8 Niinuma Y, Saito T, Takahashi M, et al. Functional charac-terization of 32 CYP2C9 allelic variants. Pharmacogenomics J. 2014;14(2):107–114. https://doi.org/10.1038/tpj.2013.22.
9 Owen RP, Gong L, Sagreiya H, Klein TE, Altman RB. VKORC1 pharmacogenomics summary. Pharmacogenet Genomics. 2010;20(10):642–644. https://doi.org/10.1097/FPC.0b013e32833433b6.
10 Lee CR, Goldstein JA, Pieper JA. Cytochrome P450 2C9 po-lymorphisms: a comprehensive review of the in-vitro and human data. Pharmacogenetics. 2002;12(3):251–263. https://doi.org/10.1097/00008571-200204000-00010.
11 Céspedes-Garro C, Fricke-Galindo I, Naranjo ME, et al. Worldwide interethnic variability and geographical distri-bution of CYP2C9 genotypes and phenotypes. Expert Opin Drug Metab Toxicol. 2015;11(12):1893–1905. https://doi.org/10.1517/17425255.2015.1111871.
12 Furuya H, Fernandez-Salguero P, Gregory W, et al. Genetic polymorphism of CYP2C9 and its effect on warfarin main-tenance dose requirement in patients undergoing anticoagu-lation therapy. Pharmacogenetics. 1995;5(5):389–392. https://doi.org/10.1097/00008571-199512000-00008.
13 Takahashi H, Echizen H. Pharmacogenetics of CYP2C9 and interindividual variability in anticoagulant response to war-farin. Pharmacogenomics J. 2003;3(4):202–214. https://doi.org/10.1038/sj.tpj.6500182.
14 Mitchell C, Gregersen N, Krause A. Novel CYP2C9 and VKORC1 gene variants associated with warfarin dosage variability in the South African black population. Phar-macogenomics. 2011;12(7):953–963. https://doi.org/10.2217/pgs.11.36.
15 Cavallari LH, Langaee TY, Momary KM, et al. Genetic and clinical predictors of warfarin dose requirements in Afri-can Americans. Clin Pharmacol Ther. 2010;87(4):459–464. https://doi.org/10.1038/clpt.2009.223.
16 Liu Y, Jeong H, Takahashi H, et al. Decreased warfarin cle-arance associated with the CYP2C9 R150H (*8) polymor-phism. Clin Pharmacol Ther. 2012;91(4):660–665. https://doi.org/10.1038/clpt.2011.269.
17 Liu J, Jiang HH, Wu DK, et al. Effect of gene polymorphisms on the warfarin treatment at initial stage. Pharmacogenomics J. 2017;17(1):47–52. https://doi.org/10.1038/tpj.2015.81.
18 Shrif NE, Won HH, Lee ST, et al. Evaluation of the effects of VKORC1 polymorphisms and haplotypes, CYP2C9 geno-types, and clinical factors on warfarin response in Sudane-se patients. Eur J Clin Pharmacol. 2011;67(11):1119–11130. https://doi.org/10.1007/s00228-011-1060-1.
19 D’Andrea G, D’Ambrosio RL, Di Perna P, et al. A polymor-phism in the VKORC1 gene is associated with an interin-dividual variability in the dose-anticoagulant effect of war-farin. Blood. 2005;105(2):645–649. https://doi.org/10.1182/blood-2004-06-2111.

184 Pol ann MeD. 2018;25(2):184–189
Original article
Shital S. Panchal, Apurva Bhatt, Neha Mishra, Abhishek B. Jha, Shital B. Butani
Department of Pharmacology, Institute of Pharmacy, Nirma University, Gujarat, India
Corresponding author: Shital S. Panchal, Department of Pharmacology, Institute of Pharmacy, Nirma University, Sarkhej-Gandhinagar Highway, Ahmedabad-382 481, Gujarat, India. Tel.: +91 9687626589. Fax: +9179 2717241917.
E-mail address: [email protected].
Effect of γ-oryzanol on hyperlipidemia and thrombus formation in mice treated with poloxamer-407
article info
Art ic l e h i s toryReceived 5 September 2016Accepted 16 February 2017Available online 26 March 2018
Keywords Hyperlipidemiaγ-OryzanolPoloxamer-407 ThrombusOxidative stress
Doi10.29089/2017.17.00032
User l i cense This work is licensed under a Creative Commons Attribution –NonCommercial – NoDerivatives 4.0 International License.
abstract
Introduct ion: Hyperlipidemic and thrombotic events are the most common risk factors for death related to cardiovascular diseases. γ-Oryzanol (OZ) is the ac-tive chemical constituent of Oryza sativa bran oil. It is reported for its antihyperlipi-demic activity.
Aim: Our study was aimed to evaluate effect of OZ on atherothrombotic events, i.e. hyperlipidemia and thrombosis in animal model.
Mater ia l and methods : Swiss albino male mice were divided into four groups. Animals were treated with atorvastatin (2 mg/kg, p.o., as the standard drug) and OZ (100 mg/kg, p.o.) up to 3 days. On the 3rd day poloxamer-407 (500 mg/kg, i.p.) was administered to induce hyperlipidemia. Thrombotic plaque was induced using FeCl3 (50%). Animals were sacrificed after 24 h from induction of hyperlipidemia. Blood was collected for estimation of lipid profile, coronary dis-ease risk factors, blood coagulation parameters i.e. APTT and PT. Liver was iso-lated for estimation of oxidative stress parameters. Further, the effect of therapy on thrombus formation was observed by histopathology of carotid artery.
Resu l t s and d i scuss ion: Treatment with OZ was found to improve the serum lipid profile, reduce coronary risk factors, and to decrease oxidative stress. Thrombus formation was found to be reduced on histopathological examination. OZ prolonged APTT and PT.
Conclus ions : OZ found to be therapeutically efficient in hyperlipidemic and atherosclerotic risk management in the animals which may be due to its anti-oxida-tive stress activity.
Journal homepage: https://www.paom.pl
Polish Annals of Medicine

185 Pol ann MeD. 2018;25(2):184–189
1. INTRODUCTION
Hyperlipidemia has been considered as a predominant con-tributing factor for atherosclerosis and resultant adverse cardiovascular events.1 Hyperlipidemia can be designated as elevated cholesterol, and lipoproteins i.e. low density li-poprotein (LDL) along with low or unaltered high density lipoprotein (HDL) levels in blood.2 Intraperitoneal admin-istration of poloxamer-407 has been found to induce hyper-triglyceridemia within 24 h. It deviates normal lipoprotein level from its regular range by lipoprotein lipase inhibition and HMG-CoA reductase up regulation, the enzyme for regulation of cholesterol synthesis pathway.3 Previous stud-ies reported that poloxamer-407 elevates plasma cholesterol and triglycerides following intraperitoneal injection.4 It is apparent that hyperlipidemia is responsible for thrombo-sis, follows atherosclerotic vascular damage.5 The athero-sclerotic plaque formed in pathogenesis cascade, leads to inhibition of visceral hemoperfusion and increased risk of cardiovascular death and it gets ruptured after some time. It subsequently damages endothelium followed by activa-tion of platelets and coagulation factors which are liable for thrombus formation.6 Atrovastatin, a member of statins, in-hibits HMG-CoA reductase in competitive manner,7 reduc-es cholesterol biosynthesis, upregulates LDL receptor and promotes uptake of LDL. Further it is reported to upregu-late apolipoprotein A1 (Apo A1) synthesis and HDL levels by unknown mechanism.8 Augmented risk of hyperglyce-mia, cataract, erectile dysfunction and neurodegeneration have been reported by statin treatment.9 Since rhabdomy-olysis is critical muscular problem found to occur after ator-vastatin therapy,8 requisite of substitute remedy has been emerged to minimize such clinical event so that the global burden of cardiovascular risk as well as drug related side ef-fects could be abridged.
In current scenario the natural plant based nutritional supplements are emphasized to rid the patients from sev-eral diseases. Hence plant based nutritional and herbal by-products are center of interest for investigation. Rice bran oil contains various bioactive compounds with nutritional values viz. polyphenols and their derivatives, ferulic acids and their sterol esters i.e. cycloartenyl ferulate, 24-meth-ylene cycloartenyl ferulate, campesteryl ferulate. Further it is enriched with vitamin C, tocopherols, inositols and phytidic acid.10,11 γ-Oryzanol (OZ), a ferulic esters’ combi-nation, ameliorates lipid profile by regulating lipoproteins and total cholesterol levels. Further it has been reported for its atherosclerotic index reduction activity as well as anti-lipid peroxidation profile by virtue of its antioxidant activity.12
2. AIM
The study was designed to evaluate potential of OZ for treat-ment of hyperlipidemia and thrombotic events in animals treated with poloxamer-407 and FeCl3.
3. MATERIAL AND METHODS
3.1. ChemicalsOZ was procured from TCI chemicals, India. Poloxamer-407 (Pluronic RF-127) was obtained from Sigma-Aldrich, USA. Atorvastatin was gifted by Troikaa Pharmaceuticals, India. Diagnostic kits for lipid profile were purchased from Lab Care Diagnostics, India. Diagnostic kits for APTT and PT were purchased from Diagnostica Stago, France.
3.2. Animals grouping and treatmentAfter approval of protocol for study by Institutional Animal Ethics Committee (protocol no. IP/PCEU/MPH/14-1/010); Swiss albino male mice (60–40 gm) were used for the study. Mice were divided in different groups (each group n = 6) as: normal control (NC), disease induced (DI), standard treated (ST) and OZ suspension treated (OZS). NC and DI animals were treated with 0.5% CMC for 3 days. In DI animals 30% w/v poloxamer-407 (500 mg/kg, i.p) was administered on 3rd day to induce hyperlipidemia. In ST and OZS animals atorvastatin (2 mg/kg per day, p.o.) and OZ (100 mg/kg per day, p.o.) were administered respectively for 3 days before administration of ploloxamer-407 to induce hyperlipidem-ia. After 24 h of poloxamer-407 injection; blood and liver samples were collected from animals to estimate various biochemical parameters.
3.3. Determination of body weightChange in body weight was measured before and after ther-apy. The percentage change in body weight was calculated.
3.4. Estimation of l ipid profi le and coronary risk predictor indicesTotal cholesterol (TC), triglicerydes (TG) and HDL levels were estimated in serum by procedure recommended by commercially available diagnostic kits (Lab Care Diagnos-tics, India). Serum VLDL and LDL were determined by using Friedewald formula13:
VLDL = TG/5, LDL= TC – HDL – VLDL.
Next, coronary risk predictor indices i.e. atherogenic in-dex (AI)14 and LDL to HDL ratio15 were measured.
AI = (TC – HDL) / HDL.
3.5. Determination of blood coagulation para-metersAPTT and PT were measured by use of commercially available diagnostic kits from C.K. PREST, Diagnostica Atago, France.
3.6. Oxidative stress parametersAnimals were euthanized, livers were removed and washed by ice cold buffer. Tissues were minced and homogenized in buffer with pH 7.4 using 25 stroke of homogenizer (Remi Motors) at the speed of 2500 rpm. Clear superna-

186 Pol ann MeD. 2018;25(2):184–189
tant was taken to estimate catalase activity (CAT),16 super-oxide dismutase activity (SOD)17 and reduced glutathione level (GSH)18 while tissue homogenate was used to esti-mate malondialdehyde (MDA)19 levels. All parameters were measured as per previously described procedure.
3.7. Formation of thrombosisIn diazepam (100 mg/kg) and ketamine (80 mg/kg) anaes-thetized mice; after exposure of carotid artery; 50% FeCl3 soaked whatmann paper piece (2 × 1 mm) was applied topi-cally for 10 minutes to produce thrombosis. After 60 min-utes of the paper application carotid artery was dissected out and embedded in paraffin20 and 5 µm thick sections were taken after paraffinazation of the artery. Hematoxylin eaosin was used for staining of the sections.21
3.9. Statistical analysisThe statistical analysis was carried out by one-way ANOVA followed by Tukey’s multiple comparison test using Graph pad prism 5.03.
4. RESULTS
4.1. Body weightAfter 3 days of treatment period, DI animals had exhibited significant weight gain as compared to NC animals. ST and OZS groups showed significantly reduced body weight com-pared to DI animals (Figure 1).
4.2. Lipid profi le and coronary risk predictor indicesAfter treatment with poloxamer-407, TC, TG, LDL, VLDL levels were elevated significantly in DI animals as compared to the NC group. Significant increase in HDL level was ob-served in the DI group. Significant reduction in TG, LDL, TC and VLDL levels was observed in the ST and OZS
group animals. Moreover, significant increase in HDL level was observed in the ST and OZS animals. Similarly LDL level was improved significantly in OZS treated animals when compared with the ST group. The AI value, LDL and HDL ratio were significantly increased in the DI animals. However, all these values remained to be normal in the ST and OZS groups (Table 1).
4.3. Blood coagulation parametersStatistically insignificant reduction were observed in APTT as well as PT values in the DI group compared to the NC group. Pretreatment with OZ and atorvastatin prolonged APTT and PT time as compared to the DI group (Table 2).
4.4. Oxidative stress parametersAfter administration of poloxamer-407 significantly in-creased MDA levels, reduced SOD, CAT activity and GSH levels were observed in the DI group animals when com-
Table 1. Coronary risk factors indices.
Groups NC DI ST OZS
TC, mg/dL 102.41 ± 4.46 875 ± 5.41* 367.50 ± 8.90*# 351.417 ± 3.36*#
TG, mg/dL 63.33 ± 5.09 946.31 ± 3.26* 251.82 ± 7.47*# 469.78 ± 5.21*#
VLDL, mg/dL 12.66 ± 1.01 189.26 ± 0.65* 50.36 ± 1.4*# 93.95 ± 1.04*#
LDL, mg/dL 21.56 ± 3.89 589.91 ± 11.91* 184.76 ± 9.37*# 119.62 ± 8.11*#
HDL, mg/dL 71.18 ± 5.54 32.18 ± 2.14* 132.36 ± 6.9*# 137.83 ± 6.40*#
AI 0.5 ± 0.09 9.43 ± 0.97* 1.80 ± 0.13*# 1.58 ± 0.14*#
LDL and HDL ratio 0.36 ± 0.09 7.18 ± 0.78* 1.42 ± 0.12*# 0.89 ± 0.11*#
Comments: All values are expressed as mean ± SEM; n = 6, * P < 0.05 Vs NC, # P <0.05 Vs DI.
Table 2. Coagulation parameter results.
Groups NC DI ST OZS
APTT (s) 20.33 ± 0.92 18.65 ± 0.37 21.98 ± 2.77# 21.08 ± 0.73#
PT (s) 11.83 ± 0.48 10.83 ± 0.60 12.50 ± 1.76 12.17 ± 0.79
Comments: All values are expressed as mean ± SEM; n = 6. # P < 0.05 Vs DI.
Figure 1. Effects of OZ treatment on weight. Comments: All values are expressed as mean ± SEM; n = 6, * P < 0.05 vs. NC, # P < 0.05 vs. DI.

187 Pol ann MeD. 2018;25(2):184–189
pared with the NC group. Significantly reduced MDA lev-els, increased SOD, CAT activity and GSH levels were ob-served in the ST and OZS groups when compared with the DI group (Table 3).
4.5. Histopathology Histopathological study showed thrombus formation and atherogenicity in poloxamer-407 administered (DI) animals. Significant damage in endothelium cells of all carotids arter-ies was observed. In poloxamer-407 treated animal severe destruction of central lipid layer and endothelial cells was ob-served. However in the ST and OZS groups significant reduc-tion in damage to endothelium and lipid core were observed as shown in Figure 2.
5. DISCUSSION
Atherosclerosis and hyperlipidemia have been found as major factor for cerebrovascular diseases, coronary artery dis-eases and peripheral vascular diseases.22,23
Poloxamer-407 treated DI animals exhibited increased body weight. OZS animals exhibited comparatively nor-mal body weight. Increased serum TC, TG and LDL levels increases risk of coronary heart disease.24,25 Poloxamer-407
increases TC, TG, LDL, VLDL levels.26 In the present in-vestigation, DI animals showed significantly elevated TC, TG, VLDL and LDL levels by up regulation of HMG-CoA reductase enzyme 3 and decreased HDL levels. In previous studies OZ had been found to reduce TC, TG, VLDL as well as LDL and elevate HDL levels.11 In current study OZS ani-mals exhibited improvement in lipid levels by decreasing TC,TG, LDL as well as VLDL levels and elevating HDL level. Poloxamer-407 has been reported to increase AI, which is a marker of atherosclerosis.27 Our study also reports raised value of AI in DI animals which was found to be lower in OZS animals as compared to DI animals. LDL and HDL ratio is a marker of vascular risk which should be low for preventing the coronary disease risks. DI animals exhib-ited high LDL and HDL ratio and were found to be ath-erogenic. However, all these values returned to the normal levels by OZ treatment. Hypercholesterolemia is convicted to be the risk factor for accumulation of oxidized LDL (oxi-LDL) which accelerate foam cells formation and cascade of several atherosclerotic events.28,29 Oxidative stress occurs when antioxidant/prooxidant homeostasis is imbalanced and reactive oxygen species (ROS) production is elevated.30 Lipid peroxidation leads to the production of MDA as a by-product31 which is detrimental to body. Poloxamer-407 has been reported to aggravate oxidative damage and formation
Table 3. Changes in oxidative stress profile.
Groups NC DI ST OZS
MDA levels, nmole/gm protein 0.53 ± 0.06 2.98 ± 0.65* 0.65 ± 0.09# 0.36 ± 0.07#
SOD activity, U/min/gm protein 4.00 ± 0.44 1.44 ± 0.29* 4.39 ± 0.29# 2.74 ± 0.49#
CAT activity, U/min/gm protein 0.03 ± 0.00 0.02 ± 0.00* 0.05 ± 0.00# 0.04 ± 0.00#
GSH levels, µg/ mg protein 6.09 ± 0.20 4.25 ± 0.06* 6.31 ± 0.23# 5.80 ± 0.16#
Comments: All values are expressed as mean ± SEM; n = 6. *P < 0.05 vs. NC, # P < 0.05 vs. DI.
Figure 2. Hematoxylin-eosin stained cross section of carotid arteries: NC group (A), DI group (B), ST group (C), OZS group (D).

188 Pol ann MeD. 2018;25(2):184–189
of oxi-LDL.32 Antioxidant enzymes inhibit the lipoprotein oxidation which in turn provides a supportive mechanism for defense in the body against ROS and decreases the risk of atherogenesis. In our study because of elevated cholesterol and LDL levels in the poloxamer-407 induced atherosthrom-botic animals MDA levels were found to be upraised with re-duction of anti-oxidative enzymes i.e. SOD, CAT and GSH. Moreover, OZ significantly inhibited lipid peroxidation. It markedly improved the antioxidant enzymes such as CAT and GSH levels which collectively indicated a protective and preventive effects of OZ in oxidative stress induced athero-thrombotic complications. No significant changes in SOD activities were observed in our study. Oxidative stress in metabolic syndromes are associated with thrombotic events in the body.33 Studies reported the hyperlipidemia and hy-percoagulability markers such as APTT and PT are associ-ated with each other.34 In previous studies, it is reported that on endothelial cells, accumulation of spherical bodies filled with ferric ion reacts to adhere as well as support formation of aggregates. So FeCl3 can promote this effect in carotid ar-tery. It can also affect the function of adhesion proteins like fibrinogen, collagen, von Willebrand factors and thereby promote platelet adhesion.35,36 In our study APTT and PT were reduced in the DI animal group in statistically insignif-icant manner which were maintained to the normal by pre-treatment with OZ which indicates positive effect on both intrinsic as well as extrinsic coagulation process.
Histological study of carotid artery, showed reduced damage of endothelial and lipid layers with OZ treatment which indicated beneficial effects of OZ against thrombotic events. Hence OZ improves serum lipid profiles, reduces coronary risk factors, decreases the oxidative stress in the body, affect coagulation pathways, and decreases the risk of thrombus formation in atherosclerotic/ hyperlipidemic mice.
6. CONCLUSIONS
OZ has beneficial effects on hyperlipidemia and athero-thrombotic events mainly by improvement of lipid profile, inhibition of thrombotic events and anti-oxidative stress ef-fects.
Conflict of interestThere is no conflict of interest for this paper.
References1 Sharma K, Kumar K, Mishra N. Nanoparticulate carrier
system: a novel treatment approach for hyperlipidemia. Drug Deliv. 2016;23(3):684–699.
2 Longo M, Crosignani A, Podda M. Hyperlipidemia in chronic cholestatic liver disease. Curr Treat Options Ga-stroenterol. 2001;4(2):111–114. https://doi.org/10.1007/s11938-001-0022-6.
3 Chaudhary HR, Brocks DR. The single dose poloxamer 407 model of hyperlipidemia; systemic effects on lipids assessed using pharmacokinetic methods, and its effects on adipokines. J Pharm Pharm Sci. 2013;16(1):65–73. https://doi.org/10.18433/J37G7M.
4 Johnston TP, Li Y, Jamal AS, Stechschulte DJ, Dile-epan KN. Poloxamer 407-induced atherosclerosis in mice appears to be due to lipid derangements and not due to its direct effects on endothelial cells and macro-phages. Mediators Inflamm. 2003;12(3):147–155. https://doi.org/10.1080/0962935031000134860.
5 Eitzman DT, Westrick RJ, Xu Z, Tyson J, Ginsburg D. Hyperlipidemia promotes thrombosis after injury to athe-rosclerotic vessels in apolipoprotein E-deficient mice. Ar-terioscler Thromb Vasc Biol. 2000;20(7):1831–1834. https://doi.org/10.1161/01.ATV.20.7.1831.
6 Fuster V, Stein B, Ambrose JA, Badimon L, Badimon JJ, Chesebro JH. Atherosclerotic plaque rupture and thrombosis. Evolving concepts. Circulation. 1990;82(3 Suppl):II47–II59.
7 Rao SK, Prasad T, Mohanta GP, Manna PK. An ove-rview of statins as hypolipidemic drugs. Int J Pharm Sci Drug Res. 2011;3(3):178–183.
8 Abbas A, Milles J, Ramachandran S. Rosuvastatin and atorvastatin: comparative effects on glucose metabo-lism in non-diabetic patients with dyslipidaemia. Clin Med Insights Endocrinol Diabetes. 2012;5:13. https://doi.org/10.4137/CMED.S7591.
9 Sultan S, Hynes N. The ugly side of statins. Systemic appraisal of the contemporary un-known unknowns. OJEMD. 2013;3(3):179–185. https://doi.org/10.4236/ojemd.2013.33025.
10 Patel M, Naik SN. Gamma-oryzanol from rice bran oil – A review. J Sci Ind Res (India). 2004;63:569–578.
11 Khalil OA, Ramadan KS, Danial EN, Ayaz NO. Antidia-betic activity of Rosmarinus officinalis and its relationship with the antioxidant property. African J Pharm Pharma-col. 2012;6(14):1031–1036.
12 Ghatak SB, Panchal SJ. Anti-hyperlipidemic activity of oryzanol, isolated from crude rice bran oil, on triton WR-1339-induced acute hyperlipidemia in rats. Bra-zilian J Pharmacogn. 2012;22(3):642–648. https://doi.org/10.1590/S0102-695X2012005000023.
13 Ragland BD, Konrad RJ, Chaffin C, Robinson CA, Har-dy RW. Evaluation of a homogeneous direct LDL-chole-sterol assay in diabetic patients: effect of glycemic con-trol. Clin Chem. 2000;46(11):1848–1851.
14 Kim HY, Jeong DM, Jung HJ, Jung YJ, Yokozawa T, Choi JS. Hypolipidemic effects of Sophora flavescens and its constituents in poloxamer 407-induced hyper-lipidemic and cholesterol-fed rats. Biol Pharm Bull. 2008;31(1):73–78. https://doi.org/10.1248/bpb.31.73.
15 Millán J, Pintó X, Muñoz A, et al. Lipoprotein ratios: phy-siological significance and clinical usefulness in cardiova-scular prevention. Vasc Health Risk Manag. 2009;5:757–765.
16 Łukaszewicz-Hussain A, Moniuszko-Jakoniuk J. Liver catalase, glutathione peroxidase and reductase activity, re-

189 Pol ann MeD. 2018;25(2):184–189
duced glutathione and hydrogen peroxide levels in acute intoxication with chlorfenvinphos, an organophosphate insecticide. Polish J Environ Stud. 2004;13(3):303–309.
17 Otitoju O, Onwurah INE. Superoxide dismutase (SOD) activity and serum calcium level in rats exposed to a lo-cally produced insecticide “Rambo Insect Powder.” Anim Res Int. 2005;2(1):261–266. https://doi.org/10.1016/0304-4165(79)90289-7.
18 Moron MS, Depierre JW, Mannervik B. Levels of Gluta-thione, Glutathione reductase and Glutathione S-trans-ferase activities in rat lung and liver. Biochim Biophys Acta. 1979;582(1):67–78.
19 Ohkawa H, Ohishi N, Yagi K. Assay for lipid peroxides in animal tissues by thiobarbituric acid reaction. Anal Bio-chem. 1979;95(2):351–358. https://doi.org/10.1016/0003-2697(79)90738-3.
20 Ghatak SB, Dhamecha PS, Bhadada SV, Panchal SJ. Investigation of the potential effects of metformin on atherothrombotic risk factors in hyperlipidemic rats. Eur J Pharmacol. 2011;659(2–3):213–223. https://doi.or-g/10.1016/j.ejphar.2011.03.029.
21 Kurz KD, Main BW, Sandusky GE. Rat model of ar-terial thrombosis induced by ferric chloride. Thromb Res. 1990;60(4):269–280. https://doi.org/10.1016/0049--3848(90)90106-M.
22 Singh RB, Mengi SA, Xu YJ, Arneja AS, Dhalla NS. Pa-thogenesis of atherosclerosis: A multifactorial process. Exp Clin Cardiol. 2002;7(1):40–53.
23 Ibrahim AY, Hendawy SF, Elsayed AAA, Omer EA. Evaluation of hypolipidemic Marrubium vulgare effect in Triton WR-1339-induced hyperlipidemia in mice. Asian Pac J Trop Med. 2016;9(5):453–459. https://doi.or-g/10.1016/j.apjtm.2016.03.038.
24 Ballantyne CM, Olsson AG, Cook TJ, Mercuri MF, Pe-dersen TR, Kjekshus J. Influence of low high-density lipoprotein cholesterol and elevated triglyceride on co-ronary heart disease events and response to simvasta-tin therapy in 4S. Circulation. 2001;104(25):3046–3051. https://doi.org/10.1161/hc5001.100624.
25 Toth PP, Grabner M, Punekar RS, Quimbo RA, Cziraky MJ, Jacobson TA. Cardiovascular risk in patients achie-ving low-density lipoprotein cholesterol and particle targets. Atherosclerosis. 2014;235(2):585–591. https://doi.org/10.1016/j.atherosclerosis.2014.05.914.
26 Korolenko TA, Johnston TP, Tuzikov FV, et al. Early--stage atherosclerosis in poloxamer 407-induced hyper-lipidemic mice: pathological features and changes in the lipid composition of serum lipoprotein fractions and sub fractions. Lipids Health Dis. 2016;15(1):16. https://doi.org/10.1186/s12944-016-0186-7.
27 Korolenko TA, Tuzikov F V, Johnston TP, et al. Influ-ence of poloxamer 407 on fractional and subfractio-nal composition of serum lipoproteins of mice. Health (Irvine Calif). 2010;2(7):722. https://doi.org/10.4236/he-alth.2010.27110.
28 Sarker M, Mahmud ZA, Saha SK, Tithi NS, Ali MS, Ba-char SC. Anti hyperlipidemic activity of flowers of Puni-ca granatum in poloxamer-407 induced hyperlipidemic mice model. Pharmacogn J. 2012;4(27):66–70. https://doi.org/10.5530/pj.2012.27.11.
29 Holvoet P, Theilmeier G, Shivalkar B, Flameng W, Col-len D. LDL hypercholesterolemia is associated with accumulation of oxidized LDL, atherosclerotic plaque growth, and compensatory vessel enlargement in coro-nary arteries of miniature pigs. Arterioscler Thromb Vasc Biol. 1998;18(3):415–422. https://doi.org/10.1161/01.ATV.18.3.415.
30 Park J, Yeom M, Hahm D-H. Fucoidan improves serum lipid levels and atherosclerosis through hepatic SREBP--2-mediated regulation. J Pharmacol Sci. 2016;131(2):84–92. https://doi.org/10.1016/j.jphs.2016.03.007.
31 Uttara B, Singh AV, Zamboni P, Mahajan RT. Oxida-tive stress and neurodegenerative diseases: a review of upstream and downstream antioxidant therapeutic options. Curr Neuropharmacol. 2009;7(1):65–74. https://doi.org/10.2174/157015909787602823.
32 Ayala A, Muñoz MF, Argüelles S. Lipid peroxida-tion: Production, metabolism, and signaling mecha-nisms of malondialdehyde and 4-hydroxy-2-nonenal. Oxid Med Cell Longev. 2014;2014:360438. https://doi.org/10.1155/2014/360438.
33 Johnston TP, Zhou X. Oxidation of low-density lipopro-tein cholesterol following administration of poloxamer 407 to mice results from an indirect effect. J Cardiovasc Pharmacol. 2007;49(4):246–252. https://doi.org/10.1097/FJC.0b013e318032aa11.
34 Chen SJ, Yen CH, Huang YC, Lee BJ, Hsia S, Lin PT. Relationships between inflammation, adiponec-tin, and oxidative stress in metabolic syndrome. PLoS One. 2012;7(9):e45693. https://doi.org/10.1371/journal.pone.0045693.
35 Bojanini EU, Loaiza-Bonilla A, Pimentel A. Prekalli-krein Deficiency Presenting as Recurrent Cerebrova-scular Accident: Case Report and Review of the Lite-rature. Case Rep Hematol. 2012;2012:1–3. https://doi.org/10.1155/2012/723204.
36 Eckly A, Hechler B, Freund M, et al. Mechanisms under-lying FeCl3-induced arterial thrombosis. J Thromb Ha-emost. 2011;9(4):779–789. https://doi.org/10.1111/j.1538--7836.2011.04218.x.

190 Pol ann MeD. 2018;25(2):190–195
Original article
Taha Hussein Musa1, Wei Li1, Wenjuan Yan1, Yan Guo2, Xiaoshan Li1, Hassan Hussein Musa3, Lovel Fornah1, Pu Yuepu1, Pingmin Wei11
1 Key Laboratory of Environmental Medicine Engineering, Ministry of Education, School of Public Health, Nanjing, China2 Department of Epidemiology, Second Military Medical University, Shanghai, China3 Faculty of Medical Laboratory Science, University of Khartoum, Khartoum, Sudan
Corresponding author: Pu Yuepu, Key Laboratory of Environmental Medicine Engineering, Ministry of Education, School of Public Health, Southeast University, 87 Ding Jiaqiao Rd., Nanjing 210009, China. Tel:.+86 2583 243 899.
E-mail address: [email protected].
Association between the effects of body mass index on lung volumes among students in Jiangsu Province
article info
Art ic l e h i s toryReceived 10 March 2017Accepted 28 October 2017Available online 5 March 2018
Keywords Lung capacityBody mass indexObesityJiangsu Province.
Doi 10.29089/2017.17.00026
User l i cense This work is licensed under a Creative Commons Attribution –NonCommercial – NoDerivatives 4.0 International License.
abstract
Introduct ion: Obesity has been reported to develop lung problems and causes a significant medical health problem for the future of student’s health.
Mater ia l and methods : This is a cross-sectional study among 255 581 stu-dents aged 7–22 years-old. Electronic spirometer device was used for diagnose of lung conditions, and ultrasonic scale machine (SY133) was used to measures body weight and height. BMI was calculated based on Chines Working Group on Obesity in China (WGOC) standard.
Resu l t s : Mean of lung capacity volume (mL), and the ratio of vital lung capa-city and BMI (mL/kg) in males were significantly more than females (P < 0.001), also the differences in lung volumes by gender was reported within the 13 cities in Jiangsu Province. Lung capacity (mL) was showed significant positive associa-tion with height (r = 0.70, P < 0.001), weight (r = 0.60, P < 0.001) in males and body height in females (r = 0.54, P < 0.001), respectively. The significantly low, moderate positive association was reported in males lung capacity volume (P < 0.001) compare with the negative association in females within the ratio of vital lung capacity and BMI (P < 0.001). BMI, as reported, lowers association values of lung volume.
Conc lus ions : We found that age gender has significant effects on lung capacity volumes, and obese students were noticed lower lung volumes. Therefore, compre-hensive intervention measures dominant by physical exercise should be adopted to-wards student’s health.
Journal homepage: https://www.paom.pl
Polish Annals of Medicine

191 Pol ann MeD. 2018;25(2):190–195
1. INTRODUCTION
Obesity increases at an alarming rate in the world’s popula-tion, including the Chinese communities.1–3 It is estimated that 150 million adults and 15 million children are obese, and almost 30.4 million overweight or obese children and adolescents of China in 2010.4
Some studies show increasing of obesity incidents in China, owing to rapid economic development and dramatic transitions in lifestyle of Chinese populations.1–3,5
However, its cure has remained mostly ineffective, fol-lowed by the poor physical activities among students which reported causing numerous health problems, such as dam-aged lung function in children and adolescents.6
Lately, obesity reports cause a significant change in the respiratory system, resulting in loss on thoracoabdominal synchronism.7 Despite the fact that other studies reported that obesity has a clear potential direct effect on respiratory function, since it increases oxygen consumption and car-bon dioxide production,8 and also appeared in causes of an adverse impact on lung volume and capacity, decreases the lung volumes and increase the incidence of asthma.
Recently, other data also showed that higher BMI is asso-ciated with increased forced lung capacity and forced expira-tory volume during one second in females and males.9 Fur-thermore, there was the exponential association between BMI and lung capacity had been reported in children at overweight and obese level.10,11 Others researchers showed an inverse as-sociation between anthropometric variables with pulmonary values among fat adolescent boys in Baroda city, Gujarat.12
There is substantial evidence that the spirometric vari-ables were an essential factor to identify the respiratory diseases. The reports show forced expiratory volume in one second and forced vital capacity, tend to decrease with in-creasing BMI,9,10 however, there was a small, remarkable ef-fect which has usually presented within the normal range in healthy people, children and obese adults.13
Moreover, such a strong association between lung ca-pacities has been reported in decline by an average of the national level among students in Shandong University. Ow-ing to the lack of adequate physical fitness activities among student, such as long-distance running, cycling, swimming, and another endurance exercise, etc.14
In spite of, the overwhelming number of published ar-ticles on influence of obesity on pulmonary function in worldwide.6–11,14 More recently Musa et al. reported results increasing of BMI levels among students aged 7–22 years in Jiangsu province, which may have further future health con-sequences to student health status.3
However, studies investigating lung capacity in obese children and adolescent is few.14 Hence, the present study was aimed to investigate the association between BMI and the lung capacity volumes in school children and adolescent in Jiangsu province, China.
In spite of, many articles have been published on influ-ence of obesity on pulmonary function in the worldwide.10–12
Even though, obesity has reported increasing among student
in Jiangsu Province,3 furthermore, BMI was reported had re-ported effects on lung function that can reduce respiratory well-being, while others numerous studies have reports of the relationship between BMI and lung capacity in many ar-eas, but yielded inconsistent results.1–3,13,14
But up-to-date there has never been a large study show-ing the association between BMI and the lung volumes among of students in Jiangsu Province, China, we consider more studies were required for the future of student’s health.
2. AIM
This study aims to determine whether there is a relation-ship between lung capacity volumes values and BMI levels, height, weight among students aged 7–22 years old.
3. MATERIAL AND METHODS
3.1 Design This study utilized cross-sectional analysis based on four-wave students’ physical fitness and health surveillance data-base for years 2010–2013.
3.2 Study area The study is conducted in Jiangsu province Jiangsu, the 3rd smallest province, which is located in the eastern-central coastal of the People’s Republic of China, but the 5th most populous the most densely populated of the 23 provinces of the People’s Republic of China (PRC), covering 102 600 km2 with an approximate population of 74.058 million.
3.3 ParticipantsParticipants were male and female students aged 7–22-year-old, who were participated voluntary in student’s physical fitness and health survey. The exclusion criteria included students did not take part in lung capacity test and complete anthropometric measurements tests. Finally, a total of 127 866 males and 127 715 females students from 82 schools and 10 universities were par-ticipated in the study and completed the demographic character-istics of the study population as presented by Musa et al. (2017).3
3.4 ProceduresEthical approval for the study was provided by from the Ethics Committee of Student’s Health Literacy Promotion and Research, Jiangsu Province, China and Institutional Review Board of School of Public Health, Southeast Uni-versity. Verbal informed consent was obtained from all sur-veillance before the study was conducted.
Before conducted lung capacity test, participants were requested to fill the basic demographic information.
Measurements of maximum breathing capacity were made on 255 581 Chinese students used the electronic spirometer to obtain the vital lung capacity and a ratio of lung capacity and BMI volumes for each subject. The overall measurement was performed by and well-trained physicians during the physi-
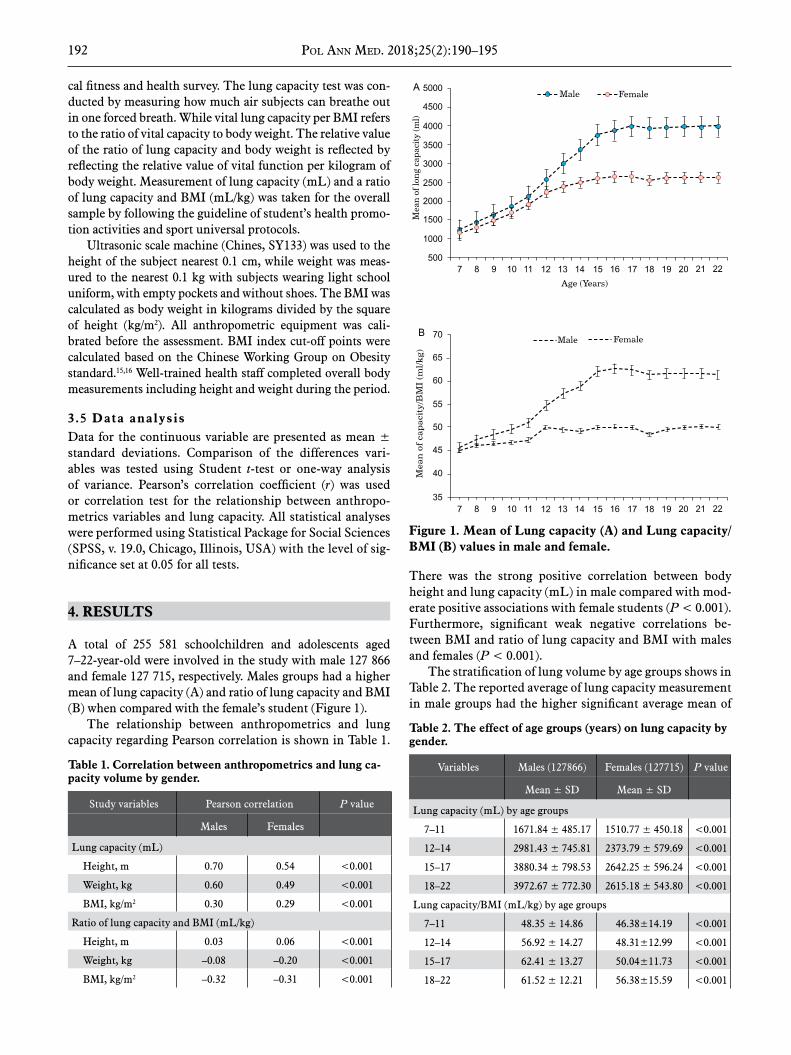
192 Pol ann MeD. 2018;25(2):190–195
cal fitness and health survey. The lung capacity test was con-ducted by measuring how much air subjects can breathe out in one forced breath. While vital lung capacity per BMI refers to the ratio of vital capacity to body weight. The relative value of the ratio of lung capacity and body weight is reflected by reflecting the relative value of vital function per kilogram of body weight. Measurement of lung capacity (mL) and a ratio of lung capacity and BMI (mL/kg) was taken for the overall sample by following the guideline of student’s health promo-tion activities and sport universal protocols.
Ultrasonic scale machine (Chines, SY133) was used to the height of the subject nearest 0.1 cm, while weight was meas-ured to the nearest 0.1 kg with subjects wearing light school uniform, with empty pockets and without shoes. The BMI was calculated as body weight in kilograms divided by the square of height (kg/m2). All anthropometric equipment was cali-brated before the assessment. BMI index cut-off points were calculated based on the Chinese Working Group on Obesity standard.15,16 Well-trained health staff completed overall body measurements including height and weight during the period.
3.5 Data analysis Data for the continuous variable are presented as mean ± standard deviations. Comparison of the differences vari-ables was tested using Student t-test or one-way analysis of variance. Pearson’s correlation coefficient (r) was used or correlation test for the relationship between anthropo-metrics variables and lung capacity. All statistical analyses were performed using Statistical Package for Social Sciences (SPSS, v. 19.0, Chicago, Illinois, USA) with the level of sig-nificance set at 0.05 for all tests.
4. RESULTS
A total of 255 581 schoolchildren and adolescents aged 7–22-year-old were involved in the study with male 127 866 and female 127 715, respectively. Males groups had a higher mean of lung capacity (A) and ratio of lung capacity and BMI (B) when compared with the female’s student (Figure 1).
The relationship between anthropometrics and lung capacity regarding Pearson correlation is shown in Table 1.
There was the strong positive correlation between body height and lung capacity (mL) in male compared with mod-erate positive associations with female students (P < 0.001). Furthermore, significant weak negative correlations be-tween BMI and ratio of lung capacity and BMI with males and females (P < 0.001).
The stratification of lung volume by age groups shows in Table 2. The reported average of lung capacity measurement in male groups had the higher significant average mean of
Figure 1. Mean of Lung capacity (A) and Lung capacity/BMI (B) values in male and female.
Table 1. Correlation between anthropometrics and lung ca-pacity volume by gender.
Study variables Pearson correlation P value
Males Females
Lung capacity (mL)
Height, m 0.70 0.54 <0.001
Weight, kg 0.60 0.49 <0.001
BMI, kg/m2 0.30 0.29 <0.001
Ratio of lung capacity and BMI (mL/kg)
Height, m 0.03 0.06 <0.001
Weight, kg –0.08 –0.20 <0.001
BMI, kg/m2 –0.32 –0.31 <0.001
Table 2. The effect of age groups (years) on lung capacity by gender.
Variables Males (127866) Females (127715) P value
Mean ± SD Mean ± SD
Lung capacity (mL) by age groups
7–11 1671.84 ± 485.17 1510.77 ± 450.18 <0.001
12–14 2981.43 ± 745.81 2373.79 ± 579.69 <0.001
15–17 3880.34 ± 798.53 2642.25 ± 596.24 <0.001
18–22 3972.67 ± 772.30 2615.18 ± 543.80 <0.001
Lung capacity/BMI (mL/kg) by age groups
7–11 48.35 ± 14.86 46.38±14.19 <0.001
12–14 56.92 ± 14.27 48.31±12.99 <0.001
15–17 62.41 ± 13.27 50.04±11.73 <0.001
18–22 61.52 ± 12.21 56.38±15.59 <0.001

193 Pol ann MeD. 2018;25(2):190–195
lung capacity and ratio of lung capacity and BMI compared
with female groups within the different age groups.Results showed significantly different effects in lung ca-
pacity and ratio of lung capacity and BMI among male and females students with different BMI levels (P < 0.001) and higher average mean were reported in males compared with female. Moreover, the average of lung capacity and ratio of lung capacity and BMI was significantly lower among male and female in obese group (Table 3).
There is significant difference in lung capacity and ratio of capacity and BMI values in males and females student within 13 cities in Jiangsu province as showed presented in (Figure 1).
5. DISCUSSION
An increase in the rate of obesity among the population has been observed around the world. Also, the recent reports estimate that increasing of overweight and obesity among students in Jiangsu Province,3 however, there is no doubt that might be a reasons of lack of physical inactivity among student have a direct effect on respiratory well-being,8 fur-thermore have a strong association in effecting the lung vol-ume.9
There is the significant difference in mean lung capacity in males and females of detected from age 7 to 22 year-old in Jiangsu Province, and males student has better lung capac-ity volume than females. However, the previous study has reported the total lung capacity volume was lower in males, and females compare with body weight.6
Our study is unique in that it shows the influence of BMI on lung capacity by age, gender and different BMI level.
The study outcome also proves the results of many other studies on lung capacities carried out in the worldwide. Such as among a Mediterranean population,16 Malaysian students in university students in Malaysia,17 and among different parts of the Indian subcontinent,18 and among healthy Chinese sub-jects,19 and among non-smoking student in Aga University in Pakistan,20 whereas indicate that there is a significant differ-ence in lung capacity volume and ratio of lung capacity and BMI with anthropometric parameters in males and females within different ethnic groups at school aged. While the effects of obesity on spirometric values are not consistent with most of the studies, some studies showing no results,10,21 some ad-ditional showing significant effects and variation between the averages mean of lung capacity volumes.11,13 Our study is set as one that shows the effects BMI on lung capacity among the participants by age, gender and different BMI level. However, the results show that lung capacity is linked to a declining in physical fitness and reported decreased with an increased aver-age of body weight.22 The finding of current reports indicated that the mean of; lung capacity volume decreased by an in-crease in BMI, which is in agreement with previous studies, which showed the significantly reducing of lung volumes by increased of BMI.10 A comparable findings were obtained by other studies that, the increases in BMI in adolescents was as-sociated with decreased pulmonary function rate.21
The current endeavor discovered that there is an es-Figure 2. Mean differences in lung capacity (A) and lung capa-city/BMI (B) values in 13 cities in Jiangsu Province, by gender.
Table 3. Effect of BMI level on lung capacity by gender.
Variables, BMI groups Mean ± SD F value P value
Males, lung capacity (mL), BMI level
Normal weight 3605.39 ± 988.21
275.87 <0.001Over weight 3672.08 ± 1142.20
Obesity 3277.32 ± 1233.73
Total 3589.52 ± 1044.03
Females lung capacity (mL), BMI level
Normal weight 2469.44 ± 657.31
85.41 <0.001Over weight 2557.35 ± 724.20
Obesity 2305.74 ± 828.54
Total 2472.53 ± 674.28
Males, lung capacity/BMI (mL/kg)
Normal weight 62.23 ± 13.149
6.87 <0.001Over weight 52.59 ± 11.571
Obesity 43.287 ± 11.06
Total 58.93 ± 14.06
Females, lung capacity/BMI (mL/kg)
Normal weight 50.12 ± 11.79
1.80 <0.001Over weight 42.52 ± 9.93
Obesity 36.49 ± 9.75
Total 48.72 ± 12.03

194 Pol ann MeD. 2018;25(2):190–195
sential correlation coefficient of lung capacity volume with body weight and BMI between both male and female ado-lescents. Similar findings have been reported previously.23,24
The difference between the rates of lung capacity is most likely support the lung capacity score in college students in Shandong Province.14
Although the study measured the lung capacity score for students from the diverse geographical site, regions, gender, age groups, and differences BMI level, it may be necessary some limitations. The study did not include all pulmonary function tests in children and adolescent students such as lung-forced vital capacity, forced expiratory flow 25% to 75%, peak expiratory flow, vial residual capacity volume, maxi-mum voluntary ventilation, functional residual capacity, and expiratory reserve volume during the follow-up programme. Therefore, further investigations are still required to estab-lish the association of gender, age, height and weight with lung capacity in a more detailed manner and including addi-tional variables to assess the effect of obesity on lung capacity.
6. CONCLUSIONS
The study found BMI has significant effects on lung vol-umes; obesity causes a significant decrease of the lung vol-umes among schoolchildren and adolescents. Furthermore, obese students have low vital lung capacity volumes. Thus, increasing physical fitness activities may further avoid the decline rate of lung capacity volume, while more studies on BMI and lung should continue among students, followed by comprehensive intervention measures for student’s physical exercise.
AcknowledgementThis work was founded by the Jiangsu Provincial Social Science Foundation Grant No. 3TYA001 and Key Labora-tory of Environmental Medicine and Engineering School of Public Health, Southeast University. And we are grate-ful to participant and outstanding professional health staff in Jiangsu Provisional Center for Disease Control and Pre-vention, for their kind cooperation and assistance in this study.
Conflict of interestThe authors declare that do not have any conflict of interest to declare.
References1 Zong Y, Xie R, Deng N, et al. Secular trends in overwe-
ight and obesity among urban children and adolescents, 2003–2012: A serial cross-sectional study in Guangzhou, China. Sci Rep. 2017;7(1):12042. https://doi.org/10.1038/s41598-017-12094-z.
2 Gu F, Zhang RH, Fang YQ. Prevalence of overweight
and obesity among children and adolescents in Zhejiang Province. Chin J Sch Health. 2013;7:25 [in Chinese].
3 Musa TH, Li WE, LI XS, Pu YP, Wei PM. Prevalen-ce of overweight and obesity among students aged 7-22 years in Jiangsu Province, China. Biomed Environ Sci. 2016;29(10):697–705.
4 Ji Cy, Chen TJ, Working Group on Obesity in China. Empirical changes in the prevalence of overweight and obesity among Chinese students from 1985 to 2010 and corresponding preventive strategies. Biomed Environ Sci. 2013;26(1):1–12.
5 Hossain P, Kawar B, El Nahas M. Obesity and diabetes in the developing world a growing challenge. N Engl J Med. 2007;356(3):213–215. https://doi.org/10.1056/NEJMp068177.
6 Ferreira MS, Mendes RT, de Lima Marson FA, et al. The relationship between physical functional capacity and lung function in obese children and adolescents. BMC Pulm Med. 2014;14(1):199. https://doi.org/10.1186/1471-2466-14-199.
7 Parameswaran K, Todd DC, Soth M. Altered respiratory physiology in obesity. Can Respir J. 2006;13(4):203–210. https://doi.org/10.1155/2006/834786.
8 Salome CM, King GG, Berend N. Physiology of obesi-ty and effects on lung function. J Appl Physiol (1985). 2010;108(1):206–211. https://doi.org/10.1152/japplphy-siol.00694.2009.
9 Jones RL, Nzekwu MM. The effects of body mass index on lung volumes. Chest. 2006;130(3):827–833. https://doi.org/10.1378/chest.130.3.827.
10 He QQ, Wong TW, Du L, et al. Respiratory health in overweight and obese Chinese children. Pediatr Pulmonol. 2009;44(10):997–1002. https://doi.org/10.1002/ppul.21091.
11 Li AM, Chan D, Wong E, Yin J, Nelson EA, Fok TF. The effects of obesity on pulmonary function. Arch Dis Child. 2003;88(4):361–363. https://doi.org/10.1136/adc.88.4.361.
12 Paralikar SJ, Kathrotia RG, Pathak NR, Jani MB. As-sessment of pulmonary functions in obese adolescent boys. Lung India. 2012;29(3):236–240. https://doi.org/10.4103/0970-2113.99106.
13 Sin DD, Jones RL, Man SF. Obesity is a risk factor for dyspnea but not for airflow obstruction. Arch Intern Med. 2002;162(13):1477–1481. https://doi.org/10.1001/archin-te.162.13.1477.
14 Lian-he ZH. The Status Quo of Vital Capacity of Univer-sity Students and the Trend in Recent ten Years in Shan-dong Province. Modern Prev Med. 2007;34(8):1427–1428 [in Chenese].
15 Group of China Obesity Task Force. [Body mass index reference norm for screening overweight and obesity in Chinese children and adolescents]. Zhonghua Liu Xing Bing Xue Za Zhi. 2004;25(2):97–102. [in Chenese].
16 Roca J, Sanchis J, Agusti-Vidal A, et al. Spirometric refe-rence values from a Mediterranean population. Bull Eur Physiopathol Respir. 1985;22(3):217–224.
17 Bandyopadhyay A. Pulmonary function studies in young

195 Pol ann MeD. 2018;25(2):190–195
healthy Malaysians of Kelantan, Malaysia. Indian J Med Res. 2011;134(5):653–657. https://doi.org/10.4103/0971-5916.90990.
18 Rao M, Sen GA, Saha P, Devi AS. Physiological norms in Indians. Pulmonary capacities in health. Indian J Med Res. 1961;38:1–104.
19 da Costa J. Pulmonary function studies in heal-thy Chinese adults in Singapore. Am Rev Respir Dis. 1971;104(1):128–131.
20 Ali Baig MI, Qureshi RH. Pulmonary function tests: normal values in non-smoking students and staff at the Aga Khan University, Karachi. J Coll Physicians Surg Pak. 2007;17(5):265–268.
21 Collins LC, Hoberty PD, Walker JF, Fletcher EC, Peiris AN. The effect of body fat distribution on pulmonary function tests. Chest. 1995;107(5):1298–1302. https://doi.org/10.1378/chest.107.5.1298.
22 Laviolette L, Sava F, O’Donnell DE, et al. Effect of obe-
sity on constant work rate exercise in hyper inflated men with COPD. BMC Pulm Med. 2010;10:33. https://doi.org/10.1186/1471-2466-10-33.
23 Boren HG, Kory RC, Syner JC. The veterans admini-stration-army cooperative study of pulmonary func-tion: II. The lung volume and its subdivisions in nor-mal men. Am J Med. 1966;41(1):96–114. https://doi.org/10.1016/0002-9343(66)90008-8.
24 Paoletti P, Pistelli G, Fazzi P, et al. Reference values for vital capacity and flow-volume curves from a ge-neral population study. Bull Eur Physiopathol Respir. 1986;22(5):451–459.

196 Pol ann MeD. 2018;25(2):196–202
Original article
Ayoob Rostamzadeh1, Tayyeb Ghadimi2, Azra Allahveisi3, Mohsen Mohammadi4, Shohreh Rezaei5, Mohammad Jafar Rezaie6
1 Department of Anatomy and Neuroscience, Shahrekord University of Medical Sciences, Shahrekord, Iran2 Department of Surgery, Faculty of Medicine, Kurdistan University of Medical Sciences, Kurdistan, Iran
3 Department of Anatomy and Reproductive Biology, Faculty of Medicine, Kurdistan University of Medical Sciences, Sanandaj, Iran4 Department of Pharmaceutical Biotechnology, Faculty of Pharmacy, Lorestan University of Medical Sciences, Khorramabad, Iran
5 Deputy of Research, Kurdistan University of Medical Sciences, Sanandaj, Iran6 Cellular and Molecular Research Center, Department of Anatomical Sciences, Faculty of Medicine, Kurdistan University of Medical Sciences, Sanandaj, Iran
Corresponding author: Mohammad Jafar Rezaie, Cellular and Molecular Research Center, Department of Anatomical Sciences, Faculty of Medicine, Kurdistan University of Medical Sciences, Sanandaj, Iran.
Tel.: +988733664653, Fax: +988716664663. E-mail address: [email protected].
The expression of Bax protein in the early stages of spinal cord injury in the sperm cells of rats
article info
Art ic l e h i s toryReceived 19 April 2017Accepted 11 July 2017Available online 18 June 2018
Keywords SpermatogenesisCell deathBax proteinSpinal cord injuryGerm cells
Doi10.29089/2017.17.00050
User l i cense This work is licensed under a Creative Commons Attribution –NonCommercial – NoDerivatives 4.0 International License.
abstract
Introduct ion: Apoptosis is one of the most important biological processes, which occurs through the activation of intracellular cell death pathway.
Aim: The aim of this study was to determine the pattern of cell death within the early stages of spinal cord injury (SCI) and the evaluation of the changes in Bax protein expression of progressive apoptosis.
Mater ia l and methods : 48 adult male Sprague Dawley rats were randomly divided into two control and experimental groups. Animals were anesthetized and then the laminectomy procedure was performed in the area of T6–8. On days 1, 7, 14 and 28 after the surgery, one-third of the middle part of their testis tissue were taken for histological and immunohistochemical analysis.
Resu l t s : The immunohistochemical analysis indicated the presence of TU-NEL-positive cells and cells containing the pro-apoptotic protein Bax in testicu-lar sperms in the 1st day after SCI, as well as increased on 28 days.
Discuss ion: 1 day after SCI, the apoptosis occurred in testicular sperm lines as well as the apoptosis can be related to Bax protein expression. Therefore in-hibition of caspase activity via caspase cascades-mediated apoptosis may have a protective role in testicular injury during the acute phase of SCI.
Conc lus ions : Our finding suggested that the damage and destruction after SCI can be controlled by therapeutic interventions at the appropriate time before the destructive changes of SCI.
Journal homepage: https://www.paom.pl
Polish Annals of Medicine
197 Pol ann MeD. 2018;25(2):196–202
1. INTRODUCTION
The incidence rate of spinal cord injury (SCI) in most coun-tries is estimated to be between 20 and 40 cases per 1 000 000 annually that it often occurs in young people under the age of 30 years.1 Generally two cellular responses occur to the spinal cord after injury including: primary mechanical in-jury and pathologically-physiologically secondary injury which appears to have two main forms: necrotic and apo-ptotic.2 The first response includes necrotic cell death in-duced by external mechanical damage the most important landmark of which is acute hemorrhage and ischemia, and the secondary response is the activation of the apoptotic death cascade which is mediated by multiple injury process-es including inflammatory cytokines and formation of free radicals.2 The apoptosis is distinguished from necrosis cells by biochemical and morphological characteristics.3 The cel-lular destructions during apoptosis is characterized by cell shrinkage, immune cell transmigration, myelin degradation and chromatin condensation along with fragmentation of the nucleus.4 In the necrosis process, cell swelling and de-struction of mitochondria occurs.5 Recently, apoptosis has been suggested as damage to the nervous system caused by ischemia, neuronal degeneration conditions, inflammatory diseases and traumatic damage.6 B cell leukemia/lympho-ma 2 (Bcl-2) is a gene that play a crucial role in the regula-tion of cell death as well as degree of apoptotic degeneration of neurons so that neuronal cell death is prevented when overexpressed in neurons.7 After SCI, the expression of Bcl-2 can suppress apoptosis in the neurons of the spinal cord by preventing the release of cytochrome c from mitochondria, scavenging the free radicals, and rising the growth factor.7 The Bcl-2 proteins were identified in vertebrate cells using a variety of techniques.8 This family consists of many pro-teins causing increased cell survival, or cell death, such as Bax protein. The Bax protein acts as a reinforcing factor of the cell death in the general apoptosis process that has the opposite role to Bcl-2 to work to stabilize the mitochondrial membrane because its destabilization leads to the release of mitochondrial cytochrome c into the cytoplasm and induc-ing the uncoupling of oxidative phosphorylation.9,10 Fur-thermore, Bax is critically involved in both necrosis and apoptosis, and these two morphologically distinct forms of cell death could be prevented simultaneously by increasing the quantitative ratio of Bcl-xL and Bax in mitochondria.11 Moreover, activation of caspase-3 has been reported to cause apoptotic cell death, and caspase-3 activation is markedly increased following SCI.12
2. AIM
This study was conducted to investigate the testicular sperms’ changes during the early stages of SCI. Therefore, the main objective of the present study was to investigate the apoptosis and Bax protein expression in testicular sperm during the early stages of SCI.
3. MATERIAL AND METHODS
3.1. Animals and ethicsIn this study, 48 adult male Sprague Dawley rats aged 90 days, weighing 250–300 g and pathogen free were used (pur-chased from the Pasteur Institute, Tehran, Iran). The exper-iments were carried out in accordance with the principles of Helsinki protocol. All procedures were approved by the ethical committee of Kurdistan University of Medical Sci-ences, Sanandaj, Iran (IR.MUK.REC.1395.402).
3.2. SCI model and tissue preparationAll animals were randomly divided into experimental and control groups. Animal spinal cord injury (SCI) model was performed under general anesthesia (80 mg/kg ketamine; 10 mg/kg xylazine, i.p.). Briefly, rats were anesthetized under sterile conditions and a laminectomy was performed at T7 to expose the spinal dura mater. The T8 of spinal cord contu-sion was performed using the modified spinal cord impactor device which was developed so that a 25 g metal rod (2.5 mm in diameter) length of 12 mm falls from a 10 cm height.13,14 In the control group, the surgery was performed without spi-nal cord manipulation/contusion. During the postoperative period, all animals were monitored three times daily, were given an analgesic (ketoprofen 2,5 mg/kg; sc twice daily) for 2 days and gentamycin (5 mg/kg; sc) for 4 days to prevent of the bladder infection.15 The Basso, Beattie, Bresnahan (BBB) scoring is used to evaluate hind-limb locomotor function by two observers who were blinded to the any intervention. They were killed at 1, 7, 14 and 28 days after surgery. Surgical and animal care procedures were conducted strictly in accordance with the guidelines published in the NIH Guide for the Care and Use of Laboratory Animals: National Institutes of Health Publications.16 The testis tissues were fixed in a fresh solution of 4% paraformaldehyde (pH 7.4) for 4 h, incubated overnight at 4°C in 100 mM sodium phosphate buffer (pH 7.4).17
3.3. Histological examination and immunohi-stochemical stainingAt the end of the survival period, animals intraperitoneal-ly with a mixture of ketamine (3.75 mg/kg), and xylazine (1.9 mg/kg), were anesthetized and perfused intraventricular with 0.1 mL of heparin (5000 IU/mL), and subsequently tran-scardially with 4% paraformaldehyde in 0.1 M PBS, pH 7.17
Briefly, on the 1st, 7nd, 14th and 28th days after SCI, the peri-toneal cavity of animals were dissected for weighting of testes with digital scale (Sartorius; model-BL210S). The testis tis-sues were prepared in the same fixative at room temperature for 4 h, sectioned and processed for histochemistry and im-munohistochemistry analysis. To determine the histochem-istry of tissues, the hematoxylin (Merck KGaA, Darmstadt, Germany) and eosin (Sigma, St. Louis, MO, USA) were used. In total, 100 seminiferous tubules of each sample were con-ducted in accordance with the Johnsen method (1970).18 For immunohistochemistry and visualization of Bax, endogenous peroxidase activity in the sectioned tissues was blocked with 3% H2O2, and incubated at 4° overnight in PBS, pH 7.4, con-

198 Pol ann MeD. 2018;25(2):196–202
taining 0.01% mouse anti-Bax antibody (sc-7480, Santa Cruz, USA) in blocking buffer (3% goat serum in 1× PBS with 0.2% Tween 20). After rinsing, sections were incubated for 2 h at room temperature in blocking buffer containing anti-goat antibody conjugated to peroxidase (diluted as per the recom-mendations of the supplier; sc-516102, Santa Cruz, USA). Sections were rinsed again and were incubated with the chro-mogen diaminobenzidine (DAB; Sigma, St. Louis, MO) for 5 minutes to yield a permanent deposit. Sections were rinsed in distilled water, then mounted on gelatin-coated slides, air-dried overnight, and cover slipped.
3.4. TUNEL assayAs described previously, the sections were also tested with the terminal deoxynucleotidyl transferase-mediated dUTP nick-end labeling (TUNEL) technique. They were placed in terminal deoxynucleotidyl transferase (TdT) buffer (containing 50 μM dUTP-biotin, 100 μM dATP, 10 mM Tris-HCl, pH 8.0, 1 mM EDTA, pH 7.6; Invitrogen, Carls-bad, CA) for 30 minutes followed by reaction with a TdT reaction mixture (consisting in equilibration buffer, bioti-nylated nucleotide mix and TdT enzyme) and incubated in a humidified chamber at 37°C for 90 minutes. The sections were rinsed two times in buffer solution (150 mM sodium chloride, 15 mM sodium citrate, pH 7.4) for 10 minutes fol-lowed by washing in PBS (pH 7.4) two times for 10 minutes. The avidin–biotin technique was applied, and stained with chromogen diaminobenzidine (DAB) solution. After coun-terstaining with hematoxylin (0.5%), slides were dehydrated and mounted. TUNEL-positive (TUNEL+) cells (%) were quantified as apoptotic index and it was characterized by the core of TUNEL+ cells was brown in appearance.19
3.5. Statistical analysisAll statistical analyses were performed using the SPSS soft-ware (v.19, SPSS Inc., Chicago, IL, USA) using t-test. Dif-ferences were considered as significant at P < 0.05.
4. RESULTS
4.1. Johnsen scoring In this study the rate of spermatogenesis in the control and experimental groups were evaluated. All cases were ranked ac-cording to the Johnsen scoring system categories as shown in
Table 1. The quantitative results showed that in the control group the average total score (as score 10) spermatogenesis was 98.6%. Following the experimental groups as ‘one day after SCI’ group, ‘one week after SCI’ group, ‘two weeks af-ter SCI’ group and ‘four weeks after SCI’ group were 74.5%, 53.3%, 11.2% and 0%, respectively. Therefore the rate of sper-matogenesis in four weeks after SCI group was significantly decreased (P = 0.0027).
4.2. Histological examinationIn the histological sections of control group, testicular pa-renchyma consisted of seminiferous tubules which appeared rounded or oval in shape with regular contour as well as sper-matogenesis was observed in all seminiferous tubules. There-fore, there was no evidence of irregularities in spermatogen-esis or degenerative changes in seminiferous tubules and the interstitial connective tissue. Finally, histological evalua-tions reveal normal architecture of the spermatogenic cells at various stages of development (Figure 1). One day after SCI in the experimental group, the shape of seminiferous tu-bules was regular and round with external border. Also, the spermatogonia cells, primary spermatocytes and round sper-matid, often exhibited quite condensed nuclei. Furthermore, the spermatogenesis in most of the seminiferous tubules were more 90% and a few evidence of seminiferous tubule degeneration were observed. But, vasculature and increased number of inflammatory cells was observed in the interstitial connective tissue (Figure 2). One week after SCI, the irregu-lar outline of the seminiferous tubules was observed as well as thickened and irregular basement membrane. Also a sign of degeneration, vacuolated cytoplasm and pyknotic nuclei was observed in the spermatogenic cells in some seminifer-ous tubules. On histological examination of spermatogonial cells, the primary spermatocyte, round spermatid and sperm were observed (Figure 3). Two weeks after SCI, in the experi-mental group, the seminiferous tubules basement membrane of tubules was slightly corrugated. In the histological study, a degeneration of epithelial lineage, thick corrugated base-ment membrane and absence of well-organized elongated spermatids was observed. Furthermore, results showed evi-dence of spermatogenesis in 83% of the seminiferous tubules and the other tubules. Illustrations show evidence of degen-erative changes including disorganization of seminiferous tubule and heterochromatin of nucleus in spermatogonia, primary spermatocyte and round spermatocyte germ cells.
GroupsJohnsen scores
1 2 3 4 5 6 7 8 9 10
Control group 1.4 98.6
Experimental group
One week after SCI 25.5 74.5
One week after SCI 20.3 37.4 53.3
Two weeks after SCI 18.4 46.6 23.8 11.2
Four weeks after SCI 20.5 23.5 34.4 13.9 6.6 2.1
Table 1. Rating seminiferous tubules in both control and experimental groups according to Johnsen classification (results are presented as a percentages).

199 Pol ann MeD. 2018;25(2):196–202
Figure 1. Control group: A) spermatogenesis in all of the seminiferous tubules without any degeneration (HE staining); B) TUNEL assay (Bax protein expression) and C) TUNEL+ and Bax+ cells in the entire spermatogenic cell lines in the seminiferous tubules (Bax protein expression).
Figure 2. Experimental group one day after SCI: A) regular and round seminiferous tubules, dense core of primary spermatocyte and round spermatid (HE staining); B) TUNEL assay (Bax protein expression) and C) the testis of experimental group stained with TUNEL (Bax protein expression). Some of the TUNEL+ and Bax+ sperm cells were observed with brown core. Especially, most of these cells were in the lines of spermatocytes and round spermatids.
Figure 3. Experimental group one week after SCI: A) seminiferous tubules with irregular basement membrane (HE staining); B) TUNEL assay (Bax protein expression) and C) some of the TUNEL+ and Bax+ cells in the lines of sper-matocytes, round, and long spermatids (Bax protein expression).
Figure 4. Experimental group two weeks after SCI: A) seminiferous tubules with regular shaped, but irregular base-ment membrane (HE staining). Also, stopping spermatogenesis trend and unstructured sperm cells was observed in some seminiferous tubules; B) TUNEL assay (Bax protein expression) and C) lines of spermatocytes, round and long spermatids with brown cytoplasm (Bax protein expression).

200 Pol ann MeD. 2018;25(2):196–202
There were gaps between spermatogonia, primary spermato-cytes and round spermatid. The spermatogenic cells are less closely arrayed, and some of the spermatogenic cells desqua-mate. Moreover, spermatogonial cells, primary spermato-cyte, and round spermatid were detected, but a small number of sperm was found (Figure 4). Four weeks after SCI in the experimental group, the seminiferous tubules were quite ir-regular and there was a shrunken basement membrane with relatively thick as well as abnormal cellular debris in the tubules. Also a failure and disruption was observed in the trend of spermatogenesis in all seminiferous tubules as sper-matogenesis in 55% of the seminiferous tubules were found. In addition, the other tubules often exhibited degenerative changes such as partial regression of the seminiferous epi-thelium due to the absence of proliferating spermatogonia and other spermatogenic cell (Figure 5).
4.3. The TUNEL technique and expression of the Bax proteinIn control group TUNEL-positive (TUNEL+) and Bax-positive (Bax+) sperm cells were rarely observed (Figure 1 and Table 2). The immunohistochemical results one day after SCI in the experimental group showed that most of TUNEL+ and Bax+ cells were found in the spermatogonial and primary spermatocyte series, as these cells were espe-
cially in the line of round spermatid and sperm. There was no statistically significant difference in the TUNEL+ and Bax+ cells at one day after SCI when compared to control group (P = 0.073 and P = 0.067, respectively) (Table 2 and Figure 2). In contrast the differences at 7 days after SCI were statistically significant (P = 0.014 and P = 0.019, respec-tively) and the TUNEL+ and Bax+ cells has significantly increased. Most of these cells were spermatogenic cell lines including round spermatid and spermatozoa. Results of 1 week after SCI showed more TUNEL+ and Bax+ cells com-pared to 1 day SCI group. Most of TUNEL+ and Bax+ cell were in the spermatogonial and primary spermatocyte se-ries. TUNEL+ and Bax+ cells for this group are represented in Table 2 and Figure 3. In 14 days after SCI in experimental group, the results show that the TUNEL+ and Bax+ cells has significantly increased when compared to control group (P = 0.0055 and P = 0.0072, respectively). Furthermore, a significant increase was observed when we compared this group with days 1 and 7 after SCI (Table 2). The TUNEL+ and Bax+ cells were significantly elevated in all of the sper-matogenic series cells in the seminiferous tubules including spermatogonia primary spermatocyte, round spermatid and spermatozoa (Figure 4 and Table 2). There was no signifi-cant increase in the TUNEL+ and Bax+ cells at 28 days after SCI group compared to the control group. In contrast, a sig-
Figure 5. Experimental group four weeks after the SCI: A) the testis tissues that epithelium atrophy in some semini-ferous tubules (HE staining); B) TUNEL assay (Bax protein expression) and C) the testis tissue which TUNEL+ and Bax+ in the line of spermatogonia cells with brown cytoplasm (Bax protein expression).
Days GroupsParameters
TUNEL+ Bax+
One day Control 2.85 ± 0.04 P = 0.073 2.97 ± 0.41 P = 0.067
SCI 11.95 ± 0.53 14.81 ± 0.09
One week Control 2.91 ± 0.28 P = 0.014a 3.28 ± 0.61 P = 0.019
SCI 16.32 ± 1.04 19.32 ± 1.35
Two weeks Control 2.01 ± 0.02 P = 0.0055b,c 3.7 ± 0.16 P = 0.0072
SCI 22.28 ± 0.73 24.3 ± 0.62
Four weeks Control 2.85 ± 0.07 P = 0.072d 3.63 ± 0.13 P = 0.081
SCI 8.95 ± 0.15 10.58 ± 0.3
Comments: a P ≤ 0.022 vs. one day group; b P ≤ 0.009 vs. one day group; c P ≤ 0.014 vs. one week group; d P ≤ 0.006 vs. one week group.
Table 2. Number of Bax+ cells and TUNEL+ cells in both experimental and control groups.

201 Pol ann MeD. 2018;25(2):196–202
nificant decrease in TUNEL+ and Bax+ cells was seen when compared with the 14 days after SCI group (P = 0.006) (Ta-ble 2), the TUNEL+ and Bax+ cells were observed in line of spermatogonial cells, and primary spermatocyte (Figure 5).
5. DISCUSSION
The availability of suitable mouse models for the study of sperm cell apoptosis has a key role in the understanding of the process during the early stages of the SCI in the semi-niferous tubules.20 In this regard, cell apoptosis and Bax protein expression were studied after SCI in the early stages of testicular sperms. Results showed that one day after SCI in the testis tissues of experimental group the morphology of seminiferous tubules were regular and round with ex-ternal border and regular basement membrane. Moreover, the results of the histological examination showed that the core of spermatogonial cells in the primary spermatocyte and round spermatid were dense. However, one day after SCI, the basement membrane was irregular. Also, the core of spermatogonial cells, primary spermatocyte and round spermatid were dense. These results could be attributed to the variation in the testicular temperature. This may be due to a disorder which may occur in the temperature of the testis after SCI, which is caused by denervation.21 On the other hand, Chow et al. (2002) reported that the disorders of producing spermatogenesis after SCI in the longterm were not related to the etiology of endocrine chronic SCI. They showed that the neurological disorders, particularly in su-perior spermatic nerve (SSN) can cause alteration and arrest in the spermatogenesis after SCI.22 In another study, Patki et al. (2008) reported that the quality of semen in men with SCI was poor, and these changes were observed in two weeks after SCI.23 It should be noted that the initial variations in the acute period of the SCI may be due to hormonal imbal-ance.21 According to the histological examination, an ir-regularity was observed in the trend of spermatogonial cells distribution one week after SCI. Moreover, after two weeks, cessation in the spermatogenesis trend and unstructured sperm cells were observed in some seminiferous tubules. In addition, cessation of spermatogenesis trend, unstruc-tured sperm cells and epithelium atrophy were observed in some seminiferous tubules after four weeks of SCI. Moreo-ver, the core of spermatogonial cells, primary spermatocyte, and round spermatid were dense. Also, eosinophilic masses were in different sperm categories. Therefore, the changes in the produced spermatogenesis increased over time. This result is consistent with the results of previous studies;22,24,25 bearing in mind that the increased rate of aneuploidy for sperm with fragmented DNA was related to the occurrence of aneuploidy during sperm maturation, thereby TUNEL assay was widely used to identify apoptotic cells in the tissue sections. Chohan et al. (2006), it has been reported that the TUNEL assay is an accurate method for quantifying apop-tosis in the germ cells.26 In the present study the TUNEL as-say was used for the study of sperm cells after SCI during the
experiments. Results obtained indicated that one day after SCI, some TUNEL+ sperm cells were observed with brown core. Especially, most of these cells were in the category of spermatocytes and round spermatids. This trend was also observed one week after SCI, and most of the observed cells were in the category of spermatocytes, round and long sper-matids. Moreover, results showed that in those two weeks after SCI the cytoplasm of sperm cells were also brown. Four weeks after SCI, Bax+ sperm cells were observed with brown cytoplasm, especially, the cells were in the category of sper-matogonia. Therefore, the results concluded that the round cells increased over time after SCI, and after four weeks, long cells appeared as well. Previous studies have reported that the increase of round cells may be related to the response of body round cells to changes in sperm parameters after SCI, such as white blood cells.27 Meanwhile, in a similar study Hirsch et al. (1999) reported that the morphology of sperm cells obtained from the epididymis changed between 2 to 12 weeks after SCI.21. Furthermore, caspase are a group of cysteine proteases and key effectors of apoptotic cell death. The caspase-3 is the principal effector whose activation has been implicated in the prevention of apoptotic cell death and its down-regulation in disease conditions leading to ne-crosis. Sperm count reduction in SCI rats observed in the present study appears to be due to the inhibitory action of SCI on spermatogenesis, including spermatogenic arrest and reduced spermatogenic cell number which is in accord-ance with previous studies. Also, the lesion surrounding the spinal cord cascades a series of inflammatory changes within the spinal cord tissue leading to diminutive effects on neuronal conduction homeostasis and integrity. This phenomenon follows a biphasic pattern. TNF-α could po-tentiate glutamate-mediated neuronal cell death in the rat spinal cord.
6. CONCLUSIONS
Our data revealed that degenerative changes occurs in the germinal cells in testicular seminiferous tubules during acute phase of SCI. Some of the degenerative cells exhibit morphological features of Bax-dependent apoptosis as well as the increase in Bax protein expression. The evaluation of Bax protein expression of SCI could be important for prog-nostic outcome. Therefore, suggest that the inhibition of caspase activity may play a protective role in the testicular atrophy through acute phase of SCI.
Conflict of interestThe authors declare no conflict of interest.
AcknowledgmentsAuthors would like to thank personnel of deputy of research and lab staffs in Kurdistan University of Medical Sciences, Sanandaj, Iran for their technical and assistant support.

202 Pol ann MeD. 2018;25(2):196–202
References 1 Wyndaele M, Wyndaele J-J. Incidence, prevalence and epi-
demiology of spinal cord injury: what learns a worldwide literature survey? Spinal Cord. 2006;44(9):523–529. https://doi.org/10.1038/sj.sc.3101893.
2 Beattie MS, Hermann GE, Rogers RC, Bresnahan JC. Cell de-ath in models of spinal cord injury. Prog Brain Res. 2002;137: 37–47. https://doi.org/10.1016/S0079-6123(02)37006-7.
3 Shimada K, Crother TR, Karlin J, et al. Oxidized mito-chondrial DNA activates the NLRP3 inflammasome du-ring apoptosis. Immunity. 2012;36(3):401–414. https://doi.org/10.1016/j.immuni.2012.01.009.
4 Caruso RA, Fedele F, Rigoli L, et al. Apoptotic-like tumor cells and apoptotic neutrophils in mitochondrion-rich gastric adenocarcinomas: a comparative study with light and electron microscopy between these two forms of cell death. Rare Tu-mors. 2013;5(2):68–71. https://doi.org/10.4081/rt.2013.e18.
5 Xie Y, Li Q, Yang Q, et al. Overexpression of DCF1 inhibits glioma through destruction of mitochondria and activation of apoptosis pathway. Scientific Rep. 2014;4:3702. https://doi.org/10.1038/srep03702.
6 Burda JE, Sofroniew MV. Reactive gliosis and the multicellu-lar response to CNS damage and disease. Neuron. 2014;81(2): 229–248. https://doi.org/10.1016/j.neuron.2013.12.034.
7 Wang Y, Sun Z, Zhang K, Xu G, Li G. Bcl-2 in suppressing neuronal apoptosis after spinal cord injury. World J Emerg Med. 2011;2(1):38–44.
8 Levkovitch-Verbin H, Waserzoog Y, Vander S, Makarovsky D, Ilia P. Minocycline mechanism of neuroprotection invo-lves the Bcl-2 gene family in optic nerve transection. Int J Neurosci. 2014;124(10):755–761. https://doi.org/10.3109/00207454.2013.878340.
9 Ashkenazi A, Salvesen G. Regulated cell death: signaling and mechanisms. Annu Rev Cell Dev Biol. 2014;30:337–356. https://doi.org/10.1146/annurev-cellbio-100913-013226.
10 Tiraihi T, Rezaie MJ. Apoptosis onset and Bax protein di-stribution in spinal motoneurons of newborn rats following sciatic nerve axotomy. Int J Neurosci. 2003;113(9):1163–1175. https://doi.org/10.1080/00207450390212311.
11 Elmore S. Apoptosis: a review of programmed cell de-ath. Toxicol Pathol. 2007;35(4):495–516. https://doi.org/10.1080/01926230701320337.
12 Snigdha S, Smith ED, Prieto GA, Cotman CW. Caspase-3 ac-tivation as a bifurcation point between plasticity and cell de-ath. Neurosci Bull. 2012;28(1):14–24. https://doi.org/10.1007/s12264-012-1057-5.
13 Miranpuri GS, Meethal SV, Sampene E, et al. Folic Acid Modulates Matrix Metalloproteinase-2 Expression, Allevia-tes Neuropathic Pain, and Improves Functional Recovery in Spinal Cord-Injured Rats. Ann Neurosci. 2017;24:74–81. https://doi.org/10.1159/000475896.
14 Cramer SW, Baggott C, Cain J, et al. The role of cation--dependent chloride transporters in neuropathic pain fol-lowing spinal cord injury. Mol Pain. 2008;4:36. https://doi.org/10.1186/1744-8069-4-36.
15 Basso DM, Beattie MS, Bresnahan JC. A sensitive and reliable locomotor rating scale for open field testing in rats. J Neurotrau-ma. 1995;12(1):1–21. https://doi.org/10.1089/neu.1995.12.1.
16 National Research Council. Committee for the Update of the Guide for the Care and Use of Laboratory Animals. Gu-ide for the Care and Use of Laboratory Animals. Eight Edition. Washington: The National Academiess Press. 2011. https://grants.nih.gov/grants/olaw/guide-for-the-care-and-use-of--laboratory-animals.pdf. Accessed June 5, 2018.
17 Poon PC, Gupta D, Shoichet MS, Tator CH. Clip compres-sion model is useful for thoracic spinal cord injuries: histolo-gic and functional correlates. Spine. 2007;32(25):2853–2859. https://doi.org/10.1097/BRS.0b013e31815b7e6b.
18 Johnsen SG. Testicular biopsy score count–a method for registration of spermatogenesis in human testes: normal values and results in 335 hypogonadal males. Hormones. 1970;1(1):2–25. https://doi.org/10.1159/000178170.
19 Nasimi P, Vahdati A, Tabandeh M, Khatamsaz S. Cytopro-tective and anti-apoptotic effects of Satureja khuzestanica essential oil against busulfan-mediated sperm damage and seminiferous tubules destruction in adult male mice. Andro-logia. 2016;48(1):74–81. https://doi.org/10.1111/and.12421.
20 Knudson CM, Tung KS, Tourtellotte WG, Brown GA, Kor-smeyer SJ. Bax-deficient mice with lymphoid hyperplasia and male germ cell death. Science. 1995;270(5233):96–99. https://doi.org/10.1126/science.270.5233.96.
21 Hirsch IH, Huang B, Chancellor MB, et al. Spermatogenesis in early and chronic phases of experimental spinal cord inju-ry in the rodent model. J Androl. 1999;20(1):63–71.
22 Chow S-H, Giglio W, Anesetti R, Ottenweller JE, Pogach LM, Huang HF. The effects of testicular denervation on spermatogenesis in the Sprague-Dawley rat. Neuroendocrino-logy. 2000;72(1):37–45. https://doi.org/10.1159/000054569.
23 Patki P, Woodhouse J, Hamid R, Craggs M, Shah J. Effects of spinal cord injury on semen parameters. J Spinal Cord Med. 2008;31(1):27–32. https://doi.org/10.1080/10790268.2008.11753977.
24 Ohl DA, Sønksen J, Wedemeyer G, et al. Canine model of in-fertility after spinal cord injury: time course of acute changes in semen quality and spermatogenesis. J Urol. 2001;166(3): 1181–1184. https://doi.org/10.1016/S0022-5347(05)65942-3.
25 Muriel L, Goyanes V, Segrelles E, Gosálvez J, Alvarez JG, Fer-nández JL. Increased aneuploidy rate in sperm with fragmen-ted DNA as determined by the sperm chromatin dispersion (SCD) test and FISH analysis. J Androl. 2007;28(1):38–49. https://doi.org/10.2164/jandrol.106.000067.
26 Chohan KR, Griffin JT, Lafromboise M, Jonge CJ, Carrell DT. Comparison of chromatin assays for DNA fragmenta-tion evaluation in human sperm. J Androl. 2006;27(1):53–59. https://doi.org/10.2164/jandrol.05068.
27 Billups K, Tillman S, Chang T. Reduction of epididymal sperm motility after ablation of the inferior mesenteric ple-xus in the rat. Fertil Steril. 1990;53(6):1076–1082. https://doi.org/10.1016/S0015-0282(16)53589-4.

203 Pol ann MeD. 2018;25(2):203–206
Original article
Samaneh Rahimi1, Afra Khosravi2, Sanaz Aazami3
1 Faculty of Medicine, Ilam University of Medical Sciences, Ilam, Iran2 Department of Immunology, Faculty of Medicine, Ilam University of Medical Sciences, Ilam, Iran
3 Department of Nursing, Faculty of Nursing and Midwifery, Ilam University of Medical Sciences, Ilam, Iran
Corresponding author: Afra Khosravi, Department of Immunology, Faculty of Medicine, Ilam University of Medical Science, Banganjab, Ilam, Iran. Tel.: +988432222404, Mobile: +989126223958.
E-mail address: [email protected].
Effect of smoking on cyanide, IL-2 and IFN-γ levels in saliva of smokers and nonsmokers
article info
Art ic l e h i s toryReceived 29 June 2017Accepted 3 November 2017Available online 27 June 2018
Keywords SmokingInterleukin-2 IFN-γSalivaCyanide
Doi10.29089/2017.17.00053
User l i cense This work is licensed under a Creative Commons Attribution –NonCommercial – NoDerivatives 4.0 International License.
abstract
Introduct ion: Tobacco use is widely spread throughout the world. Smoking has several adverse effects on human health ranging from minor health condi-tions to death.
Aim: This study aimed to investigate effect of smoking on level of saliva cyani-de, interleukin-2 (IL-2) and interferon-gamma (IFN-γ) among smokers compa-red to nonsmokers in the city of Ilam, Iran.
Mater ia l and methods : This study was carried out among two equal groups of smokers as cases and nonsmokers as controls (N = 76) which were matched in terms of their age range. Dental roll and direct saliva method were used to collect samples. The saliva sample was stored at –18°C. The level of salivary cyanide was measured using the spectrophotometric method. IL-2 and IFN-γ were measured by ELISA.
Resu l t s and d i scuss ion: We found level of cyanide in the saliva of smokers was higher than that in nonsmokers. In addition, level of cyanide in the smokers’ saliva increased (164.21 ± 18.54 µg/mL) significantly compared to nonsmokers (42.63 ± 24.01 µg/mL). A significant increase was found in the level of IFN-γ and IL-2 among smokers compared to nonsmokers. However, there was a significant decrease in the level of IFN-γ and IL-2 with increased intensity of smoking.
Conc lus ions : Heavy smoking was associated with an increased level of saliva-ry cyanide and a decreased level of sera IFN-γ. Recognizing immunosuppression mechanisms produced by cigarette-smoking is a platform for identifying the best therapeutic and management approaches in smoke-induced diseases.
Journal homepage: https://www.paom.pl
Polish Annals of Medicine

204 Pol ann MeD. 2018;25(2):203–206
1. INTRODUCTION
Cigarette smoking is the main risk factor for the accelerated decline in lung function and development of chronic obstruc-tive pulmonary disease. Smoking is one of the most frequent addictions. Smoking cigarettes decreases blood flow to the extremities due to the increased peripheral vasoconstriction, especially relating to digital and forearm hemodynamics.1 Moreover, cigarette smoking generates many toxic and carci-nogenic compounds harmful to the health, such as nicotine, nitrogen oxides, carbon monoxide, hydrogen cyanide and free radicals.2,3 Smoking affects a wide range of immunologi-cal functions in humans and experimental animals, including both the humoral and cell-mediated immune responses.
Immunosuppression effects of smoking depend on the amount and duration of smoke exposure, ethnic back-ground, and gender. It is postulated that this increased susceptibility reflects cigarette smoke-induced impairment of the immune system.4 It has been postulated that smoke may impair host defense by exhausting the signaling path-ways upon which lymphocyte antigen receptors rely.
Cyanide ion is naturally present in saliva, urine, and blood serum and its concentration varies according to diet, among other factors.4 Cyanide is considered to be a bio-marker in distinguishing smokers from nonsmokers. Cya-nide is a potent toxic agent which inhibits the activity of cytochrome oxidase.5,6
There is no evidence on the exact amount of cyanide and thiocyanate in the human’s saliva and no reference val-ue has been reported for salivary cyanide. A previous study7 indicated that denaturation of oxyhemoglobin produces cy-anide from thiocyanate and that active oxygen scavenge re-agents suppressed cyanide production. Chronic inhalation of cyanide alters a wide range of immunological functions, including innate and adaptive immune responses. It has been speculated that several health consequences of chron-ic cyanide inhalation might be due to adverse effects on the immune system.8–10 Late 1960s was the first time that possi-ble relationship was found between elevated occurrence of diseases related to cyanide and smoke-induced changes in the immune and inflammatory processes.11 Cytokines are kind of proteins that are secreted by different cells and per-form paracrine, endocrine and even autocrine functions. Cytokines can relatively penetrate into blood-brain barrier and bind to receptors of neurons and glial cells. Further-more, cytokines have the capacity to be produced inside the central nervous system.
Smoking suppresses alveolar macrophage and T cells function.11,12 Immune cells communicate with each other via cell–cell interactions and production of cytokines which act through specific receptors expressed on the tar-get cell membrane.11 It has been shown that cigarette smok-ing decreases cytokines levels, except IgE which is signifi-cantly elevated in smokers.13 Interferon-gamma (IFN-γ) dimerized soluble cytokine which is the sole member of type II IFNs.14 IFN-γ is produced predominantly by natu-ral killer cells as a part of the innate immune response.15
Interleukin-2 (IL-2) is a type of cytokine signaling mol-ecule in the immune system. Additionally, IL-2 promotes the differentiation of T cells into effector T cells. It has also been shown that the production of IL-1β, IL-2, IFN-γ, and tumor necrosis factor-α (TNF-α) in human peripheral blood is suppressed by cigarette smoke extracts.16 Previous studies demonstrated that cigarette smoking suppresses the production of IL-1β, IL-6, and TNF-α by alveolar mac-rophages obtained from the bronchoalveolar lavage fluids of smokers.17,18 In the current study, authors investigated the effect of smoking on level of saliva cyanide, IL-2 and IFN-γ among smokers compared to nonsmokers.
2. AIM
This study aimed to investigate effect of smoking on level of saliva cyanide, IL-2 and IFN-γ among smokers compared to nonsmokers in the city of Ilam, Iran.
3. MATERIAL AND METHODS
In this case-control study, cases (n = 38) were male smok-ers and controls (n = 38) were aged matched nonsmokers. Out of 38 controls 21 were female while, 17 were male. This study was approved by ethics committee of Ilam University of Medical Science. Participants signed a written consent form prior to data collection. Subjects included into this study did not suffer from any serious health condition, had no history of drug usage and had no history of blood dona-tion as well as transfusion in the past 6 months. The clinical data, medical history and other relevant information were collected from subjects by face to face interview. Samples were prepared by two methods: dental roll and direct saliva method. The saliva sample were stored at –18°C.
3.1. Determination of salivary cyanideSample sera in an amount of 0.1 mL of was added to 0.1 mL of kit standardized solution, incubated for 90 minutes at 37°C. Plates were washed 3 times in TBS. 0.1 mL of bioti-nylated antihuman antibody was added and incubated for 60 minutes at 37°C. Plates were washed 3 times in TBS fol-lowed by adding 0.1 mL of ABP solution incubating for 30 minutes. After 5 times washing, 0.9 mL of ABP solution was added incubating for 30 minutes at 37°C. Stop solution in an amount of 0.1 mL was added to each sample and sample OD was measured using ELISA reader. The levels of salivary cyanide were measured using spectrophotometric method.
3.2. Cytokine measurementsSalivary concentrations of IL-2 and IFN-γ in all samples were measured by commercial ELISA kit (Booster Com-pany) in accordance with the manufacturer’s instructions. Salivary IL-2 and IFN-γ levels (µg/mL) in each sample were calculated using a standard curve obtained from calibrators in the kit.

205 Pol ann MeD. 2018;25(2):203–206
4. RESULTS
Mean age of smokers were 32.71 ± 7.52 years old and mean age of nonsmokers were 29.79 ± 9.72 years old. The level of cyanide in the salvia of smokers was significantly higher (164.21 ± 18.54 µg/mL) than that in nonsmokers (42.63 ± 24.01 µg/mL) (Table). A significant increase of total IL-2 level was recorded in smokers (31.34 ± 76.75 µg/mL) when compared to controls (8 ± 0.46 µg/mL) (Table). The inten-sity of smoking was further categorized into light, moder-ate and heavy smoker. It was shown that level of total IL-2 among light smokers (mean 30.75, SD 15.32) was higher than that among heavy smokers (mean 10.57, SD 4.4). Our find-ings also showed that level of IFN-γ was significantly higher among smoker (13.16 ± 12 µg/mL) compared to nonsmokers (2.62 ± 1.21 µg/mL) (Table). It was shown that level of total IL-2 among light smoker (mean 16.6, SD 14.73) was higher than that among heavy smokers (mean 8.05, SD 7.92).
5. DISCUSSION
This study revealed a significant increase in salivary cya-nide and decrease in IFN-γ and IL-2 among smokers. Smoking is associated with both release and inhibition of pro-inflammatory and anti-inflammatory mediators. A large network of pulmonary and systemic cytokines is involved in chronic inflammation of smokers. Cigarette smoke induces the release of TNF-α, TNF-α receptors, IL-1, IL-6, IL-8 and granulocyte-macrophage colony-stimulating factor (GM-CSF). On the other hand, smoking has also been associated with decreased IL-6 production through toll-like receptors (TLR)-2 and, decreased IL-10 production via TLR-2 acti-vation and also decreased IL-1b, IL-2, TNF-a, and IFN-g production by mononuclear cells. The inhibitory effects of cigarette smoking have been attributed to nicotine, hydro-quinone and to carbon monoxide in the smoke. Klein et al.19 found that exposure to cigarette caused 70% loss of enzyme activity and increased the salivary cyanide concentration. Understanding the possible effect of cigarette smoking on variety of immune responses would be beneficial to evaluate the interactions between these factors.
Cytokines are known to play an important role in the immune response to infections. Alveolar macrophages in smokers, discharge significantly lower amount of IL-1, IL-6, and TNF-α compared to nonsmokers.20 Cigarette smoke may affect immune responses by altering the Th1 and Th2 ratio. In fact, cigarette smoke-associated airway hyperactiv-ity is believed to be a Th2-driven disorder. Cytokines such
as IFN-γ and IL-2 are produced by Th1 cells, the presence of IFN-γ and IL-2 in the smokers is indicative of cell mediated immune response. In our study, we found that smoke expo-sure can have an impact on immune responses. In addition, our data showed that, in smokers, the concentration of sa-liva cyanide is affected by the amount and period of smoking. Cigarette smoking has been shown to suppress the mitogenic responses and the production of IL-1β, IL-6 and TNF-α by alveolar macrophages.21,22 However, little is known about the nature of the immunosuppressive compounds in the cigarette smoke. Decreased serum IL-1, IL-2, and TNF-α have been observed in patients with lung cancer, and decreased levels of IFN-γ are associated with shorter survival.23 In addition, IL-2 alone or in combination with other therapies can enhance antitumor immunity.24,25 Transfection of tumor cells with the genes encoding IL-2 and IFN-γ induces a marked increase in antitumor cytotoxic T-cell activity and tumor destruction. These studies provide strong evidence that the production of IL-1, TNF-α, IL-2, and IFN-γ are critical for antitumor im-munity, and suppression of these cytokines by components of cigarette smoke may increase the risk of infection, lung cancer, and other malignancies. Some studies suggested that smoking might decrease IFN-γ and IL-2.26,27 In contrast, an-other study revealed that exposure to smoke also appears to increase both IFN-γ and IL-2 levels.28,29
It was also shown that Th1 has decreased production of IFN-γ in smokers compared to nonsmoker.30–32 Thus, smok-ing can alter the balance of cytokines produced by T helper cells. These studies have provided some strong evidence that the production of IL-2 and IFN-γ are critical for im-mune responses and suppression of these cytokines by com-ponents of cigarette smoke (cyanide) may increase the risk of infection and lung cancer. It has been shown that expo-sure to cigarette smoke inhibits the function of circulatory dendritic cells which specifically inhibit key Th1 cytokine production and triggers development of Th2 responses.
6. CONCLUSIONS
Findings of the current study showed that cyanide level in saliva and IL-2 and IFN-γ levels in the sera of smokers were significantly higher compared to nonsmokers. Fur-thermore, it was revealed that a heavy smoking led to an increased level of salivary cyanide and a decreased level of sera IFN-γ. Such changes in cytokine levels can be attrib-uted to different components of cigarette such as cyanide and its derivatives. As cyanide is a toxic agent and its impact on immune system is confirmed according to these results, further studies are needed to evaluate the exact mechanism behind this interference of cigarette and its derivatives such as cyanide and the immune system response.
AcknowledgementsWe would like to thank the Ilam University of Medical Sci-ence for supporting this study.
Table. Mean (± SE) of effect of cigarette smoke on IFN-γ, cyanide and IL-2 in saliva of smokers and nonsmokers.
P value Smoker Control Parameters
0.000 13.16 ± 12 2.62 ± 1.21 IFN-γ, µg/mL
0.003 31.34 ± 76.75 8 ± 0.46 IL-2, µg/mL
0.002 164.21 ± 18.54 42.63 ± 24.01 Cyanide, µg/mL

206 Pol ann MeD. 2018;25(2):203–206
References 1 Bornmyr S, Svensson H. Thermography and laser‐Doppler
flowmetry for monitoring changes in finger skin blood flow upon cigarette smoking. Clin Physiol. 1991;11(2):135–141. https://doi.org/10.1111/j.1475-097X.1991.tb00106.x.
2 Hoffmann D, Hoffmann I, El-Bayoumy K. The less harm-ful cigarette: a controversial issue. A tribute to Ernst L. Wynder. Chem Res Toxicol. 2001;14(7):767–790. https://doi.org/10.1021/tx000260u.
3 Koc-Gąska M. Diagnostic pitfalls of tobacco smoking: The effect of nicotine addiction on the oral cavity – Literature re-view. Pol Ann Med. 2013;20:56–61. https://doi.org/10.1016/j.poamed.2013.02.001.
4 Kalra R, Singh SP, Savage SM, Finch GL, Sopori ML. Ef-fects of cigarette smoke on immune response: chronic expo-sure to cigarette smoke impairs antigen-mediated signaling in T cells and depletes IP3-sensitive Ca2+ stores. J. Pharma-col Exp Ther. 2000;293(1):166–171.
5 Hovinen J, Lahti M, Vilpo J. Spectrophotometric deter-mination of thiocyanate in human saliva. J Chem Educ. 1999;76(9):1281. https://doi.org/10.1021/ed076p1281.
6 Tsuge K, Kataoka M, Seto Y. Cyanide and thiocyanate levels in blood and saliva of healthy adult volunteers. J Health Sci. 2000;46(5):343–350. https://doi.org/10.1248/jhs.46.343.
7 Seto Y. Oxidative conversion of thiocyanate to cyanide by oxy-hemoglobin during acid denaturation. Arch Biochem Biophys. 1995;321(1):245–254. https://doi.org/10.1006/abbi.1995.1392.
8 Kalburgi CV, Naik KL, Kokatnur MV, Warad S. Estimation and correlation of salivary thiocyanate levels in healthy and different forms of tobacco users having chronic periodonti-tis: A cross-sectional biochemical study. Contemp Clin Dent. 2014;5(2):182–186. https://doi.org/10.4103/0976-237X.132312.
9 Hegde S, Chatterjee E, Rajesh K, Kumar MA. Estimation and correlation of salivary thiocyanate levels in periodontally healthy subjects, smokers, nonsmokers, and gutka-chewers with chronic periodontitis. Indian J Dent Res. 2016;27(1): 12–14. https://doi.org/10.4103/0970-9290.179807.
10 Aggarwal A, Keluskar V, Goyal R, Dahiya P. Salivary thiocy-anate: a biochemical indicator of cigarette smoking in ado-lescents. Oral Health Prev Dent. 2013;11(3):221–227.
11 Sopori ML, Kozak W. Immunomodulatory effects of ciga-rette smoke. J Neuroimmunol. 1998;83(1–2):148–156. https://doi.org/10.1016/S0165-5728(97)00231-2.
12 Chang JC, Distler SG, Kaplan AM. Tobacco smoke suppresses T cells but not antigen-presenting cells in the lung-associated lymph nodes. Toxicol Appl Pharmacol. 1990;102(3):514–523. https://doi.org/10.1016/0041-008X(90)90046-W.
13 Burrows B, Halonen M, Barbee R, Lebowitz M. The rela-tionship of serum immunoglobulin E to cigarette smoking. Am Rev Respir Dis. 1981;124(5):523–525.
14 Abbas AK, Lichtman AH, Pillai S. Cellular and molecular immu-nology. 7th ed. Philadelphia: Elsevier Health Sciences; 2011.
15 Schoenborn JR, Wilson CB. Regulation of interferon‐γ during innate and adaptive immune responses. Adv Immunol. 2007;96: 41–101. https://doi.org/10.1016/S0065-2776(07)96002-2.
16 Ouyang Y, Virasch N, Hao P, et al. Suppression of human IL--1beta, IL-2, IFN-gamma, and TNF-alpha production by ci-garette smoke extracts. J Allergy Clin Immunol. 2000;106(2): 280–287. https://doi.org/10.1067/mai.2000.107751.
17 Soliman DM, Twigg HL 3rd. Cigarette smoking decreases bioactive interleukin-6 secretion by alveolar macrophages. Am J Physiol. 1992;263(4 Pt 1):L471–L478. https://doi.org/10.1152/ajplung.1992.263.4.L471.
18 Yamaguchi E, Itoh A, Furuya K, Miyamoto H, Abe S, Ka-wakami Y. Release of tumor necrosis factor-α from hu-man alveolar macrophages is decreased in smokers. Chest. 1993;103(2):479–483. https://doi.org/10.1378/chest.103.2.479.
19 Klein I, Nagler RM, Toffler R, van Der Vliet A, Reznick AZ. Effect of cigarette smoke on oral peroxidase activity in hu-man saliva: role of hydrogen cyanide. Free Radic Biol Med. 2003;35(1):1448–1452. https://doi.org/10.1016/j.freeradbio-med.2003.08.001.
20 McCrea KA, Ensor JE, Nall K, Bleecker ER, Hasday JD. Al-tered cytokine regulation in the lungs of cigarette smokers. Am J Respir Crit Care Med. 1994;150(3):696–703. https://doi.org/10.1164/ajrccm.150.3.8087340.
21 Yanbaeva DG, Dentener MA, Creutzberg EC, Wesseling G, Wouters EF. Systemic effects of smoking. Chest. 2007;131(5): 1557–1566. https://doi.org/10.1378/chest.06-2179.
22 Lindblad SS, Mydel P, Jonsson M, Senior RM, Tarkowski A, Bokarewa M. Smoking and nicotine exposure delay deve-lopment of collagen-induced arthritis in mice. Arthritis Res Ther. 2009;11(3):R88. https://doi.org/10.1186/ar2728.
23 Martı ́n F, Santolaria F, Batista N, et al. Cytokine levels (IL-6 and IFN-γ), acute phase response and nutritional status as prognostic factors in lung cancer. Cytokine. 1999;11(1):80–86. https://doi.org/10.1006/cyto.1998.0398.
24 Rosenberg SA, Mulé JJ, Spiess PJ, Reichert CM, Schwarz SL. Regression of established pulmonary metastases and subcu-taneous tumor mediated by the systemic administration of high-dose recombinant interleukin 2. J Exp Med. 1985;161(5): 1169–1188. https://doi.org/10.1084/jem.161.5.1169.
25 Weiss GR, Margolin KA, Aronson FR, et al. A randomized phase II trial of continuous infusion interleukin-2 or bolus injection interleukin-2 plus lymphokine-activated killer cells for advanced renal cell carcinoma. J Clin Oncol. 1992;10(2): 275–281. https://doi.org/10.1200/JCO.1992.10.2.275.
26 Hallquist N, Hakki A, Wecker L, Friedman H, Pross S. Differential effects of nicotine and aging on splenocyte proliferation and the production of Th1-versus Th2-type cytokines. Exp Biol Med. 2000;224(3):141–146. https://doi.org/10.1046/j.1525-1373.2000.22412.x.
27 Nouri‐Shirazi M, Guinet E. Evidence for the immuno-suppressive role of nicotine on human dendritic cell func-tions. Immunology. 2003;109(3):365–373. https://doi.or-g/10.1046/j.1365-2567.2003.01655.x.
28 Petro TM, Peterson DS, Fung YK. Nicotine enhances in-terleukin production of rat splenic T lymphocytes. Immu-nopharmacol Immunotoxicol. 1992;14(3):463–475. https://doi.org/10.3109/08923979209005405.
29 Zhang S, Petro TM. The effect of nicotine on murine CD4 T cell responses. Int J Immunopharmacol. 1996;18(8–9): 467–478. https://doi.org/10.1016/S0192-0561(96)00054-9.
30 Cozen W, Diaz-Sanchez D, Gauderman W, et al. Th1 and Th2 cytokines and IgE levels in identical twins with varying levels of cigarette consumption. J Clin Immunol. 2004;24(6): 617–622. https://doi.org/10.1007/s10875-004-6247-0.
31 Hagiwara E, Takahashi K-I, Okubo T, et al. Cigarette smo-king depletes cells spontaneously secreting Th(1) cytokines in the human airway. Cytokine. 2001;14(2):121–126. https://doi.org/10.1006/cyto.2001.0860.
32 Daloee MH, Avan A, Mirhafez SR, et al. Impact of ciga-rette smoking on serum pro-and anti-inflammatory cyto-kines and growth factors. Am J Mens Health. 2017;11(4): 1169–1173. https://doi.org/10.1177/1557988315601724.

207 Pol ann MeD. 2018;25(2):207–211
Original article
Ernest Lad Heisten IV
Ohio State University Alumni Association, Columbus, OH, USA
Corresponding author: Ernest Lad Heisten IV, 3669 Dragonfly Dr., Columbus Ohio, 43204 United States. Tel.: +1614 260-0125.
E-mail address: [email protected].
Croatia and Slovenia have a maximum peak in multiple sclerosis prevalence at 7.54°C
article info
Art ic l e h i s toryReceived 28 May 2017Accepted 12 October 2017Available online 27 June 2018
Keywords TRPM8TemperatureThermoreceptiveGorski KotarIL-6Water immersionMultiple sclerosisPancreatic cancer
Doi10.29089/2017.17.00055
User l i cense This work is licensed under a Creative Commons Attribution –NonCommercial – NoDerivatives 4.0 International License.
abstract
Introduct ion: The high rate of multiple sclerosis (MS) in the Gorski Kotar Region of Croatia is currently unexplained. This is the only region in Croatia with an average yearly temperature below 9°C. Colder temperatures corresponds to the immune system regulator TRPM8.
Aim: To determine if average yearly temperature is associated with MSprevalence rates in Croatia and what average yearly temperature is the most si-gnificantly associated when variation is considered.
Mater ia l s and methods : Weather data from the Croatian Meteorological and Hydrological Service was compared to MS prevalence rates from 28 locations in Cro-atia. Multivariate analysis was used to determine the significance of a correlation between average yearly temperature and MS prevalence. When this was determined the same method was repeated with variation towards a particular temperature.
Resu l t s and d i scuss ion: The results were significant for all areas combined (P < 0.013) and were highly significant in non-coastal areas (P < 0.002) but not significant in coastal areas (P < 0.44). 10.87°C was found to be the most signifi-cantly associated temperature (P < 1.60 × 10⁻⁴) and variation was found to be si-gnificantly associated (P < 0.05) between 7.9°C and 8.29°C. Swimming can have the same effects on the body as colder weather and this could explain the lack of association in coastal areas. MS prevalence rates also shows corresponding me-trics with specific cancers which are known to be linked to the TRPM8 receptor.
Conc lus ions : MS prevalence in Croatia is significantly associated with ave-rage yearly temperature. MS also has the highest prevalence rates in areas which correspond to peak activity of the TRPM8 receptor.
Journal homepage: https://www.paom.pl
Polish Annals of Medicine

208 Pol ann MeD. 2018;25(2):207–211
1. INTRODUCTION
Croatia has one of the widest variations in multiple sclerosis (MS) prevalence rates for a geographic area of it’s size in the world.1 Variations range from a low of 22 cases per 100 000 population in Rab County to 194 / 100 000 in Cabar County (Figure 1) – with these locations less than 100 km from each other.1 The high of 194 / 100 000 – part of an overall average of 124 / 100 000 in the Gorski Kotar region1 – has been a topic of considerable scientific interest and investigation. Environ-mental factors have been accepted as being a contributing fac-tor to the development of MS and the one defining environ-mental factor in the Gorski Kotar region is the fact that the region is the only one in Croatia with an average temperature below 9°C (Figure 1). The TRPM8 receptor has been shown to peak in activity between 8°C–10°C2 and is a mediator of IL-6 levels in the body.3 The average yearly temperature of the Gorski Kotar region is roughly 7.4°C in Cabar County and 8.4°C in Delnice.4
The TRPM8 receptor is mediated by voltage and tem-perature: each can independently trigger the activity of the TRPM8 receptor. As temperature falls from 8°C to 20°C the half maximum voltage – half the voltage necessary to trigger a response in the receptor – and the number of gating charges – the number of charges needed to activate the receptor – both fall by about half.5 This change reflects a temperature medi-ated change in the Gibbs free energy (the minimum activa-tion energy) of the TRPM8 receptor: as the temperature falls the energy required to activate the receptor falls as well (Fig-ure 2). Mutations have been documented in this channel that have been shown to alter the functioning of the temperature dependent response and the voltage dependent response.6 In order to determine if average yearly temperature is respon-sible for the wide range in MS rates within Croatia average yearly temperature was compared to MS prevalence rates as compiled in Materljan and Sepcic (2002)1 as well as previous research done in the Rijeka area7 and additional research done in the Sibenik-Knin and Zadarska county regions.8 This was compared to the documented temperature dependent voltage activity5 to determine if MS prevalence rates in Croatia match documented normal TRPM8 receptor activity.
2. AIM
To determine if average yearly temperature is associated with MS prevalence rates in Croatia, what average yearly temperature is the most strong associated when variation is considered, what variation towards a particular temperature has the greatest impact on MS prevalence rates, and to ex-amine more specific effects within those trends if relevant.
3. MATERIAL AND METHODS
Areas which had weather data available from the Croatian Meteorological and Hydrological Service4 were compiled
and compared against the available MS prevalence rates for Croatia. Prevalence that did not have available corre-sponding weather locations were compared with a reason-able close weather station (Table 1).9 Lika county’s average yearly temperature was averaged between Senj, Otacac and Gospic,4 which between these three locations represent the majority of the population of that country. Sibenik-Knin county’s average yearly temperature was averaged between Sibenik and Knin,4 which constitute the majority of the population of that county. Ivanec did not have a weather station within a very close distance (20 km) and thus it’s prevalence rate was not included in analysis. Vrbovsko had a more recent prevalence estimated of 66.3 / 100 0007 and thus this prevalence was used instead of the earlier study by Materljan. Average yearly temperature was compared to the prevalence rate for that location and regression analysis was
Figure 1. Map of Croatia, with average yearly temperatu-re of each county colored, MS prevalence for each tested location, and the locations of a minor weather effect exa-mined in the analysis. Note that Ivanec has an MS preva-lence rate but that no corresponding weather station was available, thus it was not included in the analysis.
Figure 2. Gibbs free energy for TRPM8 receptor as a func-tion of temperature. Gibbs free energy required to activate the TRPM8 receptor, as defined by Raddatz et al. (2014). As the temperature falls from 25.0°C to 7.8°C the energy re-quired for this function declines. In the study it was found that a minor effect of temperature crossed this threshold.

209 Pol ann MeD. 2018;25(2):207–211
conducted on the resulting trendline in data analysis of Ex-cel 2013 (Table 1). The results were considered significant if the P value was less than 0.050. In order to determine an average yearly temperature with the highest MS prevalence rate the average yearly temperatures was subtracted from temperatures between 7°C–17°C and the absolute value of the result was calculated in data analysis of Excel 2013 (Ta-ble 1) as multivariate analysis with MS prevalence rate and average temperature variation set as independent variables and the absolute difference calculated as the dependent vari-able. Variation was determined in this test by determining standard deviation of temperature throughout the year. The way a temperature with the highest significance was deter-mined was to use the intercept of the absolute value of all locations to determine the point at which the significance
level was the highest. The result in this test was determined to be significant if Pvalue was less than 0.05.
An additional test was also done for variation. The way variation was calculated was that the variation from that temperature in a given month was subtracted from the tem-perature of highest MS prevalence that was determined first and an absolute value was taken for that difference. Each of these values was collected monthly and then added together from the entire year. Multivariate analysis was then con-ducted with the added difference as the dependent variable and the set difference from the determined temperature of high significance for each location and MS prevalence rates as independent variables. This was done under regression in
‘Data analysis’ of Excel 2013. Significance was deter-mined if P was less than 0.05 and if that significance was
Table 1. Locations of study, their MS prevalence, average yearly temperature as defined by the Croatian Meteorological and Hydrological Service (or denoted alternative), and alternative Weather Stations as necessary. All temperatures are sourced from the Croatian Meteorological and Hydrological Service. Vrbovsko is sourced from a location other than its location of prevalence rate. Years of meteorological data are listed in the far right column.
Location of study MS prevalence per 100000
Average temperature, °C
Alternative weather station, distance from prevalence
site9
Data range
Bjelovar and Bilogora 22.91 10.76 – 1949–2015
Zadarska County 318 15.13 Zadar, 0 km 1961–2015
Sibenik County 308 14.32 Sibenik and Knin (averaged), 0 km
1949–2015 (Sibenik)1949–2015 (Knin)
Donji Miholjac 661 11.16 – 1955–2015
Valpovo 531 10.92 – 1963–2015
Osijek 591 11.04 – 1899–2015
Nasice 331 11.29 – 1982–2015
Dakovo 311 11.00 – 1981–1988, 1990, 1995–2015
Lika County 30.61 11.11 Gospic, Senj and Otacac (averaged), 0 km
1872–2015 (Gospic)1949–2015 (Senj)
1995–2015 (Otocac)Dubrovnik 521 16.61 – 1961–2015
Rijeka (Rijeku) 59.61 14.11 – 1948–2015
Split Marjan 30.21 16.29 – 1948–2015
Zagreb Gric 401 11.58 – 1861–2015
Karlovac 57.127 11.03 1949–2015
Slavonski Brod 44.51 11.02 1963–2015
Cres Losini 621 15.46 Mali Losinj, 0 km 1961–2015
Rab 341 15.49 1978–2015
Krk 221 14.08 1981–1984, 1995–2011, 2013–2015
Pag 521 15.82 – 1978–2015
Buzet 271 12.45 – 1981–2015
Pazin 851 11.43 – 1961–2015
Labin 341 13.38 1994–2001
Vrbovsko 66.37 7.07 Stara Susica, 5 km 1960–1985
Delnice 1351 8.33 – 1981–1984, 1992–1993, 2008–2015
Cabar 1941 7.43 Parg, 1 km 1950–2015
Ludbreg 321 10.54 – 1982–2015
Varazdin 29.41 10.35 – 1949–2015
Novi Marof 241 11.00 1981–2015

210 Pol ann MeD. 2018;25(2):207–211
higher than that of the test for average yearly temperature with variation accounted for. Finally, a separation was made between coastal and non-coastal areas to determine if there was a difference in average yearly temperature association significance between those regions.
4. RESULTS
The results were significant (P < 0.013) for temperature and were also significant when variation was taken into account (P < 0.009). Of additional note was the division in associa-tion with average yearly temperature between non-coastal areas and coastal areas: Areas which were near a coastline (n = 10) followed the trend line less distinctively than those which were not (n = 18) (Figure 3). When these coastal ar-eas were analyzed separately by regression analysis it was found that the results were not significant (P < 0.44). Re-gression analysis of the non-coastal areas, however, dem-onstrated a very significant correlation (P < 0.002) (Figure 3). The average yearly temperature with the highest signifi-cance of association with MS prevalence when variation was accounted for was determined to be 10.87°C, with a peak significance of 1.60 × 10⁻⁷ (Figure 4). Results for variation towards a particular temperature showed that 8.29°C was the point at which variation would reach significance (P < 0.05) (Figure 4). This was by a gradient curve, however, and was not more significant that average yearly temperature with variation accounted for.
5. DISCUSSION
The distinct line documented in Figure 3 crosses the threshold of TRPM8 activity as defined by Gibbs Free En-ergy.5 The increases in MS prevalence, 29.4–66 cases per 100 000, are indicative of these small temperature increases from 10.3°C to 11.16°C crossing the 10.87°C temperature that was the most significant for MS prevalence when aver-age yearly temperature and variation are accounted for. This could cause individuals with TRPM8 receptors that possess polymorphisms that alter temperature dependent functions6 to be at risk of MS development – which is the same reason that areas with an average temperature around 8°C could be expected to have very high MS prevalence rates. At those temperatures (7°C–9°C) any deficiency or reduced temper-ature responsiveness could cause a heightened risk of MS prevalence. The minor effect noted for the distinct line is also due to minute changes in average variation that cross the threshold of the highest MS prevalence association at 10.87°C: When the seven data points that make up this line are considered the results are significant regarding varia-tion from the given average yearly temperature (P < 0.031) further defining temperature variation as a reason for this feature in Figure 3.
Additionally, the significance of association above 10.87°C is one of exponential decrease (Figure 4) whereas
that above 9.60°C is one of near exponential increase. The increase in significance above that demonstrated for 10.87°C occurs at approximately 7.90°C, suggesting that this is the lower limit of where variation towards a particular tempera-ture would increase above that of average yearly temperature with variation accounted for regarding significance. The up-per limit is the 8.29°C defined in the variation towards a particular temperature test, although this did not exceed the significance of the first test for average yearly temperature with variation accounted for. The difficulty in achieving this result for that analysis is due to the extraordinarily high level of significance for the first test, which largely makes the second analysis somewhat superfluous. This result, it should be recognized, is due to the very detailed analysis of the population of Croatia that was examined: some counties that were tested for MS prevalence had populations of less than 100 000 people, making the results very detailed and amplifying the significance of the first analysis.
With this minor effects noted the fact remains that the overall trend is still one of increasing MS prevalence with increasing demands on the TRPM8 receptor (that is, decreas-ing temperature up to 8°C). If the body was physiologically suited for the TRPM8 receptor to be active and it was reduced in function or not functioning at all, this could account for
Figure 3. MS prevalence rates vs. average yearly tempera-ture (°C). The minor weather effect from variation across the peak MS prevalence temperature and the Gibbs free energy boundary is marked with a trendline. All data po-ints on this line of the minor weather effect are non-co-astal areas. Coastal areas are non-signficant (P < 0.44) whereas non-coastal areas are significant (P < 0.002). The overall trend was significant (P < 0.013).
Figure 4. Significance of the intercept for the collective difference from an average yearly temperature.

211 Pol ann MeD. 2018;25(2):207–211
all these effects. The TRPM8 receptor also ceases to be re-active below 8°C, and this explains the sudden drop in MS prevalence (66.3 / 100 000) at Vrbovsko, which has an average yearly temperature of 7.07°C but of which it’s variation in temperature from month to month would cross that thresh-old. The apparent lack of correlation between MS prevalence and temperature in coastal areas may be due to an amorphous confound distinctive to areas on a coastline: water immersion from swimming may cause the same effects on MS develop-ment by producing the same physiological stresses as atmos-pheric cooling, and thus may cause notable increases in MS prevalence which are hard to define by weather patterns be-cause not everyone will engage in this activity and be exposed to the physiological risks it would present.10
In addition to this possibility, some correlations between cancer and MS in Croatia have been made.11,12 TRPM8 has been shown to be abnormally expressed in a number of dif-ferent tumors.12,13 It has been directly associated with pan-creatic cancer, which was the strongest association noted with MS prevalence and incidence in Croatia (non-coastal areas: P < 0.0003, coastal areas: P < 0.009).13 In addition TRPM8 has been shown to be strongly expressed in lung epithelial cells6 and associated with lung cancer in at least one study14 which could explain the otherwise difficult to explain association between lung cancer and MS prevalence (non-coastal: NS, coastal: P< 0.03). By comparison stomach cancer does not correlate with MS prevalence12 even though colorectal cancer was associated with MS prevalence in both coastal and non-coastal areas (non-coastal areas P < 0.0007, coastal P < 0.04). Colon cancer was also associated with MS prevalence (P < 0.045) in non-coastal areas. This makes the connection between abnormal TRPM8 expression and these particular cancers strong and shows that the same receptor may be responsible for cancers that have been correlated with MS.
6. CONCLUSIONS
Average yearly temperature is associated with MS preva-lence in Croatia. It is significantly associated with MS preva-lence in non-coastal areas and not in coastal areas. The aver-age yearly temperature with the highest association with MS prevalence when variation is accounted for is 10.87°C, and the variation towards which MS prevalence demonstrates the greatest difference is between 7.90°C and 8.29°C, which is close to where the TRPM8 has been demonstrated to cease being reactive.5 An increase in MS prevalence in some loca-tions with increasing temperature from 10.32°C to 11.16°C is due to crossing the threshold of TRPM8 receptor activity and crossing the temperature of 10.87°C that demonstrates peak MS prevalence when variation is considered.
Conflict of interestAuthor declare to have no conflict of interest.
AcknowledgementsThis research was conducted independently and not on be-half of the Ohio State Alumni Association. No conflict of interest exists in this relationship
References1 Materljan E, Sepcic J. Epidemiology of multiple sclerosis in
Croatia. Clin Neurol Neurosurg. 2002;104(3):192–198. https://doi.org/10.1016/S0303-8467(02)00037-9.
2 Bautista DM, Siemens J, Glazer JM, et al. The menthol receptor TRPM8 is the principal detector of environmental cold. Nature. 2007;448(7150):204–208. https://doi.org/10.1038/nature05910.
3 Son GY, Hong JH, Chang I, Shin DM. Induction of IL-6 and IL-8 by activation of thermosensitive TRP channels in hu-man PDL cells. Arch Oral Biol. 2015;60(4):526–532. https://doi.org/10.1016/j.archoralbio.2014.12.014.
4 Croatian Meteorological and Hydrological Service. Srednje mjesečne vrijednosti za Osijek u razdoblju 1899–2017. http://klima.hr/klima.php?id=k1¶m=srednjak&Grad=osi-jek. Accessed May 22, 2017.
5 Raddatz N, Castillo JP, Gonzalez C, Alvarez O, Latorre R. Temperature and voltage coupling to channel opening in transient receptor potential melstatin 8 (TRPM8). J Biol Chem. 2014;289(51):35438–35454. https://doi.org/10.1074/jbc.M114.612713.
6 Voets T, Owsianik G, Janssens A, Talavera K, Nilius B. TRPM8 voltage sensor mutants reveal a mechanism for integrating thermal and chemical stimuli. Nat Chem Biol. 2007;3(3):174–182. https://doi.org/10.1038/nchembio862.
7 Perkovi O, Jurjevi A, Igor Anton I, Dunatov S, Brali M, Ri-sti S. The town of Cabar, Croatia, familiar pseudocluster for multiple sclerosis – descriptive epidemiological study. Coll Antropol. 2010;34(Suppl 2):141–144.
8 Klupka-Saric I, Risti S, Sepcic J, et al. Epidemiology of multi-ple sclerosis in western Herzegovina. Clin Neurol Neurosurg. 2007;109:779–783. https://doi.org/10.1016/j.clineuro.2007.07.014.
9 Čačić I, ed. 160 Years of Meteorological Observations and Their Application in Croatia. Zagreb: Republic of Croatia Meteorological and Hydrological Service. 2014;188. http://klima.hr/razno/publikacije/160_god_met_motrenjaHR.pdf. Accessed May 22, 2017.
10 Kozyreva TV, Khramova GM, Voronova IP, Evtushenko AA. The influence of cooling and TRPM8 ion channel activation on the level of pro-inflammatory cytokines in normoten-sive and hypertensive rats. J Therm Biol. 2016:61:119–124. https://doi.org/10.1016/j.jtherbio.2016.09.004.
11 Du GJ, Li JH, Liu WJ, et al. The combination of TRPM8 and TRPA1 expression causes an invasive phenotype in lung cancer. Tumour Biol. 2014:35(2):1251–1261. https://doi.org/10.1007/s13277-013-1167-3.
12 Materljan E, Materljan M, Materljan B, Vlacić H, Barićev--Novaković Z, Sepcić J. Multiple sclerosis and cancers in Croatia – A possible protective role of the Mediterranean diet. Coll Antropol. 2009;33(2):539–545.
13 Kim SH, Nam JH, Park EJ, et al. Menthol regulates TRPM8-independent processes in PC-3 prostate cancer cells Biochim. Biophys Acta. 2009;1792(1):33–38. https://doi.or-g/10.1016/j.bbadis.2008.09.012.
14 Yee NS. TRPM8 ion channels as potential cancer biomarker and target in pancreatic cancer. Adv Protein Chem Struct Biol. 2016;104:127–151. https://doi.org/10.1016/bs.apcsb.2016.01.001.

212 Pol ann MeD. 2018;25(2):212–217
Original article
Ernest Lad Heisten IV
Ohio State University Alumni Association, Columbus, OH, USA
Corresponding author: Ernest Lad Heisten IV, 3669 Dragonfly Dr., Columbus Ohio, 43204 United States. Tel.: +1614 260-0125.
E-mail address: [email protected].
Multiple sclerosis prevalence in Italy associated with temperature variation towards 8.60°C
article info
Art ic l e h i s toryReceived 28 May 2017Accepted 21 August 2017Available online 27 June 2018
Keywords TRPM8ThermoreceptiveMultiple sclerosisImmunologyMultivariate analysisLatitudinal prevalenceSystemic lupus erythematosusAmyotrophic lateral sclerosisItaly
Doi10.29089/2017.17.00052
User l i cense This work is licensed under a Creative Commons Attribution –NonCommercial – NoDerivatives 4.0 International License.
abstract
Introduct ion: Italy is an exception to the association of increasing Latitudi-nal prevalence of multiple sclerosis (MS) with temperature. This is noteworthy because even though northern Italy’s average yearly temperature is significantly colder than southern Italy’s MS rates are lower instead of higher. If the reason for this inverse epidemiology of MS were determined it would give important insight as to the causes of MS.
Aim: This study was done to determine if variation towards a particular tempe-rature was responsible for MS prevalence rates in Italy.
Mater ia l and methods : Multivariate analysis was used to determine ave-rage yearly temperatures that had the highest effect on MS prevalence rates and variation towards which MS rates would be the most affected. Multivariate analy-sis was used to determine the significance of a correlation between average yearly temperature and MS prevalence. When this was determined the same method was repeated with variation towards a particular temperature.
Resu l t s and d i scuss ion: The results showed the average yearly temperatu-re at which MS prevalence rates peaked was 10.11°C and the temperature towards which temperature variation would have the most significant impact on preva-lence rates was 8.60°C.
Conc lus ions : The temperature that both the average yearly temperature and variation towards a particular temperature has the most impact on MS prevalen-ce rates corresponds to the point at which the TRPM8 thermoreceptor peaks in activity and below which it ceases to be reactive, respectively. That receptor has been shown to be a mediator of immune system function. It’s dysfunction could explain the development of MS.
Journal homepage: https://www.paom.pl
Polish Annals of Medicine

213 Pol ann MeD. 2018;25(2):212–217
1. INTRODUCTION
Multiple sclerosis (MS) is a condition that has been asso-ciated repeatedly with latitudinal prevalence: the further north a prevalence rate is tested for the higher the rates of MS are typically reported. Italy does not follow this trend: Sicily, which is located to the south of the mainland, has higher prevalence rates1–5 than the mainland.6–9 Northern Italy, however, has lower rates on the average10–13 than either Sicily or southern Italy. Most of this variation has been at-tempted to be explained as due to genetic pool differences within Italy.14,15 There is some truth to this: Sardinia has some of the highest rates of MS in the world at between 144–152 cases per 100 000 population16,17 and it’s residents are genetically different than mainland Italy. Malta also has an ethnically unique population and has much lower rates (4 cases per 100 000 population)18 than the rest of Italy. In northern Italy there is one population of ethnically distinct people in Valle d’Aosta which are reported to have higher rates of MS than the rest of Italy (90 / 100000)19 although an-other study has questioned this with a rate of 39 / 100000.10
One factor that has not been explored is whether average yearly temperature is a factor that explains this reversed lati-tudinal MS prevalence rates in Italy. The Alps in Northern Italy provide extremely cold temperatures in some locations while more southerly locations like Sicily provide compara-tive warm ones. This makes the apparent reversed latitudinal trends even more intriguing because the temperature gradi-ent appears to be consistent with what would be expected of a northerly direction – and that gradient is exaggerated further because of the Alps. If there is a specific temperature range in which MS prevalence rates would be expected to increase then it is possible that by comparing average yearly tempera-ture with MS prevalence rates in Italy a peak temperature for association with MS development could be determined. It’s also possible to analyze yearly temperature variation in or-der to determine if there is a particular temperature at which variation above or below that temperature would be expected to affect MS prevalence rates.
2. AIM
The purpose of this study is to examine whether a corre-lation exists between MS prevalence rates, average yearly temperature, and monthly variation throughout the year in Italy that explains the difference between Italy’s MS preva-lence rates and the general worldwide trend of increased latitudinal incidence for MS.
3. MATERIAL AND METHODS
Numerous studies done at later dates appear to be show-ing drastic increases in MS prevalence20,21 – particularly in Sicily.22–24 The reasons for this increase in prevalence has not been explained and could well be due to methodologi-
cal study method changes or diagnostic criterion changes that have taken place since 2000. Studies consulted (n = 16) were done prior to 20001–15.25 and were examined for preva-lence rate. Their locations were then matched for average temperature and temperature variations based on data from the Norwegian Meteorological Institute.26 Average yearly temperature was defined as data collected from 1961–1990. In order to determine an average yearly temperature with the highest MS prevalence rate the average yearly tempera-tures was subtracted from temperatures between 1°C–14°C and the absolute value of the result was calculated in data analysis of Excel 2013 (Table 1) as multivariate analysis with MS prevalence rate and average temperature variation set as independent variables and the absolute difference calculat-ed as the dependent variable. Variation was determined in this test by determining standard deviation of temperature throughout the year. The way a temperature with the high-est significance was determined was to use the intercept of the absolute value of all locations to determine the point at which the significance level was the highest. The result in this test was determined to be significant if P < 0.05.
The way variation was calculated was that the variation from that temperature in a given month was subtracted from the temperature of highest MS prevalence that was determined first and an absolute value was taken for that difference. Each of these values was collected monthly and then added together from the entire year. Multivariate anal-ysis was then conducted with the added difference as the de-pendent variable and the set difference from the determined temperature of high significance for each location and MS
Table 1. MS Prevalence Rate, location of tested area, Avera-ge Yearly temperature of that area, and the difference from 10.11°C of that area.
MS preva-lence rate per 100 000
Location Average yearly temperature
Average dif-ference from
10.11°C
58 Vallagarina-Rovereto 2.23 7.89
45 Biella 11.27 1.16
90 Valle D’Aosta –5.63 15.74
38 Macerata 12.70 2.59
43 Ascoli Piceno 14.45 4.34
53 L’Aquila Province 4.98 5.12
35 Salerno 9.20 0.91
62 Terni Province 13.23 3.12
56 Valdarno-Firenze 2.45 7.65
69 Ferrara province 13.02 2.91
52 San Marino 13.04 2.93
61 Monreale Province 16.79 6.68
45 Bagheria 17.99 7.88
51 Caltanissetta 17.55 7.44
53 Enna 13.67 3.56
58 Catania 17.66 7.55

214 Pol ann MeD. 2018;25(2):212–217
prevalence rates as independent variables. This was done under regression in ‘data analysis’ of Excel 2013. Signifi-cance was determined if P < 0.01. The highest confidence interval is necessary because since the highest probability of temperature has already been selected then it would re-quire a higher confidence interval to determine whether the results of the second test are truly valid. Additionally, because of the potential confounds that could be presented by genetically distinct populations Sardinia and Malta are not included in the analysis. Due to its later date of study the Valle D’Aosta prevalence rate of 90 / 100 000 was used. The locations tested are shown in Table 1. Before conduct-ing these tests multivariate analysis was used to determine if the association between these factors was significant.
4. RESULTS
The results for multivariate analysis of average tempera-ture and temperature variation were highly significant (P < 0.0003) meaning that an association was present. Average temperature was then plotted between 1°C and 14°C (Figure 1). The results showed that the highest point of significance was 10.11°C (P < 0.0016) with a range of significance be-tween 13.25°C (P < 0.05) and 7.70°C (P < 0.05). This marks 10.11°C as the temperature that amount of variation from a given temperature will be tested. Variation from 10.11°C showed the highest point of significance for variation from that temperature was 8.60°C (P < 0.005) with a range of significance by 1% confidence interval of 7.5°C and 9.3°C (Figure 2).
5. DISCUSSION
One of the limitations on this study was the fact that there were almost no prevalence rates reported for an area with an average temperature between 11.26°C and 4.98°C. Salerno, alone, was a sole representative with an average temperature of 9.20°C and a prevalence rate of 35 / 100 000.10 This leaves a small degree of uncertainty about how accurate the peak variation result is, since it cannot be compared to any MS prevalences in the study itself. However, study of the high-est incidences of MS in the world – The Orkney Islands and the Shetland Islands – reveal that the average yearly tem-perature of those islands is very close to this predicted av-erage. The Orkneys have an average temperature of 7.83°C and a prevalence rate of 193 / 100 000.27 The Shetlands have an average temperature of 7.12°C and a prevalence rate of 152 / 100 000.28 Additionally, their variations in temperature are very narrow, at 2.95°C and 2.84°C26 respectively, which means that these locations are never very far away from the average temperature.
A temperature sensor in the body named the TRPM8 re-ceptor has an active range between 8°C–28°C.29 It’s activity has been shown to peak between 8°C and 10°C.29–31 Immune functions have been associated with this sensor and some of
these have been linked to the central nervous system.32,33 It is possible that this temperature sensor in the body, if dysfunc-tional, is associated with the incidence of MS reported in the world and may explain temperature dependent incidences and prevalences of multiple sclerosis. The reason why varia-tion towards a particular temperature would affect the results is presumably because this is roughly the point at which the
Figure 1. Average yearly temperature at which a differen-ce from that temperature is associated with a reduction in MS prevalence rates. Peak MS prevalence is associated with the average difference from 10.11°C. This tempera-ture is with variation considered a factor, not without.
Figure 1. Average yearly temperature at which a difference from that temperature is associated with a reduction in MS prevalence rates. Peak MS prevalence is associated with the Average difference from 10.11 C. This temperature is with variation considered a factor, not without.
0
2
4
6
8
10
12
14
16
0 0,01 0,02 0,03 0,04 0,05 0,06 0,07 0,08 0,09 0,1
Aver
age
Year
ly T
empe
ratu
re C
at w
hich
diff
eren
ce
redu
ces M
S pr
eval
ence
Signficance by Confidence interval
Temperature of Highest MS prevalence with Variation accounted for
Figure 2. Variation from 10.11°C as a function of MS pre-valence. The results show that 8.60°C is the peak tempe-rature around which variation towards would be predicted to have the greatest effect of changing MS prevalence.
Figure 2: Variation from 10.11oC as a function of MS prevalence. The results show that 8.6oC is the peak temperature around which variation towards would be predicted to have the greatest effect of changing MS prevalence.
0
1
2
3
4
5
6
7
8
9
10
0 0,005 0,01 0,015 0,02 0,025 0,03 0,035
Tem
pera
ture
in C
Significance (Confidence interval)
Variation from 10.11 C average yearly temperature with the greatest effect on MS prevalence rates
Figure 3. Incidence rates of ALS (n = 13, P< 0.01) and SLE (n = 12, P < 0.02) vs. the average yearly temperature of the location tested.
Figure 3: Incidence rates of Amytrophic Lateral Sclerosis (ALS) (n=13, p<.01) and Systemic Lupus Erythematosus (SLE) (n=12, p<.02) vs the Average Yearly temperature of the location tested.
0
2
4
6
8
10
12
14
16
18
1 2 3 4 5 6 7 8 9
Aver
age
Year
ly T
empe
ratu
re C
Incidence/100000
ALS and SLE Incidence VS average Yearly Temperature
ALS Incidence
SLE incidence
Liniowy (ALS Incidence)
Liniowy (SLE incidence)

215 Pol ann MeD. 2018;25(2):212–217
TRPM8 receptor would cease to be reactive and crossing this point would cause prevalence rates to rise or fall. Northern Italy’s average temperatures were also below the reactive range of this receptor, which could explain why that regions’ MS prevalence rates were lower than the rest of Italy.
Systemic lupus erythematosus (SLE) is a similar disease to MS34 that has been speculated to be autoimmune. Its de-velopment occurs roughly 10 years later than the average onset of MS. Like MS it is significantly more common in women than men, although that development is even more lopsided with a 9 : 1 ratio of female to male patients. Far fewer epidemiology studies on SLE prevalence or incidence have been done than MS, but those that do have shown a similar correlation between SLE incidence in the United Kingdom35 – where the highest rates of MS in the world ex-ist – and those of Ferrara province in Italy: UK rates ranged between 3.56 / 100 000 and 7.62 / 100 000, whereas the inci-dence rates in Ferrara were an average of 1.92 / 100 000 from 2000–2002.34 The association between the average yearly temperature of these locations and SLE incidence was sig-nificant (n = 12, P < 0.02) (Figure 3) which strongly sug-gests that the factors that affect MS development also regu-late the development of SLE development. Prevalence rates for Ferrara were calculated at 57 / 100 000,34 which would suggest that SLE is similar in geographic distribution and prevalence rates to MS if the correlation between incidence rates was directly associated with prevalence rates. The re-duction between MS prevalence and SLE prevalence could be entirely accounted for by the more advanced age of SLE development.
Amyotrophic lateral sclerosis (ALS) is another autoim-mune condition with a very late age of onset (after 53 at the earliest, in general after 65)36 and a much lower life expec-tancy than either MS or SLE. It is also a much rarer disease owing to the shorter life expectancy at higher ages and as a result prevalence rates are not well studied. Incidence rates for ALS do show a significant association between average yearly temperature and location37–48 (n = 13, P < 0.01) (Fig-ure 3) suggesting that development of ALS may be governed by the same factors that affect MS development. It is worth noting that one location from Northern Italy47 (Figure 3) has a drop in ALS incidence consistent with the cutoff point of the TRPM8 receptor.
6. CONCLUSIONS
The fact that multivariate analysis was significant is re-markable because neither temperature variation (P < 0.40) nor average temperature (P < 0.10) were significant by themselves. Only by combining the two variables was a sig-nificant correlation established between average yearly tem-perature and MS prevalence. This is largely due to the fact that no average yearly temperatures were reported between 9.20°C and 4.98°C – which made this multivariate analysis necessary. The results demonstrate that the most common average temperature when variation was included to expect
MS prevalence to increase is 10.11°C and the temperature towards which variation could cause a change in prevalence was 8.60°C. This roughly reflects the cutoff point for activity of the TRPM8 receptor.29
Conflict of interestAuthor declare to have no conflict of interest.
AcknowledgementsThis research was conducted independently and not on be-half of the Ohio State Alumni Association.
Conflict of interestNo conflict of interest exists in this relationship.
References1 Dean G, Grimaldi G, Kelly R, Karhausen L. Multiple scle-
rosis in southern Europe. I. Prevalence in Sicily in 1975. J Epidemiol Community Health. 1979;33(2):107–110. https://doi.org/10.1136/jech.33.2.107.
2 Savettieri G, Elian M, Giordano D, Grimaldi G, Ventura A, Dean G. A further study on the prevalence of multiple sclerosis in Sicily: Caltanissetta city. Acta Neurol Scand. 1986;73(1):71–75. https://doi.org/10.1111/j.1600-0404.1986.tb03243.x.
3 Savettieri G, Salemi G, Ragonese P, Aridon P, Scola G, Ran-disi G. Prevalence and incidence of multiple sclerosis in Monreale city, Italy. J Neurol. 1998;245(1):40–43. https://doi.org/10.1007/s004150050172.
4 Salemi G, Ragonese P, Aridon P, et al. Multiple sclerosis in Southern Europe: incidence and prevalence in Bagheria City, Sicily, Italy. Neurol Sci. 2001;21(6):361–365. https://doi.org/10.1007/s100720070051.
5 Nicoletti A, Bartolo ML, Fermo S, et al. Prevalence and in-cidence of multiple sclerosis in Catania, Sicily. Neurology. 2001;56(1):62–66. https://doi.org/10.1212/WNL.56.1.62.
6 Iuliano G, Napoletano R. Prevalence and incidence of multi-ple sclerosis in Salerno (southern Italy) and its province. Eur J Neurol. 2008;15(1):73–76.
7 Maddestra M, Sabbatini S, Paci F, Paci A. Epidemiological survey of multiple sclerosis in the province of Terni. Neuro-epidemiology. 1998;17:54.
8 Angeleri F, Bollettini G, Brizioli E. A prevalence study of multiple sclerosis in the Regione Marche. In: Battaglia MA, Crimi G, eds. An Update on Multiple Sclerosis. Bologna: Mon-duzzi. 1989;209–212.
9 Totaro R, Marini C, Cialfi A Giunta M, Carolei A. Prevalen-ce of multiple sclerosis in the L’Aquila district, central Italy. J Neurol Neurosurg Psychiatry. 2000;68(3):349–352. https://doi.org/10.1136/jnnp.68.3.349.
10 Sironi L, Mamoli A, D’Alessandro G, Camerlingo M, Bot-tachi E. Frequency of multiple sclerosis in Valle D’Aosta, 1971–1985. Neuroepidemiology. 1991;10(2):66–69. https://doi.org/10.1159/000110249.
11 Moresco M, Rossi G. Studio di prevalenza della sclerosi multipla nella USL Vallagarina-Rovereto. In: Battaglia MA, Crimi G, eds. An Update on Multiple Sclerosis. Bologna: Mon-duzzi. 1989;287–291.

216 Pol ann MeD. 2018;25(2):212–217
12 Diodato S, Cattaino G, Lisotto C, Pomes A. Multiple sclero-sis epidemiological survey in Pordenone. In: Battaglia MA, Crimi G, eds. An Update on Multiple Sclerosis. Bologna: Mon-duzzi. 1989;231–233.
13 Nardozza V, Chiò A, Santoni M, Marforio S. Prevalence of multiple sclerosis in the town of Biella, northern Italy. In: An Update on Multiple Sclerosis. Scientific Meeting sponsored by IFMSS-ECTRIMS, Rome, 14–17 September 1998. Abs-tract Book, AISM Rome. 1988;4:37.
14 Granieri E, Malagú S, Casetta I, et al. Multiple sclerosis in Italy. A reappraisal of incidence and prevalence in Ferrara. Arch Neurol. 1996;53(8):793–798. https://doi.org/10.1001/archneur.1996.00550080115019.
15 Meucci G, Bianchi F, Rossi G. Indagine sulla prevalenza del-la sclerosi multipla nella USL n.17 del Valdarno inferiore. In: 7th Italian Congress of Neuroepidemiology. Abstract Book. Perugia: Tipografia Umbra. 1992;35.
16 Granieri E, Casetta I, Govoni V, et al. The increasing inciden-ce and prevalence of MS in a Sardinian province. Neurology. 2000;55(6):842–847. https://doi.org/10.1212/WNL.55.6.842.
17 Pugliatti M, Sotgiu S, Solinas G, et al. Multiple sclerosis epidemiology in Sardinia: evidence for a true increasing risk. Acta Neurol Scand. 2001;103(1):20–26. https://doi.or-g/10.1034/j.1600-0404.2001.00207.x.
18 Vassallo L, Elian M, Dean G Multiple sclerosis insouthern Europe. II. Prevalence in Malta in 1978. J Epidemiol Com-munity Health. 1979;33(2):111–113. https://doi.org/10.1136/jech.33.2.111.
19 Sironi L, Mamoli A, D’Alessandro G, Corso G, Bottachi E. Epidemiology of multiple sclerosis in Valle D’Aosta, Italy. Mult Scler. 1997;3:283.
20 Gajofattoa A, Stefania A, Turattia M, et al. Prevalence of multiple sclerosis in Verona, Italy: an epidemiological and genetic study. Eur J Neurol. 2013;20(4):697–703. https://doi.org/10.1111/ene.12045.
21 Millefiorini E, Cortese A, Rezze SD, et al. The prevalence of multiple sclerosis in central Italy. Mult Scler. 2010;16(12): 1432–1436. https://doi.org/10.1177/1352458510373263.
22 Bellantonioa P, Iulianob G, Di Blasioa F, Ruggieria S. Pre-valence and incidence of multiple sclerosis in Campobasso (Molise region chieftown, southern Italy). Clin Neurol Neu-rosurg. 2013;115:1806–1808. https://doi.org/10.1016/j.clineu-ro.2013.05.001.
23 Grimaldi LM, Palmeri B, Salemi G, et al. High prevalence and fast rising incidence of multiple sclerosis in Caltanis-setta, Sicily, Southern Italy. Neuroepidemiology. 2007;28(1): 28–32. https://doi.org/10.1159/000097853.
24 Savettieri G, Salemi G, Ragonese P, Aridon P, Scola G, Ran-disi G. Prevalence and incidence of multiple sclerosis in the city of Monreale, Italy. J Neurol. 1998;245:40–43. https://doi.org/10.1007/s004150050172.
25 Bergamaschi R, Montomoli C, Candeloro E, et al. Bayesian mapping of multiple sclerosis prevalence in the province of Pavia, northern Italy. J Neurol Sci. 2006;244:127–131. https://doi.org/10.1016/j.jns.2006.01.013.
26 Norwegian Meteorological Institute. Average Yearly Tempe-rature for all locations tested. https://www.yr.no/?spr=eng. Ac-cessed June 10, 2018.
27 Cook SD, Cromarty MB, Tapp W, et al. Declining in-cidence of multiple sclerosis in the Orkney Islands. Neurology. 1985;35(4):545–551. https://doi.org/10.1212/WNL.35.4.545.
28 Poskanzer DC, Prenney LP, Sheridan JL, Yon Kondy J. Mul-tiple sclerosis in the Orkney and Shetland Islands. I. Epide-miology, clinical factors, and methodology. J Epidemiol Com-munity Health. 1980;34(4):229–239. https://doi.org/10.1136/jech.34.4.229.
29 Raddatz N, Castillo JP, Gonzalez C, Alvarez O, Latorre R. Temperature and voltage coupling to channel opening in transient receptor potential melstatin 8 (TRPM8). J Biol Chem. 2014:289(51):35438–35454. https://doi.org/10.1074/jbc.M114.612713.
30 Bautista DM, Siemens J, Glazer JM, et al. The menthol recep-tor TRPM8 is the principal detector of environmental cold. Nature. 2007:448(7150):204–208. https://doi.org/10.1038/na-ture05910.
31 Sherkheli MA, Vogt-Eisele AK, Bura D, Beltrán-Márques LR, Gisselmann G, Hatt H. Characterization of selective TRPM8 ligands and their structure activity response (S.A-.R) relationship. J Pharm Sci. 2010;13(2):242–253. https://doi.org/10.18433/J3N88N.
32 Son GY, Hong JH, Chang I, Shin DM. Induction of IL-6 and IL-8 by activation of thermosensitive TRP channels in hu-man PDL cells. Arch Oral Biol. 2015;60(4):526–532. https://doi.org/10.1016/j.archoralbio.2014.12.014.
33 Du J, Yang X, Zhang L, Zeng Y. Expression of TRPM8 in the distal cerebrospinal fluid-contacting neurons in the bra-in mesencephalon of rats. Cerebrospinal Fluid Res. 2009;6:3. https://doi.org/10.1186/1743-8454-6-3.
34 Govoni M, Castellino G, Bosi S, Napoli N, Trotta F. Lupus Around The World: Incidence and prevalen-ce of systemic lupus erythematosus in a district of North Italy. Lupus. 2006;15(2):110–113. https://doi.or-g/10.1191/0961203306lu2235xx.
35 Somers EC, Thomas SL, Smeeth L, Schoonen WM, Hall AJ. Incidence of systemic lupus erythematosus in the United Kingdom, 1990–1999. Arthritis Care Res. 2007;57(4):612–618. https://doi.org/10.1002/art.22683.
36 Vázquez MC, Ketzoián AC, Legnani AC, et al. Incidence and prevalence of amyotrophic lateral sclerosis in Uruguay: A po-pulation-based study. Neuroepidemiology. 2008;30(2):105–111. https://doi.org/10.1159/000120023.
37 Traynor BJ, Codd MB, Corr B, Forde C, Frost E, Hardiman O. Incidence and prevalence of ALS in Ireland, 1995–1997: A population based study. Neurology. 1999;52(3):504–509. https://doi.org/10.1212/WNL.52.3.504.
38 Piemonte and Valle d’Aosta Register for Amyotrophic Late-ral Sclerosis (PARALS). Incidence of ALS in Italy: eviden-ce for a uniform frequency in Western countries. Neurology. 2001;56(2):239–244. https://doi.org/10.1212/WNL.56.2.239.
39 Logroscino G, Beghi E, Zoccolella S, et al. The SLAP re-gistry incidence of amyotrophic lateral sclerosis in so-uthern Italy: a population based study. J Neurol Neurosurg Psychiatry. 2005;76(8):1094–1098. https://doi.org/10.1136/jnnp.2004.039180.
40 Beghi E, Millul A, Micheli A, Vitelli E, Logroscino G. Inciden-ce of ALS in Lombardy, Italy. Neurology. 2007;68(2):141–145. https://doi.org/10.1212/01.wnl.0000250339.14392.bb.
41 The Scottish Motor Neuron Disease Research Group. The Scottish motor neuron disease register: a prospective study of adult onset motor neuron disease in Scotland. Metho-dology, demography and clinical features of incident cases in 1989. J Neurol Neurosurg Psychiatry. 1992;55(7):536–541. https://doi.org/10.1136/jnnp.55.7.536.

217 Pol ann MeD. 2018;25(2):212–217
42 McGuire V, Longstreth WT, Koepsell TD, van Belle G. In-cidence of amyotrophic lateral sclerosis in three counties in western Washington state. Neurology. 1996;47(2):571–573. https://doi.org/10.1212/WNL.47.2.571.
43 Kahana E, Zilber N. Changes in incidence of amyotrophic lateral sclerosis in Israel. Arch Neurol. 1984;41(2):157–160. https://doi.org/10.1001/archneur.1984.04050140055023.
44 Yoshida S, Mulder DW, Kurland LT, Chu C-P, Okazaki H. Follow-up study on amyotrophic lateral sclerosis in Ro-chester, Minnesota, 1925 through 1984. Neuroepidemiology. 1986;5(2):61–70. https://doi.org/10.1159/000110815.
45 Gunnarsson LG, Lygner PE, Viega-Cabo J, de Pedro-Cuesta J. An epidemic-like cluster of motor neuron disease in a Swe-dish county during the period 1973–1984. Neuroepidemiology. 1996;15(3):142–152. https://doi.org/10.1159/000109901.
46 Højer-Pedersen E, Christensen PB, Jensen NB. Inciden-ce and prevalence of motor neuron disease in two Danish counties. Neuroepidemiology. 1989;8(3):151–159. https://doi.org/10.1159/000110177.
47 Guidetti D, Bondavalli M, Sabadini R, et al. Epidemiologi-cal survey of amyotrophic lateral sclerosis in the province of Reggio Emilia, Italy: influence of environmental exposure to lead. Neuroepidemiology. 1996;15(6):301–312. https://doi.org/10.1159/000109920.
48 Preux PM, Druet-Cabanat M, Couratier P, Debrock C, Mar-charia W, Dumas M. Estimation of the amyotrophic late-ral sclerosis incidence by capture-recapture method in the Limousin region of France. J Clin Epidemiol. 2000;53(10): 1025–1029. https://doi.org/10.1016/S0895-4356(00)00212-2.

218 Pol ann MeD. 2018;25(2):218–223
Original article
Pratima Baisakh1, Gyanranjan Nayak1, Sitanshu Kumar Panda1, Mahesh Chandra Sahu2
1 Department of Anatomy, IMS and SUM Hospital, Siksha ‘O’ Anusandhan University, Bhubaneswar, India2 Directorate of Medical Research, IMS and SUM Hospital, Siksha ‘O’ Anusandhan University, Bhubaneswar, India
Corresponding author: Pratima Baisakh, Department of Anatomy, IMS and SUM Hospital, Siksha ‘O’ Anusandhan University, K8, Kalinga Nagar, Bhubaneswar-751003, Odisha, India. Tel.: +91 9438844704.
E-mail address: [email protected].
Asymptomatic gall stone disease: A clinicopathological correlation
article info
Art ic l e h i s toryReceived 17 August 2017Accepted 12 October 2017Available online 28 May 2018
Keywords CholecystectomyGallstone diseaseH&E stainMetaplasiaAdenocarcinoma
Doi10.29089/2017.17.00039
User l i cense This work is licensed under a Creative Commons Attribution –NonCommercial – NoDerivatives 4.0 International License.
abstract
Introduct ion: The widespread use of routine ultrasound (USG) of abdomen has led to increased detection of asymptomatic gallstone disease. The cholecy-stectomy is the gold standard treatment for symptomatic gallstones. However, there is always a controversy regarding management of silent gallstones.
Aim: Present study designed to analyze the incidence of diverse histological changes found in gallbladder mucosa in silent gallstone diseases.
Mater ia l and methods : We evaluated the mucosal changes in 135 specimens collected from patients undergoing routine cholecystectomy for silent gallstone di-sease for a period of 2 years. After gross examination, the specimens were formalin fixed. Sections were taken from different areas of formalin fixed gallbladder, sta-ined with hematoxylin and eosin and examined under light microscope.
Resu l t s : Abnormal mucosa was found in 86 (63,70%) cases of gallbladder grossly. On microscopy, chronic cholecystitis was found in 121 (89,63%) cases and xantho-granulomatous cholecystitis found in 4 cases (2,96%). Follicular cholecystitis was found in 5 (3,70%) cases. Cholesterolosis was found in 25 (18.52%) cases. Epithe-lial adenomatoid hyperplasia and papillary hyperplasia were found in 1 case each. Eighteen (13.33%) cases of Gastric metaplasia, 6 (4.44%) cases of intestinal meta-plasia, 1 (0.74%) case of dysplasia and 2 cases (1.48%) adenocarcinoma were found.
Discuss ion: Silent gallstone diseases, despite being asymptomatic, always show series of mucosal changes. Data revealed metaplastic changes especially intestinal metaplasia are associated significantly with dysplastic changes.
Conc lus ion: Cholecystectomy should be done in all surgically fit silent gall-stone cases and histopathological evaluation is important in every case to exclude metaplasia, dysplasia and carcinoma.
Journal homepage: https://www.paom.pl
Polish Annals of Medicine

219 Pol ann MeD. 2018;25(2):218–223
1. INTRODUCTION
Gallstone disease is a major health problem globally includ-ing India.1 Generally, it is told that bile stasis is the main factor for gallstone formation. The gallbladder functions not only to store the bile, but also to concentrate it during the inter-digestive phase by means of salt-dependent water reabsorption.2 Gallbladder epithelium cells and biliary tract is exposed to high concentrations of potentially dangerous exogenous and endogenous compounds excreted into pri-mary bile.3 All columnar epithelial cells are lined by a blan-ket of mucus, a native physiological gel-like secretion which separates the host mucosal cells from the external milieu.4
The gallbladder mucus plays a regulatory role in cholelithi-asis as it promotes the nucleation of stones.5 Cholelithiasis is one of the most common diseases in India with an incidence of about 4%–6%.6 Mucus, calcium and lipids act in concert to form the gallstones.7 Gallbladder mucin is one of the key factors in gallstone formation. However, there is little infor-mation about the diversity of mucin secretion according to the stone composition.8 A major causative agent for stasis is gallbladder dyskinesia which in turn may be a consequence of gallbladder wall pathology.9 However, it was observed that gallbladder tension increased, rather than decreased during the early stage of gallstone formation.10 Cholelithi-asis produces diverse histopathological changes in gallblad-der mucosa namely acute inflammation, chronic inflamma-tion, glandular hyperplasia, granulomatous inflammation, cholesterosis, dysplasia and carcinoma.11
Due to liberal use of USG for abdominal symptoms inci-dence of gallstone detection is increased manyfolds. Among all the diagnosed cholelithiasis cases, 50%–70% cases diag-nosed incidentally during evaluation for other symptoms.The mucosal epithelium is high columnar with underlying lamina propria. Gallbladder mucosal changes depend on the number and type of stone, duration of disease, age and gen-
der of the patient. Depending on the chronicity of the dis-ease, gallstone causes varieties of mucosal changes ranging from inflammation to metaplasia and dysplasia.12
2. AIM
Present study designed to analyze the incidence of diverse histological changes found in gallbladder mucosa in cholecys-tectomy cases for asymptomatic gallstone disease for predic-tion of future complications in relation to age and gender of the patient that may guide for a proper management. Clinical profile and macroscopic changes in the gallbladder mucosa in patients undergoing cholecystectomy were also evaluated.
3. MATERIAL AND METHODS
This study was carried out during February 2013 to Feb-ruary 2015 on 135 patients undergoing cholecystectomy for asymptomatic gallstone disease. Mean duration of surgery from detection varies from 4 weeks to 10 years. Patients with high surgical risk, patients at extremes of age less than 10 years or over 80 years and patients with pregnancy were ex-cluded from our study group. Detailed gross examination of the resected specimens with number and type of stone were studied. Parameters for gross inspection includes: appearance of serosal surface, wall thickness, mucosal tex-ture, cystic duct. For microscopy, the specimens were fixed in 10% formalin and sections were taken from body, fun-dus, neck and abnormal looking sites. They were stained in haematoxylin and eosin stain and seen under light mi-croscope. The different microscopic changes like inflamma-tion, hyperplasia, cholesterolosis, metaplasia, dysplasia and CIS were studied.
Table 1. Patient demographic data.
Age of patient Mean age 45 years (10–76 years)
Male 60
Female 75
Mean duration of sugeySince detection
16 weeks (3 days to 12 years)
Single stone 45
Multiple stones 90
Table 2. Type of stone.
Type of stone Single Multiple Total
Cholesterol 17 23 40
Pigment 18 17 35
Mixed 10 50 60
Total 45 90 135Comments: γ2 P value = 0.001.
Table 3. Operative findings /Gross features.
Macroscoping finding Features Number Percentage (%)
Serosal surfaceNormal 106 78.5
Congested 29 21.5
Wall
Normal 17 12.6
Thin walled 97 71.9
Thick walled 16 11.9
Focal thickening 5 3.7
Mucosa
Normal 49 36.3
Ulcerated 11 8.1
Haemorrhagic 7 5.2
Atrophic 54 40.0
Nodular 14 10.4
Cystic ductStone impacted 4 3.0
Wide cystic duct 4 3.0

220 Pol ann MeD. 2018;25(2):218–223
4. RESULTS
Out of 135 cases 60 were male and 75 female. Though the number of affected female was more as compared to male but it is not significant (P = 0.085). Mean age of presenta-tion was 45 years (10–76 years). Multiple stones were found in 90 cases and single stone in 45 cases (Table 1). Most com-mon type of stone found was mixed type in 60 (44.4%) cases, followed by cholesterol stone in 40 (29.6%) cases and pig-ment stone in 35 (25.9%) cases (Table 2). On gross examina-tion serosal surface was found normal in 106 (78.5%) cases and congested in only 29 (22.5%) cases. The wall thickness found normal (3 mm) in 17 (12.6%) cases, thin walled (<3 mm) in 97 (71.9%) cases, thickened in 16 (11.9%) cases and focal thickening was found in 5 (3.7%) cases. Impacted stone in cystic duct was found in 4 (3.0%) cases, wide cystic duct in 4 (3.0%) cases and rest were found normal. On macroscopic examination of mucosa, it was found normal in 49 (36.3%) cases, ulcerated in 11 (8.1%) cases, haemorrhagic in 7 (5.2%)
Table 4. Microscopic changes with gender*.
Changes Male Female Total
Chronic cholecystitis 38 83 121
Eosinophilic cholecystitis 0 1 1
Follicular cholecystitis 2 3 5
Xanthogranulomatous cholecystitis 1 3 4
Cholesterosis 10 15 25
Papillary hyperplasia 10 13 23
Adenomatous hyperplasia 0 1 1
Gastric metaplasia 7 11 18
Intestinal metaplasia 2 6 8
Dysplasia 0 1 1
Adeno ca 1 1 2
TotalComments: * T test: P = 0.226638.
Figure 1. Chronic cholecystitis: Chronically inflammed mucosa with lympho-plasmacytic infiltrate in the wall.
Figure 2. Cholestesterosis: Sheets of foamy macrophages infiltration in the lamina propria.
Figure 3. Xanthogranulomatouscholecystitis: Wall of the gallbladder infiltrated with sheets of foamy histiocytes, lymphocytes, plasma cells and multinucleated giant cells.
Figure 4. Lymphocytic cholecystitis: Wall of the gallblad-der shows multiple lymphoid follicle formation.

221 Pol ann MeD. 2018;25(2):218–223
Table 5. Mucosal changes according to age group.
ChangesAge groups
10–19 20–29 30–39 40–49 50–59 60–69 70–79 Total
Chronic cholecystitis 5 28 26 18 25 15 7 124
Eosinophilic cholecystitis 0 0 0 1 0 0 0 1
Follicular cholecystitis 0 0 2 1 1 1 0 5
Xanthogranulomatous cholecystitis 0 0 0 1 2 1 0 4
Cholesterosis 0 2 4 6 8 3 2 25
Papillary hyperplasia 0 0 1 3 5 6 8 23
Adenomatous hyperplasia 0 0 0 1 0 0 0 1
Gastric metaplasia 0 3 6 5 2 1 1 18
Intestinal metaplasia 0 0 1 1 3 3 0 8
Dysplasia 0 0 0 0 0 1 0 1
Adeno ca 0 0 0 0 1 1 0 2
Total 5 33 40 37 47 32 18 212
Figure 5. Gastric metaplasia: Mucosa showing lobules of pyloric gland.
Figure 6. Intestinal metaplasia: Intestinal type glands with goblet cell metaplasia.
Figure 7. Dysplasia: Glands showing high grade dyspla-sia limited to mucousa.
Figure 8. Adenocarcinoma: Infiltrative neoplastic glands in the lamina propria and muscularis propria.

222 Pol ann MeD. 2018;25(2):218–223
cases, atrophic in 54 (40.0%) cases and nodular in 14 (10.4%) cases (Table 3). On microscopic examination, chronic chole-cystitis reported in 121 (89.6%) cases (Figure 1). Twenty five (18.5%) cases of cholesterolosis (Figure 2), 4 (3.0%) cases of xanthogranulomatous cholecystitis (Figure 3), 1 (0.7%) case of eosinophilic cholecystitis and 5 (3.7%) cases of follicular cholecystitis (Figure 4) were noted. In hyperplasia of muco-sa, adenomatous hyperplasia in 1 (0.7%) case and papillary hyperplasia in 23 (17.0%) cases were seen. Gastric metapla-sia (Figure 5) was reported in 18 (13.3%) cases, intestinal metaplasia (Figure 6) in 6 (4.4%) cases, dysplasia (Figure 7) in 1 (0.7%) case and adenocarcinoma (Figure 8) in 2 (1.5%) cases (Table 4). Analyzing the age gradient, papillary hy-perplasia, gastric metaplasia and intestinal metaplasia were found in age group of 50–79, 30–49 and 50–69 years respec-tively. Dysplasia and adenocarcinoma were found in 60–69 years age group (Table 5).
5. DISCUSSION
Cholelithiasis causes injury to mucosa and leads to a series of changes ranging from inflammation, hyperplasia, choles-terolosis13 and precancerous condition like metaplasia, dys-plasia and neoplastic lesions.14 It is the most common cause of gallbladder cancer worldwide.15 In the present study, we have taken patients undergoing cholecystectomy for asymp-tomatic gallstones. Their age ranges 10–79 years. Maximum cases are in the age group of 5th decade (23.7%) followed by 4th (21.5%) and 3rd decade (19.2%). Mean age in the present study is 45 years where as in study by Sood et al. and Ba-narjee et al. it was 43.5 years and 39.5 years, respectively. Male to female ratio is 1 : 1.25 where as in other studies it ranges from 1 : 3.2 to 1 : 6.5.16 This may be due to type of patient and regional variation. In present study chronic inflammation was the most common finding found in 90% cases. This coincides with the study by Sood et al. where they found 92% cases were having chronic cholecystitis. Features of acute cholecystitis was not found in our study where as study by Vahini et al. (2015) showed 18.3% cases having acute cholecystits.17 This can be explained on basis of patient selection criteria and their duration between di-agnosis and resection of gallbladder. We found eosinophillic cholecystitis in 1 (0.7%) case which is similar to a study by Kaur et al. (0.78%) and Vahini et al. (0.9%). Many hypoth-eses proposed for eosinophilic cholecystitis18 but in our case it may be idiopathic. Xanthogranulomatous cholecystitis was found in 4 (3.0%) cases. Non-neoplastic lesions were found in 80% cases and maximum cases (66.6%) were associ-ated with multiple stone. Similar result was found by Goyal et al. (2014)6 who showed multiple stones are more com-mon than single stone (72%).19 Mixed stone was the most common type of stone (44.4%) in our study. Cholesterol and pigment stones were found in 29.6% and 25.9% cases, re-spectively. In present study we found metaplasia associated with chronic cholecystitis in 19% cases. Out of which antral metaplasia and intestinal metaplasia are 13% and 6%, re-
spectively. In contrast, a data given by Mukhapadhyay and Landas20 where antral and intestinal metaplasia were 59.5% and 9.8%, respectively. They have demonstrated the age gra-dient in progression of disease from antral-type metaplasia to intestinal metaplasia to dysplasia.20 Similar age gradients were seen in our study. We found antral type metaplasia more common in age group 30–50 years, intestinal metapla-sia in 50–69 years age group and dysplasia in 60–69 years age group. However, incidence of dysplasia alone was very low (0.7%) compared to simillar studies. Albores-Saavedra et al. found dysplasia in 13.5% of Mexican patients and Duarte et al. also reported similar findings (13.6%) from Chile. This differences in incidence of dysplasia in our case series can be explained by factors like smaller sample size, inter-observer variation of precursor lesions and the most importantly ge-ographic and racial differences. Adenocarcinoma was found in 2 (1.5%) cases above 60 years. Occurence of gallbladder cancer is more related to duration of gallstone disease not to age of patient.20 A study by Behari et al. shows after 13 years of follow up in asymptomatic case and only 0.2% of them di-agnosed to have cancer.21 According to some autopsy studies only 1%–4% of patients with cholelithhiasis developed can-cer compared to those not containing gall stone. Treatment of silent gallstone disease is still a mater of confusion to sur-geons. Shukla et al. reported highest incidence of gallblad-der carcinoma in the world in Indo-Gangetic belt of India.22
6. CONCLUSIONS
As explained by present study there is an age gradient change from inflammatory pathology to metaplasia and then dysplasia. The incidences of malignant and premalig-nant cases are increasingly being detected. Therefore, in all cases of silent gallstone disease, gallbladder should be re-sected if patient condition permits.
AcknowledgementsAuthors are grateful to Dean, IMS and SUM Hospital for extended facilities in this research work.
References1 Baig SJ, Biswas S, Das S, Basu K, Chattopadhyay G. Histo-
pathological changes in gallbladder mucosa in cholelithia-sis: correlation with chemical composition of gallstones. Trop Gastroenterol. 2002;23(1):25–27.
2 Meyer G, Guizzardi F, Rodighiero S, et al. Ion transport across the gallbladder epithelium. Curr Drug Targets Immu-ne Endocr Metabol Disord. 2005;5(2):143–151. https://doi.org/10.2174/1568008054064805.
3 Aust S, Obrist P, Jaeger W, et al. Subcellular localization of the ABCG2 transporter in normal and malignant human gallbladder epithelium. Lab Invest. 2004;84(8):1024–1036. https://doi.org/10.1038/labinvest.3700127.
4 Kuver R, Klinkspoor JH, Osborne WR, et al. Mucous granule exocytosis and CFTR expression in gallbladder

223 Pol ann MeD. 2018;25(2):218–223
epithelium. Glycobiology. 2000;10(2):149–157. https://doi.org/10.1093/glycob/10.2.149.
5 Afdhal NH, Smith BF. Choleterol crystal nucleation: A decade-long search for the missing link in gallbladder pa-thogenesis. Hepatology. 1990;11(4):669–702. https://doi.org/10.1002/hep.1840110426.
6 Goyal S, Singla S, Duhan A. Correlation between gall-stones characteristics and gallbladder mucosal changes: A retrospective study of 313 patients. Clin Cancer Inve-stig J. 2014;3(2):157–161. https://doi.org/10.4103/2278-0513.130215.
7 Jacyna MR. Interactions between gallbladder bile and muco-sa; Relevance to gallstone formation. Gut. 1990;31(5):568–570. https://doi.org/10.1136/gut.31.5.568.
8 Kim HJ, Kim JS, Kim KO, et al. [Expression of MUC3, MUC5AC, MUC6 and epidermal growth factor receptor in gallbladder epithelium according to gallstone composition]. Korean J Gastroenterol. 2003;42(4):330–336 [in Korean].
9 Velanovich VF. Biliary dyskinesia and biliary crystals: a pro-spective study. Am Surg. 1997;63(1):69–73.
10 Lange K, Gottschalk M. [Gallbladder contractility in early stages of lithogenesis in the lithogenic fed guinea pig]. Z Ga-stroenterol; 1995;33(6):333–339 [in German].
11 Kouroumalis E, Hopwood D, Ross PE, Milne G, Bouchier IA. Gallbladder epithelial acid hydrolases in human cho-lecystitis. J Pathol. 1983;139(2):179–191. https://doi.org/10.1002/path.1711390209.
12 Sood S, Kumar R, Varshney A, et al. A histopathological stu-dy of non-neoplastic gall bladder diseases with special refe-rence to mucinhistochemistry. AABS. 2016;3(2):A189–A195.
13 Zaki M, Al-Refeidi A. Histological changes in the Human Gallbladder Epithelium associated with gallstones. OMJ. 2009;24(4):1–5. https://doi.org/10.5001/omj.2009.55.
14 Gupta SC, Misra V, Singh PA, Roy A, Misra SP, Gupta AK. Gall stones and carcinoma gall bladder. Indian J Pathol Mi-crobiol. 2000;43(2):147–154.
15 Meirelles-Costa AL, Bresciani CJ, Perez RO, Bresciani BH, Siqueira SA, Cecconello I. Are histological alterations obse-rved in the gallbladder precancerous lesions? Clinics (Sao Paulo). 2010;65(2):143–150. https://doi.org/10.1590/S1807-59322010000200005.
16 Mohan H, Punia RP, Dhawan SB, Sekhon MS. Morphologi-cal spectrum of gallstone disease in 1100 cholecystectomies in North India. Indian J Surg. 2005;67(3):140–142.
17 Vahini G, Premalatha P, Mathi A, et al. A Clinicopathological Study of Gallbladder Lesions. IOSR-JDMS. 2015;14(2):15–20. https://doi.org/10.9790/0853-142XXXXX.
18 Sheth S, Bedford A, Chopra S. Primary gallbladder can-cer: Recognition of risk factors and the role of prophylactic cholecystectomy. Am J Gastroenterol. 2000;95(6):1402–1410. https://doi.org/10.1111/j.1572-0241.2000.02070.x.
19 Satoh H, Koga A. Fine structure of cholesterolosis in the human gallbladder and the mechanism of lipid accumu-lation. Microsc Res Tech. 1997;39(1)14–21. https://doi.org/10.1002/(SICI)1097-0029(19971001)39:1<14::AID--JEMT2>3.0.CO;2-#.
20 Mukhopadhyay S, Landas SK. Putative Precursors of Gall-bladder Dysplasia A Review of 400 Routinely Resected Speci-mens. Arch Pathol Lab Med. 2005;129(3):386–390. https://doi.org/10.1043/1543-2165(2005)129<386:PPOGDA>2.0.CO;2.
21 Behari A, Kapoor VK. Asymptomatic Gallstones (AsGS) – To Treat or Not to?. Indian J Surg. 2012;74(1):4–12. https://doi.org/10.1007/s12262-011-0376-5.
22 Shukla HS, Avasthi K, Naithani YP. A clinicopathological study of the carcinoma of the gallbladder. Indian J Cancer. 1981;18:198–201.
224 Pol ann MeD. 2018;25(2):224–230
Original article
Fatemeh Adeli1, Ameneh Alikarami1, Shohreh Fakhari2, Seyed Hadi Anjamrooz1, Ali Jalili2, Ayoob Rostamzadeh3, Mohsen Mohammadi4, Daem Roshani5, Mohammad Jafar Rezaie6
1 Department of Anatomical Sciences, Faculty of Medicine, Kurdistan University of Medical Sciences, Sanandaj, Iran2 Department of Immunology and Hematology, Faculty of Medicine, Kurdistan University of Medical Sciences, Sanandaj, Iran
3 Department of Anatomy and Neuroscience, Shahrekord University of Medical Sciences, Shahrekord, Iran4Department of Pharmaceutical Biotechnology, Faculty of Pharmacy, Lorestan University of Medical Sciences, Khorramabad, Iran
5 Department of Biostatistics, Faculty of Medicine, Kurdistan University of Medical Sciences, Sanandaj, Iran6 Department of Anatomy, Faculty of Medicine, Kurdistan University of Medical Sciences, Sanandaj, Iran
Corresponding author: Mohammad Jafar Rezaie, Department of Anatomy, Faculty of Medicine, Kurdistan University of Medical Sciences, Sanandaj, Iran. Tel.: +988733664653, Fax: +988716664663.
E-mail address: [email protected].
Human embryonic stem cell-conditioned medium induces cell cycle arrest in HL60 cells by unknown soluble factor(s) in vitro
article info
Art ic l e h i s toryReceived 21 April 2017Accepted 13 June 2017Available online 29 June 2018
Keywords Embryonic stem cellCell cycleApoptosisAcute myeloid leukemiaCell proliferation
Doi10.29089/2017.17.00059
User l i cense This work is licensed under a Creative Commons Attribution –NonCommercial – NoDerivatives 4.0 International License.
abstract
Introduct ion: Acute myeloid leukemia (AML) is a type of cancer that affects the blood and bone marrow, characterized by the rapid growth of abnormal white blood cells.
Aim: The aim of the present study was to evaluate the inhibitory effect of hu-man embryonic stem cell – conditioned medium (hESC-CM) on the prolifera-tion of human leukemic HL-60 cells.
Mater ia l and methods : We measured proliferation of myeloid leukemia cell by XTT assay. Also cell cycle and apoptosis was measured by flow cytometry after the cells stained.
Resu l t s and d i scuss ion: Our experiment indicated that the human em-bryonic stem cells conditioned medium has anti-proliferative effects on the pro-gression of HL60 cell. HL60 cells were treated with conditioned medium; the re-sults of the flow cytometry demonstrate that hESC-CM was capable of increasing apoptosis of HL60 cells and inhibit the cell cycle progression.
Conc lus ions : Our results show that Human embryonic stem cell conditioned medium contain factors that are able to inhibit the growth and inducing apopto-sis of HL60 cells, which may represent a novel therapeutic approach for leuke-mia. However, further investigation is needed to identify the role of these factors.
Journal homepage: https://www.paom.pl
Polish Annals of Medicine

225 Pol ann MeD. 2018;25(2):224–230
1. INTRODUCTION
Acute myeloid leukemia (AML) is a type of malignancy he-matopoietic cells, characterized by the rapid growth of ab-normal white blood cells. AML is recognized as the ordinary form of acute leukemia among adults with higher outbreak in older patients. At present, the basic therapy for leukemia includes allogeneic hematopoietic stem cell transplantation, chemotherapy and immunotherapy.1 However, its survival rates remain down because of inappropriate selection of re-cipients and transplant donors, the high relapse rate, incon-venience of chemotherapy and hard complications.2 Hence, the exploration of new methods for AML therapy is an ever ecumenical interest. Although pluripotent stem cell is an attractive source for regenerative medicine, one of the ma-jor concerns of cell therapy is defective in vitro cell differ-entiation, which may form teratomas in recipient tissues.3–5 Some studies demonstrated useful effects of paracrine factors secreted by stem cells in various diseases. The secreted fac-tors contain secretome, exosome, etc. which can be detected in the medium. Thus, this medium is called supernatant or conditioned medium (CM). The use of CM has several ex-cellences against the use of stem cells. For example, those produced, packaged, and transported for CM are more easily than stem cells and since the CM is acellular, there are no transplant rejection problems and high risk development of cancer.6,7 Examinations in recent years have shown that em-bryonic stem cells (ESCs) make anti-tumor effects in both vitro and vivo.8–12 Researches have revealed that the embry-onic microenvironment plays a key role in blocking cancer cells proliferation.8,13–15 We hypothesized that ESCs could secrete soluble factors that are capable of arresting cancer cells proliferation. Previous studies have demonstrated that human ES cells and embryonic zebrafish microenvironment could suppress the tumorigenicity of breast, prostate and metastatic melanoma cancer cells.13,16 Giuffrida et al. assessed effect of hES cells conditioned medium on human epithe-lial, ovarian, prostate and breast cancer cells proliferation. In their study, cancer cells proliferation were reduced after exposure to hES cell-conditioned media.17 Considering that there are slight reports in relation with antitumor effect of embryonic stem cells conditioned medium on cancer cells.
2. AIM
The aim of the study was to evaluate the inhibitory effect of human embryonic stem cell-conditioned medium (hESC-CM) on the proliferation of human leukemic HL-60 cells.
3. MATERIAL AND METHODS
3.1. Cells and reagentsThe HL-60 cell obtained from the Iranian national cell bank (Pasteur Institute, Tehran, Iran). hESC and MEF cell was purchased from ROYAN Institute (Tehran, Iran). RPMI
1640 medium (Bio Idea Co., Tehran, Iran) that was used for positive control. DMEM/F12, knockout serum, non-essential amino acids (NEAAs), L-glutamine, penicillin/streptomycin (Pen/Strep), insulin, transferrin, selenium (ITS), collagenase IV solution, 0.05% Trypsin/EDTA solution and PBS were purchased from Invitrogen Life Technologies (Carlsbad, CA, USA). Basic fibroblast growth factor (bFGF) was purchased from ROYAN Institute (Tehran, Iran). Furthermore, dime-thyl sulphoxide (DMSO), rock inhibitor (Y 27-632) (1 μM), beta-mercaptoethanol (β-ME), CaCl2, mitomycin C powder and fetal bovine serum (FBS) were purchased from Sigma-Aldrich (St. Louis, MO, USA). Moreover, colorimetric cell viability kit with the tetrazolium salt WST-8 (2-(2-meth-oxy-4-nitrophenyl)-3-(4-nitrophenyl)-5-(2,4-disulfophe-nyl)-2H-tetrazolium, monosodium salt) was purchased from Promokine (Heidelberg, Germany). Propidium iodide (PI), RNase type A and annexin V-FITC were purchased from eBiosciense (San Diego, CA).
3.2. Cell cultureHL-60 cells were suspended cell types. HL-60 cell were in-cubated in RPMI 1640 media supplemented with 10% FBS and 100 l Penestrapat 37°C in an atmosphere of 5% CO2.
3.3. Stem cell cultureThis cell has been of the type adhesion. hESC cell were cultured in 90 mm dishes coated with MEF cell that had been mitotically inactivated with mitomycin. We used hESCs passages 21. These cell were maintained in DMEM-F12, supplemented with 20% Knockout serum, 0.1Mm non-essential amino acids, 2 mM L-glutamine, 0.1 mM β-mercaptoethanol, 100 U⁄μg⁄mL Penstrep, 5 mg/μg/mL insulin, transferrin, selenium 12 ng/mL basic fibroblast growth factor and then placed the cells in the incubator at 37°C in an atmosphere of 5% CO2.
3.4. Preparation condition mediumControl conditioned medium were collected by incubat-ing 10 mL of hESC medium on dish covered with MEF cells for 24 h and 48 h. hESC conditioned medium was obtained by incubation of stem cells on a dish covered with MEF cells with 10 mL stem cell media for 24 h or 48 h. Stem cells should be examined for stem cell markers such as SSEA1, TRA-1-60, TRA-1-81 to undifferentiate during the time intended. Feeders were plated at 600 000 cells per plate and hESCs were plated at 1000 000 cells per plate. Then conditioned medium was harvested from the dishes with the initial centrifuge at 3000 rpm for 5 minutes, and then it was passed through a 0.2 μm syringe filter to re-move cellular debris.
3.5. Cell proliferation assayCell growth and cell viability was assessed using the Col-orimetric Cell Vability Kit (WST-8) based on the reduction of tetrazolium salt to soluble formazan compounds by mi-tochondrial enzymes. Cells (5000 cells/well) with growth medium were seeded in a 96-well plate and cells then in-

226 Pol ann MeD. 2018;25(2):224–230
cubated with different conditioned media for each experi-ment. At the end of the incubation time-periods (24 h ,48 h) 10 l CCK8 solution was added to each well to be analyzed and cells were incubated for 4 h at 37°C. After an incubation period of 4 h the absorbance of the samples was measured using an ELISA reader at 450 nm.
3.6. Apoptosis assays The cell apoptosis was assessed by dual staining with an-nexin V-FITC and PI. Cells were plated at a density of 200 000–250 000 cells⁄well in 2 mL of growth medium or CM in 6-well plates. HL-60 was treated with conditioned media: day 2 MEF-CM as control and day 2 hESC-CM for 48 h. HL-60 cells were centrifuged and washed in PBS then they were resuspended in 100 μL binding buffer and were stained with 5 μL of annexin V-FITC and 10 μL of PI for 15 minutes in the dark and analyzed by flow cytometry.
3.7. Cell cycle analysisCells were plated at a density of 106 cells in 6 mL of growth medium or CM in flask then cultured for 48 h. After har-vesting, washing and resuspending in 1 mL PBS, then 2 mL FCM buffer and resuspended in 500λ sodium citrate solu-tion containing 3 μL of RNase and 15 μL of PI. Cells were analyzed by flow cytometry.
3.8. Statistical analysisResults are reported as mean ± standard error of the mean of three to six replicates per group. Data were analyzed using oneway ANOVA and Tukey test using SPSS (V.20, USA). A statistically significant difference was accepted when the P value was lower than 0.05.
4. RESULTS
4.1. Effects of hESC-CM on HL60 cell prolife -ration The present study initially investigated anti-cancer effect of human embryonic stem cells condition medium on the pro-liferation of HL60 cells in vitro. We examined the population progression of HL60 cells exposed to 1 and 2 day hESC CM by the cell counting kit-8 assay or haemocytometer counting (Figure 1). hESC-CM exhibited significant decrease in cell proliferation rate in HL60 in the experimental group after 48 h. CM was collected from MEF alone as main control and RPMI medium + 10% serum and embryonic stem cell medium were used as additional controls. There was no dif-ference between cells exposed with the control groups after 48 h (Figure 1a). Incubation of the HL60 cell with one day hESC-CM suppressed cell proliferation significantly, after 48 h of culture. Utilization of two day CM caused stronger suppression compared to one day CM (Figure 1b). Results revealed significant difference in percent cell viability be-tween treatment and control groups in the direct cell counts (Figure 1c).
4.2. Effect of dilutions of hESC CM 48h on HL60 cancer cell proliferation Furthermore, in the next experiments the anti-proliferative effect of CM on HL60 cell was evaluated by incubation with dilution of CM 1 : 1 with fresh medium. Cell propagation should not be suppressed if the effect was due to cell hunger. Data cell counting kit-8 assay indicated significant inhibi-tory effect of two day hESC-CM 50% on HL60 cell prolifera-tion after 48 h incubation (Figure 2).
Figure 1. The effect of hESC-CM on the proliferation of HL60 cancer cells. HL60 cells were treated with MEF--CM, hESC-CM, RPMI and ES media and incubated for 24–48 h. (a) HL60 cell proliferation did not change signi-ficantly between the control groups. (b) The number of HL60 cell was less significantin the treated groups than the control groups.(c) Percent cell viability decreased si-gnificantly in the treatment group. Values are presented as the mean ± SD of six replicates (* P < 0.05 , ** P < 0.001 vs. control).

227 Pol ann MeD. 2018;25(2):224–230
4.3. hESC-CM did not affect the population proliferation of MNC To demonstrate the therapeutic effect, we investigated abil-ity of CM to suppress cell proliferation of normal mononu-clear cell (MNC). Cell proliferation was evaluated by XTT assay. The results showed one, two days hESC-CM did not change significantly on MNC proliferation than the control groups. The findings confirmed that there was no inhibitory effect of CM on normal cells and there is safer clinical ap-plication (Figure 3).
4.4. Induction of apoptosis of cancer cells by hESC-CM As mentioned above two day hESC-CM had the strong-est effect on cancer cell growth, and then we investigated whether hESC-CM induced cell apoptosis. HL60 cell were treated with two day hESC-CM or MEF-CM for 48 h. Cells
were stained with annexin and PI and were analyzed by flowcytometry. Cells that were negative for annexin and PI are live cells (Q1), cells positive for annexin and negative for PI, cells underwent early apoptosis (Q2), while cells posi-tive for annexin and PI, cells underwent late apoptotic (Q3), (necrotic cells = Q4). We observed increased percentage of early and late apoptotic cells in the test group more than the control group (Figure 4).
4.5. hESC-CM treatment induces G1 phase cell cycle arrestEvaluation of the cell cycle phase showed that HL60 cells treated with two day hESC-CM had a marked increase in the percentages of cells at the G1 phase compared to controls af-ter 48 h with a significant reduction in both the G2 and S phase. We found that CM increased the percentage for cells of G1 from 25.37% in control to 36.04 % (for hESC CM) and
Figure 4. Annexin V-PI apoptosis assay. HL60 cell treated with two day hESC-CM and cells were stained and then analyzed by flow cytometry. HL60 cells were treated with two day hESC-CM significant induces apoptosis than the control group. Values are presented as the mean ± SD of three replicates (P < 0.05 vs. control).
Figure 2. The effect of dilutions of 2 day hESC-CM on the proliferation of HL60 cancer cells. HL60 cells were exposed to hESC-CM 50% and 100% dilution for 48 h. Treatment of hESC-CM led to a significant reduction in the cell number versus control. Values are presented as the mean ± SD of six replicates (** P < 0.001 vs. control).
Figure 3. The effect of two day hESC-CM on the prolife-ration of MNC. MNC were treated with two day hESC--CM for 24h, 48 h. MNC cell proliferation did not change significantly after treatment with hESC-CM. Values are presented as the mean ± SD of six replicates.

228 Pol ann MeD. 2018;25(2):224–230
decreased cell number in S phase from 48.89% to 41.55% and in G2 from 22.97% to 14.18%, indicating that hESC-CM may induce G1 growth arrest in HL60 cells (Figure 5).
5. DISCUSSION
Cancer is an aberration of the normal cell expansion and can be regulated by signals present in the embryonic microenvi-ronment. Previous studies demonstrated that the transfusion of embryonic carcinoma cells into a blastocyst is able to ad-just cancer cell. The fate of the cancer cells inject into embryo are induced to die and to arrest growth or they are towards to differentiating pathways.18 The potential use of hESCs as a cell appealing source for stem cell therapy is rapidly develop-ing based on continuous proliferation of their capacity and can also be induced to differentiate.5,16,19 ESCs could produce clear anticancer effects. ESCs could secrete paracrine and au-tocrine factors that are capable of regulating cellular behavior such as slow cancer cells proliferation.10,20,21 The aim of us-ing secretions to stem cells is to discover the factors within it and inhibit tumor cell feature and/or reprogrammed to a nonaggressive phenotype.14,15,22 It has recently been observed that there are factors in a hESC-conditioned matrix that po-tentially makes the reprogramming of cancer cells.21 Studies reveal that ESC-CM may be a proper alternative to stem cell transplantation whereas it does not have the potential risk of developing cancer, but the concentration of soluble factors in CM and components of the culture medium are improper for
therapeutic use.6 In the last decade, a novel research has been initiated with a focus on the anticancer effects of stem cells condition medium on tumor growth.23 The exact mechanism of how SC-CM or their extracts inhibit the progression of malignant cells is not clear but several studies demonstrat-ed that the anticancer effects can be mediated by a variety of mechanisms rather than a single mechanism different for non-solid and solid cancers.24 These mechanisms are perhaps to be mediated secrete factors that inhibit the proliferation of the cancer cells.24 Studies are in development to recognize the unique agents present in the CM that are responsible for the anticancer effects on types of cancers.16,24,25 Stem cells inhibit tumor growth via three pathways: the reduction of prolifera-tion, induction of apoptosis and the excitation of cell cycle arrest.23 hESC-CM have been shown to demonstrate anti-pro-liferation properties. The present study confirmed that CM from hESC share anticancer characteristics in HL60 cells and significantly inhibited the proliferation of HL60 cells. Kim clarified the use of a mES-conditioned matrigel to prevent growth of human melanoma cells. They detected an gremlin in the ES cell microenvironment responsible for inhibiting cancer cell proliferation.20 Giuffrida et al. assessed the effect of hESC-CM on human epithelial cancer cell proliferation. They studied cancer cell proliferation reduction then expo-sure to hESC-CM as contrasted to the control.16 In this study it was shown that induction of apoptosis by CM is one of the mechanisms that reduce proliferation of HL60 cells. Studies have reported that conditioned medium derived from human Wharton’s jelly stem cells increase autophagy and apoptosis
Figure 5. Cell cycle phase analysis of HL60 cells. HL60 cells incubated with two day hESC-CM for 48 h then analyzed by flow cytometry. Two day hESC-CM significant induces cell cycle arrest in HL60 cells at G1 phase with a concomi-tant decrease of cell number in S, G2 phase than the control group. Values are presented as the mean ± SD of three replicates (P < 0.05 vs. control).

229 Pol ann MeD. 2018;25(2):224–230
of cancer cells.26 Postovit demonstrates that presentation of cancer cells to the ES cell-conditioned matrigel could prevent Nodal gene expression in cancer cells leading to apoptosis.27 It is recently assumed that in CM such as chemotherapy drugs releasing hydrogen peroxide (H2O2), the exposure of malig-nant cells to high H2O2 levels after 48 h incubation causes their death.24 Another anti-proliferation mechanism of the CM is cell-cycle arrest. Regulation of the cell cycle is neces-sary to retain harmony between differentiation and prolifera-tion in cells. Checkpoints are regulating cell cycle arrest or progression. Cancer occurs when these checkpoints flunk and damage cells survive. Blocking cancer cells in the G1 phase or returning the cell cycle checkpoints will arrest the growth of the cancer.28 In the present study, we found that there was an enhancement percentage of the HL60 cancer cell in the G1 phase when the cells were treated with two day hESC-CM. This enhancement was accompanied whit reduction of cells in the S and G2 phases compared to cells cultured in control group. Hence we hypothesized that CM factors arrest the propagation of cancer cells through the cell cycle. Results demonstrated that the observed repressive effects were due to inhibitory factors secreted by hESCs. Lin demonstrated that conditioned medium drived human umbilical cord Wharton’s jelly stem cells (hWJSC-CM) possess tumoricidal effects and significant increases in the percentages of lym-phoma cells at the G1 phase and increased apoptosis in cell compared to controls after 48 h of exposure to the hWJSC-CM.24 Cavallari demonstrated that the embryonic soluble fac-tors are able to decrease cancer cell proliferation by arresting their cell cycle.29 The data showed that human fetal MSC-CM can inhibit HCC cell proliferation and induction of cell cycle arrest.16 The results of this study confirmed that both concentrations of conditioned medium produced significant reductions of cell proliferation and similar to other studies demonstrated that evacuation of nutrients in hESC-CM do not cause the inhibition of cancer cell proliferation.16 Also, the findings indicated that medium condition derived from adipose tissue significantly reduced the propagation of B16 melanoma cells in a time dependent manner.30 In addition to these in vitro evidences, our results showed that hESC-CM did not induce decrease of proliferation and apoptosis of normal MNC, indicating that hESC-CM may be promising candidates for future therapeutic strategies.
6. CONCLUSIONS
In conclusion, our finding show that hESC-CM contain fac-tors that are able to inhibit the growth and induce of apop-tosis of HL60 cells, which may represent a novel therapeu-tic approach for leukemia. However, further investigation is needed to identify the role of these factors.
Conflict of interestNone declared.
AcknowledgmentsThis research was supported by Kurdistan University of Medical Sciences. (IR.MUK.REC.1395.25). The authors would like to thank the staff of the Cellular and Molecu-lar Research Center, Kurdistan University of Medical Sci-ences, for their kind cooperation. Moreover, we would like to appreciate the kindness of Dr. Abas Ahmadi for his as-sistance.
References 1 Xia J, Chen SF, Lv YP, Lu LN, Hu WX, Zhou YL.
ZGDHu-1 induces G2/M phase arrest and apoptosis in Ka-sumi-1 cells. Mol Med Rep. 2015;11(5):3398–3404. https://doi.org/10.3892/mmr.2015.3160.
2 Wei S, Wang Y, Chai Q, Fang Q, Zhang Y, Wang J. In vivo and in vitro effects of heme oxygenase-1 silencing on the su-rvival of acute myelocytic leukemia-M2 cells. Expe Ther Med. 2015;9(3):931–940. https://doi.org/10.3892/etm.2015.2209.
3 Gordeeva O, Nikonova T. Development of experimental tumors formed by mouse and human embryonic stem and teratocarcinoma cells after subcutaneous and intraperitone-al transplantations into immunodeficient and immunocom-petent mice. Cell Transplant. 2013;22(10):1901–1914. https://doi.org/10.3727/096368912X657837.
4 Ben-David U, Benvenisty N. The tumorigenicity of human embryonic and induced pluripotent stem cells. Nat Rev Can-cer. 2011;11(4):268–277. https://doi.org/10.1038/nrc3034.
5 Herberts CA, Kwa MS, Hermsen HP. Risk factors in the development of stem cell therapy. J Transl Med. 2011;9:1. https://doi.org/10.1186/1479-5876-9-29.
6 Bhang SH, Lee S, Shin J-Y, Lee T-J, Jang H-K, Kim B-S. Ef-ficacious and clinically relevant conditioned medium of hu-man adipose-derived stem cells for therapeutic angiogene-sis. Mol Ther. 2014;22(4):862–872. https://doi.org/10.1038/mt.2013.301.
7 Pawitan JA. Prospect of stem cell conditioned medium in regenerative medicine. BioMed Res Int. 2014;2014:1–5. https://doi.org/10.1155/2014/965849.
8 Díez-Torre A, Andrade R, Eguizábal C, et al. Reprogramming of melanoma cells by embryonic microenvironments. Int J Dev Biol. 2009;53(8–10):1563–1568. https://doi.org/10.1387/ijdb.093021ad.
9 Dong W, Du J, Shen H, et al. Administration of embryonic stem cells generates effective antitumor immunity in mice with minor and heavy tumor load. Cancer Immunol Immuno-ther. 2010;59(11):1697–1705. https://doi.org/10.1007/s00262-010-0899-9.
10 Dong W, Qiu C, Shen H, Liu Q, Du J. Antitumor effect of embryonic stem cells in a non-small cell lung cancer mo-del: antitumor factors and immune responses. Int J Med Sci. 2013;10(10):1314. https://doi.org/10.7150/ijms.6538.
11 Li Y, Zeng H, Xu RH, Liu B, Li Z. Vaccination with hu-man pluripotent stem cells generates a broad spectrum of immunological and clinical responses against colon cancer. Stem Cells. 2009;27(12):3103–3111. https://doi.org/10.1002/stem.234.
12 Mocan T, Iancu C. Effective colon cancer prophylaxis in mice using embryonic stem cells and carbon nanotubes. Int J Nanomedicine. 2011;6:1945–1954. https://doi.org/10.2147/IJN.S24060.

230 Pol ann MeD. 2018;25(2):224–230
13 Raof NA, Raja WK, Castracane J, Xie Y. Bioengineering embryonic stem cell microenvironments for exploring inhi-bitory effects on metastatic breast cancer cells. Biomaterials. 2011;32(17):4130–4139. https://doi.org/10.1016/j.biomate-rials.2011.02.035.
14 Kulesa PM, Kasemeier-Kulesa JC, Teddy JM, et al. Repro-gramming metastatic melanoma cells to assume a neural crest cell-like phenotype in an embryonic microenviron-ment. Proc Natal Acad Sci. USA. 2006;103(10):3752–3757.
15 Lee LM, Seftor EA, Bonde G, Cornell RA, Hendrix MJ. The fate of human malignant melanoma cells transplanted into zebrafish embryos: assessment of migration and cell division in the absence of tumor formation. Dev Dynam. 2005;233(4):1560–1570. https://doi.org/10.1002/dvdy.20471.
16 Giuffrida D, Rogers I, Nagy A, Calogero A, Brown T, Casper R. Human embryonic stem cells secrete soluble factors that inhibit cancer cell growth. Cell Prolif. 2009;42(6):788–798. https://doi.org/10.1111/j.1365-2184.2009.00640.x.
17 Raof NA, Mooney BM, Xie Y. Bioengineering embry-onic stem cell microenvironments for the study of breast cancer. Int J Mol Sci. 2011;12(11):7662–7691. https://doi.org/10.3390/ijms12117662.
18 Biava PM, Basevi M, Biggiero L, Borgonovo A, Borgonovo E, Burigana F. Cancer cell reprogramming: stem cell diffe-rentiation stage factors and an agent based model to opti-mize cancer treatment. Curr Pharm Biotechnol. 2011;12(2): 231–242. https://doi.org/10.2174/138920111794295783.
19 Moon SY, Park YB, Kim D-S, Oh SK, Kim D-W. Genera-tion, culture, and differentiation of human embryonic stem cells for therapeutic applications. Mol Ther. 2006;13(1):5–14. https://doi.org/10.1016/j.ymthe.2005.09.008.
20 Kim MO, Kim SH, Oi N, et al. Embryonic stem-cell-pre-conditioned microenvironment induces loss of cancer cell properties in human melanoma cells. Pigment Cell Melano-ma Res. 2011;24(5):922–931. https://doi.org/10.1111/j.1755--148X.2011.00891.x.
21 Hughes C, Radan L, Chang WY, et al. Mass spectrome-try–based proteomic analysis of the matrix microenvi-ronment in pluripotent stem cell culture. Mol Cell Prote-omics. 2012;11(12):1924–1936. https://doi.org/10.1074/mcp.M112.020057.
22 Dürr M, Harder F, Merkel A, Bug G, Henschler R, Müller AM. Chimaerism and erythroid marker expression after microinjection of human acute myeloid leukaemia cells into murine blastocysts. Oncogene. 2003;22(57):9185–9191. https://doi.org/10.1038/sj.onc.1207134.
23 Mohammadi M, Jaafari MR, Mirzaei HR, Mirzaei H. Me-senchymal stem cell: a new horizon in cancer gene the-rapy. Cancer Gene Ther. 2016;23(9):285–286. https://doi.org/10.1038/cgt.2016.35.
24 Lin HD, Fong CY, Biswas A, Choolani M, Bongso A. Hu-man umbilical cord Wharton’s jelly stem cell conditioned medium induces tumoricidal effects on lymphoma cells through hydrogen peroxide mediation. J Cell Biochem. 2016;117(9):2045–255. https://doi.org/10.1002/jcb.25501.
25 Zhu Y, Sun Z, Han Q, et al. Human mesenchymal stem cells inhibit cancer cell proliferation by secreting DKK-1. Leukemia. 2009;23(5):925–933. https://doi.org/10.1038/leu.2008.384.
26 Yulyana Y, Ho IA, Sia KC, et al. Paracrine factors of hu-man fetal MSCs inhibit liver cancer growth through redu-ced activation of IGF-1R/PI3K/Akt Signaling. Mol Ther. 2015;23(4):746–756. https://doi.org/10.1038/mt.2015.13.
27 Postovit L-M, Margaryan NV, Seftor EA, et al. Human embryonic stem cell microenvironment suppresses the tu-morigenic phenotype of aggressive cancer cells. Proc Natal Acad Sci. 2008;105(11):4329–4334. https://doi.org/10.1073/pnas.0800467105.
28 Golias C, Charalabopoulos A, Charalabopoulos K. Cell pro-liferation and cell cycle control: a mini review. Int J Clin Pract. 2004;58(12):1134–1141. https://doi.org/10.1111/j.1742--1241.2004.00284.x.
29 Cavallari C, Fonsato V, Herrera M, Bruno S, Tetta C, Camus-si G. Role of Lefty in the anti tumor activity of human adult liver stem cells. Oncogene. 2013;32:819–826. https://doi.org/10.1038/onc.2012.114.
30 Lee JH, Park CH, Chun KH, Hong SS. Effect of adipose--derived stem cell-conditioned medium on the prolife-ration and migration of B16 melanoma cells. Oncol Lett. 2015;10(2):730–736. https://doi.org/10.3892/ol.2015.3360.

231 Pol ann MeD. 2018;25(2):231–236
Original article
Mansur Rahnama1, Izabela Jastrzębska-Jamrogiewicz1, Rafał Jamrogiewicz1, Janusz Kocki2
1 Chair and Department of Oral Surgery, Medical University in Lublin, Poland2 Department of Clinical Genetics, Medical University in Lublin, Poland
Corresponding author: Rafał Jamrogiewicz, Chair and Department of Oral Surgery, Medical University in Lublin, Karmelicka 7, 20-081 Lublin, Poland. Tel.: +4881 528 79 50, Fax: +4881 528 79 51.
E-mail address: [email protected].
Influence of odontogenic cysts on immune system – cytometric analysis of T lymphocytes subpopulation
article info
Art ic l e h i s toryReceived 23 September 2016Accepted 6 June 2017Available online 16 June 2018
Keywords Odontogenic cystLymphocyte TFlow cytometryLymphocytosis
Doi10.29089/2017.17.00046
User l i cense This work is licensed under a Creative Commons Attribution –NonCommercial – NoDerivatives 4.0 International License.
abstract
Introduct ion: Cysts are one of the most common lesions found in the stoma-tognathic system. Cysts cause not only bone defect but may also cause systemic complications.
Aim: Aim of the study was to investigate influence of odontogenic cysts on immune system.
Mater ia l and methods : 45 patients participated in the study. The study groups consisted of 15 patients with radicular cysts (IC) and 15 patients with dentigerous cysts (DC). The control group (C) consisted of 15 healthy patients. Blood, saliva and sacs of cysts were analysed with use of flow cytometry techni-que in order to asses number of T lymphocytes.
Resu l t s and d i scuss ion: Ratio of T lymphocytes in blood and saliva diffe-red between groups. Analysis of cyst’s sacs showed significantly higher number of T cells in radicular cysts.
Conc lus ions : The study has shown that odontogenic cysts have influence on immune system. T cells play important role in the process of odontogenic cysts’ development. Research stresses how important is fast detection and treatment of cysts, not only in term of local but also systemic complications.
Journal homepage: https://www.paom.pl
Polish Annals of Medicine

232 Pol ann MeD. 2018;25(2):231–236
1. INTRODUCTION
Cysts are one of the most common lesions found in the stomatognathic system (Figure 1). This is due to the pres-ence of numerous epithelial remnants from the developmen-tal period. Cysts are difficult to detect, because in most cas-es, clinical symptoms occur when the size of lesion is large. An important aspect of late diagnosis, beside of significant losses of bone or facial deformities, is the possibility of ma-lignant transformation in ameloblastoma or carcinoma.1 An important and still not fully explored issue, is the impact of local, limited lesions, such as cysts, on the homeostasis of entire organism, especially the status of immune system, which has a role in the process of cysts’ formation.
Depending on the type of cyst, the process of lesion for-mation has different character. Inflammatory cysts, which constitute about 84.5% of all odontogenic cysts, arise from the activated by infectious stimuli Malassez cells.2 Ethi-opathogenesis of dentigerous cysts, which are odontogenic developmental cysts, is related with the epithelium sur-rounding erupting or impacted tooth. The process of cyst development results from pathological degeneration of fol-licle epithelium leading to squamous metaplasia.3 There are three theories of ethiopathogenesis of dentigerous cysts. The expansion of space between the tooth germ and germ
sac, leading to the formation of cyst, may result from the pressure on vessels occurring during the tooth eruption. The pressure may lead the blockade of venous return and accumulation of fluid and reduction of follicle’s epithelium. Second theory suggests that, epithelium surrounding tooth germ combines with remnants of inflammatory radicular cyst of primary tooth. Remnants of radicular cysts after combining with follicle sac lead to transformation to patho-logical dentigerous cyst. Third theory suggests, that epithe-lium surrounding tooth germ transforms after stimulation by bacteria from local inflammation in periapical region of primary root.4
T lymphocytes are responsible for the immunological answer of organism to pathological stimuli. T lymphocytes are important part of both, humoral and cell-mediated im-munity. Immunological reaction with high activity of type 1 T helper lymphocytes (Th1) is associated with high con-centration of interleukins (IL) IL-2, IL-12, tumor necrosis factor (TNF) alpha and high activity of osteoclasts.5 Th1 lymphocytes activate macrophages and CD8 lymphocytes. Th1 lymphocytes stimulate lymphocytes B, which leads to production of immunoglobulins, particularly IgG, which mediates bacteria opsonization and phagocytosis.6 In immu-nological reaction involving Th2 lymphocytes, high con-centration of interleukins 4, 5, 6, 10 and 13 can be observed. Th2 lymphocytes have chemotactic effect on mast cells and eosinophils. Th2 response is also associated with increased antibody secretion by activated plasma cells. Th1 response is more characteristic for the initial inflammatory lesions, such as granulomas. Chronic changes are characterized by a predominance of Th2 response.
2. AIM
Thorough analysis is required, in order to allow recognition of systemic threats arising from the presence of odontogenic cysts. Aim of the study was to investigate influence of od-ontogenic cysts on immune system. Study was designed to examine whether lymphocytes T have a role in development of odontogenic cysts and if local lesion significantly influ-ence status of whole immune system.
3. MATERIAL AND METHODS
The study got approval of Bioethics Committee in Lu-blin (consent number KE-0254,162,2012 and KE-0254/147/2014). The study was carried out in accordance with the ethical principles contained in the Declaration of Helsinki. The study involved 45 patients. The study groups consisted of 15 patients with radicular cysts (IC), and 15 patients with follicular cysts (DC). The control group (C) consisted of 15 healthy patients. All patients gave voluntary consent in writing to participate in the research.
Patients were qualified for further phases of the study after taking radiographs of the stomatognathic system (panoramic X-ray). Changes were asymptomatic. Patients
Figure 1. CBCT of odontogenic development cyst formed around imapcted tooth.
Figure 2. CBCT of odontogenic development cysts for-med around imapcted teeth in mandible.

233 Pol ann MeD. 2018;25(2):231–236
enrolled in the study, had no general diseases. Patients had no addictions and did not receive any medicaments on con-stant basis.7 Patients during last 3 months have not under-gone any infections. During the clinical examination state of the oral mucosa, presence of any pathological lesions, dental status, oral hygiene and periodontal status were evaluated. The presence of dental plaque on the approximal surfaces of teeth was evaluated in order to determine approximal plaque index (API). Examination of periodontium enabled the assessment of the community periodontal index of treat-ment needs (CPITN) and sulcus bleeding index (SBI).
Patients selected for further tests, had no acute or ex-acerbated chronic periodontal disease. The maximum level of the SBI in patients qualified for further examination was 25%, while the maximum level of CPITN was 3 (grade 3 stands for depth of pockets between 3.5 mm and 5.5 mm). The study excluded patients with the presence of periodon-tal pockets deeper than 5 mm. Patients with periodontal calculus were subjected for oral hygenisation and reassessed 14 days after completion of periodontal treatment. Patients evaluated for laboratory tests had no pathological lesions located within the oral mucosa. The threshold for qualifi-cation in terms of API was 39%, which corresponds as an optimal or good oral hygiene.
Diagnostic material (blood and saliva) was collected from patients in fasting state. Non-stimulated saliva was obtained. Blood was drawn from a cubital vein. Sacs of enu-cleated cysts were put into saline. Obtained material was im-mediately transported to the laboratory of Department of Clinical Genetics of Medical University in Lublin.
Navios flow cytometer (Beckman Coulter) was used to analyze lymphocytes in venous blood and saliva. Saliva was diluted in PBS in a ratio of 1 : 9. The solution was centri-fuged for 10 minutes at a speed of 1000 rpm. The precipitate was diluted with 1 mL phosphate buffered saline (PBS) and pipetted. The resulting solution was filtered twice (Beck-man Coulter Filter Tip 30 microns); 100 mL of filtrate was collected and 10 μL of anti-CD3 and CD45 Human APC EDC Human (Beckman Coulter) were added. The material was incubated for 15 minutes without accession of light. PBS (400 mL) were added and cytometric analysis was per-formed. In each sample 1000 cells were recorded. To the test-tube containing venous blood 10 μL of anti-CD3 APC Human and CD45 Human EDC were added. Blood was in-cubated without accession of light for 15 minutes. Than 0.5 mL of OptiLyse reagent (Beckman Coulter) was added. The solution was incubated for 10 minutes. After incubation 500 mL of PBS added. The solution was centrifuged for 10 minutes at a speed of 1000 rpm. and incubated for further 5 minutes. The material was then subjected to cytometric analysis. 10 000 cells in each sample were recorded.
The sac of cyst was homogenized. Obtained suspension was diluted in PBS at a ratio of 1 : 9. The resulting solution was centrifuged for 10 minutes at a speed of 1000 rpm. The precipitate was once again diluted with 1 mL PBS. The re-sulting solution was filtered twice using filters (Beckman Coulter Filter Tip 30 microns); 100 mL of filtrate was col-
lected and 10 mL of anti-CD3 and CD45 Human APC EDC Human (Beckman Coulter) were added. The material was incubated for 15 minutes. Then 4 mL of PBS ware added and cytometric analysis was carried out. In each sample 1000 cells were recorded.
Obtained data was analyzed with program Satistica 8.0. In order to determine the normal distribution of test results the W Shapiro–Wilk test was used. In the absence of normal distribution in order to compare results for three groups ANOVA Kruskal–Wallis rank test of multiple comparisons was used. The results of the statistical calculations are pre-sented in the tables. The risk of inference error of the study is 5%, which means that the results were significant, if the P was equal or less than 0.05.
4. RESULTS
The highest average number of T cells in the blood was found in patients with inflammatory cysts, while the lowest in the group of healthy patients. The same tendency was observed in saliva. T cells were found both in radicular and follicular cysts. Higher count of T cells in cyst’s sac was found in IC group when compared with DC group, however it should be noticed that T cells were present in both types of pathological lesions (Table 1).
On the basis of a Shapiro–Wilk test, hypothesis that the number of T cells has normal distributions in most assays has been rejected. For the comparison of lympho-cytes T counts between particular groups nonparametric tests were used (ANOVA Kruskal–Wallis rank test and U Mann–Whitney test). In venous blood distributions of T cells in the particular groups differed significantly. Analysis of multiple comparisons test showed significant differences between the control group and the IC (higher number in IC group) and between group IC and DC (higher number in IC). The difference between the C group and the group of patients with development cyst was not statistically sig-nificant. In the saliva distributions of T cells in the indi-vidual groups differed significantly. Multiple comparison test shoved significant differences between the C group and the IC group (higher number in patients with inflammatory cysts) and between the C group and the DC group (higher number in group of patients with development cysts). The difference between groups IC and DC was not statistically significant. By virtue of U Mann–Whitney test distributions of numbers of T cells in the sacs of the cysts showed statisti-cally significantly differences between groups. In the group of radicular cysts T lymphocyte counts are higher than in the follicular cysts (Table 2).
5. DISCUSSION
Not only pathogens but also patient’s immune system, which gives a response to a stimuli, are involved in the gen-esis of inflammatory cysts. The pathological stimulus leads

234 Pol ann MeD. 2018;25(2):231–236
to activation of humoral and cell-mediated immunity. The humoral pathway is responsible for the control of extracel-lular microorganisms and toxins produced by these patho-gens. Cellular immunity participates in the destruction of damaged or infected cells. T cells are essential in the course of these two processes. Particular subgroups of CD3+ cells support and induce a humoral immune response in order to start production of antibodies and regulatory cells inhib-it the excessive inflammatory reaction. Present study was aimed to evaluate the involvement of CD3+ lymphocytes in the creation and development of odontogenic cysts.
During the process of qualification for laboratory test a lot of attention was put on the examination of oral cavity. In order to avoid disturbances of results by an active local inflammatory processes, patients with acute or advanced chronic periodontitis were disqualified from further tests. SBI, CPITN and API did not differ significantly between the groups. Naiff et al. demonstrated, using flow cytometry techniques, that chronic periodontitis results in increase in the number of leukocytes and immunoglobulins in the sali-va, in comparison with a group of people with healthy peri-odontium.8 The results obtained in present study showed no
significant influence of API, SBI or CPITN on the number of lymphocytes which suggests that the process of clinical qualification was carried out properly and results were not modified by periodontal status. This fact allows to put for-ward thesis, while taking in consideration fact that patients enrolled for the study were generally healthy, without any infections or medications, that changes in the number of lymphocytes in the individual research materials are result of influence of odontogenic cyst on immune system.
The ethiopathogenesis of odontogenic cysts was a sub-ject of interest of many researchers. Kontiainen and cow-orkers showed that the largest subpopulations of white blood cells which can be found in the wall of odontogenic cyst are lymphocytes.9 Matsuo and associates in their study, concerning the presence of immune cells in the odonto-genic cysts, found that the number of T cells in the sac of the cyst was dependent on the size of lesion.10 Furthermore, authors demonstrated that in the symptomatic changes in the number of phagocytic cells was significantly higher than in asymptomatic changes. Results obtained during cy-tometric analysis presented in this study clearly indicated the involvement of CD3+ lymphocytes in the development
Table 1. The results of cytometric analysis of T lymphocytes (CD3+).
Diagnostic material / GroupT lymphocytes (CD3+)
n M SD V, %
Blood
C 15 470.3 546.2 116.1
IC 15 4391.9 3250.9 74.0
DC 15 914.3 1276.3 139.6
Saliva
C 15 121.6 403.0 331.4
IC 15 284.2 314.3 110.6
DC 15 233.3 215.3 92.3
Sac of the cyst IC 15 32.3 33.7 104.2 DC 15 268.9 311.7 115.9
Table 2. Shapiro–Wilk test for T lymphocytes (CD3+), ANOVA Kruskal–Wallis test (with the test of multiple comparisons).
Diagnostic material / GroupShapiro–Wilk test ANOVA Kruskal–Wallis
test P for the test of multiple comparisons
n W P H P C IC DC
Blood
C 15 0.8034 0.0041
21.40 <0.0001
– <0.0001 0.6876
IC 15 0.8950 0.0797 <0.0001 – 0.0033
DC 15 0.5911 <0.0001 0.6876 0.0033 –
Saliva
C 15 0.3027 <0.0001
14.72 0.0006
– 0.0040 0.0019
IC 15 0.7867 0.0025 0.0040 – 1.0000
DC 15 0.8454 0.0150 0.0019 1.0000 –
Sac of the cyst U Mann–Whitney Test
U Z P
IC 15 0.7785 0.002031.5 3.3390 0.0008
DC 15 0.8334 0.0102

235 Pol ann MeD. 2018;25(2):231–236
of odontogenic cysts. Comparative analysis showed that the number of T cells is significantly higher in radicular cysts when compared with development cysts. Although, it needs to be stated that lymphocytes T were found in both inflam-matory and developmental cysts. The mechanisms involved in the pathological enlargement of dental follicle are not fully understood. One theory indicates that the epithelial cells of follicle are activated by pathological stimuli caus-ing an inflammatory reaction. The results of present study showed significant presence of T cells in sacs of follicular cysts. It needs to be considered that all investigated changes were asymptomatic and were discovered incidentally during radiological examinations. This fact suggests a rejection of the hypothesis of infection of already preset follicular cysts, which would result in the onset of inflammatory infiltra-tion. The results strongly suggest that the role of immune cells in the development of odontogenic follicular cysts is significant.
Saliva as a diagnostic material has been used by scien-tists for several years. The advantages of saliva, as a diagnos-tic material, are easy acquisition and lack of discomfort dur-ing collection of material, what is especially important in case of children or disabled patients. Unfortunately, the use of salivary gland secretion is associated with many difficul-ties. It is considered, that the content of substances which can be analyzed is approximately 1000 time lower than in serum.11 In this study non-stimulated saliva was used. Non-stimulated saliva includes elements derived from the blood, which makes it reliable for test concerning the state of the whole organism. Flow cytometry, which is a very sensitive detection method, allows obtaining a very accurate evalu-ation of particular cell populations in saliva. Vidović et al. performed cytometric evaluation of particular populations of white blood cells in the saliva.12 Authors demonstrated that saliva is dominated by polymorphonuclear cells, but there are also subpopulations of T and B lymphocytes or monocytes. The researchers evaluated the number of cells in the saliva of each patient three times and found that the results obtained in each measurement are compatible. Flow cytometric analysis performed in present study indicates that saliva can be successfully used for assessing subpopu-lation of T cells. Comparative analysis of saliva between groups showed that the number of T cells was significant-ly higher in the study groups when compared with the C group. The results obtained from saliva correlated with the results obtained during the analysis of venous blood, but the differences in the results of flow cytometric analysis of saliva are larger which makes them statistically significant. This suggests that the increase of CD3+ lymphocytes in the sa-liva may suggest the existence of an odontogenic cyst in the stomatognathic system.
In present study we wanted to evaluate the effect of od-ontogenic cysts on the status of immune system. This issue has not been broadly investigated in past. Anil et al. evalu-ated the presence of immune complexes in patients who were diagnosed with chronic periapical changes or odontogenic cysts.13 Obtained results showed that in the study group con-
centration of circulating immune complexes was significant-ly higher than in healthy subjects. It should be stressed that immune complexes can cause tissue damage not only in the area of their formation but also in the areas distant from the focal lesion. In present study number of CD3+ lymphocytes in blood serum was higher in study groups when compared with the C group, but the difference was high enough to be statistically significant only between the IC and C groups. Analysis of differences in the number of T cells between study groups revealed that in the group of radicular cysts number of CD3+ cells was significantly higher in compari-son with the folliculal changes. Okada et al. described the effect of periapical changes on the immune system of rab-bits.14 Researchers discovered hypergammaglobulinemia which was increasing along with the duration of pathologi-cal process. Histopathological study carried out after the test showed the presence of early stages of endocarditis, hepatitis and glomerulonephritis. All these facts indicate how impor-tant is early detection and treatment of odontogenic cysts and how significantly they influence the human organism.
6. CONCLUSIONS
The saliva may be successfully used as diagnostic material for the study of immune cells and severity of local inflam-matory reaction.
The results suggest that odontogenic cysts have signifi-cant impact on immune system of the organism.
T lymphocytes are involved in genesis of both radicular and follicular cysts.
Conflict of interestAll authors declare that there is no conflict of interest.
FundingThe study was funded by Medical University in Lublin.
References1 Elzay RP. Primary intraosseous carcinoma of the jaws. Re-
view and update of odontogenic carcinomas. Oral Surg Oral Med Oral Pathol. 1982;54(3):299–303. https://doi.org/10.1016/0030-4220(82)90099-8.
2 Tortorici S, Amodio E, Massenti MF, Buzzanca ML, Bur-ruano F, Vitale F. Prevalence and distribution of odontoge-nic cysts in Sicily: 1986–2005. J Oral Sci. 2008;50(1):15–18. https://doi.org/10.2334/josnusd.50.15.
3 Tegginamani AS, Prasad R. Histopathologic evaluation of follicular tissues associated with impacted lower third mo-lars. J Oral Maxillofac Pathol. 2013;17(1):41–44. https://doi.org/10.4103/0973-029X.110713.
4 Gondim JO, Neto JJ, Nogueira RL, Giro EM. Conservative management of dentigerous cyst secondary to primary tooth trauma. Dent Traumatology. 2008;24(6):676–679. https://doi.org/10.1111/j.1600-9657.2008.00616.x.

236 Pol ann MeD. 2018;25(2):231–236
5 Fukada SY, Silva TA, Garlet GP, Rosa AL, da Silva JS, Cun-ha FQ. Factors involved in the T helper type 1 and type 2 cell commitment and osteoclast regulation in inflammatory apical diseases. Oral Microbiol Immunol. 2009;24(1):25–31. https://doi.org/10.1111/j.1399-302X.2008.00469.x.
6 Jankovic D, Liu Z, Gause WC. Th1- and Th2-cell commit-ment during infectious disease: asymmetry in divergent pathways. Trends Immunol. 2001;22(8):450–457. https://doi.org/10.1016/S1471-4906(01)01975-5.
7 Koc-Gąska M. Diagnostic pitfalls of tobacco smoking: The effect of nicotine addiction on the oral cavity – Literatu-re review. Pol Ann Med. 2013;20(1):56–61. https://doi.or-g/10.1016/j.poamed.2013.02.001.
8 Naiff PF, Ferraz R. unha CF, et al. Immunophenotyping in saliva as an alternative approach for evaluation of im-munopathogenesis in chronic periodontitis. J Periodontol. 2014;85(5):111–120. https://doi.org/10.1902/jop.2013.130412.
9 Kontiainen S, Ranta H, Lautenschlager I. Cells infiltra-ting human periapical inflammatory lesions. J Oral Pathol. 1986;15(10):544–546.
10 Matsuo T, Ebisu S, Shimabukuro Y, Ohtake T, Okada H. Quantitative analysis of immunocompetent cells in human periapical lesions: correlations with clinical findings of the involved teeth. J Endod. 1992;18(10):497–500. https://doi.org/10.1016/S0099-2399(06)81350-6.
11 Christodoulides N, Mohanty S, Miller CS, et al. Application of microchip assay system for the measurement of C-reac-tive protein in human saliva. Lab Chip. 2005;5(3):261–269. https://doi.org/10.1039/b414194f.
12 Vidović A, Vidović Juras D, Vučićević Boras V, et al. De-termination of leucocyte subsets in human saliva by flow cytometry. Arch Oral Biol. 2012;57(5):577–583. https://doi.org/10.1016/j.archoralbio.2011.10.015.
13 Anil S, Shanavas KR, Beena VT, Remani P, Vijayaku-mar T. Quantitation of circulating immune complexes in patients with chronic periapical lesions. J Nihon Univ Sch Dent. 1993;35(3):175–178. https://doi.org/10.2334/jo-snusd1959.35.175.
14 Okada H, Aono M, Yoshida M, Munemoto K, Nishida O, Yokomizo I. Experimental study on focal infection in rab-bits by prolonged sensitization through dental pulp ca-nals. Arch Oral Biol. 1967;12(9):1017–1034. https://doi.org/10.1016/0003-9969(67)90156-2.

237 Pol ann MeD. 2018;25(2):237–240
Case report
Sameer K. Mehta, Reetu Singh, Satish K. Prasad, Narain Pandey
Department of Medicine, Tata Main Hospital, Jamshedpur, India
Corresponding author: Sameer Kumar Mehta, Tata Main Hospital, Tata Steel Limited C Road West, Northern Town, Bistupur, Jamshedpur 831001 India. Phone: 7763807152.
E-mail address: [email protected], [email protected]
A rare case of IGF2 mediated hypoglycemia in a diabetic patient – a praneoplastic manifestation of an adrenal tumor
article info
Art ic l e h i s toryReceived 22 April 2017Accepted 14 October 2017Available online 27 June 2018
Keywords HypoglycemiaInsulin-like growth factor 2 (IGF2)Paraneoplastic syndrome
Doi10.29089/2017.17.00054
User l i cense This work is licensed under a Creative Commons Attribution –NonCommercial – NoDerivatives 4.0 International License.
abstract
Introduct ion: A rare case of persistent hypoglycemia as a paraneoplastic manifestation of an adrenal tumor due to excessive secretion of IGF2 is being reported.Aim: To learn about rare causes of hypoglycemia.Case s tudy: Hypoglycemia is most commonly due to antidiabetic drugs. Ho-wever, it is not always drug induced and it can be observed in other conditions unrelated to diabetes, such as insulinoma, autoimmune disorders, and neoplasia. Herein, we report the case of a rare cause of severe and recurrent hypoglycemia in a 83-year-old diabetic and hypertensive lady who was subsequently diagnosed with adrenal malignancy and hypoglycemia was found to be a paraneoplastic ma-nifestation of the tumor secreting IGF2.Resu l t s and d i scuss ion: Although more than 95% of cases of hypoglycemia are due antidiabetic drugs but there are other rare causes of hypoglycemia – ma-lignancy being the most important in the rare causes of hypoglycemia. Persistent hypoglycemia should arouse a suspicion of a rare cause of hypoglycemia. In our case hypoglycemia was due to excessive secretion of IGF2 by the adrenal tumor. Several such case cases have been reported where hypoglycemia was a parane-oplastic manifestation of the tumor. So, we need to be aware of the rare causes of hypoglycemia as it can lead to the diagnosis of the primary tumor, as has been in our case, and it can also significantly affect the course of the treatment.Conc lus ions : IFG2 secreting tumor can be a rare cause of hypoglycemia.
Journal homepage: https://www.paom.pl
Polish Annals of Medicine

238 Pol ann MeD. 2018;25(2):237–240
1. INTRODUCTION
Hypoglycemia is a common medical emergency in diabetic patients treated with insulin or oral hypoglycemic drugs. However, it can be observed less frequently in other condi-tions such as insulinomas and rare autoimmune diseases.1
Paraneoplastic disorders are an exceptional etiological fac-tor of hypoglycemia. In this case, paraneoplastic secretion of insulin-like growth factor 1 (IGF1) or partially processed precursors of IGF2 could be responsible for hypoglycemia.2,3
2. AIM
Herein, we report a case of severe and recurrent hypogly-cemia in a woman with an adrenal malignancy diagnosed incidentally on routine workup.
3. CASE STUDY
A 83-year-old female, a known diabetic and hypertensive, was admitted with poor oral intake and recurrent episodes of drowsiness and lethargy for 3 days. Her random blood sugar on presentation at hospital was 40 mg/dL. Detailed history and examination failed to reveal any known cause of hypoglycemia. In her past medical history, we noticed the presence of multi-infarct CVA and seizure disorder.
She was admitted for investigation and supportive ther-apy. Over the next 48 hours she suffered repeated bouts of
hypoglycemia. Her symptomatology was particularly char-acterized by neuroglycopenic signs with fatigue, weakness, headache, dysphasia, and loss of consciousness, without seizures. The Glasgow coma scale was 9/15. In view of this her serum cortisol, growth hormone (GH) and insulin levels were studied which were reported normal. However IGF2 level was found elevated (Table 1). IGF2 and IGF1 ratio was found to be 16.48.
Subsequent workup including CT scans of thorax and abdomen revealed a 6.8 × 6.6 × 6.0 cm right suprarenal Mmass invading the right lobe of liver with mild ascites (Figures 1–4).
In view of this a diagnosis of non-islet cell tumor hypo-glycemia (NICTH) was made.
However, in view of age and extensive comorbidities, pa-tient’s family refused further management. The patient was subsequently discharged on the request of her family mem-bers with prescription of prednisolone and advice regarding frequent self-monitoring of blood glucose.
4. RESULTS AND DISCUSSION
NICTH occurs mainly in patients with solid tumors of mesenchymal and epithelial origins and, less frequently, in hematopoietic and neuroendocrine tumors.4 Hypoglycemia
Table 1. Hormone levels.
Actual Normal Units
Cortisol E 13.39 2–18 mcg/dL
Cortisol M 20.40 7–28 mcg/dL
GH 2.718 <10 ng/mL
Insulin 7.10 < 25 mlU/L
IGF1 <25 ↓ 55–166 ng/mL
IGF2 412 ↑ 71–290 ng/mL
Figure 1. CECT abdomen and pelvis showing 6.8 × 6.6 × 6.0 cm heterogeneous poorly enhancing right suprarenal mass. Arrow indicates adrenal tumor.
Figure 2. CECT abdomen showing tumor invading infe-rior surface of liver (red arrow) and perihepatic ascites (white arrow).

239 Pol ann MeD. 2018;25(2):237–240
leads to the diagnosis of the tumor in 50% of cases.4 In other cases, hypoglycemia occurs after the tumor has been found.4 Usually, patients report previous hypoglycemic symptoms before the NICTH has been diagnosed.4 Neuroglycopenic symptoms are more commonly observed than autonomic symptoms due to repeated hypoglycemic events and insidi-ous progression observed with NICTH.4 In the present case, NICTH was established after excluding all other causes of hypoglycemia with relevant investigations.
The diagnosis of NICTH is based on the findings of hy-poinsulinemic hypoglycemia associated with the presence of raised levels of IGF2. The treatment of NICTH should target both a symptomatic management of hypoglycemic episodes and the tumor treatment. Hypoglycemia could be reversible after a successful tumor surgery.4 Chemotherapy or embolization can reduce the occurrence of hypoglyce-mia.4,5 Glucocorticoids seem to be the most effective symp-tomatic treatment. They stimulate gluconeogenesis and in-hibit the big IGF2 tumor production.6 This effect is dose dependent and reversible if doses are below a critical level.7 GH therapy relieves hypoglycemic symptoms although it fails to suppress tumor IGF2 production.8
5. CONCLUSIONS
Incidence of diabetes mellitus in India has been steadily increasing and one does get to encounter hypoglycemic pa-tients on a fairly regular basis in day to day practice. How-ever, a high index of suspicion needs to be maintained es-pecially in refractory hypoglycemia in elderly patients and oncological perspective needs to be explored if the index of
suspicion is high. Hence this case presented a rare constella-tion of features which would have otherwise been confusing if correct diagnostic protocols had not been applied.
Conflict of interest None declared.
References1 Nirantharakumar K, Marshall T, Hodson J, Narendran P, De-
eks J, Coleman JJ, et al. Hypoglycemia in non-diabetic in-pa-tients: clinical or criminal?. PLoS ONE. 2012;7(7):e40384. https://doi.org/10.1371/journal.pone.0040384.
2 Nauck MA, Reinecke M, Perren A, et al. Hypoglycemia due to paraneoplastic secretion of insulin-like growth factor-I in a patient with metastasizing large-cell carcinoma of the lung. J Clin Endocrinol Metab. 2007;92(5):1600–1605. https://doi.org/10.1210/jc.2006-2573.
3 Daughaday WH, Emanuele MA, Brooks MH, Barbato AL, Kapadia M, Rotwein P. Synthesis and secretion of insulin-li-ke growth factor II by a leiomyosarcoma with associated hy-poglycemia. N Eng J Med. 1988;319(22):1434–1440. https://doi.org/10.1056/NEJM198812013192202.
4 Bodnar TW, Acevedo MJ, Pietropaolo M. Management of non-islet-cell tumor hypoglycemia: a clinical review. J Clin Endocrinol Metab. 2013;99(3):713–722. https://doi.org/10.1210/jc.2013-3382.
5 Hunter SJ, Daughaday WH, Callender ME, et al. A case of hepatoma associated with hypoglycaemia and over-production of IGF-II (E-21): beneficial effects of treat-ment with growth hormone and intrahepatic adriamy-cin. Clin Endocrinol. 1994;41(3):397–401. https://doi.org/10.1111/j.1365-2265.1994.tb02564.x.
Figure 3. FNAC of the mass using a light microscope (magnification 400×) stained with May-Grünwald-Giem-sa stain showing sheets and singly scattered scattered discohesive cells with round to oval prominent nucleoli forming acinii. Arrow indicates malignant cells with pro-minent nucleoli.
Figure 4. FNAC of the mass using a light microscope (magnification 400×) stained with PAP (Papanicolaou’s stain) showing pleomorphic round tumor cells (white ar-row) in sheets with acinar arrangement (red arrow) in he-morrhagic background.

240 Pol ann MeD. 2018;25(2):237–240
6 Tsuro K, Kojima H, Okamoto S, et al. Glucocorticoid therapy ameliorated hypoglycemia in insulin-like growth factor-II-pro-ducing solitary fibrous tumor. Int Med. 2006;45(8):525–529. https://doi.org/10.2169/internalmedicine.45.1611.
7 Teale JD,Wark G. The effectiveness of different treatment options for non-islet cell tumour hypoglycaemia. Clin En-docrinol. 2004;60(4):457–460. https://doi.org/10.1111/j.1365--2265.2004.01989.x.
8 Silveira LF, Bouloux PM, MacColl GS, Camacho-Hubner C, Miraki-Moud F. Growth hormone therapy for non-islet cell tumor hypoglycemia. Am J Med. 2002;113(3):255–257. https://doi.org/10.1016/S0002-9343(02)01180-4.

241 Pol ann MeD. 2018;25(2):241–244
Case report
Gabriele Cioni
Department of Internal Medicine, Department of Experimental and Clinical Medicine, Careggi Hospital, University of Florence, Italy
Corresponding author: Gabriele Cioni, Department of Internal Medicine, Department of Experimental and Clinical Medicine, Careggi Hospital, University of Florence, Viale Morgagni, 85 50134, Florence, Italy. Tel.: +39331 1357167.
E-mail address: [email protected].
Celiac disease presenting as fever of unknown origin in the adult: The role of undiagnosed celiac disease in systemic atherosclerosis
article info
Art ic l e h i s toryReceived 28 April 2017Accepted 4 September 2017Available online 20 April 2018
Keywords HyponatremiaHepatic encephalopathyLiver cirrhosis
Doi10.29089/2017.17.00034
User l i cense This work is licensed under a Creative Commons Attribution –NonCommercial – NoDerivatives 4.0 International License.
abstract
Introduct ion: Celiac disease is an inflammatory disorder affecting subjects at any age and presenting with a broad spectrum of symptoms. In several cases, extra--intestinal symptoms are the only clinical manifestations or occur in conjunction with gastrointestinal symptoms.
Aim: We present the case of a 47-year-old male admitted to our Internal Me-dicine Department, after a further episode of fever with chill, associated with headache and malaise.
Case s tudy: He had suffered from episodes of fever for about 20 years. At phy-sical examination, gastrointestinal symptoms such as nausea, emesis, diarrheal and constipation, were absent.
Resu l t s : Investigations were negative for malignancy, haematological disor-ders, autoimmune diseases, and inflammatory bowel disease; serological and culture tests were negative for common infectious diseases and parasitosis. In-flammatory markers were elevated (erythrocyte sedimentation rate 48 mm/h, C--reactive protein 185 mg/L), with the exception of normal procalcitonin levels. Colonoscopy demonstrated villous blunting, with biopsies consistent with a dif-fuse chronic inflammation in the lamina propria and significant intraepithelial lymphocytosis (MARSH II). Further investigations showed an advanced athero-sclerotic peripheral disease, despite the low cardiovascular risk.
Discuss ion: In celiac disease, the activation of gluten specific T cells in the gastro-intestinal mucosa induces the activation of a pro-inflammatory pattern, which could contribute to the fever. The systemic inflammatory activation found in celiac disease was associated to a chronic vascular damage, both consisting in an increased arterial stiffness and intima-media-thickness.
Conc lus ions : The delay in diagnosis of celiac disease could be associated to seve-ral complications, such as atherosclerotic progression.
Journal homepage: https://www.paom.pl
Polish Annals of Medicine

242 Pol ann MeD. 2018;25(2):241–244
1. INTRODUCTION
Coeliac disease is a lifelong, chronic, immune-mediated, inflammatory disorder affecting subjects at any age and presenting with a broad spectrum of symptoms; in several cases, extra-intestinal symptoms are the only clinical mani-festations or occur in conjunction with gastrointestinal symptoms.1 Cooney et al.2 reported the first published case of celiac disease presenting as fever of unknown origin. Au-thors exposed the case of a 16-year-old female, presenting with one month of intermittent fever, a 5 kg weight loss, but without gastrointestinal disorders. Similarly, Leonardi et al.3 described the case of 3-year-old child with silent ce-liac disease presenting with recurrent febrile infections and moderate neutropenia, normalized after the onset of a gluten free diet. The delay in the diagnosis of celiac disease can be associated with many complications. In particular, several observational studies have showed a small absolute increase in overall mortality in patients with undiagnosed celiac dis-ease in comparison to the general population.4,5 Moreover, population-based studies showed an association between celiac disease and cancer risk, with particular reference to non-Hodgkin’s lymphoma.6 In a previous report, authors described the case of a 13-year-old female from the Middle East with an 8-year history of severe rickets causing multi-ple bone deformities, after malabsorption for many years.7 Previous studies investigated the association between car-diovascular profile and celiac disease in adults, showing an increased risk due to chronic inflammation.8,9
2. AIM
A 47-year-old male was admitted to the Internal Medicine De-partment of our hospital, after a further episode of fever with chill, associated with headache and malaise, which occurred two days before. We described the diagnostic workup and discussed the association between the peripheral vascular atherosclerosis and the delay in the diagnosis of celiac disease.
3. CASE STUDY
According to his medical history, the patient had suffered from episodes of fever for about 20 years, occasionally tak-ing ibuprofen with benefit. Fever appeared not cyclical, with long periods between one episode and the next one, in which the patient reported complete well-being. From clinical records of previous hospitalizations, investigations were negative for malignancy, haematological disorders, autoimmune diseases, and inflammatory bowel disease. Se-rological and culture tests were negative for common infec-tious diseases and parasitosis. In particular, a previous celiac screen was negative. He was not diabetic, dyslipidemic, hy-pertensive, overweight or smoker. As collateral findings, he presented a mild atherosclerosis at common carotid arteries (intima media thickness over 2.0 mm), inconsistent with
the low cardiovascular profile of our patient. He had no sick contacts and he had gone to Peru for work reasons about 5 years ago. His family history was negative for autoimmune diseases; his father was hypertensive. The patient currently was on no medications. He reported to assume a mostly veg-etarian diet, and he never had gastrointestinal disorders or sudden weight loss in recent years.
On physical examination, sore throat, abdominal and chest pain, joint pain and other signs compatible with acute or chronic inflammation were absent. Gastrointestinal symp-toms such as nausea, emesis, diarrheal and constipation, were absent. He appeared well, and his body mass index was 23.4 kg/m2. Apparently there were no signs of anaemia. His liver was 4 cm below the costal margin, and her spleen was palpa-ble for 2 cm.
4. RESULTS
4.1. Biochemical parameters and instrumental examsComplete blood cells count showed a mild reduction in hae-moglobin level (12.7 g/dL), with normal volume of red cells; other cell lines on immunophenotype assay were within normal limits. Throat, blood and urine cultures were nega-tive. We excluded viral, bacterial and parasitic infections: in particular, serological tests for human immunodeficiency virus-type 1 and 2, hepatitis B and C virus, Epstein-Barr virus, cytomegalovirus, were negative. Inflammatory mark-ers were elevated (erythrocyte sedimentation rate 48 mm/hr, C-reactive protein 185 mg/L), with the exception of normal procalcitonin levels. Panel for autoimmune disease was nega-tive. Thyroid function tests showed no alterations. Plasma levels of folic acid and B12 vitamin were significantly lower the minimum normal range (1.7 ng/mL and more than 60 pg/mL, respectively); serum ferritin level was within normal range. Cranial and thoracic CT scans were negative; abdomi-nal CT scan demonstrated only a mild splenomegaly; ab-dominal ultrasound showed only a mild non-alcoholic fatty liver disease. In the suspicion of endocarditis, we prescribed transthoracic and transoesophageal echocardiography, show-ing normal findings. In order to exclude inflammatory bowel disease, the patient underwent upper gastrointestinal endos-copy, showing only a not specific gastric inflammation with biopsies consistent with a normal pattern, and colonoscopy demonstrating villous blunting, with biopsies consistent with a diffuse chronic inflammation in the lamina propria and sig-nificant intraepithelial lymphocytosis (MARSH II). He was started on a gluten-free diet and after a month from the dis-charge he was afebrile; inflammatory markers were signifi-cantly lower and haemoglobin levels were mildly increased. After discharge, the patients underwent further investiga-tions in order to characterize the atherosclerotic involve-ment. Homocysteine and lipoprotein (a) were within normal values. We performed a vascular ultrasound assessment by a MyLab 70 XVision Esaote Machine equipped of a 7.5 MHz linear and a 3.75 MHz convex transducers machine (Esaote

243 Pol ann MeD. 2018;25(2):241–244
Medical Systems, Rome, Italy). The system used a dedicated software (RF-data technology involving RF Quality Intima-media Thickness and RF Quality Arterial Stiffness; Esaote Medical Systems) in order to provide a standard assessment of intima media thickness and pulsewave velocity at common carotid and femoral arteries. Examinations demonstrated the presence of an extensive atherosclerotic involvement, associated to increased arterial stiffness at both carotids and femoral arteries. Thoracic and abdominal aorta were within normal limits. For this reason, we performed a CT angiogra-phy of intracranial arteries (Figure 1) and lower limbs, which showed a widespread atherosclerosis but without critical ste-nosis in the examined sites.
5. DISCUSSION
In our case, the patient was a 47-year-old man, having a posi-tive history of recurrent fever and who presented a previ-ous negative celiac disease screening. Fever is a key element of the inflammatory response, involving production and release of cytokines with endogenous pyrogenic activity.10 In celiac disease, the activation of gluten specific T cells in the gastrointestinal mucosa induces the activation of a pro-inflammatory pattern, which could contribute to the fever; a such activated inflammatory response, was elsewhere as-sociated to the epithelial damage at the basis of many com-mon intestinal manifestations of the disease.11 In a recent work, the systemic inflammatory activation found in celiac disease was associated to a chronic vascular damage, both consisting in an increased arterial stiffness12 and intima-media-thickness;13 our patient presented an atherosclerotic wall of common carotids and femoral arteries and a mild non alcoholic fatty liver disease, which is a well-established car-diovascular marker,14, also associated to celiac disease.15 In this case, because it was possible to recognize celiac disease only after many years, this delay may have contributed to increase the vascular damage and the global cardiovascular
risk, regardless of the presence of traditional cardiovascular risk factors. It is also known that autoimmune diseases are statistically associated with an increased risk of cardiovascu-lar diseases, which are the leading cause of premature death in this patient population.16 Therefore, to reduce diagnostic latency and to prevent clinical complications, directly17 and indirectly18 linked to celiac disease, it is mandatory to con-sider this disorder in the differential diagnosis of fever of unknown origin. Indeed, an early consideration of a gluten free diet may decrease the severe complications related to the disease and worsened with delaying the onset of therapy.19
6. CONCLUSIONS
In celiac disease, the activation of gluten specific T cells in the gastrointestinal mucosa induces the activation of a pro-inflammatory pattern, which could contribute to the fever. The delay in diagnosis of celiac disease could be associated to several complications; in this particular case, it may have led to atherosclerotic progression in different vascular dis-tricts. Therefore, it is mandatory to consider this disorder in the differential diagnosis of fever of unknown origin.
Conflict of interestNone declared
References1 Leffler DA, Green PH, Fasano A. Extraintestinal mani-
festations of coeliac disease. Nat Rev Gastroenterol Hepa-tol. 2015;12(10):561–571. https://doi.org/10.1038/nrga-stro.2015.131.
2 Cooney MJ, El-Matary W. Celiac disease presenting as fever of unknown origin. Case Rep Gastrointest Med. 2013;2013:676327. https://doi.org/10.1155/2013/676327.
3 Leonardi S, Vitaliti G, La Rosa M. Recurrent febrile infections and neutropenia in a child with silent celiac disease. Clin Pediatr (Phila). 2010;49(2):146–149. https://doi.org/10.1177/0009922809344426.
4 Rubio-Tapia A, Kyle RA, Kaplan EL, et al. Increased prevalence and mortality in undiagnosed celiac dise-ase. Gastroenterology. 2009;137(1):88–93. https://doi.or-g/10.1053/j.gastro.2009.03.059.
5 Ludvigsson JF, Montgomery SM, Ekbom A, Brandt L, Granath F. Small-intestinal histopathology and mortali-ty risk in celiac disease. JAMA. 2009;302(11):1171–1178. https://doi.org/10.1001/jama.2009.1320.
6 Card TR, West J, Holmes GK. Risk of malignancy in diagno-sed coeliac disease: a 24-year prospective, population-based, cohort study. Aliment Pharmacol Ther. 2004; 20(7):769–775. https://doi.org/10.1111/j.1365-2036.2004.02177.x.
7 Al-Sharafi BA, Al-Imad SA, Shamshair AM, Al-Faqeeh DH. Severe rickets in a young girl caused by celiac disease: the tragedy of delayed diagnosis: a case report. BMC Res Notes. 2014;7:701. https://doi.org/10.1186/1756-0500-7-701.
Figure 1. Computed tomography angiography of intracra-nial arteries: (A) a calcific plaque of right common ca-rotid; (B) several calcific plaques of left internal carotid.
A B

244 Pol ann MeD. 2018;25(2):241–244
8 Viljamaa M, Kaukinen K, Pukkala E, Hervonen K, Reu-nala T, Collin P. Malignancies and mortality in patients with coeliac disease and dermatitis herpetiformis: 30-year population-based study. Dig Liver Dis. 2006; 38(6):374–380. https://doi.org/10.1016/j.dld.2006.03.002.
9 Wei L, Spiers E, Reynolds N, Walsh S, Fahey T, MacDonald TM. The association between coeliac disease and cardiova-scular disease. Aliment Pharmacol Ther. 2008;27(6):514–519. https://doi.org/10.1111/j.1365-2036.2007.03594.x.
10 Dinarello CA. Cytokines as endogenous pyrogens. J Infect Dis. 1999;179 (Suppl 2):S294–S304. https://doi.org/10.1086/513856.
11 Rallabhandi P. Gluten and celiac disease – an immu-nologic perspective. J AOAC Int. 2012;95(2):349–355. https://doi.org/10.5740/jaoacint.SGE_Rallabhandi.
12 Korkmaz H, Sozen M, Kebapcilar L. Increased arterial stiffness and its relationship with inflammation, insu-lin, and insulin resistance in celiac disease. Eur J Ga-stroenterol Hepatol. 2015;27(10):1193–1199. https://doi.org/10.1097/MEG.0000000000000437.
13 De Marchi S, Chiarioni G, Prior M, Arosio E. Young adults with coeliac disease may be at increased risk of early athe-rosclerosis. Aliment Pharmacol Ther. 2013;38(2):162–169. https://doi.org/10.1111/apt.12360.
14 Bonci E, Chiesa C, Versacci P, Anania C, Silvestri L, Pacifico L. Association of non alcoholic fatty liver di-sease with subclinical cardiovascular changes: a sys-tematic review and meta-analysis. Biomed Res Int. 2015;2015:213737. https://doi.org/10.1155/2015/213737.
15 Reilly NR, Lebwohl B, Hultcrantz R, Green PH, Ludvigs-son JF. Increased risk of non-alcoholic fatty liver disease after diagnosis of celiac disease. J Hepatol. 2015;62(6):1405–1411. https://doi.org/10.1016/j.jhep.2015.01.013.
16 Ahearn J, Shields KJ, Liu CC, Manzi S. Cardiovascu-lar disease biomarkers across autoimmune diseases. Clin Immunol. 2015;161(1):59–63. https://doi.org/10.1016/j.clim.2015.05.024.
17 Malamut G, Cellier C. Complications of coeliac disease. Best Pract Res Clin Gastroenterol. 2015;29(3):451–458. https://doi.org/10.1016/j.bpg.2015.05.005.
18 Emilsson L, Lebwohl B, Sundström J, Ludvigsson JF. Cardio-vascular disease in patients with coeliac disease: a systematic review and meta-analysis. Dig Liver Dis. 2015;47(10):847–852. https://doi.org/10.1016/j.dld.2015.06.004.
19 Kelly CP, Bai JC, Liu E, Leffler DA. Advances in dia-gnosis and management of celiac disease. Gastroentero-logy. 2015;148(6):1175–1186. https://doi.org/10.1053/j.gastro.2015.01.044.

245 Pol ann MeD. 2018;25(2):245–249
Case report
Krzysztof Piersiala1, Piotr Przymuszała1, Monika Sykutera1, Anna Bartochowska2, Joanna Jackowska2, Małgorzata Wierzbicka2
1 Student Research Group at the Department of Otolaryngology, Head and Neck Surgery, Poznań University of Medical Sciences, Poland2 Department of Otolaryngology, Head and Neck Surgery, Poznań University of Medical Sciences, Poland
Corresponding author: Krzysztof Piersiala, Student Research Group at the Department of Otolaryngology, Head and Neck Surgery, Poznań University of Medical Sciences, Przybyszewskiego 49, 60-355 Poznań, Poland. Tel.: +48604179331.
E-mail: [email protected].
The asymmetry of the laryngeal ventricle – the very rare cases and review of the literature
article info
Art ic l e h i s toryReceived 24 October 2017Accepted 6 December 2017Available online 4 June 2018
Keywords Laryngeal ventricleLaryngeal asymmetryLymphomaWarthin’s tumorTumor
Doi10.29089/2017.17.00045
User l i cense This work is licensed under a Creative Commons Attribution –NonCommercial – NoDerivatives 4.0 International License.
abstract
Introduct ion: The most common neoplastic lesion found in the larynx is squamous cell carcinoma. In this study, we report the set of cases of unexpected neoplastic lesions found in the laryngeal ventricle. These are extranodal lympho-ma and two cases of Warthin’s tumors.
Aim: To report these extremely rare lesions, as they require special diagnostic, therapeutic attention and collaboration with the pathologist.
Case s tudy: The case records of two patients with the diagnosis of Warthin’s tumor and one with lymphoma limited to the laryngeal ventricle were retrospec-tively reviewed.
Resu l t s and d i scuss ion: The histopathologic diagnosis revealed one case of diffuse large B-cell lymphoma – centroblastic variant, non GCB type and two ca-ses of papillary cystadenoma lymphomatosum (Warthin’s tumor). Details of the presentation, diagnostic procedures, treatment, and outcome of these patients were presented. In the differential diagnosis of laryngeal asymmetry laryngoce-le, benign and malignant lesions need to be taken into consideration. Warthin’s tumor and primary lymphoma located in the larynx require special diagnostic, therapeutic attention and collaboration with the pathologist.
Conc lus ions : (1) This case series serves to highlight the rich and varied pa-thology which can affect the larynx. (2) In addition to the more commonly en-countered conditions, the otolaryngologists should always be aware of the varied pathology of the larynx with conditions such as Warthin’s tumor and extranodal lymphoma.
Journal homepage: https://www.paom.pl
Polish Annals of Medicine

246 Pol ann MeD. 2018;25(2):245–249
1. INTRODUCTION
The asymmetry of the laryngeal ventricle in most cases does not represent pathology. In several studies, an asymmetry to greater or lesser extent was shown in all examined laryn-ges.1,2 However, in some cases, the asymmetry is a result of benign or malignant neoplastic growth within the larynge-al ventricle. Some of the lesions, which may be present in this particular anatomical site are laryngocele, schwanno-ma, rhabdomyoma, amyloidosis, squamous cell carcinoma (SCC), adenoid cystic carcinoma (ACC) or rhabdomyosar-coma. Warthin’s tumor and primary laryngeal lymphoma are also extremely rare causes of laryngeal asymmetry with fewer than 20 and 100 cases, respectively reported in the English literature.3,4
2. AIM
In this article, we describe two cases of Warthin’s tumor and one case of diffuse large B-cell lymphoma located in the la-ryngeal ventricle that remained undiagnosed in the preop-erative period owing to the difficult differential and lack of specific symptoms. The aim of the study was to report these extremely rare lesions, as they require special diagnostic, therapeutic attention and collaboration with the pathologist.
3. CASE STUDY
A 58-year-old woman was admitted to the hospital (07/2016) presenting persistent hoarseness for about 2 years accompa-nied by progressive dyspnea since October 2015. She denied any other symptoms. The patients had a long-term cigarette smoking history. In the physical examination no changes of head and neck region lymph nodes were palpable. The direct laryngoscopy revealed bilateral well-defined, smooth masses originating from laryngeal ventricles and vestibular folds (Figure 1 and 2). However, there was no severe de-terioration of her airway tract. The changes noted in the direct laryngoscopy were later confirmed in the ultrasound
examination of the neck, which also revealed multinodular goiter. The primary diagnosis was laryngocele. Therapeutic excision in Kleinsasser microlaryngoscopy using CO2 laser was performed. Histological examination showed a cystade-nolymphoma (Warthin’s tumor). The patient is on frequent follow-up scheme in the outpatient setting, which after one year remains uneventful.
An 81-year-old man was admitted to our department (07/2016) due to persistent mild hoarseness for about 12 months. His past medical record included hypertension, brain stroke, heart infarct and asthma. He was an active smoker for many years. The direct laryngoscopy was per-formed and showed unilateral smooth mass located in the left laryngeal ventricle and comprising the left vestibu-lar fold. The patient was qualified for transoral surgery in Kleinsasser microlaryngoscopy. During the procedure, a specimen samples for intraoperative histopathologi-cal examination were taken. The result showed a variable amount of salivary gland tissue with histological features of Warthin’s tumor. The final histology confirmed the di-agnosis. The patient is on frequent follow-up scheme in the outpatient setting with no sign of recurrence.
The third patient was a 74-year-old woman admitted to ENT department (07/2016) due to progressive mild hoarse-ness and dyspnea for about 3 months without any other specific symptoms. The physical examination revealed no palpable lymph nodes. In the direct laryngoscopy a smooth, round mass in the right laryngeal ventricle was observed, covering the right vocal fold. There were no signs of airway obstruction. Based on laryngoscopy and ultrasound laryn-gocele was suspected and as a result the patient was qualified for microlaryngoscopy with the use of the CO2 laser. During the surgery, an intraoperative histopathological examina-tion was performed. It revealed neoplastic malignant cells in the specimen. Consequently, the lesion was fully excised and the final histopathology indicated diffuse B-cell lym-phoma centroblastic variant. Further immunohistopatho-logical examination revealed a set of unfavorable prognostic factors: expression of Bcl-2 and MUM-1, non GCB subtype and high Ki67 score (60-70%). A hematology consultation was carried out and as a result the patient was planned to
Figure 1 and 2. The direct laryngoscopy revealing bilateral well-defined, smooth masses originating from laryngeal ventricles and vestibular folds.

247 Pol ann MeD. 2018;25(2):245–249
be admitted to the ward. However, due to a sudden dete-rioration of her clinical condition, the patient passed away shortly afterwards, before appropriate hematological treat-ment could have been implemented.
4. RESULTS
Clinical data of the presented patients were summarized in Table 1. Diagnostic and therapeutic approach implemented in our patients are discussed in this part of the article based on the available literature.
Cystadenolymphoma (CAL) also known as Warthin’s tu-mor is a benign tumor of the salivary glands, consisting of oncocytic epithelial cells and lymphoid stroma containing lymphoid follicles with reactive germinal centers.5 It was first described in 1895 by Hildebrand and is named after an American pathologist Aldred Warthin who contributed the most to its description.6 Warthin’s tumor is reported most often in smokers.6–8 The highest prevalence occurs in the sixth or seventh decades of life and a male predominance was noted.6 However, there are also reports of the increas-ing incidence in females and even those of equal predilec-tion in both sexes since 1970 which is explained by chang-ing patterns of tobacco use.6–8 A correlation of the Warthin’s tumor’s occurrence with Epstein–Barr virus (EBV) infec-tion has also been observed, but the relationship is so far unclear.8
It is found most often in the parotid gland and repre-sents about 10 % of all salivary gland tumors which makes it the second most frequent benign tumor of salivary glands, with 10% of these being bilateral.6
CALs are believed to originate from the excretory duct-ules of salivary glands and since the occurrence of the sali-vary gland tissue in ectopic locations within the head and neck has been reported also cases of Warthin’s tumors out-side the salivary glands have been noted.9,10
However, other locations are rare (about 8%) and most often include the lymph nodes of the cervical region.7,8 They were also reported in the nasopharynx, the minor salivary gland in the buccal mucosa or in the larynx.6,10,11 Approxi-mately 6% of CALs are discovered incidentally as part of a specimen after neck dissections for malignancies of the head and neck and a case of multiple unilateral Warthin’s tumors demonstrating the complete transition from salivary ductal inclusions to the CAL was published which may sug-
gest a continuum resulting ultimately in grossly detectable lesions.12,13
Until now, only few cases of a Warthin’s tumor in the larynx were reported often with the coexistence within one or both parotid glands. These involved the location of the tumor in the region of the aryepiglottic fold, the lateral thy-roarytenoid muscle or the left Morgagni sinus.11
It’s pathogenetic mechanism still remains unclear and the most common theories explaining the origin of the CAL include a delayed hypersensitivity reaction of the parotid parenchyma to a ductual metaplasia; an abnormal blending of salivary and lymphoid tissues during embryogenesis or a holdover of the branchial cleft apparatus.11
Clinically the Warthin’s tumor is mostly asympto-matic,14 however depending on its localization, which may range from the middle ear to the larynx, such symptoms as pain (varying from mild discomfort and tenderness to very severe pain), earache, tinnitus, deafness, facial weakness and swelling may occur.15 CALs usually grow very slowly and have a shape of a well-circumscribed, egg-shaped swelling of 1–3 cm in diameter.15,16 Whenever a CAL is suspected the differential diagnosis should be performed and include cysts, lymph nodes, pleomorphic adenoma, papillary cys-tadenoma or squamous cell carcinoma among others.
Ultrasonography has been found helpful not only in de-tecting Warthin’s tumors but also in describing the struc-ture and even the vascularity of the lesions.17 In ultrasonog-raphy the Warthin’s tumor has been described as echogenic, strikingly hypoechoic or sonolucent with few internal focal echoes.18 In PET/CT they show hypermetabolism and it is believed that the increasing use of these techniques could increase a number of its incidental findings at unusual loca-tions including the larynx.6
The data concerning the management of Warthin’s tu-mors are limited and suggest that it should be resected fully with an adequate margin to avoid local recurrence and the conservative treatment seems to be less favorable.19 Of the resection methods the transoral approach seems to be ap-propriate for most of the cases as it has little side effects and is most often curative.6 Larger or invasive neoplasms which are more difficult to excise these way may require an exter-nal approach.
The risk of recurrence following excision in the parotid gland is high, estimated 5%–25%.7 In the larynx they are not well-known and the recurrence seems to be an excep-tion there, however its possibility always has to be kept in
Table 1. Clinical data of presented patients.
Year Age/Sex Presentation Location Surgical approach Pathology
2016 58/F Hoarseness Dyspnea Supraglottic Microlaryngoscopy (CO2 laser)
Cystadenoma papillary lymphomatosum (Warthin’s tumor)
2016 81/M Hoarseness SupraglotticMicrolaryngoscopy
(CO2 laser) Cystadenoma papillary lymphomatosum (Warthin’s tumor)
2016 74/F Hoarseness Dyspnea SupraglotticMicrolaryngoscopy
(CO2 laser)Lymphoma malignum diffusum centroblasticum(Diffuse B-cell lymphoma centroblastic variant,
non GCB-type)

248 Pol ann MeD. 2018;25(2):245–249
mind as few have been reported.6 As a result it is important to obtain a fully excised specimen and patients should be under a longer follow-up period in case of the need for fur-ther surgery.
Moving to the next entity, diffuse large B-cell lymphoma (DLBCL) is a lymphoid malignancy with neoplastic trans-formation of mature peripheral B lymphocytes arising in germinal centers. It is the most prevalent type of non-Hodg-kin lymphoma among adults with the average age at diagno-sis of 70 years with a male predominance.20 The etiology of the disease still remains unclear.
Different environmental, immunological, infectious and iatrogenic factors are taken into consideration. EBV infec-tion contributes to the occurrence of some subgroups of DLBCLs. The researches show EBV positive DLBCLs are associated with unfavorable prognostic features, poor treat-ment response and worse survival than EBV negative.21
Patients usually present lymphadenopathy, however, in up to 40% of them the location of a lymphoma is extranodal. The Waldeyer’s ring is the most common extranodal area involved in the head and neck region.22 Primary lymphomas restricted to larynx are extremely rare lesions. The occur-rence of them is reported to be less than 1% of laryngeal neoplasm. Moreover, there are fewer than 100 histologi-cally confirmed cases reported in the global literature.22–24 DLBCL and extranodal marginal zone lymphoma of muco-sa-associated lymphoid tissue (MALT lymphoma) are pre-dominant recognitions and represent approximately 75% of laryngeal NHLs.22,23 Extremely rare cases are also described in the literature such as NK/T-cell lymphoma, peripheral T-cell lymphoma, not otherwise specified (PTCL, NOS), Burkitt lymphoma.25,26 Moreover, a case of an 8-year-old boy suffering from primary laryngeal lymphoma is also re-ported.28
The majority of the lesions is located in the supraglottic region as a result of follicular lymphoid tissue presence in this site.22,23 They can expand locally, affecting surrounding structures as thyroid, tonsils, salivary glands and nasophar-ynx.24 Clinically the patient may present various symptoms including dysphagia, dysphonia, hoarseness, cough, dysp-nea, cervical lymphadenopathy and systemic signs like fe-ver, weight loss and night sweats.22,29
As the presentation is usually nonspecific, the diagnosis may be challenging. The case of our patient with only one symptom (progressive mild hoarseness) confirms it. How-ever, rarely the course of illness may be rapid with acute airway obstruction.24 Based on currently available data, the laryngoscopy usually reveals discrete, unilateral lesions de-scribed as smooth submucosal masses, rarely ulcerated.22
Histopathological examination is necessary for the definite diagnosis.
The review of the literature reveals chemotherapy, radio-therapy, immunotherapy and combination of them as effec-tive methods of treatment. The choice of therapy depends on staging (Ann Arbor), the extent of expansion and immuno-histopathological results. Surgery is not recommended as the first line of treatment in these lesions, however, it can be nec-
essary when the mass of the tumor obstructs the airways and the patient suffers from difficulties in breathing.23 Some data indicate that excision of the tumor by the Carbon dioxide laser before other therapies may be beneficial for the patient and may allow avoiding tracheostomy or laryngectomy.22
6. CONCLUSIONS
(1) This case series serves to highlight the rich and varied pathology which can affect the larynx.
(2) In the differential diagnosis of laryngeal asymmetry lar-yngocele, benign and malignant lesions need to be taken into consideration.
(3) In addition to the more commonly encountered condi-tions, the otolaryngologists should always be aware of the varied pathology of the larynx.
Conflict of interestNone declared.
References 1 Hirano M, Yukizane K, Kurita S, Hibi S. Asymmetry of the
Laryngeal Framework: A Morphologic Study of Cadaver Larynges. Ann Otol Rhinol Laryngol. 1989;98(2):135–140. https://doi.org/10.1177/000348948909800210.
2 Szmeja Z, Szyfter W, Golusiński W. [Unilateral prolapse of the laryngeal pouch due to the deformity of the thyroid car-tilage]. Polish Otolaryngol. 1995;49(6):519–524 [in Polish].
3 Nisa L, Landis BN, Salmina C, Ailianou A, Karamitopoulou E, Giger R. Warthin’s tumor of the larynx: a very rare case and systematic review of the literature. J Otolaryngol Head Neck Surg. 2015;44(1):16. https://doi.org/10.1186/s40463-015-0067-5.
4 Horny HP, Kaiserling E. Involvement of the larynx by he-mopoietic neoplasms. An investigation of autopsy cases and review of the literature. Pathol Res Pract. 1995;191(2): 130–138. https://doi.org/10.1016/S0344-0338(11)80562-5.
5 Aga M, Kondo S, Yamada K, et al. Warthin’s tumor as-sociated with IgG4-related disease. Auris Nasus La-rynx. 2013;40(5):514–517. https://doi.org/10.1016/j.anl.2012.11.005.
6 Nicolai G, Ventucci E, Antonucci P, et al. Bilateral and multi-focal Warthin’s tumor of parotid gland: two case reports and review of literature. Oral Implantol (Rome). 2014;7(1):25–31.
7 Patterson JW, Wright ED, Camden S. Extraparotid Warthi-n’s tumor. J Am Acad Dermatol. 1999;40(3):468–470. https://doi.org/10.1016/S0190-9622(99)70499-8.
8 O’Neill ID. New insights into the nature of Warthin’s tumo-ur. J Oral Pathol Med. 2008;38(1):145–149. https://doi.or-g/10.1111/j.1600-0714.2008.00676.x.
9 Donald PJ, Krause CJ. Papillary cystadenoma of the la-rynx. Laryngoscope. 1973;83(12):2024–2028. https://doi.org/10.1288/00005537-197312000-00014.
10 Foulsham CK, Snyder GG, Carpenter RJ. Papilla-ry Cystadenoma Lymphomatosum of the Larynx. Oto-laryngol Neck Surg. 1981;89(6):960–964. https://doi.org/10.1177/019459988108900616.
249 Pol ann MeD. 2018;25(2):245–249
11 Ioannis N Kotrotsos EIG. Multifocal Occurrence of War-thin’s Tumor in Both Parotid Glands and in the Larynx. J Otolaryngol Res. 2015;2(3):1–3. https://doi.org/10.15406/jo-entr.2015.2.00023.
12 Dietert SE. Papillary cystadenoma lymphomatosum (War-thin’s tumor) in patients in a general hospital over a 24-year period. Am J Clin Pathol. 1975;63(6):866–875. https://doi.org/10.1093/ajcp/63.6.866.
13 Azzopardi JG, Lee Tsün H. The genesis of adenolympho-ma. J Pathol Bacteriol. 1964;88(1):213–218. https://doi.org/10.1002/path.1700880127.
14 Karthikeya P, Mahima VG, Shalini K. Papillary cystade-noma lymphomatosum: case report and review of litera-ture. Indian J Dent Res. 2005;16(4):153–158. https://doi.org/10.4103/0970-9290.29904.
15 Eveson JW, Cawson RA. Warthin’s tumor (cystadenolym-phoma) of salivary glands. A clinicopathologic investigation of 278 cases. Oral Surg Oral Med Oral Pathol. 1986;61(3):256–262. https://doi.org/10.1016/0030-4220(86)90371-3.
16 Sato T, Morita Y, Hamamoto S, Noikura T, Kawashima K, Matsune S, Semba I. Interpretation of scintigraphy of pa-pillary cystadenoma lymphomatosum (Warthin’s tumor) on the basis of histopathologic findings. Oral Surg, Oral Med Oral Pathol Oral Radiol Endod. 1996;82(1):101–107. https://doi.org/10.1016/S1079-2104(96)80386-6.
17 Shimizu M, Ussmüller J, Hartwein J, Donath K. A compa-rative study of sonographic and histopathologic findings of tumorous lesions in the parotid gland. Oral Surg Oral Med Oral Pathol Oral Radiol Endod. 1999;88(6):723–737. https://doi.org/10.1016/S1079-2104(99)70017-X.
18 Yoshiura K, Miwa K, Yuasa K, et al. Ultrasonographic te-xture characterization of salivary and neck masses using two-dimensional gray-scale clustering. Dentomaxillofa-cial Radiol. 1997;26(6):332–336. https://doi.org/10.1038/sj.dmfr.4600295.
19 Bouchayer M, Cornut G, Witzig E, Loire R, Roch JB, Bastian RW. Epidermoid cysts, sulci, and mucosal bridges of the true vocal cord: a report of 157 cases. Laryngoscope. 1985;95(9 Pt 1):1087–1094. https://doi.org/10.1288/00005537-198509000-00014.
20 Smith A, Howell D, Patmore R, Jack A, Roman E. Incidence of haematological malignancy by sub-type: a report from the Haematological Malignancy Research Network. Br J Cancer. 2011;105(11):1684–1692. https://doi.org/10.1038/bjc.2011.450.
21 Lu T-X, Liang J-H, Miao Y, et al. Epstein-Barr virus posi-tive diffuse large B-cell lymphoma predict poor outcome, regardless of the age. Sci Rep. 2015;5(1):12168. https://doi.org/10.1038/srep12168.
22 Markou K, Goudakos J, Constantinidis J, Kostopoulos I, Vital V, Nikolaou A. Primary laryngeal lymphoma: Re-port of three cases and review of the literature. Head Neck. 2009;32(4):NA-NA. https://doi.org/10.1002/hed.21104.
23 Cui W, Fan F, Zhang D, Garnett D, Tilzer L. Primary com-posite lymphoma of the larynx, composed of diffuse large B--cell lymphoma and peripheral T-cell lymphoma, not other-wise specified, presenting as left subglottic tracheal fistula, esophageal diverticulum, and neck abscess. Ann Clin Lab Sci. 2012;42(1):73–80.
24 Rahman B, Bilal J, Sipra QUAR, Riaz I Bin. All That Whe-ezes Is Not Asthma: A Case of Diffuse Large B-Cell Lym-phoma of the Larynx. Case Rep Oncol Med. 2017;2017:1–4. https://doi.org/10.1155/2017/7072615.
25 Monobe H, Nakashima M, Tominaga K. Primary laryngeal na-tural killer/T-cell lymphoma-Report of a rare case. Head Neck. 2008;30(11):1527-1530. https://doi.org/10.1002/hed.20803.
26 Kato S, Sakura M, Takooda S, Sakurai M, Izumo T. Pri-mary non-Hodgkin’s lymphoma of the larynx. J Laryn-gol Otol. 1997;111(6):571–574. https://doi.org/10.1017/S0022215100137946.
27 Quimby AE, Caulley L, Rodin D, Purgina B, Eapen L, Shier L, Johnson-Obaseki S. Primary Burkitt lymphoma of the supraglottic larynx: a case report and review of the literatu-re. J Med Case Rep. 2017;11(1):65. https://doi.org/10.1186/s13256-017-1209-3.
28 Rodríguez H, Cuestas G, Bosaleh A, Passali D, Zubizarreta P. Primary laryngeal lymphoma in a child. Turk J Pediatr. 57(1):78–81.
29 Andratschke M, Stelter K, Ihrler S, Hagedorn H. Subglot-tic tracheal stenosis as primary manifestation of a marginal zone B-cell lymphoma of the larynx. In Vivo. 19(3):547–550.

250 Pol ann MeD. 2018;25(2):250–253
Case report
Jeyasakthy Saniasiaya1, Mohan Kameswaran2, Murali Susruthan3, Baharudin Abdullah1
1 Department of Otorhinolaryngology – Head and Neck Surgery, School of Medical Sciences, Universiti Sains Malaysia, Kelantan, Malaysia2 Madras ENT Research Foundation, Tamil Nadu, India
3 Susrutha Diagnostics, Tamil Nadu, India
Corresponding author: Jeyasakthy Saniasiaya, Department of Otorhinolaryngology – Head and Neck Surgery, School of Medical Scinces, Universiti Sains Malaysia, Health campus, 16150 Kota Bharu, Kelantan, Malaysia.
Tel.: +6097673000.E-mail address: [email protected].
Successful endoscopic excision of nasal plasmacytoma: Lesson learnt
article info
Art ic l e h i s toryReceived 21 January 2016Accepted 10 May 2017Available online 29 June 2018
Keywords Extramedullary plasmacytomaSinonasal tumoursMultiple myeloma
Doi10.29089/2017.17.00060
User l i cense This work is licensed under a Creative Commons Attribution –NonCommercial – NoDerivatives 4.0 International License.
abstract
Introduct ion: Extramedullary plasmacytoma is a rare entity which belongs to non-Hodgkin lymphoma category. Head and neck region is the most common site of manifestation, of which sinonasal area is of predominance which oftenti-mes remains undiagnosed.
Aim: To illustrate unusual presentation of nasal mass and its management.
Case s tudy: Herein, we are reporting a case of sinonasal plasmacytoma in an elderly man who presented with a four month history of unilateral nasal blocka-ge. Rigid nasoendoscopy revealed benign looking polypoidal mass occupying en-tire right nasal cavity with no evidence of any polypoidal mass seen over the left nostril. Computer tomography revealed homogenous soft tissue mass over right nasal cavity with minimal mucosal thickening in bilateral maxillary, ethmoid, sphenoid and left frontal sinus.
Resu l t s and d i scuss ion: Patient underwent endoscopic clearance of right nasal mass under general anaesthesia. Nasal mass was removed with the aid of microdebrider and Blakesley forcep without difficulty. Intra- and postoperative were unremarkable. Histopathological examination of the nasal mass along with immunohistochemical study was suggestive of nasal plasmacytoma. In addition, systematic workup for multiple myeloma was negative. Subsequent follow-up revealed no evidence or recurrence and patient has been asymptomatic till date.
Conc lus ions : Transnasal endoscopic surgical excision is an ideal treatment for small and localised extramedullary sinonasal plasmacytoma. Albeit rare, extramedullary sinonasal plasmacytoma should be considered as a differential diagnosis of sinonasal mass as this entity has tendency to develop into multiple myeloma as well as the different mode of management of this rare entity differs.
Journal homepage: https://www.paom.pl
Polish Annals of Medicine

251 Pol ann MeD. 2018;25(2):250–253
1. INTRODUCTION
Extramedullary plasmacytoma (EMP) is a rare plasma cell neoplasm involving soft tissue, accounts for less than 1% of all head and neck tumours1 and less than 0.5% of all aerodi-gestive tract tumours.2 It commonly manifests in the upper respiratory tract, more so in the nasal cavity and paranasal sinus.1 Approximately 80%–90% of EMP involve mucosa-as-sociated lymphoid tissue of the upper airway, of which 75% involves sinonasal region.1 In up to 33% of cases, multiple myeloma may occur, thus this warrants a life-long follow up of patients with sinonasal EMP. In this article, we describe the presentation, diagnosis and management of this entity.
2. AIM
Aim of this case report is to illustrate on unusual presenta-tion of nasal mass, importance of histopathological exami-nation for all nasal mass despite being benign looking and its management.
3. CASE STUDY
A 79-year-old Indian gentleman with underlying hyperten-sion, was referred to Madras ENT Research Foundation, with a four-month history of right-sided nasal blockage. Ac-cording to him, nasal blockage lead to difficulty in breath-ing which caused distress to him. Apart from that, there were neither any accompanying epistaxis, nasal discharge, facial tenderness, proptosis nor any inciting trauma or in-fection prior to that. There were also no prior symptoms suggestive of an allergic condition or any upper respiratory infections or any prior nasal surgery.
Upon review, patient was comfortable with no sign of respiratory distress. Anterior rhinoscopy revealed right-sided benign looking nasal mass with congested mucosa over right nasal cavity with no mass seen over left nasal cavity. Zero degree rigid nasoendoscopy revealed a benign looking polypoidal mass occupying entire right nasal cavity with no sign of an active infection which did not bleed upon probing. There was however, no evidence of any polypoidal mass seen over the left nostril. Other than that, intraoral examination was normal. His systemic examination and vi-tal signs were also unremarkable and within normal range. Blood parameters were also normal.
Computer tomography revealed homogenous soft tissue mass occupying right nasal cavity with no evidence of erosion, minimal mucosal thickening in bilateral maxillary, ethmoid, sphenoid and left frontal sinus (Figure 1). We proceeded with endoscopic clearance of right nasal mass under general anaesthesia. Intraoperatively, right nasoendoscopy revealed polypoidal mass arising from lateral nasal wall, occupying the entire right nasal cavity. The nasal mass was removed with the aid of microdebrider and Blakesley forcep without difficulty. As there was only minimal bleeding, no nasal packing was re-
quired. The excised mass was sent for histopathological exam-ination. Post-operatively, there was no complication, patient was well and was discharged home the subsequent day with a one-week appointment. Patient was also prescribed home with a one-week course of antibiotics and analgesics.
Histopathological examination revealed respiratory epi-thelium with cells arranged as sheets showing oval cells with eccentrically placed nuclei, cloak faced chromatin, perinu-clear clearing with few binucleate cells (Figure 2). Immuno-histochemical study was diagnostic of plasmacytoma. Hence, a diagnosis of nasal plasmacytoma was made. Systematic workup for multiple myeloma was negative. Subsequent fol-low-up demonstrated no evidence of recurrence or any nasal mass and patient has been asymptomatic till date. Patient was planned for repeated follow-up to monitor recurrence.
Figure 1. Homogenous soft tissue mass occupying right nasal cavity.
Figure 2. Respiratory epithelium with oval cells, eccen-trically placed nuclei, cloak faced chromatin, perinuclear clearing with few binucleate cells.

252 Pol ann MeD. 2018;25(2):250–253
4. RESULTS AND DISCUSSION
Plasmacytoma was first described by Schridde in 1905 as a discrete solitary mass of neoplastic monoclonal plasma cells. Plasmacytoma, basically can be divided into 3 vari-ants: multiple myeloma, osseous solitary plasmacytoma and extramedullary plasmacytoma (EMP).3
EMP is derived from plasma cells with a single class of heavy and light chains in a monoclonal proliferation of B cells.4 Upper respiratory tract is considered the most com-mon site as the submucosa in this region are rich with plas-ma cells. Other rare affected sites includes urinary bladder, central nervous system, orbit, gastrointestinal tract, liver, spleen, pancreas, lung, breast, skin, testis, parotid gland, mediastinum and thyroid gland.
The global incidence of EMP is 1 case per 100 000 cases. There is a male preponderance of 3 : 1 with an average age of 60 years.5 Our patient discussed above is a male in his 8th decade of life. The nasal mass appears as a solitary, sub-mucosal, sessile or polypoidal mass. Apart from that, this entity has a slowly evolving nature.2 Patients usually remain asymptomatic until the mass expands.6 Patients usually turns up to the otorhinolaryngology clinic with complaints of nasal obstruction, epistaxis or facial pain although, cases with ulceration or bone invasion have been reported. Cervi-cal lymphadenopathy has been documented in 20%–25% of cases with EMP in the head and neck region.7 Our patient discussed above however, complained only of progressive unilateral nasal blockage.
Albeit myriad hypothesis that exists till date regarding aetiology of EMP including viral infection, overdose or in-appropriate radiation and genetic alterations in the reticu-loendothelial system,8 chronic irritation from inhaled irri-tants remains to be the most sought out for and this may be the case in our patient as well.
Diagnosis of sinonasal EMP is based solely on histo-pathological examination as there are no pathognomonic clinical presentation. Thus, deep biopsies should be per-formed as the tumour is oftentimes submucosal and mucosa may be thickened as a result of inflammation.2 Apart from histopathological examination of tissue biopsy, patients di-agnosed with EMP should be further evaluated for serum electrophoresis and radiological skeletal survey with bone marrow aspirate to confirm diagnosis3 and to rule out other systemic disease.
Differential diagnosis of this entity among others in-cludes lymphoma, marginal zone B-cell lymphoma, plasma cell granuloma, poorly differentiated neoplasms and reac-tive plasmacytosis.9
Till date, there is no consensus on gold standard treat-ment of sinonasal EMP. Management of sinonasal EMP comprises of single-modality treatment including surgical, radiotherapy or chemotherapy and combined management. In many centres, combination of surgical excision with an adjuvant radiotherapy is favoured as this entity known to be radiosensitive.9 Some authors also advocate radiotherapy as a sole treatment for this entity.2 As for the dosage of radio-
therapy, no standard protocol exist and varies between 3000 rads and 8000 rads over a period of 3 to 6 weeks.2 Chemo-therapy should be considered for refractory or relapse cases. Having said that, small and localised tumour located in the head and neck region can be managed solely by surgical excision as this has been shown to have similar results as radiotheraphy.10 In our patient, we opted for transnasal en-doscopic surgical excision as the mass was more localised and there was no signs of erosion.
Long-term follow up is mandatory for patients with sinonasal EMP as 15%–20% of EMP turns to multiple my-eloma over the years especially when there is a bone involve-ment.5 Not only that, local recurrence has also been reported by countless authors. Some authors, propose serum electro-phoresis and imaging upon follow-up to detect recurrence.4
Prognosis of this entity depends on the dissemination of the disease, tumour size and nodal involvement. Ten-year survival rate have been reported in 70%. Hence, these pa-tients ought to be kept under close surveillance with a life-long follow-up.
5. CONCLUSIONS
Extramedullary sinonasal plasmacytoma albeit a rare en-tity, is often underdiagnosed. This article emphasizes on histopathological examination for all sinonasal tumours as negligence or underdiagnoses of EMP may lead to devastat-ing consequences as these entity has tendency to develop multiple myeloma. As for surgical management, it should be tailored according to the tumour size and location.
Conflict of interestNone declared.
References1 Attanasio G, Viccaro M, Barbaro M, De Seta E, Filipo R.
Extramedullary plasmacytoma of paranasal sinuses. A combined therapeutic strategy. Acta Otorhinolaryngol Ital. 2006;26(2):118–120.
2 Anjos Corvo MA, Granato L, Ikeda F, De Prospero JD. Extramedullary nasal plasmacytoma: Literature review and case report. Int Arch Otorhinolaryngol. 2013;17(2):213–217.
3 de Paula Araújo R, Gomes EF, de Menezes DB, de Brito Ma-cedo Ferreira LM, do Nascimento Rios AS. Rare nasosinosal tumour: case series and literature review. Braz J Otorhino-laryngol. 2008;74(2):307–314. https://doi.org/10.1016/S1808--8694(15)31106-X.
4 Ashraf MJ, Azarpira N, Khademi B, Abedi E, Hakimzadeh A, Valibeigi B. Extramedullary plasmacytoma of the nasal cavity: Report of three cases with review of the literature. Iran Red Crescent Med J. 2013;15(4):363–366. https://doi.org/10.5812/ircmj.2209.
5 Bachar G, Goldstein D, Brown D, et al. Solitary extramedul-lary plasmacytoma of the head and neck long term outco-me analysis of 68 cases. Head Neck. 2008;30(8):1012–1019. https://doi.org/10.1002/hed.20821.

253 Pol ann MeD. 2018;25(2):250–253
6 Ashish G, Chandrasekaran R, Parmar H. A rare case of si-nonasal extramedullary plasmacytoma with orbital involve-ment. Int J Head Neck Surg. 2015;6(3):121–124. https://doi.org/10.5005/jp-journals-10001-1239.
7 Medina E, Rao Y, Levitt SH. Solitary extramedulla-ry plasmacytoma of the upper respiratory and digesti-ve tracts. Cancer. 1980;45(11):2893–2896. https://doi.org/10.1002/1097-0142(19800601)45:11<2893::AID--CNCR2820451130>3.0.CO;2-9.
8 Moshref M, Mashhadi-Abbas F, Sargolzaei S, Nafarzadeh S. Extramedullary plasmacytoma of the gingiva. Arch Iran Med. 2007;10(1):91–93.
9 Soo G, Chan A, Lam D, Abdullah V, van Hasselt CA. Extra-medullary nasal plasmacytoma-an unusual clinical entity. Ear Nose Throat J. 1996;75(3):171–173.
10 Lomeo PE, McDonald JE, Finneman J, Shoreline. Extra-medullary plasmacytoma of the nasal sinus cavities. Am J Otolaryngol Head Neck Med Surg. 2007;28:50–51.

254 Pol ann MeD. 2018;25(2):254–257
Case report
Mürteza Çakır1, Atilla Yilmaz2, Hakan H. Kadıoğlu1, Çağatay Çalıkoğlu1 1 Department of Neurosurgery, Ataturk University, Erzurum, Turkey
2 Department of Neurosurgery, Mustafa Kemal University, Hatay, Turkey
Corresponding author: Mürteza Çakır, Neurosurgery and Emergency Department, Atatürk University, Medical School Research Hospital, 2500, Erzurum, Turkey. Tel.: +90 442 231 83 67.
E-mail address: [email protected].
Suspension of the spinal dura mater to the corpectomy cage with tack-up sutures for bleeding control and prevention
of epidural hematoma: Operative technique
article info
Art ic l e h i s toryReceived 21 January 2016Accepted 10 May 2017Available online 29 June 2018
Keywords Spinal surgeryPostoperative spinal epidural hematoma Tackingup sutureOperative technique
Doi10.29089/2017.17.00058
User l i cense This work is licensed under a Creative Commons Attribution –NonCommercial – NoDerivatives 4.0 International License.
abstract
Introduct ion: Postoperative spinal epidural hematoma (PSEH) is a rare complication of spinal surgery that requires surgery in very few patients. Unless prompt diagnosis and intervention is performed, neurologic deficits and morta-lity may occur depending on the localization of the PSEH.
Aim: In this report, we present a case that underwent tack-up suture technique with the suspension of the spinal dura mater to the corpectomy cage for bleeding control and prevention of epidural hematoma.
Case s tudy: A 70-year-old male patient was admitted with paresis on the right arm. MRI showed protrusion and grade 2 spondylolisthesis at C3–C4, oblitera-tion of anterior cerebrospinal fluid column caused by osteophytes at C4–C5–C6, and loss of intervertebral disc height and degenerative fusion at the same level. C4–C5 anterior corpectomy and instrumentation was performed. Two hours after surgery, neurologic deficits developed and an epidural hematoma was detected on MRI. The patient underwent a revision surgery and hemostasis was achieved by the suspension technique. Neurologic deficits recovered postoperatively. Po-stoperative MRI showed the suspension of dura like a tent and no hematoma in the epidural space.
Resu l t s and d i scuss ion: Prevention of PSEH in addition to prompt dia-gnosis and surgical intervention is highly important for the prevention of adver-se outcomes. In our case, we achieved successful hemostasis by suspending the dura to implanted instrument in the paravertebral region.
Conc lus ions : Suspension of the dura with tack-up sutures can be a useful technique for the prevention of PSEH and risk of cord compression.
Journal homepage: https://www.paom.pl
Polish Annals of Medicine

255 Pol ann MeD. 2018;25(2):254–257
1. INTRODUCTION
Postoperative spinal epidural hematoma (PSEH) is a classic but rare complication of spinal surgery.1–7 Although the real incidence of PSEH is unknown, it is predicted to be around 0.2% after all spinal procedures.1,3,8–11 PSEH is believed to arise from a rich epidural venous plexus.12–13 Moreover, it may also result from massive bleeding after decompression of the ossification of the posterior longitudinal ligament (PLL).2,14
The prognostic factors for PSEH include multiple-seg-ment surgeries, history of spinal surgeries, instrumenta-tion, duratomy, prolonged operative time, systemic diseases, smoking and alcohol abuse, preoperative coagulopaty, preop-erative non-steroidal anti-inflammatory drug intake, intra-operative massive hemorrhage, old age, Rh+ blood groups, an intraoperative hemoglobin level of less than 10 g/dL, and increased pre- and perioperative international normalized ratio (INR) levels.2–5,7,9,15,16
Spinal cord compression and neurological symptoms that require surgery are seen in very few patients with PSEH. Although most of the PSEH cases remain asympto-matic, the disease may result in rapidly-progressive cauda equina syndrome, quadriplegia, respiratory disorders and even death by the time it becomes symptomatic. PSEH should be suspected in the patients presenting with postop-erative neurologic deficits or with worsened symptoms.2,11 Prompt diagnosis and surgical drainage of the hematoma is of prime importance for maximum neurological recovery.2,3
2. AIM
In this report, we present a case that underwent tack-up su-ture technique with the suspension of the spinal dura mater to the corpectomy cage for bleeding control and prevention of epidural hematoma.
3. CASE STUDY
A 70-year-old male patient was admitted with a one-month history of weakness, pain, and paresthesia in the right arm. Patient history revealed that the patient had undergone ob-structive lung disease, permanent tracheostomy and larynx carcinoma five years ago, and medically well-controlled hypertension. On neurologic examination, paresis was de-tected and the muscle strength was 4/5 in the right wrist and 3/5 in the forearm, arm, and shoulder (ASIA). Laboratory parameters including coagulation tests were within normal ranges. On cervical MRI, T2-weighted images showed pro-trusion and grade 2 spondylolisthesis at C3–C4, obliteration of anterior cerebrospinal fluid (CSF) column caused by oste-ophytes at C4–C5–C6, and loss of intervertebral disc height and degenerative fusion at C4–C5–C6 (Figure 1).
The procedure was initiated by corpectomy. After C4–C5 corpectomy, active epidural bleeding was detected and was controlled by hemostatic materials. A C3–C6 anterior spinal
fusion was performed with self-plated titanium elevator cage filled with putty bone graft. The operative time was approxi-mately 120 minutes and total blood loss was 400 mL. The patient was not awakened due to respiratory problems and hypertension and thus was transferred to the intensive care unit for controlled awakening. Two hours after the operation, painless quadriparesis was detected and thus an emergency MRI was performed. T1- and T2-weighted images showed the impression of an epidural hematoma extending between C2 and C6 and causing massive cord compression (Figure 2).
Figure 1. Preoperative T2 weighted cervical sagittal MRI image: Protrusion and grade 2 spondylolisthesis at C3–C4, obliteration of anterior cerebrospinal fluid column caused by osteophytes at C4–C5–C6, and loss of interver-tebral disc height and degenerative fusion at C4–C5–C6.
Figure 2. Postoperative T2-weighted cervical sagittal MRI image: The impression of an epidural hematoma extending between C2 and C6 and causing massive cord compression.

256 Pol ann MeD. 2018;25(2):254–257
A revision surgery was performed under emergency condi-tions. The previous incision was opened and the paraverte-bral hematoma was exposed and aspirated. Subsequently, the cage was removed and the hematoma leading to severe compression of the cord was aspirated. Spinal cord pulsation was absent. Vertical duratomy was performed. Spinal cord pulsation was restored after the drainage of high-pressure CSF. Subsequently, bleeding from the venous plexi in both epidural spaces was detected and thus primary duraplasty was performed. Although the bleeding was lessened by control-ling the coagulation with bipolar cauters and the bleeding
with hemostatic materials, the bleeding was not controlled completely and continued to leak from the epidural veins. The proximal and the distal aspects of the dura mater were fixed with 5/0 suspension sutures (Figure 3). The bleeding in the epidural space was controlled by clamping the sus-pension sutures. The cage was reinserted under fluoroscopic guidance. The proximal and distal sutures were fixed to each other above the cage. The procedure was ended after achiev-ing hemostasis. A repeat MRI showed that the hematoma was completely evacuated and the dura mater at the corpectomy site was suspending like a tent both proximally and distally (Figure 4). The neurological deficits that developed after the primary surgery were significantly improved.
4. RESULTS AND DISCUSSION
Symptomatic PSEH is a rare complication of spinal surgery with a reported incidence of 0.1%–0.2%. It is also a major complication of spinal decompression surgery and may be inevitable in some cases.1–4 Due to its proximity to the dura and neural tissues, it can lead to serious morbidity and mor-tality unless prompt diagnosis and surgical evacuation is performed.16 Therefore, prevention of PSEH in addition to prompt diagnosis and surgical evacuation is highly impor-tant for the prevention of adverse outcomes.2,3,6
Studies reporting on PSEH have mainly focused on the incidence, risk factors, operative timing, and outcomes of the disease. Moreover, to our knowledge, these studies have made no significant contribution to the literature except for pre-senting data on the prevention of PSEH occurring after pri-mary or revision surgery and routine hemostatic methods.3,17 Most common method recommended for the hemostasis of bleedings including the bleedings arising from posterior lon-gitudinal ligament are bipolar cauterization and application of systemic or local hemostatic agents.3,17 Another method for preventing PSEH is placing a drain on the incision site. However, the use of this method remains controversial since there are several studies maintaining that this method does not prevent the PSEH and even can be risk factor for PSEH2,9 and some others suggest that there is no effectivity of this method.3,8
The dura mater is usually suspended to the skull after the excision of massive intracranial lesions and craniotomy and craniectomy procedures. In such conditions, dural tack-up sutures are used to prevent epidural hematoma.19,20 Suspen-sion of the dura to the bone narrows the space where epidural hematoma may occur, thereby preventing the compression of neural tissues by possible hematoma formation.19 In our case, we performed this technique in the spinal region to pre-vent PSEH development. We fixed the dural tack-up sutures to the instrument although it is fixed to the bone in cranial interventions. By doing so, we not only controlled the severe bleeding but also prevented the risk of bleeding in early post-operative period that might lead to cord compression. To our knowledge, there has been no study in the literature report-ing on the application of this technique in spinal surgeries.
Figure 3. The tack-up suture technique.
Figure 4. Postoperative T2-weighted cervical sagittal MRI image (after the tack-up suture): Dura mater at the corpectomy site was suspending like a tent both proxi-mally and distally.

257 Pol ann MeD. 2018;25(2):254–257
6. CONCLUSIONS
The main concern on PSEH should be the prevention of the disease rather than the prognostic factors and the treatment methods of the disease. Suspension of the dura with tack-up sutures can be a useful technique for the prevention of PSEH and risk of cord compression. We used this method in the anterior cervical region but we believe that it can also be performed in all the anterior and posterior procedures such as corpectomy and laminectomy that allow suturing of the dura and the use of instruments.
Conflict of interestNone declared.
References 1 Uribe J, Moza K, Jimenez O, Green B, Levi AD. Delayed po-
stoperative spinal epidural hematomas. Spine J. 2003;3(2): 125–129. https://doi.org/10.1016/S1529-9430(02)00535-1.
2 Yi S, Yoon DH, Kim KN, Kim SH, Shin HC. Postoperative spinal epidural hematoma: Risk factor and clinical outcome. Yonsei Med J. 2006;47(3):326–332. https://doi.org/10.3349/ymj.2006.47.3.326.
3 Amiri AR, Fouyas IP, Cro S, Casey AT. Postoperative spinal epidural hematoma (SEH): incidence, risk factors, onset, and management. Spine J. 2013,13(2):134–140. https://doi.org/10.1016/j.spinee.2012.10.028.
4 Awad JN, Kebaish KM, Donigan J, Cohen DB, Kostuik JP. Analysis of the risk factors for the development of post--operative spinal epidural haematoma. J Bone Joint Surg Br. 2005;87(9):1248–1252. https://doi.org/10.1302/0301--620X.87B9.16518.
5 Kou J, Fischgrund J, Biddinger A, Herkowitz H. Risk fac-tors for spinal epidural hematoma after spinal surgery. Spine (Phila Pa 1976). 2002;27(15):1670–1673. https://doi.org/10.1097/00007632-200208010-00016.
6 Lawton MT, Porter RW, Heiserman JE, Jacobowitz R, Son-ntag VK, Dickman CA. Surgical management of spinal epi-dural hematoma: relationship between surgical timing and neurological outcome. J Neurosurg. 1995;83(1):1–7. https://doi.org/10.3171/jns.1995.83.1.0001.
7 Sokolowski MJ, Garvey TA, Perl J 2nd, et al. Prospective study of postoperative lumbar epidural hematoma: inci-dence and risk factors. Spine (Phila Pa 1976). 2008;33(1): 108–113. https://doi.org/10.1097/BRS.0b013e31815e39af.
8 Goldstein CL, Bains I, Hurlbert RJ. Symptomatic spinal epidural hematoma after posterior cervical surgery: inciden-ce and risk factors. Spine J. 2015;15(6):1179–1187. https://doi.org/10.1016/j.spinee.2013.11.043.
9 Chimenti P, Molinari R. Post-operative spinal epidural he-matoma causing American Spinal Injury Association B spinal cord injury in patients with suction wound drains. J Spinal Cord Med. 2013;36(3):213–219. https://doi.org/10.1179/2045772312Y.0000000070.
10 Glotzbecker MP, Bono CM, Wood KB, Harris MB. Posto-perative spinal epidural hematoma: a systematic review. Spine (Phila Pa 1976). 2010;35(10):E413–E420. https://doi.org/10.1097/BRS.0b013e3181d9bb77.
11 Yin G, Ni B. Acute postoperative cervical spinal epidural heamatoma. Acta Orthop Traumatol Turc. 2014;48(4):437–442. https://doi.org/10.3944/AOTT.2014.13.0133.
12 Groen RJ, Ponssen H. The spontaneous spinal epidural hematoma. A study of the etiology. J Neurol Sci. 1990;98 (2–3):121–138. https://doi.org/10.1016/0022-510X(90)90253-J.
13 Hentschel SJ, Woolfenden AR, Fairholm DJ. Resolution of spontaneous spinal epidural hematoma without surgery: report of two cases. Spine (Phila Pa 1976). 2001;26(22):E525–E527. https://doi.org/10.1097/00007632-200111150-00025.
14 Zileli M. Basic principles for preventing complications in spine and spine surgery. In: Zileli M, Özer AF, eds. Spine and spinal cord surgery. Vol. 3. İzmir: İntertip Publisher; 2014:1759–1769.
15 Swamy G, Tay B, Walker JC, Hu S, Berven S, Ames C, et al. Postoperative spinal epidural hematoma – management and neurological outcome. Proceedings of the NASS 20th annu-al meeting. Spine J. 2005;5:1–189.
16 Aono H, Ohwada T, Hosono N, et al. Incidence of postopera-tive symptomatic epidural hematoma in spinal decompres-sion surgery. J Neurosurg Spine. 2011;15(2):202–205. https://doi.org/10.3171/2011.3.SPINE10716.
17 Porter RW, Detwiler PW, Lawton MT, Sonntag VK, Dickman CA. Postoperative Spinal Epidural Hematomas: Longitudi-nal Review of 12,000 Spinal Operations. BNI Q. 2000;16(1).
18 Sandin J, Medew J. Anterior Servikal Corpectomy. In: Wol-fla CE, Resnick DK, eds. Spine and Peripheral. New York: Thieme; 2006:64–68.
19 Aoki N. Acute subdural hematoma during tack-up suture of the dura mater – case report. Neurol Med Chir (Tokyo). 1988;28(10):994–995. https://doi.org/10.2176/nmc.28.994.
20 Salcman MD, Heros RC, Laws ER, Sonag VKH. Kempe’s Operative Neurosurgery. Vol. 1. New York: Springer; 2004: 1–17. https://doi.org/10.1007/978-1-4419-9007-5.

258 Pol ann MeD. 2018;25(2):258–261
Case report
Beata Tarnacka1,2, Justyna Frasuńska1,2, Krzysztof Wasiak2, Paweł Baranowski2
1 Warsaw Medical University, Warsaw, Poland2 Mazovian Centre of Rehabilitation, Warsaw and Konstancin-Jeziorna, Poland
Corresponding author: Beata Tarnacka, Department of Rehabilitation, First Faculty of Medicine, Medical University of Warsaw, Barska 16/20, 02-315 Warszawa, Poland. Tel.: +48 603 944 804.
E-mail address: [email protected].
Problems with child care after successful pregnancy in a patient with spinal cord injury – a case study
article info
Art ic l e h i s toryReceived 18 September 2017Accepted 1 December 2017Available online 18 June 2018
Keywords PregnancySpinal cord injuryChild care
Doi10.29089/2017.17.00048
User l i cense This work is licensed under a Creative Commons Attribution –NonCommercial – NoDerivatives 4.0 International License.
abstract
Introduct ion: Pregnancy in spinal cord injury (SCI) patient’s population is rare. The problems with child care are also rarely described in the literature.
Aim: To present a case of a woman with incomplete tetraplegia and problems during pregnancy and child care.
Case s tudy: A case of a 30-year-old SCI woman with C5 fracture due to a motor vehicle accident is described. She was admitted to our neurorehabilitation ward with severe tetraparesis and discharged able to walk with assistance. After discharge, the patient was referred by a senior physical medicine specialist in our outpatient clinic, and 4 years after her SCI, she got pregnant. Beyond acute clinical problems related to SCI, many chronic medical issues arose, such as or-thostatic hypertension and constipation during her pregnancy. After 39 weeks of pregnancy, she was admitted for caesarean section because of somatosensory problems and received epidural analgesia. She gave birth to a male baby, we-ighing 3500 g. During the first weeks after delivery until now, she has had several problems with baby care due to limb paresis and spasticity, which she could not predict before.
Resu l t s and d i scuss ion: For a mother with SCI, child care is restricted by many everyday problems occurring after delivery.
Conc lus ions : The management of pregnancy and delivery in this setting em-phasises the importance of a multidisciplinary team. The knowledge of these problems can help prepare these patients for child care.
Journal homepage: https://www.paom.pl
Polish Annals of Medicine

259 Pol ann MeD. 2018;25(2):258–261
1 . INTRODUCTION
In the United States, approximately 1000 new spinal cord injuries (SCIs) are reported per year in women 16-30 years old.1 The annual incidence of SCI ranges from 3.6 to 195.4 patients per 1 000 000 around the world and the European countries have various valuable reports of SCI.2 In Switzer-land for women in young age (16–30 years) annual incidence rates per one million population for SCI were 8.1 (for tetra-plegia 1.6).3 Unfortunately we do not have similar registers in Poland. Pregnancy in SCI population is rare. Dramatic improvement in health outcomes for individuals with SCI over the last 50 years and more allows people with SCI to live full and complex lives, become pregnant and raise chil-dren. SCI itself does not affect the ability to conceive for this female population, but other factors, such as physical and psychosocial factors, may influence the decision to have a child.1 Pregnancy exacerbates most problems affecting women with SCI. Women with lesions above the level of T6 of the spinal cord are susceptible to autonomic dysreflexia, spasms, breathing difficulties with advancing pregnancy, bradycardia and hypotension.4 All women with SCI are at high risk of pressure ulcers, anaemia and urinary tract infec-tions.5 The literature contains papers concerning pregnancy problems in this female population, but the problems with child care are rarely discussed. Little is also known about the effects of physical disability secondary to SCI on child raising. To the best of our knowledge, the present report is the first case report describing pregnancy and child care problems of a Polish SCI patient with tetraparesis in the lit-erature.
2. AIM
We present herein the case of a woman with incomplete tetraplegia, who after a SCI decided to get pregnant and her problems during pregnancy and child care.
3. CASE STUDY
A 30-year-old woman admitted to Mazovian Rehabilita-tion Centre in December 2011 after a motor vehicle acci-dent. Magnetic resonance performed on the day of injury revealed a C5 vertebral body fracture and spinal cord contu-sion. According to the International Standards for Neuro-logical Classification of Spinal Cord Injury, the patient had an incomplete lesion American Spinal Injury Association (ASIA) Impairment Scale (AIS) – C, motor score (MS) was 59 with a C5 neurologic injury level. The patient was inten-sively rehabilitated and discharged from our rehabilitation ward after 16 weeks and was able to walk with assistance of one person. During her rehabilitation program on our ward, several episodes of autonomic dysreflexia occurred. After discharge, neurologically, she presented tetraparesis at C5 (AIS-C, MS 89) level that was more pronounced on the right
side and upper limbs, pain and temperature disturbances more severe on the left side and hyperalgesia on both hands. She had problems with writing, dressing, feeding, groom-ing, locomotion and bladder dysfunction (neurogenic blad-der-detrusor overactivity, no intermittent catheterisation was needed). After discharge, the patient was referred by a senior physical medicine specialist in our outpatient clinic.
During the first 2 years, her functional and neurologi-cal status improved. Just before pregnancy she was able to walk independently more than 100 m, she had poor knee stabilisation and foot drop, this caused difficulty in walking the stairs. She also had problems with writing and typing on a computer, driving a car, using a telephone and carry-ing loads over 4–5 kg because of her right-hand paresis. The neuropathic pain in her upper limbs and bladder dysfunc-tion (urge incontinence) were present also at this time. Af-ter 1.5 years, she returned to work in the law faculty where she worked as an assistant professor. This limitation did not interfere with her professional career, and she became a university professor of aviation law. She got married and (4 years later SCI), she got pregnant.
Beyond acute clinical problems related to SCI such as orthostatic hypertension, sensory disturbances such as neu-ropathic pain and constipation, no episodes of autonomic dysreflexia, anaemia or urinary tract infection occurred during her pregnancy. After 39 weeks, she was admitted for caesaren section because of somatosensory impairment and received epidural analgesia. She did not feel uterine contrac-tions. She gave birth to a male baby, weighing 3500 g. In the obstetrics ward, the patient met several architectonic barriers – lack of capacity to adapt to patients with disabilities (beds, bathrooms). For one week after childbirth, the patient used a wheelchair, because she felt very weak. The patient could not take care of the baby, and she had to pay extra money for care for her newborn baby. Since the first weeks after delivery until today (one and half years later) she has had several prob-lems with baby care due to limb paresis and spasticity, which she could not predict before. Because of right limb paresis, she had difficulty with breastfeeding, she could not carry her baby and she had to hire a babysitter. She had severe prob-lems with lifting her child, dressing and bathing. Later, she encountered difficulties with meal preparation and watching the baby. The problem with baby care was also increased by episodes of autonomic dysreflexia she had in the past after the injury, and she had the fear of falling down.
The limitation in child care was her biggest problem for fulfilling the role of motherhood. She felt unsuitable in the role of mother, and she was not prepared by any medical professional to fulfil the role of a parent.
4. DISCUSSION
Pregnancy exacerbates most problems affecting women with SCI, particularly urinary infections which can lead to py-elonephritis and premature labour.5 No urinary infections occurred in our patient during pregnancy. In the literature,

260 Pol ann MeD. 2018;25(2):258–261
the majority of changes in medical procedures are related to bladder management, including changes in medication and in bladder evacuation methods.5 These changes led to an in-creased rate of urinary tract infections. Most anticholinergic drugs should not be taken, at least during the first trimester of pregnancy because foetal malformations were observed in animal experiments that used these drugs, and botulinum toxin is also not licensed for use during pregnancy.6 Given this, an ineffective treatment of detrusor overactivity may occur, usually leading to incontinence, which is frequently treated by inserting an indwelling catheter, especially if in-termittent catheterisation becomes more difficult during the course of pregnancy. The treatment option can be used of a Brindley stimulator, a sacral anterior root stimulator device enabling patients with a complete SCI to empty their blad-ders.7 Patients with such a stimulation are less likely to de-velop urinary tract infections.7
Autonomic dysreflexia is one of the most dangerous complications during pregnancy in patients with tetraplegia or tetraparesis. Our patient had in the past, mostly during the first 3 months after injury, several incidents of auto-nomic dysreflexia, but during pregnancy she had only two incidents of a mild blood pressure rise. An SCI at the level of T6 or above results in loss of supraspinal control of the greater splanchnic sympathetic outflow. The potential caus-es of dysreflexia may include bladder and bowel distension, catheterisation, active haemorrhoids, gastric ulcers, constric-tive clothing, blisters on the skin and burns or even vaginal evaluation in a consultation or during labor. Patients must be informed by medical staff of such a condition and their health implications and how to behave in this situation (fast verticalisation and empty the bladder). Practitioners manag-ing labours in patients with SCI still need to be acutely aware of the possibility of autonomic dysreflexia and be well-versed in how to treat potential paroxysmal cardiovascular instabil-ity. Delayed or suboptimal management can lead to maternal intracranial bleeding, death and foetal bradycardia or heart rate irregularities due to paroxysmal hypertensive episodes.8 Pharmacologic treatment of autonomic dysreflexia is nitren-dipine sublingual or intravenous labetalol.8 Pharmacological treatment should be individualised based on patient medical history and physical limitations. Our patients did not receive pharmacological prophylaxis.
There is an increased risk of thromboembolism in the first 6 months after SCI. Following this period, the risk is almost the same as that in the general population. This is attributed to vessel remodelling and other physiologic changes occurring below the level of SCI.9 The combina-tion of impaired mobility and the hypercoagulable state of pregnancy raises concerns for thromboembolic disease in women with SCI.10 Studies in nonpregnant adults suggest a benefit of prophylaxis after acute SCI, but there are no data specific to women who became pregnant several years after SCI.11 Despite these theoretical risks, insufficient data exist to recommend universal pharmacologic thromboprophy-laxis (e.g., low-molecular-weight heparin) during pregnancy of all women with SCI. Pharmacologic treatment should be
individualised based on patient medical history and physi-cal limitations.
Spasticity is also a very common sign in patients with SCI. Our patient did not take any antispastic drugs during pregnancy, but she had several problems with spasticity during pregnancy, which interfered with her child care. Her spasticity was not very severe, partly due to her private con-tinuous rehabilitation program during pregnancy. In any pregnancy, planning this problem must be discussed with the patient because Jackson and Wadley reported a 12% in-cidence of worsening of spasticity in pregnancy.12 Baclofen treatment of spasticity in pregnancy is applied, but it is asso-ciated with side effects, such as neonatal withdrawal symp-toms, irritability, poor feeding and seizures.13 An intrathecal pump can be an option in severe cases.14
Our patient, despite a C5 spinal cord lesion, did not suf-fer from respiratory problems. In lesions above T4, partial or complete paralysis of ventilation muscles may occur, which can make breathing more difficult as the pregnancy advances. The American College of Obstetrics and Gynecol-ogy recommends chest physiotherapy, continuous positive airway pressure and mechanical ventilation if respiratory function is suboptimal.15 Vital capacity in patients with spi-nal injuries can be used to predict the need for ventilation.
The ability to provide child care by mothers with SCI is restricted by many everyday life problems, which can be very frustrating for women. People with disabilities are commonly viewed as asexual or sexually innocent, which can be a result of exclusion from sex education. Women with SCI in Poland are confronted with many barriers affecting their ability to carry a child. In Poland, we have no health-care providers with up-to-date information about SCI and pregnancy, and there is a need for these providers to be pre-pared to discuss in advance pregnancy problems with their patients/consumers with SCI. The patient can get the infor-mation about pregnancy mostly from other patients or from the Foundation of Active Rehabilitation. Our patient did not know about this foundation. During the pregnancy and after the delivery, the patient received information about child care but not adapted for a disabled person because the medical staff were unaware of her limitations caused by SCI.
In the United States, the SCI doctor is the primary source of information about SCI and pregnancy.16 We think that creation of SCI centres may improve the situation for these patients. In our case, the obstetrics ward was not pre-pared to care for people with disabilities, and the staff were not familiar with problems or barriers in patients with dis-abilities. This problem should be more accurately discussed in the literature and during medical training for doctors and nurses in Poland.
The case study also indicates a lack of knowledge among health professionals at the obstetrics ward at the hospital about the needs of mothers with SCI. The same conclusion was described by Gunnbjorg Aune in Scandina-vian hospitals.17 The obstetrics ward to which our patient was admitted was not adapted for patients with disabilities like our patient with SCI. We think that more and more

261 Pol ann MeD. 2018;25(2):258–261
female patients with disabilities will have babies, and it is very important to provide them with a comfortable delivery and hospital stay.
During pregnancy and as a parent, women with SCI have unique experience and challenges such as the need for practi-cal arrangements and limitations related to participation. It should be emphasized that our patient did not have signifi-cant problems with returning and continuation of work, but she had severe problems with participation in various activi-ties related to child care after giving birth. Now, she is still not able to look after her toddler, who plays inside and out-side the house. Patients with SCI often depend on others. In Poland, a lack of knowledge exists about problems encoun-tered in daily living by mothers with disabilities, primarily with SCI. Women with cervical SCI after childbearing need continuous help. Understanding how SCI affects pregnancy and child care is very important. Disability of mothers with SCI generates many additional costs. In Poland, there are no social services recommended to individuals with SCI to help with daily activities. We think this problem may restrict the decision of mothers in this population to give birth. Many women are concerned about their ability to care for a child and about lack of financial support. Our patient had to hire a babysitter because she could not take care of her child even though her disability did not interfere with her scientific ca-reer. It is also very important to perform investigations from the father’s perspective and how family roles may change when one parent has a disability.
5. CONCLUSIONS
Although pregnancy outcomes seem to be favourable after SCI, women with disabilities may face problems during pregnancy and childbirth due to many barriers. We think that the management of pregnancy and delivery in this set-ting emphasises the importance of a multidisciplinary team. There is a large need in Poland to propagate the pregnancy, delivery and child care problems of women with SCI. It is very important to increase the competence of the care deliv-erer as rehabilitation specialist, physiotherapist, midwifes etc. There is currently a lack of para- and tetraplegic reha-bilitation/care centres for SCI patients in Poland.
Conflict of interest None declared.
References1 Lezzoni L, Chen Y, Mc Lain A. Current pregnancy among
women with spinal cord injury: findings from the US Natio-nal Cord Injury Database. Spinal Cord. 2015;53(11):821–826. https://doi.org/10.1038/sc.2015.88.
2 Jazayeri S, Beygi S, Shokraneh F, Hagen EM, Rahimi-Mova-ghar V. Incidence of traumatic spinal cord injury worldwide: a systematic review. Eur Spin J. 2015;24(5):905–918. https://doi.org/10.1007/s00586-014-3424-6.
3 Chamberlain J, Deriaz O, Hund-Georgiadis M, et al. Epide-miology and contemporary risk profile of traumatic spinal cord injury in Switzerland. Inj Epidemiol. 2015;2(1):28–39. https://doi.org/10.1186/s40621-015-0061-4.
4 Burns A, Jackson B. Gynecological and reproductive issues in women with spinal cord injury. Phys Med Rehabil Clin N Am. 2001;12(1):183–199.
5 Bertschy S, Bostan C, Meyer T, Pannek J. Medical complica-tions during pregnancy and childbirth in women with SCI in Switzerland. Spinal Cord. 2016;54(3):183–187. https://doi.org/10.1038/sc.2015.205.
6 Edwards J, Reid Y, Cozens D. Reproductive toxicity studies with oxybutynin hydrochloride. Toxicology. 1989;40(1):31–44. https://doi.org/10.1016/0300-483X(86)90044-2.
7 Krasmik D, Krebs J, Van obhoven A, Pannek J. Urodyna-mic results, clinical efficacy, and complication rates of sacral anterior root stimulation in patients with neurogenic lower urinary tract dysfunction resulting from complete spinal cord injury. Neurol Urodyn. 2014;33(8):1202–1206. https://doi.org/10.1002/nau.22486.
8 McGregor J, Meeuwsen J. Autonomic hyperreflexia a mortal danger for spinal cord-damaged women in labour. Am J Obter Gynecol. 1985;151(3):330–333. https://doi.org/10.1016/0002-9378(85)90297-2.
9 Lamb G, Tomski MA, Kaufman J, Maiman DJ. Is chronic spinal cord injury associated with increased risk of venous thromboembolism? J Am Paraplegia Soc. 1993;16(3):153–156. https://doi.org/10.1080/01952307.1993.11735893.
10 James A. American College of Obstetricians and Gynecolo-gists, Committee on Practice Bulletins – Obstetrics. ACOG Practice bulletin no. 123: thromboembolism in pregnancy. (Replaces Practice Bulletin No. 19, August 2000). Obstet Gy-necol. 2011;118(3):718–729.
11 Teasell R, Hsieh J, Aubut J, Eng JJ, Krassioukov A, Tu L. Spinal Cord Injury Rehabilitation Evidence Review Rese-arch Team. Venous thromboembolism after spinal cord inju-ry. Arch Phys Med Rehabil. 2009;90(2):232–245. https://doi.org/10.1016/j.apmr.2008.09.557.
12 Jackson AB, Wadley V. A multicenter study of women’s self-reported reproductive health after spinal cord injury. Arch Phys Med Rehabil. 1999;80(11):1420–1428. https://doi.org/10.1016/S0003-9993(99)90253-8.
13 Adams M, Hicks A. Spasticity after spinal cord injury. Spinal Cord. 2005;43(10):577-86. https://doi.org/10.1038/sj.sc.3101757.
14 Delhaas E, Verhagen J. Pregnancy in quadriplegic patient treated with continuous intrathecal baclofen infusion to manage her severe spasticity. Case report. Paraplegia. 1992;30(7):527–528. https://doi.org/10.1038/sc.1992.110.
15 Ohry A, Peleg D, Goldman J, David A, Rozin R. Sexu-al function, pregnancy and delivery in spinal cord wo-men. Gynecol Obster Invest. 1978;9(6):281–291. https://doi.org/10.1159/000300996.
16 Pebdani RN, Johnson KL, Amtmann D. Personal experience of pregnancy and fertility in individuals with spinal cord in-jury. Sex Disabil. 2014;32(1):65–74. https://doi.org/10.1007/s11195-013-9319-3.
17 Aune G. Everyday challenges for mothers with spi-nal cord injury: a qualitative study. Scan J Dis Resarch. 2013;15(2):185–198. https://doi.org/10.1080/15017419.2012.692708.

262 Pol ann MeD. 2018;25(2):262–265
Case report
Urszula Kościuczuk1, Andrzej Siemiątkowski1, Adam Łukasiewicz2
1 Department of Anaesthesiology and Intensive Care, Medical University of Bialystok, Poland2 Department of Radiology, Medical University of Bialystok, Poland
Corresponding author: Urszula Kościuczuk, Department of Anaesthesiology and Intensive Care, Medical University of Bialystok, Marii Skłodowskiej-Curie 24 A, 15-276 Białystok, Poland. Tel.: +4885 746 83 02, Fax +4885 746 86 32.
E-mail address: [email protected].
MRI in diagnostic of diffuse axonal injury
article info
Art ic l e h i s toryReceived 1 June 2017Accepted 16 August 2017Available online 29 June 2018
Keywords Traumatic brain injuryNeurological outcomesPrognostication
Doi10.29089/2017.17.00057
User l i cense This work is licensed under a Creative Commons Attribution –NonCommercial – NoDerivatives 4.0 International License.
abstract
Introduct ion: Diffuse axonal injury (DAI), is a rarely occurring consequen-ce of traumatic brain injury (TBI). For many years identification and outcomes prediction of DAI was limited. The specific markers have not been described. Progress in the development of radiological methods has made current abilities for recognition and prognosis much greater.
Aim: The aim of the paper is the presentation of the clinical image of DAI and the emphasis of the importance of magnetic resonance imaging (MRI) in the diagnosis of this neurological condition.
Case s tudy: A 66-year-old female was admitted to the Intensive Care Unit (ICU) in the 2nd day after TBI due to cardiovascular and respiratory failure. A suspicion of DAI was formulated on the basis of the brain computed tomography (CT).
Resu l t s and d i scuss ion: The neurological state Glasgow coma scale (GCS) 7 did not correlate with changes observed in CT. The brain MRI presented le-sions in the splenium and in the lobe of the corpus callosum, additionally. The intensity of changes in radiological classification of DAI based on brain MRI confirms the neurological state and allows the prognosis formulation.
Conc lus ions : The brain MRI has become important in the diagnosis and pro-gnostication of DAI.
journal homepage: https://www.paom.pl
Polish Annals of Medicine

263 Pol ann MeD. 2018;25(2):262–265
1. INTRODUCTION
Diffuse Axonal Injury (DAI), initially described by Strich in 1956, is a rarely occurring consequence of traumatic brain injury (TBI).1 The analysis of TBI in Poland between 2009 and 2012 performed by Miekisiak et al. demonstrated a general frequency 126/105 per year of which DAI con-stituted 2.11%.2 The epidemiological data presented above is comparable with trends occurring in many European countries.3
For many years diagnosis and identification of DAI was limited. The specific biochemical markers still have not been described.4–7 Progress in the development of ra-diological diagnostic methods has made current abilities for recognition and prognosis much greater. Brain computed tomography (CT) is the first choice radiological method to describe consequences of injury, but does not correspond well to the Glasgow coma scale (GCS) score and neurologi-cal state. The brain MRI has become especially important in the imaging and confirming diagnosis of DAI.8–12
Numerous classifications have been formed to describe severity of DAI and predict outcomes of brain injury.13–14 Diagnosis of DAI is based on clinical signs and radiologi-cal imaging. The treatment of DAI is multidirectional but still not specific.15–17 The most important management are the cardiac and respiratory stabilization and the prevention of secondary complications connected to the brain injury. Many studies presented positive effects of systemic electro-lytes and metabolic stabilization, neuroprotective pharma-cotherapy, rehabilitation and local stimulation of healing and regenerative processes.18–19
2. AIM
The aim of this paper is the presentation of the clinical im-age of DAI and the emphasis of the diagnostic importance of MRI in the diagnosis of this neurological condition.
Figure 1. Axial CT, day of injury (DOI). Small hemorrhagic focus in left subinsular region – arrow (a) and at the level of the centrum semiovale in the left and right frontal subcortical white matter – arrows (b). Hypodense lesion in genu of corpus callosum is not well seen in CT – arrow (c).
Figure 2. Axial CT, 18 days after DOI at the same level like in Figure 1. Partially resorbed hemorrhagic foci, hyper- and hypodense – arrows (a, b). Hypodense lesion in genu of corpus callosum is more evident than on the DOI (c).
a b c
cba
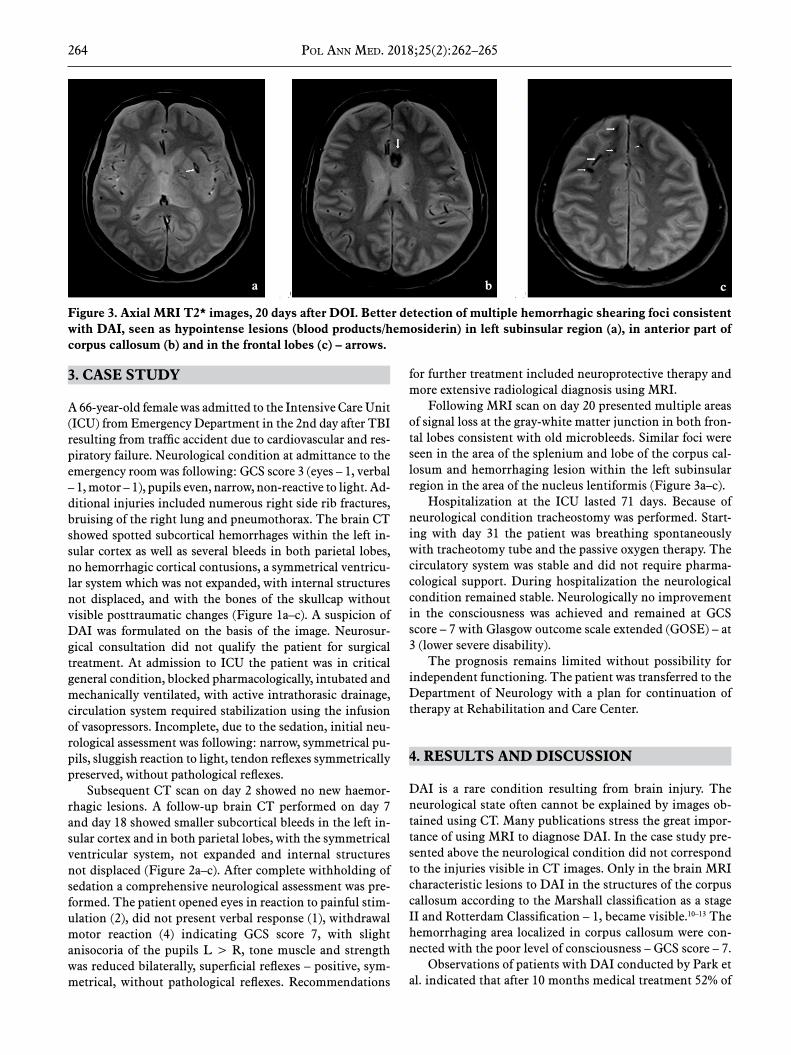
264 Pol ann MeD. 2018;25(2):262–265
3. CASE STUDY
A 66-year-old female was admitted to the Intensive Care Unit (ICU) from Emergency Department in the 2nd day after TBI resulting from traffic accident due to cardiovascular and res-piratory failure. Neurological condition at admittance to the emergency room was following: GCS score 3 (eyes – 1, verbal – 1, motor – 1), pupils even, narrow, non-reactive to light. Ad-ditional injuries included numerous right side rib fractures, bruising of the right lung and pneumothorax. The brain CT showed spotted subcortical hemorrhages within the left in-sular cortex as well as several bleeds in both parietal lobes, no hemorrhagic cortical contusions, a symmetrical ventricu-lar system which was not expanded, with internal structures not displaced, and with the bones of the skullcap without visible posttraumatic changes (Figure 1a–c). A suspicion of DAI was formulated on the basis of the image. Neurosur-gical consultation did not qualify the patient for surgical treatment. At admission to ICU the patient was in critical general condition, blocked pharmacologically, intubated and mechanically ventilated, with active intrathorasic drainage, circulation system required stabilization using the infusion of vasopressors. Incomplete, due to the sedation, initial neu-rological assessment was following: narrow, symmetrical pu-pils, sluggish reaction to light, tendon reflexes symmetrically preserved, without pathological reflexes.
Subsequent CT scan on day 2 showed no new haemor-rhagic lesions. A follow-up brain CT performed on day 7 and day 18 showed smaller subcortical bleeds in the left in-sular cortex and in both parietal lobes, with the symmetrical ventricular system, not expanded and internal structures not displaced (Figure 2a–c). After complete withholding of sedation a comprehensive neurological assessment was pre-formed. The patient opened eyes in reaction to painful stim-ulation (2), did not present verbal response (1), withdrawal motor reaction (4) indicating GCS score 7, with slight anisocoria of the pupils L > R, tone muscle and strength was reduced bilaterally, superficial reflexes – positive, sym-metrical, without pathological reflexes. Recommendations
for further treatment included neuroprotective therapy and more extensive radiological diagnosis using MRI.
Following MRI scan on day 20 presented multiple areas of signal loss at the gray-white matter junction in both fron-tal lobes consistent with old microbleeds. Similar foci were seen in the area of the splenium and lobe of the corpus cal-losum and hemorrhaging lesion within the left subinsular region in the area of the nucleus lentiformis (Figure 3a–c).
Hospitalization at the ICU lasted 71 days. Because of neurological condition tracheostomy was performed. Start-ing with day 31 the patient was breathing spontaneously with tracheotomy tube and the passive oxygen therapy. The circulatory system was stable and did not require pharma-cological support. During hospitalization the neurological condition remained stable. Neurologically no improvement in the consciousness was achieved and remained at GCS score – 7 with Glasgow outcome scale extended (GOSE) – at 3 (lower severe disability).
The prognosis remains limited without possibility for independent functioning. The patient was transferred to the Department of Neurology with a plan for continuation of therapy at Rehabilitation and Care Center.
4. RESULTS AND DISCUSSION
DAI is a rare condition resulting from brain injury. The neurological state often cannot be explained by images ob-tained using CT. Many publications stress the great impor-tance of using MRI to diagnose DAI. In the case study pre-sented above the neurological condition did not correspond to the injuries visible in CT images. Only in the brain MRI characteristic lesions to DAI in the structures of the corpus callosum according to the Marshall classification as a stage II and Rotterdam Classification – 1, became visible.10–13 The hemorrhaging area localized in corpus callosum were con-nected with the poor level of consciousness – GCS score – 7.
Observations of patients with DAI conducted by Park et al. indicated that after 10 months medical treatment 52% of
Figure 3. Axial MRI T2* images, 20 days after DOI. Better detection of multiple hemorrhagic shearing foci consistent with DAI, seen as hypointense lesions (blood products/hemosiderin) in left subinsular region (a), in anterior part of corpus callosum (b) and in the frontal lobes (c) – arrows.
cba

265 Pol ann MeD. 2018;25(2):262–265
patients recovered a good level of consciousness, 28% were relatively stable, 12% remained in critical condition while 8% slipped into a vegetative state. Patients with grade II in-juries had an average GCS score of 7.6 and the mean inter-val to return consciousness was 12.5 days. Authors showed that 50% of patients with changes caused by hemorrhage in corpus callosum as well as in the brainstem never regained consciousness. The our case study was consistent with the observations of Park et al. illustrating serious and persistent neurological state caused by DAI with changes occurring in the corpus callosum.20
The neurological condition remained stable, however, due to lack of improvement of consciousness significantly reduced the possibility for a positive prognosis.
5. CONCLUSIONS
The brain MRI is an important element in diagnosis of neu-rological state in patient with DAI. The discovery of the characteristic changes caused by hemorrhage within brain structures explains neurological deficiencies. The staging in radiological classification reflects the neurological state and allows the formulation of a prognosis.
References1 Hayes JP, Bigler ED, Verfaellie M. Traumatic brain in-
jury as a disorder of brain connectivity. J Int Neuropsy-chol Soc. 2016;22(2):120–137. https://doi.org/10.1017/S1355617715000740.
2 Miekisiak G, Czyz M, Tykocki T, Kaczmarczyk J, Zaluski R, Latka D. Traumatic brain injury in Poland from 2009–2012: A national study on incidence. Brain Inj. 2016;30(1):79–82. https://doi.org/10.3109/02699052.2015.1104550.
3 Peeters W, van den Brande R, Polinder S, et al. Epidemiolo-gy of traumatic brain injury in Europe. Acta Neurochir. 2015; 157(10):1683–1696. https://doi.org/10.1007/s00701-015-2512-7.
4 Lin Y, Wen L. Inflamatory response following diffuse axo-nal injury. Int J Med Sci. 2013;10(5):515–521. https://doi.org/10.7150/ijms.5423.
5 Siedler DG, Chuah MI, Kirkcaldie MTK, Vickers JC, King AE. Diffuse axonal injury in brain trauma: insights from al-terations in neurofilaments. Front Cell Neurosci. 2014;8:1–10. https://doi.org/10.3389/fncel.2014.00429.
6 Johnson VE, Stewart W, Smith DH. Axonal pathology in traumatic brain injury. Exp Neurol. 2013;246:35–43. https://doi.org/10.1016/j.expneurol.2012.01.013.
7 Li XY, Feng DF. Diffuse axonal injury: novel insights into detection and treatment. J Clin Neurosci. 2009;16(5):614–619. https://doi.org/10.1016/j.jocn.2008.08.005.
8 Maas AIR, Hukkelhoven C, Marshall LF, Steyerberg EW. Prediction of outcome in traumatic brain injury with computer tomographic characteristics: a comparison be-tween the computed tomography classification and com-binations of computed tomographic predictors. Neuro-surgery. 2005;57(6):1173–1182. https://doi.org/10.1227/01.NEU.0000186013.63046.6B.
9 Kim HJ, Park IS, Kim JH, et al. Clinical analysis of the prognosis of the patients with cerebral diffuse axonal inju-
ries based on gradient – echo MR imaging. J Krean Neu-rosurg Soc.2001;30(2):168–172. https://doi.org/10.3340/jkns.2014.56.2.168.
10 Weiss N, Galanaud D, Carpentier A. A combined clinical and MRI approach for outcome assessment of traumatic head injured comatose patients. J Neurol. 2008;255(2):217–223. https://doi.org/10.1007/s00415-008-0658-4.
11 Skandsen T, Kvistad KA, Solheim O. Prognostic value of magnetic resonance imaging in moderate and severe head injury: A prospective study of early MRI findings and one--year outcome. J Neurotrauma. 2011;28(5):691–699. https://doi.org/10.1089/neu.2010.1590.
12 Adams JH, Doyle D, Ford I, Gennarelli TA, Graham DI, McLellan DR. Diffuse axonal injury in head injury: defini-tion, diagnosis and grading. Histopathology. 1989;15(1):49–59. https://doi.org/10.1111/j.1365-2559.1989.tb03040.x.
13 Munakomi S. A comparative study between Marshall and Rotterdam computed tomography – CT scores in predic-ting early deaths in patients withtraumatic brain injury in a major tertiary care hospital in Nepal. Chin J Traumatol. 2016;19(1):25–27. https://doi.org/10.1016/j.cjtee.2015.12.005.
14 Talari H, Fakharian E, Mousavi N, Abedzadeh-Kalahroudi M, Akbari H, Zoghi S. The Rotterdam scoring system can be used as an independent factor for predicting traumatic brain injury outcomes. World Neurosurg. 2016;87:195–199. https://doi.org/10.1016/j.wneu.2015.11.055.
15 Edlow BL, Giacino JT, Hirschberg RE. Unexpected recovery of function after severe traumatic brain injury. The limits of early neuroimaging-based outcome prediction. Neurocrit Care. 2013;19(3):364–375. https://doi.org/10.1007/s12028-013-9870-x.
16 Carter EL, Hutchinson PJA, Kolias AG, et al. Predicting the outcome for individual patients with traumatic brain inju-ry: a case-based review. Br J Neurosurg. 2016;30(2):227–232. https://doi.org/10.3109/02688697.2016.1139048.
17 Smith DH, Hicks R, Povlishock JT. Therapy development for diffuse axonal injury. J Neurotrauma. 2013;30(5):307–323. https://doi.org/10.1089/neu.2012.2825.
18 Li J, Li XY, Feng DF, Pan DC. Biomarkers associated with diffuse traumatic axonal injury: exploring pathogenesis, ear-ly diagnosis and prognosis. J Trauma. 2010;69(6):1610–1618. https://doi.org/10.1097/TA.0b013e3181f5a9ed.
19 Povlishock JT, Katz DI. Update of neuropathology and neu-rological recovery after traumatic brain injury. J Head Trauma Rehabil. 2005;20(1):76–94. https://doi.org/10.1097/00001199-200501000-00008.
20 Park SJ, Hur JW, Kwon YK, et al. Time to recover concio-usness in patients with diffuse axonal injury: assessment with reference to magnetic resonance grading. J Korean Neurosurg Soc. 2009;46:205–209. https://doi.org/10.3340/jkns.2009.46.3.205.

266 Pol ann MeD. 2018;25(2):266–271
Review article
Vikram Mohan1,2, Aatit Paungmali1, Patraporn Sitilerpisan1, Sulaiman Md Dom3, Ummi Farhana Hashim3, Siti Nor Binti Daud2, Manikumar Muthiah4
1 Neuro-Musculoskeletal and Pain Research Unit, Department of Physical Therapy, Faculty of Associated Medical Sciences, Chiang Mai University, Chiang Mai, Thailand
2 Faculty of Health Sciences, Centre of Physiotherapy, Universiti Teknologi MARA Selangor, Bandar Puncak Alam, Puncak Alam, Malaysia3 Faculty of Health Sciences, Centre of Medical Imaging, Universiti Teknologi MARA Selangor, Bandar Puncak Alam, Puncak Alam, Malaysia
4 Saveetha College of Physiotherapy, Saveetha University, Chennai, India
Corresponding author: Aatit Paungmali, Neuro-Musculoskeletal and Pain Research Unit, Department of Physical Therapy, Faculty of Associated Medical Sciences, Chiang Mai University, Chiang Mai 50200, Thailand. Tel.: +66 53949246,
Fax: +66 53936042.E-mail address: [email protected].
Reliability of diaphragmatic mobility assessment: A systematic review
article info
Art ic l e h i s toryReceived 17 March 2017Accepted 22 May 2017Available online 4 June 2018
Keywords DiaphragmTest–retest reliabilityUltrasonographyRadiography
Doi10.29089/2017.17.00044
User l i cense This work is licensed under a Creative Commons Attribution –NonCommercial – NoDerivatives 4.0 International License.
abstract
Introduct ion: Diaphragm Mobility (DM) assessment is gaining interest in the field of medicine and in the healthcare sector. Despite its clinical usage, the measure of reliability in assessing DM is not clearly known.
Aim: To critically appraise the evidence describing the reliability measures of DM assessment using any of the diagnostic modalities.
Mater ia l and methods : A systematic search across five databases was car-ried out from January 1990 to September 2016. Quality Appraisal of Reliability Studies (QUAREL) and the Grading of Recommendations Assessment, Develop-ment and Evaluation (GRADE) system were used to assess the risk of bias and for rating the quality of the evidence. In addition, levels of evidence grading which synthesize all the included articles for grading were also used.
Resu l t s and d i scuss ion: Four papers were included for assessing both intra-rater and inter-rater reliability using ultrasound and radiography. Three papers reported ICC measures of reliability, with one paper reporting CV% of reliability. The results demonstrate that, overall, lower levels of evidence exist among the selected articles between moderate and good for intra-rater reliability and good for inter-rater reliability measures. The synthesis of all the included articles demonstrated that, overall, moderate evidence exists.
Conc lus ions : There were moderate-to-good reliability measures with a low risk of bias in both the forms of reliability for assessing diaphragmatic mobility.
Journal homepage: https://www.paom.pl
Polish Annals of Medicine

267 Pol ann MeD. 2018;25(2):266–271
1. INTRODUCTION
Breathing is a natural physiological process which is re-quired to withstand life. In this context, the diaphragm is an important muscle of respiration. Thus, it is understood that dysfunction or impairment of diaphragm disturbs the breathing cycle. Such undue changes which occur due to the phenomena of abnormal physiology and biomechanical ab-normality could eventually lead to altered work of breathing and deterioration in exercise tolerance, which would affect the quality of life.1–3
Diaphragmatic mobility (DM) is one of the important parameters to be assessed in recent years to identify dys-function of the diaphragm. In general, DM assessment was developed to improve screening of individuals who suffer from respiratory concerns. It has been theorized that indi-viduals whose breathing is compromised because of respira-tory illness and musculoskeletal disorders may exhibit poor movement patterns of the diaphragm, thus predisposing an individual to respiratory dysfunction.1,2,4 In order to know the extent of DM, a few imagery assessment methods are used to evaluate the function and position of the diaphragm. The imagery assessment methods that are in practice are X-ray, fluoroscopy, magnetic resonance imaging (MRI), and ultrasonography.5–7 Out of all these techniques proposed to assess DM, ultrasound has the advantage of being a safe operating procedure, as described in the earlier literature.8
Even though various techniques of assessment are available to assess DM, the commonly used methods of estimation to ensure reliability of results are not understood clearly.
In general, reliability takes two forms, one is relative re-liability and the other is absolute reliability.9 In relation to DM, relative reliability is the degree to which DM values differ on two occasions, and this can be expressed by means of Pearson’s correlation coefficient and intraclass correla-tion coefficient (ICC). On the other hand, absolute reliabil-ity is the degree to which repeated measurements of DM vary for individuals, which can be expressed by means of the standard error of measurements (SEMs), the coefficient of variation (CV), and Bland and Altman’s 95% limits of agree-ment. The current consensus in the literature is that these two forms of reliability estimates need to be used together while performing reliability statistics in order to test repeat-ability and reproducibility.9
On considering these two reliability forms, the term reli-ability of DM has been reported in a few studies.10,11 These studies have utilized differing forms of reliability and dif-ferent methods of evaluating DM using different diagnos-tic modalities. In addition, the authors have utilized raters with different levels of clinical expertise and different back-grounds in the field of medicine. Therefore, there is no con-sensus on which forms of reliability measures are commonly used to test reliability measures and which mode of assess-ment technique is reliable for evaluating DM.
To date, there has been no synthesis of the evidence re-garding the reliability of DM to make a definite statement regarding the clinical applicability or use of this method in
practice using a particular modality for assessment. If this assessment method of using any of the modalities is reli-able within and between the raters, clinicians can be confi-dent in their assessments and begin to utilize interventions to improve the patient’s status. Furthermore, it will enable clinicians and researchers to assess the effectiveness of their treatments through reevaluation to improve the patient’s condition following respiratory rehabilitation.
2. AIM
The specific objective of this systematic review was to criti-cally appraise published evidence describing the reliability measures of DM using any of the diagnostic modalities de-scribed in earlier literature.
3. MATERIAL AND METHODS
3.1. Search strategy and selection criteriaThe details of the search are presented in Figure 1. Two re-viewers (VM and AP) independently selected the eligible studies based on the inclusion and the exclusion criteria as stated in the study protocol. All studies that investigated the reliability of DM assessment using any of the measure-ment devices were included. The criteria for the inclusion comprised the following: the articles had to assess human subjects with no restriction regarding methods of the as-sessment instrument. Furthermore, only articles that are published in English were considered in the present study. Studies, which are not published in relation to reliability and DM were excluded. In the initial review, the extracted data included the type of study design, purpose of study, and examination of DM with statistical analysis and conclusion. In case of disagreement in the article selection, a consensus was reached by consulting with a third reviewer (MM).
3.2. Quality assessmentThe methodological quality of the included studies in this present systematic review was assessed using a Quality Ap-praisal of Reliability Studies (QUAREL) scale.12 A score of 60% or more indicates high-quality studies.13,14 The tool was found to be a reliable tool for assessing diagnostic reliability studies.15 The present study adapted the QUAREL scale to identify whether the equipment used was able to detect DM. The quality assessment was carried out by two reviewers (PS and UFH) independently for all the four included studies. In case of discrepancy in rating the articles, a consensus was reached by consulting with a third reviewer (SD).
3.3. Level of evidenceThe Grading of Recommendations Assessment, Develop-ment, and Evaluation (GRADE) approach was used to rate the quality of evidence and the grading strength of the recommendations.16 The GRADE method of approach de-scribes the evidence as high, moderate, low, and very low. In

268 Pol ann MeD. 2018;25(2):266–271
addition, the level of evidence was analyzed using updated method guidelines for systematic reviews in the Cochrane group, as proposed by van Tulder et al.17
4. RESULTS
The computer software used for this review included Mi-crosoft Office 2008, SPSS v. 21 (IBM Corporation; Armonk, New York), Microsoft Office Excel 2008, and Mendeley v. 1.16.3 for reference formatting. The SPSS data sheet im-ported all, the averaged data of QUAREL between the ob-servers for inter-rater reliability of Kappa statistic measures of assessment from a Microsoft Excel spreadsheet.
4.1. Literature searchThe PRISMA flow chart depicting the systematic search and review process for selection can be found in Figure 1. Of the initial 70 articles retrieved through the electronic search engines, 6 articles met the criteria set by the study protocol. In addition, 2 other articles were retrieved through other re-sources, thus totaling the number of articles to be 8. After screening and removing the duplicates, the total number of
articles in the qualitative synthesis was 4. Three articles de-termined the intra-observer and the inter-observer reproduc-ibility in relation to DM assessment using ultrasound. Only 1 article determined both reproducibility and repeatability in relation to DM assessment using radiograph. The character-istics of all the included studies are presented in Table 1.
4.2. Assessment of r isk of bias within studiesThe two reviewers initially agreed on 39 out of 44 (88.63%) items on the QUAREL checklist with a Kappa score (0.42). Differences in the QUAREL scores were resolved through discussion among the reviewers. The quality scores ranged from 45.45% to 81.81% with one high-quality study (>60%) and three low-quality studies (<60%). The internal compo-nent ranged from 14.28% to 71.42%, while the external va-lidity component was 100%. All the studies rated at 100% on the statistical portion of the QUAREL scale.
4.3. Study characteristicsThree modalities including B-mode, M-mode ultrasonog-raphy, and radiographic equipment were used for assessing DM in four of the included studies.10,11,18,19 Three studies
Figure 1. Flowchart of study selection process according to the preferred reporting items for systematic review and meta-analysis (PRISMA).
Records identified through databases searching: EBSCO (n = 12),
Ovid (n = 20), Science Direct (n = 16),
PubMed (n = 21), Scopus (n = 1)
(n = 70)
Additional record identified through other sources; references
(n = 3)
Record after screening the title and abstract: EBSCO (n = 3),
Ovid (n = 2), Science Direct (n = 0),
PubMed (n = 0), Scopus (n = 1),
other sources (3)(n = 9)
Record excluded based on relevance or no reliability statistic data
(n = 4)
Records after duplicates removed (n = 9)
Full-text articles assessed for eligibility(n = 8)
Included studies(n = 4)
Iden
tifica
tion
Scre
enin
gE
ligib
ility
Incl
uded

269 Pol ann MeD. 2018;25(2):266–271
used an ultrasound device in which two of the studies used M-mode ultrasonography and one study used B-mode ul-trasound.11,18,19 One of the included studies used the radi-ography method to assess the reliability measures of DM.10
Among the four included studies, only one study reported that the rater had one year of clinical experience, whereas the remaining four studies did not specify anything about experience, or it was not clearly mentioned. Three of the in-cluded studies evaluated both right and left hemi-DM. One of the included studies evaluated only right hemi-DM.
The interpretation of the ICC values for all the includ-ed studies was based on evidence as poor (0.00–0.25), fair (0.26–0.50), moderate (0.51–0.75), and good (0.76–1.00).20
The inter-rater reliability according to the ICC interpreta-tion for three of the included studies are good. The intra-rater reliability according to the ICC interpretation for three of the included studies ranged from moderate to good. Only one of the included studies utilized coefficient of variation percentage (CV %) to report reliability measures for DM us-ing real time and M-mode ultrasonography. Both the meas-ures of reproducibility of quiet and deep breathing using the real-time method of assessment were acceptable, with a CV of 13%, and the deep real time of DM was good, with 6.5%.
Statistical pooling of the data was not performed as the number of studies that used B-Mode, M-mode ultrasound, and radiography for assessing DM was limited. Second, meth-odological variation in terms of the position of the patients by identifying a landmark varied between the studies. Third, the inclusion criteria between the studies were heterogeneous in terms of samples. A few of the studies decided not to perform funnel plot analysis to rule out publication bias.
4.4. Level of evidenceThe results of the inter-observer and the intra-observer reli-ability statistics demonstrate that, overall, low levels of evi-dence existed in the selected articles, which were between moderate and good for intra-rater reliability. For inter-rater reliability measures, it was good, on using the GRADE method of assessment.16 Equally, the van Tulder et al. ap-proach indicates that, overall, moderate evidence exists in both inter-observer and intra-observer reliability of DM.17
5. DISCUSSION
The present study is, to our knowledge, the first systematic review assessing the risk of bias and summarizing the results of reliability measures such as relative and absolute for DM using various modalities. The included studies had different measuring equipment and were conducted with different methodological measures. Hence, a universal methodology for assessing DM either using ultrasound or through radio-graph is necessary. All the included studies were conducted with low risk of bias and had a moderate level of evidence for the measures of reliability in measuring DM.
All the included studies examined intra-observer reli-ability and inter-observer reliability. However, the statisti-cal measures that were utilized differed between the studies. Three of the studies included in the review reported relative reliability (ICC) and Pearson correlation coefficient analy-sis.10,11,19 One of the included studies reported absolute reli-ability (CV %).18 Only one study used both absolute and rel-ative forms of reliability measure, which were Pearson and
Author Reliability design Sample size (raters)
Rater (experience) Modality Side of diaphragm
mobility
Position of subjects /
Probe position
Sample size (participants)
Grams et al. (2014) Intra-observer
Inter observer RP & repeatability 2 1 year B-Mode US RT HD
Dorsal decubitus/right subcostal
region in the sagit-tal plane
40 HS
Boussuges et al. (2009) Intra and inter observer RP 2 NC M-mode US RT & LT HD
Standing/ subcostal or
low intercostal probe placed between the
anterior & mid axillary lines
180 HS
Houston et al. (1992) Intra and inter observer RP 2 NS Real time US &
M-mode US RT and LT HD
Supine/inter-costal probe
between mid-axillary & mid-clavicular line
55 general medical ward
patients
Saltiel et al. (2013) Intra and inter observer RP 2 NS
Chest radiog-raphy: Antero-posterior view
RT & LT HD Supine/NS
44 patients who waited for cho-lecystectomy
surgery
Comments: HD – hemi-diaphragm, HS – healthy subjects, LT – left, NS – not specified, NC – not clear, RT – right, RP – reproducibility, US – ultrasound.
Table 1. Characteristics of included studies.

270 Pol ann MeD. 2018;25(2):266–271
Bland-Altman methods of analysis.19 The studies reported for inter-rater reliability were, overall, shown to have good reliability, indicating that clinicians could replicate the measurement of DM using an ultrasound device. Measure-ment of the other type of reliability, which is intra-observer reliability measurement, had a distinction between moderate and good reliability. This signifies that neither of the forms of reliability measures, which are relative and absolute reli-ability measures, was reported in any of the included studies for the present systematic review. A report which was car-ried on diaphragmatic displacement using ultrasound was excluded when it was identified through other resources.21 The reason behind the exclusion is that the majority of the characteristics which were to be extracted for the present study were not clear. Nevertheless, the results of the short report showed that the measurement of the diaphragmatic displacement at tidal breathing was reliable. This further supports that the studies which were carried out in this area did not report clearly the measures of reliability.
5.1. Methodological considerationsThree of the included studies demonstrated low internal valid-ity (1/7) and one of the included studies showed high internal validity (5/7) as assessed by the QUAREL checklist. Hence, it can be inferred that the included studies ranged between low and high quality in terms of internal validity measures. Most of the parameters of internal validity as assessed through the QUAREL checklist scored ‘unclear’ or ‘no’ in three of the in-cluded studies, indicating that the quality of the studies was low. The intimidation to internal validity as evaluated by the QUAREL checklist concerns the parameters of blinding raters, blinding clinical information, additional cues, and diseases.
In order to avoid bias between the reviewers who as-sessed the QUAREL checklist, the review team opted for one clinical content expert and a non-expert as recommend-ed by earlier guidelines for performing a systematic review.17 In addition, the review team carried out a pilot test of meth-odological quality assessment on the various articles that were not included in the review. This could be the probable reason why the quality scores were graded as low, as opera-tionalization and interpretation of each of the parameters are discussed earlier for methodological quality assessment using the QUAREL scoring method. Furthermore, the re-view group opted to have an international group of authors to reduce bias in the inclusion of articles.
5.2. Practical implicationsThe results of this systematic review imply that inter-observer reliability is typically good while intra-observer reliability is typically between moderate and good. Therefore, it can be in-terpreted that the results are encouraging enough to conclude that clinicians can replicate the DM values. The range of in-terpretation which is between moderate and good for intra-rater reliability is concerning the credibility of the assessment. The lack of consistency within the rater’s reading challenges the credibility of the measurement. This can be overwhelmed by identifying factors such as knowledge of the anatomi-
cal landmark of the abdomen, experience of the investigator, the position of the patient, and positioning of the transducer. Therefore, it can be conceded that these factors need to be de-liberated on to improve the consistency within the investiga-tor’s reading. In addition, currently, there no reference stand-ards for DM values, meaning there are no acceptable ranges of healthy and diseased subjects. Hence, there is a need to gener-ate the reference values with regard to both healthy and clinical populations. Overall, the intra-observer and the inter-observer measures of reliability were found to be good. However, the re-sults of the systematic review need to be interpreted with cau-tion as there is limited literature in this particular field.
5.3. Limitations and recommendations of re -viewThe systematic review, which assessed intra-observer and inter-observer reliability of DM using ultrasound and radi-ography was accomplished based on the Preferred Report-ing Items for Systematic Reviews and Meta-Analyses (PRIS-MA) guidelines. In addition, the measures of QUAREL, GRADE, and level of evidence grading were employed based on earlier guidelines.12,15–17
Even though the measures of systemic review guidelines were followed, the study has certain limitations. Firstly, only articles that were published in English for assessing intra-observer and inter-observer reliability were included. Even though no articles were retrieved during the search other than articles in English, this could be considered as one of the limitations. This could be because of the selection of the databases for the present systematic review: it could be that these databases were not able to retrieve articles oth-er than those in English.
Out of the four articles included in the systematic review, two articles were from Brazil, one was from France, and the fourth was from the United Kingdom. The impression is that the study was including two articles from South America and two from Europe. This indicates that articles relevant to the topic may have been published in languages other than Eng-lish which the team may have presumably missed out. Sec-ondly, most of the articles which were included in this review performed DM assessment on healthy subjects, which means that there is a possibility that the results of the assessment may be different in various clinical conditions. Hence, the measure of reliability needs to be tested on clinical popula-tions to ascertain the reliability measures of DM. Studies with similar methods need to be carried out on various clini-cal populations, such as those suffering from musculoskeletal, neurological, and cardio-respiratory conditions for the study findings of the reliability measures to be generalized.
6. CONCLUSIONS
The results of this systematic review indicate that diaphrag-matic mobility assessment is presented in studies with mod-erate-to-good reliability with low risk of bias. The clinical implications of the tests may be suggested with caution.

271 Pol ann MeD. 2018;25(2):266–271
Therefore, utilization of this technique may be recommend-ed. However, future research is important to evaluate dia-phragmatic mobility in both healthy and diseased subjects.
Conflict of interestNone declared.
AcknowledgementsThe authors would like to thank the library assistance of Universiti Teknologi MARA, Puncak Alam, Malaysia.
References1 Kolar P, Sulc J, Kyncl M, et al. Postural function of the dia-
phragm in persons with and without chronic low back pain. J Orthop Sports Phys Ther. 2012;42(4):352–362. https://doi.org/10.2519/jospt.2012.3830.
2 Paulin E, Yamaguti WPS, Chammas MC, et al. Influence of diaphragmatic mobility on exercise tolerance and dys-pnea in patients with COPD. Respir Med. 2007;101(10): 2113–2118. https://doi.org/10.1016/j.rmed.2007.05.024.
3 Rocha T, Souza H, Brandão DC, et al. The Manual Diaph-ragm Release Technique improves diaphragmatic mobility, inspiratory capacity and exercise capacity in people with chronic obstructive pulmonary disease: A randomised trial. J Physiother. 2015;61(4):182–189. https://doi.org/10.1016/j.jphys.2015.08.009.
4 Santana PV, Prina E, Albuquerque AL, Carvalho CR, Ca-ruso P. Identifying decreased diaphragmatic mobility and diaphragm thickening in interstitial lung disease: the utility of ultrasound imaging. J Bras Pneumol. 2016;42(2):88–94. https://doi.org/10.1590/S1806-37562015000000266.
5 Haji K, Royse A, Green C, Botha J, Canty D, Royse C. In-terpreting diaphragmatic movement with bedside imaging, review article. J Crit Care. 2016;34:56–65. https://doi.or-g/10.1016/j.jcrc.2016.03.006.
6 Kolář P, Neuwirth J, Šanda J, et al. Analysis of diaphragm move-ment during tidal breathing and during its activation while bre-ath holding using MRI synchronized with spirometry. Physiol Res. 2009;58(3):383–392. https://doi.org/10.1093/ehjci/jeu087.
7 Rocha FR, Brüggemann AKV, Francisco D de S, Medeiros CS de, Rosal D, Paulin E. Diaphragmatic mobility: rela-tionship with lung function, respiratory muscle strength, dyspnea, and physical activity in daily life in patients with COPD. J Bras Pneumol. 2017;43(1):32–37. https://doi.org/10.1590/s1806-37562016000000097.
8 Toledo NSG, Kodaira SK, Massarollo PCB, Pereira OI, Mies S. Right hemidiaphragmatic mobility: assessment with US measurement of craniocaudal displacement of left branches of portal vein. Radiology. 2003;228(2):389–394. https://doi.org/10.1148/radiol.2282011554.
9 Bruton A, Conway JH, Holgate ST. Reliability: What is it, and how is it measured? Physiotherapy. 2000;86(2):94–99. https://doi.org/10.1016/S0031-9406(05)61211-4.
10 Saltiel R V., Grams ST, Pedrini A, Paulin E. High relia-bility of measure of diaphragmatic mobility by radio-graphic method in healthy individuals. Brazilian J Phys Ther. 2013;17(2):128–136. https://doi.org/10.1590/S1413-35552012005000076.
11 Grams ST, von Saltiél R, Mayer AF, et al. Assessment of the reproducibility of the indirect ultrasound method of measuring diaphragm mobility. Clin Physiol Funct Imaging. 2014;34(1):18–25. https://doi.org/10.1111/cpf.12058.
12 Lucas NP, Macaskill P, Irwig L, Bogduk N. The develop-ment of a quality appraisal tool for studies of diagnostic reliability (QAREL). J Clin Epidemiol. 2010;63(8):854–861. https://doi.org/10.1016/j.jclinepi.2009.10.002.
13 May S, Chance-Larsen K, Littlewood C, Lomas D, Saad M. Reliability of physical examination tests used in the as-sessment of patients with shoulder problems: A systematic review. Physiotherapy. 2010;96(3):179–190. https://doi.or-g/10.1016/j.physio.2009.12.002.
14 May S, Littlewood C, Bishop A. Reliability of procedures used in the physical examination of non-specific low back pain: A systematic review. Aust J Physiother. 2006;52(2): 91–102. https://doi.org/10.1016/S0004-9514(06)70044-7.
15 Lucas N, Macaskill P, Irwig L, et al. The reliability of a qu-ality appraisal tool for studies of diagnostic reliability (QA-REL). BMC Med Res Methodol. 2013;13:111. https://doi.org/10.1016/j.jclinepi.2009.10.002.
16 Guyatt G, Oxman AD, Akl EA, et al. GRADE guidelines: 1. Introduction – GRADE evidence profiles and summary of findings tables. J Clin Epidemiol. 2011;64(4):383–394. https://doi.org/10.1016/j.jclinepi.2010.04.026.
17 Van Tulder M, Furlan A, Bombardier C, Bouter L. Upda-ted Method Guidelines for Systematic Reviews in the Co-chrane Collaboration Back Review Group. Spine (Phila Pa 1976). 2003;28(12):1290–1299. https://doi.org/10.1097/BRS.0b013e3181b1c99f.
18 Houston JG, Morris AD, Howie CA, Reid JL, McMillan N. Technical report: Quantitative assessment of diaphragmatic movement – A reproducible method using ultrasound. Clin Radiol. 1992;46(6):405–407. https://doi.org/10.1016/S0009-9260(05)80688-9.
19 Boussuges A, Gole Y, Blanc P. Diaphragmatic motion stu-died by M-mode ultrasonography. Chest. 2009;135(2):391–400. https://doi.org/10.1378/chest.08-1541.
20 Portney LG, Watkins MP. Foundations of Clinical Research Applications to Practice. 3rd Ed. New Jersy: Prentice Hall He-alth; 2009.
21 Blaney F, English CS, Sawyer T. Sonographic measurement of diaphragmatic displacement during tidal breathing manoeu-vres – a reliability study. Aust J Physiother. 1999;45:41–43.
272 Pol ann MeD. 2018;25(2):272–276
Review article
Apolinary Ginszt1, Michał Ginszt1, Piotr Majcher1, Zbigniew Tarkowski2
1 Chair and Department of Rehabilitation, Physiotherapy and Balneotherapy, the Medical University of Lublin, Poland2 Department of Pathology and Rehabilitation of Speech, Medical University of Lublin, Poland
Corresponding author: Michał Ginszt, Magnoliowa 2, 20-143 Lublin, Poland. Tel.: +48 602 533 723.E-mail address: [email protected].
Effects of exercise on blood glucose levels in type 2 diabetic patients – Literature review
article info
Art ic l e h i s toryReceived 20 July 2017Accepted 19 October 2017Available online 7 May 2018
Keywords DiabetesGlucoseExercise
Doi10.29089/2017.17.00037
User l i cense This work is licensed under a Creative Commons Attribution –NonCommercial – NoDerivatives 4.0 International License.
abstract
Introduct ion: Diabetes is a major global health problem that affects almost 382 million people worldwide. Physical exercises have been considered as a ‘gold standard’ in treatment of type 2 diabetes. Nevertheless, there is still a low preva-lence of exercise in diabetes population.
Aim: The aim of our study is to present the effects of resistance, aerobic, com-bined, and high-intensity exercise on blood glucose levels in patients with type 2 diabetes.
Mater ia l and methods :The attempt was made to investigate the effects of exercise on blood glucose levels in type 2 diabetic patients. Using keywords ‘dia-betes,’ ‘exercise,’ ‘glucose,’ we performed a review of relevant articles based on a PubMed and Scopus online databases, focusing on the last five years.
Resu l t s and d i scuss ion: The combination of resistance and aerobic tra-ining seems to have a greater impact on glycemic control than both types of exercise alone. In addition, some studies have shown a positive effect of high--intensity exercise, especially high-intensity interval training, in the treatment of diabetes.
Conc lus ions :Both resistance, aerobic, and combined exercises have benefits in glycemic control for type 2 diabetic patients. The type of exercise chosen to the treatment of diabetes should be matched according to the individual clinical profile of the patient. Further studies are needed to assess the effects of high-in-tensity exercises on blood glucose levels in type 2 diabetes.
Journal homepage: https://www.paom.pl
Polish Annals of Medicine

273 Pol ann MeD. 2018;25(2):272–276
1. INTRODUCTION
Diabetes is a major global health problem that affects almost 382 million people worldwide.1 The pathogenesis of type 2 diabetes (T2D), which accounts for 85%–95% of all diabe-tes cases in the world, has been for a long time. Current re-search shows, that insulin resistance and β-cell dysfunction are the major factors in the pathogenesis of T2D.2 However, the disease process is heterogeneous, including genetic and environmental determinants such as physical inactivity and poor nutrition.3,4 The environmental determinants of insulin resistance and β-cell dysfunction are strongly asso-ciated with obesity and a sedentary lifestyle. Thus, physi-cal exercise has been considered as a ‘gold standard’ in the treatment of T2D. This non-pharmacological therapeutic strategy improves glycaemic control and insulin sensitiv-ity.5 Moreover, physical exercises have a positive impact on body composition, blood pressure and lipid profile, which disorders can be a predictor of T2D.6 European Association for the Study of Diabetes and American Diabetes Associa-tion pay attention to the important role of well-planned ef-fort in the treatment of diabetes, especially of type 2.7,8 Fur-thermore, individuals at high risk for developing T2D can significantly decrease the rate of diabetes onset by lifestyle intervention, such as increasing physical activity to at least 150 min/week of moderate activity and weight loss of 7% of body weight.8
Nevertheless, in some countries there is still a low preva-lence of exercise practice in patients with T2D.9 It might be due to the lack of knowledge about potential benefits of physical exercises and current international recommenda-tions for diabetic patients.10 Over the last few years, more research is using a continuous glucose monitoring system, which gives unprecedented access to control patient’s blood glucose levels.11,12 In spite of this, there is still a lack of stud-ies demonstrating which type of exercise should be recom-mended for T2D. Scientific organisations (International Diabetes Federation, European Association for the Study of Diabetes, American College of Sports Medicine, American Diabetes Association, American Heart Association, Belgian Physical Therapy Association, Canadian Diabetes Associa-tion, European Society of Cardiology, Exercise and Sports Science Australia, Francophone Diabetes Society, Swed-ish National Institute of Public Health) recommend both aerobic activity, resistance exercise and combined aerobic/resistance training.13 In addition, some studies have shown a positive effect of high-intensity exercise, especially high-intensity interval training, in the treatment of diabetes, in-cluding the increase of glucose uptake and improvement of mitochondrial function.14–16
Therefore, exercise volume and the type of training should be carefully analyzed and matched to the medical profile of the diabetic patient, which may be a major deter-minant of proper glucose level.
2. AIM
The aim of our study is to present the effects of resistance, aerobic, combined, and high-intensity exercise on blood glucose levels in patients with T2D.
3. MATERIAL AND METHODS
The attempt was made to investigate the effects of exercise on blood glucose levels in type 2 diabetic patients. Using keywords ‘diabetes,’ ‘exercise,’ ‘glucose,’ we performed a review of relevant articles based on a PubMed and Scopus online databases, focusing on last five years.
4. RESULTS AND DISCUSSION
4.1 Resistance exerciseResistance exercise is an anaerobic type of training, which is used to increase muscular strength, power, and endurance by varying the resistance intensity range between 50%–75% of 1-repetition maximum.17,18 Well-planned, ten-week re-sistance training may increase resting metabolic rate by 7% and reduce fat weight by 1.8 kg.19 By decreasing visceral fat and improving insulin sensitivity and glucose control, resistance training can be a useful tool in the treatment of T2D. Hence, resistance exercise for T2D is recommended by national and international organisations.20–22 According to Position Statement of the American Diabetes Associa-tion, resistance training of any intensity is recommended for diabetic patients to improve strength, balance, and abil-ity to engage in activities of daily living throughout the life span. In addition, adults with diabetes should engage in 2–3 sessions/week of resistance exercise on nonconsecutive days (1).23 Moreover, Ishiguro et al. (2016) Systematic Review and Meta-Analysis suggests that the resistance training could be recommended in the early stage of T2D, especially for patients with relatively poor glycaemic control.24 However, there is no agreement on detailed duration, dosage and re-sistance exercise programs.13
The positive effect of exercise on blood glucose level and diabetes treatment has been demonstrated in many stud-ies over the years.25 However, in the last five years, only a few papers dealt with this issue. Russell et al. (2017) study showed that resistance training improves glycaemic control (fasting blood glucose, HbA1c, and glucose area under the curve).26 The significant differences between the resistance exercise group and the control group in the reduction of glu-cose level (22.21%∆ vs. 7.99%∆, respectively; P < 0.05) was found by AminiLari et al. (2017).27 Moreover, improvements in glycaemic control and glucose homeostasisin type 2 dia-betic patients were also reported by Hameed et al. (2012), Mavros et al. (2013), and Hsieh et al (2016) studies.28–30
4.2 Aerobic exerciseAerobic type of training involving large muscle groups with low and middle intensity can be performed safely by dia-betic patients. Aerobic exercises such as running, walking,

274 Pol ann MeD. 2018;25(2):272–276
cycling, swimming, and rowing, are typically included in this category of training.18,31 International diabetes societies recommended 150 minutes of aerobic exercise spread over a minimum of three days per week with moderate intensity (40%–59% of heart rate reserve, 64%–76% of the maximum heart rate) with no more than two consecutive days without exercise.13 American Diabetes Association recommended for adults with T2D regular aerobic activities that last at least 10 minutes, with the goal of γ30 min/day or more, most days of the week.23
Van Dijk et al. (2013) study reported the effectiveness of aerobic-endurance exercises in improving glycaemic con-trol. A single bout of moderate-intensity exercise lowered average blood glucose concentrations by 0.9 mmol/L and reduced glycaemic variability (0.7 to 1.2; P < 0.05).32 More-over, the single 45-minutes bout of moderate-intensity exer-cise (6 METs) reduced the glycaemic response to breakfast, lunch, and dinner (P < 0.05 for all postprandial periods).33 Nygaard et al. (2017) showed significant decrease of the gly-caemic variability after aerobic postprandial exercises com-pared to the control day (1.22 ± 0.49 mmol/L vs. 1.58 ± 0.52 mmol/L, respectively; P < 0.05). They also observed decrease in the mean of the 10 highest glucose values meas-ured after exercises in each individual (8.6 ± 1.9 mmol/L).34 The positive effect of aerobic exercise on glycaemic control has been demonstrated also by AminiLari et al. (2017). The study protocol has consisted of 3 sessions per week for 12 weeks (25 minutes exercise in order to achieve 50%–55% of maximum heart rate). In this study, the reduction of glucose level was observed in comparison to controls (24.58%∆ vs. 7.99%∆, respectively; P < 0.05).27
The differences between resistance and aerobic exercises were analyzed several times in the literature. Although nu-merous studies reported statistical significance differences in diabetic control measures between resistance and aerobic exercise training programmes, there is no evidence that they are of clinical importance.25
4.3 Combined aerobic and resistance exercise Both resistance and aerobic training have a positive thera-peutic effect in the treatment and control of T2D. However, the combination of both types of training seems to have a greater impact on glycaemic control than both types of ex-ercise alone.13,22,35
Kang et al. (2016) study confirms the effectiveness of combined exercise in the insulin resistance improvement and blood glucose control enhancing. The 12 weeks com-bined aerobic and resistance training programme reduced significantly fasting blood glucose concentration (Pre: 139.5 ± 12.3 mg/dL, Post: 132.9 ± 11.6 mg/dL; P < 0.001).36 The study Liu et al. (2015) evaluated the difference between combined aerobic/resistance exercises and conventional treatment during 12 weeks. The authors observed the re-duction of postprandial blood glucose level after combined training in comparison to the conventional therapy group (9.00 ± 1.91 mmol/L vs. 7.30 ± 0.98 mmol/L, respectively; P < 0.01).37 Moreover, Tan et al. (2012) showed significant
reduction of the fasting blood glucose concentration after 6 months of combined intervention in comparison to controls (6.19 ± 1.47 mmol/L vs. 6.69 ± 1.73 mmol/L, respectively; P < 0.05).38 Similar results were obtained by AminiLari et al. (2017), Yalamanchi et al. (2016), Adeniyi et al. (2013), and Jorge et al. (2011).27,39–41
4.4 High-intensity exerciseHigh-intensity interval training (HIT) is an increasingly popular form of time-efficient exercises program, consisting brief bursts of very vigorous exercise (≥90% VO2max) sepa-rated by brief recovery periods.42 Although the large group of studies has demonstrated the ability of HIT to produce large gains in both aerobic and anaerobic exercise ability in rehabilitation, only several studies described this type of effort in the management of diabetes.43 Moreover, accord-ing to Position Statement of the American Diabetes Asso-ciation, those diabetic patients, who wish to perform HIT, should be clinically stable, have been participating at least in regular moderate-intensity exercise, and should be super-vised during the first stage of exercise.23
Lee et al. (2015) finding indicate that the 12 week high-intensity exercise program (n = 10; 3 trainings per week at not less than 80% heart rate reserve) resulted in more posi-tive changes in glycemic control (fasting glucose, C-peptide, homeostasis model assessment 2 of insulin resistance; P < 0.05) in type 2 diabetic patients than the typical low-intensity exercise training (n = 10; 6 trainings per week at not more than 40% heart rate reserve).44 Gillen et al. (2012) study re-ported, that HIT reduced hyperglycaemia above 10 mmol/L (HIT: 4.5 ± 4.4 mmol/L vs. CTL: 15.2 ± 12.3 mmol/L, P = 0.04) and postprandial hyperglycaemia (HIT: 728 ± 331 mmol/L • 9 h vs. CTL: 1142 ± 556 mmol/L • 9 h, P = 0.01). The study protocol consisted of 10 × 60 s cycling efforts at ~90% maximal heart rate, interspersed with 60 s rest and in-volved a small number of diabetic patients (n = 7) in a short continuous glucose monitoring system monitoring period (24 hours).14 The similar protocol used by Little et al. (2011), which examined the effects of 2 week HIT on glucose regu-lation showed the reduction of average 24-hours blood glu-cose concentration after training (7.6 ± 1.0 mmol/L vs. 6.6 ± 0.7 mmol/L; P < 0.05). However, the study only reported on eight participants.15 Thus, lack of studies and small study groups in existing research do not allow assessing the effects of high-intensity exercise on blood glucose levels and the ef-fectiveness of this method in the management of diabetes. In addition, the high prevalence of co-morbid illness (hyperten-sion, cardiovascular disease) in diabetes can also be a con-traindication to exercise an intensity of 90% maximal heart rate.45 Hence, perhaps this type of exercise is not included in the recommendations of diabetic associations.
5. CONCLUSIONS
1. Both resistance, aerobic, and combined exercises have benefits in glycaemic control for type 2 diabetic patients.

275 Pol ann MeD. 2018;25(2):272–276
2. The type of exercise chosen to the treatment of diabetes should be matched according to the individual clinical profile of the patient.
3. Further studies are needed to assess the effects of high-intensity exercises on blood glucose levels in T2D.
Conflict of interestThe authors declare that they have no conflict of interest.
AcknowledgmentsThe results of the present study do not constitute endorse-ment of the product by the authors or the journal.
References1 International Diabetes Federation. IDF diabetes atlas. 6th
edn. Brussels International Diabetes Federation, 2013. https://www.idf.org/component/attachments/attachments.html?id=813&task=download. Accessed: April 18, 2018.
2 Kahn SE, Cooper ME, Del Prato S. Pathophysiology and treatment of type 2 diabetes: perspectives on the past, pre-sent, and future. Lancet. 2014;383(9922):1068–1083. https://doi.org/10.1016/S0140-6736(13)62154-6.
3 Hu FB. Globalization of diabetes: the role of diet, lifestyle, and genes. Diabetes Care. 2011;34(6):1249–1257. https://doi.org/10.2337/dc11-0442.
4 Adamska A, Przegaliński M, Rutkowska I, et al. Relation-ship between regular aerobic physical exercise and glucose and lipid oxidation in obese subjects – A preliminary report. Pol Ann Med. 2012;19(2):117–121. https://doi.org/10.1016/j.poamed.2012.05.001.
5 Rydén L, Grant PJ, Anker SD, et al. ESC Guidelines on dia-betes, pre-diabetes, and cardiovascular diseases developed in collaboration with the EASD The Task Force on diabetes, pre-diabetes, and cardiovascular diseases of the European Society of Cardiology (ESC) and developed in collaboration with the European Association for the Study of Diabetes (EASD). Eur Heart J. 2013;34(39):3035–3087. https://doi.org/10.1093/eurheartj/eht108.
6 Naci H, Ioannidis JPA. Comparative effectiveness of exerci-se and drug interventions on mortality outcomes: metaepi-demiological study. Br J Sports Med. 2015;49(21):1414–1422. https://doi.org/10.1136/bjsports-2015-f5577rep.
7 Inzucchi SE, Bergenstal RM, Buse JB, et al. Management of hyperglycemia in type 2 diabetes: a patient-centered ap-proach: position statement of the American Diabetes Asso-ciation (ADA) and the European Association for the Study of Diabetes (EASD). Diabetes Care. 2012;35(6):1364–1379. https://doi.org/10.2337/dc12-0413.
8 Association AD. Standards of Medical Care in Diabetes – 2014. Diabetes Care. 2014;37:14–80. https://doi.org/10.2337/dc14-S014.
9 Hermann G, Herbst A, Schütt M, et al. Association of physical activity with glycaemic control and cardiovascular risk profile in 65 666 people with type 2 diabetes from Germany and Au-stria. Diabet Med J Br Diabet Assoc. 2014;31(8):905–912. https://doi.org/10.1111/dme.12438.
10 Colberg SR. Physical activity: the forgotten tool for type 2 diabetes management. Front Endocrinol. 2012;3:70. https://doi.org/10.3389/fendo.2012.00070.
11 Soliman A, DeSanctis V, Yassin M, Elalaily R, Eldarsy NE. Continuous glucose monitoring system and new era of early diagnosis of diabetes in high risk groups. Indian J Endocrinol Metab. 2014;18(3):274–282. https://doi.org/10.4103/2230-8210.131130.
12 McAdams BH, Rizvi AA. An Overview of Insulin Pumps and Glucose Sensors for the Generalist. J Clin Med. 2016;5(1). https://doi.org/10.3390/jcm5010005.
13 Mendes R, Sousa N, Almeida A, et al. Exercise prescrip-tion for patients with type 2 diabetes-a synthesis of inter-national recommendations: narrative review. Br J Sports Med. 2016;50(22):1379–1381. https://doi.org/10.1136/bjsports-2015-094895.
14 Gillen JB, Little JP, Punthakee Z, Tarnopolsky MA, Riddell MC, Gibala MJ. Acute high-intensity interval exercise redu-ces the postprandial glucose response and prevalence of hy-perglycaemia in patients with type 2 diabetes. Diabetes Obes Metab. 2012;14(6):575–577. https://doi.org/10.1111/j.1463--1326.2012.01564.x.
15 Little JP, Gillen JB, Percival ME, et al. Low-volume high--intensity interval training reduces hyperglycemia and increases muscle mitochondrial capacity in patients with type 2 diabetes. J Appl Physiol Bethesda Md (1985). 2011;111(6):1554–1560. https://doi.org/10.1152/japplphy-siol.00921.2011.
16 Kjaer M, Hollenbeck CB, Frey-Hewitt B, Galbo H, Haskell W, Reaven GM. Glucoregulation and hormonal responses to maximal exercise in non-insulin-dependent diabetes. J Appl Physiol Bethesda Md (1985). 1990;68(5):2067–2074. https://doi.org/10.1152/jappl.1990.68.5.2067.
17 Balducci S, Sacchetti M, Haxhi J, et al. Physical exerci-se as therapy for type 2 diabetes mellitus. Diabetes Metab Res Rev. 2014;30 (Suppl 1):13–23. https://doi.org/10.1002/dmrr.2514.
18 Thent ZC, Das S, Henry LJ. Role of Exercise in the Manage-ment of Diabetes Mellitus: the Global Scenario. PLoS ONE. 2013;8(11). https://doi.org/10.1371/journal.pone.0080436.
19 Westcott WL. Resistance training is medicine: effects of strength training on health. Curr Sports Med Rep. 2012;11(4):209–216. https://doi.org/10.1249/JSR.0b013e-31825dabb8.
20 Garber CE, Blissmer B, Deschenes MR, et al. American Col-lege of Sports Medicine position stand. Quantity and quality of exercise for developing and maintaining cardiorespirato-ry, musculoskeletal, and neuromotor fitness in apparently healthy adults: guidance for prescribing exercise. Med Sci Sports Exerc. 2011;43(7):1334–1359. https://doi.org/10.1249/MSS.0b013e318213fefb.
21 Duclos M, Oppert J-M, Verges B, et al. Physical activity and type 2 diabetes. Recommandations of the SFD (Francopho-ne Diabetes Society) diabetes and physical activity working group. Diabetes Metab. 2013;39(3):205–216. https://doi.or-g/10.1016/j.diabet.2013.03.005.
22 Hordern MD, Dunstan DW, Prins JB, Baker MK, Singh MAF, Coombes JS. Exercise prescription for patients with type 2 diabetes and pre-diabetes: a position statement from Exerci-se and Sport Science Australia. J Sci Med Sport. 2012;15(1): 25–31. https://doi.org/10.1016/j.jsams.2011.04.005.
23 Colberg SR, Sigal RJ, Yardley JE, et al. Physical Activity/Exercise and Diabetes: A Position Statement of the American Diabetes Association. Diabetes Care. 2016;39(11):2065–2079. https://doi.org/10.2337/dc16-1728.

276 Pol ann MeD. 2018;25(2):272–276
24 Ishiguro H, Kodama S, Horikawa C, et al. In Search of the Ide-al Resistance Training Program to Improve Glycemic Control and its Indication for Patients with Type 2 Diabetes Mellitus: A Systematic Review and Meta-Analysis. Sports Med Auckl NZ. 2016;46(1):67–77. https://doi.org/10.1007/s40279-015-0379-7.
25 Yang Z, Scott CA, Mao C, Tang J, Farmer AJ. Resistance exer-cise versus aerobic exercise for type 2 diabetes: a systematic review and meta-analysis. Sports Med Auckl NZ. 2014;44(4): 487–499. https://doi.org/10.1007/s40279-013-0128-8.
26 Russell RD, Hu D, Greenaway T, et al. Skeletal Muscle Micro-vascular-Linked Improvements in Glycemic Control From Re-sistance Training in Individuals With Type 2 Diabetes. Diabetes Care. 2017;40(9):1256–1263. https://doi.org/10.2337/dc16-2750.
27 AminiLari Z, Fararouei M, Amanat S, et al. The Effect of 12 Weeks Aerobic, Resistance, and Combined Exercises on Omen-tin-1 Levels and Insulin Resistance among Type 2 Diabetic Middle-Aged Women. Diabetes Metab J. 2017;41(3):205–212. https://doi.org/10.4093/dmj.2017.41.3.205.
28 Hameed UA, Manzar D, Raza S, Shareef MY, Hussain ME. Resistance Training Leads to Clinically Meaningful Impro-vements in Control of Glycemia and Muscular Strength in Untrained Middle-aged Patients with type 2 Diabetes Mel-litus. North Am J Med Sci. 2012;4(8):336–343. https://doi.org/10.4103/1947-2714.99507.
29 Mavros Y, Kay S, Anderberg KA, et al. Changes in Insulin Resistance and HbA1c Are Related to Exercise-Mediated Changes in Body Composition in Older Adults With Type 2 Diabetes. Diabetes Care. 2013;36(8):2372–2379. https://doi.org/10.2337/dc12-2196.
30 Hsieh P-L, Tseng C-H, Tseng YJ, Yang W-S. Resistance Training Improves Muscle Function and Cardiometabolic Risks But Not Quality of Life in Older People With Type 2 Diabetes Mellitus: A Randomized Controlled Trial. J Ge-riatr Phys Ther. 2016;41(2):65–76. https://doi.org/10.1519/JPT.0000000000000107.
31 Marwick TH, Hordern MD, Miller T, et al. Exerci-se Training for Type 2 Diabetes Mellitus. Circulation. 2009;119(25):3244–3262. https://doi.org/10.1161/CIRCU-LATIONAHA.109.192521.
32 Van Dijk J-W, Manders RJF, Canfora EE, et al. Exercise and 24-h glycemic control: equal effects for all type 2 diabetes patients? Med Sci Sports Exerc. 2013;45(4):628–635. https://doi.org/10.1249/MSS.0b013e31827ad8b4.
33 Van Dijk J-W, Venema M, van Mechelen W, Stehouwer CDA, Hartgens F, van Loon LJC. Effect of Moderate-Inten-sity Exercise Versus Activities of Daily Living on 24-Hour Blood Glucose Homeostasis in Male Patients With Type 2 Diabetes. Diabetes Care. 2013;36(11):3448–3453. https://doi.org/10.2337/dc12-2620.
34 Nygaard H, Rønnestad BR, Hammarström D, Holmboe-Ot-tesen G, Høstmark AT. Effects of Exercise in the Fasted and Postprandial State on Interstitial Glucose in Hyperglycemic Individuals. J Sports Sci Med. 2017;16(2):254–263.
35 Hansen D, Peeters S, Zwaenepoel B, et al. Exercise assessment
and prescription in patients with type 2 diabetes in the pri-vate and home care setting: clinical recommendations from AXXON (Belgian Physical Therapy Association). Phys Ther. 2013;93(5):597–610. https://doi.org/10.2522/ptj.20120400.
36 Kang S-J, Ko K-J, Baek U-H. Effects of 12 weeks combined aerobic and resistance exercise on heart rate variability in type 2 diabetes mellitus patients. J Phys Ther Sci. 2016;28(7): 2088–2093. https://doi.org/10.1589/jpts.28.2088.
37 Liu Y, Liu S, Cai Y, Xie K, Zhang W, Zheng F. Effects of combined aerobic and resistance training on the glycoli-pid metabolism and inflammation levels in type 2 diabetes mellitus. J Phys Ther Sci. 2015;27(7):2365–2371. https://doi.org/10.1589/jpts.27.2365.
38 Tan S, Li W, Wang J. Effects of Six Months of Combi-ned Aerobic and Resistance Training for Elderly Patients with a Long History of Type 2 Diabetes. J Sports Sci Med. 2012;11(3):495–501.
39 Jorge MLMP, de Oliveira VN, Resende NM, et al. The effects of aerobic, resistance, and combined exercise on metabolic control, inflammatory markers, adipocytokines, and muscle insulin signaling in patients with type 2 diabetes mellitus. Metabolism. 2011;60(9):1244–1252. https://doi.org/10.1016/j.metabol.2011.01.006.
40 Adeniyi AF, Uloko AE, Ogwumike OO, Sanya AO, Fasan-made AA. Time Course of Improvement of Metabolic Pa-rameters after a 12 Week Physical Exercise Programme in Patients with Type 2 Diabetes: The Influence of Gender in a Nigerian Population. Bio Med Res Int. 2013. https://doi.org/10.1155/2013/310574.
41 Yalamanchi SV, Stewart KJ, Ji N, et al. The relationship of fasting hyperglycemia to changes in fat and muscle mass after exercise training in type 2 diabetes. Diabetes Res Clin Pract. 2016;122:154–161. https://doi.org/10.1016/j.dia-bres.2016.09.026.
42 Adams OP. The impact of brief high-intensity exercise on blood glucose levels. Diabetes Metab Syndr Obes Targets Ther. 2013;6:113–122. https://doi.org/10.2147/DMSO.S29222.
43 Ito S, Mizoguchi T, Saeki T. Review of High-intensity In-terval Training in Cardiac Rehabilitation. Intern Med Tokyo Jpn. 2016;55(17):2329–2336. https://doi.org/10.2169/inter-nalmedicine.55.6068.
44 Lee SS, Yoo JH, So YS. Effect of the low- versus high-intensity exercise training on endoplasmic reticulum stress and GLP-1 in adolescents with type 2 diabetes mellitus. J Phys Ther Sci. 2015;27(10):3063–3068. https://doi.org/10.1589/jpts.27.3063.
45 Sowers JR, Epstein M, Frohlich ED. Diabetes, hypertension, and cardiovascular disease: an update. Hypertens Dallas Tex (1979). 2001;37(4):1053–1059. https://doi.org/10.1161/01.HYP.37.4.1053.

277 Pol ann MeD. 2018;25(2):277–282
Review article
Tomasz Michalski1, Piotr Michalik1, Magdalena Dąbrowska-Galas1, Tomasz Król1, Magdalena Rutkowska1, Michał Hadała2,3
1 Department of Kinesitherapy and Special Methods, SHS in Katowice, Medical University of Silesia, Katowice, Poland2 Fizjo-Sport, Rzeszów, Poland
3 Universidad Catolica de Valencia, Valencia, Spain
Efficacy of stretching in physiotherapy and sports
article info
Art ic l e h i s toryReceived 17 September 2017Accepted 11 December 2017Available online 27 June 2018
Keywords TretchingMuscleAthletic injury preventionHold-relax technique
Doi10.29089/2017.17.00056
User l i cense This work is licensed under a Creative Commons Attribution –NonCommercial – NoDerivatives 4.0 International License.
abstract
Introduct ion: Stretching constitutes an important element of therapeutic management in numerous disciplines, starting from neurology to motor training and orthodontic practice. Different models and approaches that apply stretching use their own terminology, and yet they are based on similar assumptions and purposes.
Aim: The aim of this study was to establish scientific fundamentals of using different forms of stretching, and to determine areas of its effective application.
Mater ia l and methods : Medline searches were conducted in context of stretching, hold-relax technique, athletic injury prevention and physiotherapy.
Resu l t s and d i scuss ion: Although stretching is widely recognized as an effective method of working with muscle restrictions, there are many studies that undermine its impact on the muscle length, especially in short-term observation. Similar limitations are noted with regard to its application in patients with neu-rological paresis, or as an element of warm-up before sports activity.
Conc lus ions : Stretching is an effective tool in working with myofascial pain syndromes; however, its actual influence on the condition of muscles and fascia remains unclear.
Journal homepage: https://www.paom.pl
Polish Annals of Medicine
Correspondence to: Piotr Michalik, Skrzeka i Wójcika 6b/13, 41-106 Siemianowice, Poland. Tel.: +48 694 979 743.
E-mail address: [email protected].

278 Pol ann MeD. 2018;25(2):277–282
1. INTRODUCTION
Muscle stretching is highly recommended by a wide range of specialists working with the movement sstem, including various sports disciplines trainers, physiotherapists helping patients with pain and mobility limitations. Based on dif-ferent explanations, they introduce elements of the therapy aimed at reducing muscle tone or increasing muscle length. Scholars have also been searching for an optimal model af-fecting body structures so as to permanently increase mobil-ity. Research findings are sometimes astonishing, especially those questioning the impact of stretching on changes in muscle morphology, and reducing the effect of ‘muscle is extending’ only to changes within the nervous system. Ac-cording to the sensory theory, the actual muscle length stays the same, and the observed therapy result is only a change in a subjectively sensed level of muscle stretching achieved through increasing the tolerance to stretch.1 Another in-teresting research finding is a negative influence of muscle stretching on its kinetic properties, especially on the peak strength moment and explosive force. Even though this ef-fect, known by researchers as the stretch-induced strength loss, concerns only certain forms of stretching, it makes us ponder the real, clinical value of stretching exercises.
2. AIM
The aim of this study was to establish scientific fundamen-tals of using different forms of stretching, and to determine areas of its effective application.
3. MATERIAL AND METHODS
Medline searches were conducted in context of stretching, hold-relax technique, athletic injury prevention and physi-otherapy.
4. RESULTS
Currently used types of stretching methods may be divided into three groups:(1) Static stretching (SS) which involves holding a muscle
in a position of preserving the distance between its ori-gin and insertion. The duration varies and ranges from short 15–30 s sessions repeated 2–4 times a day even to 40-minute interventions.
(2) Dynamic stretching (DS) involves actively and repeat-edly moving a limb in the full range of motion.
(3) The majority of techniques derive from the proprioceptive neuromuscular facilitation concept (PNF). Their common characteristic feature is a submaximal isometric contraction, which lasts for several seconds and is followed by a passively performed stretch. The most common of those techniques is hold-relax (HR) and muscle energy technique (MET).
4.1. Stretching eff icacy in improving the range of movement (ROM)Effects of stretching need to be considered in terms of acute changes occurring immediately after workout, and in terms of permanent plastic adaptations. Acute changes result from the viscoelastic properties of muscles, which, while under pressure, are able to change their length temporarily, only to return to their primary length once the stimulus ceases to affect them. The effects in the form of an increase in pas-sive and active range of mobility achieved immediately af-ter stretching are undisputed and concern all the types of stretching: static, dynamic, and stretching with initial ten-sion. A comparative study of the PNF and SS applications demonstrated no difference between those two stretching types when it comes to improving the hamstrings flexibil-ity.1–3 In order to achieve long-lasting effects, it was essential to ensure adequate duration of a stretching stimulus. In a study where the stimulation was performed 4 × 30 s, the achieved increase in the range of movement (ROM) subsid-ed after 10 minutes. It was only after prolonging this time to 4 minutes or 8 minutes that the effect could be preserved for 10 minutes and 30 minutes respectively at the level of 50% of the reduction occurring immediately after the workout.4 Long-lasting effects after many weeks of workout also attest to the effectiveness of different forms of stretching. A study comparing two forms of stretching hamstring muscles for 6 weeks, namely PNF and passive stretching, proved to be effective in improving the range of motion.5 All the forms of workout proved to be equally effective in a study including 117 people after the knee replacement procedure, where 2 weeks of intervention with the SS, DS, and PNF methods brought the improvement of the 20-degree angle.6 A slight advantage of the SS method was observed in a 4-week train-ing carried out with the exceptionally low intensity of 3 × 30 s per week. After 2 weeks of using PNF, SS and self-stretching all the study subjects had similar results, but after finishing the training only static stretching brought a sta-tistically significant result, while the other methods proved ineffective.7
However the results obtained in this area do not allow us to draw definite conclusions. Some researchers claim that the observed improvement of mobility after stretch-ing workout does not result from the muscle rebuilding, but from increased stretch tolerance, that is, from sensory adaptation.8 The outcome of a 4-week stretching regime conducted in a group of 14 healthy volunteers demonstrated a significant improvement in the subjectively sensed mo-bility even though there were no changes in flexibility of the stretched muscles.9 Also workout of muscle stretching performed for 30 minutes daily over 6 weeks by 60 young volunteers did not change elasticity of the examined mus-cles, although stretch tolerance improved, with the effect of mobility increasing by 10° on average.10 No alteration in the stretched muscles flexibility was observed in many other studies, which seems to confirm the hypothesis of the sen-sory conditioning of mobility changes.8,11,12

279 Pol ann MeD. 2018;25(2):277–282
4.2. The influence of muscle stretching techni-ques on biomechanicsThe majority of recently published reports support the the-sis that stretching workout has a negative influence on mus-cular activity. This negative effect, known in literature as stretch-induced strength loss (SISL), concerns mainly the impact of pre-exercise SS and PNF. In people undergoing static stretching, researchers have noted a considerable loss of muscle strength (22% on average) and explosive force, as well as impaired quality of performance regarding many functions, e.g. vertical jump (mean reduction by 3%–4%), sprint (mean reduction by 2.4%), or bench press lying face up.13 This effect is transient in character and subsides with time. After 3 minutes of stretching, complete elimination of SISL in the lower leg muscles occurred only after 30 minutes, although in a study by Power et al. the quadri-ceps femoris strength loss (by 9.5%) and the decrease in the level of its activation (5.4%) persisted even after 2 h follow-ing stretching.14 It has been observed that stretching exerts a particularly adverse effect when it lasts over 60 s, while shorter sessions, below 45 s and 30 s, do not cause such sig-nificant changes in muscular work.13 Intense stretching, especially at the end range of physiological mobility, near the point of discomfort (POD), leads to a greater SISL ef-fect than less intensive activity. According to a study by Young et al., reducing the intensity of 2-minute stretching to 90% of POD eliminates its negative impact on a vertical jump result.15 PNF training has a comparably negative in-fluence on kinetic parameters and function. When applied immediately before the main workout, it adversely affects the forms of activity that requires maximum intensity per-formance, namely sprint, weight lifting or vertical jump. A study by Bradley compares and contrasts the effects of SS and PNF on vertical jump performance. The author noted the result deterioration by 4.1% and 5.0%, but this effect subsided completely 15 minutes after the intervention.16 Yet another study by Marek demonstrates a negative impact of PNF on muscular strength and power.17 A good alterna-tive to static stretching and PNF is dynamic stretching.18 Research comparing the influence of SS and DS on vertical jump, conducted in a group of 11 athletes, demonstrated the occurrence of the SISL effect only in the SS group, whereas the DS group presented improvement in the jump results.19 Similar findings were observed when testing balance, the upper limb pace, and agility, where negative influence typi-cal of SS application did not occur after dynamic stretching; on the contrary, improvement was noted in the results con-cerning the areas observed.20
4.3. Application of stretching in physiotherapyA common indication for stretching is prevention of con-tractures and muscle shortening. This is the case when immobilization or dysfunction may lead to restrictions of mobility, and also when patients are at risk of muscle shortening resulting from paresis. The key to understand-ing muscle length changes as an adaptive process seems to lie in muscular activity in the course of immobilization.21
Animal testing has provided a chance of comparing the effects of passive stretching and passive stretching with contraction on the soleus muscle length after the Achilles tendonectomy. Passively stretching the muscle for 20 min-utes daily, under anaesthesia, did not have any impact on reducing the number of sarcomeres. It was only after ap-plying muscular contractions simultaneously with passive stretching that the loss of sarcomeres in the sequence was prevented. Negative results were also obtained when exam-ining the influence of passive stretching on denervated or anaesthetized muscles, which indicates that the method is ineffective as prevention of muscular contractures.22,23 The outcome of work with patients having contractures after the spinal cord lesion is equally dissatisfying. The analysis of 24 studies on effectiveness of contracture prevention revealed lack of clinical impact of stretching on patients after spi-nal injuries both in terms of shortterm effects (first degree improvement) and longterm effects (no improvement).24 In fact, these conclusions are similar to the inferences in this scope of work with neurological patients in general. Accord-ing to Katalinic et al. there is no possibility of effectively preventing contractures by means of regular stretching, and a different form of therapy is needed.25 When the course of therapy is aimed at preventing contractures and restoring normal mobility in orthopaedic patients considerably better results are achieved. Stretching is a confirmed method of restoring normal ROM in patients after knee replacement. Two weeks of training may increase the range of movement by 19.9%–25.3%, depending on the method used.6
Another group of patients includes those with pain as the main therapeutic problem. Possibilities of working with those individuals are confirmed in a study by Levit and Simons, who achieved immediate improvement in 94% of patients through the application of postisometric relaxa-tion.26 A significant improvement caused by stretching was also noted in a 12-month observation of patients with neck pain. The effect was similar after applying only stretching and stretching combined with muscle strengthening,27 even though it is usually more effective to apply stretching with strengthening, a phenomenon revealed by researchers from Cochrane in 2015.28 Patients suffering from low back pain (LBP) may also be significantly relieved after stretching. The result is comparable to the effectiveness of yoga and concerns 51% of the individuals subject to observation over 26 weeks, in whom the mitigation of symptoms was signifi-cant or complete.29 DS when combined with spine stabili-zation is recommended to regain optimal elasticity and to minimize the risk of irreversible structural changes and oc-currence of LBP.30
4.4. Influence of stretching on athletic injury preventionSince the 1980s it has been widely accepted that muscle stretching reduces the risk of sports injuries. That is why different forms of stretching are commonly applied as an el-ement of preparation for workout. However, up-to-date re-ports show that this approach is not scientifically proven, and

280 Pol ann MeD. 2018;25(2):277–282
may sometimes even lead to the opposite effect, increasing the risk of injuries.31 The majority of recent studies, as well as systematic reviews repeated over the last years, question the influence of stretching on the incidence of injuries.32–34 The ranking of 5 exercises most commonly applied in the frame-work of injury prevention in football does not include any form of stretching, and instead enumerates eccentric train-ing, training of balance, proprioception, global stability and the gluteus maximus activation.35 This opinion appears to have been shared by sports physicians during the 2014 FIFA final; in their view the most common injury risk factors in-cluded a previous injury, fatigue, muscular imbalances and poor physical capacity. Stretching was not regarded as a com-monly recommended training method.36 It is thus possible to assume that stretching in sports, especially professional sports, is becoming less trendy, although its influence on in-jury incidence, especially within ligaments and muscle-ten-don units, should be taken into account and analysed in fur-ther research. In a study comprising 1538 American recruits the incidence of injuries was significantly lower in a group practicing stretching than in the control group, and muscle tears were noted 5 times less frequently.37 Similar results were achieved by Hadała after introducing stretching to the train-ing of America’s Cup regatta participants.38
5. DISCUSSION Diversity of potential techniques and the intuitively felt need to stretch out suggest that this activity should be effec-tive and that it is worthwhile to stretch muscles. And yet the material discussed above undermines, at least partially, reli-ability of this approach. The most surprising part is the fact that the very effect of stretching on the actual tissue length remains unclear. The sensory theory put forward by Mag-nusson and later on confirmed by other researchers reduces stretching exclusively to the process of modifying stretch tolerance, which abolishes the basic assumption of muscle stretching as a plastic process with a permanent effect.8,11,12 Although some studies demonstrate different results, the discrepancies in the findings do not allow us to unanimous-ly determine whether we are able to stretch muscles, or just increase our resistance to stretching stimuli.
The effectiveness of stretching in athletic injury preven-tion is lower than commonly expected. Numerous studies conducted over the years, particularly systematic reviews, indicate that there is almost no relationship between flex-ibility improved through stretching and a decrease in the incidence of injuries.32,34
The findings of the research concerning effects of stretching on contracture formation and prevention in neurological patients clearly and undoubtedly demonstrate ineffectiveness of this form of therapy, which, therefore, should not be applied.24
The effectiveness of stretching in the field of physio-therapy is unquestionable. The ROM alteration, no matter if sensed subjectively, involving an increase in tolerance to
stretch, or existing in reality, is well documented and refers to all the therapy types to a very similar extent. Both static and dynamic techniques, as well as those with initial con-traction have proved to be effective tools in counteracting contracture formation and in restoring the normal range of movement.39,40 Although the negative effect that SS and PNF techniques exert on certain biomechanical parameters (SISL) may be of concern, replacing them with DS elimi-nates this effect, preserving beneficial results of work on mobility.19,41 Dynamic stretching positively affects ROM, balance, agility, vertical jump and strength.18–20
The application of stretching techniques in pain man-agement has strong scientific basis. The pioneer study by Levit and Simons, demonstrates enormous (90%) efficiency of this course of treatment.26 Various stretching techniques have proved to be effective in treating impingement syn-drome in the shoulder joint, neck pain and LBP.27,29,42 Those findings and similar results of other studies in the area of orthopaedic physiotherapy give us hope that correctly ap-plied stretching adjusted to a particular dysfunction may ef-fectively help patients with pain.
6. CONCLUSIONS
(1) Stretching is an effective method in relieving pain in many musculoskeletal dysfunctions
(2) The effectiveness of stretching in athletic injury preven-tion is lower than commonly expected.
(3) Stretching should not be recommended as a contracture prevention method applied to neurological patients.
(4) PNF and SS forms of stretching should not be per-formed prior to exercise due to their negative influence on biomechanics.
(5) Stretching is an effective method of improving ROM, though some researchers claim its efectiveness is only due to the modified stretch tolerance of elongated tis-sues.
Conflict of interestNone declared.
References1 Weppler CH, Magnusson SP. Increasing muscle extensibi-
lity: a matter of increasing length or modifying sensation? Phys Ther. 2010;90(3):438–449. https://doi.org/10.2522/ptj.20090012.
2 Puentedura EJ, Huijbregts PA, Celeste S, et al. Immediate effects of quantified hamstring stretching: hold-relax pro-prioceptive neuromuscular facilitation versus static stret-ching. Phys Ther Sport. 2011;12(3):122–126. https://doi.or-g/10.1016/j.ptsp.2011.02.006.
3 Lim K-I, Nam H-C, Jung K-S. Effects on hamstring mu-scle extensibility, muscle activity, and balance of different stretching techniques. J Phys Ther Sci. 2014;26(2):209–213. https://doi.org/10.1589/jpts.26.209.

281 Pol ann MeD. 2018;25(2):277–282
4 Ryan ED, Beck TW, Herda TJ, et al. The time course of musculotendinous stiffness responses following diffe-rent durations of passive stretching. J Orthop Sports Phys Ther. 2008;38(10):632–639. https://doi.org/10.2519/jo-spt.2008.2843.
5 Yuktasir B, Kaya F. Investigation into the long-term effects of static and PNF stretching exercises on range of motion and jump performance. J Bodyw Mov Ther. 2009;13(1): 11–21. https://doi.org/10.1016/j.jbmt.2007.10.001.
6 Chow TPY, Ng GYF. Active, passive and proprioceptive neu-romuscular facilitation stretching are comparable in impro-ving the knee flexion range in people with total knee replace-ment: a randomized controlled trial. Clin Rehabil. 2010;24(10): 911–918. https://doi.org/10.1177/0269215510367992.
7 Davis DS, Ashby PE, McCale KL, McQuain JA, Wine JM. The effectiveness of 3 stretching techniques on hamstring flexibility using consistent stretching parameters. J Strength Cond Res. 2005;19(1):27–32. https://doi.org/10.1519/14273.1.
8 Magnusson SP. Passive properties of human skeletal muscle during stretch maneuvers. A review. Scand J Med Sci Sports. 1998;8(2):65–77. https://doi.org/10.1111/j.1600-0838.1998.tb00171.x.
9 Halbertsma JP, Göeken LN. Stretching exercises: effect on passive extensibility and stiffness in short hamstrings of he-althy subjects. Arch Phys Med Rehabil. 1994;75(9):976–981.
10 Ben M, Harvey LA. Regular stretch does not increase muscle extensibility: a randomized controlled trial. Scand J Med Sci Sports. 2010;20(1):136–144. https://doi.org/10.1111/j.1600--0838.2009.00926.x.
11 Law RYW, Harvey LA, Nicholas MK, Tonkin L, De So-usa M, Finniss DG. Stretch exercises increase tolerance to stretch in patients with chronic musculoskeletal pain: a ran-domized controlled trial. Phys Ther. 2009;89(10):1016–1026.https://doi.org/10.2522/ptj.20090056.
12 Ylinen J, Kankainen T, Kautiainen H, Rezasoltani A, Kuuk-kanen T, Häkkinen A. Effect of stretching on hamstring mu-scle compliance. J Rehabil Med. 2009;41(1):80–84. https://doi.org/10.2340/16501977-0283.
13 McHugh MP, Cosgrave CH. To stretch or not to stretch: The role of stretching in injury prevention and performance. Scand J Med Sci Sport. 2010;20(2):169–181.
14 Power K, Behm D, Cahill F, Carroll M, Young W. An acu-te bout of static stretching: effects on force and jumping performance. Med Sci Sports Exerc. 2004;36(8):1389–1396. https://doi.org/10.1249/01.MSS.0000135775.51937.53.
15 Young W, Elias G, Power J. Effects of static stretching vo-lume and intensity on plantar flexor explosive force pro-duction and range of motion. J Sports Med Phys Fitness. 2006;46(3):403–411.
16 Bradley PS, Olsen PD, Portas MD. The effect of static, ballistic, and proprioceptive neuromuscular facilitation stretching on vertical jump performance. J Strength Cond Res. 2007;21(1):223–226. https://doi.org/10.1519/00124278-200702000-00040.
17 Marek SM, Cramer JT, Fincher AL, et al. Acute Effects of Static and Proprioceptive Neuromuscular Facilitation Stret-ching on Muscle Strength and Power Output. J Athl Train. 2005;40(2):94–103.
18 Behm DG, Chaouachi A. A review of the acute effects of static and dynamic stretching on performance. Eur J Appl Physiol. 2011;111(11):2633–2651. https://doi.org/10.1007/s00421-011-1879-2.
19 Hough PA, Ross EZ, Howatson G. Effects of dynamic and static stretching on vertical jump performance and elec-tromyographic activity. J Strength Cond Res. 2009;23(2): 507–512. https://doi.org/10.1519/JSC.0b013e31818cc65d.
20 Chatzopoulos D, Galazoulas C, Patikas D, Kotzamanidis C. Acute effects of static and dynamic stretching on balance, agility, reaction time and movement time. J Sports Sci Med. 2014;13(2):403–409.
21 van Dyke JM, Bain JLW, Riley D a. Preserving sarcomere number after tenotomy requires stretch and contraction. Muscle Nerve. 2012;45(3):367–375. https://doi.org/10.1002/mus.22286.
22 Coutinho EL, Gomes ARS, França CN, Oishi J, Salvini TF. Effect of passive stretching on the immobilized soleus musc-le fiber morphology. Braz J Med Biol Res. 2004;37(12):1853–1861. https://doi.org/10.1590/S0100-879X2004001200011.
23 Gomes ARS, Coutinho EL, França CN, Polonio J, Salvini TF. Effect of one stretch a week applied to the immobilized soleus muscle on rat muscle fiber morphology. Braz J Med Biol Res. 2004;37(10):1473–1480. https://doi.org/10.1590/S0100-879X2004001000005.
24 Katalinic OM, Harvey LA, Herbert RD, Moseley AM, Lan-nin NA, Schurr K. Stretch for the treatment and prevention of contractures. Cochrane Database Syst Rev. 2010;(9):CD007455. https://doi.org/10.1002/14651858.CD007455.pub2.
25 Katalinic OM, Harvey LA, Herbert RD. Effectiveness of stretch for the treatment and prevention of contractures in pe-ople with neurological conditions: a systematic review. Phys Ther. 2011;91(1):11–24. https://doi.org/10.2522/ptj.20100265.
26 Lewit K, Simons DG. Myofascial pain: relief by post-isome-tric relaxation. Arch Phys Med Rehabil. 1984;65(8):452–456.
27 Häkkinen A, Kautiainen H, Hannonen P, Ylinen J. Strength training and stretching versus stretching only in the tre-atment of patients with chronic neck pain: a randomized one-year follow-up study. Clin Rehabil. 2008;22(7):592–600. https://doi.org/10.1177/0269215507087486.
28 Gross A, Kay TM, Paquin J-P, et al. Exercises for mechanical neck disorders. Cochrane Database Syst Rev. 2015;1:CD004250. https://doi.org/10.1002/14651858.CD004250.pub5.
29 Sherman KJ, Cherkin DC, Wellman RD, et al. A randomi-zed trial comparing yoga, stretching, and a self-care book for chronic low back pain. Arch Intern Med. 2011;171(22): 2019–2026. https://doi.org/10.1001/archinternmed.2011.524.
30 Hadała M, Gryckiewicz S. Movement pattern and musc-le balance as a source of lumbar spine health according to the concept of Kinetic Control. Pol Ann Med. 2014;21(2): 152–157. https://doi.org/10.1016/j.poamed.2014.06.001.
31 Shrier I. When and whom to stretch? Gauging the bene-fits and drawbacks for individual patients. Phys Sportsmed. 2005;33(3):22–26. https://doi.org/10.3810/psm.2005.03.61.
32 Lewis J. A systematic literature review of the relationship between stretching and athletic injury prevention. Or-thop Nurs. 2014;33(6):312–320. https://doi.org/10.1097/NOR.0000000000000097.
33 Weldon SM, Hill RH. The efficacy of stretching for pre-vention of exercise-related injury: a systematic review of the literature. Man Ther. 2003;8(3):141–150. https://doi.org/10.1016/S1356-689X(03)00010-9.
34 Yeung SS, Yeung EW, Gillespie LD. Interventions for preventing lower limb soft-tissue running injuries. Co-chrane Database Syst Rev. 2011;(7):CD001256. https://doi.org/10.1002/14651858.CD001256.pub2.

282 Pol ann MeD. 2018;25(2):277–282
35 McCall A, Carling C, Nedelec M, et al. Risk factors, te-sting and preventative strategies for non-contact injuries in professional football: current perceptions and practi-ces of 44 teams from various premier leagues. Br J Sports Med. 2014;48(18):1352–1357. https://doi.org/10.1136/bjsports-2014-093439.
36 McCall A, Davison M, Andersen TE, et al. Injury preven-tion strategies at the FIFA 2014 World Cup: perceptions and practices of the physicians from the 32 participating natio-nal teams. Br J Sports Med. 2015;49(9):603–608. https://doi.org/10.1136/bjsports-2015-094747.
37 Pope RP, Herbert RD, Kirwan JD, Graham BJ. A randomized trial of preexercise stretching for prevention of lower-limb injury. Med Sci Sports Exerc. 2000;32(2):271–277. https://doi.org/10.1097/00005768-200002000-00004.
38 Hadala M, Barrios C. Different strategies for sports inju-ry prevention in an America’s Cup yachting crew. Med Sci Sports Exerc. 2009;41(8):1587–1596. https://doi.org/10.1249/MSS.0b013e31819c0de7.
39 Magnusson SP, Aagard P, Simonsen E, Bojsen-Møller F. A biomechanical evaluation of cyclic and static stretch in hu-man skeletal muscle. Int J Sports Med. 1998;19(5):310–316. https://doi.org/10.1055/s-2007-971923.
40 Marshall PWM, Cashman A, Cheema BS. A randomized controlled trial for the effect of passive stretching on me-asures of hamstring extensibility, passive stiffness, strength, and stretch tolerance. J Sci Med Sport. 2011;14(6):535–540. https://doi.org/10.1016/j.jsams.2011.05.003.
41 Manoel ME, Harris-Love MO, Danoff J V, Miller TA. Acute effects of static, dynamic, and proprioceptive neuromuscular facilitation stretching on muscle power in women. J Strength Cond Res. 2008;22(5):1528–1534. https://doi.org/10.1519/JSC.0b013e31817b0433.
42 Al Dajah SB. Soft Tissue Mobilization and PNF Improve Range of Motion and Minimize Pain Level in Shoulder Im-pingement. J Phys Ther Sci. 2014;26(11):1803–1805. https://doi.org/10.1589/jpts.26.1803.

283 Pol ann MeD. 2018;25(2):283–285
Letter to the Editor
Ernest Lad Heisten IV
Ohio State University Alumni Association, Columbus, OH, USA
Corresponding author: Ernest Lad Heisten IV, 3669 Dragonfly Dr., Columbus Ohio, 43204 United States. Tel.: +1614 260-0125.
E-mail address: [email protected].
Poland may be a high risk area for multiple sclerosis based on weather patterns
article info
Art ic l e h i s toryReceived 28 May 2017Accepted 6 July 2017Available online 24 April 2018
Keywords HyponatremiaHepatic encephalopathyLiver cirrhosis
Doi 10.29089/2017.17.00035
User l i cense This work is licensed under a Creative Commons Attribution –NonCommercial – NoDerivatives 4.0 International License.
Journal homepage: https://www.paom.pl
Polish Annals of Medicine
1. INTRODUCTION
Information on multiple sclerosis (MS) in Poland has been sparse historically. Few studies have been conducted and the few that have were very localized. The only two of note were a comparison study conducted between 1965 and 1981 rates1 and a very recent study of a single region south of Warsaw.2 The latter was not comprehensive enough to de-termine associations between MS prevalence and weather in Poland, and the former may have been faulty based on a less obvious fact that was highlighted by the latter study: MS rates were shown to be much lower in men than they were in women. With a prevalence in the former of 69.7 and in the latter of 159.6 for an average rate of 115.7/100 000. The former study showed a rough average of preva-lence of 61.11/100 000 in 1965 and 45.08/100 000 in 1981. This would lead the author of this article to suspect that the former study was only analyzing the rates of men for whatever reason. As for the latter study, its prevalence rate would appear to be more consistent with the weather pat-
terns of Poland and the rates that would be expected under such weather patterns if a recent study of MS prevalence and average weather was considered. That study3 showed that MS prevalence rates peaked at 8°C, which is the same temperature at which the TRPM8 temperature receptor in the body is known to have the highest activity. The Brola et al. study was conducted in the region of Świętokrzyskie where, according to the Norwegian Meteorological Insti-tute, the average temperature was 7.99°C4 at its capital city of Kielce. This is not very different from the temperature for peak prevalence and the apparently high prevalence rate of 115.7/100 000 may reflect that.
In the Wender et al. study of 1985 there was one study lo-cation that was noted for having a high prevalence rate: That of Leszno, of which the rate was 96.22/100 000 in 1965 and 130.97/100 000 in 1981. That location had an average tem-perature of 7.75°C. If those rates were adjusted for possible gender bias it would give a rate of 158.8/100 000 in 1965 and 217.4/100 000 in 1981. The difference between these two preva-lence rates was addressed in that study as being due to an in-

284 Pol ann MeD. 2018;25(2):283–285
crease in the population of individuals under the age of 25: MS typically does not show symptoms until at least a person’s late 20s. In addition it was noted that there was an almost equal number of definite cases between 1965 and 1981: 1302 in 1965 vs. 1244 in 1981. The only major change was in probable cases: 255 in 1965 vs. 64 in 1981. It’s the author’s opinion that this reflects improvements in diagnostic criteria and education about MS symptoms rather than any real change in MS cases. Leszno’s increase was not explained in Wender et al. and may well be due to an increase in definite cases over probably cases stemming from better diagnostic methods.
There is the established fact that Poland has many areas with an average temperature range that is what could be the danger zone for MS prevalence. The only mitigating factor in the fact that variation from that average temperature is very wide compared to the UK, where the low variation from the peak TRPM8 reactivity temperature produces the highest MS rates in the world of 193/100 000 in the Orkney Islands6 and 152/100 000 in the Shetland Islands7 (Table 1). These areas have an average variation from their average temperatures of 7.83°C and 7.125°C, respectively, of less than 4°C difference.4 In Poland the variation is 7°C–8°C difference from the average tempera-tures of the locations of consideration mentioned here. It needs to be recognized, regardless, that much of Poland appears to have an average temperature around 8°C, with Gniezno having an average temperature of 8.21°C and Leszno an average tem-perature of 7.90°C.4 If these locations are indicative of average temperature in the rest of the country then it is possible that MS could be much more widespread and serious in Poland that what is currently accepted.
2. AIM
To determine if Poland’s MS prevalence rate could be esti-mated based on other location with the same average yearly temperature range of between 7°C–9°C.
3. MATERIAL AND METHODS
Variation from average yearly temperature was measured by regression line analysis for locations of MS prevalence with an average yearly temperature that were specific locations (not regions) and had an average yearly temperature 7°C–9°C. The results were considered significant if P < 0.05.
4. RESULTS
Variation away from this average temperature is a significant factor in the aggravation or mitigation of MS prevalence rates (Table 1, Figure 1). Regression line analysis of the variation from the average yearly temperature vs. MS prevalence rate was significant (P < 0.001).
5. DISCUSSION
In regards to the other locations themselves most of these are located in or near the British Isles,6–13 which is noted for having the highest MS prevalence rates in the world. Berne, Switzerland14 and the Gorski Kotar region of Croa-tia15 are noteworthy for having high MS prevalence rates without possessing the same northern latitude of the other locations. Both possess their low average yearly tempera-ture due to their high altitude locations and correspond-ing mountain weather effects instead of a high northern latitude.
Table 1. Locations of MS prevalence rates used in this study.
Location Variation from average yearly temperature
MS preva-lence per 100 000
Average yearly tem-
perature
Leszno, Poland 7.903523384 130.971 7.7754
Gniezno, Poland 7.4704062614 122.831 8.2166666674
Shetland Islands, UK 3.214 1527 7.1254
Gothenburg, Sweden 6.74 9612 7.784
Kielce, Poland 7.9986930754 115.72 8.314
Berne, Switzerland 6.6980944834 11014 8.6416666674
Montrose, UK 4.2478069214 1849 8.5254
Edinburgh, UK 4.2806824724 18710 8.7666666674
County Donegal, Ireland 3.8950920944 1848 8.1583333334
Orkney Islands, UK5 3.3789006644 1936 7.8333333334
Aberdeen, UK 4.1464387794 14511 8.1254
Copenhagen, Denmark 6.2288186534 11213 8.24
Gorski Kotar, Croatia 6.7935575545 12415 7.385
Average Yearly Variation C3
80
100
120
140
160
180
200
4 5 6 7 8 9
Variation from Average YearlyTemperature Vs MS Prevelance
Mul
tiple
Scl
eros
is P
reve
lanc
e Pe
r 100
000
Figure 1. Average variation from average yearly tempe-rature plotted vs. MS prevalence rates. The association was P < 0.0017.

285 Pol ann MeD. 2018;25(2):283–285
6. CONCLUSIONS
Poland’s variation from average temperature is higher than the other tested locations, which likely mitigates MS prevalence in this country below those locations. Regardless, Poland’s MS prevalence could be expected to be above 105/100 000 based on the resulting trendline for this association.
Conflict of interestAuthor declare to have no conflict of interest.
AcknowledgementsThis research was conducted independently and not on be-half of the Ohio State Alumni Association. No conflict of interest exists in this relationship.
References1 Wender M, Pruchnik-Grabowska D, Hertmanowska H,
et al. Epidemiology of multiple sclerosis in Western Po-land – a comparison between prevalence rates in 1965 and 1981. Acta Neurol Scand. 1985;72(2):210–217. https://doi.org/10.1111/j.1600-0404.1985.tb00866.x.
2 Brola W, Sobolewski P, Flaga S, et al. Prevalence and incidence of multiplesclerosis in central Poland, 2010–2014. BMC Neurol. 2016;16:134. https://doi.org/10.1186/s12883-016-0662-8.
3 Heisten E. Peak TRPM8 Activity is associated with MS prevalence [in print].
4 Norwegian Meteorological Institute Average Yearly Temperature Reports for listed locations. https://www.yr.no. Accessed: April 4, 2018.
5 Croatian Meteorlogical Institute. Average Yearly tempe-rature for Gorski Kotar region. (Parg). http://klima.hr/klima.php?id=k1¶m=srednjak&Grad=parg. Ac-cessed: April 4, 2018.
6 Cook SD, Cromarty JI, Tapp W, Poskanzer D, Walker JD, Dowling PC. Declining incidence of multiple Sclerosis in the Orkney Islands. Neurology. 1985;35(4):545–551. https://doi.org/10.1212/WNL.35.4.545.
7 Poskanzer DC, Prenney LB, Sheridan JL, Kondy JY. Multiple sclerosis in the Orkney and Shetland Islands. I: Epidemiology, clinical factors, and methodology. J Epi-demiol Community Health. 1980;34(4):229–239. https://doi.org/10.1136/jech.34.4.229.
8 McGuigan C, McCarthy A, Quigley C, Bannan L, Haw-kins S, Hutchinson M. Latitudinal variation in the pre-valence of multiple sclerosis in Ireland, an effect of ge-netic diversity. J Neurol Neurosurg Psychiatry. 2004;75(4): 572–576. http://dx.doi.org/10.1136/jnnp.2003.012666.
9 Forbes RB, Wilson SV, Swingler RJ. The prevalence of multiple sclerosis in Tayside, Scotland: do latitudinal gradients really exist? J Neurol. 1999;246(11):1033–1040. https://doi.org/10.1007/s004150050509.
10 Rothwell P, Charlton D. High incidence and preva-lence of multiple sclerosis in south east Scotland: evi-dence of a genetic predisposition. J Neurol Neurosurg Psychiatry. 1998;64(6):730–735. https://doi.org/10.1136/jnnp.64.6.730.
11 Phadke JG, Downie AW. Epidemiology of multiple scle-rosis in the north-east (Grampian region) of Scotland–an update. J Epidemiol Community Health. 1987;41(1):5–13. https://doi.org/10.1136/jech.41.1.5.
12 Svenningsson A, Runmarker B, Lycke J, Andersen O. Inci-dence of MS during two 15 year periods in the Gothenburg region of Sweden. Acta Neurol Scand. 1990;82(3):161–168. https://doi.org/10.1111/j.1600-0404.1990.tb04483.x.
13 Koch-Henriksen N. The Danish Multiple Sclerosis Re-gistry: a 50-year follow-up. Mult Scler. 1999;5(4):293–296. https://doi.org/10.1177/135245859900500418.
14 Beer S, Jurg K. High Prevalence of Multiple Sclerosis in Switzerland. Neuroepidemiology. 1994;13(1–2):14–18. https://doi.org/10.1159/000110353.
15 Sepcic J, Materljan E, Antonelli L, Sepcic-Grahovac D. Multiple Sclerosis Cluster in Gorski-Kotar, Croatia, Yugo-slavia. In: Battagia MA, ed. Multiple sclerosis research. Am-sterdam: Elsevier Science Publishers; 1989:165–169.

Reviewer AcknowledgmentThe Editors gratefully acknowledge the kind assistance of the following researchers, whose reviews of the manuscripts for Polish Annals of Medicine were published in 2018.
Kahairi Abdullah, MalaysiaAgnieszka Adamska, Poland Gul Akdogan, Turkey Masoome Bakhshayesh, IranAshraf Mohamed Barakat, EgyptOlga M Bazanova, Russian FederationNgeri Benebo, NigeriaJan D Bos, NetherlandsThomas Brodowicz, AustriaRiki Brown, IsraelEwa Bryl, PolandRobert Bucki, United States of AmericaArie Burstin, IsraelJessica Caninii, ItalyJorge Santos Castro, Portugal Wen Chieh Chen, GermanyPiotr Chomik, Poland Christina Ciecierski, United States of AmericaAnna Cieślińska, PolandRoberto Codella, Italy Margaret Czart, United States of America Michal Dwornik, Poland Ewa Dzika, PolandTomasz Giżewski, United KingdomRobert Gniadecki, DenmarkAna Gonzáles, BrazilWaldemar J Grzegorzewski, Poland Piotr K Jakubowski, Poland Andrzej M Janczewski, Poland Maciej Janeczek, PolandMarek K Jurkowski, PolandWojciech Kiebzak, Poland Wojciech Kloc, Poland Katarzyna Kubiak, PolandJacek M Kwiecień, Poland
Wojciech J Lebkowski, Poland Malgorzata Lepczynska, PolandLongjiang Li, ChinaYi Li, China Marios Loukas, West IndiesWojciech Maksymowicz, Poland Bartosz Malkiewicz, Poland Natalia Marek-Trzonkowska, PolandKetan Modi, United States of AmericaSanjeev Mohanty, India Maitreyee M. Mukherjee, IndiaAfshin Nazari, IranChijoke Nwakanma, NigeriaJurgen Pannek, Switzerland Dariusz Pawlak, PolandJoanna Pienkowska, Poland Juozas Raistenskis, Lithuania Piotr Siwik, Poland Andrzej Slominski, United States of AmericaVasiliy B Smychek, Belarus Jadwiga Snarska, Poland Przemysław Sobiech, PolandTomasz Stompór, Poland Birutė Strukčinskienė, LithuaniaMichał Szałwiński, Poland Zbigniew Śliwiński, PolandMariola Świderek-Matysiak, PolandZbigniew Tarkowski, PolandMiguel Angel Torres Torres, MexicoJanusz Trzebicki, Poland Yoshinori Tsurusaki, Japan Katarzyna A Zaborowska-Sapeta, PolandTadeusz Zechowicz, Poland Ewa Żukowska-Szczechowska, Poland Jacek Zwiernik, Poland
Journal homepage: https://www.paom.pl
Polish Annals of Medicine

INTERNATIONAL MULTIDISCIPLINARY CONFERENCE
REHABILITATIONYESTERDAY – TODAY – TOMORROW
10th anniversary of the Department and Clinic of Rehabilitation establishementSchool of Medicine, Collegium Medicum, University of Warmia and Mazury in Olsztyn
19–20 October 2018 Hotel Krasicki in Lidzbark Warmiński, Poland
PRELIMINARY PROGRAMME
SESSION I Neurosurgery and Neurorehabilitation / Adult SpondyloorthopedicsSESSION II Children Spondyloorthopedics and Rehabilitation – part ASESSION III Children Spondyloorthopedics and Rehabilitation – part B
SESSION IV Neuroorthopedics and RehabilitationSESSION V Hand with spastic paresis in Celebral Palsy
SESSION VI Vascular, surgical, technological aspects and pain in rehabilitationSESSION VII Swallowing disorders and feeding in rehabilitation
SESSION VIII Physiotherapy
WORKSHOP
1. Introduction to the Vitality Flossing method2. Kinetic control - modern motor control training in physiotherapy3. The goals of treatment in rehabilitation useing Virtual Reality tech
4. Civil law liability of physiotherapists in the light of the new law
More information: http://www.konferencja.rin.olsztyn.pl/index.php/en/ORGANIZATION OFFICE ul. Żołnierska 18 a, 10-561 Olsztyn, tel./fax: 89 539 32 83, e-mail: [email protected]

Abstracted/indexed in:EBSCO Publishing Inc., Scopus, EMBASE, Academic Search Complete,Polska Bibliografia Lekarska, Index Copernicus and Ministry of Science and Higher Education