The Los Angeles Smog Problem - Center for Ethnography
11
The Los Angeles Smog Problem PAUL L. MAGILL Stanford Research Institute, Stanford, Calif. The smog of Los Angeles is unique in that it sometimes produces severe and disagreeable eye irritation. In com- mon with the smog in other parts of the country, how- ever, it also imparts a murkiness to the atmosphere. Eye irritation is severe on some twenty occasions during a year, and then in only limited areas and for relatively brief periods of time. Reduced visibility in connection with smog occurs very much more frequently. The peculiar meteorology of the Los Angeles area appears to be decisive in controlling the time and duration of eye-irritating smog. Studies of meteorological influences have revealed an empirical correlation between certain meteorological factors and the time of occurrence of eye irritation from smog. This correlation gives promise of being useful as a means of forecasting such smog. The nature of the sub- stances in smog that cause the eye irritation is not yet known. Work on this problem is currently progressing by the invention of improved ways to collect and identify the particles that compose smog, and by determining, under laboratory conditions, the eye-irritating properties of these substances in various aerosol forms in a specially built “smog chamber.” OF ALL the industrial cities in the United States, why is Los Angeles so peculiarly a victim of smog—that unhappy com- bination of atmospheric pollutants which produces eye irritation and reduced visibility? In order to answer this question and to find out what smog is and where it comes from, the Stanford Research Institute is con- ducting an extensive research on the subject for the Committee on Smoke and Fumes of the Western Oil and Gas Association. “Smog” is a term made up by combining parts of the two words “smoke” and “fog.” Properly applied to the Los Angeles County region, it denotes an abnormal weather condition in which man- made contaminants in the air mingle with haze or fog to produce a dense smoky atmosphere. It results in a sharp reduction in visibility, and causes irritation of the eyes and sometimes of the nose and throat. It is the eye-irritating aspect of smog about which people complain the most bitterly, and the results pre- sented in this paper refer principally to an investigation of the causes of eye irritation. The murkiness of the atmosphere and the poor visibility encountered are not to be discounted and are being actively investigated; the results of this study will be reported in a later paper. Unpleasant odors are also sometimes associated in public com- plaints with smoggy weather conditions, but they almost in- variably arise from local, easily identifiable sources and are not genuinely connected with the more general and characteristic- aspects of smog. FREQUENCY OF SMOG OCCURRENCE Smog of the type which irritates the eyes is severe in the Los Angeles basin 10 or 20 times a year, in attacks lasting 4 hours or less and occurring most frequently in the late morning hours of the summer and autumn months. It seldom occurs during stormy or cloudy weather. Although severe smog is not common, threshold smog con- ditions (or conditions approaching smog) occur with much greater frequency. During threshold days a certain percentage of people find that their eyes are irritated, and measurements show the number of times they must blink is greater than normal. On threshold days and severe smog days alike the eye irritation effects are likely to be fairly local. On the worst days recorded at least 85% of the people in the Los Angeles region, depending on location, consciously noticed smog effects (see Table I). HISTORY OF SMOG DISTURBANCES There are no written records, prepared by trained observers, concerning the eye-irritating effect of smog in past years. People who have lived in the Los Angeles County area for many years state positively that smog is not new ; re- ports of its presence date as far back as 1912. However, the consensus is that the frequency of smog and the severity of its eye-irritating effects have increased markedly during recent years. The same period of time has witnessed a re- markable growth in the population and indus- trialization of Los Angeles County. It seems logical to seek an explanation for the increased frequency and intensity of smog in the increased quantities of man-made contaminants ex- hausted into the air as a result of this growth. Other industrialized cities also have their air- pollution problems; those of Pittsburgh and St, Louis are notorious. There have been isolated instances of air contamination sufficient to cause eye irritation in New York, Chicago, Paris, and Rome, but in these cities it is a rare occurrence. Frequent and powerfully eye-irritating smog ap- pears to be peculiar to the Los Angeles area. SEPTEMBER OCTOBER NOVEMBER Figure 1. Public Reaction to Smog 2476 Downloaded via UNIV OF CALIFORNIA IRVINE on January 21, 2020 at 22:58:15 (UTC). See https://pubs.acs.org/sharingguidelines for options on how to legitimately share published articles.
-
Upload
khangminh22 -
Category
Documents
-
view
6 -
download
0
Transcript of The Los Angeles Smog Problem - Center for Ethnography

The Los Angeles Smog ProblemPAUL L. MAGILL
Stanford Research Institute, Stanford, Calif.
The smog of Los Angeles is unique in that it sometimesproduces severe and disagreeable eye irritation. In com-
mon with the smog in other parts of the country, how-ever, it also imparts a murkiness to the atmosphere.Eye irritation is severe on some twenty occasions during a
year, and then in only limited areas and for relatively briefperiods of time. Reduced visibility in connection withsmog occurs very much more frequently. The peculiarmeteorology of the Los Angeles area appears to be decisivein controlling the time and duration of eye-irritating smog.Studies of meteorological influences have revealed an
empirical correlation between certain meteorologicalfactors and the time of occurrence of eye irritation fromsmog. This correlation gives promise of being useful as a
means of forecasting such smog. The nature of the sub-stances in smog that cause the eye irritation is not yetknown. Work on this problem is currently progressing bythe invention of improved ways to collect and identify theparticles that compose smog, and by determining, underlaboratory conditions, the eye-irritating properties of thesesubstances in various aerosol forms in a specially built“smog chamber.”
OFALL the industrial cities in the United States, why is Los
Angeles so peculiarly a victim of smog—that unhappy com-
bination of atmospheric pollutants which produces eye irritationand reduced visibility?
In order to answer this question and to find out what smog isand where it comes from, the Stanford Research Institute is con-
ducting an extensive research on the subject for the Committee on
Smoke and Fumes of the Western Oil and Gas Association.“Smog” is a term made up by combining parts of the two words
“smoke” and “fog.” Properly applied to the Los Angeles Countyregion, it denotes an abnormal weather condition in which man-
made contaminants in the air mingle with haze or fog to produce a
dense smoky atmosphere. It results in a sharp reduction invisibility, and causes irritation of the eyes and sometimes of thenose and throat. It is the eye-irritating aspect of smog aboutwhich people complain the most bitterly, and the results pre-sented in this paper refer principally to an investigation of thecauses of eye irritation. The murkiness of the atmosphere and thepoor visibility encountered are not to be discounted and are beingactively investigated; the results of this study will be reported ina later paper.
Unpleasant odors are also sometimes associated in public com-
plaints with smoggy weather conditions, but they almost in-variably arise from local, easily identifiable sources and are notgenuinely connected with the more general and characteristic-aspects of smog.
FREQUENCY OF SMOG OCCURRENCE
Smog of the type which irritates the eyes is severe in the LosAngeles basin 10 or 20 times a year, in attacks lasting 4 hours or
less and occurring most frequently in the late morning hours ofthe summer and autumn months. It seldom occurs during stormyor cloudy weather.
Although severe smog is not common, threshold smog con-ditions (or conditions approaching smog) occur with much greaterfrequency. During threshold days a certain percentage of peoplefind that their eyes are irritated, and measurements show thenumber of times they must blink is greater than normal.
On threshold days and severe smog days alike the eye irritationeffects are likely to be fairly local. On the worst days recorded atleast 85% of the people in the Los Angeles region, depending on
location, consciously noticed smog effects (see Table I).HISTORY OF SMOG DISTURBANCES
There are no written records, prepared bytrained observers, concerning the eye-irritatingeffect of smog in past years. People who havelived in the Los Angeles County area for manyyears state positively that smog is not new ; re-
ports of its presence date as far back as 1912.However, the consensus is that the frequency ofsmog and the severity of its eye-irritating effectshave increased markedly during recent years.
The same period of time has witnessed a re-
markable growth in the population and indus-trialization of Los Angeles County. It seems
logical to seek an explanation for the increasedfrequency and intensity of smog in the increasedquantities of man-made contaminants ex-
hausted into the air as a result of this growth.Other industrialized cities also have their air-
pollution problems; those of Pittsburgh and St,Louis are notorious. There have been isolatedinstances of air contamination sufficient to cause
eye irritation in New York, Chicago, Paris, andRome, but in these cities it is a rare occurrence.
Frequent and powerfully eye-irritating smog ap-pears to be peculiar to the Los Angeles area.
SEPTEMBER OCTOBER NOVEMBER
Figure 1. Public Reaction to Smog2476
Dow
nloa
ded
via
UN
IV O
F C
AL
IFO
RN
IA I
RV
INE
on
Janu
ary
21, 2
020
at 2
2:58
:15
(UT
C).
See
http
s://p
ubs.
acs.
org/
shar
ingg
uide
lines
for
opt
ions
on
how
to le
gitim
atel
y sh
are
publ
ishe
d ar
ticle
s.

November 1949 INDUSTRIAL AND ENGINEERING CHEMISTRY 2477
CALIFORNIA STATE GROWTH
8,000,0006.000. 000 v
O4.000. 000 ¡2
2.000. 000
LOS ANGELES COUNTY GROWTH900.000. 000 >
700.000. 000 g500.000. 000 g
3.000. 000 g2.000. 000 i*
12
1.400.000 <
1.000. 000 800.000 P
5.000. 000
3.000. 000 >
2.000. 000 m
1.000. 000
Figure 2. Growth of California and LosAngeles County
PRELIMINARY CONSIDERATIONSIn order to clear the ground for research into the mechanism of
the smog and the properties of the contaminants it contains, in-vestigations were made of two preliminary considerations:
The relationship between smog as indicated by human ex-perience and smog as associated with a certain set of meteorologi-cal conditions.
The possibility that the climate of Los Angeles County mayhave undergone some change, resulting from increased populationor other causes, exclusive of the increase in man-made contamina-tion of the atmosphere.
Public Reaction to Eye Irritation. Although complaints ofsmog have been numerous, no very exact correlation of publiccomplaints of smog had been made prior to this investigation.Accordingly, a study of public reaction to smog was conductedfor the Stanford Research Institute by the American ResearchService, Los Angeles.
Interviewers questioned approximately 15,000 pedestrians in
Table I. Number of Persons Reporting Eye Irritation(September, October, November 1948)% of All Persons Interviewed
Who Complained of Eye No. of Blinks per_Irritation_ Minute, All Persons
Day and DateLos
Angeles GlendalePasa-dena
LosAngeles Glendale dena"
Sat. Sept. 11 57.2 17.3Sun. Sept. 12 45.7 13.4Mon. Sept. 13 43.9 13,4Tues. Sept. 14 74.7 25.0Wed. Sept. 15 69.4 23.3Thurs. Sept. 16 41,3 16,6Fri. Sept. 17 38.4 17.3
Sat. Sept. 18 40.3 22.0Sun. Sept. 19 25.4 16.3Mon. Sept. 20 20.0 16.9Tues. Sept. 21 27.6 16.7Wed. Sept. 22 20.3 17.1Thurs. Sept. 23 24.3 19.3Fri. Sept. 24 26.4 18.8
Sat. Sept. 25 23.1 15.5Sun. Sept. 26 18.2 13.7Mon. Sept. 27 30.0 17.0Tues. Sept. 28 60.0 18.6Wed. Sept. 29 85.2 25.8Thurs. Sept. 30 35.4 19.6Fri. Get. 1 32.4 19.3
Sat. Oct. 2 23.1 16.3Sun. Oot. 3 No interviews made No interviews madeMon. Oct. 4 26.1 17.1Tues. Oot. 5 33.1 18.2Wed. Oot. 6 47.2 20.4Thurs. Oot. 7 84.1 23.5Fri. Oot. 8 71.7 22.0
Sat. Oct. 9 33.0 17.4Sun. Oct. 10 29.4 15.6Mon. Oot. 11 34.1 19.0Tues. Oct. 12 36.4 17.3Wed. Oct. 13 28.4 15,9Thurs. Oct. 14 41.3 16.1Fri. Oot. 15 39.9 14.4
Sat. Oct. 19 36.6 47.3 34.6 14.4 18.4 13.3Sun. Oot. 17 31.4 18.2 27.6 14.5 15.7 12.7Mon. Oot. 18 22.3 14.3 17.3 15.0 14.5 14.2Tues. Oot. 19 34.3 15.0 17.4 15.5 15.4 10.9Wed. Oct. 20 30.4 20.9 28.8 16.4 17.4 14.4Thurs. Oct. 21 38.5 36.4 26.7 16.1 19.2 13.0Fri. Oct. 22 54.5 28.8 29.9 17.0 15.5 15.2
Sat. Oct. 23 46.1 25.5 34.0 16.9 19.8 18.0Sun. Oot. 24 28.8 4.3 22.4 15.5 18.6 17.7Mon. Oot. 25 40.8 45.8 29.8 15.0 23.8 17.5Tues. Oct. 26 50.8 49.0 45.4 17.2 23.4 19.0Wed. Oot. 27 35.7 25.5 39.6 16.1 20.9 15.5Thurs. Oot. 28 31.8 30.6 21.4 17.4 21.7 15.2Fri. Oct. 29 31.2 24.6 32.6 18.2 21.0 16.1
Sat. Oot. 30 21.0 16.8 14.8 16.5 19.5 19.4Sun. Oct. 31 ' 15.7 13.0 19.8 11.4 19.3 23.2Mon. Nov. 1 12.7 17.8 19.7 18.7 23.5 19.7Tues. Nov. 2 15.6 13.9 31.9 19.2 20,0 17.9Wed. Nov. 3 22.8 20.7 46.8 15.4 19.1 17.7Thurs. 33.3 26.4 31.8 12.6 19.3 20.0Fri. Nov. 5 30.0 14.2 22.4 13.7 19.1 20.4
In addition, an effort was made to find an objective measure ofdowntown Los Angeles, Pasadena, and Glendale during themorning and afternoon hours.
66 eF
64 eF.
62°F.
60 eF.
58°F.
56 °F.
1901 1906 1911 1916 1921 1926 1931 1936 1941 1946
Figure 3. Annual Mean TemperaturesPopulation figures for the City of Los Angeles for the sameperiod are: 102,479 in 1900; 319,198 in 1910; 576,673 in 1920;1,238,048 in 1930; and 1,504,277 in 1940. The metropolitan dis-trict of Los Angeles had 2,318,526 people in 1930 and 2,904,596
people in 1940
eye irritation. The blink rate per minute was considered as a
possible satisfactory standard. The blink rate and the number ofpersons reporting eye irritation were then plotted and, as may benoted from Figure 1, the average blink rate increases simul-taneously with the increase in the number of people reporting eyeirritation. The blink rate thus served generally as a check on thepresence of real eye irritation.
Another indication of the occurrence of smog is the number ofcomplaints that are telephoned in to the Los Angeles County AirPollution Control District offices. These are shown graphicallyin Figure 1, together with the Stanford Research Institute SmogIndex, described below.
As a result of the survey, several conclusions were reached:
1. The number of persons complaining of eye irritation variedfrom 4.3 to 85.2% (Table I), depending upon the conditions at thetime.
2. About 3 out of every 4 persons who complained of eyeirritation mentioned smog as the cause.
' 3. The percentage of people noticing eye irritation is approxi-mately the same in the cities of Pasadena, Glendale, and Los An-geles, but maximum eye irritation occurs approximately 1 hourlater in Pasadena and Glendale than in Los Angeles.

2478 INDUSTRIAL AND ENGINEERING CHEMISTRY VoL 41, No. 11
Figure 4. Los Angeles Noon Wet-Bulb Temperatures
During the course of the survey people were asked to give theiropinions as to the sources of smog. In Los Angeles 45.4% as-
signed factories as the cause of smog; 18.2% attributed it to auto-mobile fumes; 14.4% blamed smoke; 19.6% gave a variety ofreasons; 8.8% believed that it was due to climatic conditions;and 24.3% said they didn’t know (many people mentioned more
than one cause).Has the Climate Changed? The climate of the Los Angeles
area was studied to determine whether there had been any change,caused by increased population or any other factor, that might bereflected in the apparent increase in smog.
In the period from 1930 to 1946, the population of Los AngelesCounty increased at the rate of about 4% per year. The- motorvehicle registration and gasoline consumption increased at thesame rate. Fuel consumption for heating purposes doubled every6 years (Figure 2).
Effect of Human Habitation on Climate. There are a numberof ways in which increased human habitation may affect; climate
in a locality (11), in addition to the obvious factor of increasedcontamination of the air. Wind speed may be reduced by greaterair friction caused by new buildings; visibility may be reduced byan increase of moisture in the air, due to irrigation; and tempera-ture may be affected, in either direction, by air pollution. Therecords on each of these factors were studied.
Temperature. Temperature readings at the Los AngelesWeather Station have been tabulated for the period from 1878 to1946. In this time, there has been an approximate increase of 1,9"in the mean temperature (Figure 3).
This increase, however, does not seem to have any bearing on
smog, except that perhaps it may be a result of it—that is, thedensity of the covering canopy of smoke and fumes may conservethe heat in the area, producing a so-called “greenhouse effect.''
Humidity. When the relative humidity of the air is high (be-tween 85 and 100%), visibility is likely to be lower than during a
dry day, assuming a constant wind speed. Data from LongBeach, the University of California at Los Angeles, and SantaMaria show that visibility may drop from between 5 and 10 milesat approximately 55%. humidity to less than one mile at 98%humidity (#).
However, wet bulb temperatures, charted in Figure 4 for theperiod 1939 through 1946, show a 3.1° decrease. This, togetherwith the 1.9° F. increase (Figure 3) of the mean temperature, in-sulted in a decrease in relative humidity. This lessening in rela-tive humidity occurred despite the fact that the amount of waterbrought into the Los Angeles basin for purposes of irrigation amifor human, and industrial use has substantially increased.
Because the relative humidity has lessened rather than in-creased, it can scarcely have contributed to the increase in smog.
Wind Speed. There is a close correlation between wind speedand visibility; good visibility usually accompanies high windspeeds (10). This effect of wind speed as a controlling factor invisibility has been observed in most cities in the United Stateswhere surveys have been made; and it is also indicated in thecharts that have been made for smog days in Los Angeles.
However, wind speeds in the Los Angeles area for the years 1923to 1947 show no significant trends (Figure 5). The location of I heanemometer used for recording wind velocity at Los Angeles was
changed in 1939, and the curve at that time shows a sharpchange. Accurate adjustment of the results from the two loca-tions cannot be made.
Total Sunshine. Over a 40-year period from 1906 to 1946records of the Los Angeles Weather Bureau show practically no
change in total sunshine (Figure 6).
Figure 6. Total Number of Hours of Sunshine byMonths at Los Angeles (1906 to 1946)

November 1949 INDUSTRIAL AND ENGINEERING CHEMISTRY 2479
Figure 7. Mean Annual Position of the Pacific High,at the Surface and at 20,000 Feet, Showing
Southwest Tilt with Height
On the basis of these data it is clear that there has been no basicchange in the Los Angeles area climate in recent years which couldaccount for the frequency of the smogs, exclusive of an increase inman-made contamination of the air.
MECHANISM OF THE SMOGIn dealing with the smog problem, it is essential to understand
the peculiarities of the California region in which smog occurs, andthe way in which meteorological and topographical factors com-bine to prevent normal dispersal of polluting substances resultingfrom human activity.
Los Angeles County is unique in that it is by far the largest in-dustrialized subtropical urban area in the world. The normalwaste-disposal problems of such an industrialized region are in-tensified by its subtropical weather conditions, and further ex-
aggerated by peculiar climatic factors resulting from its unusualtopography.
The county is situated in an enormous basin, ringed about withhigh mountains. Over the entire area extends an inversion layerwith a negative temperature gradient.
Inversion Layer and Its Effects. The presence of a semiper-manent high pressure area over the North Pacific Ocean is one ofthe important meteorological factors contributing to the forma-tion of smog.
This high pressure area may be visualized as a
giant column of air, elliptical in shape and inclinedslightly to the southwest (Figure 7). The air swirlsaround the axis of the column in a clockwise direc-tion in paths extending from the West Coast of theUnited States to beyond the Hawaiian Islands (S).This high pressure area is called semipermanentbecause it exists over the mid-Pacific during a largeproportion of the summer and fall months. Itsposition, however, is not always the same withrespect to latitude and longitude.
The air paths within this high pressure columnat sea level and at levels near the base of the strato-sphere are roughly parallel to the earth’s surface.At intermediate levels, however, the air paths are
inclined to the earth’s surface, being lower in theeast and higher in the west. Thus they form a
layer of air resembling a huge saucer, tilted so thatits lower edge is adjacent to the California coastand its upper edge is suspended in mid-Pacific tothe north of the Hawaiian Islands.
The air traveling around the southern side ofthe high pressure area, in a direction away fromCalifornia and .toward the Pacific, is gradually as-
cending and consequently cooling. But air moving around thenorthern side toward California is descending, moving progres-sively downward into levels of increased pressure, and therebybecoming compressed and warmed (Figure 8).
The consequence for the Los Angeles area, because it lies underthe eastern end of the column, is that the air arriving over LosAngeles County at levels higher than the surface layer has beensubjected to considerable downward motion which has com-
pressed and heated it. The temperature contrast is further ex-
aggerated when the bottom layer of seepage air is cooled from be-low, in passing over the relatively cold band of water upwellingjust off the California coast to replace surface shore waters sweptout into the Pacific by the high pressure area winds.
The temperature inversion layer is a result of these phenomena.Normally the temperature of the air decreases directly as the alti-tude increases, but over the California coast and the Los Angelesarea the opposite condition exists. The height of the inversionvaries from hour to hour, but during the daytime it may fre-quently be found at an elevation of approximately 1500 to 3000feet/ According to a typical set of air soundings (Figure 8), air1500 feet up over the West Coast was warmer than air at 1000feet. The stratum of heated air is the inversion layer.
. The inversion layer may be visualized as a transparent sheet ofair extending over the entire Los Angeles area, at a level usuallyranging between 1000 and 3000 feet. Sometimes such inversionlayers are so sharp and definite a stratification that a balloon,ascending slowly, will rebound momentarily from their undersurfaces (16).
As a rule, the inversion layer slopes upward in both easterly andwesterly directions from the coast (IS), and rests against themountains on the east, effectively blocking any eastward outflowof air from the basin. With incoming and outgoing breezes, itsimply rises and falls like an enormous deck. Moreover, verylittle interchange of air takes place between it and the air aboveor below it. The only exchange of properties in this direction isby means of heat radiation (20).
Thus the inversion layer acts as a canopy over the entire LosAngeles basin, preventing contaminated air from escapingvertically, and, by resting against the mountains, preventing italso from escaping toward the east.
A natural haze composed of oceanic salt, dust particles, andplant pollen combines with man-made pollution and collects atthe base of the inversion layer. Owing to the isolating action ofthe layer, it is possible for the smoke and fumes of several days tobuild up and remain trapped in the Los Angeles area. Any con-
Figure 8. Temperature-Height Curve for San Diego and Honolulu

2480 INDUSTRIAL AND ENGINEERING CHEMISTRY Vol. 41, No. 11
taminants in the air tend to concentrate at the top of the air layerjust below the inversion base, reaching their greatest densitywithin the lower portion of the inversion layer ( ', 9, 14, 20).
At times, when the air becomes stagnant and the base of theinversion is forced to ground level by movements in the upperatmosphere, the combined natural haze and man-made pollutionare sufficiently dense to obstruct visibility seriously; and severeirritation of the eyes results from the concentrated contamination.
Wind Currents and Mountain Effects. The influence ofmountain barriers on wind and other climatic factors is exerted inother ways in addition to combining with the inversion layer toprevent the escape of contaminated air from the area. The highand extensive mountain ranges partially surrounding the regionprevent the passage of strong winds into or out of the area.
Moreover, as the land surface of the Los Angeles basin is notsmooth, the local wind pattern is strikingly irregular. Surfacewind direction at any given point may not be at all indicative ofwind direction only a few blocks away. Very often flags atopneighboring buildings in Los Angeles blow in different directions.Such a situation makes it extremely difficult to backtrack to thesource of contaminated air.
The effects of the Foehn (or Santa Ana winds) from the east areoften popularly confused with smog effects. Smoggy days are
usually days of high temperature, but even higher temperaturesmay result from the Foehn because no body of air can pass fromthe high plateau regions lying to the east of the Los Angeles basindown into the valley without being heated to at least 20° F. (4).The Foehn winds are characteristic of mountainous regions,notably the Alps and the Rockies. In the Rockies they arecalled “ehinooks,” and they are all dry winds with a strong down-ward component of motion (17). Moreover, the Santa Ana windsare usually of high velocity, and they pick up and carry largequantities of dust. Visibility may be greatly reduced during aSanta Ana, but in the true sense of the word there is no smogpresent..
PREDICTION OF SMOGGY DAYSFrom the outset of this investigation, the desirability of de-
veloping some method of predicting smoggy -weather with reason-able accuracy wras evident. Such a forecasting technique wouldpermit control of the amount of contaminating substances dis-charged into the air when smog is imminent, thus mitigating theseverity of its irritating aspects.
A promising method of predicting the occurrence of smog hasbeen evolved, necessarily based upon past weather conditions.It is now undergoing trial and refinement, and there is good reasonto believe that it will prove a reliable method for predictingsmoggy xveather.
S.R.I. Smog Index. The first step in developing a method offorecasting was to work out a mathematical correlation betweensmog and the meteorological conditions associated with it. Thiseffort resulted in the Stanford Research Institute smog index—aformula that tells with a high degree of certainty whether eye-irritating smog is, or is not, present in some part of the Los An-geles basin at the moment for which the index is calculated.
Smoggy days were arbitrarily defined as those on which a mini-mum of four complaints were received by the Los Angeles CountyAir Pollution Control District. When fewer complaints per daythan this are received, they are usually traceable to local irritants,and are not related to the general smog problem.
The smog index was worked out originally by using a chart onwhich five separate aspects of meteorological conditions for eachday during the period from July 1945 to July 1947 were plottedagainst the number of complaints noted for each day of the same
period (Figure 9):
1. Wind movements for 24 hours2. Noon visibility in miles3. Relative humidity at noon4. Difference between the day’s 24-hour mean temperature
and the normal mean temperature5. Height, thickness, and magnitude of the temperature in-
version
The chart indicated that those days on which severe smogoccurs were strikingly similar with respect to certain meteorologi-cal conditions.
1. A strong, low inversion must be present. Until the day pre-ceding the smog, the inversion base is often as high as 1000 feet,and seldom as low as 500 feet. But on the day before the smogoccurs, the inversion base drops sharply; and on the smog day, itdrops still farther, generally to 500 feet or less above mean sealevel, or until its base and accompanying pollution touch theground.
2. The low inversion must be accompanied by several days ofstagnant air. The chart indicated that a bad smog day is usuallypreceded by 1, 2, or 3 days when the average daily wind movementis less than the normal 125 miles.
3. The temperature must be above normal for the time atwhich the smog occurs. The dry-bulb air temperature usually in-creases steadily for 2 or 3 days to a maximum noontime tempera-ture on the smog day between 75° F. in winter and 89° F. insummer.
On the basis of such qualitative data, it proved possible to de-vise an empirical equation which, in turn, yielded a numericalvalue called the “S.R.I. smog index.” The data for the 2-year pe-riod were examined, and a smog index was calculated for each day.Agreement is marked between days on w'hioh the smog index num-
ber is large (indicating smog conditions) and days on which more
than the minimum of four complaints were received by the LosAngeles County Air Pollution Control District. Figure 9 showsthis relation over a period of 11 days.
An example of the correlation of the smog index and smoggyweather can be seen in the records for Black Friday, September13, 1946, in Figure 9, and also in the records for the period ofSeptember 11 to November 5, 1948, in Figure 1. In Figure 1
there is good correspondence betw'een the days on which eyeirritation was reported to interviewers on the streets, a high blink

November 1949 INDUSTRIAL AND ENGINEERING CHEMISTRY 2481
Figure 10. Scatter Diagram Chart
rate among the persons interviewed,, a large number of telephonecomplaints received by the county, and those days on which theStanford Research Institute smog index (which was calculatedsolely from meteorological data) attained high values.
Forecasting Smog and Smog-Free Days. The success of thesmog index in correlating the presence of smog with weathercharacteristics gave rise to a method of forecasting smog by corre-
lation with upper air pressures and surface air movements, and bya supplementary correlation with surface wind velocities and sun-
shine.Correlation· of Smog with Upper Air Pressures and
Surface Air Movements. From what had gone before, it was
plain that smog is several days in the making. A “scatter dia-gram” chart was prepared that plotted, the position of all daysduring a certain period (whether they were smoggy, precededsmog, or seemed to have no relation to smog) with respect to theupper air pressure and the surface air movement of that particularday (Figure 10).
Upper air pressure measurements instead of surface pressuremeasurements were used as a parameter in place of the height ofthe inversion layer, because small, highly localized influencestending to obscure general relationships are absent from the upperair, and significant changes are slower and more uniform.
Usually the air pressure is about 700 millibars (or 516 mm. ofmercury) at the 10,000-foot level, although the average height ofthe 700-millibar level varies from month to month, as shown inFigure 11. On smoggy days, the 700-millibar air pressure leveltends to be higher than normal.
Three days’ accumulated deviation from the normal 700-millibar level was plotted on the abscissa of Figure 10. The 3
days’ accumulated wind movement was plotted on the ordinate.Thus if the inversion layer were low for three successive days,
the accumulated millibar level would be considerably higher thannormal and, as a consequence, the corresponding point on theabscissa would fall on the right-hand side of the chart. If the air
were stagnant for three successive days, its total motion would besmall, and its corresponding point would fall near the foot of theordinate.
Study of the chart showed that days characterized by a com-bined high millibar level value and a low wind movement valuefall well within a definite area on the chart. An arc was drawn toenclose that area.
It was found that all days known to be smoggy fall within thearc. Furthermore, all days either 24 or 48 hours before a smogday lie on or within the arc. More than 70% of the days thatpreceded smog by 72 hours lie within the arc. Days falling out-side the arc were shown to be smog-free; and smog did not followthem for at least 2 days, and usually not for 3 or more days.
It follows that if a day falls within the arc, there is a 50-50chance that smog will occur within the next 2 or 3 days. There isa considerably higher probability that smog will not follow, within72 hours, days outside the arc.
The steps used in calculating the values used in such a chart as
just described are as follows:
1. From the Weather Bureau Office, find out the height of the700-millibar level for Santa Maria and San Diego for each of theprevious 3 days. These are obtained by the Weather Bureau bymeans of radiosonde observations, and will be reported for theday requested at times designated as 0400Z and 1600Z. The0400Z observation is taken at 8:00 p.m., P.S.T., the previous day.The 1600Z observation is taken at 8:00 a.m., P.S.T., of the dayreported.
2. Obtain from the Weather Bureau the wind velocities at10,000 feet at San Diego and Santa Maria at the times correspond-ing to those in Step 1.
3. Average, for each observation time, the height of the 700-millibar surface between the two stations. Then take an averageof these averages for 0400Z of the given date (day previous) andfor 1600Z of the day previous.
4. Find out, from the curve shown in Figure 11, the normalheight of the 700-millibar surface, the usual surface height forthe day in question.

2482 INDUSTRIAL AND ENGINEERING CHEMISTRY Vol. 41, No. 11
5. From the final average obtained in Step 3, subtract thenormal height obtained in Step 4. This gives one day’s deviationfrom the normal 700-millibar level.
. This identical procedure must be followed for the 2 daysprevious to the day that has just been calculated. Then add allthree values together. This determines the point along theabscissa in the prediction graph at which the day falls.
7. Average the 10,000-foot wind speed for the two stations int he same fashion as the millibar heights were averaged.
8. Add this average to the final averages of wind speed for thet wo previous days. This locates the value along the ordinate oft he graph.
9. With the final values yielded from Steps 6 and 8, plot a
point on the graph. If the point falls outside the arc, there is a
very high probability that there will be no smog on the day justcalculated or on the two following days.
EYE IRRITANTS IN SMOG
Unquestionably the most disagreeable aspect of smog is eyeirritation. In a public opinion poll made in 1948 by Field & Pea-cock Associates, of Los Angeles, 52% of county residents ques-tioned said they were affected by smog; nearly 40% complainedof eye smarting; 29% said they objected most to the physicaldiscomforts of smog; whereas only 10% objected to the reducedvisibility.
The cause of eye irritation is extremely difficult to determineunder field conditions, because of the brevity and infrequency ofsmog attacks. Severe smog occurs in the Los Angeles basin onlyabout 10 to 20 times a year, and seldom lasts longer than 4 hours.
In order to make possible controlled testing of the eye-irritatingproperties of various substances on human beings, a smog cham-ber was constructed. The smog chamber is a galvanized metalroom, large enough to permit a human being to be seated com-
fortably, and so designed that irritants may be introduced atvarious concentrations (Figure 12).
Figure 11. Normal Height of 700 Millibar Surface
The purpose of the smog chamber is to permit comparison of theI'oncentration at which any given substance will cause eye irrita-; ion with the concentration at which, that substance is found in theatmosphere of Los Angeles. If it is discovered that a given sub-stance cannot irritate the eyes except at concentrations muchhigher than any at which it has been detected in the city air, thatsubstance may be eliminated as a major irritant, at least in itsbetter known physical and chemical forms. If, on the other hand,it does irritate the eyes at concentrations found in the atmosphere,presumably it may be responsible for some of the irritating as-
pects of smog. It is recognized that there is a large variation inthe sensitivity of individuals, and only a very large number oftests on different individuals will serve to give accurate results onthreshold sensitivity. These tests were for screening purposes,and only large differences were sought.
Testing Procedures. The smog chamber was accuratelycalibrated, and two types of tests, dynamic and static, were made.
Dynamic Tests were those in which the irritant under in-vestigation was mixed with air and blown, in the form of vapor,smoke, dust, or fog, through the sealed chamber at a constant rate.
Static Tests were those in which the contaminants were added
to the chamber atmosphere and allowed to mix thoroughly forfrom 5 to 60 minutes before the observer entered. Static testswere used primarily where it was desirable to have longer testperiods to determine the possible absorption of gases in liquid orsolid aerosols, after they had been permitted to mix in the air.
In order to determine the relationship between the nominalconcentration of a substance (or the concentration to be expectedfrom the amount introduced into the air of the chamber) and theanalytical concentration (or the concentration measured bychemical or physical analyses of a sample of air drawn from thechamber), the analytical concentration of formaldehyde in thechamber was compared with the nominal concentration obtainedin both the static and dynamic methods.
For dynamic testing, the two concentrations were within 5%of each other and, therefore, were considered the same. For thestatic method, the analytical concentration was from 30 to 40%lower than the nominal concentration, apparently owing to thesurface effects of the chamber.
As all static tests to date have been primarily exploratory, no
specific correction factor for the nominal concentration of othersubstances has been determined; but it has been assumed that allnominal concentrations corresponding to sensory responses are
roughly one third too high. For the purpose of this investigation,this difference is considered to be on the safe side for, when thenominal concentration of any agent is within the critical range,the actual effective concentration will be well within it.
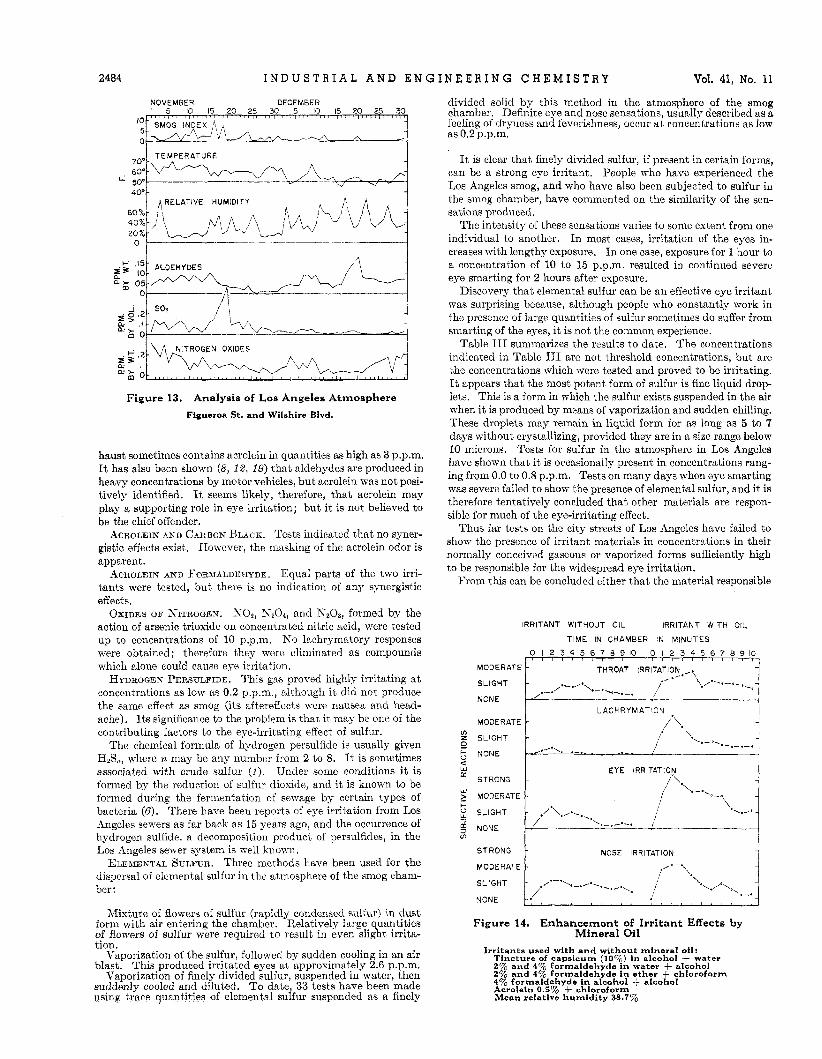
Results of Smog Chamber Work. A number of substancesknown to be present in the Los Angeles atmosphere (Table IIand Figure 13) during smog periods have been introduced into thethe smog chamber, both singly and in combination, and at variousconcentrations. Their effects upon human observers have beencarefully noted.
Among the substances which have been tested to date are
formaldehyde, sulfur trioxide, sulfur dioxide, acrolein, oxides ofnitrogen, hydrogen persulfide, and elemental sulfur.
To determine whether any two or more of these substancesmight have a synergistic or cooperative effect different from thatobtained from each of them singly, tests were also made withcombinations of formaldehyde and sulfur dioxide, formaldehydeand sulfur trioxide, formaldehyde and acrolein, formaldehyde andcarbon black aerosol, acrolein and carbon black aerosol, formalde-hyde aerosol, and mixtures of aldehydes.
By correlating air conditions in the smog chamber during testswith air conditions existing in Los Angeles during smog, many ofthe suspected irritants apparently have been eliminated as causesof lachrymation, at least in the physical form in which they were
used in the tests. There is reason to suspect, however, that someof these substances may exist in the atmosphere in other forms,such as aerosols, and as such may cause eye irritation. Study ofthese possibilities is in progress.
The tests produced one unexpected result: the identification ofelemental sulfur (sulfur the element as distinguished from sulfurin compounds) as an agent capable of causing general eye smart-ing, eye watering, and other unpleasant results, similar to thoseexperienced in smog. It is not likely, however, that sulfur is theonly material producing such effects, and aldehydes have not, as
yet, been definitely eliminated from consideration.Investigation of the effects of elemental sulfur and of other
possible contributory irritants is continuing. Results to date are
summarized below.Formaldehyde. Twenty-one tests have been completed.
The threshold concentration (or concentration required to causediscernible eye irritation) was found to be between 5 and 10 p.p.m.This corresponds rather well with previously published informa-tion which lists 10 p.p.m. as a safe working concentration (18). Be-cause formaldehyde during smog at no time has been found toexceed 0.5 p.p.m., or less than y25 that required to cause irrita-tion, it would appear that formaldehyde is not likely to be theprimary cause of eye irritation.

November 1949 2483INDUSTRIAL AND ENGINEERING CHEMISTRY
ATMOSPHERE
Inside smog chamber are a chair and a table. On table are clock, thermometer, andhumidity gage
On the other hand, these results are not quite in agreement withthe results of work recently completed at the University ofSouthern California by Roth and Swenson (15) for the Los An-geles County Air Pollution Control District, which indicate that a
significant number of persons are 20 to 40 times as sensitive toformaldehyde as others. Nine people out of 48 in an age groupfrom 50 to 85 reported detectable eye irritation at a concentrationof 0.25 p.p.m. of formaldehyde in the air. This would indicatethat aldehydes cannot be ruled out completely as one of thesources of eye irritation. However, the proportion of hypersensi-tive individuals is not as high (19%) as the 85%, or sometimeshigher, of the population reporting eye irritation during severe
smog.
Table II. Concentration Range of Known Substances inLos Angeles Atmosphere
Dust count, number of particles per cc. of air (by use of Smith-Greenburg impinger) 50-1000
Aldehydes, calculated as p.p.m. by volume of formaldehyde 0-0.5Oxides of sulfur, calculated as p.p.m. by volume of SO2 0-0.4Oxides of nitrogen, calculated as p.p.m. by volume of NOa
<0-0.1
Halogen content, calculated as p.p.m. by weight of chlorine indry air 0.15-0.3
Low (Dec.) High (April) AverageTotal dust fall in Los Angeles County
for 1946, in tons per sq. mile permonth 21.2 38.5 27.7
Some weather conditions were investigated in connection withthe eye-irritating effects of formaldehyde. For example, duringsevere smog, the temperature is sometimes above 80° F., and therelative himidity below 39%. Formaldehyde was tested underparallel conditions of temperature and humidity. Results showeda slight increase in irritation, but not sufficient to warrant furtherconsideration of atmospheric conditions as a factor in eye-irritat-ing effect of formaldehyde.
Sulfur Trioxide. Sulfur trioxide, introduced into the cham-ber by vaporizing sulfuric acid, gave no lachrymation effects at
25 p.p.m. As the total sulfur oxidesactually present in Los Angeles air rangebetween 0.0 and 0.4 p.p.m., sulfur trioxidewas dismissed as an irritant which alonecould cause the eye-irritating effects inLos Angeles smog.
Sulfur Trioxide and Formalde-hyde. Exploratory tests were made todetermine if a synergistic effect might beobtained from this combination. Sensoryresponses were the same as those forformaldehyde alone.
Mixtures of Aldehydes. Formal-dehyde, acetaldehyde, crotonaldehyde,and propionaldehyde were mixed inequal proportions. Only enough testshave been made to warrant saying that,although a slight synergistic effect ap-pears to exist, the effect is not powerfulenough to differ significantly from formal-dehyde alone.
Carbon Black and Formaldehyde.Tests indicated no synergistic effectwith formaldehyde and carbon blackobtained from the incomplete combus-tion of hydrocarbon oils.
Formaldehyde in Sea Water. Form-aldehyde in sea water solution wasintroduced into the chamber as spray.
At relative humidities below 70%,the sensory responses were the same as
those obtained when formaldehyde was added to the chamber as
a vapor.At relative humidities above 70%, however, there was a dis-
tinct lessening of the irritant effect of formaldehyde, and thelachrymation concentration threshold was raised to above 10
p.p.m., or 50 times as much as is ever present in Los Angelessmog.
Sulfur Dioxide. In concentrations up to 20 p.p.m., no
lachrymation or even slight eye irritation appeared.Sulfur Dioxide and Formaldehyde. To determine whether
formaldehyde-sulfur dioxide has a synergistic effect in producingeye irritation, formaldehyde concentrations ranging from 1 to 10
p.p.m. were tested in the presence of 0.5 to 5 p.p.m. of sulfurdioxide.
No synergistic effect was apparent. Sensory reactions of ob-servers were about the same as for formaldehyde alone. Indeed,if the presence of sulfur dioxide produced any change at all, itseemed to decrease the sensitivity of observers to the formalde-hyde.
Acrolein. The completion of a series of tests shows the thresh-old eye-irritative concentration for the average person to bewithin a range of 0.5 to 1.5 p.p.m. Acrolein is the only aldehydethus far tested which causes lachrymation within the concentra-tion range of the total of all the aldehydes as found to exist insmog (a range between 0.0 and 0.5 p.p.m.).
It was also apparent that people tend to become more sensitiveon prolonged exposure. It is therefore possible that a person maybe sensitive to a concentration considerably lower than 0.5 p.p.m.,if he is exposed for a sufficiently long time.
The question arises as to whether acrolein is present in the LosAngeles smog. The methods of analysis so far used for formalde-hyde in the streets unfortunately do not distinguish betweenacrolein and formaldehyde.
Small amounts of acrolein, however, are known to be producedby varnish manufacturing operations and other operations in-volving the heating of natural fats and oils. Recent unpublishedwork has shown, perhaps for the first time, that automobile ex-
2484 INDUSTRIAL AND ENGINEERING CHEMISTRY Vol. 41, No. 11
NOVEMBER DECEMBER
Figure 13. Analysis of Los Angeles AtmosphereFigueroa St. and Wilshire Blvd.
haust sometimes contains acrolein in quantities as high as 3 p.p.m.It has also been shown (8, 12, 19) that aldehydes are produced inheavy concentrations by motor vehicles, but acrolein was not posi-tively identified. It seems likely, therefore, that acrolein mayplay a supporting role in eye irritation; but it is not believed tobe the chief offender.
Acrolein and Carbon Black. Tests indicated that no syner-gistic effects exist. However, the masking of the acrolein odor isapparent.
Acrolein and Formaldehyde. Equal parts of the two irri-tants were tested, but there is no indication of any synergisticeffects.
Oxides of Nitrogen. N02, N204j and N203, formed by theaction of arsenic trioxide on concentrated nitric acid, were testedup to concentrations of 10 p.p.m. No lachrymatory responseswere obtained; therefore they were eliminated as compoundswhich alone could cause eye irritation.
Hydrogen Persulfide. This gas proved highly irritating atconcentrations as low as 0.2 p.p.m., although it did not producethe same effect as smog (its aftereffects were nausea and head-ache) . Its significance to the problem is that it may be one of thecontributing factors to the eye-irritating effect of sulfur.
The chemical formula of hydrogen persulfide is usually givenH2S„, where n may be any number from 2 to 8. It is sometimesassociated with crude sulfur (1). Under some conditions it isformed by the reduction of sulfur dioxide, and it is known to beformed during the fermentation of sewage by certain types ofbacteria (6). There have been reports of eye irritation from LosAngeles sewers as far back as 15 years ago, and the occurrence ofhydrogen sulfide, a decomposition product of persulfides, in theLos Angeles sewer system is well known.
Elemental Sulfur. Three methods have been used for thedispersal of elemental sulfur in the atmosphere of the smog cham-ber:
Mixture of flowers of sulfur (rapidly condensed sulfur) in dustform with air entering the chamber. Relatively large quantitiesof flowers of sulfur were required to result in even slight irrita-tion.
Vaporization of the sulfur, followed by sudden cooling in an airblast. This produced irritated eyes at approximately 2.6 p.p.m.
Vaporization of finely divided sulfur, suspended in water, thensuddenly cooled and diluted. To date, 33 tests have been madeusing trace quantities of elemental sulfur suspended as a finely
divided solid by this method in the atmosphere of the smogchamber. Definite eye and nose sensations, usually described as afeeling of dryness and feverishness, occur at concentrations as lowas 0.2 p.p.m.
It is clear that finely divided sulfur, if present in certain forms,can be a strong eye irritant. People who have experienced theLos Angeles smog, and who have also been subjected to sulfur inthe smog chamber, have commented on the similarity of the sen-sations produced.
The intensity of these sensations varies to some extent from one
individual to another. In most cases, irritation of the eyes in-creases with lengthy exposure. In one case, exposure for 1 hour toa concentration of 10 to 15 p.p.m. resulted in continued severe
eye smarting for 2 hours after exposure.Discovery that elemental sulfur can be an effective eye irritant
was surprising because, although people who constantly work inthe presence of large quantities of sulfur sometimes do suffer fromsmarting of the eyes, it is not the common experience.
Table III summarizes the results to date. The concentrationsindicated in Table III are not threshold concentrations, but are
the concentrations which were tested and proved to be irritating.It appears that the most potent form of sulfur is fine liquid drop-lets. This is a form in which the sulfur exists suspended in the airwhen it is produced by means of vaporization and sudden chilling.These droplets may remain in liquid form for as long as 5 to 7
days without crystallizing, provided they are in a size range below10 microns. Tests for sulfur in the atmosphere in Los Angeleshave shown that it is occasionally present in concentrations rang-ing from 0.0 to 0.8 p.p.m. Tests on many days when eye smartingwas severe failed to show the presence of elemental sulfur, and it istherefore tentatively concluded that other materials are respon-sible for much of the eye-irritating effect.
Thus far tests on the city streets of Los Angeles have failed toshow the presence of irritant materials in concentrations in theirnormally conceived gaseous or vaporized forms sufficiently highto be responsible for the widespread eye irritation.
From this can be concluded either that the material responsible
IRRITANT WITHOUT OIL IRRITANT WITH OIL
MODERATE
SLIGHT
NONE
MODERATE
z SLIGHTO
¡5 NONE< “
STRONG
> MODERATE
S SLIGHT
§ NONE
STRONG
MODERATE
SLIGHT
NONE
TIME IN CHAMBER IN MINUTES0 I 23456789 10 0123456789 10
THROAT
"X._,^IRRITATION^
. " 'V--------LACHRYM ATI0N
- /X \- //
EYE IRRITATION
/X_./
- / X ,
/ /• /
- NOSE RRlTATION -
- \
//
• /X ^
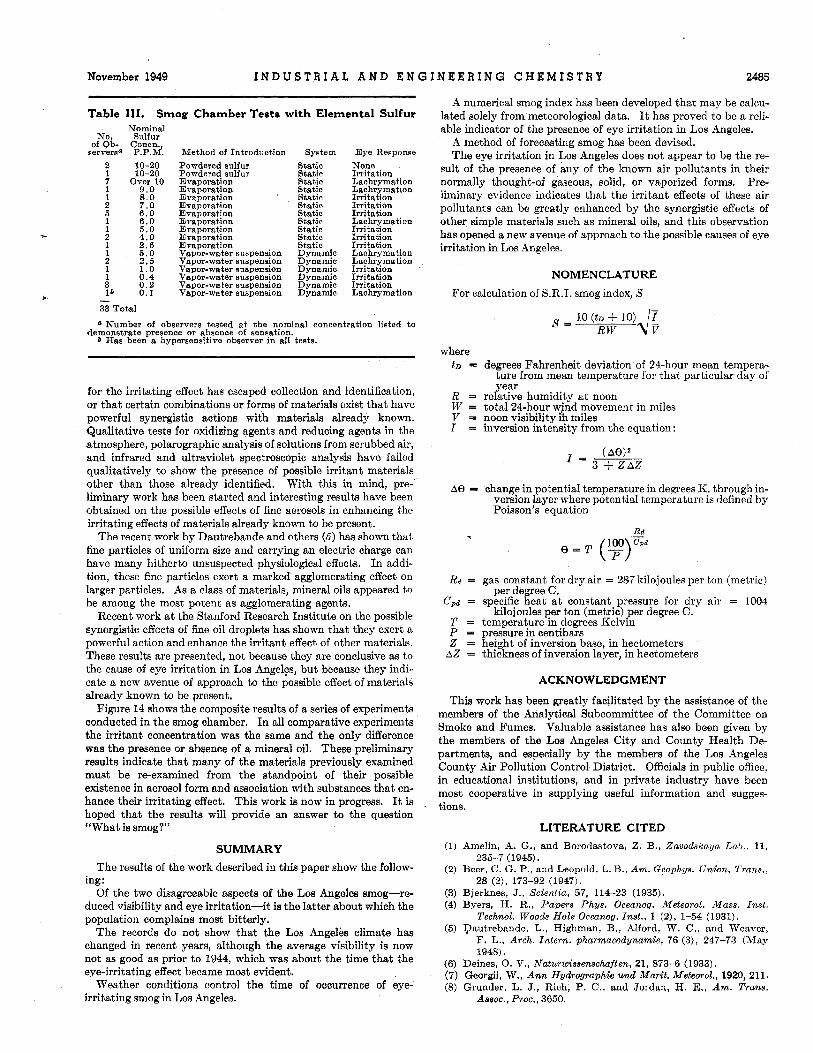
Figure 14. Enhancement of Irritant Effects byMineral Oil
Irritants used with and without mineral oil:Tincture of capsicum (10%) in alcohol + water2% and 4% formaldehyde in water + alcohol2% and 4% formaldehyde in ether + chloroform4% formaldehyde in alcohol 4* alcoholAcrolein 0.5% 4* chloroformMean relative humidity 38.7%
November 1949 INDUSTRIAL AND ENGINEERING CHEMISTRY 2485
Table III. Smog Chamber Tests with Elemental SulfurNominal
No. Sulfurof Ob- Concn.,
servers® P.P.M. Method of Introduction System Eye Response2 10-20 Powdered sulfur Static None1 10-20 Powdered sulfur Static Irritation7 Over 10 Evaporation Static Lachrymation1 9.0 Evaporation Static Lachrymation1 8.0 Evaporation Static Irritation2 7.0 Evaporation Static Irritation5 6.0 Evaporation Static Irritation1 6.0 Evaporation Static Lachrymation1 5.0 Evaporation Static Irritation2 4.0 Evaporation Static Irritation1 2.6 Evaporation Static Irritation1 5.0 Vapor-water suspension Dynamic Lachrymation2 2.5 Vapor-water suspension Dynamic Lachrymation1 1.0 Vapor-water suspension Dynamic Irritation1 0.4 Vapor-water suspension Dynamic Irritation3 0.2 Vapor-water suspension Dynamic Irritation16 0.1 Vapor-water suspension Dynamic Lachrymation
33 Total® Number of observers tested at the nominal concentration listed to
demonstrate presence or absence of sensation.6 Has been a hypersensitive observer in all tests.
for the irritating effect has escaped collection and identification,or that certain combinations or forms of materials exist that havepowerful synergistic actions with materials already known.Qualitative tests for oxidizing agents and reducing agents in theatmosphere, polarographic analysis of solutions from scrubbed air,and infrared and ultraviolet spectroscopic analysis have failedqualitatively to show the presence of possible irritant materialsother than those already identified. With this in mind, pre-liminary work has been started and interesting results have beenobtained on the possible effects of fine aerosols in enhancing theirritating effects of materials already known to be present.
The recent work by Dautrebande and others (5) has shown thatfine particles of uniform size and carrying an electric charge can
have many hitherto unsuspected physiological effects. In addi-tion, these fine particles exert a marked agglomerating effect on
larger particles. As a class of materials, mineral oils appeared tobe among the most potent as agglomerating agents.
Recent work at the Stanford Research Institute on the possiblesynergistic effects of fine oil droplets has shown that they exert a
powerful action and enhance the irritant effect of other materials.These results are presented, not because they are conclusive as tothe cause of eye irritation in Los Angeles, but because they indi-cate a new avenue of approach to the possible effect of materialsalready known to be present.
Figure 14 shows the composite results of a series of experimentsconducted in the smog chamber. In all comparative experimentsthe irritant concentration was the same and the only differencewas the presence or absence of a mineral oil. These preliminaryresults indicate that many of the materials previously examinedmust be re-examined from the standpoint of their possibleexistence in aerosol form and association with substances that en-hance their irritating effect. This work is now in progress. It ishoped that the results will provide an answer to the question“What is smog?”
SUMMARYThe results of the work described in this paper show the follow-
ing:Of the two disagreeable aspects of the Los Angeles smog—re-
duced visibility and eye irritation—it is the latter about which thepopulation complains most bitterly.
The records do not show that the Los Angeles climate haschanged in recent years, although the average visibility is nownot as good as prior to 1944, which was about the time that theeye-irritating effect became most evident.
Weather conditions control the time of occurrence of eye-irritating smog in Los Angeles.
A numerical smog index has been developed that may be calcu-lated solely from meteorological data. It has proved to be a reli-able indicator of the presence of eye irritation in Los Angeles.
A method of forecasting smog has been devised.The eye irritation in Los Angeles does not appear to be the re-
sult of the presence of any of the known air pollutants in theirnormally thought-of gaseous, solid, or vaporized forms. Pre-liminary evidence indicates that the irritant effects of these airpollutants can be greatly enhanced by the synergistic effects ofother simple materials such as mineral oils, and this observationhas opened a new avenue of approach to the possible causes of eyeirritation in Los Angeles.
NOMENCLATUREFor calculation of S.R.I. smog index, S
„ 10 (in+ 10) ¡7 RW Mfwhere
to = degrees Fahrenheit deviation of 24-hour mean tempera-ture from mean temperature for that particular day ofyear
R — relative humidity at noonW = total 24-hour wind movement in milesV = noon visibility íh miles/ = inversion intensity from the equation:
(A9)a3 + ZAZ
= change in potential temperature in degrees K. through in-version layer where potential temperature is defined byPoisson’s equation
Ri100 \CpdP )
Ri = gas constant for dry air = 287 kilojoules per ton (metric)per degree C.
CPi = specific heat at constant pressure for dry air = 1004kilojoules jaer ton (metric) per degree C.
T = temperature in degrees KelvinP = pressure in centibarsZ = height of inversion base, in hectometers
Z = thickness of inversion layer, in hectometers
ACKNOWLEDGMENTThis work has been greatly facilitated by the assistance of the
members of the Analytical Subcommittee of the Committee on
Smoke and Fumes. Valuable assistance has also been given bythe members of the Los Angeles City and County Health De-partments, and especially by the members of the Los AngelesCounty Air Pollution Control District. Officials in public office,in educational institutions, and in private industry have beenmost cooperative in supplying useful information and sugges-tions.
LITERATURE CITED(1) Amelin, A. G., and Borodastova, Z. B., Zavodskaya Lab., 11,
235-7 (1945).(2) Beer, C. G. P., and Leopold, L. B., Am. Geophys. Union, Trans,,
28 (2), 173-92 (1947).(3) Bjerknes, J., Scientia, 57, 114-23 (1935).(4) Byers, H. R., Papers Phys. Oceanog. Meteorol. Mass. Inst.
Technol. Woods Hole Oceanog. Inst., 1 (2), 1-54 (1931).(5) pautrebande, L., Highman, B., Alford, W. C., and Weaver,
F. L., Arch. Intern, pharmacodynamic, 76 (3), 247-73 (May1948).
(6) Deines, O. V., Naturwissenschaften, 21, 873-6 (1933).(7) Georgii, W., Ann Hydrographic und Marit. Meteorol., 1920, 211.(8) Grander, L. J., Rich, P. C., and Jordan, , E., Am. Trans.
Assoc., Proc., 3650.
2486 INDUSTRIAL AND ENGINEERING CHEMISTRY Vol. 41, No. 11
(9) Heilman, G., Prense. Altad. Wissenschaften, Physikalisch-mathematischen Klassen, Sitsungsber., 1921 (Pt. 2), pp. 900-19.
(10) Ivea, J. E„ et al., U. S. Pub. Health Service, Pub. Health Bull.224, Sec. 5 (March 1936).
(11) Kraus, E., Royal Meteorol. Soc. Quart. J., 71, 397-412 (July-October 1945).
(12) Mikita, J. J., Leven, Harry, and Kechline, H. R., S.A.E.Journal, 51, 12-19 (January 1943).
(13) Neiburger, Morris, Beer, C. G. P., and Leopold, L. B., U. S.Dept. Commerce, Weather Bur. (April 1945),
(14) Peppier, W., Das Wetter, 41, 173-6 (1924).(15) Roth, . P., and Swenson, E. A,, “Physiological Studies of
Irritant Aspects of Atmospheric Pollution,” Los Angeles,Calif., University of Southern California, School of Medicine.
(16) Shaw, N., and Owens, J. S., “The Smoke Problem in GreatCities,” London, Constable & Co., 1925.
(17) U. S. Dept. Commerce, Weather Bur., Weather Glossary, 1945.(18) Walker, J. F., “Formaldehyde,” Am. Chem. Soc. Monograph 98,
New York, Reinhold Publishing Corp., 1944.(19) Wetmiller, it. S., and Endaley, L. E., S.A.E. Journal, 50, 509-
20T (December 1942).(20) Willett, H. C., Monthly Weather Rev., 56, 435-8 (November
1928).Received March 7, 1949.
Industrial Dusts and Fumes inthe Los Angeles Area
LOUIS C. MCCABE, PAUL P. MADER, . E. McMAHON, AND W. J. HAMMINGLos Angeles County Air Pollution Control District, Los Angeles, Calif.
A. L. CHANEYChaney Laboratories, Glendale, Calif.
Meteorological and topographical conditions in the LosAngeles basin cause the retention of dusts and fumes, fre-quently for several days. Eye irritation and limited visi-bility are characteristic of the resultant smog. Studiesof the aerosols in this area have been undertaken by gov-ernment and private laboratories. Methods and equip-ment used by the Los Angeles County Air Pollution Con-trol District in identification of industrial contaminantsare described. The roles of sulfuric acid mist and metal-lurgical dusts in smog formation are discussed.
INTHE Los Angeles basin the term smog is applied to the
complex blue haze of air pollution which limits visibility andon 53 days of 1948 caused reports of eye, nose, and throat irrita-tion. Natural gas is used for domestic heating, and natural andrefinery gas and fuel oils are the principal fuels of industry.There is no appreciable use of coal.
Smoke, in the common usage of the word, is a minor source ofnuisance although it is produced in burning combustible rubbishand in the improper firing of fuel oil. Many of these sources ofsmoke have been eliminated during the past year and currentstudies indicate that dust and fumes are the predominant aero-sols.
METEOROLOGICALASPECTS
Temperature inversionand the local wind patternsaggravate the air contami-nation (1). The persist-ent temperature inversionlimits the vertical distri-bution of the pollutionby turbulence, and advec-
tion of the local winds distributes it beneath the inversionlayer. Marked inversions are most prevalent in the summer
months but sometimes occur in winter especially when a highpressure area develops over the Great Basin. There was an
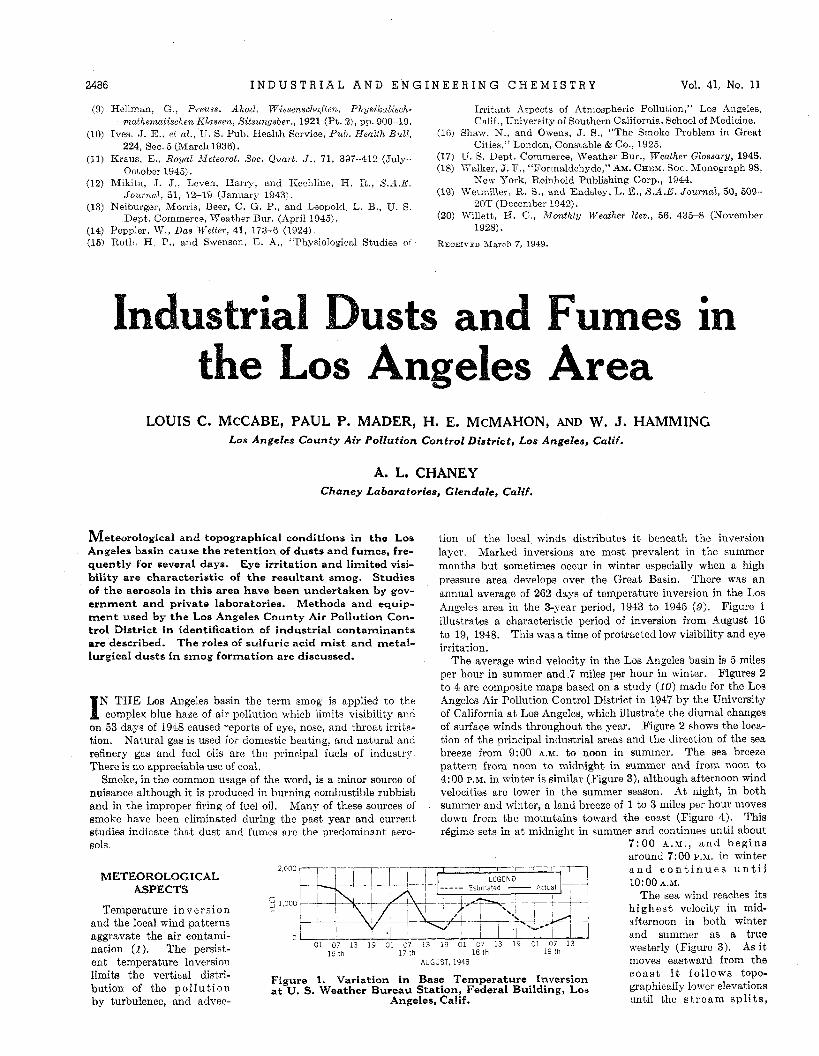
annual average of 262 days of temperature inversion in the LosAngeles area in the 3-year period, 1943 to 1945 (9). Figure 1
illustrates a characteristic period of inversion from August 16to 19, 1948. This was a time of protracted low visibility and eyeirritation.
The average wind velocity in the Los Angeles basin is 5 milesper hour in summer and .7 miles per hour in winter. Figures 2to 4 are composite maps based on a study (10) made for the LosAngeles Air Pollution Control District in 1947 by the Universityof California at Los Angeles, which illustrate the diurnal changesof surface winds throughout the year. Figure 2 shows the loca-tion of the principal industrial areas and the direction of the sea
breeze from 9:00 a.m. to noon in summer. The sea breezepattern from noon to midnight in summer and from noon to4:00 p.m. in winter is similar (Figure 3), although afternoon windvelocities are lower in the summer season. At night, in bothsummer and winter, a land breeze of 1 to 3 miles per hour moves
down from the mountains toward the coast (Figure 4). Thisrégime sets in at midnight in summer and continues until about
7:00 a.m., and beginsaround 7:00 p.m. in winterand continues until10:00 a.m.
The sea wind reaches itshighest velocity in mid-afternoon in both winterand summer as a truewesterly (Figure 3). As itmoves eastward from thecoast it follows topo-graphically lower elevationsuntil the stream splits,
Figure 1. Variation in Base Temperature Inversionat U. S. Weather Bureau Station, Federal Building, Los
Angeles, Calif.