The labour market impact of robotisation in Europe
36
EUR 28558 EN The labour market impact of robotisation in Europe JRC Working Papers Series on Labour, Education and Technology 2020/06 José-Ignacio Antón, David Klenert, Enrique Fernández-Macías, Maria Cesira Urzì Brancati and Georgios Alaveras JRC Technical Report TECHNOLOGY LABOUR EDUCATION Joint Research Centre
-
Upload
khangminh22 -
Category
Documents
-
view
0 -
download
0
Transcript of The labour market impact of robotisation in Europe

EUR 28558 ENJointResearchCentre
The labour market impact ofrobotisation in Europe
JRC Working Papers Series onLabour, Education and Technology
2020/06
José-Ignacio Antón, David Klenert, Enrique Fernández-Macías,Maria Cesira Urzì Brancati and Georgios Alaveras
JRC Technical Report
TECH
NOLOGY
LABO
UR
EDUCA
TION
Joint Research Centre

This Working Paper is part of a Working paper series on Labour, Education and Technology by the Joint Research Centre (JRC) The JRC is the European Commission’s science and knowledge service. It aims to provide evidence-based scientific support to the European policymaking process. The scientific output expressed does not imply a policy position of the European Commission. Neither the European Commission nor any person acting on behalf of the Commission is responsible for the use that might be made of this publication.
Contact information Name: José-Ignacio Antón Address: Department of Applied Economics, Facultad de Derecho, Universidad de Salamanca, Campus Miguel de Unamuno, s/n, Salamanca 37007, Spain Email: [email protected]
EU Science Hub https://ec.europa.eu/jrc
JRC121388
Seville: European Commission, 2020
© European Union, 2020
The reuse policy of the European Commission is implemented by the Commission Decision 2011/833/EU of 12 December 2011 on the reuse of Commission documents (OJ L 330, 14.12.2011, p. 39). Except otherwise noted, the reuse of this document is authorised under the Creative Commons Attribution 4.0 International (CC BY 4.0) licence (https://creativecommons.org/licenses/by/4.0/). This means that reuse is allowed provided appropriate credit is given and any changes are indicated. For any use or reproduction of photos or other material that is not owned by the EU, permission must be sought directly from the copyright holders.
All content © European Union 2020
How to cite this report: Antón, J., Klenert, D., Fernández-Macías, E., Urzì Brancati, M. C., Alaveras, G., The labour market impact of robotisation in Europe, Seville: European Commission, 2020, JRC121388.
The labour market impact of robotisation in Europe
The labour market impact of robotisation in Europe
José-Ignacio Antón (University of Salamanca), David Klenert (Joint Research Centre, European Commission), Enrique Fernández-Macías (Joint Research Centre, European Commission), Maria
Cesira Urzì Brancati (Joint Research Centre, European Commission) and Georgios Alaveras (Joint Research Centre, European Commission)
Abstract
This paper explores the impact of robot adoption on European regional labour markets between 1995 and 2015. Specifically, we look at the effect of the usage of industrial robots on jobs and employment structures across European regions. We regress the outcome of interest on the change in the exposure to robotisation in each regional labour market, based on the initial distribution of employment by industry across regions. Our estimates suggest that the effect of robots on employment tends to be mostly small and negative during the period 1995–2005 and positive during the period 2005–2015 for the overwhelming majority of model specifications and assumptions. Regarding the effects on employment structures, we find some evidence of a mildly polarising effect in the first period, but this finding depends to some extent on the model specifications. In sum, this paper shows that the impact of robots on European labour markets in the last couple of decades has been small and ambiguous. The strength and even the sign of this effect are sensitive to the specifications, as well as to the countries and periods analysed.
Keywords: robots, employment, polarisation, robots and jobs, European Union

The labour market impact of robotisation in Europe
Authors: José-Ignacio Antón (University of Salamanca), David Klenert (Joint Research Centre, European Commission), Enrique Fernández-Macías (Joint Research Centre, European Commission), Maria Cesira Urzì Brancati (Joint Research Centre, European Commission) and Georgios Alaveras (Joint Research Centre, European Commission
Acknowledgements: We thank Anna Atkinson for excellent comments and proofreading. José-Ignacio Antón gratefully acknowledges the financial support from Ramón Areces Foundation Grants for Research Projects in Social Sciences (17th edition). We thank Sergio Torrejón-Pérez for helpful comments on a first version of this paper.
Joint Research Centre reference number: JRC121388
Related publications and reports: Klenert, D., Fernández-Macías, E., Antón, J., Do robots really destroy jobs? Evidence from Europe, Seville: European Commission, 2020, JRC118393. Fernández-Macías, E., Klenert, D., Antón, J., Not so disruptive yet? Characteristics, distribution and determinants of robots in Europe, Seville: European Commission, 2020, JRC120611.

The labour market impact of robotisation in Europe
Contents
Introduction .................................................................................................................................................................................................................. 4 Data and methods .................................................................................................................................................................................................... 6 Results .......................................................................................................................................................................................................................... 10 Conclusions ................................................................................................................................................................................................................ 26 References .................................................................................................................................................................................................................. 28

The labour market impact of robotisation in Europe
4
Introduction
Few topics have historically attracted so much interest from the general public and the research community alike as the impact of technology on work (Mokyr, Vickers & Ziebarth, 2015). Jointly with globalisation, automation is one of the main sources of economic concern for European citizens, with almost three out of four considering that this phenomenon implies net job losses on the Continent (European Commission, 2017). Nevertheless, so far, this kind of technological anxiety may have led to an overestimation of the negative effects of automation. Productive technologies have in fact mostly contributed to raising the living standards of modern societies (Atack, Margo & Rhode, 2019; Autor, 2015; Autor & Salomons, 2018). But the current debates often focus on whether—and to what extent— “this time is different” and whether current technological innovations are in fact more disruptive than those in the past (Autor & Salomons, 2018; Eurofound, 2018; Marengo, 2019; Mokyr, Vickers, & Ziebarth, 2015; Pratt, 2015).
The aim of this paper is to explore the impact of a very specific technology, industrial robots, on jobs and employment structures in Europe during the period 1995–2015. We examine region-level variation in the exposure to robotisation, combining information on the deployment of this sort of capital by countries and sectors from the International Federation of Robotics (IFR) with region-level labour market statistics obtained from different Eurostat datasets.
We find that the impact of robot adoption on local labour markets depends on the time period analysed: whereas there is evidence of negative effects of the increase of robot density on employment in the period 1995–2005, the impact in the period 2005–2015 is positive or null. However, we perform extensive robustness checks and find that these results are often sensitive to the exact specifications of the estimations.
Regarding the effect of robot adoption on occupational change, our results are less clear. In some of our specifications, we identify a negative effect on the middle of the distribution or a positive effect on the extremes in the first period (which would be consistent with the hypothesis of a polarisation effect), but the differences between the change in the middle and the extremes are relatively small and often not statistically significant. In fact, for certain model specifications we find a more pronounced positive effect of robotisation on the middle tercile over the entire period, so this finding has to be interpreted with caution.
The impact of automation on the labour market is complex (Acemoglu & Autor, 2011; Acemoglu & Restrepo, 2018a, 2018b, 2019a; Autor, 2015; Autor, Levy & Murlane, 2003). First of all, the new technology might displace labour from those tasks it is brought in to perform. Second, it might involve the creation of new tasks and, consequently, foster the creation of employment associated with them. The same applies to those (pre-existing) tasks that are complementary to the technology introduced, the so-called productivity effect. In principle, it is unclear which effect dominates. Finally, Acemoglu and Restrepo (2018b) add that, in the long run, the productivity effect becomes larger, since automation raises the rental rate of capital, which triggers further capital accumulation until a point at which the price of this factor reaches its steady state level.
There is an extensive body of literature aiming to disentangle the labour market consequences of technological changes, mainly focused on the task-content of jobs and its effect on different segments of the labour force (for a taste of the general developments regarding this topic, see, among many others, Acemoglu and Autor [2011], Autor [2015], Barbieri, Piva, Mussida & Vivarelli [2019], Fernández-Macías & Hurley [2016] and Jerbashian [2019]). More specifically, there are several recent papers exploring the labour market implications of robot adoption on both developed and developing economies, with somewhat diverse conclusions. Exploiting sector- and country-level variation, Graetz and Michaels (2018) document a null effect of robotisation on jobs (with a negative effect on low-skill employment) and a positive effect on wages for the period 1993–2007 in developed countries. Klenert, Fernández-Macías and Antón (2020) show that the impact on

The labour market impact of robotisation in Europe
5
employment is often positive when looking solely at manufacturing and extending the period of analysis to 2015. Carbonero, Ernst and Weber (2018), using a similar approach but looking at a larger sample of countries during the period 2000–2014, report a negative impact on employment, particularly in developing countries. Looking at a similar time window, De Backer, DeStefano, Menon and Suh (2018) find a positive impact of robots on jobs in developed countries in some periods and a null effect for developing countries. For the US, Borjas and Freeman (2019) find a negative impact on wages and employment in the period 1996–2016, while Dahlin (2019) reports a positive impact on high- and middle-skill jobs between 2010 and 2015.
Another stream of literature exploits regional variation in robot exposure, assigning the increase in the stock of this technology by sector (available from the IFR data) to subnational territories on the basis of the distribution of employment at the beginning of the observation period. This approach is adopted by Acemoglu and Restrepo (in press-a), Dauth et al. (2017) and Chiacchio et al. (2018) when exploring the implications of robot adoption on employment in the US, Germany and a set of 6 European Union countries, respectively. Acemoglu and Restrepo (in press-a) report a negative impact of robotisation on both employment and wages. Chiacchio, et al. (2018) find similar effects for Europe. Finally, in the work of Dauth et al. (2017), robot adoption seems to exert a negative effect on manufacturing employment and wages, but the overall effect on the labour market is null. This suggests that non-manufacturing sectors are absorbing the employment made redundant in industrial activities and profiting from the productivity rise. One of the advantages of the regional approach is that it allows taking into the existence of differential effects on employment in robot-intensive sectors and on the whole economy.
Finally, several recent studies based on firm-level data, come to different conclusions. While Moll and Lerch (2016), making use of the European Manufacturing Survey comprising firms in six European countries, find that the use of robots and employment are uncorrelated, Domini, Grazzi, Moschella, & Treibich (2019) and Koch, Manuylov and Smolka (2019), who make a greater effort than the latter study in identifying causality, find a positive effect of automation technology on employment creation. Balsmeier and Woerter (2019) focus on Swiss firms and find a slight positive effect on employment, explained by a relevant boost of high-skilled jobs and negative impact on low-qualified ones. A noticeable exception to this not so dark landscape is Acemoglu, LeLarge and Restrepo (2020), who find that for the case of France, robots are associated with a decrease in employment on aggregate, as the reduction in labour share outweighs employment creation effects driven by increased productivity.
The contribution of this paper is twofold. First, we assess the robustness of previous studies on the impact of robotisation on local labour markets, including in our analyses a wider set of countries and time periods. Second, we explore the differential impact of robot adoption on different parts of the employment distribution (beyond educational levels), which allows us to examine potential links between robotisation and labour market polarisation.
The paper is structured as follows. In the second section, we describe in detail the databases employed in the analysis and the methodology used for exploring the impact of robot adoption on European labour markets. The third section presents the results of our econometric analysis. Finally, last section summarizes and discusses the main conclusions of the paper.
The labour market impact of robotisation in Europe
6
Data and methods
Data
In order to assess the effect of robotisation on European labour markets, we combine several databases for the years 1995, 2005 and 2015.
Regarding robot adoption, as many recent studies, we draw on the data from the World Robotics Database, specifically from the 2017 edition (IFR, 2018). This dataset, administered by the main association of producers of robots worldwide, contains information on industrial robot stocks and deliveries all over the globe. It is worth mentioning that the types of robots this database comprises are far from general. They stick to the definition of the International Standards Organisation (2012) norm, which defines a robot as “an automatically controlled, reprogrammable, multipurpose manipulator programmable in three or more axes, which can be either fixed in place or mobile for use in industrial automation applications”. Therefore, the narrow concept of robot in the IFR database (2018) basically comprises industrial machinery, digitally controlled, mainly aimed at handling operations and machine tending, welding and soldering and assembling and disassembling. In terms of accounting, robots are not part of information and communication technology capital (ICT), with the exception of the software needed to manage them.1
The labour market information used in this paper comes from several different sources. The first and main source is the European Union Labour Force Survey (EU-LFS), carried out jointly by the EU member states and Eurostat. The EU-LFS micro-data are a key source of information on employment figures and the main demographic characteristics of population across regions. Unfortunately, because of confidentiality and anonymity concerns, this dataset does not offer a detailed disaggregation by economic activity - information effectively collected in the questionnaires. We have obtained the detailed distribution of the labour force by region and industry through several ad hoc requests to the Eurostat User Support.2 Nevertheless, we resort to other databases in order to fill some gaps in the EU-LFS data. Particularly, because of the lack of information on German regions until the mid-2000s (due to legal reasons), we use the European Community Household Panel 1994–2001 to fill those gaps.3 Furthermore, given that Poland did not disaggregate the sectoral composition of the labour force by region at more than one digit until recently, we obtain the distribution of workers by economic activity (at the two digit level) and region in Polish manufacturing from the Structural Business Statistics administered by Eurostat.
Our assessment of the effect of robots on job polarisation requires ranking jobs by their average wages (jobs are defined as a combination of a two-digit occupation and a one-digit economic activity, the highest detail level allowed by the EU-LFS micro data). We rank the jobs in the initial year of each of our analyses using the national rankings developed by the European Foundation for the Improvement of Living and Working Conditions (Fernández-Macías et al., 2017). This ranking,
1 See Fernández-Macías, Antón and Klenert (2020) for an extended discussion on the concept and characteristics of these robots. 2 Chiacchio et al. (2018) use instead the Structural Business Statistics, which has the disadvantage that it lacks information for some years, countries, regions and sectors. Chiacchio et al. (2018) describe the adjustments and assumptions they had to make in order to use this database. However, as we will discuss later we can roughly reproduce their results for a similar period of analysis with LFS data, so the use of different employment data should not have major implications for the results in this case. 3 Specifically, we average the relevant variables for the period 1994−1996 in order to get a reliable estimate for the year 1995 in Germany.
The labour market impact of robotisation in Europe
7
based on different data sources of earnings, provides an ordinal classification of jobs by remuneration at two-digit occupation-one-digit sector.4 Given that there is a significant break in the relevant classifications of occupations (the International Standard Classification of Occupations, ISCO) and industries (the Statistical Classification of Economic Activities in the European Community, NACE) in the end of the 2000s, we reclassify all the jobs in 2015 (using ISCO-08 and NACE Rev. 2) into the previous nomenclature (ISCO-88 and NACE Rev 1.1) relying on a cross-walk constructed on the basis of the double coding used in the European Working Conditions Survey 2010 and 2015, performed by Eurofound (see Eurofound/IPSOS 2016).
There are two additional data sources required for the construction of control variables. The first one is the version of the European Union Capital, Labour, Energy, Material and Service Database (EU KLEMS) available when starting this project (The Conference Board, 2018), which allows us to retrieve information on capital stocks, jointly with their counterpart Asia KLEMS (2020). The second source is the World Integrated Trade Solution (World Bank, 2019), from which we calculate the increase in the exposure to Chinese trade across European regions.
Methods
In order to disentangle the causal effect of this technology, we exploit the sector- and country-level variation in the deployment of robots. This allows to increase the degrees of freedom of our analysis, in the fashion of Acemoglu and Restrepo (in press-a), who calculate the exposure to robot adoption by region, assuming that robots inflows during a time interval follows the distribution of employment (on which we have detailed information) in the initial period of time. Our geographical units of analysis (regions) mainly follow the Nomenclature of Territorial Units for Statistics at the second level (NUTS 2).5 Overall, we can consider NUTS 2 as closed labour markets, given the relatively low levels of mobility across these geographical regions in Europe (Gáková & Dijkstra, 2008; Janiak & Wasmer, 2008).
The right-hand-side variable of interest in our analyses refers to robots. Particularly, in order to put the robot stock in relation with the size of the labour force in the region, we employ the change in the number of robots per region divided by the initial number of workers (in thousands) there. Consequently, we define the increase in robot exposure in region i of a country c as follows:
0
0 0 0
Robot stock 1Robot exposure Robot stock∆∆ = = ∆∑ic ikc
i kckic ic kc
LL L L [1]
where Lio denotes the initial number of (thousand) workers in the region at the beginning of the analysed period (time 0); Likc, the number of workers in industry k in region i at the initial year and Lkc0, the number of workers in industry k in country c at time 0. This definition of robot exposure is identical to the concepts used in Acemoglu and Restrepo (in press-a)6 Chiacchio et al. (2018) and
4 For more details, see one of the recent reports employing this methodology, such as Fernández-Macías et al. (2017). 5 We harmonize the definition of the regions across all the databases and over all the years used in our analyses. This task of harmonization implies that, in some cases, we have to aggregate several units into a larger one. In order to contextualize the size of the regions, NUTS 2 represent states in Germany or Austria or Autonomous Communities in Spain. 6 Acemoglu and Restrepo (in press-a) include an adjustment term in their measure of robot exposure to account for the overall expansion of each industry's output in their benchmark estimate. However, they show in a robustness analysis in Table A5 of their Appendix that the results do not change qualitatively when omitting this term. We thus choose to omit the term in our paper to keep the model as simple as possible and to allow for comparability with Chiacchio et al. (2018) and Dauth et al. (2017).
The labour market impact of robotisation in Europe
8
Dauth et al. (2017). Indices i and c are nested, in the sense that a region i always belongs to a country c. Nevertheless, we need both indices to construct the robot density in each region. Hereafter, in order to simplify notation, we refer to each region as i instead of ci.
Unfortunately, the IFR robot database is subject to different measurement problems that have to be accounted for before using the data for econometric analysis. Even in those countries with information for all years and sectors, there is a non-negligible proportion of unspecified stocks and deliveries of robots. Furthermore, in some countries, in the early years there is only information on the total figures of robots, with no reference to the economic sector of deployment. The IFR itself reconstructs the series of robot stocks on the basis of deliveries and a 12-year depreciation assumption (i.e., a robot is fully functional until reaching 12 years of life, when it is withdrawn), with the exception of some countries (e.g., Japan). In principle, the reliability of deliveries’ numbers tends to be higher, since the association of robot manufacturers directly control those inflows, but it can only estimate the stocks. In order to maximize the variability of our main variable of interest (robot adoption), we reconstruct the robot series imputing the unspecified robots under several assumptions. First, we take as given the initial stocks reported in the database and we depreciate them on the basis of the 12-year assumption and the figures observed in the first years of our windows of analysis. Second, we rely on robot deliveries because of the reasons stated above. Third, when we impute initial stocks or unspecified deliveries, we base the imputation on the three closest years to the period of interest with specified information.7
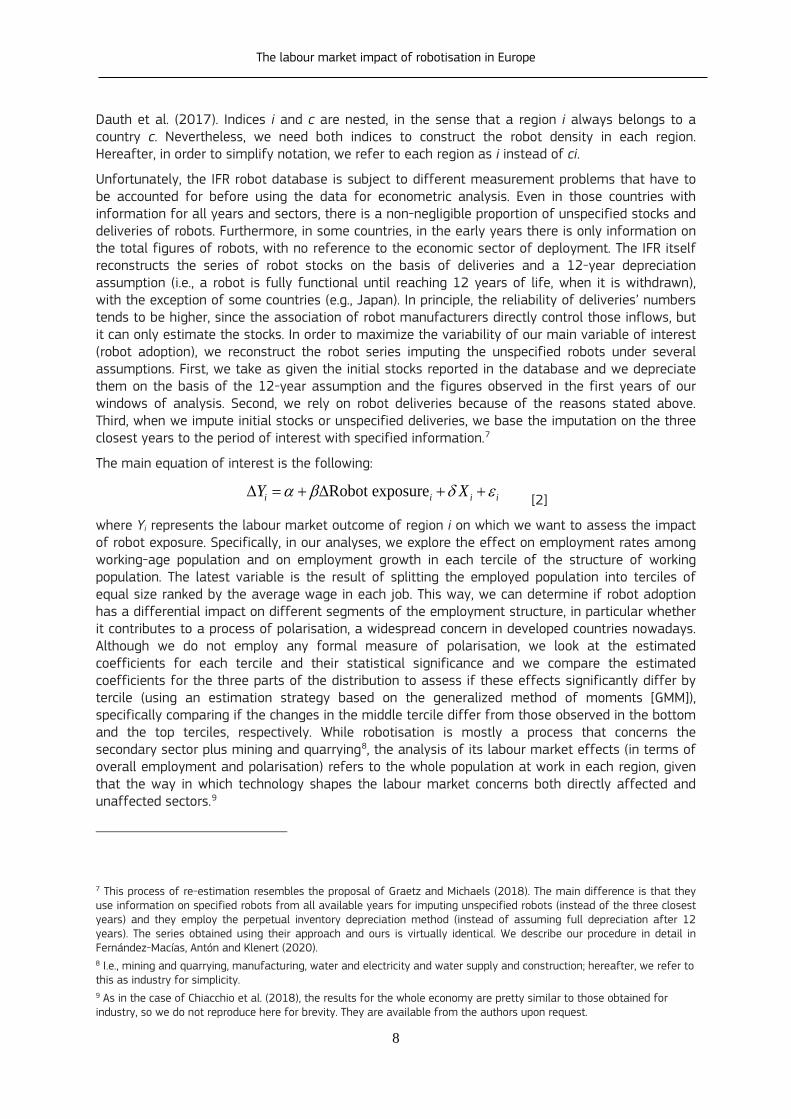
The main equation of interest is the following:
Robot exposurei i i iY Xα β δ ε∆ = + ∆ + + [2]
where Yi represents the labour market outcome of region i on which we want to assess the impact of robot exposure. Specifically, in our analyses, we explore the effect on employment rates among working-age population and on employment growth in each tercile of the structure of working population. The latest variable is the result of splitting the employed population into terciles of equal size ranked by the average wage in each job. This way, we can determine if robot adoption has a differential impact on different segments of the employment structure, in particular whether it contributes to a process of polarisation, a widespread concern in developed countries nowadays. Although we do not employ any formal measure of polarisation, we look at the estimated coefficients for each tercile and their statistical significance and we compare the estimated coefficients for the three parts of the distribution to assess if these effects significantly differ by tercile (using an estimation strategy based on the generalized method of moments [GMM]), specifically comparing if the changes in the middle tercile differ from those observed in the bottom and the top terciles, respectively. While robotisation is mostly a process that concerns the secondary sector plus mining and quarrying8, the analysis of its labour market effects (in terms of overall employment and polarisation) refers to the whole population at work in each region, given that the way in which technology shapes the labour market concerns both directly affected and unaffected sectors.9
7 This process of re-estimation resembles the proposal of Graetz and Michaels (2018). The main difference is that they use information on specified robots from all available years for imputing unspecified robots (instead of the three closest years) and they employ the perpetual inventory depreciation method (instead of assuming full depreciation after 12 years). The series obtained using their approach and ours is virtually identical. We describe our procedure in detail in Fernández-Macías, Antón and Klenert (2020). 8 I.e., mining and quarrying, manufacturing, water and electricity and water supply and construction; hereafter, we refer to this as industry for simplicity. 9 As in the case of Chiacchio et al. (2018), the results for the whole economy are pretty similar to those obtained for industry, so we do not reproduce here for brevity. They are available from the authors upon request.

The labour market impact of robotisation in Europe
9
Xi comprises a set of control variables, including some covariates referred to the initial period (share of employment in industry in the region, population [thousand people, in logs], share of females, share of people aged 65 or more, share of highly or medium educated population, share of foreign population, average routine task index [RTI] and average offshorability index). Furthermore, this vector considers the change in ICT capital stock per initial worker in the region of interest and the change in exposure to China net imports per initial worker during the period of interest. The set of covariates are very similar to the ones used by Autor, Dorn and Hanson (2013) in their exploration of the effects of Chinese imports shock on American labour markets or the work of Acemoglu and Restrepo (in press-a) on robot adoption.
The logic of controlling for the initial values of RTI and offshorability is to rule out that the impact of robots conflates with other developments of employment associated to technological changes but alien to robotisation.10 We compute the region-level change in ICT capital and Chinese net imports from sector-level data, so we have to follow a similar procedure, based on the employment distribution by region and industry, to the one employed for calculating the exposure to robot adoption of each geographical unit. These last two variables are likely to be endogenous, so we include them only to carry out some robustness checks of our main results. It is also worth mentioning that the coverage of capital stocks in the EU KLEMS is far from perfect, sometimes limited to less than 10 countries, depending on the period of analysis. Because of this reason, we often show the results of different econometric specifications with and without the latter control variable. For instance, while in some specifications (such as in the analysis of employment using stacked differences) we are able to consider 28 countries, in others, we can just look at 6 (long differences when exploring the effect on employment structure using capital data).
We extend the model in a further specification splitting the sample into two pooled periods (1995–2005 and 2005–2015), including a dummy variable, and adding geographical dummies aiming to capture group-of-countries-specific time trends.11 We employ long differences in order to increase the signal-to-noise ratio. Particularly, measurement error is very likely to be present in robot stocks, for the reasons mentioned above. At the same time, within-region variation accounts for most of the variability of the robot stock. In these circumstances, looking at year-by-year differences, the measurement error might have a higher weight than under a long-differences approach. Furthermore, the loss of efficiency due to this setting is minimal here, since we cluster standard errors at the regional level in order to control for serial correlation across geographical units.
Even after controlling for unobserved time-constant heterogeneity (through the first difference) and different sets of covariates, there is room for the existence of region-specific factors that are potentially correlated with the deployment of robots. This problem would result in inconsistent estimates of β. If, e.g., if robot adoption tends to be faster in the most dynamic regions, the estimated coefficient would be downwards biased. In the absence of natural experiments, we resort to the IV strategy proposed by Acemoglu and Restrepo (in press-a). These
10 The RTI index, proposed by Autor and Dorn (2013), aims at measuring to which extent an occupation is routine-task intensive. The logic behind using the RTI measure is that automation is more likely to affect routine, manual, non-interactive job tasks. Fernández-Macías et al. (2016) offer an alternative set of measures of routinization. Nevertheless, we employ the former approach for the sake of comparison with previous literature (which widely uses the RTI measure) and because of the focus of the RTI index on detecting tasks susceptible to replacement by machines (rather than actually measuring the true nature of the task) and the characteristics of our data (where economic activity is not available at the level of detail used by the these authors. 11 Particularly, we consider the following groups of countries: Nordic, British Islands, Continental (reference category), Mediterranean and Eastern Europe. We are unable to include country dummies given that some states only contain a traceable region. In some specifications containing few countries, we have to necessarily drop some of those dummies.
The labour market impact of robotisation in Europe
10
authors build a regional exposure to robotisation based on the penetration of robots in other developedin this case, Europeancountries. Dauth et al. (2017) follow a similar strategy in their study for Germany, trying to exclude border countries and states in the Euro Area, aiming to minimize the existence of common economic shocks among Germany and the countries employed for building the instrument. Chiacchio, Petropoulos and Pichler (2018) use the United Kingdom and Denmark, apart from lagged employment protection legislation, which can raise some endogeneity concerns.
By contrast, in this paper, we use of average change in robot penetration per worker by industry in South Korea, one of the main leaders in robot adoption worldwide, as an instrumental variable. Furthermore, because of the relatively small size of South Korea compared to the global economy, it is unlikely that their sector-level developments could trigger general-equilibrium effects on the countries covered in our analysis. We believe that this instrument might have some advantages over the one used by Chiacchio, Petropoulos and Pichler (2018). They base their IVs on the increase in robot exposure in the United Kingdom and Denmark (which might experience sector-level economic shocks correlated with those in the rest of the continent) and on the Employment Protection Legislation in 1990, which is a dubious exogenous variable (even if the IVs pass the Hansen J test), given that labour market rigidity might affect wage performance and that the level of employment protection is likely to be persistent over time.
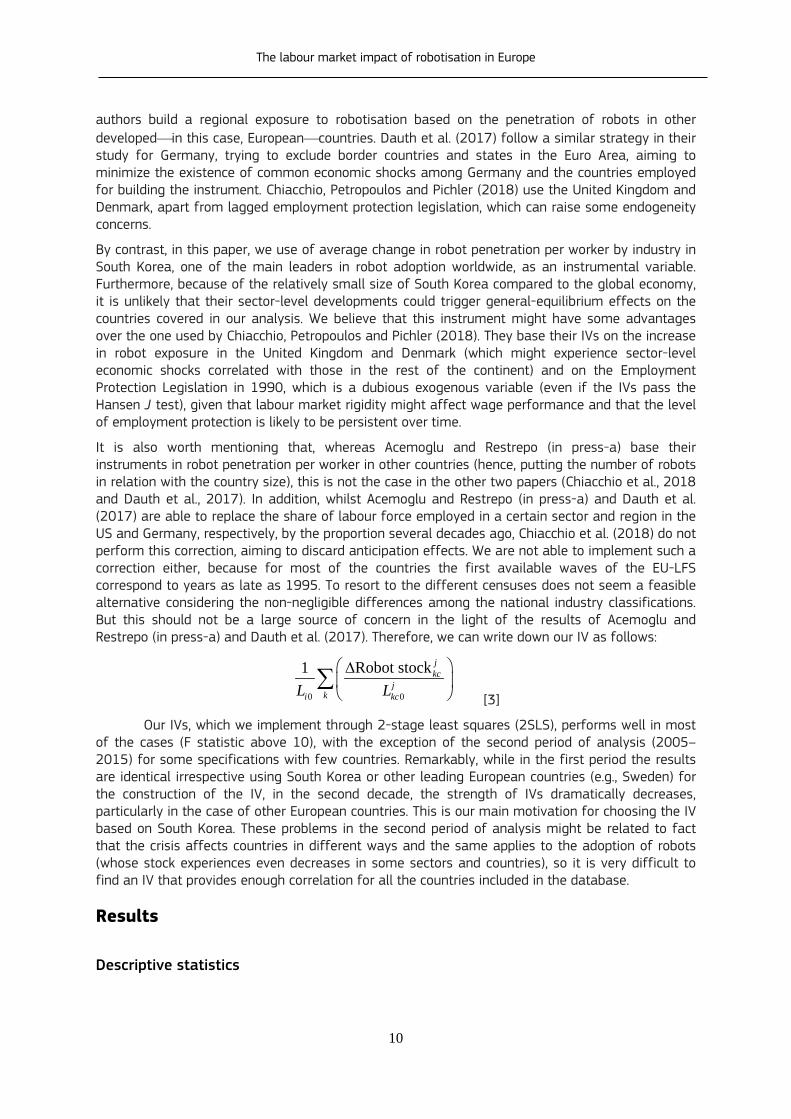
It is also worth mentioning that, whereas Acemoglu and Restrepo (in press-a) base their instruments in robot penetration per worker in other countries (hence, putting the number of robots in relation with the country size), this is not the case in the other two papers (Chiacchio et al., 2018 and Dauth et al., 2017). In addition, whilst Acemoglu and Restrepo (in press-a) and Dauth et al. (2017) are able to replace the share of labour force employed in a certain sector and region in the US and Germany, respectively, by the proportion several decades ago, Chiacchio et al. (2018) do not perform this correction, aiming to discard anticipation effects. We are not able to implement such a correction either, because for most of the countries the first available waves of the EU-LFS correspond to years as late as 1995. To resort to the different censuses does not seem a feasible alternative considering the non-negligible differences among the national industry classifications. But this should not be a large source of concern in the light of the results of Acemoglu and Restrepo (in press-a) and Dauth et al. (2017). Therefore, we can write down our IV as follows:
0 0
Robot stock1 jkc
jki kcL L ∆
∑ [3]
Our IVs, which we implement through 2-stage least squares (2SLS), performs well in most of the cases (F statistic above 10), with the exception of the second period of analysis (2005–2015) for some specifications with few countries. Remarkably, while in the first period the results are identical irrespective using South Korea or other leading European countries (e.g., Sweden) for the construction of the IV, in the second decade, the strength of IVs dramatically decreases, particularly in the case of other European countries. This is our main motivation for choosing the IV based on South Korea. These problems in the second period of analysis might be related to fact that the crisis affects countries in different ways and the same applies to the adoption of robots (whose stock experiences even decreases in some sectors and countries), so it is very difficult to find an IV that provides enough correlation for all the countries included in the database.
Results
Descriptive statistics

The labour market impact of robotisation in Europe
11
We construct two region-level datasets (of employment and employment by terciles), which share much of their content, but they are not identical. As mentioned above, we carry out a harmonization of the regions over time and across different databases focusing on the years necessary for performing the econometric analysis (1995, 2005 and 2015), trying to lose as little information as possible.12 Table 1 displays descriptive statistics of the main variables used in the analysis of employment.13 They are not particularly illustrative, and we show them mainly because of a formal motivation, as the number of available regions changes from 1995–2005 to 2005–2015 because of the EU enlargement. Whereas one can adequately deal with this issue in a regression framework or when evaluating changes, it makes the information embedded in the descriptive statistics of limited usefulness for the reader.
We present in Figure 1 some pairwise correlations between the change in the employment rate and the increase in robot exposure. Focusing on manufacturing only, we can observe a virtual absence of correlation in the first decade and a strong positive correlation over the second time span. The (positive) relationship observed for the 20-year time span results from the aggregation of these two heterogeneous sub-periods. Observations are combined by weighting them by the population of each region in 1995.The sample is restricted to the subset of countries for which labour market information is available for the whole period.
12 For a detailed assessment of the evolution of employment and robot figures by country over time, see Fernández-Macías, Antón and Klenert (2020). 13 In the case of the structure of employment the available number of regions is a bit lower, but the descriptive statistics are similar, and we do not show them here for brevity (although they are available upon request from the authors).

The labour market impact of robotisation in Europe
12
Table 1. Descriptive statistics of the sample used in the analysis of the impact of robotisation on employment
Means
(standard deviations)
1995 2005 2015
Robots per thousand workers 0.626 1.032 1.468
(0.599) (1.235) (1.381)
Employment rate (working-age population) 0.579 0.624 0.641
(0.087) (0.075) (0.085)
Employment rate in industry (working-age population) 0.162 0.173 0.158
(0.045) (0.046) (0.056)
Share of employment in industry (% of workers) 0.277 0.276 0.243
(0.067) (0.071) (0.079)
Population (thousands) 2,869.762 2,622.326 2,721.701
(3,311.206) (2,949.564) (3,089.954)
Share of females (% of working-age population) 0.499 0.500 0.499
(0.012) (0.009) (0.009)
Share of population aged 65 or more (% of population) 6.534 6.156 5.398
(1.317) (1.247) (0.936)
Share of highly or medium educated population (% of working age population) 0.477 0.644 0.720
(0.169) (0.139) (0.118)
Share of foreigners (% of working-age population) 0.052 0.070 0.095
(0.056) (0.073) (0.091)
Average RTI by region 0.088 -0.002 0.008
(0.095) (0.078) (0.107)
Average offshorability index by region -0.087 -0.110 -0.071
(0.170) (0.127) (0.129)
ICT capital stock (thousand US$ per worker) 301.255 2,018.782 2,202.296
(467.080) (2,025.366) (2,832.234)
Chinese net imports (US$ per worker) 6.778 6.690 6.248
(2.311) (2.219) (1.771)
No. of observations (regions) 129 187 187
Notes: Data are not weighted. The number of observations is lower for some variables. Source: Authors’ analysis from IFR (2018), EU-LFS, ECHP, EU KLEMS and WITS.

The labour market impact of robotisation in Europe
13
Figure 1. Correlation between change in employment rates and change in robot exposure (1995–2015)
Note: Data are weighted by the initial employment figures.
Source: Authors’ analysis from IFR (2018), EU-LFS and ECHP

The labour market impact of robotisation in Europe
14
.
Econometric results
Effects on employment
Tables 2 and 3 display the OLS and 2SLS estimates of the effect of robot adoption on industrial employment. We present estimations for each decade, for the period 1995-2015, and using stacked differences. We also estimate models with our baseline covariates and additionally with exposure to Chinese net imports and the increase in ICT-capital. We further consider a set of models without (Table 2) and with group-specific trends (Table 3). In principle, it is a sign of robustness that the estimates do not change much when including these controls. We further argue that including these dummies controls to some extent for the existence of different trends in employment creation across Europe that might confound the impact of robots. However, there is some debate about the convenience of including such dummies in some econometric settings as they might capture dynamic effects of the regressor of interest, particularly, in differences-in-differences designs (Wolfers, 2006). In most of our cases, the F-statistic of our IV is above the common threshold of 10, indicating its relevance, although in the case of stacked differences its strength decreases.14 In the following tables, we present the most complete specifications, distinguishing between models including and excluding trade and capital (which are both potentially endogenous variables and which, in the case of the latter, reduce the countries available in the database). Models with less control covariates are available upon request.
Table 2 presents the results without controlling for group-specific trends. In the first period we find a small but significant negative association between robotisation and employment in the case of the 2SLS estimates. For the OLS estimator coefficients are positive and even smaller but not significant. In the second period the results of both the OLS and 2SLS estimates are positive and of similar magnitudes, but they are only significant for the OLS estimator. Looking at the full period using stacked differences, we find a positive and significant association for both OLS and 2SLS and independent of the trade and capital controls. Using a long-difference estimator we find significant (but small) negative effects in the case of the 2SLS with capital and trade controls. All other estimates using a long-difference approach are not significant, small and with varying sign. In most cases, controlling for trade and capital does not make much of a difference.
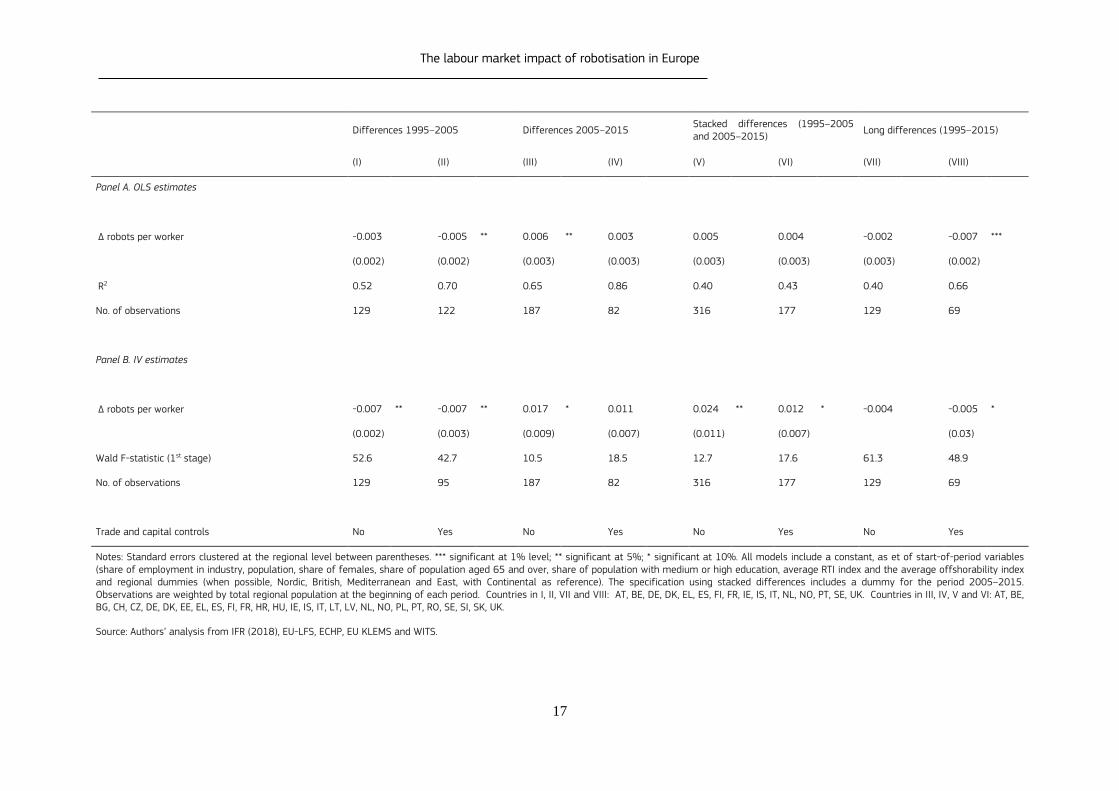
Results accounting for group-specific trends are reported in Table 3. In the first period, we can see by comparing the first two columns of Tables 2 and 3 that when we include the control covariates (specifically, region-specific trends, that account for the possibility that the path of employment growth is different across different groups of countries), the coefficients of the 2SLS estimate remain negative and significant while the coefficients for the OLS estimates now also become negative and, when controlling for trade and capital, significant.15
In the second period, results become positive and significant in most cases and the coefficients are relatively large for the 2SLS estimator, compared to the other estimates. It appears that the strength of our IV decreases in the second period of analysis. This can be related to the heterogeneity of economic performance of countries during the Great Recession and subsequent
14 Details on the first stage are available upon request. 15 For the period 1995–2005, we replicate the negative descriptive correlation identified by Chiacchio, Petropoulos and Pichler (2018) for a similar time span (1995–2007) if we limit the sample to the same six countries they consider (a coefficient of correlation of −0.17 using the population of each region as weights).

The labour market impact of robotisation in Europe
15
recovery, also affecting robot adoption.16 We have checked how sensitive the results in the second period might be with regard to the selection of countries. Looking at the same countries as in the specification including capital and even only at a subset of six countries (Finland, France, Germany, Italy, Spain and Sweden), correlations are positive in both OLS and IV estimates and in many cases statistically significant.
Looking at the entire period the results are very similar to the case without covariates described in Table 2: For the stacked differences, the coefficients are positive, but only significant for the 2SLS estimator. For long differences, the coefficients are very small and negative, but only significant when trade and capital controls are included. When looking at the impact of employment in the same subset of countries as Chiacchio et al. (2018), not shown here for brevity, the results are similar.
16 We also experiment with other instruments for both the first and second period, based on the evolution of Swedish or Finnish robot density. The results for the first decade are analogous to the ones used when employing South Korea, while in the second period, they are very weak.

The labour market impact of robotisation in Europe
16
Table 2. The effects of robot adoption on employment rate in industry without group-specific trends (OLS and 2SLS estimates, 1995–2015)
Differences 1995–2005 Differences 2005–2015 Stacked differences (1995–2005 and 2005–2015)
Long differences (1995–2015)
(I) (II) (III) (IV) (V) (VI) (VII) (VIII)
Panel A. OLS estimates
∆ robots per worker 0.003 0.001 0.006 ** 0.009 *** 0.005 * 0.007 ** 0.002 -0.004
(0.003) (0.003) (0.003) (0.003) (0.003) (0.003) (0.003) (0.003)
R2 0.32 0.43 0.61
No. of observations 129 95 187
Panel B. IV estimates
∆ robots per worker -0.009 * -0.009 ** 0.006 0.012 0.017 * 0.015 * -0.008 -0.009 **
(0.005) (0.004) (0.007) (0.009) (0.009) (0.008) (0.005) (0.005)
Wald F-statistic (1st stage) 26.3 29.1 8.3 6.1 11.1 12.11 25.3 20.3
No. of observations 129 95 187 82 316 177 129 69
Trade and capital controls No Yes No Yes No Yes No Yes
Notes: Standard errors clustered at the regional level between parentheses. *** significant at 1% level; ** significant at 5%; * significant at 10%. All models include a constant, as et of start-of-period variables (share of employment in industry, population, share of females, share of population aged 65 and over, share of population with medium or high education, average RTI index and the average offshorability index. The specification using stacked differences includes a dummy for the period 2005–2015. Observations are weighted by total regional population at the beginning of each period
Source: Authors’ analysis from IFR (2018), EU-LFS, ECHP, EU KLEMS and WITS. Countries in I, II, VII and VIII: AT, BE, DE, DK, EL, ES, FI, FR, IE, IS, IT, NL, NO, PT, SE, UK. Countries in III, IV, V and VI: AT, BE, BG, CH, CZ, DE, DK, EE, EL, ES, FI, FR, HR, HU, IE, IS, IT, LT, LV, NL, NO, PL, PT, RO, SE, SI, SK, UK.
Table 3. The effects of robot adoption on employment rate in industry with group-specific trends (OLS and 2SLS estimates, 1995–2015)
The labour market impact of robotisation in Europe
17
Differences 1995–2005 Differences 2005–2015 Stacked differences (1995–2005 and 2005–2015) Long differences (1995–2015)
(I) (II) (III) (IV) (V) (VI) (VII) (VIII)
Panel A. OLS estimates
∆ robots per worker -0.003 -0.005 ** 0.006 ** 0.003 0.005 0.004 -0.002 -0.007 ***
(0.002) (0.002) (0.003) (0.003) (0.003) (0.003) (0.003) (0.002)
R2 0.52 0.70 0.65 0.86 0.40 0.43 0.40 0.66
No. of observations 129 122 187 82 316 177 129 69
Panel B. IV estimates
∆ robots per worker -0.007 ** -0.007 ** 0.017 * 0.011 0.024 ** 0.012 * -0.004 -0.005 *
(0.002) (0.003) (0.009) (0.007) (0.011) (0.007) (0.03)
Wald F-statistic (1st stage) 52.6 42.7 10.5 18.5 12.7 17.6 61.3 48.9
No. of observations 129 95 187 82 316 177 129 69
Trade and capital controls No Yes No Yes No Yes No Yes
Notes: Standard errors clustered at the regional level between parentheses. *** significant at 1% level; ** significant at 5%; * significant at 10%. All models include a constant, as et of start-of-period variables (share of employment in industry, population, share of females, share of population aged 65 and over, share of population with medium or high education, average RTI index and the average offshorability index and regional dummies (when possible, Nordic, British, Mediterranean and East, with Continental as reference). The specification using stacked differences includes a dummy for the period 2005–2015. Observations are weighted by total regional population at the beginning of each period. Countries in I, II, VII and VIII: AT, BE, DE, DK, EL, ES, FI, FR, IE, IS, IT, NL, NO, PT, SE, UK. Countries in III, IV, V and VI: AT, BE, BG, CH, CZ, DE, DK, EE, EL, ES, FI, FR, HR, HU, IE, IS, IT, LT, LV, NL, NO, PL, PT, RO, SE, SI, SK, UK.
Source: Authors’ analysis from IFR (2018), EU-LFS, ECHP, EU KLEMS and WITS.

The labour market impact of robotisation in Europe
18
When we look exclusively at manufacturing employment (instead of focusing on employment in mining and quarrying, manufacturing, electricity and water supply and construction) the results are similar. We present the results for the whole economy in Table A1 in the Annex. They are essentially in line with the ones presented in Tables 2 and 3: the effects tend to be negative in the first period, while in the second period they tend to be positive. When looking at the entire period, stacked differences suggest a relatively large positive effect, while the long-difference approach is inconclusive. In this respect, our results from the first period resemble those of Dauth et al. (2017), who find negative employment effects only in manufacturing sectors, not in the whole economy, while our results from the second period and from the stacked differences approach for the entire period appear to confirm the positive association between robotisation and employment found in Klenert et al. (2020).17
Effects on employment structure
In this section we analyse the impact of robot adoption on different parts of the distribution of employment across occupations. Assessing the effect of this technology on different segments of the labour market is a way to check whether robots have contributed to the phenomenon of job polarisation.18 We adopt a simplified approach for characterizing polarisation, comparing the effect of the variable of interest on employment in the middle occupational tercile relative to the extremes. If this difference is very small, we consider that there is no polarisation effect.19 The dependent variable is employment in each occupational tercile. The terciles are obtained by ranking jobs, a crossing of two-digit ISCO and NACE classifications, by their average wages and then assigning them to three groups of equal size in terms of initial employment. For more details on this method see chapter 2 in Fernández-Macías et al. (2017).
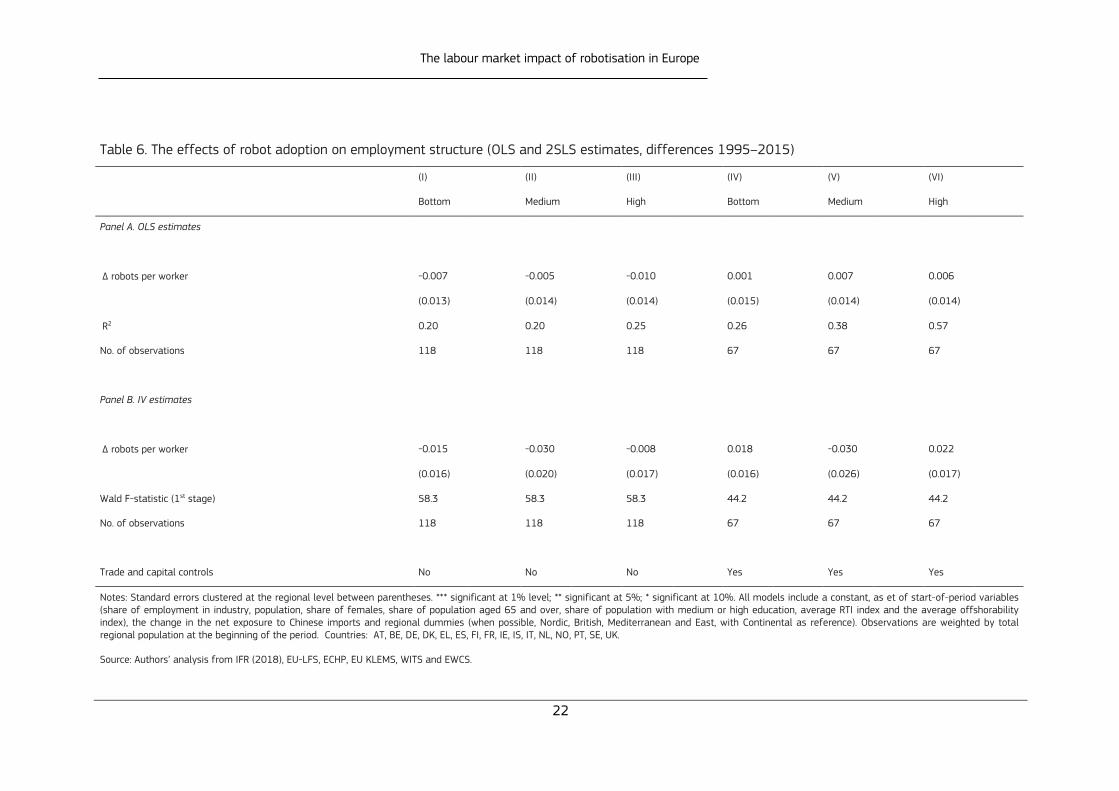
The results for 1995–2005, 2005–2015 using stacked differences and long differences are given in Tables 4, 5, 6 and 7, respectively. Each table contains both the OLS and the 2SLS estimates. In all cases, we have included our main baseline controls and group-specific trends and we present another specification including capital and trade.
Regarding the first decade of the analysis (Table 4), our results point to a significant negative effect on the middle tercile, which could be viewed as evidence for polarisation (results for the bottom and top tercile are not significant). However, performing several equality tests based on a GMM model yields that the effect on the middle tercile is not significantly different from the effect in the bottom and the top terciles. We find that the estimated coefficient for the middle tercile is significantly different from the coefficient for the top tercile. However, it is fairly similar to the bottom coefficient.20 Rather than indicating polarisation, this finding suggests upgrading (a
17 Why are our findings from the first period at odds with Klenert et al. (2020)? The main difference is that in the current paper we look at robots installed in a specific region, while Klenert et al. (2020) look at robots in a specific sector. This implies that in the first period, a decline in employment in a region in sectors that are not robot-intensive outweighs increases in employment in the same region in robot-intensive sectors. As a corollary, employment spillover effects from robot-intensive sectors to non robot-intensive sectors within regions are relatively small. 18 Job polarisation refers to a decline of employment in mid-skilled or mid-paid occupations relative to the highest and lowest (see Goos and Manning 2007, Fernández-Macías 2012). 19 Although this approach is certainly quite crude, it is in line with the sort of measures used in this literature (see, for instance, Goos and Manning [2007] or Fernández-Macías [2012], among many others). 20 We have to carry out specific equality tests using a simultaneous equation model estimated by GMM because the samples are not independent. Therefore, the covariance among the estimated coefficients is not zero and we cannot determine the existence of significant differences among them by simply inspecting the confidence intervals or the

The labour market impact of robotisation in Europe
19
relative expansion of the top tercile). Nevertheless, we should interpret this result with some caution, given the outcome of the test and the limited statistical power of our analysis.
During the second period (Table 5), results for the OLS estimator are significant for all terciles when looking at the specification without capital, but we observe no evidence of polarisation. When capital and trade controls are included, the increase in employment is significantly different from zero and positive in the bottom and the top tercile, which could be interpreted as a sign of job polarisation. However, our statistical tests based on a GMM model do not allow rejecting that the estimated coefficient for the middle quintile differ from neither the bottom nor the top one. In the case of the long differences (Table 6), none of the estimated coefficients are statistically significant.
Finally, Table 7 displays the results of the model using stacked differences. In this case, the results are somewhat puzzling. In the case of the OLS, the coefficients are not statistically significant. When looking at the 2SLS estimates, we observe a pattern that differs from the one shown in Table 4 and Table 5. The coefficients are positive, as in Tables 4 and 5, but the coefficient of the middle tercile is larger than the coefficients of the bottom and top terciles, which would in fact suggest a reversal of job polarisation. These results should be interpreted with caution, since the strength of our instrument decreases substantially when using stacked differences while the magnitudes of the coefficient do not. The reasons for such a large deviation of the OLS from the IV estimates remain unclear.
For brevity, we do not present the analyses that exclude regional dummies. These results, available upon request from the authors, are roughly in line with the results presented in Table 7. There are some signs of polarising effects in the period 1995–2005, with comparatively less negative impact of employment in the bottom and the top of the employment distribution than in the middle. However, the differences between the change in the middle tercile and at least one of the extremes is not always significant. In the case of the period 2005–2015, where the results suggest a certain polarisation (but accompanied by employment growth), the results excluding dummies support less of a polarising pattern than the results presented in Tables 4-7.
standard errors. We comment on the p-values of these tests in the main text, but we do not show the details here (they are available from the authors upon request).

20
Table 4. The effects of robot adoption on employment structure (OLS and 2SLS estimates, differences 1995–2005)
(I) (II) (III) (IV) (V) (VI)
Bottom Medium High Bottom Medium High
Panel A. OLS estimates
∆ robots per worker -0.018 -0.030 * -0.003 -0.017 -0.023 * -0.014
(0.018) (0.017) (0.018) (0.016) (0.013) (0.012)
R2 0.27 0.36 0.26 0.50 0.55 0.60
No. of observations 118 118 118 86 86 86
Panel B. IV estimates
∆ robots per worker -0.012 -0.052 ** -0.014 -0.017 -0.059 *** -0.024
(0.021) (0.023) (0.021) (0.022) (0.021) (0.015)
Wald F-statistic (1st stage) 54.5 54.5 54.5 44.3 44.3 44.3
No. of observations 118 118 118 86 86 86
Trade and capital controls No No No Yes Yes Yes
Notes: Standard errors clustered at the regional level between parentheses. *** significant at 1% level; ** significant at 5%; * significant at 10%. All models include a constant, as et of start-of-period variables (share of employment in industry, population, share of females, share of population aged 65 and over, share of population with medium or high education, average RTI index and the average offshorability index), the change in the net exposure to Chinese imports and regional dummies (when possible, Nordic, British, Mediterranean and East, with Continental as reference). Observations are weighted by total regional population at the beginning of the period. Countries: AT, BE, DE, DK, EL, ES, FI, FR, IE, IS, IT, NL, NO, PT, SE, UK.
Source: Authors’ analysis from IFR (2018), EU-LFS, ECHP, EU KLEMS, WITS and EWCS.
The labour market impact of robotisation in Europe

The labour market impact of robotisation in Europe
21
Table 5. The effects of robot adoption on employment structure (OLS and 2SLS estimates, differences 2005–2015)
(I) (II) (III) (IV) (V) (VI)
Bottom Medium High Bottom Medium High
Panel A. OLS estimates
∆ robots per worker 0.062 *** 0.047 *** 0.032 ** 0.034 ** 0.023 0.035 **
(0.018) (0.016) (0.015) (0.017) (0.016) (0.018)
R2 0.27 0.33 0.20 0.41 0.69 0.34
No. of observations 150 150 150 82 82 82
Panel B. IV estimates
∆ robots per worker 0.056 0.055 0.048 0.046 * 0.011 0.083 ***
(0.041) (0.037) (0.034) (0.027) (0.033) (0.027)
Wald F-statistic (1st stage) 29.9 29.9 29.9 12.3 12.3 12.3
No. of observations 150 150 150 82 82 82
Trade and capital controls No No No Yes Yes Yes
Notes: Standard errors clustered at the regional level between parentheses. *** significant at 1% level; ** significant at 5%; * significant at 10%. All models include a constant, as et of start-of-period variables (share of employment in industry, population, share of females, share of population aged 65 and over, share of population with medium or high education, average RTI index and the average offshorability index), the change in the net exposure to Chinese imports and regional dummies (when possible, Nordic, British, Mediterranean and East, with Continental as reference). Observations are weighted by total regional population at the beginning of the period. Countries: AT, BE, BG, CH, CZ, DE, DK, EE, EL, ES, FI, FR, HR, HU, IE, IS, IT, LT, LV, NL, NO, PL, PT, RO, SE, SI, SK, UK.
Source: Authors’ analysis from IFR (2018), EU-LFS, ECHP, EU KLEMS, WITS and EWCS.
The labour market impact of robotisation in Europe
22
Table 6. The effects of robot adoption on employment structure (OLS and 2SLS estimates, differences 1995–2015)
(I) (II) (III) (IV) (V) (VI)
Bottom Medium High Bottom Medium High
Panel A. OLS estimates
∆ robots per worker -0.007 -0.005 -0.010 0.001 0.007 0.006
(0.013) (0.014) (0.014) (0.015) (0.014) (0.014)
R2 0.20 0.20 0.25 0.26 0.38 0.57
No. of observations 118 118 118 67 67 67
Panel B. IV estimates
∆ robots per worker -0.015 -0.030 -0.008 0.018 -0.030 0.022
(0.016) (0.020) (0.017) (0.016) (0.026) (0.017)
Wald F-statistic (1st stage) 58.3 58.3 58.3 44.2 44.2 44.2
No. of observations 118 118 118 67 67 67
Trade and capital controls No No No Yes Yes Yes
Notes: Standard errors clustered at the regional level between parentheses. *** significant at 1% level; ** significant at 5%; * significant at 10%. All models include a constant, as et of start-of-period variables (share of employment in industry, population, share of females, share of population aged 65 and over, share of population with medium or high education, average RTI index and the average offshorability index), the change in the net exposure to Chinese imports and regional dummies (when possible, Nordic, British, Mediterranean and East, with Continental as reference). Observations are weighted by total regional population at the beginning of the period. Countries: AT, BE, DE, DK, EL, ES, FI, FR, IE, IS, IT, NL, NO, PT, SE, UK.
Source: Authors’ analysis from IFR (2018), EU-LFS, ECHP, EU KLEMS, WITS and EWCS.

The labour market impact of robotisation in Europe
23
Table 7. The effects of robot adoption on employment structure (OLS and 2SLS estimates, stacked differences 1995–2005 and 2005–2015)
(I) (II) (III) (IV) (V) (VI)
Bottom Medium High Bottom Medium High
Panel A. OLS estimates
∆ robots per worker 0.012 0.002 0.025 0.021 0.028 0.018
(0.016) (0.022) (0.018) (0.019) (0.022) (0.017)
R2 0.16 0.12 0.35 0.33 0.29 0.35
No. of observations 268 268 268 168 168 168
Panel B. IV estimates
∆ robots per worker 0.098 * 0.243 ** 0.144 ** 0.027 0.126 ** 0.052
(0.059) (0.096) (0.060) (0.031) (0.061) (0.035)
Wald F-statistic (1st stage) 9.9 9.9 9.9 17.0 17.0 17.0
No. of observations 268 268 268 168 168 168
∆ Chinese imports and ∆ ICT capital per worker No No No Yes Yes Yes
Notes: Standard errors clustered at the regional level between parentheses. *** significant at 1% level; ** significant at 5%; * significant at 10%. All models include a constant, as et of start-of-period variables (share of employment in industry, population, share of females, share of population aged 65 and over, share of population with medium or high education, average RTI index and the average offshorability index), regional dummies (when possible, Nordic, British, Mediterranean and East, with Continental as reference) and a time dummy for the period 2005–2015. Observations are weighted by total regional population at the beginning of the period. Countries: AT, BE, BG, CH, CZ, DE, DK, EE, EL, ES, FI, FR, HR, HU, IE, IS, IT, LT, LV, NL, NO, PL, PT, RO, SE, SI, SK, UK (depending on the period).
Source: Authors’ analysis from IFR (2018), EU-LFS, ECHP, EU KLEMS, WITS and EWCS.

24
Discussion
The results presented in the previous section are to some extent puzzling, as the association between robots and employment appears to be predominantly negative in the first half of the observed period and largely positive in the second half. This leads to mostly inconclusive and sometimes positive estimates when pooling the observations to include both periods. In this section we discuss possible reasons behind this outcome and compare our results to the literature.
There are several possible explanations for the discrepancy between the two periods. In the first place, there might be some sort of unobserved heterogeneity that we are not able to control for (e.g., the differential geographic impact of the economic crisis of 2008). Second, the differences in the results between periods might be influenced by the effect of robotisation on productivity. While the potential negative effect of robot adoption on employment is immediate and likely to be constant over time, the potential positive impact associated with productivity gains manifests itself later (Acemoglu and Restrepo, 2018b), which could explain the positive effect in the second period.21 In this fashion, Jungmittag and Pesole (2019) find a positive effect of robot adoption on productivity during a similar frame window, which increases during the second decade of the period of analysis. These authors argue that the higher rise in productivity in the latter period might be due to the existence of nonlinearities, such as a minimum level of robot stock being required for driving such a positive impact. Third, the effect of robotisation is generally small in magnitude (which can be seen from the estimation coefficients) and the quality of the data simply might not allow it to be isolated, a problem that is further aggravated when looking at the installation of robots in regions instead of sectors. As Fernández-Macías et al. (2020) have shown, robots are highly concentrated in specific manufacturing sectors – attributing them to different regions might further complicate identification of the effect among other factors that impact employment in the region. Fourth, we include countries in the second period for which no data was available in the first period. In particular eastern European countries exhibited a strong growth in robotisation (see Fernández-Macías et al., 2020) as well as expanding economically after 2005. Fifth, we should not rule out that these results are due to another sort of heterogeneity: we consider a 20-year period, during which robotic technology may have significantly advanced, so it is conceivable that more recent robots have a higher impact on productivity or increased complementarity to the existing labour force than the older models, even against the backdrop of a fraction of replaceable workers already having been displaced.
Regarding other literature on this topic, we are able to roughly reproduce the results obtained by Chiacchio et al. (2018) for the first period and a similar set of countries, particularly when looking at employment in mining, quarrying, manufacturing, electricity, water supply and construction. In the case of the whole economy, the effects are weaker but still present. Our findings also resemble those of Acemoglu and Restrepo (in press-a), who find a negative correlation for a period of analysis from 1993 to 2007.
In the second period (2005–2015), the impact of robots on employment is positive for the majority of model specifications. It also is mostly positive when looking at both periods using a stacked differences approach. This suggests positive effects of robotisation on employment similar to those found by Klenert et al. (2020) and Dahlin (2019). However, they use a different approach, which is based on sector-level penetration of robots in Europe and the United States, respectively, not on the
21 This is roughly related to an argument that Jaeger, Ruist and Stuhler (2018) make about the short- and long-run impacts of immigration: If a certain shock (e.g., robots or migration) might have a different effect in the short and the long run, the coefficient of interest in the type of econometric specification employed here and widely in the literature conflates both kinds of impacts.
The labour market impact of robotisation in Europe
25
regional distribution of robots. Graetz and Michaels (2018), who also use an approach based on the classification of robots by sector, do not find a correlation between robotisation and total employment for the period 1993 to 2007. In sum, this striking heterogeneity of results suggests that the effects of industrial robots on employment in the period studied are relatively small and depend to a great extent on the model specifications and the selection of countries and years analysed.
We should also acknowledge the limitations imposed by the number of regions included in the analysis, which determine the degrees of freedom and the statistical power of our econometric tests. Although we make a considerable effort in enlarging the sample as much as possible, it is undeniable that this issue imposes an important constraint and, in many cases, it is difficult to assess the extent to which the lack of significance is driven by the low number of observations or by the actual absence of non-negligible effects. In relation to this issue, we should also keep in mind that the relevance of the instrument decreases substantially during the second decade, which is probably related to the larger unobserved heterogeneity during this turbulent economic period.

The labour market impact of robotisation in Europe
26
Conclusions
Nowadays, few topics generate as much interest from both public and academic circles as the impact of technology on the labour market. Within this context, our paper aims to explore the effect of industrial robots, a very specific technology, on employment and labour market polarisation in regional European labour markets. Our main contribution is twofold: first, we replicate and extend previous research on this topic in several ways, covering additional countries and years as well as exploring a broader range of instruments and specifications. Second, we analyse the impact of robot adoption on the occupational structure, to check whether this technology contributes to job polarisation.
Overall, our results suggest that the effects of robots on regional labour markets are generally small and not particularly robust, as they appear to differ over time: our estimates for the period 1995–2005 suggest a negative association between robotisation and employment in Europe, while in the second period (2005–2015), this association becomes positive.
Regarding the impact on employment structure, there is some weak evidence that robotisation might have polarised the labour market to some extent in the period 1995-2005. However, this effect is not observed in the second period. Interestingly, for certain model specifications, job polarisation appears to be reversed when looking at the whole period (1995-2015); that is, we find a more pronounced positive effect of robotisation on the middle tercile. For all periods analysed, however, the statistical significance greatly depends on the model specifications and therefore the results regarding the employment structure should be interpreted with additional caution.
Previous studies that analyse the employment effect of robots in local labour markets with similar methods only use data up to 2007 (Acemoglu and Restrepo, in press-a; Chiacchio, Petropoulos & Pichler, 2018). It is therefore not surprising that we confirm their finding of a negative association between robots and employment in the first period. Studies that instead use an approach based on a classification of robots by sector, instead of region, appear to find a positive effect of robots on aggregate employment (Klenert et al., 2020) or no effect at all (Graetz and Michaels, 2018). In contrast to Graetz and Michaels (2018), Klenert et al. (2020) also analyse the period until 2015 and find an overall positive correlation between robots and employment.
Where could the differences in the effect of robotisation on aggregate employment between the two periods and between different approaches come from? We have four hypotheses on the contributing factors. The first factor is related to the effect of robotisation on productivity. While the potential negative effect of robot adoption on employment is immediate and likely to be constant over time, the potential positive impact associated with productivity gains manifests itself later, hence the aggregate effect might be negative at first but could become positive over time (Acemoglu and Restrepo, 2018b).22 The second factor is simply that the effect of robotisation is generally small in magnitude compared to other determinants of employment and hence the quality of the data might not allow it to be isolated consistently. This problem is further aggravated when looking at the installation of robots in regions, as we do in this paper, not sectors (as done in Graetz and Michaels 2018 and Klenert et al. 2020). A third possible factor is that we include countries in the second period for which no data was available in the first period and which exhibit strong economic growth and a boost in robotisation at the same time (see Fernández-Macías et al., 2020). Fourth, during the period analysed, there have been improvements in robot technology, so
22 This argument is backed up by Jungmittag and Pesole (2019) who analyse a similar time frame and find a positive effect of robot adoption on productivity, which increases during the second decade of the period of analysis.

The labour market impact of robotisation in Europe
27
more recent robots might have a higher impact on productivity or increased complementarity to workers.
The analysis in this paper is inevitably subject to several limitations. First of all, despite having the different hypotheses regarding the differential pattern of the effects of robots on employment over time, we cannot prove their validity econometrically. We leave this challenge to future work. Second, we cannot rule out factors such as the economic turbulences due to the Great Recession in the second decade confounding the results, as the extent and depth of the crisis differed significantly across Europe. This could have introduced some sort of unobserved heterogeneity in our estimates for the period 2005–2015 that we cannot control for (though arguably, the economic bubbles of the previous decade could have introduced similar unobserved heterogeneities). Third, a caveat this work shares with other recent works using the IFR data is the low precision of the underlying data on robots, compounded in our case by the limited number of regions, which reduces the precision of the estimates. Fourth, the fact that industrial robots are highly concentrated in certain sectors and countries – for instance, German car manufacturing accounted for 27 % of all robot stock in Europe in 2016 – might distort the results to some extent and needs to be taken into account when interpreting them (Fernández-Macías et al. 2020). Finally, the so-called shift-share approach has recently received severe criticisms, suggesting that this approach, without appropriate corrections, might underestimate the size of standard errors.23 Fourth, industrial robots are only one specific type of automation technology, which happens to be sufficiently well-documented for performing econometric analysis. Hence, our results cannot be generalised to other automation technologies, such as service robots or AI, which might well have a large and significant impact on employment.
Our findings have important implications for policy-makers. The variability and the small magnitude of our results show that it is by no means certain that robots generally have a negative effect on employment. Calls for regulating industrial robots might therefore not be justifiable, at least on the grounds of their current effect on employment. Such policies might in fact reduce productivity, as robots have been found to be positively correlated with productivity (Graetz & Michaels, 2018, Jungmittag & Pesole, 2019). This does not imply that other advanced automation technologies such as AI, chat-bots or service robots might not have significant job destruction potential. However, we are not aware of sufficiently detailed data on these technologies that allow for an econometric analysis.
23 See Adão, Kolesár and Morales (2019), Borusyak., Hull and Jaravel (2018) and Goldsmith-Pinkham, Sorkin, and Swift (2018).

28
References
Acemoglu, D., LeLarge, C., & Restrepo, P. (2020). Competing with Robots: Firm-Level Evidence from France (No. w26738). National Bureau of Economic Research.
Acemoglu, D. & Restrepo, P. (2018a). The race between man and machine: implications of technology for growth, factor shares, and employment. American Economic Review, 108(6), 1488–1542.
Acemoglu, D. & Restrepo, P. (2018b). Low-skill and high-skill automation. Journal of Human Capital, 12(2), pp. 204–231.
Acemoglu, D. & Restrepo, P. (2019a). Automation and new tasks: how technology displaces and reinstates labor. Journal of Economic Perspectives, 33(2), 3–30.
Acemoglu, D. & Restrepo, P. (in press-a). Robots and jobs: Evidence from US labor markets. Journal of Political Economy. DOI: 10.1086/705716.
Acemoglu. D. & Autor, D. H. (2011). Skills, tasks and technologies: implications for employment and earnings. In O. Ashenlfelter & D. Card (Eds.), Handbook of Labor Economics (Vol. 4B, 1043–1171). Amsterdam: North Holland.
Asia KLEMS (2020). Asia KLEMS [Data set]. Retrieved from http://www.asiaklems.net/
Atack, J., Margo, R. A. & Rhode, P. W. (2019). “Automation” of manufacturing in the late nineteenth century: the hand and machine labor study. Journal of Economic Perspectives, 33(2), 51–70.
Autor, D. H. & Dorn, D. (2013). The growth of low skill service jobs and the polarisation of the U.S. labor market. American Economic Review, 103(5), 1553–1597.
Autor, D. H. & Salomons, A. (2018). Is automation labor share-displacing? Productivity growth, employment, and the labor share. Brooking Papers on Economic Activity, 2018(spring), 1–63
Autor, D. H. (2015). Why are there still so many jobs? The history and future of workplace automation. Journal of Economic Perspectives, 29(3), 3–30.
Autor, D. H., Dorn, D. & Hanson, G. H. (2013). The China syndrome: local Labor market effects of import competition in the United States. American Economic Review, 103(6), 2121–2168.
Autor, D. H., Levy, F. & Murlane, R. J. (2003). The skill content of recent technological change: an empirical exploration. Quarterly Journal of Economics, 118(4): 1279–1333.
Balsmeier, B., & Woerter, M. (2019). Is this time different? How digitalization influences job creation and destruction. Research policy, 48(8), 103765.
Barbieri, L., Piva, M., Mussida, C. & Vivarelli, M. (2019). Testing the employment impact of automation, robots and AI: a survey and some methodological issues (IZA Discussion Paper No. 12612). Bonn: Institute for Labor Economics. Retrieved from http://ftp.iza.org/dp12612.pdf
Blinder, A. S. & Krueger, A. B. (2013). Alternative measures of offshorability: a survey approach. Journal of Labor Economics, 31(S1), S97–S128.
Borjas, G. J. & Freeman, R. B., (2019). From immigrants to robots: the changing locus of substitutes for workers. RSF: The Russell Sage Foundation Journal of the Social Sciences, 5(5), 22–42.
Brandolini, A., Rosolia, A. & Torrini, R. (2011). The distribution of employees’ labour earnings in the European Union: Data, concepts and first results (ECINEQ Working Paper No 2011–198). Rome: Society for the Study of Economic Inequality. Retrieved from http://www.ecineq.org/milano/WP/ECINEQ2011-198.pdf
The labour market impact of robotisation in Europe
29
Carbonero, F. Ernst, E. & Weber, E. (2018). Robots worldwide: the impact of automation on employment and trade (ILO Working Paper No. 36). Geneva: International Labour Organization. Retrieved from https://www.ilo.org/wcmsp5/groups/public/---dgreports/---inst/documents/publication/wcms_648063.pdf
Chiacchio, F., Petropoulos, G. & Pichler, D. (2018). The impact of industrial robots on EU employment and wages: A local labour market approach (Bruegel Working Paper No. 2). Brussels: Bruegel. Retrieved from http://bruegel.org/wp-content/uploads/2018/04/Working-Paper-AB_25042018.pdf
Dahlin, E. (2019). Are robots stealing our jobs? Socius: Sociological Research for a Dynamic World, 5, 1–14.
Dauth, W., Findeisen, S., Südekum, J. & Wößner, N. (2017). German robots: the impact of industrial robots on workers (IAB-Discussion Paper No. 30/2017). Nuremberg: Institute for Employment Research. Retrieved from http://doku.iab.de/discussionpapers/2017/dp3017.pdf
De Backer, K., de Stefano, T., Menon, C. & Suh, J. R. (2018). Industrial robotics robotics and the global organisation of production (OECD Science, Technology and Industry Working Papers 2018/03). Paris: Organisation for the Co-operation and Economic Development. Retrieved from https://www.oecd-ilibrary.org/industry-and-services/industrial-robotics-and-the-global-organisation-of-production_dd98ff58-en
Domini, G., Grazzi, M., Moschella, D. & Treibich, T. (2019). Threats and opportunities in the digital era: automation spikes and employment dynamics (LEM Working Paper Series 2019/22). Pisa: Laboratory of Economics and Management, Sant'Anna School of Advanced Studies. Retrieved from http://www.lem.sssup.it/WPLem/files/2019-22.pdf
Ernst, E., Merola, R. & Saaman, D. (2018). The economics of artificial intelligence: implications for the future of work (ILO Future of Work Research Paper No. 5). Geneva: International Labour Organization. Retrieved from https://www.ilo.org/wcmsp5/groups/public/---dgreports/---cabinet/documents/publication/wcms_647306.pdf
Eurofound/IPSOS (2016). 6th European Working Conditions Survey Technical report. Retrieved from https://www.eurofound.europa.eu/sites/default/files/ef_survey/field_ef_documents/6th_ewcs_-_technical_report.pdf
Eurofound (2018). Game changing technologies: Exploring the impact on production processes and work. Luxembourg: Publications Office of the European Union.
European Commission (2017). Attitudes towards the impact of digitisation and automation on daily life. Special Eurobarometer 460 (Report). Brussels: European Commission. Retrieved from https://ec.europa.eu/jrc/communities/sites/jrccties/files/ebs_460_en.pdf
Fernández-Macías, E., Hurley, J. and Arranz-Muñoz, J.M. (2017). Occupational change and wage inequality: European Jobs Monitor 2017. Luxembourg: Publications Office of the European Union. Retrieved from https://www.eurofound.europa.eu/sites/default/files/ef_publication/field_ef_document/ef1710en.pdf
Fernández-Macías, E., Hurley, J. and Bisello, M. (2016). What do Europeans do at work? A task-based analysis: European Jobs Monitor 2016. Luxembourg: Publications Office of the European Union. Retrieved from https://www.eurofound.europa.eu/sites/default/files/ef_publication/field_ef_document/ef1617en.pdf
Fernández-Macías, E. & Hurley, J. (2016). Routine-biased technical change and job polarisation in Europe. Socio-Economic Review, 15(3), 563–585.
Fernández-Macías, E., Klenert, D. & Antón, J.-I. (2020). Not so disruptive yet? Characteristics, distribution and determinants of robots in Europe (JRC Working Paper on Labour, Education and Technology No. 2020/03). JRC120611. Seville: Joint Research Centre, European Commission.

The labour market impact of robotisation in Europe
30
Retrieved from: https://ec.europa.eu/jrc/en/publication/eur-scientific-and-technical-research-reports/not-so-disruptive-yet-characteristics-distribution-and-determinants-robots-europe
Gáková, Z. & Dijkstra, Z. (2008). Labour mobility between the regions of the EU-27 and a comparison with the USA. Regional Focus, 2008(2). Retrieved from http://ec.europa.eu/regional_policy/sources/docgener/focus/2008_02_labour.pdf
Goos, M. & Manning, A. (2007). Lousy and lovely jobs: the rising polarisation of work in Britain. Review of Economics and Statistics, 89(1), 118–133
Graetz, G. & Michaels, G. (2018). Robots at work. Review of Economics and Statistics, 100(5), 753–768
IFR. (2018). World Robotics 2017 edition [Data set]. Frankfurt am Mein: International Federation of Robotics.
ISO. (2012). ISO 8373:2012. Robots and robotic devices—Vocabulary. Retrieved from https://www.iso.org/standard/55890.html
Jaeger, D., Ruist, J. & Stuhler, J. (2018). Shift-share instruments and dynamic adjustments: the case of immigration (NBER Working Paper No. 24285). Cambridge, Massachusetts: National Bureau of Economic Research. Retrieved from https://www.nber.org/papers/w24285.pdf.
Janiak, A. & Wasmer, E. (2008). Mobility in Europe—Why it is low, the bottlenecks, and the policy solutions (Economic Paper No 340). Brussels: Directorate General Economic and Financial Affairs, European Commission. Retrieved from http://ec.europa.eu/economy_finance/publications/pages/publication13173_en.pdf
Jerbashian, V. (2019). Automation and job polarisation: on the decline of middling occupations in Europe. Oxford Bulletin of Economics and Statistics, 81(5), 1095–1116.
Jungmittag, A. & Pesole, A. (2019). The impact of robots on labour productivity: A panel data approach covering 9 industries and 12 countries (JRC Working Paper on Labour, Education and Technology No. 2019/08). Seville: Joint Research Centre, European Commission. Retrieved from https://ec.europa.eu/jrc/sites/jrcsh/files/jrc118044.pdf
Klenert, D., Fernández-Macías, E. & Antón, J.-I. (2020). Do robots really destroy jobs? Evidence from Europe (JRC Working Paper on Labour, Education and Technology No. 2020/01). JRC118393 Seville: Joint Research Centre, European Commission.
Koch, M., Manuylov, I. & Smolka, M. (2019). Robots and firms (CESifo Working Paper No. 7608). Munich: The CESifo Group. Retrieved from https://www.ifo.de/DocDL/cesifo1_wp7608.pdf
Marengo, L. (2019). Is this time different? A note on automation and labour in the fourth industrial revolution. Journal of Industrial and Business Economics, 46(3), 323-331.
Moll, C. & Lerch, C. (2016). Analysis of the Impact of robotic systems on employment in the European Union-Update. Luxembourg: Publications Office of the European Union.
Mokyr, J., Vickers, C. & Ziebarth, L. (2015). The history of technological anxiety and the future of economic growth: Is this time different? Journal of Economic Perspectives, 29(3), 31–50.
Pratt, G. A. (2015). Is a Cambrian Explosion coming for robotics? Journal of Economic Perspectives, 29(3), 51–60.
The Conference Board (2018). EU KLEMS Growth and Productivity Accounts. Release 2018 [Data set]. New York: The Conference Board. Retrieved from http://www.euklems.net/
Wolfers, J. (2006). Did unilateral divorce laws raise divorce rates? A reconciliation and new results. American Economic Review, 96(5), 1802–1820.

The labour market impact of robotisation in Europe
31
World Bank. (2019). World Integrated Trade Solution [Data set]. Retrieved from https://wits.worldbank.org

32
Annex I Table A. The effects of robot adoption on employment rate in industry (OLS and 2SLS estimates, 1995–2015)
Differences 1995–2005 Differences 2005–2015 Stacked differences (1995–2005 and 2005–2015) Long differences (1995–2015)
(I) (II) (III) (IV) (V) (VI) (VII) (VIII)
Panel A. OLS estimates
∆ robots per worker -0.003 -0.005 0.009 ** 0.001 0.009 0.010 0.000 -0.002
(0.005) (0.003) (0.004) (0.003) (0.006) (0.006) (0.004) (0.003)
R2 0.46 0.80 0.73 0.93 0.37 0.49 0.31 0.65
No. of observations 129 95 187 82 316 177 129 69
Panel B. IV estimates
∆ robots per worker -0.007 -0.008 * 0.001 -0.009 0.036 ** 0.014 -0.003 0.000
(0.006) (0.004) (0.011) (0.008) (0.017) (0.013) (0.004) (0.004)
Wald F-statistic (1st stage) 52.6 42.7 10.5 18.5 12.7 17.6 61.3 46.9
No. of observations 129 95 187 82 316 177 129 69
Trade and capital controls No Yes No Yes No Yes No Yes
Notes: Standard errors clustered at the regional level between parentheses. *** significant at 1% level; ** significant at 5%; * significant at 10%. All models include a constant, as et of start-of-period variables (share of employment in industry, population, share of females, share of population aged 65 and over, share of population with medium or high education, average RTI index and the average offshorability index) and regional dummies (when possible, Nordic, British, Mediterranean and East, with Continental as reference). The specification using stacked differences includes a dummy for the period 2005–2015. Observations are weighted by total regional population at the beginning of each period
Source: Authors’ analysis from IFR (2018), EU-LFS, ECHP, EU KLEMS and WITS.

GETTING IN TOUCH WITH THE EU
In person
All over the European Union there are hundreds of Europe Direct information centres. You can find the address of the centre nearest you at: https://europa.eu/european-union/contact_en
On the phone or by email
Europe Direct is a service that answers your questions about the European Union. You can contact this service:
- by freephone: 00 800 6 7 8 9 10 11 (certain operators may charge for these calls),
- at the following standard number: +32 22999696, or
- by electronic mail via: https://europa.eu/european-union/contact_en
FINDING INFORMATION ABOUT THE EU
Online
Information about the European Union in all the official languages of the EU is available on the Europa website at: https://europa.eu/european-union/index_en
EU publications You can download or order free and priced EU publications from EU Bookshop at: https://publications.europa.eu/en/publications. Multiple copies of free publications may be obtained by contacting Europe Direct or your local information centre (see https://europa.eu/european-union/contact_en).
GETTING IN TOUCH WITH THE EU
In person
All over the European Union there are hundreds of Europe Direct information centres. You can find the address of the centre

EU Science Hubec.europa.eu/jrc
@EU_ScienceHub
EU Science Hub - Joint Research Centre
EU Science, Research and Innovation
EU Science Hub
JRC MissionAs the science and knowledge service of the European Commission, the Joint Research Centre’s mission is to support EU policies with independent evidence throughout the whole policy cycle.
The European Commission’sscience and knowledge serviceJoint Research Centre