Growth Regime, Labour Market and Inequality in India in ...
216
Growth Regime, Labour Market and Inequality in Brazil and India: Concepts and Methods of Analysis By Gerry Rodgers, Ashok Pankaj, Nandita Gupta, J. Krishnamurty, Janine Rodgers, Taniya Chakrabarty and Vidhya Soundararajan Project Paper C (India) August 11 2014 Working Paper IDRC Project number 106919-002 (Institute for Human Development, New Delhi, India) IDRC Project number 106919-001 (Cebrap, Sao Paulo, Brazil) IDRC Project title: Labour Market Inequality in Brazil and India Institute for Human Development, NIDM Building, IIPA Campus, IP Estate, New Delhi 110002 Centro Brasileiro Análise Planejamento Cebrap, R. Morgado de Mateus, 615, São Paulo - SP, 04015-051, Brazil Contact: [email protected]; [email protected] This report is presented as received from project recipent(s). It has not been subjected to peer review or other review processes. This work is used with the permission of Institute for Human Development/Cebrap, New Delhi/Sao Paulo. Copyright 2014, Institute for Human Development/Cebrap. Abstract This paper provides the long term historical framework for the analysis of labour market inequality in India. Two principal ideas inform the present paper. Firstly, inequality is embedded in history and society. That is, the pattern of inequality can only be interpreted in its particular social, economic and political context. To capture the factors which lead to unequal outcomes, it is necessary to go beyond data that describe patterns of inequality at a point in time, and explore the processes and mechanisms that lie behind the figures. Secondly, inequality depends on forces and factors at different levels. Some are local or national, others come from the international environment, either directly – through the mechanisms of globalization – or indirectly, in the ideas, models and theories that set the global stage and eventually influence national behaviour. This paper explores the role of these factors and their intersection as part of a longer term historical process that shapes economies, labour markets and labour institutions, and so determines the pattern of inequality. In both India and Brazil, and indeed in much of the world, there was a clear change of regime in the 1980s, when in the wake of the oil shock and economic crisis in the dominant economies in the world, a shift occurred in the framework for economic policy towards a more liberal model; thus the 1980s was used as a dividing line to distinguish the conditions in the period before and after.
-
Upload
khangminh22 -
Category
Documents
-
view
0 -
download
0
Transcript of Growth Regime, Labour Market and Inequality in India in ...
Growth Regime, Labour Market and Inequality in Brazil and India: Concepts and Methods of Analysis By Gerry Rodgers, Ashok Pankaj, Nandita Gupta, J. Krishnamurty, Janine Rodgers, Taniya Chakrabarty and Vidhya Soundararajan Project Paper C (India) August 11 2014 Working Paper IDRC Project number 106919-002 (Institute for Human Development, New Delhi, India) IDRC Project number 106919-001 (Cebrap, Sao Paulo, Brazil) IDRC Project title: Labour Market Inequality in Brazil and India
Institute for Human Development, NIDM Building, IIPA Campus, IP Estate, New Delhi 110002 Centro Brasileiro Análise Planejamento Cebrap, R. Morgado de Mateus, 615, São Paulo - SP, 04015-051, Brazil Contact: [email protected]; [email protected] This report is presented as received from project recipent(s). It has not been subjected to peer review or other review processes. This work is used with the permission of Institute for Human Development/Cebrap, New Delhi/Sao Paulo. Copyright 2014, Institute for Human Development/Cebrap.
Abstract This paper provides the long term historical framework for the analysis of labour market inequality in India. Two principal ideas inform the present paper. Firstly, inequality is embedded in history and society. That is, the pattern of inequality can only be interpreted in its particular social, economic and political context. To capture the factors which lead to unequal outcomes, it is necessary to go beyond data that describe patterns of inequality at a point in time, and explore the processes and mechanisms that lie behind the figures. Secondly, inequality depends on forces and factors at different levels. Some are local or national, others come from the international environment, either directly – through the mechanisms of globalization – or indirectly, in the ideas, models and theories that set the global stage and eventually influence national behaviour. This paper explores the role of these factors and their intersection as part of a longer term historical process that shapes economies, labour markets and labour institutions, and so determines the pattern of inequality. In both India and Brazil, and indeed in much of the world, there was a clear change of regime in the 1980s, when in the wake of the oil shock and economic crisis in the dominant economies in the world, a shift occurred in the framework for economic policy towards a more liberal model; thus the 1980s was used as a dividing line to distinguish the conditions in the period before and after.

Keywords: accumulation regime, growth, distribution, labour market institutions, state policies.
2
IHD-Cebrap project on Labour Market Inequality in Brazil and India
Project paper C – India
Growth Regime, Labour Market and Inequality in India in Historical Perspective
Revised draft, August 11 2014
Not for quotation
Authors: Taniya Chakrabarty
Nandita Gupta J. Krishnamurty Ashok Pankaj Gerry Rodgers Janine Rodgers
Vidhya Soundararajan
3
Table of contents 1. Introduction 2. Inequality and the Indian society at the time of Independence*
2.1. Economic structure at the time of Independence: Output, employment, and urbanisation
2.2. Inequality of income, wages and assets 2.3. Agriculture and land reforms: Agrarian systems and productivity 2.4. Manufacturing and industry 2.5. Representation of interests and vision at the time of Independence 2.6. Caste and community 2.7. A synthesis
3. Growth and distribution from Independence up to 1980 3.1. Policy regime and macroeconomic outcomes, 1950-1980 3.2. The impact on inequality 3.3. The situation at the end of the 1970s
4. The macro-economic regime from 1980 to the present 5. Key labour institutions and their implications for inequality
5.1. Trade unions 5.2. Wage-setting institutions and policies 5.3. The Labour Code 5.4. Institutions for job access 5.5. Labour market structure and segmentation
6. Key policy issues 6.1. Employment policy* 6.2. Reservations in India: Government services and Legislature* 6.3. Education policies and inequalities in India* 6.4. Social protection and anti-poverty transfers* 6.5. Industrial policies*
7. Fractures and divides 7.1. The regional pattern of inequality
7.1.1. Introduction 7.1.2. Bihar and Jharkand 7.1.3. The case of Tamil Nadu* 7.1.4. Punjab and Haryana* 7.1.5. Conclusion
7.2. Gender inequality 7.3. Inequality across castes and communities
8. Conclusion 9. References * identifies sections where further revisions/updating are planned
4
1. Introduction This paper provides the long term historical framework for the analysis of labour market inequality in India. A similar paper is being prepared for Brazil. These two parallel histories will provide the point of departure for a wider comparison of the experience of the two countries.1 Two principal ideas inform the present paper. Firstly, inequality is embedded in history and society. That is, the pattern of inequality can only be interpreted in its particular social, economic and political context. To capture the factors which lead to unequal outcomes, it is necessary to go beyond the data that describe patterns of inequality at a point in time, and explore the processes and mechanisms that lie behind the figures. Secondly, inequality depends on forces and factors at different levels. Some are local or national, others come from the international environment, either directly – through the mechanisms of globalization – or indirectly, in the ideas, models and theories that set the global stage and eventually influence national behaviour. This paper explores the role of these different factors and their intersection as part of a longer term historical process that shapes economies, labour markets and labour institutions, and so determines the pattern of inequality. This provides the context which permits us to interpret household level patterns and trends. Third, we need to consider several interconnected aspects of inequality – inequalities of income, consumption and wealth; inequalities between individuals and between groups; inequalities of opportunity and of outcome2. In order to address this multidimensional challenge, we draw on the work of the “regulation school” and the related idea of “varieties of capitalism”. This leads us to consider the notion of regimes of accumulation, growth and distribution, in the sense of a set of complementary or mutually reinforcing institutions, state policies and private interests which together drive a particular pattern of development in a specific international context. This idea of a “regime” can also be applied to welfare policies, labour and work – we can think of welfare regimes and labour regimes as part of the wider system. The work of the regulation school suggests that regimes of growth and accumulation display periods of stability, but that internal pressures and contradictions ultimately lead to crisis and to a change of regime. Interpreting these changes is part of the analysis, and they respond to the dynamics of national development. However, in both India and Brazil, and indeed in much of the world, there was a clear change of regime in the 1980s, when in the wake of the oil shock and economic crisis in the dominant economies in the world, a shift occurred in the framework for economic policy towards a more liberal model. This did not occur overnight, and the processes were different in the two countries, but for both it makes sense to distinguish the period before 1980 from the period after. In the case of India, the other obvious dividing line is Independence. Again, the social and economic shifts did not occur at a point in time, and some of the important elements of the post-Independence order were put in place in the 1930s or before, while others only emerged
1 These studies are being prepared as part of a research project on labour market inequality in Brazil and India, being carried out by the Institute for Human Development, New Delhi, and Cebrap, São Paulo, and funded by the Canadian International Development Research Centre. See www.ihdindia.org/lmi 2 The methodological issues are discussed further in Barbosa et al., “Labour market inequality in Brazil and India: Concepts and methods of analysis”, New Delhi and São Paulo, Institute for Human Development/Cebrap Working Paper 04/2014.
5
in the years after Independence, but 1947 makes a logical dividing line. We therefore consider the historical process in two long periods, from 1947 to 1980, and from 1980 to the present. 1947 to 1980 was a period when development was primarily led by the state, with a model in which connections with the international economy were limited and conditioned by national needs; after 1980 there was a shift towards a model based on private accumulation and liberalization in both domestic and external economies. Within these periods further subdivisions are of course both possible and necessary. The paper starts with an overview of the pattern of social and economic inequality at the time of Independence, in terms of the dominant structures and cleavages that were inherited from the colonial economy and more broadly from India’s history. It then considers the macro-economic regime in the two periods, 1947-1980 and 1980 to the present, in terms of the structure of growth, the role of the state and the other social actors, the social and economic environment and the pattern of inequality that emerged. The remainder of the paper explores key features of these regimes in more depth. First, it considers the most important labour institutions, since these condition the pattern of inequality in the labour market. The paper examines the role of trade unions, the institutions which are involved in the setting of wages for different groups of workers, the overall labour code and the impact of labour legislation, the mechanisms for job access and how they lead to different types of inclusion and exclusion in the labour market, and more generally the structure of the labour market and the consequences of segmentation and informality. Second, it examines some of the principal domains of state policy with potentially major consequences for inequality. These include employment, policies which reserve jobs for certain disadvantaged groups (initially Scheduled Castes and Tribes, but increasingly a wider set of categories), education policies, policies for social security and social protection and industrial policy. Finally, the paper considers some major dimensions of inequality that need to be considered in historical perspective in their own right. The first of these is regional inequality, which has deep historical origins but which is also the result of differences in growth regime in different parts of the country. Overall inequality is the result of both differences between regions, and different patterns of inequality within them. In order to address this issue we look first at the broad pattern of regional inequality, and then in more detail at the pattern of growth and inequality in three states: Bihar (including Jharkand, from which it was separated in 2000), Tamil Nadu, and Punjab and Haryana, the latter two states taken together (their separation dating from the 1960s). The second is the gender divide, which is as deep rooted in India as anywhere. Changes in labour markets affect men and women differently; and the prevailing pattern of gender inequality influences the evolution of the labour market. The third is inequality in terms of caste and community. Expected by many to decline as the economy modernizes, in reality this remains a central factor in inequality. But the question that needs to be asked is whether caste as such influences the overall level of inequality, or whether it merely determines who is disadvantaged. Many of these issues will be examined in more depth in a separate quantitative analysis of patterns of inequality and their determinants on the basis of micro-household survey data (in
6

the case of India, mainly from the National Sample Survey). The present paper lays out the structural and institutional forces that constrain or dictate particular labour market outcomes, including many that cannot be easily assessed using micro-data – notably the extent to which new opportunities are captured by particular classes or other social groups, the regional dimensions of change and the changing macro-economic structures within which labour markets function.
7
2. Inequality and the Indian society at the time of Independence According to census data, the population of Undivided India in 1941 was around 383 million, having grown by about 13 per cent over the previous decade. In 1951, the population of India and Pakistan was 438 million, an increase of 14 per cent over the 1941 level (Mahalanobis and Bhattacharya Table 1.1). In 1951, the population of the Indian Union (more or less present-day India) was 361 million. The highest recorded population growth in India before Independence was between 1921 and 1941, when it grew at almost 1.2 per cent per annum. According to the 1951 Census around 17 per cent of the population of the Indian Union were urban residents, accounting for about 63 million persons. Literacy rates, as percentages of the total population, were very low: 27 per cent for males, but only 9 per cent for females (see Krishnamurty 1979). The country had strong notions of socio-economic hierarchy in terms of the caste system and also other divisions in terms of religion, education levels, regional differences and language. Life expectancy during the period 1941-1951 (includes Pakistan) was around 32.1 years; for males it was 32.4 years and for females it was slightly lower at 31.7 years (see Visaria and Visaria pp.502). The total fertility rate (children per woman) in 1951 was 5.9. The Crude Birth Rate was around 40 and Crude Death Rate around 27.4, clearly indicating a growing population. The proportion of population below the poverty line was 47 per cent in rural areas and 35 per cent in urban areas (see Dreze and Sen 2013 p. 6). The quality of life could be said to have been very low. Nagaraj (2012) provides estimates of the Physical Quality of Life Index (which includes indicators for literacy, life expectancy and infant mortality) for 1950 made by Morris D. Morris. It emerges that of some “70 mostly developing countries only Afghanistan, Gambia and Central African Republic stood equal to, or lower than, India (p.27)”.
2.1. Economic structure at the time of Independence: Output, employment, and urbanisation
At the time of Independence India could be described as a “laissez-faire” state, but the colonial government had been active in developing infrastructure, especially the railway infrastructure. In 1951, the Indian Union had a large agricultural population of about 271 million, accounting for 75.1 per cent of the workforce; 10.3 per cent were in industry and 14.6 per cent in services (see Krishnamurty. 1979, pp. 260-1, Table 1.). Apart from agricultural workers, a sizeable population was involved in handicrafts and trading. There was a small group of educated elites, a dominant group of landlords, a small industrialist/capitalist class and a large peasantry. The colonial government had no particular interest in tackling inequality within India, and the Indian state before Independence was largely concerned with maintaining law, collection of taxes and defence (Vaidyanathan 1982). Agriculture was characterized by low productivity and lack of modern inputs; irrigation was available for only one-sixth of the area. ‘The growth of aggregate real output was less than 2 per cent per year and per capita output by 0.5 per cent per year or less’. As Vaidyanathan (1982) puts it, the period before Independence was “a period of near stagnation for the Indian economy’; this is also evident in case of agriculture (see Table 2.1)”.
8
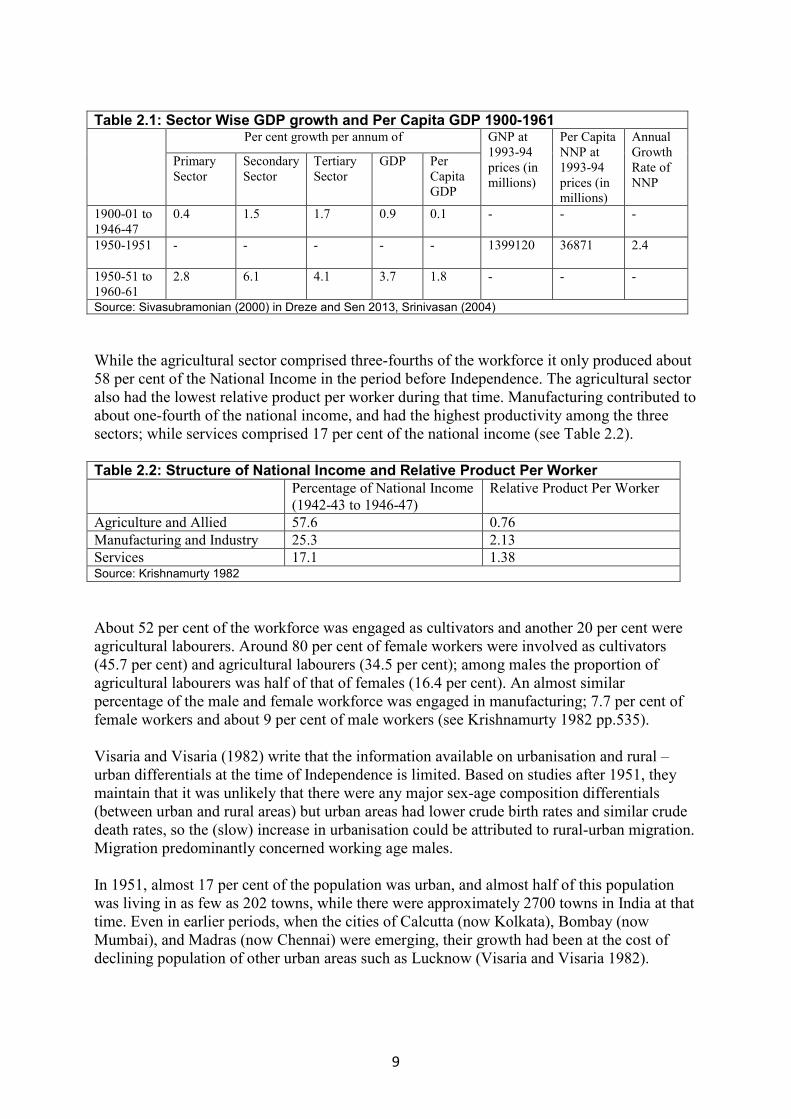
Table 2.1: Sector Wise GDP growth and Per Capita GDP 1900-1961 Per cent growth per annum of GNP at
1993-94 prices (in millions)
Per Capita NNP at 1993-94 prices (in millions)
Annual Growth Rate of NNP
Primary Sector
Secondary Sector
Tertiary Sector
GDP Per Capita GDP
1900-01 to 1946-47
0.4 1.5 1.7 0.9 0.1 - - -
1950-1951
- - - - - 1399120 36871 2.4
1950-51 to 1960-61
2.8 6.1 4.1 3.7 1.8 - - -
Source: Sivasubramonian (2000) in Dreze and Sen 2013, Srinivasan (2004) While the agricultural sector comprised three-fourths of the workforce it only produced about 58 per cent of the National Income in the period before Independence. The agricultural sector also had the lowest relative product per worker during that time. Manufacturing contributed to about one-fourth of the national income, and had the highest productivity among the three sectors; while services comprised 17 per cent of the national income (see Table 2.2). Table 2.2: Structure of National Income and Relative Product Per Worker Percentage of National Income
(1942-43 to 1946-47) Relative Product Per Worker
Agriculture and Allied 57.6 0.76 Manufacturing and Industry 25.3 2.13 Services 17.1 1.38 Source: Krishnamurty 1982 About 52 per cent of the workforce was engaged as cultivators and another 20 per cent were agricultural labourers. Around 80 per cent of female workers were involved as cultivators (45.7 per cent) and agricultural labourers (34.5 per cent); among males the proportion of agricultural labourers was half of that of females (16.4 per cent). An almost similar percentage of the male and female workforce was engaged in manufacturing; 7.7 per cent of female workers and about 9 per cent of male workers (see Krishnamurty 1982 pp.535). Visaria and Visaria (1982) write that the information available on urbanisation and rural –urban differentials at the time of Independence is limited. Based on studies after 1951, they maintain that it was unlikely that there were any major sex-age composition differentials (between urban and rural areas) but urban areas had lower crude birth rates and similar crude death rates, so the (slow) increase in urbanisation could be attributed to rural-urban migration. Migration predominantly concerned working age males. In 1951, almost 17 per cent of the population was urban, and almost half of this population was living in as few as 202 towns, while there were approximately 2700 towns in India at that time. Even in earlier periods, when the cities of Calcutta (now Kolkata), Bombay (now Mumbai), and Madras (now Chennai) were emerging, their growth had been at the cost of declining population of other urban areas such as Lucknow (Visaria and Visaria 1982).
9
2.2. Inequality of income, wages and assets India has generally had low per capita income and relatively low inequality, but the aggregates may conceal sharp difference between particular groups like the British officials and maharajas at one end and agricultural labourers and village artisans on the other. Long term trends in national income and per capita income have been a subject of interest to both the ruler and the ruled, although no official estimates were prepared before Independence. But the estimates were often “point estimates” rather than “series estimates,” making it difficult to compare changes over time. However, most of the available series give somewhat similar results in respect of changes over time. The best available estimates today are those of Sivasubramoniam and Heston (1982). The advantage with using Heston’s estimates is that they cover the period from 1870 to 1947 and correct for probable underestimation of yield per acre over time. Per capita income, at 1946-47 prices, rose from Rs. 120 in 1868-69 to Rs. 163 in 1945, but almost all of this increase had occurred by 1930 when per capita income had reached Rs. 171. It must also be noted that generally the figures for the period after 1900 are better than those for the earlier period. One may conclude that per capita income rose reasonably rapidly until about 1925 and then fluctuated around Rs. 165 thereafter. Some attempts have been made to measure the Gini coefficients for distribution of income or consumption before Independence. Working with available data from a variety of sources, Tirthankar Roy (2007) argues that between 1875 and 1950, the Gini concentration ratio fell from 0.35 to 0.3. While the data are admittedly shaky, as Roy (2007) notes, the departure of the British ruling class of highly paid officials may have contributed to this decline. Also the size and condition of the middle class probably improved as more people progressed as lower-rung officials, traders, and other commercial groups, and better-off peasants. The wage data for earlier periods has been known to be problematic given the issues of payments having been made in kind, differences in the length of the working day, spatial variations, gender and caste differentials, lack of data for own account workers and family workers, among other issues. For the historical series, the best known source of serial statistics is the Prices and Wages in India. This began in 1861 and from 1873 began providing data on the wages of three categories, one representing skilled labour (carpenters, blacksmiths and masons), another representing domestic service (syce or horse keeper), and the third being agricultural labour. It is not clear if both rural and urban areas are covered. Price data were also collected making it possible to measure real wages. While this series has been used by many analysts for the period 1873-1914, the K L Datta Committee, an official committee on the rise in prices, rejected this data source arguing that the methodology used was defective and that there were problems in converting wages paid in kind. Datta and his associates developed an alternate series based on other sources. The exact method that was followed is not explained and it appears that a cherry- picked series was developed, aimed at showing improvement under British rule. This was not a committee of independent experts: Datta and one associate, Gupta, were officials of the Finance Ministry, while the other associate, Professor George Findlay-Shirras, a qualified economist and statistician, was known to be a strong defender of the government. The Datta series starts from 1890 and goes on to 1913. It suggests an increase in real wages, compared to the Prices and Wages series which suggests some decline. Taking
10
1890-1894 as base, the Committee concludes that the real wages of agricultural labourers rose by 38 per cent by the year 1912 (see Datta 1915). Looking at the results from Alan Heston’s more recent work, one may conclude that wages showed no clear trend between 1870 and 1920. They may then have risen in the 1930s, and then fallen again up to the mid 1940s (see Heston 1982). But data quality and coverage is a serious problem. In any case, it is difficult to establish that real wages for unskilled or agricultural labour rose over the period from the 1880s to 1950. Little is known about the distribution of all assets before Independence. However, we do have some evidence on land distribution patterns. It is important to note that patterns of land ownership may and indeed do differ from patterns of land operation, as there is always some leasing out by owners and leasing in of land by operators. The land records are also far from perfect and may have systematic biases in reporting. The pioneering working in this field is that of Dharma Kumar (1998) who analysed the distribution of pattas (documents describing the land registered in the name of the holder) in the ryotwari areas of the Madras Presidency between 1853 and 1947. The tenure system here recognized the rights of holders of land and recorded their details. Lorenz curves were constructed based on land revenue paid and number of pattas. While the data are subject to a number of weaknesses which Kumar indicates, they nevertheless provide a way of examining inequality in landholding (and possibly rural income) over a long period. Kumar finds that landholding was very unequal in 1853, but there was no subsequent trend towards concentration. Unfortunately similar information does not appear to exist for other parts of India or has not been traced or analyzed. Land ownership and tenure systems are discussed in the next section (section 2.3).
2.3. Agriculture and land reforms: Agrarian systems and productivity The agricultural population was hierarchical, and caste was central to all interactions, wealth, and work. Most of the land was under formal or informal tenancy; in 1950-51, even formally almost 36 per cent of the total land was leased in (Omvedt 1981). In 1953-54, about 4 per cent of households owned landholdings of 25 acres or more and operated almost one-fourth of the cultivated land. There was also a substantial class of landless agricultural workers; the percentage of landless households seemed to have been around 11 per cent of the rural households at the time of Independence (Srinivasan 2007). Even prior to the colonial rule, ‘landless agricultural workers’ existed, but people could easily use waste land, although access to capital and inputs may have been a constraint. However, in some areas they had to work for landlords through forms of debt bondage and agricultural servitude (Kumar 1982, p. 212). Under British land revenue systems, rights to ownership and the payment of land revenue were established at different times beginning in 1793. With developments over time these became very complex and varied greatly across territories. The land revenue burden decreased significantly over the period after 1860 so that it was no longer a rapacious state that could be blamed for taxing away all surpluses. Instead, this surplus now accrued in different degrees to different actors in the countryside. With the growth of commercial agriculture the dependence on agrarian groups and money lenders for credit increased. Many, who were principally
11
agricultural labourers, also worked on their own small holdings and in addition performed non-agricultural work in the off-season. The actual patterns of ownership, leasing-in and leasing-out, tenancy, sharecropping, bonding of labour and credit dependence , freedom to choose employment, restrictions on mobility, were all highly location-specific and do not lend themselves to simple generalizations. Roy (2000) argues that evidence for Madras and possibly other areas does not support the view that polarization in land holding occurred under British rule. As he notes, this is not equivalent to saying that inequality in income did not increase. In his view, some of the old elites and Brahmins may have lost out and middle peasants gained from commercial opportunities opening up in agriculture and the countryside. Middle peasants successfully farmed for themselves, producing surpluses and reducing their dependence on traditional moneylenders. Several such peasant groups became powerful in the countryside. According to Roy (2000 pp 84-85), “In Punjab and the upper Doab the jat peasantry, the Vellalas in Tamil Nadu, the jotedars or large tenants with superior rights in western and northern Bengal, the Kanbi Patidars of south Gujarat, the rich Reddy farmers in the Madras-Deccan, the Maratha peasants and Saswad Mali in the Maharashtra sugar belt, and counterparts of these groups from other regions illustrate this process of the consolidation of the middle peasantry as dominant cultivators.” Even small cultivators, though often hit by famine and other disasters, did not all fare badly. Some managed to take advantage of the growing market for commercial agriculture. In the twentieth century, upward mobility from a small holding base became rarer and more difficult. Smaller holdings, greater insecurity of tenure and rising prices are cited by Roy (2000) as among the reasons why small operators fared less well. In particular, small peasants who were net buyers of grain often fared very badly during food shortages and could lose their assets through debt. One may also add that those who were agricultural labourers without other sources of income did not see a rise in their incomes compared with better-endowed peasants who could exploit the opportunities offered by new crops and better transport and market access. In sum, the old elites may have lost out, the middle and upper peasants may have prospered and the pure agricultural labourers may have fared badly. But this generalization conceals a wide variety of actual situations in different parts of India at different points of time between 1860 and 1947. The British land revenue settlements were intended to provide stable revenue and efficient agriculture by promoting private property rights in land. This influenced the development of major land tenure systems during the colonial rule. The British expected that the landlords would take a direct interest in the day to day management of the farm which would lead to higher productivity and returns. The different tenure systems came about at different periods during the colonial rule and were operational in distinct regions. 3
i. Zamindari system: It was introduced in 1793 and covered large tracts of North India, including Bihar, West Bengal, large parts of UP, Orissa and Rajasthan and about 20 per cent of the area of the Madras Presidency. Under the Zamindari system, feudal lords were made proprietors of the land in return for fixed revenues, which were collected by intermediaries, and the cultivators were made tenants. According to
3 The different systems of land tenure have been adapted from Mearns (1999).
12
Mearns (1999) the Zamindari system was a more unequal tenure system (than the Ryotwari and the Mahalwari) with respect to the landlords, tenants and their respective rights.
ii. Ryotwari system: It was introduced in early 19th century in the Madras and Bombay Presidencies, now covering parts of Maharashtra, Karnataka, Tamil Nadu, Kerala, Andhra Pradesh, and Madhya Pradesh. Individual cultivators were made proprietors of their own land, and they could sublet, mortgage, transfer or gift the land, provided the revenues were paid directly to the colonial administration. The percentage of revenue to be paid to the state under this tenure was very high in the early stages, leading to high indebtedness, sale of land and rising tenancy, hence rising inequality. However later periodic settlements substantially lowered the real burden of assessments.
iii. Mahalwari system: It was introduced in the part of the 19th century in parts of the United Provinces, Punjab and Haryana. After some experimentation, it was made into a temporary settlement for 30 years. Revenue was collected from the village (mahal) as a whole, and the tenants would pay according to the size of their landholdings. The assessment was set at 66 per cent of rental value, which proved too high and was later lowered to 50 per cent. Towards the end of the nineteenth century the real incidence of land taxation fell as more land was cultivated, the crop mix changed, and politically it became increasingly difficult to raise land revenue.
iv. Other tenures: Many less extensive system of land tenure prevailed, especially, but not only, in the princely states. These included inams, jagirs and rent-free tenures. There were also several special tenures too numerous to mention, which were very restricted in coverage.
While the initial land revenue demand under all these land tenure systems was high, its share fell quite sharply over time. As Kumar (1982) shows, between 1860 and 1900 land revenue collections rose 25 per cent, agricultural prices rose 80 per cent and agricultural output rose by over 20 per cent (see Kumar 1982). Since the share of land revenue in gross agricultural output was 5 per cent in 1900, working backwards she estimates that it was probably above 10 per cent in 1860. By 1946-47 its share had fallen to 2 per cent. The growth of relatively better-off peasants was a phenomenon that had its roots in the colonial period and these were the groups poised to benefit from a land reform which removed only the uppermost strata of the rural population from ownership and control of the land (see Dore). One of the architects of the Congress land reform programme in Uttar Pradesh after Independence, Chaudhuri Charan Singh, represented the occupancy tenant and better-off farmer. Not surprisingly, he put forward the argument that the mass of peasants had little land and that it was the zamindars at the top that had to be removed. The British also brought in measures to provide some legal rights to the cultivators along with the Zamindars, such as the Bengal Tenancy Act 1885. However, such measures were not easy to enforce and were not implemented effectively (Jannuzi 1994). In terms of agrarian development the British started, in a very limited way, programmes of agricultural research, veterinary research and better means of credit. The only agrarian reform they initiated was some consolidation of small units.
13
Since Independence, the Ryotwari and Mahalwari areas have seen higher agricultural growth than the Zamindari areas. A study of Gujarat shows that the green and white revolutions have had more equitable consequences in former Ryotwari areas than in Zamindari areas (Mearns 1999). Banerjee and Iyer (2005) analyze the effect of the different land-tenure systems on economic outcomes and find that areas which were under landlords had lower agricultural investment and productivity, than those areas which did not have landlordism during colonial rule.
2.4. Manufacturing and industry The new land tenure systems, commercialisation of agriculture and other processes under the colonial rule led to changes in the structure of agricultural production. With improvements in transport and communications, especially the advent of the railways and steamships from the mid-19th century traditional industry faced growing competition. Many industries like hand spinning were decimated, but others like weaving recovered during the early twentieth century, taking advantage of cheap mill yarn. Over time due to imports of manufactures and the growth of a modern industrial sector, several traditional activities went into decline, including food grain processing and preparation of food products (major sources of female employment), but the proportion of the Undivided India work force employed in the manufacturing sector as a whole declined a little from 10.1 to 8.7 per cent between 1901 and 1951. The bulk of this decline was in female employment. We may roughly estimate that between 1901 and 1951, factory employment rose from 0.6 to 2.9 million, while employment in the rest of manufacturing fell from 12.6 to 11.4 million (See Krishnamurty, 1979). Due to the war period 1939-45, manufacturing output increased considerably, but it fell again after the war; the net value of output of all large scale manufacturing activity was 2,173 million rupees in 1946 (for undivided India) (Vaidyanathan 1982). Throughout the 19th century, if not earlier, there were thriving business communities to be found in different parts of India. These included, among others, the Marwaris, originally from Rajasthan but spread all over India especially in the East; Parsis, Khojas, Baghdadi Jews and Bhatias in western India, and the Chettiars in South India. Many were involved in indigenous banking and started or promoted industrial enterprises through the managing agency system. The latter was originally a British innovation to enable British expatriates to manage enterprises in India though one or more resident partner. In certain industries, like jute processing and tea, British managing agents dominated until Independence. After 1947 most of these firms had been taken over either by local industrial groups or the state. In 1951, most industrial employment was in traditional industries. Cotton, jute and some other agro products dominated modern factory industries. The contribution of other industries such as steel, cement, paper and basic chemicals was limited (Vaidyanathan 1982). During the period 1850-1914, India became the largest jute manufacturing centre in the world, it had created the third largest railway network and was fourth or fifth in cotton production. However these industries were highly concentrated in some districts. About 18 per cent of manufacturing employment was in the cotton industry and about 11 per cent in the jute industry (Morris 1982). Since the importance of industrial development was being increasingly realized between the two world wars, the Government found it necessary to provide a modicum of tariff protection to selected industries. The protection was limited in
14
scope; it was often delayed, and it was not accompanied by other measures to promote industry. Nevertheless, protection did help Indian industry to grow in the interwar period. During the period 1881-1950, the share of agriculture, manufacturing and services remained more or less constant, but within the manufacturing sector, factory employment replaced the traditional industries to some extent, and productivity also increased. Most industries at that time employed both permanent and temporary employees (Morris 1982). Public services also expanded during the above-mentioned period (Krishnamurty 1982). While the original Indian Factory Act was introduced in 1881 and subsequently amended several times and while several studies, with or without government support, revealed poor wages and working conditions for industrial labourers, the government did not intervene. The Royal Commission of Labour in 1929 drew attention to the need for a more active role of the government in regard to labour. But this was slow in coming. During this period, strikes were frequent and attrition rates were high, trade unions were also putting pressure for effective mechanisms for wage fixing. With the coming of the Second World War and Britain’s dependence on India for supplies, it became imperative to maintain peace among the industrial workforce. A tripartite conference (the Indian Labour Conference) was organized for the first time in 1940 and several meetings were held. It consisted of various stakeholders (including labourers, employers and government officials). Subsequently, the Minimum Wages Act was introduced in 1948, which was applicable to a part of the workforce, and different sectors were divided between the State and Central Government (for the fixing of minimum wages); it was only in the 1950s that the boards to fix wages were finally set up (see section 5.2, Chibber 2012). As part of the preparatory work done under the Post-war Reconstruction Programme started in 1944 – a broad strategy for development of sectors, industries and policies was prepared under the leadership of the Planning and Development Department (set up by the central government). Prior to Independence, the Government had launched some basic schemes to develop agriculture and industries. These included the ‘grow more food scheme’ in response to the loss of rice supplies from Burma and the Bengal Famine of 1943. Preliminary work on designs for irrigation projects and various industrial projects was undertaken. These included fertilizers, locomotives, newsprint, steel, machine tools and telephone equipment. Right after Independence the Directive Principles of State Policy also specified the goal of avoiding concentration of wealth and means of production (Vaidyanathan 1982).
2.5. Representation of interests and vision at the time of Independence Before Independence the Indian National Congress (INC) embraced more or less all social classes of India (except, big landowners who were allied to the British, the Muslim middle class who were with the Muslim League, and the rising elements of the untouchables who were part of the Scheduled Caste’s Federation), especially the peasantry (which it had mobilized). In that period the Congress also encompassed the socialists, communists as well as right-wing elements. However, eventually, the influence of the proprietary class weighed more heavily on the INC (see Kohli 2012). Before Independence, Gandhi’s leadership had been critical in steering the INC. His vision for an independent India was neither capitalist nor socialist; he believed that both systems led to
15
concentration of power. He was also opposed to industrialisation and mechanisation, unlike Nehru who embraced state led industrialisation. Gandhi believed in minimum mechanisation; he felt that it would lead to unemployment and exploitation. He propagated self-reliance and the decentralisation of governance at the village level. On the issues of caste he was a champion in the movement for the uplifting of the ‘untouchables’, at the same time he believed that the Varna system (explained in section 2.6) should not be completely done away with; and that some segregation of duties would be beneficial (see Friedman 2008). Ambedkar, who opined that the caste system should be abolished completely, did not support his views (Jogdand 2007). The INC was radical in its stance to bring about land reforms, but the implementation of these reforms was limited in its effectiveness (Alavi 1975, and as discussed in section 3). Jannuzi (1994 p.38) writes about how Nehru was largely non-specific about agrarian reform, did not have a deep understanding of peasantry and himself spoke about his propensity to “think in terms of industrialization, rather than in terms linked to the transformation of peasant agriculture”. Chibber (2012) describes how Nehru’s vision was towards accelerating growth rate though industrialisation and that Nehru bore in mind the views of the business houses in India when expanding (or not expanding) the public sector. Nehru was also inclined towards developing a scientific temper, and was keen on developing ‘centres of excellence’. In this context, the early development of primary education did not receive the attention it deserved (discussed in section 6.3). A movement for the representation of women had begun prior to Indian Independence. The first wave of feminism could be said to have been during the period 1880-1940. However the movement and issues raised at this period served the interests of the higher and middle classes; some of these issues were widow remarriage, dowry and sati (see Desouza 2011). Desouza writes that while women’s issues that concerned public life were being contested, private issues relating to patriarchy, domestic violence and inheritance were not. There is no questioning of the fact that women were excluded from formal education and public roles. Even Gandhi only acknowledged in the 1920s the significant role that women could play in India’s freedom struggle; and their involvement in the salt marches in the 1930s was a turning point in women’s participation in the struggle. India finally introduced universal franchise in 1949-1950. Labour institutions are discussed in section 5. Trade unions had grown in importance since the 1920s, but their action was limited and mainly defended the interests of a small minority of workers. In the dominant vision of development after Independence, all social groups should be committed to supporting the process of growth. Since strikes and other disruptions in industrial production would affect growth, the Industrial Disputes Act of 1947 was introduced, which forced the unions to notify a strike at least 14 days in advance. During the first two Plan Periods, Chibber (2012) writes that there was an emphasis on placating the business houses in order to promote private investment, and this was also reflected in delays in implementing the Minimum Wages Act.
16
2.6. Caste and community For centuries the Hindu society in India was divided on the basis of Varna, which entailed division of the society into four groups; the Brahmins (scholars and priests), the Kshatriyas (the rulers and the army), Vaishyas (merchants and traders) and the Sudras (untouchables, who performed menial tasks). The Varna system later became solidified into the caste system, where one’s caste became hereditary with little scope for mobility. The Varna system and its underlying Jatis (occupational segregations) were otherwise not necessarily ascribed by birth and the individuals, on the basis of their ‘gunas’ (mental temper) could have a different varna or jati than their parents (see Lahiri 2005). Precisely when the Varna system transformed into the rigid caste system is contentious. According to Bayly (1999), in the early 1800s the caste system was not solidified, and the precepts of Jati and Varna allowed mobility; it is only during the colonial rule that caste relationships and hierarchies became rigid. But Lahiri (2005) believes that it was probably around the 10th century that the caste system started becoming rigid. The caste system was based on a “segmented division of society; hierarchy; restrictions on feeding and social intercourse; civil and religious disabilities and privileges of different sections; lack of unrestricted choice of occupation; restrictions on marriage (see Jodhka 2010 p.4)”. The basic categories of the Varna system were similar in the caste system. The most deprived of the groups were the Sudras or the ‘untouchables’. The ‘untouchables’ were considered impure, they lived away from the main village, could not access resources such as wells (which were used by other castes), they could not access education, enter temple complexes, and were restricted to occupations such as cleaning, manual scavenging, leather work, hair-cutting, as slaves and as labourers. While the Vaishyas also did not enjoy a high social status, they were economically strong, being the trading and business caste. Due to the restrictions placed on the ‘untouchables’ and the notion of them being ‘polluted’; they were even in pre-Independence India seen as a community deserving of protection and welfare measures. The British categorized some of the ‘untouchables’ as ‘depressed classes’ and in 1935 they were listed as Scheduled Castes and were entitled to some welfare measures. In the 1930s Ambedkar in fact began to recommend conversion to other religions, especially Buddhism, in order to provide mobility to the ‘untouchable’ castes. According to Ambedkar, the caste system was a graded hierarchy and was a division of labourers and not just labour (see Jaffrelot 2009). He believed that the distinction between the ‘untouchables’ (or Dalits) and the other (higher) castes was more important than the distinction between the Brahmins and the other (lower) castes; thereby emphasising the need for protecting the interests of the Dalits. Post-Independence Ambedkar was central in representing the interest of the Dalits, especially in the framing of the Indian Constitution.
2.7. A synthesis
While India had a low per capita income and – the well-off colonial stratum apart – fairly low inequality pre-Independence, the data available hide sharp differences between groups. It can be said that from the mid-1800s till 1950, the middle class in India grew somewhat, with
17
growing commercialisation, emergence of new professions and growth in lower rung public positions. There is no conclusive evidence to say whether real wages grew during this period. Agriculture dominated the economy, so the overall pattern of inequality was greatly influenced by the agrarian system. This system, or systems because there was a great diversity, was not entirely static. In some places the landed elites lost out, the middle and upper peasantry gained and the agricultural labourers fared badly; but this is a very broad generalisation given the diversity of the contexts. In any event landholding remained highly concentrated, with little change after the mid nineteenth century. At the time of Independence there was insufficient acknowledgement of the need for agrarian reforms, although more than 75 per cent of the workforce was engaged in agricultural activities. Agriculture and land were overshadowed by the elite perception of the need for industrialization. The 1800s saw the emergence of movements and efforts which represented various groups and their interests. The INC emerged as an umbrella organisation in the twentieth century, representing more or less all social groups. The first wave of feminism also grew during this period; but it was mostly concerned with the issues of the higher and middle class women. The women’s movement was further emboldened by the participation of women in India’s struggle for Independence in the early 1900s.While trade unions grew in importance from the 1920s, they were not particularly successful in bargaining for workers’ rights and wages, and were to a great extent co-opted by political movements, while the INC was sensitive to business interests, even as it promoted the expansion of the public sector. With respect to the highly unequal and hierarchical caste system, there is no doubt that the untouchables were particularly deprived and excluded, and that despite the legal abolition of untouchability, they continued to suffer from economic and social exclusion. While the colonial government was not particularly interested in disrupting the social structures, they did initiate some welfare measures for the ‘untouchables’ as depressed classes and later as the Scheduled Castes. The pre-Independence period also saw the growth of movements demanding rights for the ‘untouchables’ and for the abolishment of untouchability. But these practices are deeply embedded, and even today, these groups are more concentrated in the lower rungs, socially and economically.
18
3. Growth and distribution from Independence up to 1980
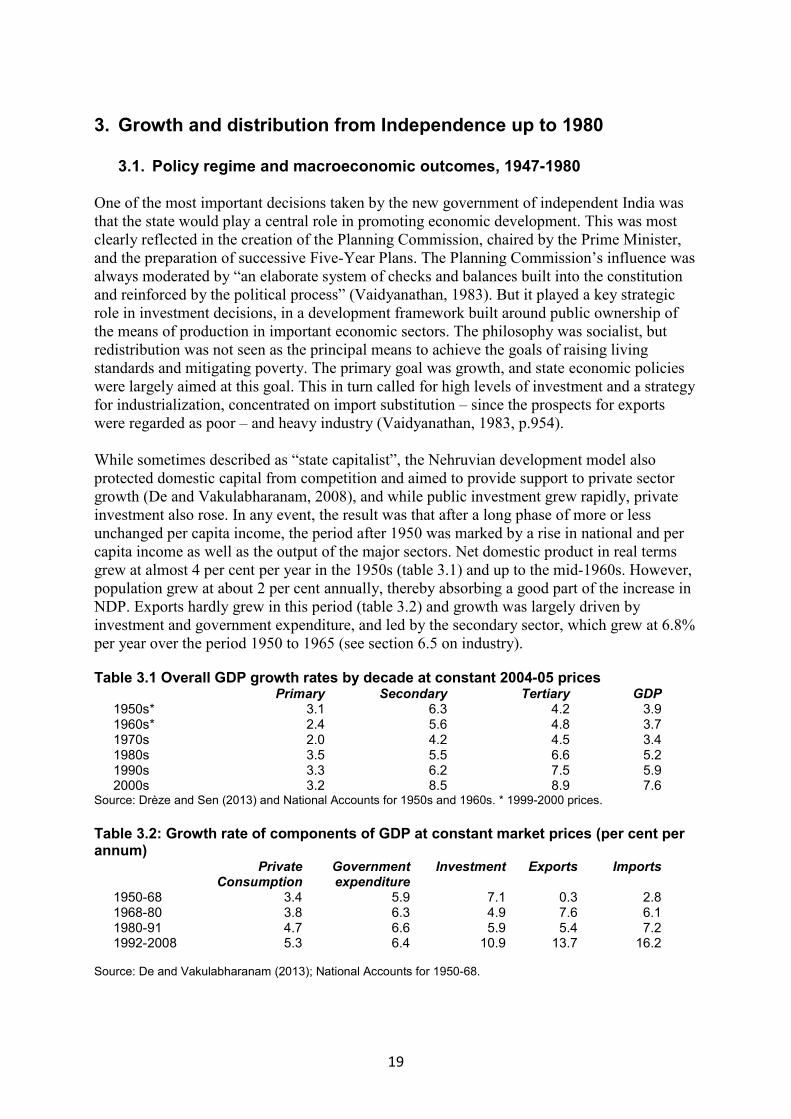
3.1. Policy regime and macroeconomic outcomes, 1947-1980 One of the most important decisions taken by the new government of independent India was that the state would play a central role in promoting economic development. This was most clearly reflected in the creation of the Planning Commission, chaired by the Prime Minister, and the preparation of successive Five-Year Plans. The Planning Commission’s influence was always moderated by “an elaborate system of checks and balances built into the constitution and reinforced by the political process” (Vaidyanathan, 1983). But it played a key strategic role in investment decisions, in a development framework built around public ownership of the means of production in important economic sectors. The philosophy was socialist, but redistribution was not seen as the principal means to achieve the goals of raising living standards and mitigating poverty. The primary goal was growth, and state economic policies were largely aimed at this goal. This in turn called for high levels of investment and a strategy for industrialization, concentrated on import substitution – since the prospects for exports were regarded as poor – and heavy industry (Vaidyanathan, 1983, p.954). While sometimes described as “state capitalist”, the Nehruvian development model also protected domestic capital from competition and aimed to provide support to private sector growth (De and Vakulabharanam, 2008), and while public investment grew rapidly, private investment also rose. In any event, the result was that after a long phase of more or less unchanged per capita income, the period after 1950 was marked by a rise in national and per capita income as well as the output of the major sectors. Net domestic product in real terms grew at almost 4 per cent per year in the 1950s (table 3.1) and up to the mid-1960s. However, population grew at about 2 per cent annually, thereby absorbing a good part of the increase in NDP. Exports hardly grew in this period (table 3.2) and growth was largely driven by investment and government expenditure, and led by the secondary sector, which grew at 6.8% per year over the period 1950 to 1965 (see section 6.5 on industry). Table 3.1 Overall GDP growth rates by decade at constant 2004-05 prices
Primary Secondary Tertiary GDP 1950s* 3.1 6.3 4.2 3.9 1960s* 2.4 5.6 4.8 3.7 1970s 2.0 4.2 4.5 3.4 1980s 3.5 5.5 6.6 5.2 1990s 3.3 6.2 7.5 5.9 2000s 3.2 8.5 8.9 7.6
Source: Drèze and Sen (2013) and National Accounts for 1950s and 1960s. * 1999-2000 prices. Table 3.2: Growth rate of components of GDP at constant market prices (per cent per annum)
Private Consumption
Government expenditure
Investment Exports Imports
1950-68 3.4 5.9 7.1 0.3 2.8 1968-80 3.8 6.3 4.9 7.6 6.1 1980-91 4.7 6.6 5.9 5.4 7.2 1992-2008 5.3 6.4 10.9 13.7 16.2
Source: De and Vakulabharanam (2013); National Accounts for 1950-68.
19
There is a substantial literature on the experience of this period. There is a widespread view that agriculture was neglected, but in fact there was considerable investment in large scale irrigation and land reforms (Nagaraj, 2012) and the primary sector grew at a respectable rate of over 3 per cent in the 1950s (table 3.1), the growth rate only dropping away in the 1960s. Kohli (2012) argues that large-scale industrialization and neglect of primary education had adverse effects on the poor, and that there was too much emphasis on creating “pockets of excellence”, while Chibber refers to “a near-absence of any real welfare policy”. These judgements may seem harsh, but there was little decline in poverty (see below) and the development model clearly ran out of steam in the mid 1960s, partly because of external factors such as wars with China and Pakistan and Nehru’s death, partly because of its own internal contradictions, with rising food and foreign exchange deficits. The coup de grace came with the drought and famine of 1965-67. Agricultural production dropped by 16 per cent between 1964-5 and 1965-6 (20 per cent for foodgrains), and did not recover until 1967-68 (Chaudhuri, 1978, table 12). Per capita foodgrain availability, which had risen from 376 gm per day in 1950 to 459 in 1961, stagnated in the 1960s, reaching only 464 gm in 1971. The political domination of the Congress party was such that there was little space for competing social forces. Chibber (2012) argues that the state favoured business over labour, and was slow to enact and implement labour legislation to protect worker interests. Insofar as the state engaged with labour, it was concerned with a rather small class of industrial workers, essential for the success of the industrialization strategy. In rural areas, as noted in the previous section, political support came mainly from a class of rich peasants who gradually took over the space previously occupied by landlords and zamindars (although the latter remained influential for decades in some parts of the country), In 1960-61, roughly 63 per cent of the rural and 54 per cent of the urban population could be classified as poor according to Dandekar and Rath (1971). Those authors found little change in poverty during the 1960s, though different authors find different patterns. Figures for 1973-74 from the Planning Commission are slightly lower (at 56 and 49 per cent respectively), but whether this is because there was a real decline or due to difference in method is not clear. Bardhan (1984) found that the proportion of agricultural labour households below the poverty line in rural India increased from 52 per cent in 1963-64 to 56 per cent in 1977-78. A longer time series (Datt, 1998) suggests that in the whole period from Independence up to 1980 poverty levels fluctuated between 42 and 62 per cent, rising and then falling in the 1950s, rising again in the 1960s until 1967 (62 per cent) and then falling slowly to 48 per cent in 1977-78, a level comparable to 1952-3 or 1963-64. Overall it can be said that there was no substantial decline in poverty in this period, and since population growth accelerated the absolute numbers increased substantially. Whatever the trend, the famine of 1966-67 brought poverty to the forefront of attention in the late 1960s and 1970s, and in particular led to Indira Gandhi’s famous electoral slogan of “garibi hatao”, get rid of poverty, in 1971, along with her 20-point programme aimed at creating employment and directing resources towards the poor. Policy initiatives included the Public Distribution System providing subsidized foodgrains and the Integrated Rural Development Programme, as well as public works programmes along the lines suggested by Dandekar and Rath (but not on the scale they suggested). This was the period of the Green Revolution, which saw considerable increases in agricultural output as a result of new seeds and changing agricultural technology, but in the early years these gains were confined to relatively small parts of the country (especially Punjab and Haryana – see section 7.1.4), and overall agricultural growth did not accelerate until the 1980s. Moreover, financial constraints,
20
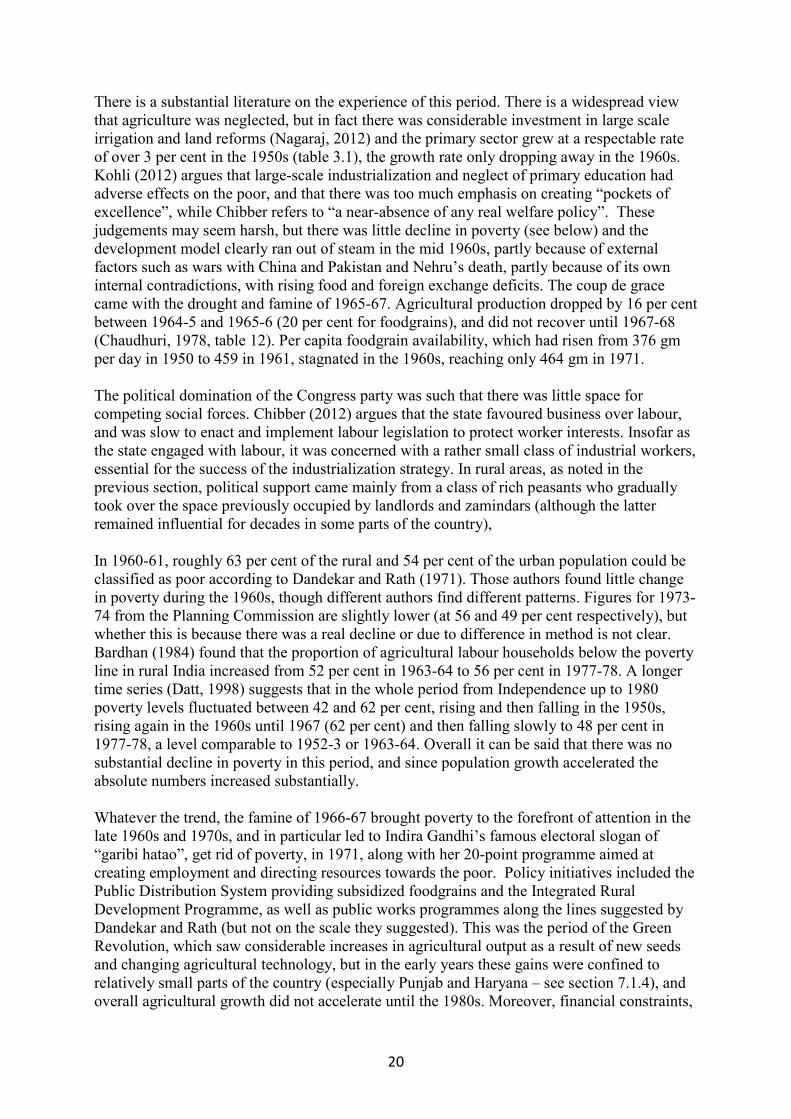
along with increased social expenditure, led to a drop in public investment and an increasing fiscal deficit (De and Vakulabharanam, 2013). The policy regime shifted towards “securing a better distribution of growth by promoting regional development, small-scale industries, curbing industrial monopolies and regulating foreign-owned enterprises” (Nagaraj, 2012, p.34). But the outcome was disappointing. GDP growth fell to 3.4 per cent in the 1970s. Since the population growth rate was accelerating the decline in output growth per capita was greater still. Of course, the external environment was unhelpful in the 1970s with the successive oil shocks, and imports rose, culminating in a balance of payments crisis and negative growth at the end of the decade. The 1970s saw not only economic crisis but also political crisis with the Emergency and the arrival in power in 1977 of a precarious coalition of anti-Indira Gandhi forces. The new government, however, hardly had time to put in place a new policy regime before it fell apart, opening the way for Indira Gandhi’s return to power. The period from 1950 to 1980 as a whole saw declining success in economic terms. It also did not see much change in the structure of employment in the economy as a whole. The high rate of growth of manufacturing did not create much employment, and the share of employment in agriculture hardly changed until the 1970s (table 3.3). In 1981 it had started to decline, but the secondary sector still accounted for only 13-14 per cent of employment, and the growth of the tertiary sector was starting to emerge.
Table 3.3: Sectoral distribution of output and employment, 1951-1981 (%) Sector 1951 1961 1971 1981 Output Emp’t Output Emp’t Output Emp’t Output Emp’t
Primary 51.8 72.4 42.6 71.9 42.0 72.0 35.4 68.8 Secondary (including mining)
14.2 10.6 19.3 11.7 20.5 11.5 24.3 13.5
Tertiary 33.3 17.0 38.3 16.4 37.2 16.5 39.9 17.7 Total* 100 100 100 100 100 100 100 100
Source: Census of India; National accounts (RBI database). Output data for 1950-51, 60-61, etc. *Figures for output (in current prices) do not add up to exactly 100 in the RBI database.
21

Chart 3.1 – Growth Regimes and Modes of Regulation in India (1947-80) Post colonial industrialization
(1947-1967) Populist (1967-1980)
Accumulation regime Inward looking State capitalist Inward looking State
capitalist/populist Institutional Forms
Type of integration in the International Economy
Very limited; import substitution in capital goods, slow growth of exports. Capital market closed. Foreign managed firms taken over by nationals on Independence
Remaining focussed on domestic economy, higher growth of exports to cover imports of necessities and capital goods. Capital market remains closed
Competition regime
Oligopoly, national private companies indirectly subsidised through public sector investment. Growth of public sector monopolies
Some shift towards curbing private monopoly and promoting small scale industries. But main features remained unchanged
Wage labour relations
Institutionalized only for small industrial proletariat and public sector workers with state-imposed protection and fair wages. Otherwise competitive with stagnant real wages. Women largely excluded except in agriculture
Protected segment remains small, improved organized and bargaining increases wage gap between industrial workers and the rest. Growth of precarious jobs and informality in urban areas. Growth of casual labour in rural areas
Agrarian relations
Highly unequal land structure, limited land reform reduced landlessness but persistence of semi-feudal relations in some areas. Slow growth in agricultural productivity after 1960 leads to crisis and famine
Beginnings of technological change (Green Revolution) in agriculture but regionally concentrated. Stagnant wages and growth of landless agricultural labour.
Monetary/fiscal regime
Fiscal capacity of the state expands with acceleration of growth
Lack of diversification of tax base and slow growth, along with increased government expenditure in populist programmes, lead to fiscal deficits and eventually crisis
Role of the State Dominant, driving growth through public investment and setting rules for private economic activity
Dominant but weakened by successive political crises. Growth of government expenditure despite slower GDP growth.
Mode of regulation Dualistic state-led industrialization Dualistic state-led populist
Income distribution profile
Little direct redistribution except through limited land reform and growth of public sector. Some decline in inequality probably reflects redistribution from the rich to the middle, little change in poverty and increasing gap between protected workers and others.
After setbacks in mid 1960s inequality declined within rural and urban areas, partly due to state redistribution through populist programmes. Real wages of casual workers stagnated, and wage differentials between organized industrial workers and others increased. Urban-rural differentials and regional differentials probably increased.
22
3.2 The impact on inequality For a long period, India’s history took place in the context of rule by an alien, colonial, power. This episode created, altered and reinforced existing inequalities in a host of different ways. Since Independence some of the old inequalities have been strengthened or have reappeared in new guises; while new structures of inequality have developed. 3.2.1. Regional differences Not only was India on average poor, but it was a large country with differences in living standards across the country. Comparable State income estimates are available only from the late 1950s. The relative variation of State per capita income in 1960-61 was 23 per cent, which, however, is not high by international standards. The corresponding figure for the US was 36 per cent in 1929 and 23 per cent in 1955 (Kumar and Krishnamurty, 1981). Another way to make comparisons of regional inequality has been developed by Williamson (1965). We can compare the industrial distribution of the work force in different States and form an idea of differentials, assuming that a higher share of agriculture in the work force is associated with a lower level of development and per capita income. Using this indicator, India had a rather low degree of regional inequality in 1951: the coefficient of variation in the share of agriculture in the work force of the different States is about 9 per cent. This is lower than Brazil (13 per cent), equal to the US, and much lower than that in Finland, Austria, Spain, Japan and Sweden, as reported by Williamson. Nevertheless, this apparent lack of regional differentiation largely reflected the conditions of the agricultural sector. Insofar as modern industry had started to develop, it was concentrated in the larger cities, especially in Bombay, Calcutta, and Madras, and to a lesser degree in places like Ahmedabad and Kanpur. Regional political forces were also important, and led to quite different roles for the state and development trajectories in different parts of the country. Communist parties came to power in both Kerala and West Bengal, which to a considerable extent explains high minimum wages in the former and progress in land reform in the latter. There were also reforming leaders in states such as Punjab and Tamil Nadu, who built local coalitions around support for local investment in industry combined with redistributive programmes that were lacking at the centre. But these regional variations did not change the broad thrust of national policy. 3.2.2 Inequality of income or consumption For the period from 1951 onwards the Gini coefficient for expenditure for rural India, as measured by national sample surveys, remained in the region of 30-34 per cent for most of the years up to 1983 while for urban India the percentages generally were in the upper 30s (Dastidar, 2004). In both rural and urban areas there is some evidence of improving distribution, with the rural Gini coefficient declining from around 0.34 in the early 1950s to around 0.30 in the 1970s, and the urban coefficient from around 0.4 to 0.34. There is one piece of additional evidence to support the proposition of declining inequality, from the work by Banerjee and Piketty (2004). They found that the share of the top 1 per cent of incomes, based on income tax records, fell sharply between the early 1950s (when it
23
reached 14 per cent of all income) and 1980 (when it was less than 5 per cent of all income). This redistribution of 9 per cent of national income is quite substantial. This has to be set against the evidence, above, that there was very little decline in poverty in this period. Datt’s (1998) analysis suggests that there was some modest impact of redistribution on poverty, but the obvious implication of a decline in the income share of the top 1 per cent, and improving inequality, but not much change in poverty, is that little of the redistribution was reaching the bottom half of the population. It seems more likely that there was redistribution from the very rich to an intermediate class, perhaps of industrial workers, white collar workers and bureaucrats or middle peasants. This would be consistent with the dualistic development model followed in urban areas, and the limited land reform in rural areas (below).
3.2.3 Inequality in assets An important driver of changes in the inequality of income and consumption would be changes in the inequality of assets. In the post-Independence period, large scale surveys and attempts to use land records were undertaken with the objective of understanding land holding and land operation patterns and changes in them over time. These were important in the context of on-going attempts, especially in the 1950s, to carry out land reform aimed at eliminating intermediaries, giving (wherever possible) land to the tiller and ensuring security of tenure (as discussed in section 2). These measures necessitated better recording of land, both for carrying out the reform and for assessing outcomes. Simultaneously they must have encouraged misreporting of holdings by powerful groups in the countryside. At the time of Independence, the Congress articulated the need for land ceilings, but as Jannuzi (1994) writes, the legal pathways were based on colonial procedures. The Kumarappa committee set up after Independence suggested various measures to eliminate intermediaries, influence the size of landholdings, the need for joint farming and community rights and ownership. However, the systems were designed such that the ceilings were often not effective, and various loopholes (land for personal cultivation, lack of written contracts, change of tiller often benefitting landlords) were created and used by the elites to retain land and power (Appu 1975, Jannuzi 1994). The limited land reforms that unfolded did remove intermediaries, but did not lead to any real redistribution, and in fact created or strengthened an elite class. Relatively wealthy peasants in many parts of India, who had prospered under British rule, probably worked to prevent any real attempt at land redistribution. In fact after Independence, the issue of land ceilings was made a state issue (and states were anyway to a greater degree in the control of the local elites) and therefore land distribution did not have teeth (Chibber 2012). The land reforms and redistribution that did take place led to the creation of a new class of large peasants, effectively a new class of elites. Further, even the forming of cooperatives was largely ornamental. The land reforms were more successful in some parts of India than in others, but we do not have direct evidence on their impact on inequality of income. We can, following Sanyal, look at the changes between the mid 1950s and the early 1970s in the distribution of rural households by ownership of land (Sanyal, 1988, pp 121-153). The data are from the NSS 8th, 17th and 26th Rounds. The figures (table 3.4) suggest a sharp decline in the proportion owning no land, especially between the mid 1950s and the 1960s. This may be overstated so we should also look at the distribution of households holding some land. The proportion holding some land, but under an acre, increased sharply from 31.4 to 39 per cent. The proportion with
24
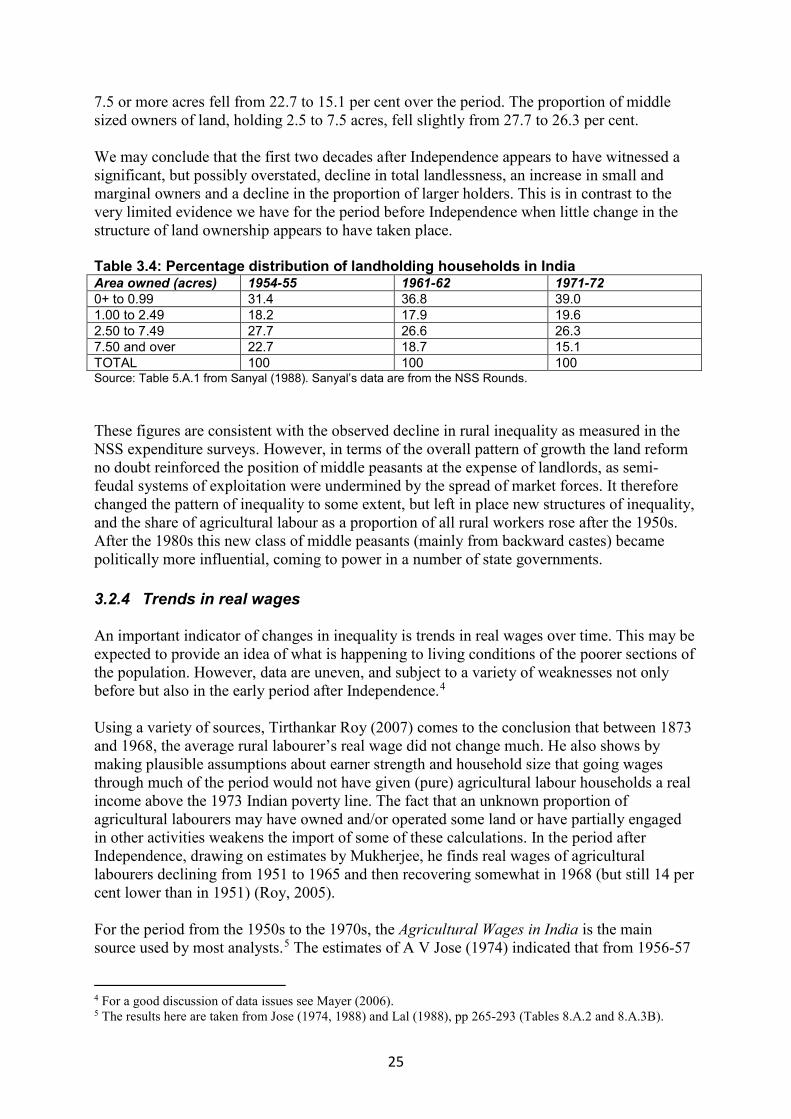
7.5 or more acres fell from 22.7 to 15.1 per cent over the period. The proportion of middle sized owners of land, holding 2.5 to 7.5 acres, fell slightly from 27.7 to 26.3 per cent. We may conclude that the first two decades after Independence appears to have witnessed a significant, but possibly overstated, decline in total landlessness, an increase in small and marginal owners and a decline in the proportion of larger holders. This is in contrast to the very limited evidence we have for the period before Independence when little change in the structure of land ownership appears to have taken place. Table 3.4: Percentage distribution of landholding households in India Area owned (acres) 1954-55 1961-62 1971-72 0+ to 0.99 31.4 36.8 39.0 1.00 to 2.49 18.2 17.9 19.6 2.50 to 7.49 27.7 26.6 26.3 7.50 and over 22.7 18.7 15.1 TOTAL 100 100 100 Source: Table 5.A.1 from Sanyal (1988). Sanyal’s data are from the NSS Rounds. These figures are consistent with the observed decline in rural inequality as measured in the NSS expenditure surveys. However, in terms of the overall pattern of growth the land reform no doubt reinforced the position of middle peasants at the expense of landlords, as semi-feudal systems of exploitation were undermined by the spread of market forces. It therefore changed the pattern of inequality to some extent, but left in place new structures of inequality, and the share of agricultural labour as a proportion of all rural workers rose after the 1950s. After the 1980s this new class of middle peasants (mainly from backward castes) became politically more influential, coming to power in a number of state governments.
3.2.4 Trends in real wages An important indicator of changes in inequality is trends in real wages over time. This may be expected to provide an idea of what is happening to living conditions of the poorer sections of the population. However, data are uneven, and subject to a variety of weaknesses not only before but also in the early period after Independence.4 Using a variety of sources, Tirthankar Roy (2007) comes to the conclusion that between 1873 and 1968, the average rural labourer’s real wage did not change much. He also shows by making plausible assumptions about earner strength and household size that going wages through much of the period would not have given (pure) agricultural labour households a real income above the 1973 Indian poverty line. The fact that an unknown proportion of agricultural labourers may have owned and/or operated some land or have partially engaged in other activities weakens the import of some of these calculations. In the period after Independence, drawing on estimates by Mukherjee, he finds real wages of agricultural labourers declining from 1951 to 1965 and then recovering somewhat in 1968 (but still 14 per cent lower than in 1951) (Roy, 2005). For the period from the 1950s to the 1970s, the Agricultural Wages in India is the main source used by most analysts.5 The estimates of A V Jose (1974) indicated that from 1956-57
4 For a good discussion of data issues see Mayer (2006). 5 The results here are taken from Jose (1974, 1988) and Lal (1988), pp 265-293 (Tables 8.A.2 and 8.A.3B).
25
to 1971-72 there was an increase in real wages of male agricultural labourers in 7 states, and a decline in 5 states. A simple (unweighted) average of these changes would give an increase of 16 per cent over this period, of the order of 1 per cent per year. However, the data from the Agricultural (later Rural) Labour Enquiries suggest that the real wage fluctuated between 1950 and 1970: it rose from 1950 to 1970, but fell below the 1950 level in 1974. This is confirmed by Jose’s analysis (1988); in 1974-75 wages in every state were lower than in 1970-71, mostly 20 to 30 per cent lower. There was some recovery later in the decade, but on average wages in 1979-80 were little different from a decade earlier. While there is some uncertainty about the exact numbers, and a great deal of variation across the country, it seems that on balance the increase in wages of agricultural workers in the first 3 decades after Independence was at best modest, and in much of the country negligible. Information on industrial wages is quite uneven, but the picture is distinctly more positive. In the paper industry, cotton textiles, iron and steel and cement real wages were 40 to 70% higher in 1980 than in 1967; there was a similar increase in coal mining (Tulpule and Datta, 1989). These may reflect the bargaining power of organized labour, though they can also reflect skill differentials. In any case they are evidence of a widening wage gap between agriculture and organized industry. This would be consistent with the speculation, above, that the beneficiaries of income redistribution during this period were not the poor, but intermediate groups. 3.3 The situation at the end of the 1970s The political struggles of the late 1970s took place against a backdrop of persistent poverty and low economic growth. The socialist rhetoric of the Nehru era had hidden a degree of coordination between the state and private capital, but conflicts with organized private interests had sharpened under Indira Gandhi, whose populist programme attempted to increase the degree of state control without being able to generate a dynamic process of growth or raise the rate of investment. Some recovery in food security had to be set against the failure of Indian manufacturing to take off, in notable contrast to East Asia. There had been some redistribution away from the rich, but in practice little towards the poor, and the urgent need for wider social programmes in education and health was ignored (Kohli, 2012). The main political forces were the bureaucratic elite, a class of medium or large landowners, and patronage-based structures around the Congress party without a social base (Kohli); none of these had any particular interest in rapid economic growth. There was a business community, with a small number of prominent leaders, but their influence on state policy declined under Indira Gandhi compared with the period around and immediately after Independence. The international environment was unfavourable, with India’s principal partner, the USSR, facing serious economic and political difficulties, while the west was entering a deep recession as a result of the oil shocks. It was not a pretty picture.
26
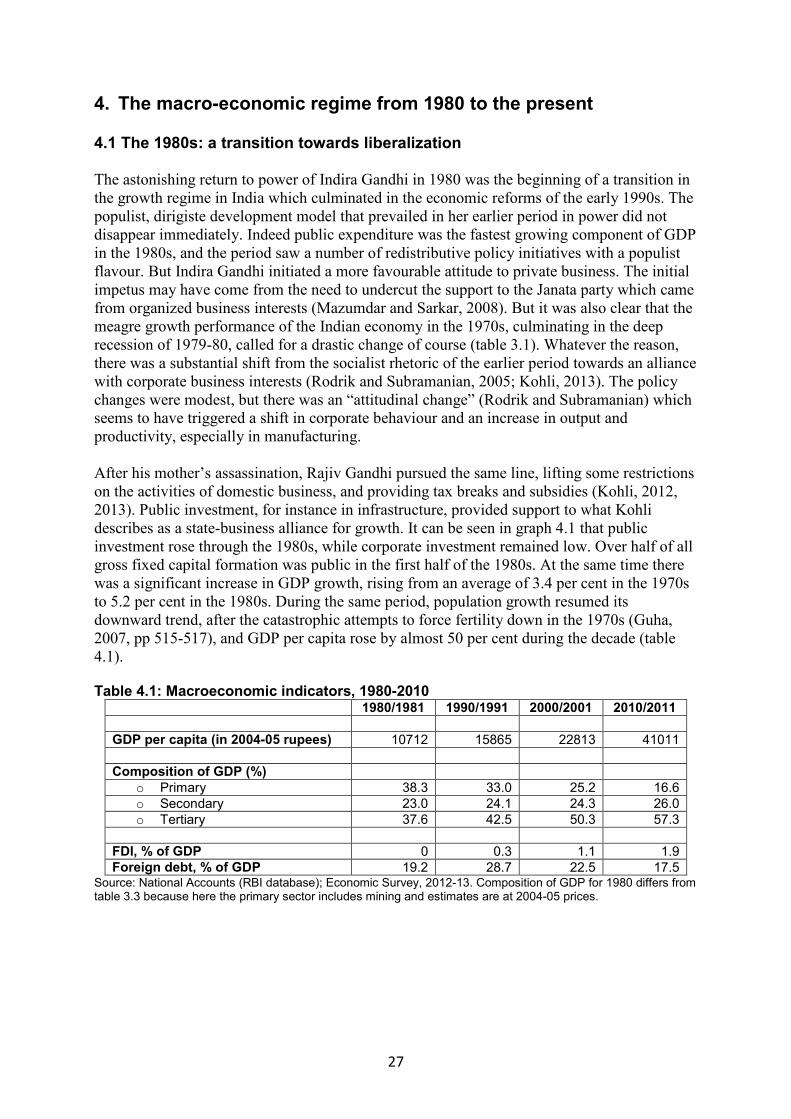
4. The macro-economic regime from 1980 to the present 4.1 The 1980s: a transition towards liberalization The astonishing return to power of Indira Gandhi in 1980 was the beginning of a transition in the growth regime in India which culminated in the economic reforms of the early 1990s. The populist, dirigiste development model that prevailed in her earlier period in power did not disappear immediately. Indeed public expenditure was the fastest growing component of GDP in the 1980s, and the period saw a number of redistributive policy initiatives with a populist flavour. But Indira Gandhi initiated a more favourable attitude to private business. The initial impetus may have come from the need to undercut the support to the Janata party which came from organized business interests (Mazumdar and Sarkar, 2008). But it was also clear that the meagre growth performance of the Indian economy in the 1970s, culminating in the deep recession of 1979-80, called for a drastic change of course (table 3.1). Whatever the reason, there was a substantial shift from the socialist rhetoric of the earlier period towards an alliance with corporate business interests (Rodrik and Subramanian, 2005; Kohli, 2013). The policy changes were modest, but there was an “attitudinal change” (Rodrik and Subramanian) which seems to have triggered a shift in corporate behaviour and an increase in output and productivity, especially in manufacturing. After his mother’s assassination, Rajiv Gandhi pursued the same line, lifting some restrictions on the activities of domestic business, and providing tax breaks and subsidies (Kohli, 2012, 2013). Public investment, for instance in infrastructure, provided support to what Kohli describes as a state-business alliance for growth. It can be seen in graph 4.1 that public investment rose through the 1980s, while corporate investment remained low. Over half of all gross fixed capital formation was public in the first half of the 1980s. At the same time there was a significant increase in GDP growth, rising from an average of 3.4 per cent in the 1970s to 5.2 per cent in the 1980s. During the same period, population growth resumed its downward trend, after the catastrophic attempts to force fertility down in the 1970s (Guha, 2007, pp 515-517), and GDP per capita rose by almost 50 per cent during the decade (table 4.1). Table 4.1: Macroeconomic indicators, 1980-2010
1980/1981 1990/1991 2000/2001 2010/2011
GDP per capita (in 2004-05 rupees) 10712 15865 22813 41011 Composition of GDP (%)
o Primary 38.3 33.0 25.2 16.6 o Secondary 23.0 24.1 24.3 26.0 o Tertiary 37.6 42.5 50.3 57.3
FDI, % of GDP 0 0.3 1.1 1.9 Foreign debt, % of GDP 19.2 28.7 22.5 17.5
Source: National Accounts (RBI database); Economic Survey, 2012-13. Composition of GDP for 1980 differs from table 3.3 because here the primary sector includes mining and estimates are at 2004-05 prices.
27
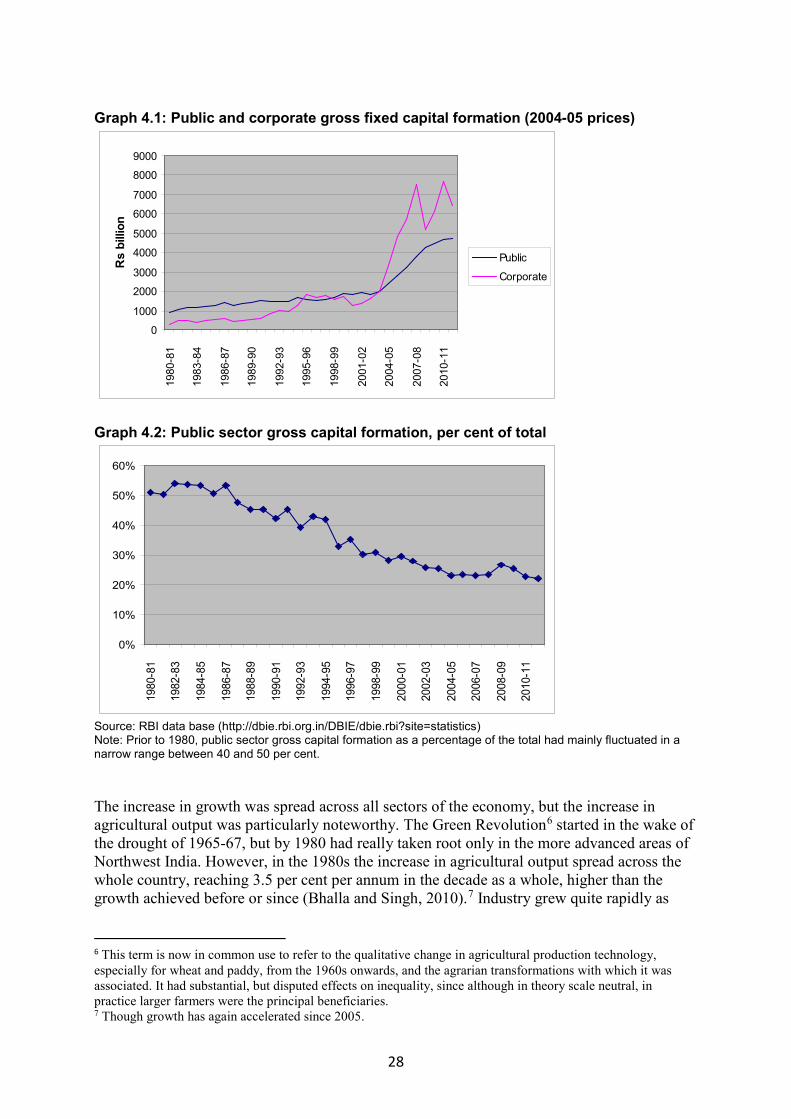
Graph 4.1: Public and corporate gross fixed capital formation (2004-05 prices)
0
1000
2000
3000
4000
5000
6000
7000
8000
900019
80-8
1
1983
-84
1986
-87
1989
-90
1992
-93
1995
-96
1998
-99
2001
-02
2004
-05
2007
-08
2010
-11
Rs
billi
on
Public
Corporate
Graph 4.2: Public sector gross capital formation, per cent of total
0%
10%
20%
30%
40%
50%
60%
1980
-81
1982
-83
1984
-85
1986
-87
1988
-89
1990
-91
1992
-93
1994
-95
1996
-97
1998
-99
2000
-01
2002
-03
2004
-05
2006
-07
2008
-09
2010
-11
Source: RBI data base (http://dbie.rbi.org.in/DBIE/dbie.rbi?site=statistics) Note: Prior to 1980, public sector gross capital formation as a percentage of the total had mainly fluctuated in a narrow range between 40 and 50 per cent. The increase in growth was spread across all sectors of the economy, but the increase in agricultural output was particularly noteworthy. The Green Revolution6 started in the wake of the drought of 1965-67, but by 1980 had really taken root only in the more advanced areas of Northwest India. However, in the 1980s the increase in agricultural output spread across the whole country, reaching 3.5 per cent per annum in the decade as a whole, higher than the growth achieved before or since (Bhalla and Singh, 2010).7 Industry grew quite rapidly as
6 This term is now in common use to refer to the qualitative change in agricultural production technology, especially for wheat and paddy, from the 1960s onwards, and the agrarian transformations with which it was associated. It had substantial, but disputed effects on inequality, since although in theory scale neutral, in practice larger farmers were the principal beneficiaries. 7 Though growth has again accelerated since 2005.
28
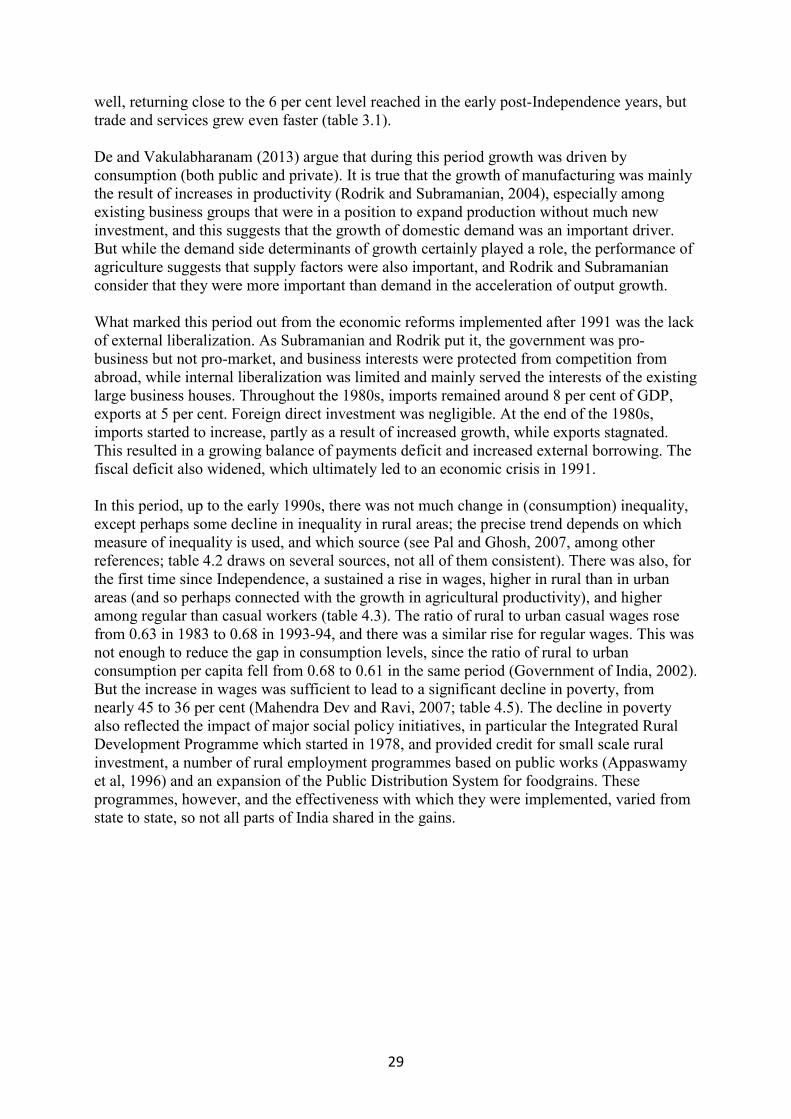
well, returning close to the 6 per cent level reached in the early post-Independence years, but trade and services grew even faster (table 3.1). De and Vakulabharanam (2013) argue that during this period growth was driven by consumption (both public and private). It is true that the growth of manufacturing was mainly the result of increases in productivity (Rodrik and Subramanian, 2004), especially among existing business groups that were in a position to expand production without much new investment, and this suggests that the growth of domestic demand was an important driver. But while the demand side determinants of growth certainly played a role, the performance of agriculture suggests that supply factors were also important, and Rodrik and Subramanian consider that they were more important than demand in the acceleration of output growth. What marked this period out from the economic reforms implemented after 1991 was the lack of external liberalization. As Subramanian and Rodrik put it, the government was pro-business but not pro-market, and business interests were protected from competition from abroad, while internal liberalization was limited and mainly served the interests of the existing large business houses. Throughout the 1980s, imports remained around 8 per cent of GDP, exports at 5 per cent. Foreign direct investment was negligible. At the end of the 1980s, imports started to increase, partly as a result of increased growth, while exports stagnated. This resulted in a growing balance of payments deficit and increased external borrowing. The fiscal deficit also widened, which ultimately led to an economic crisis in 1991. In this period, up to the early 1990s, there was not much change in (consumption) inequality, except perhaps some decline in inequality in rural areas; the precise trend depends on which measure of inequality is used, and which source (see Pal and Ghosh, 2007, among other references; table 4.2 draws on several sources, not all of them consistent). There was also, for the first time since Independence, a sustained a rise in wages, higher in rural than in urban areas (and so perhaps connected with the growth in agricultural productivity), and higher among regular than casual workers (table 4.3). The ratio of rural to urban casual wages rose from 0.63 in 1983 to 0.68 in 1993-94, and there was a similar rise for regular wages. This was not enough to reduce the gap in consumption levels, since the ratio of rural to urban consumption per capita fell from 0.68 to 0.61 in the same period (Government of India, 2002). But the increase in wages was sufficient to lead to a significant decline in poverty, from nearly 45 to 36 per cent (Mahendra Dev and Ravi, 2007; table 4.5). The decline in poverty also reflected the impact of major social policy initiatives, in particular the Integrated Rural Development Programme which started in 1978, and provided credit for small scale rural investment, a number of rural employment programmes based on public works (Appaswamy et al, 1996) and an expansion of the Public Distribution System for foodgrains. These programmes, however, and the effectiveness with which they were implemented, varied from state to state, so not all parts of India shared in the gains.
29
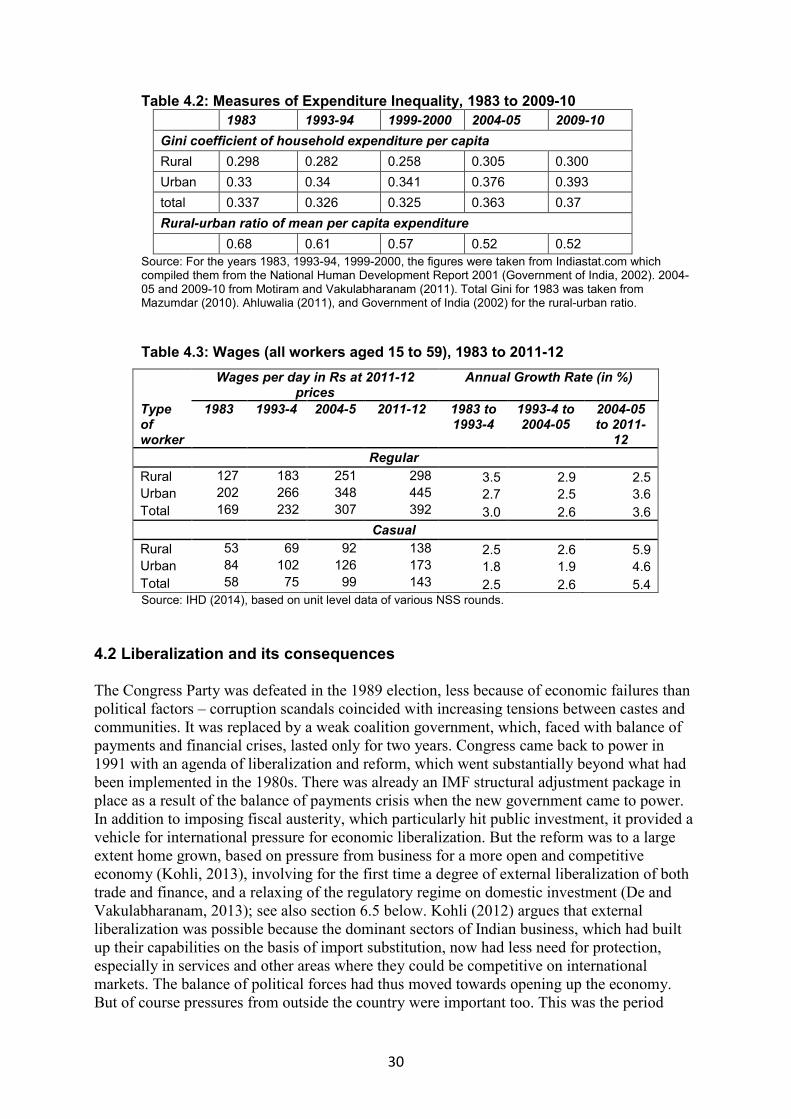
Table 4.2: Measures of Expenditure Inequality, 1983 to 2009-10 1983 1993-94 1999-2000 2004-05 2009-10 Gini coefficient of household expenditure per capita Rural 0.298 0.282 0.258 0.305 0.300 Urban 0.33 0.34 0.341 0.376 0.393 total 0.337 0.326 0.325 0.363 0.37 Rural-urban ratio of mean per capita expenditure 0.68 0.61 0.57 0.52 0.52
Source: For the years 1983, 1993-94, 1999-2000, the figures were taken from Indiastat.com which compiled them from the National Human Development Report 2001 (Government of India, 2002). 2004-05 and 2009-10 from Motiram and Vakulabharanam (2011). Total Gini for 1983 was taken from Mazumdar (2010). Ahluwalia (2011), and Government of India (2002) for the rural-urban ratio.
Table 4.3: Wages (all workers aged 15 to 59), 1983 to 2011-12
Type of worker
Wages per day in Rs at 2011-12 prices
Annual Growth Rate (in %)
1983 1993-4 2004-5 2011-12 1983 to 1993-4
1993-4 to 2004-05
2004-05 to 2011-
12 Regular
Rural 127 183 251 298 3.5 2.9 2.5 Urban 202 266 348 445 2.7 2.5 3.6 Total 169 232 307 392 3.0 2.6 3.6
Casual Rural 53 69 92 138 2.5 2.6 5.9 Urban 84 102 126 173 1.8 1.9 4.6 Total 58 75 99 143 2.5 2.6 5.4 Source: IHD (2014), based on unit level data of various NSS rounds.
4.2 Liberalization and its consequences The Congress Party was defeated in the 1989 election, less because of economic failures than political factors – corruption scandals coincided with increasing tensions between castes and communities. It was replaced by a weak coalition government, which, faced with balance of payments and financial crises, lasted only for two years. Congress came back to power in 1991 with an agenda of liberalization and reform, which went substantially beyond what had been implemented in the 1980s. There was already an IMF structural adjustment package in place as a result of the balance of payments crisis when the new government came to power. In addition to imposing fiscal austerity, which particularly hit public investment, it provided a vehicle for international pressure for economic liberalization. But the reform was to a large extent home grown, based on pressure from business for a more open and competitive economy (Kohli, 2013), involving for the first time a degree of external liberalization of both trade and finance, and a relaxing of the regulatory regime on domestic investment (De and Vakulabharanam, 2013); see also section 6.5 below. Kohli (2012) argues that external liberalization was possible because the dominant sectors of Indian business, which had built up their capabilities on the basis of import substitution, now had less need for protection, especially in services and other areas where they could be competitive on international markets. The balance of political forces had thus moved towards opening up the economy. But of course pressures from outside the country were important too. This was the period
30
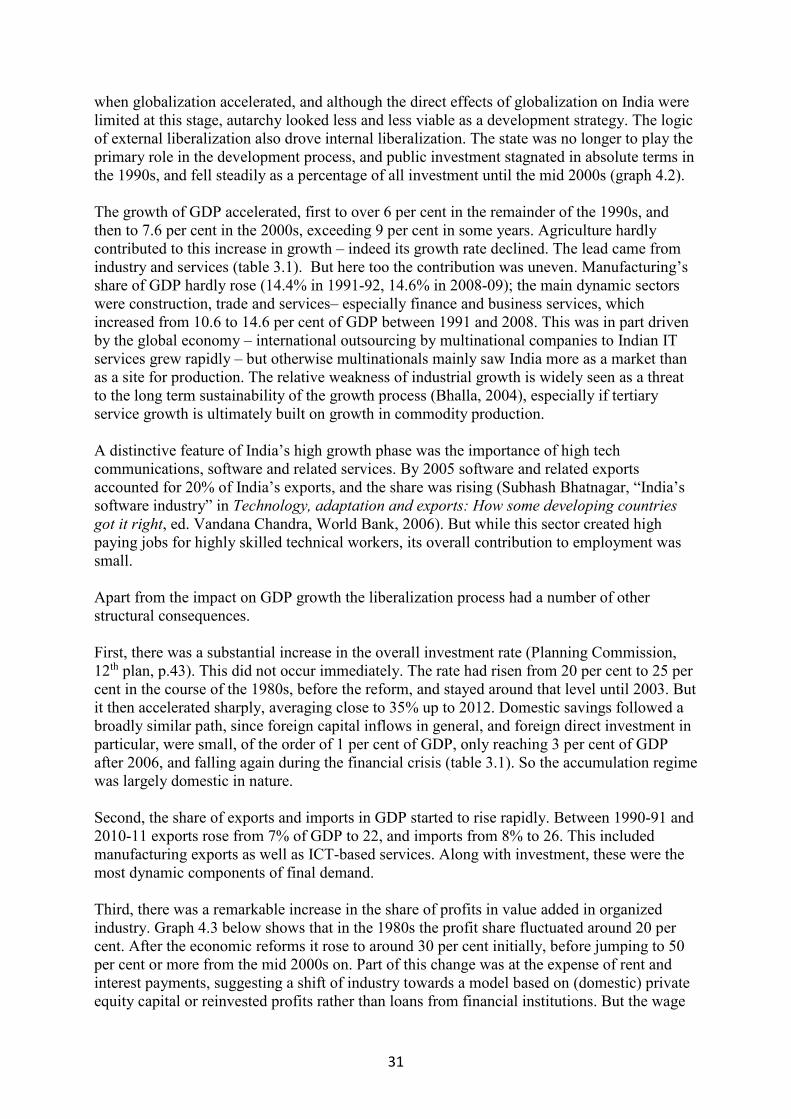
when globalization accelerated, and although the direct effects of globalization on India were limited at this stage, autarchy looked less and less viable as a development strategy. The logic of external liberalization also drove internal liberalization. The state was no longer to play the primary role in the development process, and public investment stagnated in absolute terms in the 1990s, and fell steadily as a percentage of all investment until the mid 2000s (graph 4.2). The growth of GDP accelerated, first to over 6 per cent in the remainder of the 1990s, and then to 7.6 per cent in the 2000s, exceeding 9 per cent in some years. Agriculture hardly contributed to this increase in growth – indeed its growth rate declined. The lead came from industry and services (table 3.1). But here too the contribution was uneven. Manufacturing’s share of GDP hardly rose (14.4% in 1991-92, 14.6% in 2008-09); the main dynamic sectors were construction, trade and services– especially finance and business services, which increased from 10.6 to 14.6 per cent of GDP between 1991 and 2008. This was in part driven by the global economy – international outsourcing by multinational companies to Indian IT services grew rapidly – but otherwise multinationals mainly saw India more as a market than as a site for production. The relative weakness of industrial growth is widely seen as a threat to the long term sustainability of the growth process (Bhalla, 2004), especially if tertiary service growth is ultimately built on growth in commodity production. A distinctive feature of India’s high growth phase was the importance of high tech communications, software and related services. By 2005 software and related exports accounted for 20% of India’s exports, and the share was rising (Subhash Bhatnagar, “India’s software industry” in Technology, adaptation and exports: How some developing countries got it right, ed. Vandana Chandra, World Bank, 2006). But while this sector created high paying jobs for highly skilled technical workers, its overall contribution to employment was small. Apart from the impact on GDP growth the liberalization process had a number of other structural consequences. First, there was a substantial increase in the overall investment rate (Planning Commission, 12th plan, p.43). This did not occur immediately. The rate had risen from 20 per cent to 25 per cent in the course of the 1980s, before the reform, and stayed around that level until 2003. But it then accelerated sharply, averaging close to 35% up to 2012. Domestic savings followed a broadly similar path, since foreign capital inflows in general, and foreign direct investment in particular, were small, of the order of 1 per cent of GDP, only reaching 3 per cent of GDP after 2006, and falling again during the financial crisis (table 3.1). So the accumulation regime was largely domestic in nature. Second, the share of exports and imports in GDP started to rise rapidly. Between 1990-91 and 2010-11 exports rose from 7% of GDP to 22, and imports from 8% to 26. This included manufacturing exports as well as ICT-based services. Along with investment, these were the most dynamic components of final demand. Third, there was a remarkable increase in the share of profits in value added in organized industry. Graph 4.3 below shows that in the 1980s the profit share fluctuated around 20 per cent. After the economic reforms it rose to around 30 per cent initially, before jumping to 50 per cent or more from the mid 2000s on. Part of this change was at the expense of rent and interest payments, suggesting a shift of industry towards a model based on (domestic) private equity capital or reinvested profits rather than loans from financial institutions. But the wage
31
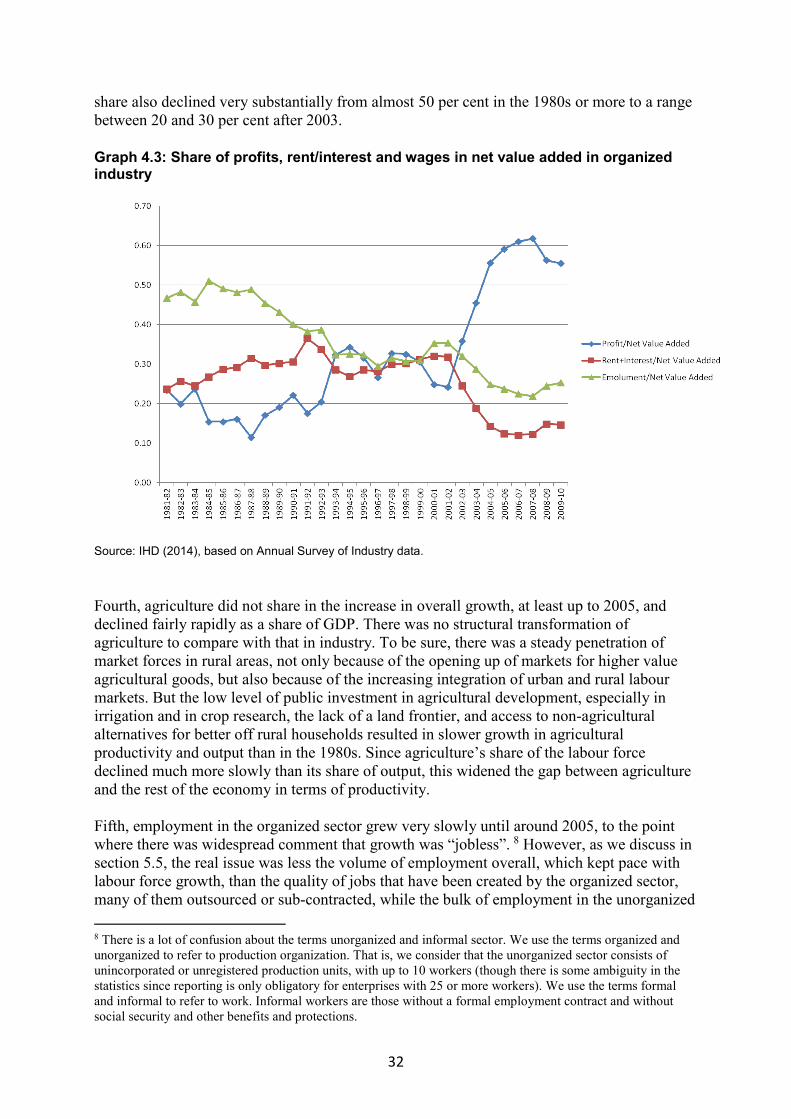
share also declined very substantially from almost 50 per cent in the 1980s or more to a range between 20 and 30 per cent after 2003. Graph 4.3: Share of profits, rent/interest and wages in net value added in organized industry
Source: IHD (2014), based on Annual Survey of Industry data. Fourth, agriculture did not share in the increase in overall growth, at least up to 2005, and declined fairly rapidly as a share of GDP. There was no structural transformation of agriculture to compare with that in industry. To be sure, there was a steady penetration of market forces in rural areas, not only because of the opening up of markets for higher value agricultural goods, but also because of the increasing integration of urban and rural labour markets. But the low level of public investment in agricultural development, especially in irrigation and in crop research, the lack of a land frontier, and access to non-agricultural alternatives for better off rural households resulted in slower growth in agricultural productivity and output than in the 1980s. Since agriculture’s share of the labour force declined much more slowly than its share of output, this widened the gap between agriculture and the rest of the economy in terms of productivity. Fifth, employment in the organized sector grew very slowly until around 2005, to the point where there was widespread comment that growth was “jobless”. 8 However, as we discuss in section 5.5, the real issue was less the volume of employment overall, which kept pace with labour force growth, than the quality of jobs that have been created by the organized sector, many of them outsourced or sub-contracted, while the bulk of employment in the unorganized
8 There is a lot of confusion about the terms unorganized and informal sector. We use the terms organized and unorganized to refer to production organization. That is, we consider that the unorganized sector consists of unincorporated or unregistered production units, with up to 10 workers (though there is some ambiguity in the statistics since reporting is only obligatory for enterprises with 25 or more workers). We use the terms formal and informal to refer to work. Informal workers are those without a formal employment contract and without social security and other benefits and protections.
32
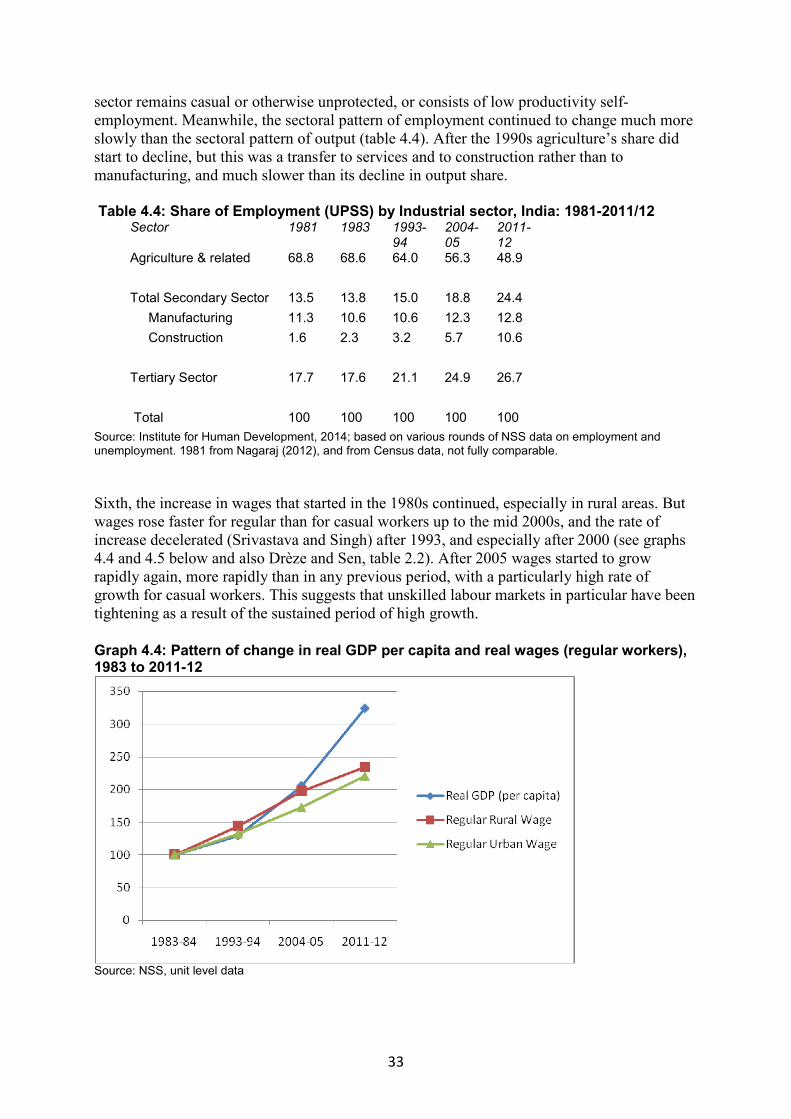
sector remains casual or otherwise unprotected, or consists of low productivity self-employment. Meanwhile, the sectoral pattern of employment continued to change much more slowly than the sectoral pattern of output (table 4.4). After the 1990s agriculture’s share did start to decline, but this was a transfer to services and to construction rather than to manufacturing, and much slower than its decline in output share. Table 4.4: Share of Employment (UPSS) by Industrial sector, India: 1981-2011/12
Sector 1981 1983 1993-94
2004-05
2011-12
Agriculture & related 68.8 68.6 64.0 56.3 48.9 Total Secondary Sector 13.5 13.8 15.0 18.8 24.4 Manufacturing 11.3 10.6 10.6 12.3 12.8 Construction 1.6 2.3 3.2 5.7 10.6 Tertiary Sector 17.7 17.6 21.1 24.9 26.7 Total 100 100 100 100 100
Source: Institute for Human Development, 2014; based on various rounds of NSS data on employment and unemployment. 1981 from Nagaraj (2012), and from Census data, not fully comparable. Sixth, the increase in wages that started in the 1980s continued, especially in rural areas. But wages rose faster for regular than for casual workers up to the mid 2000s, and the rate of increase decelerated (Srivastava and Singh) after 1993, and especially after 2000 (see graphs 4.4 and 4.5 below and also Drèze and Sen, table 2.2). After 2005 wages started to grow rapidly again, more rapidly than in any previous period, with a particularly high rate of growth for casual workers. This suggests that unskilled labour markets in particular have been tightening as a result of the sustained period of high growth. Graph 4.4: Pattern of change in real GDP per capita and real wages (regular workers), 1983 to 2011-12
Source: NSS, unit level data
33
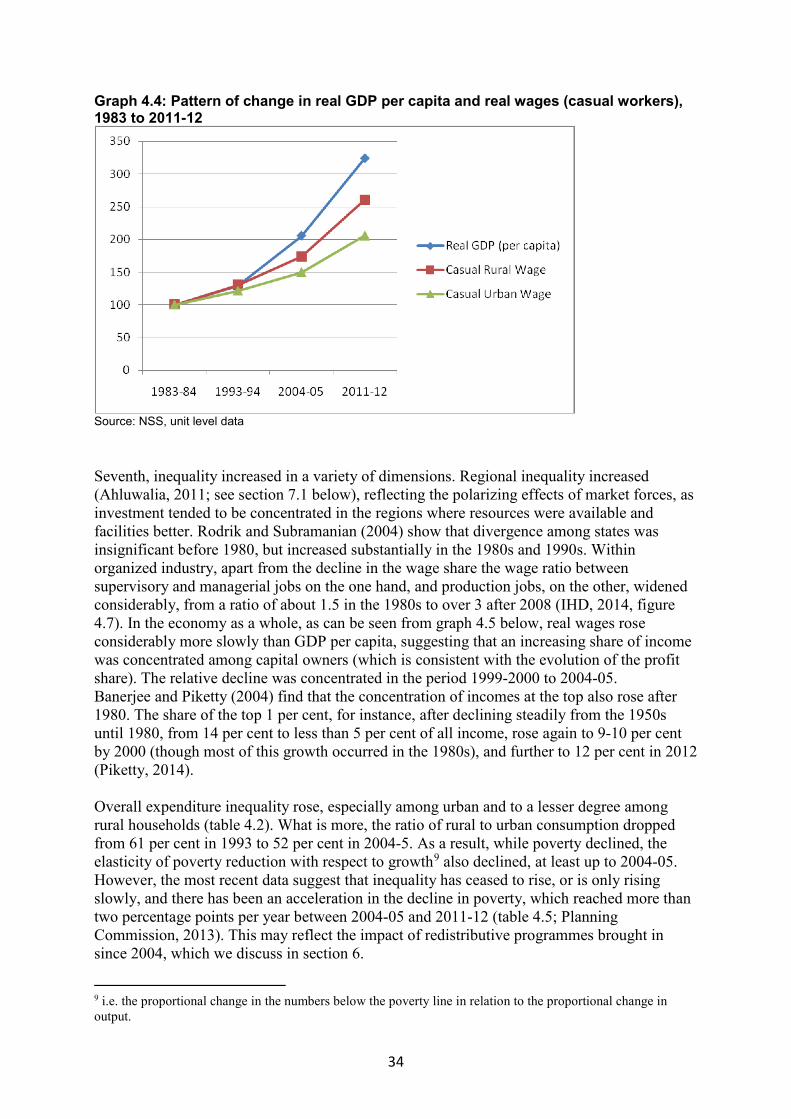
Graph 4.4: Pattern of change in real GDP per capita and real wages (casual workers), 1983 to 2011-12
Source: NSS, unit level data Seventh, inequality increased in a variety of dimensions. Regional inequality increased (Ahluwalia, 2011; see section 7.1 below), reflecting the polarizing effects of market forces, as investment tended to be concentrated in the regions where resources were available and facilities better. Rodrik and Subramanian (2004) show that divergence among states was insignificant before 1980, but increased substantially in the 1980s and 1990s. Within organized industry, apart from the decline in the wage share the wage ratio between supervisory and managerial jobs on the one hand, and production jobs, on the other, widened considerably, from a ratio of about 1.5 in the 1980s to over 3 after 2008 (IHD, 2014, figure 4.7). In the economy as a whole, as can be seen from graph 4.5 below, real wages rose considerably more slowly than GDP per capita, suggesting that an increasing share of income was concentrated among capital owners (which is consistent with the evolution of the profit share). The relative decline was concentrated in the period 1999-2000 to 2004-05. Banerjee and Piketty (2004) find that the concentration of incomes at the top also rose after 1980. The share of the top 1 per cent, for instance, after declining steadily from the 1950s until 1980, from 14 per cent to less than 5 per cent of all income, rose again to 9-10 per cent by 2000 (though most of this growth occurred in the 1980s), and further to 12 per cent in 2012 (Piketty, 2014). Overall expenditure inequality rose, especially among urban and to a lesser degree among rural households (table 4.2). What is more, the ratio of rural to urban consumption dropped from 61 per cent in 1993 to 52 per cent in 2004-5. As a result, while poverty declined, the elasticity of poverty reduction with respect to growth9 also declined, at least up to 2004-05. However, the most recent data suggest that inequality has ceased to rise, or is only rising slowly, and there has been an acceleration in the decline in poverty, which reached more than two percentage points per year between 2004-05 and 2011-12 (table 4.5; Planning Commission, 2013). This may reflect the impact of redistributive programmes brought in since 2004, which we discuss in section 6.
9 i.e. the proportional change in the numbers below the poverty line in relation to the proportional change in output.
34

Graph 4.5: Trend in wages compared with GDP per capita (Index, 1983=100)
60
70
80
90
100
110
1983 1993-94 1999-2000 2004-05 2009-10 2011-12
Inde
x (1
983=
100)
Regular UrbanCasual RuralCasual Urban
Source: NSS, unit level data; National Accounts The official figures for the decline in poverty (table 4.5) are based on a poverty line that is increasingly regarded as unacceptably low, as real incomes rise rapidly for some sections of the community. These are absolute poverty lines, intended to reflect the income needed to achieve a basic subsistence level, and they are not adjusted for rising expectations and needs. When the 2011-12 figures were published, they were met with a great deal of scepticism, precisely because they fail to take into account the changing nature of the society within which these poverty lines are drawn (and a new committee has since suggested an alternative calculation method). So the absolute declines need to be considered critically. Still the trend does suggest that some of the gains from growth are reaching lower income groups. Table 4.5: Per cent of households below the poverty line (Tendulkar method)
Rural Urban Total A B A B A B 1973-74 56.4 49.0 54.9 1983-84 45.7 40.8 44.5 1993-94 37.3 50.1 32.3 31.8 36.0 45.3 2004-05 28.3 41.8 25.7 25.7 27.5 37.2 2011-12 25.7 13.7 21.9 Decline 04-05/93-94* 0.75 0.55 0.74 Decline 11-12/04-05* 2.32 1.69 2.18 Source: Government of India, Planning Commission (2013), and earlier Planning Commission documents. A: Lakdawala Committee method B: Tendulkar Committee method * Percentage points per annum
4.3 Growth regime and social policy The state-business alliance which underpinned this period of growth survived two changes of government, from Congress to BJP and back again, and has probably survived a third change in 2014. At the same time, it can be argued that the voting out, first of the Congress in 1996,
35
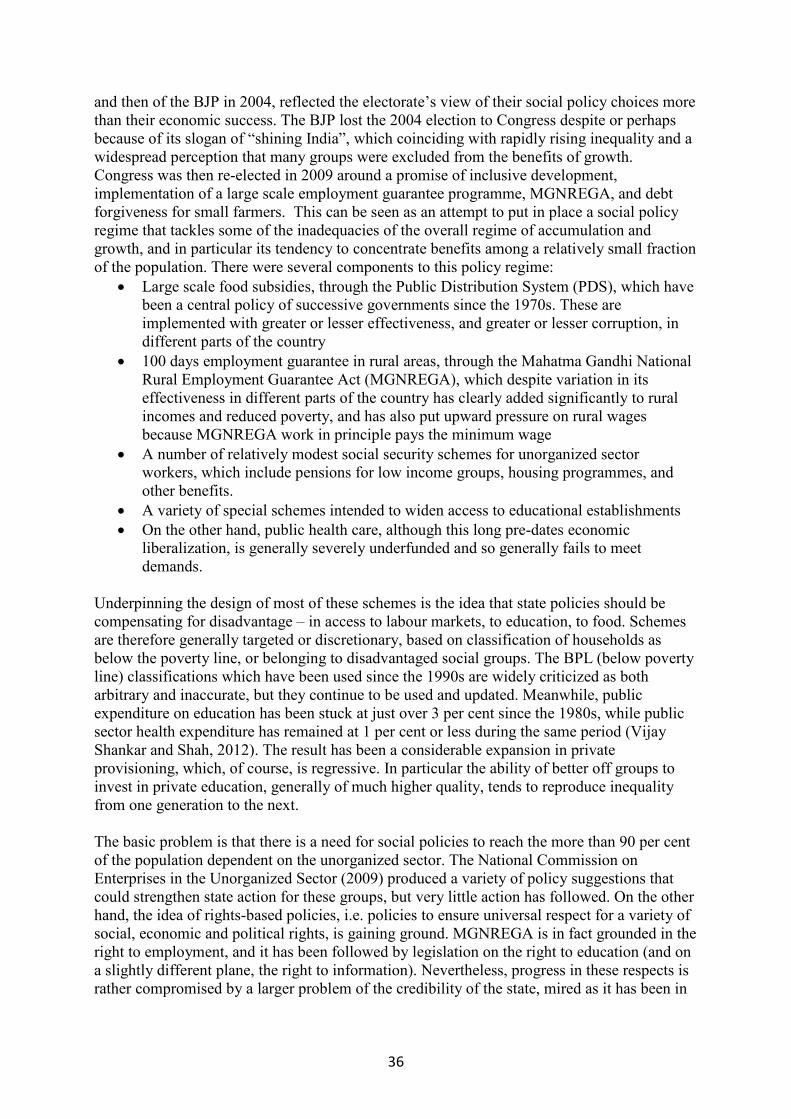
and then of the BJP in 2004, reflected the electorate’s view of their social policy choices more than their economic success. The BJP lost the 2004 election to Congress despite or perhaps because of its slogan of “shining India”, which coinciding with rapidly rising inequality and a widespread perception that many groups were excluded from the benefits of growth. Congress was then re-elected in 2009 around a promise of inclusive development, implementation of a large scale employment guarantee programme, MGNREGA, and debt forgiveness for small farmers. This can be seen as an attempt to put in place a social policy regime that tackles some of the inadequacies of the overall regime of accumulation and growth, and in particular its tendency to concentrate benefits among a relatively small fraction of the population. There were several components to this policy regime:
• Large scale food subsidies, through the Public Distribution System (PDS), which have been a central policy of successive governments since the 1970s. These are implemented with greater or lesser effectiveness, and greater or lesser corruption, in different parts of the country
• 100 days employment guarantee in rural areas, through the Mahatma Gandhi National Rural Employment Guarantee Act (MGNREGA), which despite variation in its effectiveness in different parts of the country has clearly added significantly to rural incomes and reduced poverty, and has also put upward pressure on rural wages because MGNREGA work in principle pays the minimum wage
• A number of relatively modest social security schemes for unorganized sector workers, which include pensions for low income groups, housing programmes, and other benefits.
• A variety of special schemes intended to widen access to educational establishments • On the other hand, public health care, although this long pre-dates economic
liberalization, is generally severely underfunded and so generally fails to meet demands.
Underpinning the design of most of these schemes is the idea that state policies should be compensating for disadvantage – in access to labour markets, to education, to food. Schemes are therefore generally targeted or discretionary, based on classification of households as below the poverty line, or belonging to disadvantaged social groups. The BPL (below poverty line) classifications which have been used since the 1990s are widely criticized as both arbitrary and inaccurate, but they continue to be used and updated. Meanwhile, public expenditure on education has been stuck at just over 3 per cent since the 1980s, while public sector health expenditure has remained at 1 per cent or less during the same period (Vijay Shankar and Shah, 2012). The result has been a considerable expansion in private provisioning, which, of course, is regressive. In particular the ability of better off groups to invest in private education, generally of much higher quality, tends to reproduce inequality from one generation to the next. The basic problem is that there is a need for social policies to reach the more than 90 per cent of the population dependent on the unorganized sector. The National Commission on Enterprises in the Unorganized Sector (2009) produced a variety of policy suggestions that could strengthen state action for these groups, but very little action has followed. On the other hand, the idea of rights-based policies, i.e. policies to ensure universal respect for a variety of social, economic and political rights, is gaining ground. MGNREGA is in fact grounded in the right to employment, and it has been followed by legislation on the right to education (and on a slightly different plane, the right to information). Nevertheless, progress in these respects is rather compromised by a larger problem of the credibility of the state, mired as it has been in
36
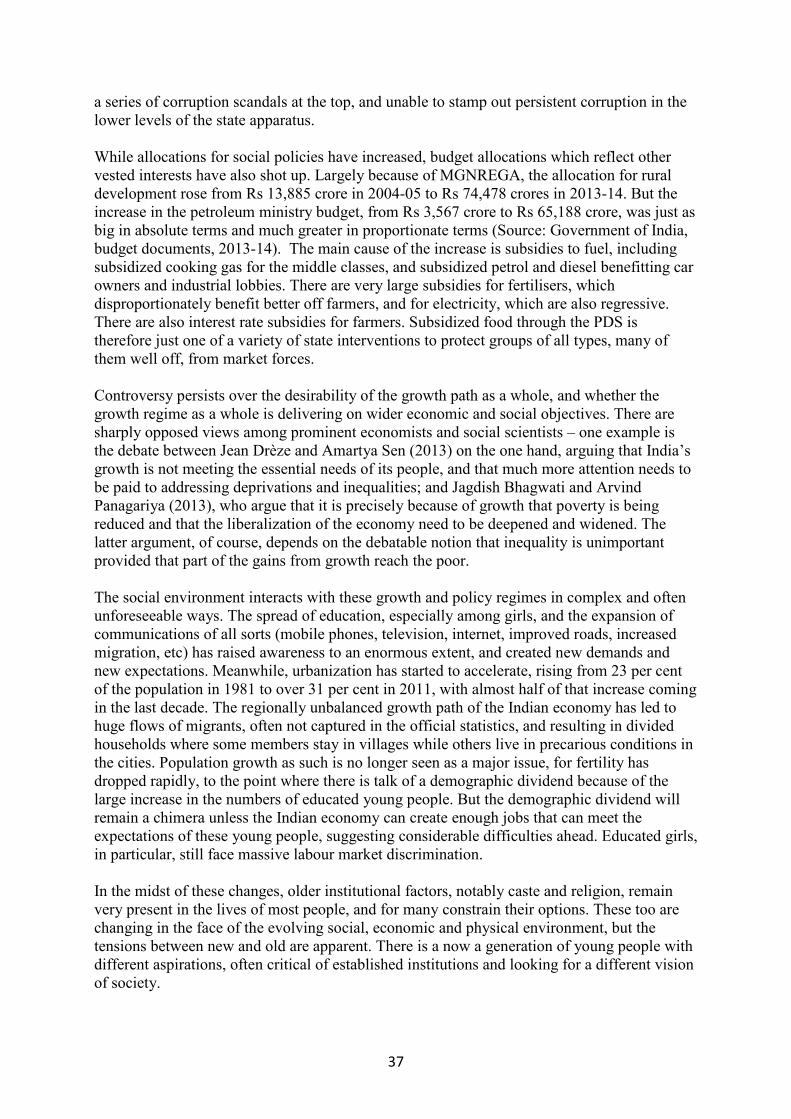
a series of corruption scandals at the top, and unable to stamp out persistent corruption in the lower levels of the state apparatus. While allocations for social policies have increased, budget allocations which reflect other vested interests have also shot up. Largely because of MGNREGA, the allocation for rural development rose from Rs 13,885 crore in 2004-05 to Rs 74,478 crores in 2013-14. But the increase in the petroleum ministry budget, from Rs 3,567 crore to Rs 65,188 crore, was just as big in absolute terms and much greater in proportionate terms (Source: Government of India, budget documents, 2013-14). The main cause of the increase is subsidies to fuel, including subsidized cooking gas for the middle classes, and subsidized petrol and diesel benefitting car owners and industrial lobbies. There are very large subsidies for fertilisers, which disproportionately benefit better off farmers, and for electricity, which are also regressive. There are also interest rate subsidies for farmers. Subsidized food through the PDS is therefore just one of a variety of state interventions to protect groups of all types, many of them well off, from market forces. Controversy persists over the desirability of the growth path as a whole, and whether the growth regime as a whole is delivering on wider economic and social objectives. There are sharply opposed views among prominent economists and social scientists – one example is the debate between Jean Drèze and Amartya Sen (2013) on the one hand, arguing that India’s growth is not meeting the essential needs of its people, and that much more attention needs to be paid to addressing deprivations and inequalities; and Jagdish Bhagwati and Arvind Panagariya (2013), who argue that it is precisely because of growth that poverty is being reduced and that the liberalization of the economy need to be deepened and widened. The latter argument, of course, depends on the debatable notion that inequality is unimportant provided that part of the gains from growth reach the poor. The social environment interacts with these growth and policy regimes in complex and often unforeseeable ways. The spread of education, especially among girls, and the expansion of communications of all sorts (mobile phones, television, internet, improved roads, increased migration, etc) has raised awareness to an enormous extent, and created new demands and new expectations. Meanwhile, urbanization has started to accelerate, rising from 23 per cent of the population in 1981 to over 31 per cent in 2011, with almost half of that increase coming in the last decade. The regionally unbalanced growth path of the Indian economy has led to huge flows of migrants, often not captured in the official statistics, and resulting in divided households where some members stay in villages while others live in precarious conditions in the cities. Population growth as such is no longer seen as a major issue, for fertility has dropped rapidly, to the point where there is talk of a demographic dividend because of the large increase in the numbers of educated young people. But the demographic dividend will remain a chimera unless the Indian economy can create enough jobs that can meet the expectations of these young people, suggesting considerable difficulties ahead. Educated girls, in particular, still face massive labour market discrimination. In the midst of these changes, older institutional factors, notably caste and religion, remain very present in the lives of most people, and for many constrain their options. These too are changing in the face of the evolving social, economic and physical environment, but the tensions between new and old are apparent. There is a now a generation of young people with different aspirations, often critical of established institutions and looking for a different vision of society.
37
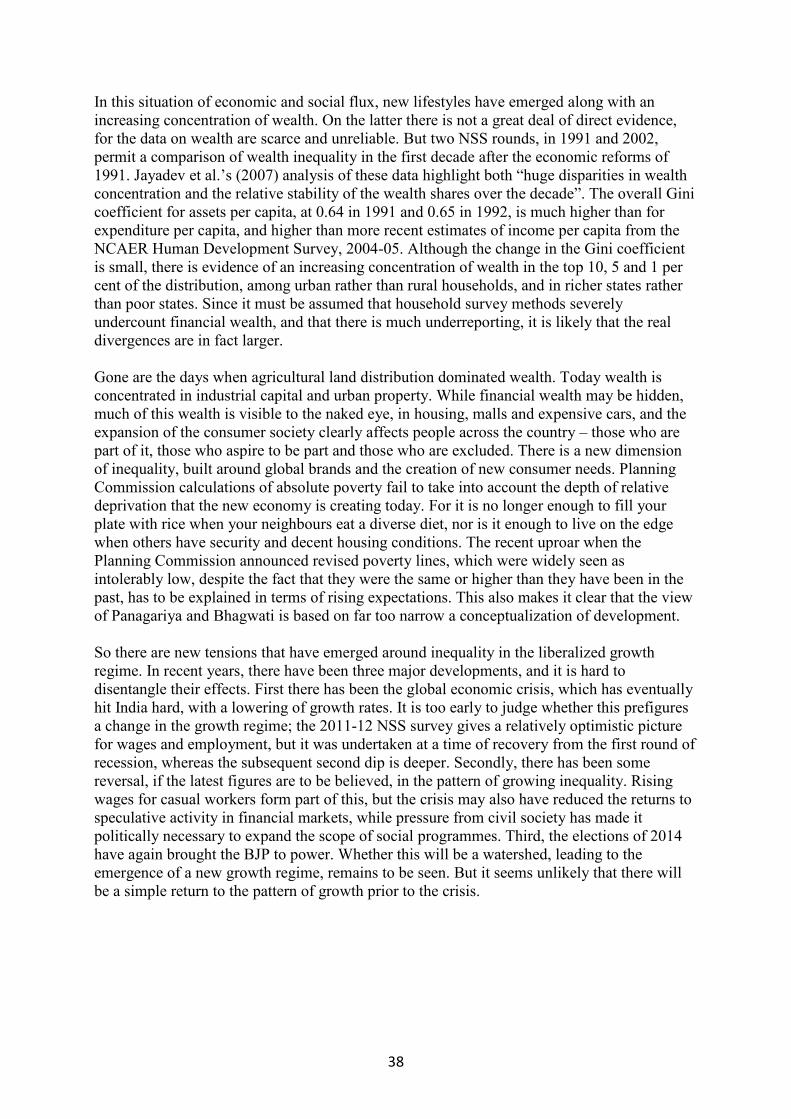
In this situation of economic and social flux, new lifestyles have emerged along with an increasing concentration of wealth. On the latter there is not a great deal of direct evidence, for the data on wealth are scarce and unreliable. But two NSS rounds, in 1991 and 2002, permit a comparison of wealth inequality in the first decade after the economic reforms of 1991. Jayadev et al.’s (2007) analysis of these data highlight both “huge disparities in wealth concentration and the relative stability of the wealth shares over the decade”. The overall Gini coefficient for assets per capita, at 0.64 in 1991 and 0.65 in 1992, is much higher than for expenditure per capita, and higher than more recent estimates of income per capita from the NCAER Human Development Survey, 2004-05. Although the change in the Gini coefficient is small, there is evidence of an increasing concentration of wealth in the top 10, 5 and 1 per cent of the distribution, among urban rather than rural households, and in richer states rather than poor states. Since it must be assumed that household survey methods severely undercount financial wealth, and that there is much underreporting, it is likely that the real divergences are in fact larger. Gone are the days when agricultural land distribution dominated wealth. Today wealth is concentrated in industrial capital and urban property. While financial wealth may be hidden, much of this wealth is visible to the naked eye, in housing, malls and expensive cars, and the expansion of the consumer society clearly affects people across the country – those who are part of it, those who aspire to be part and those who are excluded. There is a new dimension of inequality, built around global brands and the creation of new consumer needs. Planning Commission calculations of absolute poverty fail to take into account the depth of relative deprivation that the new economy is creating today. For it is no longer enough to fill your plate with rice when your neighbours eat a diverse diet, nor is it enough to live on the edge when others have security and decent housing conditions. The recent uproar when the Planning Commission announced revised poverty lines, which were widely seen as intolerably low, despite the fact that they were the same or higher than they have been in the past, has to be explained in terms of rising expectations. This also makes it clear that the view of Panagariya and Bhagwati is based on far too narrow a conceptualization of development. So there are new tensions that have emerged around inequality in the liberalized growth regime. In recent years, there have been three major developments, and it is hard to disentangle their effects. First there has been the global economic crisis, which has eventually hit India hard, with a lowering of growth rates. It is too early to judge whether this prefigures a change in the growth regime; the 2011-12 NSS survey gives a relatively optimistic picture for wages and employment, but it was undertaken at a time of recovery from the first round of recession, whereas the subsequent second dip is deeper. Secondly, there has been some reversal, if the latest figures are to be believed, in the pattern of growing inequality. Rising wages for casual workers form part of this, but the crisis may also have reduced the returns to speculative activity in financial markets, while pressure from civil society has made it politically necessary to expand the scope of social programmes. Third, the elections of 2014 have again brought the BJP to power. Whether this will be a watershed, leading to the emergence of a new growth regime, remains to be seen. But it seems unlikely that there will be a simple return to the pattern of growth prior to the crisis.
38
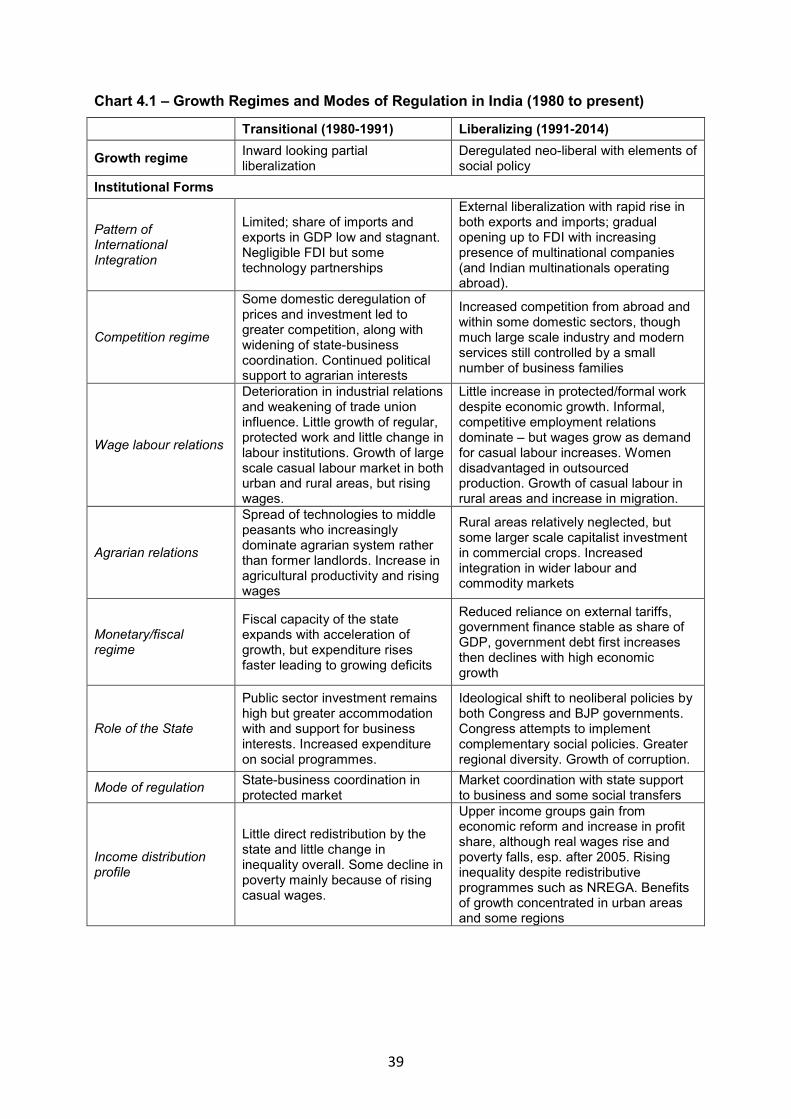
Chart 4.1 – Growth Regimes and Modes of Regulation in India (1980 to present) Transitional (1980-1991) Liberalizing (1991-2014)
Growth regime Inward looking partial liberalization
Deregulated neo-liberal with elements of social policy
Institutional Forms
Pattern of International Integration
Limited; share of imports and exports in GDP low and stagnant. Negligible FDI but some technology partnerships
External liberalization with rapid rise in both exports and imports; gradual opening up to FDI with increasing presence of multinational companies (and Indian multinationals operating abroad).
Competition regime
Some domestic deregulation of prices and investment led to greater competition, along with widening of state-business coordination. Continued political support to agrarian interests
Increased competition from abroad and within some domestic sectors, though much large scale industry and modern services still controlled by a small number of business families
Wage labour relations
Deterioration in industrial relations and weakening of trade union influence. Little growth of regular, protected work and little change in labour institutions. Growth of large scale casual labour market in both urban and rural areas, but rising wages.
Little increase in protected/formal work despite economic growth. Informal, competitive employment relations dominate – but wages grow as demand for casual labour increases. Women disadvantaged in outsourced production. Growth of casual labour in rural areas and increase in migration.
Agrarian relations
Spread of technologies to middle peasants who increasingly dominate agrarian system rather than former landlords. Increase in agricultural productivity and rising wages
Rural areas relatively neglected, but some larger scale capitalist investment in commercial crops. Increased integration in wider labour and commodity markets
Monetary/fiscal regime
Fiscal capacity of the state expands with acceleration of growth, but expenditure rises faster leading to growing deficits
Reduced reliance on external tariffs, government finance stable as share of GDP, government debt first increases then declines with high economic growth
Role of the State
Public sector investment remains high but greater accommodation with and support for business interests. Increased expenditure on social programmes.
Ideological shift to neoliberal policies by both Congress and BJP governments. Congress attempts to implement complementary social policies. Greater regional diversity. Growth of corruption.
Mode of regulation State-business coordination in protected market
Market coordination with state support to business and some social transfers
Income distribution profile
Little direct redistribution by the state and little change in inequality overall. Some decline in poverty mainly because of rising casual wages.
Upper income groups gain from economic reform and increase in profit share, although real wages rise and poverty falls, esp. after 2005. Rising inequality despite redistributive programmes such as NREGA. Benefits of growth concentrated in urban areas and some regions
39
5. Key labour institutions and their implications for inequality
5.1. Trade unions
Trade unions in India have been characterized by strong political connections from the very beginning. Political parties have created, and continue to create their own trade unions with political affiliations and overlapping membership. As a result, these unions have had strong political motivations behind their policies and actions. Of course, the basic function of a trade union is to protect and improve pay and conditions of employment and to campaign for laws and policies affecting the worker. Trade unions provide collective strength to the demands of the workers which enables them to have a greater bargaining potential. But at the same time, by virtues of their representativeness, trade unions play a wider social and economic role and can represent a political force in their own right. The combined membership of trade unions was last estimated to be 24.88 million in 2002 (IHD, 2014), but this is a fraction of the total work force. In fact, trade unions are concentrated in particular segments of the labour market. Labour market segmentation has taken various forms in India: between rural and urban areas, public and private sector, male and female workers, but the most visible form is that between the organized and the unorganized sector10. In the analysis of the Indian labour market, the division is usually based on the size of establishment. That could be considered arbitrary, except that the dividing line generally coincides with the threshold for the application of regulatory provisions (Papola, 2012). Hence the state has played an important role in facilitating the segmentation of the labour market. Trade unions, as a key labour market institution, have also been a very prominent influence in perpetuating these segmentations, which has given rise to various forms of inequalities in the labour market. A more detailed account of the labour market segmentations can be found in Section 5.5.
5.1.1. The evolution of the trade union movement The textile industry was the earliest industry to be established in India and since it employed a large number of workers, the earliest unions were formed in this sector. In 1918, the Madras Labour Union came into existence with mill workers as its members. The first organized trade union federation was the All India Trade Union Congress (AITUC), in 1920, which acted as an umbrella organization for workers across industries. Although created by the Communist Party of India, AITUC served as the principal platform for workers during the independence movement, members from different parties came together to fight on labour issues. The independence movement gave rise to divergent political opinions among nationalist leaders, many of whom were active participants of the labour movement in colonial India. This resulted in a split within AITUC which gave rise to the Indian National Trade Union Congress (INTUC) in 1947 followed by the formation of the Hind Mazdoor Sabha (HMS) in 1948, as alternative trade union federations with different political affiliations. Political events like the split in the Indian National Congress and the Communist Party also resulted in corresponding splits among trade unions and the creation of new federations with strong political affiliations like the Indian National Trade Union Congress (INTUC), affiliated to the Congress party;
10 See definition in the previous section.
40
Centre of Indian Trade Unions (CITU), affiliated to the Communist Party of India (Marxist), among others. In the initial years after Independence, the unions followed a centralized bargaining structure where a single union represented the entire industry; there was a paradigmatic shift in industrial relations in the 1970s and 1980s, as unions began to follow a decentralized bargaining structure and enterprise-level unions emerged which bargained in behalf of workers in a particular enterprise. This resulted in discrepancies and inequalities within an industry in terms of collective negotiations on issues of wages, working hours, conditions of work, social security benefits and recognition. The evolution of trade unions and the changes in their roles suggest that there has been a shift in approach from rights based bargaining to narrower interest based bargaining. This distinction is evident in terms of the value and importance placed on centralized bargaining vis-à-vis decentralized bargaining; while in the former unions were defending workers’ basic rights which included equal pay, better working and living conditions and the right to form associations for all workers, in the latter the motives behind bargaining were guided by the immediate interests of the workers who wished to take advantage of the uneven development between firms, productivity gains or the employer’s capacity to pay, which in turn gave rise to differences between workers in profit-making and non-profit making plants. The pattern of growth of the trade union movement in India can be connected to the implementation of the various Five-Year Plans in the economy (Bhattacharjee, 1999). There have been several time-frames provided in the literature with regard to the evolution of the labour movement in India; the categorization offered by Debashish Bhattacharjee (1999) has been used in this paper for purpose of consistency with the broad time framework adopted in this paper. The first phase of the trade union movement starts before independence and continues to the mid 1960s, which corresponds to the first three Five-Year Plans. This phase was characterized by a strong state-sponsored trade union movement, and the public sector provided the scope for large-scale unionization. Industrial relations in this phase were strongly tripartite in character as the state intervened to determine the level of wages and working conditions in industries. Dr. B.R. Ambedkar, as member in charge of labour of the Viceroy's Executive Council, liked the ILO model of operations and tried to recreate a similar structure for India in the form of the Indian Labour Conference; it helped to reinforce the tripartite model as it was considered that it was imperative to include the unions into any dialogue in order to maintain industrial peace. The structure of collective bargaining was extremely centralized, usually at the national level and in some cases in the industry level (like in the textile mills of Mumbai). During this phase, the unions and employers were left with very few strategic choices as the outcomes of labour relations were over-determined by the state (Venkataratnam, 1996). Hence, there was a tendency to parity in wages and other benefits across industries. The second phase of the union movement, from mid-1960s to 1979, corresponds to the fourth and fifth Five-Year Plans. This period witnessed high rates of inflation; structural changes in the economy had an effect on union activities, collective bargaining practices and on labour relations in general. In this period, it was the INTUC which primarily dominated the trade union movement due to its political connection with the existing government; however, disillusionment with INTUC’s internal practice and its ineffectiveness at enterprise level led to a proliferation of unions affiliated to other organizations. With support from political parties and elected governments, the public sector companies and many private sector
41
companies became heavily unionized. The decade of the 1960s and the 1970s witnessed a rise in trade union activities leading to strikes and lockouts It is during this phase that the union movement went through a shift in their goals from centralized lobbying to decentralized collective bargaining. Uneven development of firms within an industry, as witnessed during this phase, meant that some employers had greater ‘capacity to pay’ than the others; unions increasingly started to use this increased capacity during collective bargaining, while unions in the declining sectors had no such opportunity. This essentially gave rise to differences in wages within an industry; but this was also dependent on the strength of a union, a union with greater strength of collective bargaining would be more successful in negotiating a higher wage than other unions. Hence, inter-industry wage differences emerged or increased with the rise of enterprise-level unions. In the following years, decentralized bargaining became a very popular trend as more and more enterprise unions emerged without affiliation to central trade unions because they felt that centralized bargaining was not sufficient for realizing the potential for wage rises in the more profitable firms. This was also supported by the employers who preferred decentralized bargaining because it gave them an opportunity to give different wages across the different plants depending on the strength of the union and productivity of the plant. As a reason, it became increasingly difficult for the trade union movement to assume an inclusive character and this in turn gave rise to greater inequalities. However, the gains of collective bargaining also varied across public and private sectors. While public sector and government employees received considerable fringe benefits, unions in the private sector had to bargain a lot more for such gains in the competitive environment (Bhattacharjee, 1999). The imposition of the Emergency in 1975 by the Indira Gandhi (Congress) government led to the suspension of trade union rights and a sudden fall in trade union activities. Many prominent opposition trade union leaders like George Fernandez, among others, were jailed during this period. However, trade unions were successful in pressurising the government to amend the Industrial Disputes Act, in 1976, making it mandatory for firms employing more than 300 workers to take prior government permission before retrenchment. It can be argued however, that such amendments were brought about only to gather support for the unpopular Indira Gandhi government. This clause is today at the centre of all debates regarding labour flexibility and labour reforms as employers have time and again opposed this clause because it made the process of closures a lot more complicated and difficult; while earlier the employers could close down plants easily in case of periodic losses, this clause made it imperative to take prior government consent which is usually a time-consuming process. The third phase of the union movement, from 1980 to 1991, corresponded to the sixth and seventh Five-Year Plans. Much like in the earlier phase, decentralized bargaining arrangements were negotiated by workers in two of the biggest strikes, in Bangalore during 1980/81 and in Mumbai during 1982. A striking feature of the 1980s was the Bombay Textile strike (1981) which was led by an independent trade union leader Datta Samant; this strike was a watershed incident in the Indian labour movement and made the growth of non-political independent unions a reality and also laid the foundations for militant unionism in India. The purpose of this strike was to obtain bonus and wage increases. Nearly 225,000 workers and 57 mills went on strike in Bombay on a call made by Datta Samant, an independent union leader chosen by a group of workers, despite the existence of the INTUC affiliated Rashtriya Mazdoor Sangh which was the recognized trade union which had represented the workers for
42
decades. This strike also witnessed strong union rivalry between the Socialist controlled Mill Mazdoor Sabha and the INTUC-affiliated RMS. The strike soon assumed the form of a general struggle of the entire organized sector working class, which brought the city to a halt. There was widespread discontent among the workers due to payment of low wages despite enormous profits made by the mills during the war period. The Mazdoor Sangh did very little to oppose this and was instead willing to compromise with the government, this further agitated the workers. The strong association of unions with political parties proved to be a crippling factor for the labour movement because abiding to party dictates often forced unions to go against the interests of workers; added to this was the problem of rivalry between unions which further crippled the movement. These problems are prevalent even today and are the main factors responsible for the weak labour movement in India (Bhattacharjee, 1989). Datta Samant had a strong influence on the labour movement as a whole, as it was for the first time that one witnessed the rise of an individual who came from the outside and represented the workers and started one of India’s longest labour strikes. He was one of the most prominent INTUC leaders and followed a militant approach in his political convictions and activism. He repeatedly ignored the company's offers and consistently refused to settle on compromise concessions; his influence over workers made him a political threat. Despite the fact that he was a member of the same party, the government took a firm stance of rejecting his demands, and refusing to budge despite the severe economic losses suffered by the city and the industry. Samant's militancy in the face of government obstinacy led to the failure of any attempts at negotiation and resolution, which led to the closure of textile mills across the city and resulted in thousands of mill workers losing their jobs. Although Samant remained popular with a large block of union activists, his clout and control over Mumbai trade unions soon faded out. But it laid down the foundations of a militant brand of unionism which would involve threatening companies with strikes and agitation that often resulted in violent clashes, winning the loyalty of workers with hefty wage increases, and contesting older, established labour leaders. Such brand of unionism continues to exist even today, a recent example being the strike in the Manesar unit of Maruti Company which broke through the regular patterns of industrial relations and resulted in violent clashes between the workers and the unions. The proliferation of ‘independent’ unions operating in industrial centres competed with the traditional party-based unions and delivered higher wages and other benefits as compared to the affiliated unions (Bhattacharjee, 1987). This period, as a result, witnessed increasing inter-regional, inter-state and inter-city variations in the nature of labour management. Private sector unions became increasingly open to productivity linked agreements that were later accepted by the public sector unions as well. Banking sector trade unions like the All Indian Bank Employees Association (AIBEA) allowed the introduction of computers in a limited scale for which they negotiated extra payment. During this phase, some Indian manufacturing firms outsourced and subcontracted their production to the unorganized sector (Ramaswamy, 1999). This gave rise to a situation where enterprise level unions reaped the benefits of high-paying sectors but workers in the low paying sectors or in subcontracted enterprises became more vulnerable to competitive forces and could no longer depend on the traditional unions to provide them with any protection. Thus it became clear that they were two types of union characteristics in the movement, at this stage; while the traditional party-based unions chose to focus on matters of employment during wage negotiations, the independent enterprise unions, on the other hand, focused on matters of wages during negotiations. This is because while the former believed that increase in membership is the key determinant for bargaining strength, the latter believed that given a
43
trade-off, an increase in wages would be more favourable for those already in the enterprise. This change in focus is a crucial factor behind the existing inequalities in the labour market. The present phase of the movement starting from 1992 onwards (to the present) coincided with accelerated economic reform, decline in public sector employment and a continued decline in the power of centralized unions. Privatization of state owned enterprises and the closing down of “sick units” were part of this reform package. Voluntary retirement scheme (VRS) was adopted which became a convenient option for firms to remove aging and less technology-capable employees by mutual agreement; this enabled firms to retrench workers without violating the amendment to the Industrial Disputes Act. The National Renewal Fund (NRF) was established to help firms in adjusting to the new economic realities. Many of the jobs lost have ‘reappeared’ in the unorganized sector with increasing subcontracting of production in services like transport, security, cleaning and provision of food at the workplace. The continuation of economic liberalization has led to employment flexibility and strengthened the trend towards decentralized bargaining structures. The government has facilitated this by linking unit-level wage increases to productivity and by continuously refusing to provide budgetary support to the increase in wages in the public sector (Bhattacharjee, 1999). The emerging IT/ITES Sector has firms with minimal or complete absence of trade unions. Employees in this sector have often shown antipathy towards unions and their activities as unions are increasingly being projected as barriers to economic growth. Employers have openly discouraged and disallowed union activities in this sector. Additionally, one finds that most of the firms in manufacturing and service sector like private banks etc are completely devoid of trade union activity, although these sectors were traditionally part of union membership. The demarcation of certain industries as Public Utility Services and the creation of Special Economic Zones have further impacted union activity as strikes and protests are banned in the former while trade union activity as a whole is banned in the latter. The unions have in this phase been receding from the service sector and have been unsuccessful in representing the myriad interests of the different categories of workers and large sections of the workforce engaged in casual and temporary work have remained outside the membership of trade unions. So while a small category of workers benefitted from the strength of collective bargaining, large sections have been left unprotected and insecure with no collective strength and hence nominal bargaining potential. In India it is difficult to arrive at exact figures of union membership because the only source of information is from the returns submitted by registered trade unions and for the same reason, the possibility of an over- or under-estimation cannot be ruled out. Inaccuracy in union membership figures can be due to poor administration in registration and regulation of unions and non-submission of regular annual returns by unions. The verified membership of Central Trade Union Organisations (CTUOs) has increased from 12.27 million to 24.88 million between 1989 and 2002 (MoLE, 2005). This was mainly because of an increase in membership of unorganized sector workers who constitute 39.4% of the total membership of CTUOs (Datt, 2008). This is fairly large when set against the 33 million formal workers in the organized sector reported in 2004-05; but it should also be compared with the 457 million workers in the Indian economy as a whole. An overall estimate of trade union density by sector, based on NSS data, is given in Figure 5.1.1 (taken from the India Labour and Employment Report, 2014). This suggests a higher
44
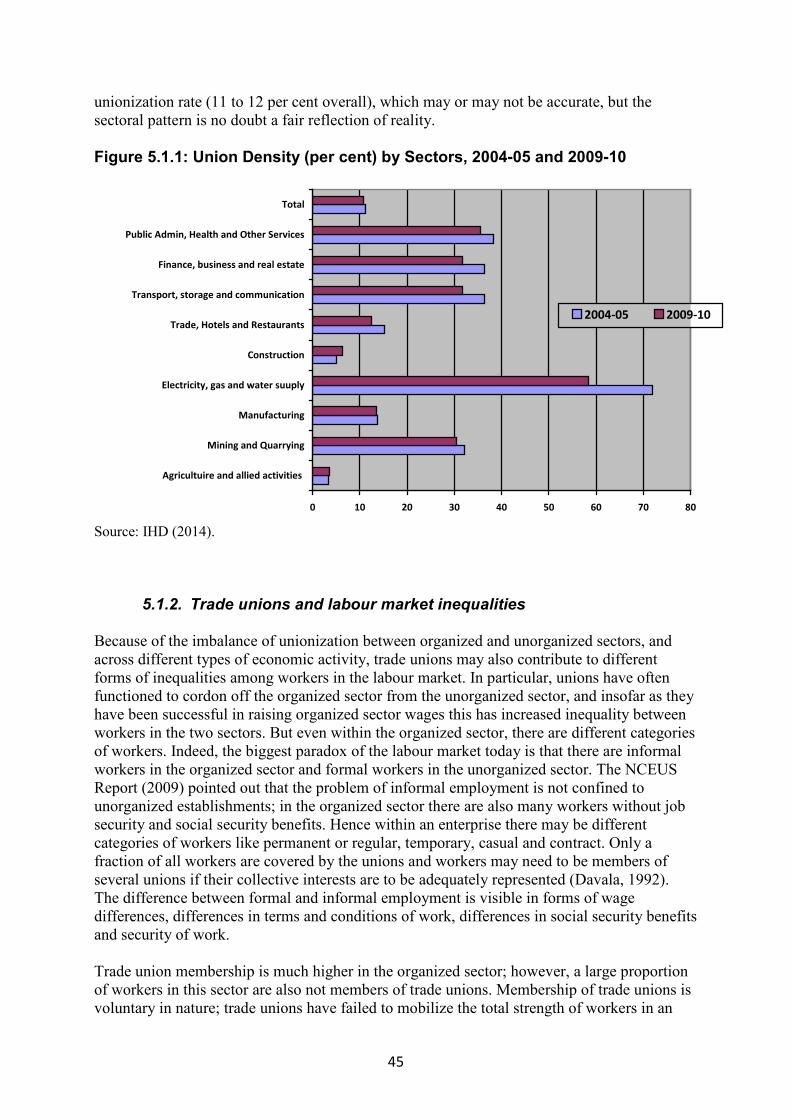
unionization rate (11 to 12 per cent overall), which may or may not be accurate, but the sectoral pattern is no doubt a fair reflection of reality. Figure 5.1.1: Union Density (per cent) by Sectors, 2004-05 and 2009-10
0 10 20 30 40 50 60 70 80
Agricultuire and allied activities
Mining and Quarrying
Manufacturing
Electricity, gas and water suuply
Construction
Trade, Hotels and Restaurants
Transport, storage and communication
Finance, business and real estate
Public Admin, Health and Other Services
Total
2004-05 2009-10
Source: IHD (2014).
5.1.2. Trade unions and labour market inequalities Because of the imbalance of unionization between organized and unorganized sectors, and across different types of economic activity, trade unions may also contribute to different forms of inequalities among workers in the labour market. In particular, unions have often functioned to cordon off the organized sector from the unorganized sector, and insofar as they have been successful in raising organized sector wages this has increased inequality between workers in the two sectors. But even within the organized sector, there are different categories of workers. Indeed, the biggest paradox of the labour market today is that there are informal workers in the organized sector and formal workers in the unorganized sector. The NCEUS Report (2009) pointed out that the problem of informal employment is not confined to unorganized establishments; in the organized sector there are also many workers without job security and social security benefits. Hence within an enterprise there may be different categories of workers like permanent or regular, temporary, casual and contract. Only a fraction of all workers are covered by the unions and workers may need to be members of several unions if their collective interests are to be adequately represented (Davala, 1992). The difference between formal and informal employment is visible in forms of wage differences, differences in terms and conditions of work, differences in social security benefits and security of work. Trade union membership is much higher in the organized sector; however, a large proportion of workers in this sector are also not members of trade unions. Membership of trade unions is voluntary in nature; trade unions have failed to mobilize the total strength of workers in an
45
enterprise or industry, as a result, the actual membership is often very limited even within the organized sector. However, it is quite evident that while trade unions have been successful in unionising large proportions of the formal workers in the organized sector, most informal workers in the organized sector remains outside the trade unions and thus do not enjoy the benefits of collective bargaining like the other workers in the sector. Most of the informal workers working in organized sector enterprises have to individually negotiate their wage and social security benefits with the employer; their only source of protection is the Minimum Wages Act, 1948, which lays down the minimum level of wages for a worker in an industry given his or her skill endowments, and even this is not well applied. This acts as an important source of inequality. In the private sector, the strength of trade unions in wage bargaining is largely dependent on productivity levels; as a result, the majority of contracts are negotiated at the enterprise or plant level. There is very little parity among the wages and other related benefits among the different plants of a single firm or among the industry as a whole. This also creates a division between a central union and plant level unions. An example can be found in the Bata India Company Limited which recognizes enterprise unions in various plants across the country but does not recognize the All India Bata Employees Federation in order to avoid centralized bargaining; employers also prefer decentralized bargaining which enables them to maintain their profit margins in plants having weaker unions. Hence, decentralized bargaining plays a role in creating wage discrepancies within the private sector. Economic liberalization has been manifested through measures like downsizing, outsourcing, privatization of public services, increases in “precarious” employment, new production systems (e.g., lean manufacturing), new occupations (e.g., call centre work) and the reappearance of sweatshops. Meanwhile, the unorganized sector continues to account for the bulk of all workers. Trade unions, until recently, had largely ignored the unorganized sector workers; it is only after the NCEUS Report that one finds a shift in focus within the trade union movement towards the unorganized sector. According to a trade unionist11* (interviewed for this project), the Bharatiya Mazdoor Sangh (BMS), affiliated to the Bharatiya Janata Party, was the first amongst the central trade unions to report membership from the unorganized sector in its annual returns submitted to the Labour Ministry; following this report, other unions woke up to the fact that this sector should be unionized as it would also help in increasing the membership strength of unions. Nevertheless, Casual, temporary and contract workers across industries have largely remained outside union membership. Further, outsourced workers have been altogether excluded from the trade union movement (Srivastava, 2001). There have been some successful unions in the unorganized sector like in the brick kilns, dockyards, for street vendors, etc, however, they have been few in number and have generally failed to reach all workers in a particular sector. Recently one finds that many of the new (independent) unions have been trying to organize among the construction workers, home-based workers, domestic workers, agricultural workers, scheme-based workers (Anganwadi and ASHA workers), and so on, but this is only a recent phenomena and is limited to only a small proportion of the total workers engaged in these sectors.
11 As part of this project, interviews were conducted among union representatives from Indian National Trade Union Congress (INTUC), Centre of Indian Trade Union (CITU), New Trade Union Initiative (NTUI), and National Association of Street Vendors in India (NASVI).
46
5.1.3. Women workers and trade unions Other than the formal – informal segmentation, the labour market is also segmented between male and female workers. There are vast differences between male and female workers in terms of access to employment, wages received, and quality of work, recognition of work, job securities, social security benefits and union membership. The majority of female workers (approximately 67%) work in agriculture, only a mere 11% of women work as regular employees while only 4% work in the organized sector (Labour Bureau, 2012). A large proportion of female workers are engaged in the unorganized sector in the form of street vendors, domestic workers, home-based workers, agricultural labour, etc and most of them remain outside the union membership, often in self-employment (Table 5.5.2). The problems of women workers are of various kinds; the principle of equal pay for equal work is widely violated as most women workers are paid wages less than their male counterparts involved in the same work. Often women workers are categorized as unskilled or semi-skilled workers and thus their opportunities for accessing the labour market are limited and they are paid lower wages. Also, in most cases they are denied social security benefits, often the most basic maternity benefits are also denied to them. Trade unions have for long neglected the possibilities of unionising women workers and this was partly due to the gendered notion of work. Many of these workers were not given the recognition of being a worker but were merely identified as ‘helpers’ to the male workers (as is still prevalent in construction industry). Also, it was generally believed that collective bargaining was a male-oriented activity and female workers, who also have the responsibility of managing their homes, would not have time for union activities. The exclusion of women from trade union activities took place in various ways. Demands of women workers would never be given any importance in the male-dominated unions, despite significant protests from female members; women were hardly given an opportunity to become trade union leaders; women workers are often displaced in the name of technological advancement; on many occasions, employers refused to employ women workers in order to avoid giving maternity benefits (as specified in the Maternity Benefits Act of 1961), and unions rarely protested against these initiatives. Hence, large sections of women workers remained outside the trade union activities (de Haan and Sen, 2005 and Fernandes, 1999). Recently, the Self-Employed Women’s Association (SEWA) has taken a lead in protecting the interests of certain categories of women workers. After being registered as a central trade union in 2007, with much opposition from other central trade unions, it is presently one of the largest unions and the only exclusive women’s union representing home-based workers, street vendors, garment workers, construction workers, head-load workers, factory workers, agricultural workers, domestic workers and rag pickers. But the need for such an organisation indicates the failure of existing unions in representing the women workers and addressing their concerns of wage inequality and job insecurity, among others.
47
5.1.4. Conclusion If one looks back at the evolution of the trade union movement and the patterns of demands raised by unions, it would be evident that the issue of contract, casual or temporary work was largely ignored in the years 1950-1980; it is only very recently with the publishing of several research studies and government-sponsored reports like the NCEUS Report on Conditions of Work and Promotion of Livelihoods in the Unorganised Sector (2007) that trade unions realized their deficit in mobilising the workforce. Until then, unions felt that the potential for mobilising workers was basically limited to the organized sector, as the casual or temporary workers had no bargaining potential and were dependent on the employers for most of their requirements. The unions never felt the need to collectively protest against this practice. Pro-industrial policies and rising economic growth has resulted in increasing replacement of permanent work with temporary and contract work and unions have been unsuccessful in curbing the rise in contractual employment. Presently the labour market is divided in two groups of workers – those who enjoy the benefits of collective bargaining and are thus able to collectively get a greater share of productivity gains in the form of rises in wages and social security benefits; and a second group which consists of those workers who are employed under insecure terms through periodic contracts and who work as temporary or casual workers and have no bargaining potential and are vulnerable to exploitation. The latter group of workers includes workers from both the organized and the unorganized sector, in both public and private sectors. Women are disproportionately represented in this group, and are largely outside the ambit of union membership. As a result, the female workforce is largely left unprotected and vulnerable to exploitation. In such ways, although it was never a part of their motive, trade unions have also contributed towards increasing inequalities in the labour market. Caste which acts as a principal form of discrimination and inequality in Indian society is also reflected in the inequalities persisting in the labour market (section 7.3 below). Caste plays a major role in matters of access to employment, wages, job securities and future prospects; trade unions have largely neglected this issue. Interviews conducted with representatives of several national trade union federations suggest that unions largely feel that caste does not have a significant role in the labour market; yet anecdotal and practical evidence suggests a strong influence of caste. Outsourcing of production activities started to grow in the 1970s when firms were looking for opportunities for increasing profits by reducing wage costs. Outsourcing often involves private firms or labour contractors who hire workers under nominal wages and precarious working conditions (Srivastava, 2001). Unions have been unable to develop an effective strategy to deal with this phenomenon. Although all unions were broadly against the use of contract labour, their demand was mainly to prevent the decline in membership which would impact their collective bargaining potential, and they devoted very little effort towards securing the working conditions and terms of work for those contract, temporary and casual workers who were hired in these outsourced firms. As one trade unionist12 (interviewed for the project) puts it, “the difference in approach of trade unions is visible in the nature of their demands for contract workers”. If they set out a separate demand for formal and informal
12 As part of this project, interviews were conducted among union representatives from Indian National Trade Union Congress (INTUC), Centre of Indian Trade Union (CITU), New Trade Union Initiative (NTUI), and National Association of Street Vendors in India (NASVI).
48
workers, as was the case till very recently, it clearly reflects the lesser importance given to latter. 2013 witnessed the formation of a national platform for all trade unions that came together for a two day strike in the national capital; their demands included a national floor-level minimum wage of Rs 10,000 and recognition for trade unions, among other things. However, this consolidated effort failed to attract the government’s interest, which probably reflects the decline in the effectiveness of unions as an institution in the labour market. Despite the fact that most of the central trade unions have strong political affiliations, they have not been able to use this linkage in the interests of the workers. The unionists interviewed for this project have unanimously said that the political linkage has only worked to pressurize the unions to follow official party positions; the parties and governments however, have not reciprocated by including and deliberating on the interests of the unions and its workers. The available data on unions reflect a growth of union membership over the years, but in effect, there has been a decline of union power in the post-reform years. In the pre-liberalisation period, government policies were aimed at protecting both industry and labour which helped the growth of union membership. The new economic policy has provided industry with ways and means to avoid labour protection in order to maximize reduce labour costs; this has resulted in exploitation of labour and unions have not been able to resist this. With decentralized bargaining, more and more issues are now decided at the firm level which has given rise to income inequality and variations in employment practices. Wages are now more closely linked to performance and skill that vary across individual workers and further aggravate inequalities. The result has been an increase in income inequalities, variations in wages, decentralisation of bargaining and growing variations in employment practices and in the end a declining influence of trade unions in the labour market.
5.2. Wage-setting institutions and policies 5.2.1 Introduction The Indian labour market is highly segmented by location, sector and size of enterprise and workers are differentiated on the basis of skill, gender and social groups; as a result, one finds wide variations in the structure of wages and earnings of workers. The rise in income and earnings inequality in the post-liberalization period has been a major concern. Over one-fifth of the working population still earns less than the modestly defined poverty line. Wages and earnings is arguably the most important subject in the whole field of labour management relations. Wages, more than any other single demand of workers, have been the source at all times for the greatest extent of industrial unrest. There are wide differences in the wage structure between different categories of workers – casual and regular, public and private sector, male and female, skilled and unskilled workers. There are large differences between rural and urban areas, between social groups and across regions. Over the years, one can observe a change in the wage differentials among different categories of workers; the wage difference between rural and urban areas has declined while that between regular and casual workers has increased within both rural and urban areas (IHD, 2014). The change has not just been in terms of money wages but also in terms of the methods of wage payment. Wages are paid either in cash or in kind (like food, clothing, etc) and are on the basis of payments made for per unit of time – paid per day, per week or per month. Wages
49

for regular workers are generally made in cash for a one-month period, while for the casual workers they may be in terms of cash or kind paid over various time-periods, but commonly daily. All systems of wage payment in the informal sector may be broadly divided into two types – time payment which is paid by the hour, day, week or month without any reference to actual volume of work done during this period (like for construction workers) and piece-rate payment which is paid at a specified rate per unit of output, in proportion to output (like for home-based workers). While analyzing wage differentials between regular and casual workers one must keep in mind the fact that while the former group of workers get paid wages for all days in a week whether they work or are on leave, the latter group of workers get wages only for the actual number of days worked, and so depend on the availability of work. Wage rates in part reflect market forces but they are strongly influenced by several state and social institutions. Wages for government and public sector workers are largely determined through Pay Commissions or through specific legislations, while wages for the private sector are mostly determined through collective bargaining activities; there is however a very strong influence of social institutions like caste and religion which influence the levels of wage payment in both the organized and unorganized sectors of employment. The use of collective bargaining in private sectors is dependent on the bargaining potential of trade unions, which in turn results in wage differences among various plants and industries and between regions. Intra-industry, inter-industry and inter-regional wage differentials have thus grown. Hence the policies and mechanisms for determining wages differ between the public and the private sectors. There is a wide range of institutions and policies which influence the mechanisms for fixing wages in India. These institutions have undergone considerable changes since independence. Wages in the public sector are generally determined through direct state interventions in the form of government appointed Public Sector Pay Commissions, Industrial Wage Boards and specific labour legislations like the Minimum Wages Act (1948) and the Equal Remunerations Act (1976), which lay down the basis for fixing wages for all categories of workers in the public sector; the private sector relies more on practices of collective bargaining and individual negotiations. Labour legislation like that cited above caters to the labour market as a whole and are applicable for all categories of workers. Hence, the private sector is legally required to set its wages keeping in the mind the minimum wage stipulations fixed by the respective state governments under the Minimum Wages Act.
5.2.2 Fixation of wages up to Independence Much like the other labour market institutions, wage fixing institutions also have their roots in colonial India. The colonial era was characterized by a laissez faire model which called for minimal state intervention in matters of industrial relations. Labour in the initial years was mostly migratory and unorganized and in the absence of any consolidated trade union organization, industrial disputes were mostly on the issue of wages. The textile industry was the earliest industry to be established in India; wage rates in this industry varied greatly with each mill setting its own wage rate with little regard for rates existing in other mills (Morris, 1955). Government’s intervention in the field of industrial relations started with the passage of the Indian Trade Disputes Act, 1929, which laid down the procedures for resolving industrial disputes. The Royal Commission on Labour in India, appointed in 1929, recommended a
50

minimum wage fixing machinery in India. A direct result of this recommendation was the passing of the Payment of Wages Act, 1936 (NCL, 1969). The Second World War gave rise to increase in prices which resulted in a fall in real wages, and prompted large scale industrial unrest. In response, the government introduced compulsory arbitration as a clause in the Defense of India Rules in 1942 but this was limited to individual establishments. Soon compulsory adjudication failed because of inordinate delays, unsatisfactory results, multiplicity of statutory authorities interfering with original decisions, etc. Consequently, trade unions were looking for a process which would include their demands and give labour an effective voice on the fixation of wages. In 1940, the (colonial) Government of India convened a tripartite conference, the Indian Labour Conference (ILC), consisting of representatives of employers, labourers and government officials. The ILC continues to exist even today and its members hold meetings every few years. After Independence the Industrial Policy Resolution (1948) was adopted which emphasized the need to fix minimum wages in sweated industries and sought to promote fair wage agreements in organized industries. To facilitate the former, the government enacted the Minimum Wage Act in 1948, and to ensure fair wages, the government appointed the Committee on Fair Wages to determine the principles on which fair wages should be based and the lines on which such principles are to be applied. The Committee on Fair Wages defined three distinct levels of wages – living wage, fair wage and minimum wage. ‘Living wage' represented a wage level which provided not merely for a bare physical subsistence but for maintenance of health, a measure of frugal comfort including education for the children, protection against ill-health, requirements of essential social needs and some insurance against the more important misfortunes. The 'minimum wage' was to ensure not merely the bare sustenance of life but the preservation of the efficiency of the worker by providing some measure of education, medical requirements and amenities. It envisaged that while the lower limit for "fair wage" must obviously be the minimum wage, the upper limit was set by the capacity of the industry to pay (NCL, 1969). The constitution of India, adopted in November, 1949, included the securing of a ‘living wage’ to workers as one of the key points enumerated under the Directive Principles of State Policy. The three categories of wages enumerated by the Committee on Fair Wages (CFW) continue to influence policies in the labour market in the post-independence period. On the recommendation of the Fair Wages Committee, the government appointed Tripartite Wage Boards which were formed to fix wages on an industry-cum-region basis. These Boards aimed to promote good industrial relations, standardization of wages and secured wage settlements. For the public sector, the government appointed Pay Commissions which would examine and reshape the salary structure of the Central Government employees; the First Pay Commission was appointed in 1946. The principles of wage fixation enunciated by this Commission have been accepted by the Government and have influenced the wage fixing authorities in matters related to industrial relations. Since the Commission and its recommendations are limited to the public sector; the private sector largely relies on the market forces for determining the wage levels, collective bargaining activities between trade unions and employers’ organizations also have a strong influence over this process. The Indian Labour Conference which met in 1945 adopted a Convention which called for the creation of a minimum wage fixing machinery at the all-India level. Further, in May 1947, the
51
Industrial Court ordered a rise in basic wages and imposed a system of standardized wage rates on industry. These initiatives served as a motive for the enactment of the Minimum Wages Act in 1948 which stipulated that both the Central and the State governments have the authority to fix, review, revise and enforce the minimum wages for workers employed in the various categories of employment scheduled under this Act. The Act extends to the whole of India and is applied to both agricultural employment (in Part II of the Act) and non-agricultural employment in (Part I) of the Act.
5.2.3 Institutions for fixing wages since the 1950s Wages and salaries of workers in India post independence are determined through several institutions like Industrial Wage Boards, Legal Adjudication by courts and tribunals, government-appointed Pay Commissions or through collective bargaining between employers and workers. Each of these institutions caters to a certain section of the workforce and there is no single institution regulating wages of the entire workforce. The Minimum Wages Act is also restricted in its coverage to only those industries included in its different schedules of employment listed under this Act. Employment Schedules listed under this Act have been updated over the years to include certain industries which were excluded earlier; however, a large proportion of workers continue to remain outside the ambit of this Act. The existence of multiple institutions makes for large variations in wages and earnings.
State Institutions for Fixing Wages Industrial Wage Boards Tripartite Wage boards came into existence upon the recommendation of the Fair Wages Committee (1949). These boards were formed to fix wages on an industry-cum-region basis with the basic idea of promoting good industrial relations, standardization of wages and securing wage settlements. The boards were composed of representatives of workers, employers, an independent economist and a Member of Parliament who together finalized the recommendations. The first wage board was established in March 30, 1957 for the cotton textile industry; soon it was followed by boards for sugar industry (Dec, 1957), cement industry (April, 1958), jute industry (August, 1960) and tea plantations (December, 1960) (Subramanian, 1969). These boards would decide on the minimum wages for unskilled workers in the industry and created a structure of differentials for other employees. Official and non-official review of the Wage Boards found several defects in their functioning like the prolonged time taken to complete work, lack of unanimity in recommendations, inability to work out a comprehensive wage structure and failure to ensure industrial peace through a feasible wage structure. As a result, workers soon lost faith in wage boards and instead preferred to negotiate their wages individually or through collective bargaining initiatives. Despite these shortcomings, wage boards persist for some sectors like the Journalists’ Wage Board which determines the wage structure for journalists and other workers in the field of media. Central Pay Commissions The Government of India set up the Central Pay Commission as an administrative mechanism to review and recommend the wage structure for all government employees in accordance with the current economic condition. These commissions examine various issues such as pay and allowances, retirement benefits, conditions of service, promotion policies etc and submit their recommendations on the same to the government. The first pay commission was set up in 1946 and the recommendations of this commission were based upon the idea of providing
52
‘living wages’ to the workers while accepting the principle that the interaction of demand and supply of labour should determine the level of wages. After the first commission, a new commission is appointed every decade and each new commission has brought about certain specific changes to the wage structure in the public sector of employment. Till now there have been seven commissions appointed. The Pay Commissions are however limited to only the organized public sector and do not cater to the private sector and the unorganized sector. The Pay Commissions take into consideration market fluctuations, changes in the price level, etc while fixing the salary structures of employees in government jobs in the public sector. The sixth Pay Commission raised the basic pay levels and provided increased dearness allowance, variable dearness allowance, transport costs, etc which considerably increased the level of earnings; this significantly increased differentials in wages and earnings because informal workers within the public sector were excluded from this award (and of course private sector workers were also excluded). Thus the gap in earnings increased significantly with the passage of the Sixth Pay Commission. The Seventh Pay Commission, which is yet to submit its report, is expected to further increase the salary of government employees, which would in turn further accentuate the wage and income gap between the organized and the unorganized sectors. Legal adjudications and legislations Legal adjudications and legislations constitute an important source of wage fixing machinery in India. One of the most important legislations on wages is the Minimum Wages Act of 1948. This act allows the Central and State governments to fix minimum rates of wages for different employments listed in the Schedule I and II of the Act. The scope of this act includes all workers, including those who were excluded from coverage under other Acts; so it applies to any person employed to do any work skilled, unskilled, manual or clerical work. The Act, for the first time, recognized that wages cannot be determined solely by the market forces. The whole philosophy underlying the enactment of the Minimum Wages Act is to prevent exploitation of labour through the payment of unduly low wages. In order to control the differences in wages paid to male and female workers, the government passed the Equal Remunerations Act in 1976 which called for payment of equal remuneration to men and women workers without any discrimination, on the ground of sex, against women in the matter of employment and for matters connected with it. Despite the existence of such laws, there are wide differences in the wages paid to men and women workers and minimum wage legislation is much criticized for non-compliance, lack of proper implementation and non-revisions over long periods of time. The next section considers the Minimum Wages act in more detail.
Minimum Wages Act (1948) and its implementation The introduction of the minimum wage legislation was a watershed in the history of the Indian labour market. The Minimum Wage Bill was introduced in the Indian Legislative Assembly on February 11, 1946 and was duly enacted on March 15, 1948. The objective of this Act was to ensure a minimum subsistence wage for workers. The Act defines wages as “all remuneration, capable of being expressed in terms of money, which would, if the terms of the contract of employment, express or implied, were fulfilled, be payable to a person employed in respect of his employment or of work done in such employment”. This Act gives both the Central and State governments the right to fix minimum rates of wages for different
53

employments listed in the Schedule I and II of the Act. Workers involve in non-agricultural operations listed in Schedule I of this Act and agricultural work listed under Schedule II of the Act are covered under this law. The scope of this act includes all workers engaged in agricultural and non-agricultural occupations like agriculture, industry and service sectors, including mining corporations; it applies to any person employed for hire or rewarded to do skilled, unskilled, manual, or clerical work. It was aimed to prevent sweating or exploitation of labour through payment of low wages. The minimum wage rate may be fixed in the form of time rate, piece rate, guaranteed time rate and overtime rate. The Act also provides that different rates may be fixed by the appropriate government for the different of scheduled employments, for different works in the same employment, for adults, adolescents and children, at different locations and for both male and female workers. These rates may be fixed by the hour, day, month or any other period as prescribed by the authority. Since labour is a subject matter of the Concurrent List, both Central and State governments have the right to stipulate wages, the Act specifies the various groups of occupations in which the Central or State government specifies the wages. The act however does not provide any specific criteria for fixing the rates of minimum wages; in the absence of any definite criteria, the Indian Labour Conference in 1957 had decided on certain norms which were to regulate the levels of wage fixation. The norms for fixing minimum wage rate are:
1. Three consumption units per earner 2. Minimum food requirement of 2700 calories per average adult member 3. Cloth requirement of 72 yards per annum per family 4. Rent corresponding to the minimum area provided under the Government’s Industrial
Housing Scheme 5. Fuel, lighting and other miscellaneous items of expenditure to constitute 20 per cent of
total minimum wage The Supreme Court in a landmark judgment in 1992 said that children’s education; medical requirement; minimum recreation, including festivals and ceremonies; provisions for old age and marriage should constitute further 25 per cent of the minimum wage. The act also provides for the fixation of number of hours constituting each working day, and sets rules for rest time. The Act also adds that it is mandatory for employer to maintain records of all employees’ work, wages and receipts. The wages fixed must be revised on a five-year interval on the basis of the ‘cost of living’ index. The wages differ across states, sectors, skills, regions and occupations owing to difference in costs of living, payment capacity of regional industries, patterns of consumption, etc. Wages can either be fixed by the committees and sub-committees set up by the respective governments to make recommendations and inquiries or through publications made by the government in the Official Gazette. There are wide variations in the Minimum Wage levels fixed among different states (table 5.2.1); this gives rise to discrepancies in wages among workers doing the same work across different plants within and between states.
54
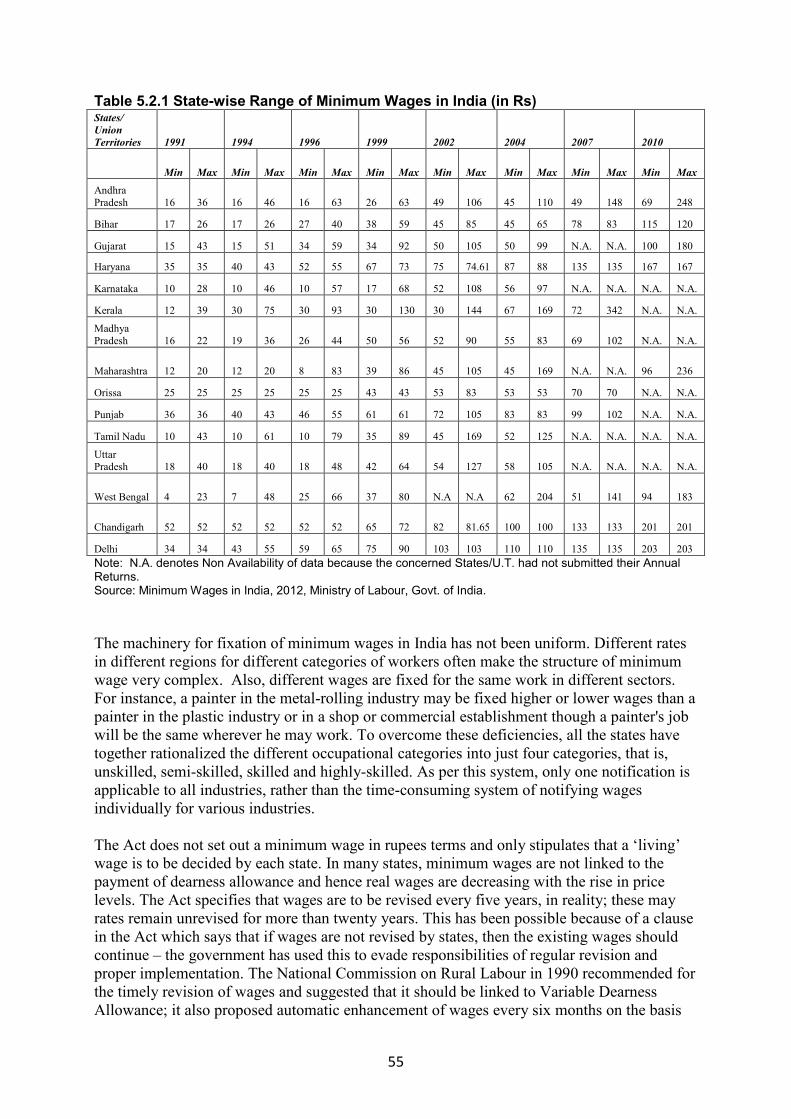
Table 5.2.1 State-wise Range of Minimum Wages in India (in Rs) States/ Union Territories 1991 1994 1996 1999 2002 2004 2007 2010
Min Max Min Max Min Max Min Max Min Max Min Max Min Max Min Max
Andhra Pradesh 16 36 16 46 16 63 26 63 49 106 45 110 49 148 69 248
Bihar 17 26 17 26 27 40 38 59 45 85 45 65 78 83 115 120
Gujarat 15 43 15 51 34 59 34 92 50 105 50 99 N.A. N.A. 100 180
Haryana 35 35 40 43 52 55 67 73 75 74.61 87 88 135 135 167 167
Karnataka 10 28 10 46 10 57 17 68 52 108 56 97 N.A. N.A. N.A. N.A.
Kerala 12 39 30 75 30 93 30 130 30 144 67 169 72 342 N.A. N.A.
Madhya Pradesh 16 22 19 36 26 44 50 56 52 90 55 83 69 102 N.A. N.A.
Maharashtra 12 20 12 20 8 83 39 86 45 105 45 169 N.A. N.A. 96 236
Orissa 25 25 25 25 25 25 43 43 53 83 53 53 70 70 N.A. N.A.
Punjab 36 36 40 43 46 55 61 61 72 105 83 83 99 102 N.A. N.A.
Tamil Nadu 10 43 10 61 10 79 35 89 45 169 52 125 N.A. N.A. N.A. N.A.
Uttar Pradesh 18 40 18 40 18 48 42 64 54 127 58 105 N.A. N.A. N.A. N.A.
West Bengal 4 23 7 48 25 66 37 80 N.A N.A 62 204 51 141 94 183
Chandigarh 52 52 52 52 52 52 65 72 82 81.65 100 100 133 133 201 201
Delhi 34 34 43 55 59 65 75 90 103 103 110 110 135 135 203 203 Note: N.A. denotes Non Availability of data because the concerned States/U.T. had not submitted their Annual Returns. Source: Minimum Wages in India, 2012, Ministry of Labour, Govt. of India. The machinery for fixation of minimum wages in India has not been uniform. Different rates in different regions for different categories of workers often make the structure of minimum wage very complex. Also, different wages are fixed for the same work in different sectors. For instance, a painter in the metal-rolling industry may be fixed higher or lower wages than a painter in the plastic industry or in a shop or commercial establishment though a painter's job will be the same wherever he may work. To overcome these deficiencies, all the states have together rationalized the different occupational categories into just four categories, that is, unskilled, semi-skilled, skilled and highly-skilled. As per this system, only one notification is applicable to all industries, rather than the time-consuming system of notifying wages individually for various industries. The Act does not set out a minimum wage in rupees terms and only stipulates that a ‘living’ wage is to be decided by each state. In many states, minimum wages are not linked to the payment of dearness allowance and hence real wages are decreasing with the rise in price levels. The Act specifies that wages are to be revised every five years, in reality; these may rates remain unrevised for more than twenty years. This has been possible because of a clause in the Act which says that if wages are not revised by states, then the existing wages should continue – the government has used this to evade responsibilities of regular revision and proper implementation. The National Commission on Rural Labour in 1990 recommended for the timely revision of wages and suggested that it should be linked to Variable Dearness Allowance; it also proposed automatic enhancement of wages every six months on the basis
55
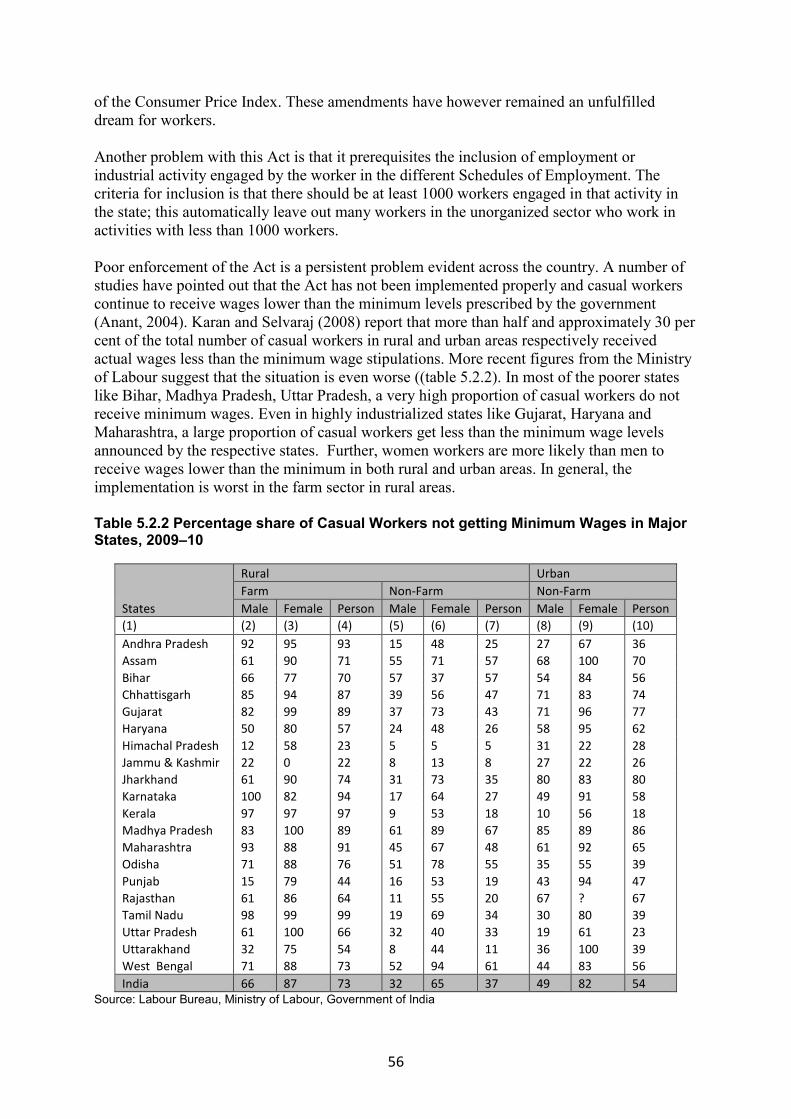
of the Consumer Price Index. These amendments have however remained an unfulfilled dream for workers. Another problem with this Act is that it prerequisites the inclusion of employment or industrial activity engaged by the worker in the different Schedules of Employment. The criteria for inclusion is that there should be at least 1000 workers engaged in that activity in the state; this automatically leave out many workers in the unorganized sector who work in activities with less than 1000 workers. Poor enforcement of the Act is a persistent problem evident across the country. A number of studies have pointed out that the Act has not been implemented properly and casual workers continue to receive wages lower than the minimum levels prescribed by the government (Anant, 2004). Karan and Selvaraj (2008) report that more than half and approximately 30 per cent of the total number of casual workers in rural and urban areas respectively received actual wages less than the minimum wage stipulations. More recent figures from the Ministry of Labour suggest that the situation is even worse ((table 5.2.2). In most of the poorer states like Bihar, Madhya Pradesh, Uttar Pradesh, a very high proportion of casual workers do not receive minimum wages. Even in highly industrialized states like Gujarat, Haryana and Maharashtra, a large proportion of casual workers get less than the minimum wage levels announced by the respective states. Further, women workers are more likely than men to receive wages lower than the minimum in both rural and urban areas. In general, the implementation is worst in the farm sector in rural areas. Table 5.2.2 Percentage share of Casual Workers not getting Minimum Wages in Major States, 2009–10
States
Rural Urban Farm Non-Farm Non-Farm Male Female Person Male Female Person Male Female Person
(1) (2) (3) (4) (5) (6) (7) (8) (9) (10) Andhra Pradesh 92 95 93 15 48 25 27 67 36 Assam 61 90 71 55 71 57 68 100 70 Bihar 66 77 70 57 37 57 54 84 56 Chhattisgarh 85 94 87 39 56 47 71 83 74 Gujarat 82 99 89 37 73 43 71 96 77 Haryana 50 80 57 24 48 26 58 95 62 Himachal Pradesh 12 58 23 5 5 5 31 22 28 Jammu & Kashmir 22 0 22 8 13 8 27 22 26 Jharkhand 61 90 74 31 73 35 80 83 80 Karnataka 100 82 94 17 64 27 49 91 58 Kerala 97 97 97 9 53 18 10 56 18 Madhya Pradesh 83 100 89 61 89 67 85 89 86 Maharashtra 93 88 91 45 67 48 61 92 65 Odisha 71 88 76 51 78 55 35 55 39 Punjab 15 79 44 16 53 19 43 94 47 Rajasthan 61 86 64 11 55 20 67 ? 67 Tamil Nadu 98 99 99 19 69 34 30 80 39 Uttar Pradesh 61 100 66 32 40 33 19 61 23 Uttarakhand 32 75 54 8 44 11 36 100 39 West Bengal 71 88 73 52 94 61 44 83 56 India 66 87 73 32 65 37 49 82 54
Source: Labour Bureau, Ministry of Labour, Government of India
56
Employers have time and again violated the norms of this Act and have denied workers their right to a basic minimum wage. Lack of awareness among the workers about the provisions and entitlements listed under the Act has increased the vulnerability of workers. Minimum wages are expected to be a floor level below which wages should not fall; but employers have paid workers – especially casual, contract and home-based workers – wages far below the minimum wage level. For the unorganized sector, this Act is the principal labour legislation applicable; but ineffective implementation and non-compliance by employers, coupled with low unionization, have made workers in this sector more susceptible to exploitation. Not only are these workers denied minimum wages, they are also denied overtime payments, leave and other entitlements specified under the Act.
Wage fixing institutions in the private sector Collective bargaining Wages in the private sector are to some extent determined through collective bargaining procedures between employers and trade unions, especially in larger firms. Collective bargaining negotiations are generally carried out between the workers’ collective and an individual employer or with the employers’ association. These processes are generally limited to only the membership of the collectives and exclude the casual and contract workers in the industries who are not members of unions or cooperatives. In this context, it is important to note that there may be more than one union in a plant and often casual and contract workers are part of smaller subsidiary unions which may not enjoy recognition from the employer (trade union recognition being a sole prerogative of the employer). In such a situation, despite being a member of a union, informal workers may remain outside collective bargaining activities. For informal workers, wages are simply based on the prerogative of the employer. Collective bargaining relates to those arrangements under which wages and conditions of employments are generally decided by agreements negotiated between the representatives of workers and employers. Workers’ organizations like trade unions differ in their strengths of collective bargaining depending on the membership base, productivity of plants and negotiating skills of union leaders. In recent years, with the rise of independent unions, there has been a shift from centralized bargaining to decentralized bargaining where wages are negotiated at the plant/firm level and are not applicable for the industry as a whole. This gives rise to wage differences within industries and between industries in the same region; for the same reason one find wage differences across regions among different plants of the same industry depending on the collective bargaining potential of the respective plant unions. Labour market factors, like a decline in employment in the organized sector and a simultaneous increase in contract and casual employment, the increase in employment in non-unionized sectors (like in IT and IT-related industries), managerial strategies such as closures, retrenchment, reduction in bargainable category of workers, relocation of plants, outsourcing etc and the withdrawal of state support for union activities have tended to weaken the power of unions to influence wages in India in recent years (see section 5.1); but they remain an important factor in many important sectors. Wages in the unorganized sector In the unorganized sector, there are no formal mechanisms for wage determination; while some employers stick to the minimum wage stipulations fixed by state governments under the Minimum Wages Act, others violate this basic level. The Minimum Wages Act (1948) is the
57
principal formal wage-fixing institution for this sector. While in the organized sector this Act is used as the minimum level; in the unorganized sector, it is often treated as the upper limit for wages; as a result, wages paid to informal workers are often less than the Minimum Wage stipulations. Wages for these workers are often piece-rated and are far lower than minimum wage levels, without overtime payments or social security benefits. Ineffective implementation of this Act and non-compliance with the wage stipulations have resulted in extremely low wages. Informal institutions Other than the above mentioned institutions, many informal mechanisms and institutions, including those concerning religion, caste, personal relationships and ties of kinship, influence the determination of wages in the labour market. Scheduled Caste and Scheduled Tribe workers are discriminated against both in the public and private sector but the effect of discrimination is less in the public sector (Madheswaran and Attewell, 2007). These factors are strongest in the unorganized sector, where the process of determining wages is hugely influenced by caste identities; workers belonging to SC, ST or OBCs are widely paid wages lower than Upper Caste workers. Caste discrimination also persists in terms of access to employment opportunities, as lower castes are may be refused access to higher category (highly skilled) jobs if upper castes refuse to work under the guidance of lower caste workers, even if they possess greater levels of skill and knowledge. The claim, made by some employers and workers’ organizations, that caste discriminations do not exist in the labour market is far from true (see Section 7.3).
5.2.4 Patterns of wage inequality The Indian labour market is highly segmented into different categories of workers and there is a substantial wage gap between each category. Workers in the unorganized sector are paid less than one-third of the wages paid to the organized sector employees, on average; they mostly suffer from poor working conditions without any social security benefits. There is a large gap in wages between casual and regular workers. Within the organized sector, there are wage differences between the private and the public sector. This wage differential is higher in rural than in urban areas and is higher among women workers than men. Women workers earn much lower wages than their male counterparts. Hence, a significant part of this inequality is between groups rather than within groups (Das, 2012). Institutional factors and inter-regional mobility of labour strongly influence the pattern of wage differentiation. Wages of causal workers, unlike most regular workers, are not institutionally fixed; instead they are determined by the local labour market conditions which vary among regions. As we have seen in earlier sections, average wages and earnings increased during the 1990s, however the growth in wages has not been commensurate with the overall increase in economic output and there are large variations in this growth across the different segments of the labour market.
Wage differences between regular and casual workers The average wage of regular workers in 2011-12, as shown in table 5.2.3, was Rs 392, as against Rs 143 for casual workers; in 1983 the corresponding figures (in 2011-12 prices) were Rs 169 and Rs 58. This trend is visible throughout this period: wages of regular workers are around three-times those of casual workers. This regular-casual wage differential widened sharply during the post-liberalization period as compared to the pre-reform period, but then
58
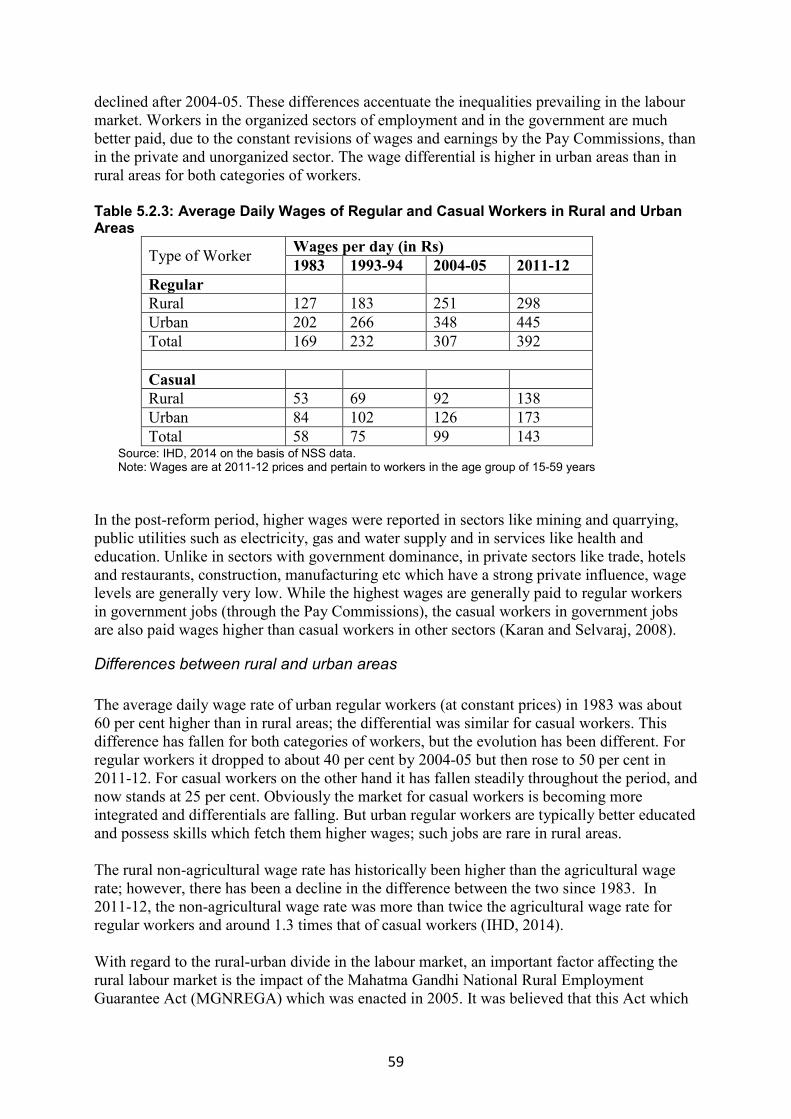
declined after 2004-05. These differences accentuate the inequalities prevailing in the labour market. Workers in the organized sectors of employment and in the government are much better paid, due to the constant revisions of wages and earnings by the Pay Commissions, than in the private and unorganized sector. The wage differential is higher in urban areas than in rural areas for both categories of workers. Table 5.2.3: Average Daily Wages of Regular and Casual Workers in Rural and Urban Areas
Type of Worker Wages per day (in Rs) 1983 1993-94 2004-05 2011-12
Regular Rural 127 183 251 298 Urban 202 266 348 445 Total 169 232 307 392 Casual Rural 53 69 92 138 Urban 84 102 126 173 Total 58 75 99 143
Source: IHD, 2014 on the basis of NSS data. Note: Wages are at 2011-12 prices and pertain to workers in the age group of 15-59 years
In the post-reform period, higher wages were reported in sectors like mining and quarrying, public utilities such as electricity, gas and water supply and in services like health and education. Unlike in sectors with government dominance, in private sectors like trade, hotels and restaurants, construction, manufacturing etc which have a strong private influence, wage levels are generally very low. While the highest wages are generally paid to regular workers in government jobs (through the Pay Commissions), the casual workers in government jobs are also paid wages higher than casual workers in other sectors (Karan and Selvaraj, 2008).
Differences between rural and urban areas
The average daily wage rate of urban regular workers (at constant prices) in 1983 was about 60 per cent higher than in rural areas; the differential was similar for casual workers. This difference has fallen for both categories of workers, but the evolution has been different. For regular workers it dropped to about 40 per cent by 2004-05 but then rose to 50 per cent in 2011-12. For casual workers on the other hand it has fallen steadily throughout the period, and now stands at 25 per cent. Obviously the market for casual workers is becoming more integrated and differentials are falling. But urban regular workers are typically better educated and possess skills which fetch them higher wages; such jobs are rare in rural areas. The rural non-agricultural wage rate has historically been higher than the agricultural wage rate; however, there has been a decline in the difference between the two since 1983. In 2011-12, the non-agricultural wage rate was more than twice the agricultural wage rate for regular workers and around 1.3 times that of casual workers (IHD, 2014). With regard to the rural-urban divide in the labour market, an important factor affecting the rural labour market is the impact of the Mahatma Gandhi National Rural Employment Guarantee Act (MGNREGA) which was enacted in 2005. It was believed that this Act which
59
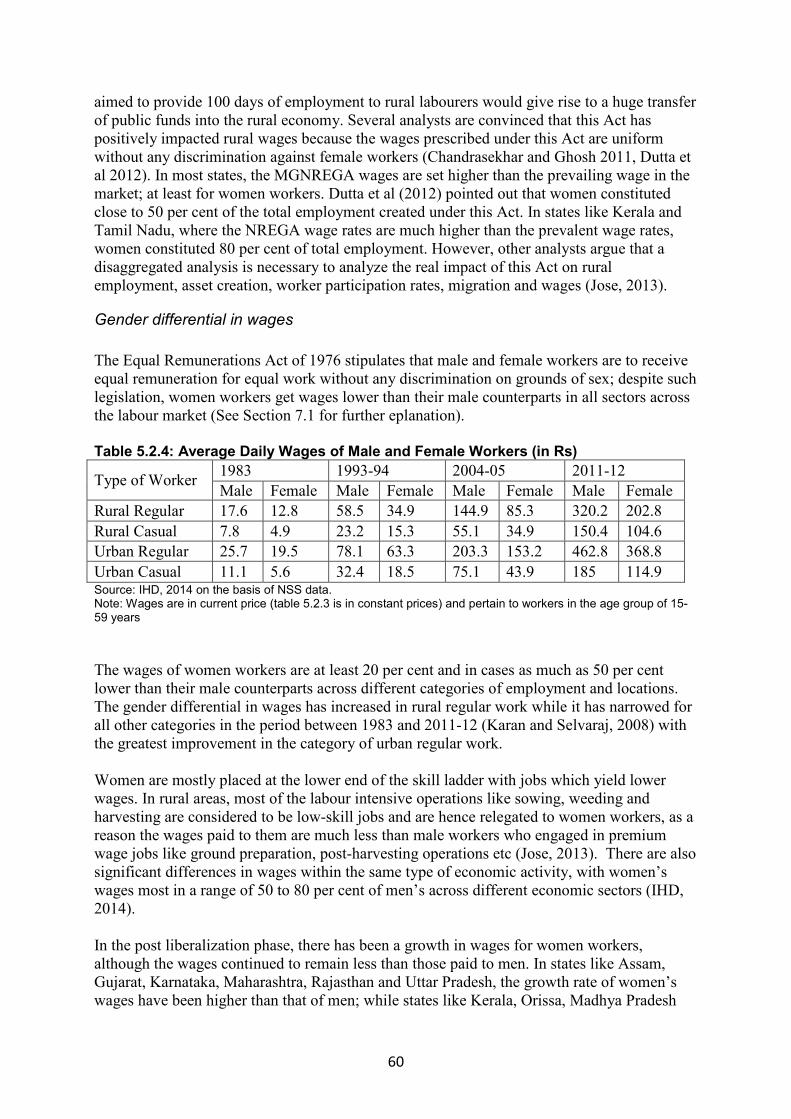
aimed to provide 100 days of employment to rural labourers would give rise to a huge transfer of public funds into the rural economy. Several analysts are convinced that this Act has positively impacted rural wages because the wages prescribed under this Act are uniform without any discrimination against female workers (Chandrasekhar and Ghosh 2011, Dutta et al 2012). In most states, the MGNREGA wages are set higher than the prevailing wage in the market; at least for women workers. Dutta et al (2012) pointed out that women constituted close to 50 per cent of the total employment created under this Act. In states like Kerala and Tamil Nadu, where the NREGA wage rates are much higher than the prevalent wage rates, women constituted 80 per cent of total employment. However, other analysts argue that a disaggregated analysis is necessary to analyze the real impact of this Act on rural employment, asset creation, worker participation rates, migration and wages (Jose, 2013).
Gender differential in wages The Equal Remunerations Act of 1976 stipulates that male and female workers are to receive equal remuneration for equal work without any discrimination on grounds of sex; despite such legislation, women workers get wages lower than their male counterparts in all sectors across the labour market (See Section 7.1 for further eplanation). Table 5.2.4: Average Daily Wages of Male and Female Workers (in Rs)
Type of Worker 1983 1993-94 2004-05 2011-12 Male Female Male Female Male Female Male Female
Rural Regular 17.6 12.8 58.5 34.9 144.9 85.3 320.2 202.8 Rural Casual 7.8 4.9 23.2 15.3 55.1 34.9 150.4 104.6 Urban Regular 25.7 19.5 78.1 63.3 203.3 153.2 462.8 368.8 Urban Casual 11.1 5.6 32.4 18.5 75.1 43.9 185 114.9 Source: IHD, 2014 on the basis of NSS data. Note: Wages are in current price (table 5.2.3 is in constant prices) and pertain to workers in the age group of 15-59 years The wages of women workers are at least 20 per cent and in cases as much as 50 per cent lower than their male counterparts across different categories of employment and locations. The gender differential in wages has increased in rural regular work while it has narrowed for all other categories in the period between 1983 and 2011-12 (Karan and Selvaraj, 2008) with the greatest improvement in the category of urban regular work. Women are mostly placed at the lower end of the skill ladder with jobs which yield lower wages. In rural areas, most of the labour intensive operations like sowing, weeding and harvesting are considered to be low-skill jobs and are hence relegated to women workers, as a reason the wages paid to them are much less than male workers who engaged in premium wage jobs like ground preparation, post-harvesting operations etc (Jose, 2013). There are also significant differences in wages within the same type of economic activity, with women’s wages most in a range of 50 to 80 per cent of men’s across different economic sectors (IHD, 2014). In the post liberalization phase, there has been a growth in wages for women workers, although the wages continued to remain less than those paid to men. In states like Assam, Gujarat, Karnataka, Maharashtra, Rajasthan and Uttar Pradesh, the growth rate of women’s wages have been higher than that of men; while states like Kerala, Orissa, Madhya Pradesh
60
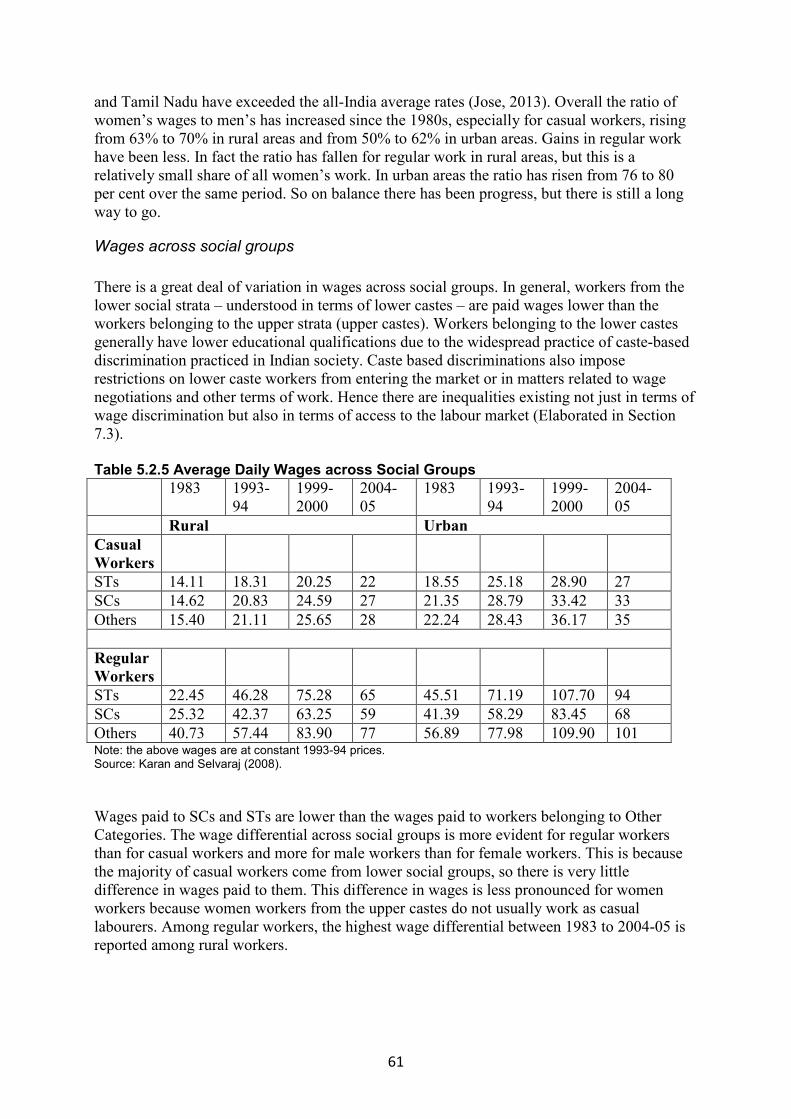
and Tamil Nadu have exceeded the all-India average rates (Jose, 2013). Overall the ratio of women’s wages to men’s has increased since the 1980s, especially for casual workers, rising from 63% to 70% in rural areas and from 50% to 62% in urban areas. Gains in regular work have been less. In fact the ratio has fallen for regular work in rural areas, but this is a relatively small share of all women’s work. In urban areas the ratio has risen from 76 to 80 per cent over the same period. So on balance there has been progress, but there is still a long way to go.
Wages across social groups There is a great deal of variation in wages across social groups. In general, workers from the lower social strata – understood in terms of lower castes – are paid wages lower than the workers belonging to the upper strata (upper castes). Workers belonging to the lower castes generally have lower educational qualifications due to the widespread practice of caste-based discrimination practiced in Indian society. Caste based discriminations also impose restrictions on lower caste workers from entering the market or in matters related to wage negotiations and other terms of work. Hence there are inequalities existing not just in terms of wage discrimination but also in terms of access to the labour market (Elaborated in Section 7.3). Table 5.2.5 Average Daily Wages across Social Groups 1983 1993-
94 1999-2000
2004-05
1983 1993-94
1999-2000
2004-05
Rural Urban Casual Workers
STs 14.11 18.31 20.25 22 18.55 25.18 28.90 27 SCs 14.62 20.83 24.59 27 21.35 28.79 33.42 33 Others 15.40 21.11 25.65 28 22.24 28.43 36.17 35 Regular Workers
STs 22.45 46.28 75.28 65 45.51 71.19 107.70 94 SCs 25.32 42.37 63.25 59 41.39 58.29 83.45 68 Others 40.73 57.44 83.90 77 56.89 77.98 109.90 101 Note: the above wages are at constant 1993-94 prices. Source: Karan and Selvaraj (2008). Wages paid to SCs and STs are lower than the wages paid to workers belonging to Other Categories. The wage differential across social groups is more evident for regular workers than for casual workers and more for male workers than for female workers. This is because the majority of casual workers come from lower social groups, so there is very little difference in wages paid to them. This difference in wages is less pronounced for women workers because women workers from the upper castes do not usually work as casual labourers. Among regular workers, the highest wage differential between 1983 to 2004-05 is reported among rural workers.
61

Differences by occupation and education level There are substantial differences in wages across skill levels and occupational groups. Due to the absence of a precise measure of skill, educational levels are considered as indicators of skill with the general expectation that there will be a rise in wages with the rise in educational levels. Table 5.2.6 shows a wage differential of 3-4 to 1 between the top and bottom educational levels in 2011-12, but casual observation suggests that this is considerably underestimated in the NSS surveys from which this information comes. There is some evidence of increasing wage differentials across educational categories in the post liberalization period, especially between the highest educational levels and the rest, but the gap declined somewhat in 2011-12. More information on occupational differentials is required to investigate this further. Table 5.2.6 Wage by Educational Level of Regular Workers, 2011–2
Education level Rural Urban Male Female Male Female
Non-Educated 178 95 208 129 Primary 189 102 222 139 Middle 217 112 252 138 Secondary 338 229 383 328 Graduate and higher 550 378 792 607 Total 320 203 463 369
Source: IHD (2014). Inter-sectoral differentials also contribute to growing inequality. There is, for instance, evidence that some export-oriented sectors pay higher wages than domestically-oriented sectors; further, graduates employed in IT earn more than graduates in other sectors (Sarkar and Mehta, 2010).
Regional variations Wage differences are also evident across different states which depend on the political environment of the state, the level of development and other factors. There are wide variations in casual and regular wages across different states. The labour market appears to be most integrated across states in case of regular jobs in urban areas and least integrated for casual jobs in rural areas (table 5.2.7). However, such conclusions are dependent on special factors such as high casual wages in Kerala. Several factors together give rise to regional wage differences – wages for regular workers are largely institutionally determined and regulated and variations in the coverage, application and nature of each institution gives rise to wage inequalities across states. Wages of casual workers on the other hand are primarily determined by the inherent labour market conditions which vary across regions. Labour mobility also acts as another factor contributing to wage differences. Growth patterns of each state and the importance given to labour legislation like the Minimum Wages Act by each state also gives rise to differences in wages across states.
62
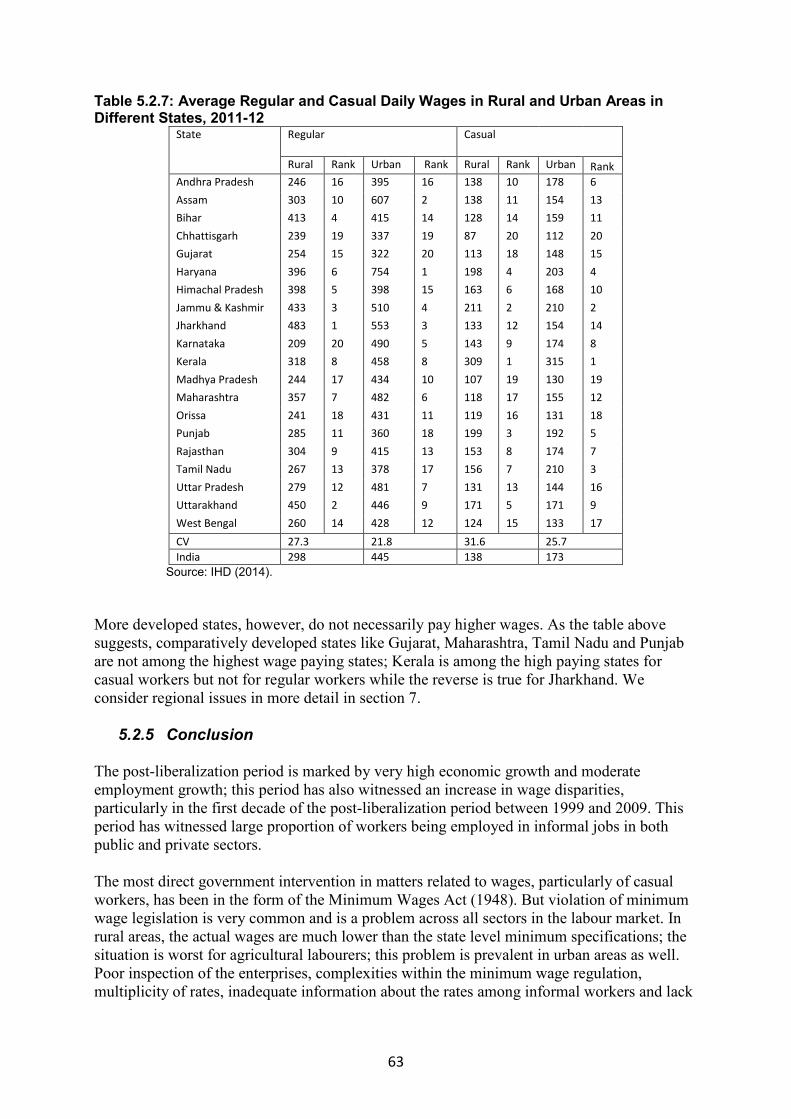
Table 5.2.7: Average Regular and Casual Daily Wages in Rural and Urban Areas in Different States, 2011-12
State Regular
Casual
Rural Rank Urban Rank Rural Rank Urban Rank Andhra Pradesh 246 16 395 16 138 10 178 6 Assam 303 10 607 2 138 11 154 13 Bihar 413 4 415 14 128 14 159 11 Chhattisgarh 239 19 337 19 87 20 112 20 Gujarat 254 15 322 20 113 18 148 15 Haryana 396 6 754 1 198 4 203 4 Himachal Pradesh 398 5 398 15 163 6 168 10 Jammu & Kashmir 433 3 510 4 211 2 210 2 Jharkhand 483 1 553 3 133 12 154 14 Karnataka 209 20 490 5 143 9 174 8 Kerala 318 8 458 8 309 1 315 1 Madhya Pradesh 244 17 434 10 107 19 130 19 Maharashtra 357 7 482 6 118 17 155 12 Orissa 241 18 431 11 119 16 131 18 Punjab 285 11 360 18 199 3 192 5 Rajasthan 304 9 415 13 153 8 174 7 Tamil Nadu 267 13 378 17 156 7 210 3 Uttar Pradesh 279 12 481 7 131 13 144 16 Uttarakhand 450 2 446 9 171 5 171 9 West Bengal 260 14 428 12 124 15 133 17 CV 27.3 21.8 31.6 25.7 India 298 445 138 173
Source: IHD (2014). More developed states, however, do not necessarily pay higher wages. As the table above suggests, comparatively developed states like Gujarat, Maharashtra, Tamil Nadu and Punjab are not among the highest wage paying states; Kerala is among the high paying states for casual workers but not for regular workers while the reverse is true for Jharkhand. We consider regional issues in more detail in section 7.
5.2.5 Conclusion The post-liberalization period is marked by very high economic growth and moderate employment growth; this period has also witnessed an increase in wage disparities, particularly in the first decade of the post-liberalization period between 1999 and 2009. This period has witnessed large proportion of workers being employed in informal jobs in both public and private sectors. The most direct government intervention in matters related to wages, particularly of casual workers, has been in the form of the Minimum Wages Act (1948). But violation of minimum wage legislation is very common and is a problem across all sectors in the labour market. In rural areas, the actual wages are much lower than the state level minimum specifications; the situation is worst for agricultural labourers; this problem is prevalent in urban areas as well. Poor inspection of the enterprises, complexities within the minimum wage regulation, multiplicity of rates, inadequate information about the rates among informal workers and lack
63
of government efforts at ensuring proper implementation of this Act have together accentuated the problem of non-compliance with labour laws. The problem of wage inequality is extremely complex, involving a mix of social and economic forces, with a variety of dimensions on both supply and demand sides. Several analysts argue that social spending in the form of education, healthcare, sanitation, shelter and civic amenities can help in raising the “reserve price” of workers in the labour market and so help to maintain wages (Jose, 2008). Others argue that better implementation of wage legislation is the others. Still others point to the need for better organization of workers, especially groups that are discriminated against or vulnerable to exploitation. In reality, wage inequality is closely bound up with labour market segmentation.
5.3 The Labour Code One of the most visible forms of labour market segmentation is that between the organized sector and the unorganized sector. This division corresponds in large measure to the ways certain laws and regulations are applied. These differentiate between establishments to which these laws are applicable, depending on their size and other characteristics. They also define various categories of work within different types of enterprise and specify the different degrees of protection that each category of worker is entitled to. In other words, labour laws and regulations play a crucial role in perpetuating, rather than reducing, certain inequalities within the labour market. India has over 150 separate laws governing the labour market and the workers, many of which overlap (Mitchell, Mahy and Gahan, 2012). There is also a general perception that the bulk of labour laws restrict the growth of the economy. The presently existing body of labour laws can be broadly categorized into collective laws that relate to tripartite relations between employee, employer and trade unions, and individual laws concerning employee rights at work and for different categories of workers
5.3.1 The evolution of labour laws in India The origins of most of the labour laws, in the sub-continent as a whole, lie in its colonial legacy and in the British system of common law. The Law Commission set up in 1856 by Lord Macaulay drafted a series of laws for this region, some of which are still in force today. From the 1880s onwards, there were a few legislative interventions by the colonial government, like the Factories Act of 1881, 1891 and the Indian Mines Act 1901, which mainly dealt with the employment of women and children, especially in matters related to hours of work, in factories and mines. The creation of the International Labour Organization (ILO) in 1919 and the impetus given by it to law-making has also been another source of influence for several of the labour laws existing in India. Laws such as the Workmen’s Compensation Act, 1923; the Trade Unions Act, 1926, The Payment of Wages Act, 1936, Industrial Disputes Act, 1947, which incidentally acts as one of the primary source of guidelines for most industries in the country, were adopted in the colonial period, under the influence and sometimes pressures of ILO. Much of the legislation in the period up to the 1920s was characterized by factory-style regulation dealing with hours of work, rest periods, health and safety and women and child
64

protection. The industrial relations policy in that period was one of laissez faire and selective intervention in industrial matters The Trade unions Act 1926 provided for the registration of trade unions, which gave unions a legal status and extended some protections against civil and criminal liability in matters of industrial disputes. However, the Act was limited because it did not include unregistered unions, some of which has considerable strength, irrespective of membership, and imposed no obligation upon employers to bargain with unions. It can be argued that much of the legal framework was aimed at protecting the interest of the employers rather than safeguarding the interest of workers. In July 1929 the colonial government set up the Royal Commission on Labour to look into the employment conditions in colonial India. The report submitted by this commission gave rise to a series of new labour laws like the Payment of Wages Act, 1938 which allowed the employer to deduct wages of workers in case of absence from work. A very important milestone of this period was the enactment of the Government of India Act of 1935 which called for sharing of powers between the Centre and the State governments in matters related to labour; a practice that has been continued in independent India as well. This gave rise to progressive labour regulations from the provincial governments like the enactment of the Industrial Disputes Act, 1938, by the Bombay provincial government which imposed a legal obligation on the part of employers to recognize trade unions. Regulations in the Second World War period aimed to counter industrial unrest and strike actions against the conditions and effects of the war. The Defense of Indian Rules (Rule 81-A introduced in 1942 and Rule 56-A introduced in 1943) called for compulsory adjudication and banned strikes. Many of these provisions have been retained post independence and an important law, the Industrial Disputes Act, 1947, has reproduced some of the war-time controls. After independence, a new constitutional framework was adopted (1950) which laid strong emphasis on basic rights of equality and freedom and focused on the need to eradicate poverty and all forms of discrimination. The Preamble to the Indian Constitution is committed to secure economic, political and social justice to its people. The dignity of human labour and need for protecting and safeguarding the interests of labour is enshrined in Chapter III (Articles 16. 19, 23 and 14) and Chapter IV (Articles 39, 41, 42, 43 and 54) of the Indian Constitution which provides the constitutional basis for labour laws in India. The Directive Principles of State Policy, in Article 39 (Part IV) of the constitution, directs the state to secure to all its citizens the right to adequate means of livelihood, and equal pay for equal work for both men and women, among other things. The Indian Government introduced several protective legislations such as the Factories Act 1948, the Minimum Wages Act, 1948, the Employees’ State Insurance Act 1948 which provided for an insurance system for employees in cases of sickness, maternity, injury and death and the Employees’ Provident Fund and Miscellaneous Provisions Act 1952, which is one of the most important pieces of social security legislation in the country. It is however interesting to note that the laws regulating trade unions and industrial disputes remained largely fixed on the model developed during 1926 to 1947 (Mitchell, Mahy and Gahan, 2012). As noted in Section 5.1, the system of industrial relations that emerged in this period was tripartite in nature; however, the level of state intervention in actual practice suggested that
65
collective bargaining was to develop as the primary process for future industrial relations. Some states tried to secure the interests of workers with progressive legislation which made employer’s refusal to bargain with unions an “unfair labour practice” thereby making collective bargaining obligatory to some extent. The Maharashtra Recognition of Unions and Prevention of Unfair Labour Practices Act of 1971 was an example of such a piece of legislation. In the period after independence, there has been a rise in contractual employment. The Contract Labour (Prohibition and Regulation) Act, 1970 was enacted to provide a mechanism for regulating the use of contractual employment. The Act provides for the registration of contractors, appointment of a Tripartite Advisory Board that investigates the various forms of contract labour and prohibits the use of contract labour in perennial forms of production. The Act however is silent on whether the contract workers are to be automatically absorbed into the permanent workforce in a plan, after contract labour is abolished. In the era of liberalization, post 1990s, the primary concern of the government was to construct and maintain a ‘floor of rights’ for certain classes of labour which restricted the collective labour influence. Labour policies were strongly concentrated on labour relations in the formal sector, largely ignoring labour relations in the unorganized sector. The National Commission on for Enterprises in the Unorganized Sector (2004) was established to act as an advisory body for matters regarding informal employment. The NCEUS through its various reports highlighted the extent of the unorganized sector in India. It clearly showed that organized sector jobs were limited to only 7% of the workforce while 93% of the workforce was engaged in the unorganized sector. The recommendations made by this commission gave rise to the enactment of the Unorganized Workers Sector Social Securities Act, 2008, which, for the first time, provided a concise definition for the unorganized Sector. The Act specified the various types of employment which together constituted the unorganized sector and declared that they should be recognized as workers and be provided with social security benefits.
66

Labour Laws in India
Theme Name of the law Scope of the Act Industrial Relations
Trade Unions Act, 1926 Provides for registration of trade unions (including association of employers) to enable collective bargaining. The act also confers certain protection and privileges on a registered trade union.
Industrial Employment Standing Orders Act, 1946
Requires employers to clearly define and publish standing orders (service rules) and to make them known to the workmen employed by them. Applies to every industrial establishment where 100 or more workers were employed in last 12 months
Industrial Disputes Act, 1947 Provides machinery and procedure for the investigation and settlement of industrial disputes by negotiations. Applies to every industrial establishment and includes all workers hired therein
Wages Payment of Wages Act, 1936 Ensures payment of wages in a particular form at regular intervals without unauthorised deductions in any establishment
Minimum Wages Act, 1948 Fixing minimum rates of wages in certain employments. It applies to all establishments employing one or more persons and engaged in any of the scheduled employments.
Working Journalists (Fixation of Rates of wages) Act, 1958
provide for the fixation of rates of wages in respect of working journalists and for matters connected therewith.
Payment of Bonus Act, 1965 Provide for the payment of bonus (linked with profit or productivity) to persons employed in certain establishments. Applicable to factories with 20 or more workers
Working Hours Conditions of Service and Employment
Factories Act, 1948 Provides for health, safety, welfare, service conditions and other aspects of work in factories. Applies to all factories employing more than 10 workers and working with power or 20 people without using power. Covers all workers in factory precincts employed directly or indirectly
Dock Workers (Regulation of Employment) Act, 1948
Scheme for the registration or dock workers and employers with a view to ensuring greater regularity of employment and for regulating the employment of dock workers whether registered or not in a Port.
Plantation Labour Act, 1951 regulate the conditions of work like hours of work, wages, health facilities and general welfare of workers in plantations
Mines Act, 1952 provisions for managing mines and providing measures related to health, safety and welfare
67
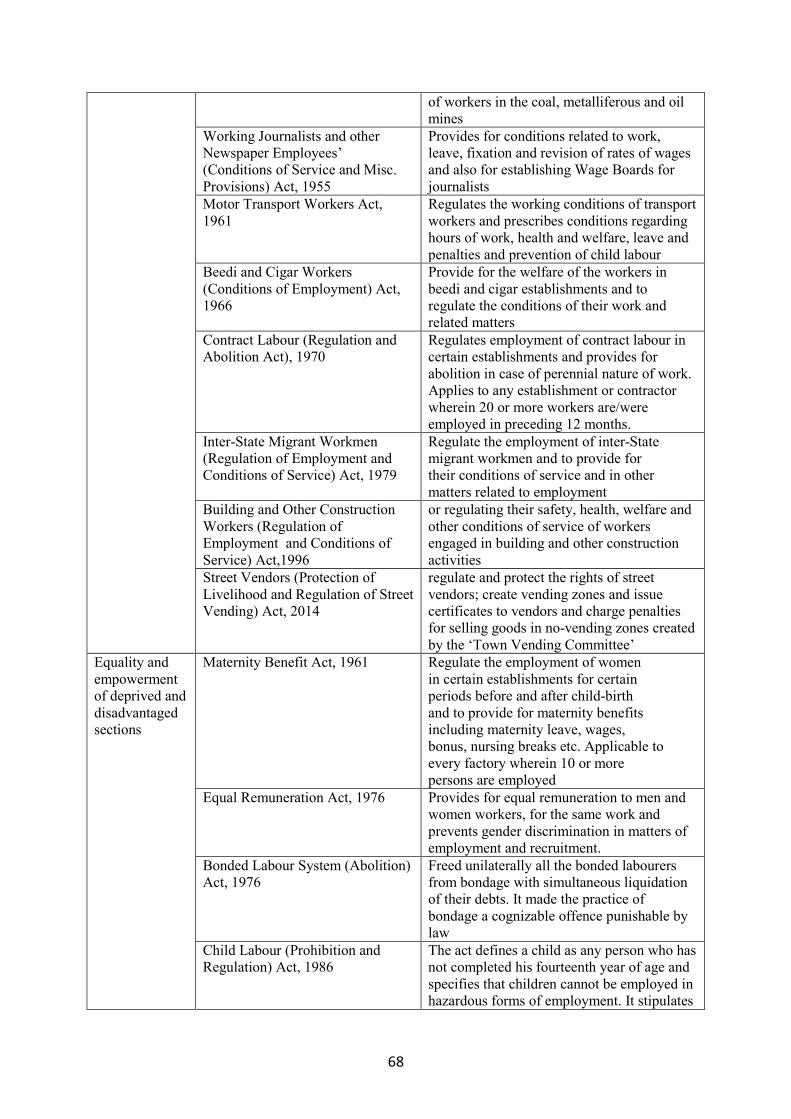
of workers in the coal, metalliferous and oil mines
Working Journalists and other Newspaper Employees’ (Conditions of Service and Misc. Provisions) Act, 1955
Provides for conditions related to work, leave, fixation and revision of rates of wages and also for establishing Wage Boards for journalists
Motor Transport Workers Act, 1961
Regulates the working conditions of transport workers and prescribes conditions regarding hours of work, health and welfare, leave and penalties and prevention of child labour
Beedi and Cigar Workers (Conditions of Employment) Act, 1966
Provide for the welfare of the workers in beedi and cigar establishments and to regulate the conditions of their work and related matters
Contract Labour (Regulation and Abolition Act), 1970
Regulates employment of contract labour in certain establishments and provides for abolition in case of perennial nature of work. Applies to any establishment or contractor wherein 20 or more workers are/were employed in preceding 12 months.
Inter-State Migrant Workmen (Regulation of Employment and Conditions of Service) Act, 1979
Regulate the employment of inter-State migrant workmen and to provide for their conditions of service and in other matters related to employment
Building and Other Construction Workers (Regulation of Employment and Conditions of Service) Act,1996
or regulating their safety, health, welfare and other conditions of service of workers engaged in building and other construction activities
Street Vendors (Protection of Livelihood and Regulation of Street Vending) Act, 2014
regulate and protect the rights of street vendors; create vending zones and issue certificates to vendors and charge penalties for selling goods in no-vending zones created by the ‘Town Vending Committee’
Equality and empowerment of deprived and disadvantaged sections
Maternity Benefit Act, 1961 Regulate the employment of women in certain establishments for certain periods before and after child-birth and to provide for maternity benefits including maternity leave, wages, bonus, nursing breaks etc. Applicable to every factory wherein 10 or more persons are employed
Equal Remuneration Act, 1976 Provides for equal remuneration to men and women workers, for the same work and prevents gender discrimination in matters of employment and recruitment.
Bonded Labour System (Abolition) Act, 1976
Freed unilaterally all the bonded labourers from bondage with simultaneous liquidation of their debts. It made the practice of bondage a cognizable offence punishable by law
Child Labour (Prohibition and Regulation) Act, 1986
The act defines a child as any person who has not completed his fourteenth year of age and specifies that children cannot be employed in hazardous forms of employment. It stipulates
68
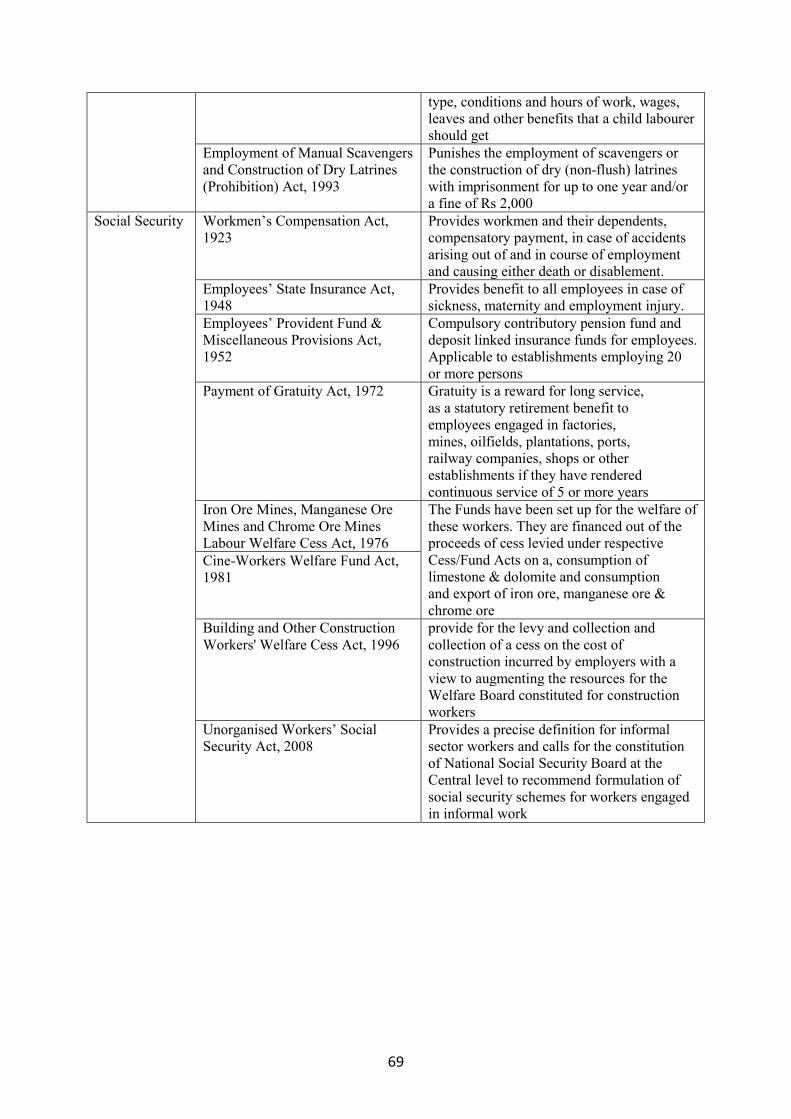
type, conditions and hours of work, wages, leaves and other benefits that a child labourer should get
Employment of Manual Scavengers and Construction of Dry Latrines (Prohibition) Act, 1993
Punishes the employment of scavengers or the construction of dry (non-flush) latrines with imprisonment for up to one year and/or a fine of Rs 2,000
Social Security
Workmen’s Compensation Act, 1923
Provides workmen and their dependents, compensatory payment, in case of accidents arising out of and in course of employment and causing either death or disablement.
Employees’ State Insurance Act, 1948
Provides benefit to all employees in case of sickness, maternity and employment injury.
Employees’ Provident Fund & Miscellaneous Provisions Act, 1952
Compulsory contributory pension fund and deposit linked insurance funds for employees. Applicable to establishments employing 20 or more persons
Payment of Gratuity Act, 1972 Gratuity is a reward for long service, as a statutory retirement benefit to employees engaged in factories, mines, oilfields, plantations, ports, railway companies, shops or other establishments if they have rendered continuous service of 5 or more years
Iron Ore Mines, Manganese Ore Mines and Chrome Ore Mines Labour Welfare Cess Act, 1976
The Funds have been set up for the welfare of these workers. They are financed out of the proceeds of cess levied under respective Cess/Fund Acts on a, consumption of limestone & dolomite and consumption and export of iron ore, manganese ore & chrome ore
Cine-Workers Welfare Fund Act, 1981
Building and Other Construction Workers' Welfare Cess Act, 1996
provide for the levy and collection and collection of a cess on the cost of construction incurred by employers with a view to augmenting the resources for the Welfare Board constituted for construction workers
Unorganised Workers’ Social Security Act, 2008
Provides a precise definition for informal sector workers and calls for the constitution of National Social Security Board at the Central level to recommend formulation of social security schemes for workers engaged in informal work
69
5.3.2 Labour laws as a form of segmentation
Much inequality in the labour market arises from the inherent characteristics of labour laws in the country. Most of these laws are not universally applicable and exclude some groups of workers and establishments from their scope. The legal basis of such segmentation is founded on various criteria like the number of workers employed, nature of activity, direct or indirect terms of employment, on the basis of certain regions and conditions which depend on the income of workers. Coverage of labour laws Labour laws in India are premised on the existence of an employer-employee relationship for a person to be considered as a worker. They often apply to certain sectors of the economy, typically to those legally interpreted as an ‘industry’, this inevitably leaves out a large share of workers who do not qualify for the status of industrial worker. These laws determine the minimum level of employment in an enterprise in various ways as conditions for their applicability, which then excludes vast numbers of smaller establishments. This pre-requisite for legal protection acts as a fundamental source of inequality. Most establishments in the unorganized sector employ less than ten workers and thus fail to make the threshold level for inclusion under law. The workers excluded from the ambit of labour laws are generally regarded as informal workers. Casual workers or contract workers hired by contractors or indirectly hired home-based workers are often excluded from the definition of ‘worker’ or ‘workman’ on the grounds that they have not worked for the minimum eligibility period or do not have a direct employer-employee relation with direct supervision and are thus not considered to have a definite ‘contract of service’ vis-à-vis the principal employer. Such regulations also leave out a large number of self-employed workers who constitute half of the total workforce (Papola, 2012). A few labour laws specify the maximum income level which makes a worker eligible for certain social security benefits; this automatically excluded those who might be getting slightly better wages but in time of contingencies, they are left without any social protection. Hence, there are serious limitations to the applicability of labour laws as the majority of laws apply only to the directly employed. Although some laws cover contract labour, it is not a universal approach.
70

Table 5.3.1: Coverage of Major Labour Laws (as percentage of workers)
Labour Law Eligible as per law Actually covered workers
% of all workers
% of wage workers
% of eligible workers
% of all workers
% of wage workers
Factories Act 3.0 6.6 73.5 2.2 4.9
Shops and Commercial Establishment Act 3.9 8.5 44.7 1.7 3.8
Minimum Wages Act 38.1 83.3 9.3 3.6 7.8
Payment of Wages Act 10.5 22.9 50 5.1 8.2
Payment of Bonus Act 5.2 11.4 60 2.5 5.1
Workers’ Compensation Act 3.3 7.2 20.3 0.7 1.5
Employees State Insurance Act 2.2 4.5 87.5 1.9 4.2
Employees’ Provident Fund Act 3.7 8.1 100 6.6 14.5
Industrial Disputes Act 5.5 12.1 47.6 2.6 5.7
Industrial Employment (Standing Orders) Act 2.7 5.9 49.2 5.1 8.2
Source: (Papola, 2012). Adopted from NCEUS (2009), Pais (2008), Papola and Pais (2007) and Papola, Pais and Sahu (2008).
As table 5.3.1 suggests, while 38.1% workers are eligible under the Minimum Wages Act, 3.3% under Workers’ Compensation Act and 5.5% under the Industrial Disputes Act – only 3.6%, 0.7% and 2.6% of the total workers enjoy this coverage under the respective Acts in reality. This shows that while laws may exist in theory, when applied, they fail to reach a large share of the workforce. Multiplicity of definitions Inequality also emerges due to the lack of uniformity and multiplicity of definitions within the labour law. There are multiple laws with varying definitions of concepts like ‘worker’, ‘employer’, establishment’, ‘industry’, ‘wages’. As a result while some workers are covered under the definitions of some acts, they are excluded from some other important laws. Often, workers complain that while they may be covered under laws dealing with conditions of work, they are often excluded from the scope of laws dealing with social security benefits due to variations in the levels of income (Sankaran, 2007, Papola, 2012). The most persistent criticism of labour laws is that they it makes the labour market inflexible and thereby curb economic growth and employment expansion. This is partly because of the multiplicity of labour laws. The NCEUS Report (2009) observed that “there are too many laws for too few in the organized sector and too few for too many in the unorganized sector”. Labour features in the Concurrent List, i.e. due to the federal nature of the political system, both the Central and State legislatures can legislate on matters related to labour. This gives
71
rise to considerable variation across states on some fundamental issues. Further, many centrally enacted laws prescribe the power of enforcement to the ‘appropriate government’ which gives rise to variations across states in the manner in which these laws are enacted. As a result, certain states are more ‘relaxed’ than others in the application of and compliance with some laws. This has given rise to inequalities and rigidities within the labour market which adversely impacts the balance of power in matters of industrial relations. Recently, the Rajasthan state government has introduced some reforms in labour laws, without consulting unions, to amend three crucial labour laws – the Factories Act, the Contract Labour Act and the Industrial Disputes Act. Until now only factories employing 100 or more workers needed government’s permission to retrench workers, this amendment raises this ceiling to 300 workers. These reforms will make it tougher to register unions as the earlier 15% membership requirement has now been increased to 30%. Such efforts will adversely impact labour welfare and result in decline of unionization. Contractual employment and labour laws There has been a decline in full-time employment and an increase in casual and contractual employment even within the organized sector. Much of the present day employment is characterized by the absence of a clear employer-employee relationship and a high incidence of home-based work, under-employment and lack of regular employment (Unni, 2001). These workers are described as ‘working poor’ who are employed but are not paid minimum wages and who work under precarious conditions. This is one of the primary contributing factors to poverty. These workers generally are unrecognized by labour laws and hence they neither enjoy the rights at work nor access to social security benefits. The Contract Labour (Regulation and Abolition) Act, 1970, empowers the government to abolish contract labour if the jobs are of a perennial nature, but employers oppose this law on grounds that it reduces flexibility. Although this Act prevents the use of contract labour in perennial employment it does not specify what is to become of the workers removed from contractual employment – the Act is silent on the question of whether or not they become part of the principal workforce. Labour laws and the unorganized sector The notion of the ‘informal sector’ was not much used until recently; instead the concept of the unorganized sector was used, as per the Factories Act of 1948, to indicate those establishments that employed less than ten workers. The characteristic feature of this sector was that it was negatively defined as the sector where many legal regulations and labour laws were not applicable. As a result, for many years, the total size of this sector was estimated on the basis of a residual principle. The Report of the National Commission of Enterprises in the Unorganized Sector (2007) proved to be the watershed in this discourse as it, for the first time, laid down a definition for informal workers – now it is the complete absence of social security that defined informal employment. The NCEUS did not distinguish very clearly between the terms “informal” and “unorganized”. For clarity it is better to reserve the term “informal” to the type of employment contract (or rather its absence), and the term unorganized to the type of production unit. On this basis that the Report showed that in 2004-05 86% of all workers were in the “unorganized sector”, but 93% were in “informal employment”; nearly 47% of the organized sector workers were engaged in informal jobs (NCEUS, 2007).
72
High employment sectors like agriculture, home-based work and other activities in the unorganized sector are outside the purview of labour laws because there is no institutional mechanism for resolving disputes or regulating the conditions of work in these sectors. The Second National Commission on Labour in India recommended the creation of umbrella legislation to cover the informal sector and the creation of laws with universal coverage which would also cover the self-employed, who constitute a large section of the workforce. A start to this process was made by the Unorganized Workers Sector Social Securities Act, 2008, but it does not clearly lay down the social security rights to which the workers are entitled, and also failed to create any forum for dealing with grievances. It merely talks of the ‘benefits’ that should be provided to workers but denies them any voice in raising grievances or demanding any benefits (Sankaran, 2012). This is particularly worrisome because this Act was touted as one of the most important laws applied to the unorganized sector. Women and labour laws The law also tends to ignore the work done by women by denying it due status or protection and thus many women workers suffer from exclusion and discrimination (Sankaran, 2007). By not covering the unorganized sector, laws leave out the majority of women workers who are generally employed in this sector. Low priority accorded to women by the law is in part due to the view that home-based work or domestic work does not fall within the formal definitions of work. Only certain home-based work such as rolling ‘beedi’ is recognized under the law. It is possible in principle to extend legal protection to unorganized sector workers like home-based workers by tracing the complex chain of contractors and sub-contractors all the way to the principal employer; however, this is a complicated process which is resisted by employers. Loopholes in the Act In their existing forms, labour laws have several loopholes in their structures which give rise to segmentations and complexities in the labour market. The structure of laws makes them appear as complicated and discouraging, which tends to encourage non-compliance. Ambiguity and lack of precision has often provided employers with opportunities to bypass several provisions under the Act; this has made non-compliance a persisting problem. There is no comprehensive anti-discrimination of law in India prohibiting discrimination in hiring and dismissal on caste or religious grounds. The Constitution prohibits it only in public employment and prohibits the general practice of ‘untouchability’ by private persons also (Sankaran, 2007). On the issue of forming of worker associations and collective bargaining, Article 19 of the Indian constitution grants all Indian citizens the right to form associations or unions and the right to practice any profession, or to carry forward any occupation, trade or business. The Trade Unions Act, 1926, specifies the minimum number of workers required to form a trade union and allows and recognizes political links of trade unions through a provision permitting outsiders to be an office bearer within the union membership. However, India is yet to have any provision in the central law which determines the bargaining agent in an establishment or an industry and has no provision for compulsory recognition of trade unions. Despite being one of the founding members of the International Labour Organization (ILO), India is yet to ratify ILO Convention 87 which guarantees Freedom of Association and Protection of the Right to Organize and Convention 98 which guarantees Right to Organize and Collective Bargaining. A start to the process has been made in Maharashtra with the
73
enforcement of the Maharashtra Recognition of Trade Unions – Prevention of Unfair Labour Practices Act but it is yet to be replicated at the national level. Alternative sources of labour regulations Labour regulations are not limited to labour laws alone, on several occasions certain specific Supreme Court judgments have also acted as benchmark regulations which have influenced the functioning of the labour market. In a major judgment, Gujarat Electricity Board vs. Hind Mazdoor Sabha (1995), the Supreme Court ruled that the employment of contract labour in public sector undertakings was an unfair labour practice and recommended its abolition and the absorption of contract labourers as regular workmen. It further gave labour courts the right to interfere when the contract is a sham and trade unions and others were given the right to pursue the banning of certain types of contract work. In the Supreme Court judgment, The Air India vs. United Labour Union (1996), the court directed that in a process, operation, or other work where contract labour is prohibited, the contract labourers engaged in the process are automatically to be absorbed as regular workers. Subsequently, however, a five-judge constitutional bench quashed this ruling in the case of SAIL vs. United Waterfront Workers (2001). Public interest litigations (PILs) filed by individuals and Non-governmental Organizations (NGOs) have also contributed in providing legal protection to the unorganized sector like in 1980s when the Supreme Court ordered the Delhi government to pay minimum wages to contract workers engaged in Asian Games preparations in Delhi. Non-compliance and Ineffective implementation of laws The extent of contract labour continues to rise despite such judgments. Recent evidence suggests that there has been very low level of inspection and enforcement of labour laws. The Report of the Comptroller and Auditor General of India on Contract Labour Act, for the first time, noted that the government does not conduct any survey for identification of establishments and contractors; instead, it recommended registration of establishments and licensing of contractors on the basis of applications submitted voluntarily by the enterprises or contractors – this made coverage and compliance dependent on self-identification by concerned employees. A fundamental problem with labour laws is that they lack compliance and effective enforcement. Labour laws in India are criticized on several grounds. Employers argue that labour laws like the Industrial Disputes Act, 1947, imposes several rigidities which acts as a deterrent for industrial growth; others argue that India has too many laws which makes labour regulations extremely confusing and cumbersome and thereby give rise to evasion and non-compliance (Pluralist School); yet others argue that the poor enforcement of laws and the contractualization of labour provides the “flexibility” to the labour market. Compliance is worse in scattered and unorganized sectors like in brick kilns, stone quarries etc. Trade unions argue that the political administration is responsible for the ineffective implementation of labour laws at they have on several occasions allowed various types of non-compliance in order to attract investment and promote their own political interests. The costs associated with implementing the laws and maintaining records have often been used as an excuse to keep the unorganized sector outside the purview of labour laws.
74
5.3.3 Conclusion
Labour law has many purposes, but one fundamental purpose is to protect labour from exploitation in labour markets where power is concentrated among employers. Most labour laws however protect only a small segment of the workforce, ironically consisting of workers who have better bargaining potential than the others in the industry (Papola, 2012). Thus, the most exploited and disadvantaged are generally kept outside protective provisions. The argument is often made that small, unorganized enterprises will not be able to meet the cost of compliance – the costs associated with implementation of laws and maintaining proper records have been used as a reason to keep them outside the purview of labour laws. It is argued that laws like Chapter V, Section B of the Industrial Disputes Act which specifies that prior permission from the appropriate government is required before lay-off, retrenchment and closure in the case of establishments employing more than 100 or more workers, and the Contract Labour (Regulation and Abolition) Act, 1970 which prevents hiring of contract workers in ‘core’ activities, give rise to rigidities to the labour market. However, anecdotal evidence suggests that employers have, on many occasions, been able to bypass such provisions. The government has also sometimes facilitated this process through schemes and initiatives like the Learn and Earn Scheme in Maharashtra, Special Economic Zones, etc. Labour laws have been unsuccessful in providing stability and security of employment, wages, and social security benefits to the informal workers. Workers in the unorganized sector work under exploitative conditions without any overtime benefits and are vulnerable to various occupational diseases, accidents and injuries and the labour code has failed to rid them of these insecurities. Differentiated criteria of application tend to divide workers into several categories with respect to job security and social protection. By including or excluding certain categories of workers, labour laws have contributed to the existing inequalities in the labour market. It is for this reason that it is often argued that state regulations are central to the creation of informality in the labour market (Mohapatra, 2005). The state has also quite consciously kept a section of the workforce outside the scope of labour regulation in order to ensure the availability of cheap and flexible labour in order to encourage private investment. Thus labour laws have had a direct influence in labour market inequalities.
5.4 Institutions for job access Inequality in the labour market is manifested in various ways and perhaps one of the more subtle forms of inequality is with regard to access to employment. Not all workers possess equal means of access to the labour market; information related to availability of good jobs and the process for accessing such jobs has historically been a privilege of only a few. Much like employment itself, the institutions and means used for job access are highly segmented into formal and informal, rural and urban, skilled and high-skilled, casual and regular. Historically the labour market has been exclusionary and discriminatory, and never freely competitive (Papola, 2005). Hiring for jobs across all sectors depends on several factors like caste, community, language, regional affiliation, family background, social networks, educational level which together influence employment in public and private sectors, in agriculture, industry and services, in the formal and informal economy and in urban and rural areas. Often workers move away from their place of origin in search of employment, which
75
may have been inaccessible for them in their own regions; thus, migration, both voluntary and forced, is in itself an institution for accessing jobs. It is however true that all these factors are inter-connected and often a combination of these factors together determine the means to access employment. Educational qualification is one of the primary factors influencing the access to jobs; most jobs in the organized public and private sectors specify requirements for educational qualifications. Workers can also be categorized in terms of the differences in access to education and in the levels of education qualifications – in the year 2012, while there are some who have completed secondary school (18.4%), and a small section who have either completed a diploma course or are graduates (1.4 and 8.8% respectively), there is huge chunk of workers who are not literate (31.2%); the rates are further lower for women workers (IHD 2014). However, what is interesting is to note that while a large section of the workforce loses out on jobs due to inadequate and insufficient educational qualifications, even among the educated, there has been an increase in the unemployment rate with increasing levels of education due to the unavailability of suitable jobs. So while on the one-hand, India has large proportions of unskilled labour force, it also has high rates of unemployment among the educated youth due to lack of skill training and unavailability of suitable jobs. The absence of suitable jobs for women workers has resulted in the marginalization of women in the labour market. Women have access to only certain kinds of jobs, most of which are low-skilled and low-paying insecure jobs, due to the presence of strong social institutions like religion and caste which relegate women to the lower rungs of employment. A large percentage of women in India, particularly rural India, are involved in various part-time economic activities along with other domestic care activities which keeps them outside the national sample survey estimates; hence women’s work is highly under-counted and undervalued. In the case of India, caste has historically been a persistent cause for exclusion and discrimination in society; such discriminations have also influenced the nature of segmentation in the labour market. The caste system was based on the principle of purity and pollution which involved the division of people into unequal and hierarchical categories based on social, economic and civil rights. The system of caste divisions gave rise to rigid functional categorization of workers where the untouchables were made to do the physically intensive or unpleasant work – such as cleaning toilets, cleaning clothes, burying or burning the dead of all castes, sweeping the streets, picking up garbage etc. The Indian constitution provided for reservations in government sector jobs, for those belonging to the Scheduled Caste and Scheduled Tribes, as a form of affirmative action adopted to uplift the backward communities. However, such measures were limited to the public sector as the private sector has often strongly resisted any form of reservations – in education, employment or in any other form; they argue that it is against the spirit of free competition.
5.4.1 Institutions for job access in the public sector Employment vacancies in the public sector are generally notified through newspaper advertisements, billboard advertisements, notifications published in the Gazette of India etc. Other than these sources, there are certain specific institutions and factors which also determine the process of accessing jobs in the public sector; these include the policy of reservations and the presence of National Employment Exchanges located in each state for the purpose of channelizing job related information to all sections of the workforce in order to
76
provide equal access to public employment. Public sector jobs are divided into four categories – Class I, II, III and IV depending on the skill requirement at each level. Many of the government jobs, especially the Class I and II tiered jobs can only be accessed through competitive examinations. Reservations The system of reservations in India is a process by which a certain percentage of posts (vacancies) in government institutions are set aside by the government for the members of the backward and under-represented communities – those belonging to Scheduled Caste and Schedule Tribes. It acts as a basis of affirmative action, backed by constitutional laws, with the object of ensuring a “level” playing field for all groups in the society. The policy of reservation set outs a percentage of posts in each category of work in this sector and thus extends to all forms of public employment. This system gives the socially backward communities direct access to employment in the public sector without facing any of the discriminations that are prevalent in the open job market, especially in the private sector. The reservation system has received a mixed response from Indians since its inception; while on the one hand it has been praised for diminishing the gap between the upper and lower castes by allowing the latter to enjoy increased opportunities in jobs, education and governance by allotting seats exclusively for them; it has also been criticized for discouraging a merit-based system and encouraging vote bank politics (see section 6.2 below). Placement exchanges The National Employment Service (NES) was set up by the government of India in 1945 to serve as official information channels on the available job vacancies to potential candidates and to facilitate the process of placement with the employing enterprises and industries without any discrimination on grounds of caste, religion, sex or region. This institution has its roots in the Directorate General of Resettlement and Employment which was set up in 1945, after the Second World War, to provide employment to the released service personnel and other war workers. Post Independence in 1947, the Directorate was given the additional responsibility of resettling the large number of people (refugees) displaced by the country’s partition. In early 1948, it was decided that the Employment Exchange was to be open to all categories of workers in search for employment; thus, the Employment Service (NES) was transitioned into an all-India placement organization. In 1956, the day to day administration of the exchange was handed over to the state governments, which made it the joint concern of the Central and State Governments, just like other matters related to employment. It was decided that the role of the Central Government would be to formulate national policies, standards and procedure which are to be followed by the Employment Exchanges in the states, coordinate their work, formulate programmes for expansion and development of the services, and train staff. On the other hand, the State Governments had full control over all other functional aspects of the Employment Exchanges in their respective states. In 1959, The Employment Exchanges Compulsory Notification of vacancies Act was enacted by the Parliament; it came into existence in 1960. The Act aimed to protect the rights of those seeking employment and to make sure that there was no partiality involved in providing jobs to the deserving candidates. Under the provisions of the Act all the establishments in the public sector and all the establishments in the private sector normally employing 25 or more workers are required to notify their vacancies and also render quarterly and biennial returns to the Employment Exchange of their area. These exchanges were to act as an inclusive
77
organization which would cater to the various categories of workers by providing every worker the equal access to information and processes of hiring. However it is primarily concentrated in the public sector as the private sector has mostly refrained from providing notification to the exchanges. The significance of the NES has been reduced due to several factors like the decline in scope of the public sector to provide jobs, the emergence of large number of private recruiting organisations and the general reluctance of the private sector to notify its vacancies and recruit through the NES. The growth of informal employment has further rendered the NES as ineffective. Thus, there is a need to restructure and strengthen the agency to maintain a proper database of vacancies and qualifications of potential workers and to provide proper guidance for employment in both formal and informal sectors. It can however be credited for bringing about some change in the system of recruitment in the organized sector; it has, at least in theory, generated a shift from the traditional chaotic, highly personalized and unfair system towards one with some degree of orderliness, impersonal methods without any apparent discriminations.
5.4.2 Institutions for job access in the private sector In case of the private sector, it is well known and well documented that the recruitment process has been highly informal and personalized with factors like caste, community, language and regional affiliations influencing the process of hiring more than other factors like merit (Papola, 2005). Information on job opportunities have been inaccessible to workers in general and a privilege of a few insiders in private industries, which made the process of recruitment like what many scholars called a “closed shop” – which basically meant that in order to enter the labour market one must have somebody known or related working inside it. System of referrals Various studies of factory workers, conducted at different points of time, by different scholars have shown that the channels of information and routes of recruitment were mostly personalized and that it has hardly changed over time. A study of factory workers in Poona, conducted by Richard Lambert during 1959, found that 72 per cent of the workers used ‘informal’ channels for securing jobs (Lambert, 1963). Another study conducted during 1971-72 in Ahmedabad, covering a sample of 1000 workers, found that around 69% of workers got jobs through personalized sources like referrals from friends, family and neighbours (Papola and Subrahmanian, 1975). In more recent times, many of the industrial sectors like Information Technology (IT) and IT-enabled services, telecom industries, etc have shown a preference for this system (Pradeep, 2012). These sectors have also gone a step further by awarding incentives to their existing staff for providing referrals to fill any internal vacancies. As the Chief Human Resource Official of a telecom service provider puts it, “Referrals help shorten the due diligence process as compared to other modes…candidates have a fair amount of background knowledge about the company and it is easier to get people with right skills and experiences in relatively shorter time (ET, 2013)”. Thus employers generally prefer to use the system of referrals by employing workers known or related to their existing workforce, this makes it difficult for the entry of others into the labour market. There are no precise data available to determine the exact social composition of these “insider” groups who possess the job information and influence the hiring decisions, but as
78
some scholars suggest, it would be reasonably safe to assume that the persons providing these referrals belong to the socially better endowed sections (Papola, 2005) System of “jobbers” and contractors The system of “jobbers” and contractors was very widely used as another means for hiring workers in the early years of industrialization. Various manufacturing plants and industrial centres like the textile mills in Bombay made use of this system for procurement and recruitment of workers at low wages. The jobber – also called sirdar, jamadar, mistri in different regions – was in fact an employee of the factory who was assigned the dual task of procuring workers and of supervising and disciplining them in accordance to the requirement of the factories. It is believed that it emerged out of the historical need to have a local person from working class background to supervise and discipline the workers (Morris, 1965). Since the onus of recruiting workers was solely on them, the “jobbers” tended to favour their family and caste brethren; they usually went back to their own villages and recruited workers either from among their family networks or from their own religious and social groups. Hence, the individual biases automatically influenced the process of hiring and the system proved to be personalized and discriminatory. This system however gained predominance across industries and especially in the informal economy in the low skilled manufacturing sector and especially in the construction industry which always required a lot of mobile labour at low wage rates. This system however soon needed replacement because the “jobbers” emerged as a threat to the employers due to their control over the workers. In its place, the system of Labour Contractors emerged; these contractors would engage in the same process of hiring workers with the difference that they were not required to go back to their villages but instead could hire workers from the local workforce. However, in reality, many of these contractors go back to their villages and bring workers from among their informal networks and social groups. The system of contractors is predominantly used in the unorganized sector which is characterized by several tiers of sub-contracting where it is often difficult to identify the principal employer. Hence, workers mostly consider their contractor to be their employer and are often unaware of the fact that he is merely sub-contracting the work to them. Placement agencies Just like for the public sector, the National Employment Exchanges are also functional in the private sector as all establishments employing more than 25 workers are required to inform the Exchange in case of any vacancies. However, the Exchange has failed to be effective in the private sector as most private sector enterprises ignore this directive and continue to fill their vacancies through informal means. A recent development has been the emergence of placement agencies managed by private entrepreneurs and voluntary associations. In the past few years, there has been a quick expansion of these agencies in small towns and metropolitan cities. In a study carried out on placement agencies for domestic workers in the informal sector (Neetha, 2009), the writer points out that such agencies serve as an intermediary between the worker and the employer and differ in their objectives; this is reflected in the form of variations in terms of the conditions imposed on the employer and of the services offered to the workers. The range of services provided includes hostel facilities (for both prior and in-service periods), soft–skill and vocational training, etc. In return, the agencies charge a considerable portion of the
79
workers’ earnings during the initial months or in some cases for every month, as brokerage expenses, transportation costs, accommodation and food charges. These agencies are responsible for providing employment to workers belonging to socially backward communities as they follow an inclusive approach which helps in mobilizing large sections of tribal populations who have limited sources of job access. They mostly rely on agents and middlemen who make visits to village areas and persuade individuals to come to the towns and cities for work. The jobs provided are generally informal like in domestic work, home-based work, courier services, house-keeping services, security guards etc and a large chunk of their membership consists of women workers who are otherwise relegated to low-skilled, low paying employment. Such agencies are not homogenous identities and differ in terms of their formal status, size, nature of operations, objectives and the services offered to the employers and workers. While there are some agencies which have more or less defined terms and conditions of placement and enforcement and well organized structure; there are others which operate as informal arrangements but vary in terms of the degree and parameters of informality. Placement agencies acquire “formality” when they are validated by a legal or social structure which guides their existence and working. They may be either registered or supported by a trade union, like many of domestic workers’ placement agencies which are supported by the Self Employed Women’s Association (SEWA), or by cooperative societies and voluntary organizations or by religious organizations. In such cases, the registration of the parent organization, under the Trade Union Act or the Society’s Act, is considered as a registration for placement also. Other informal mechanisms Other informal mechanism used in the private sector include online job searches, billboard advertisements, social networking sites etc which have gained much popularity among the urban youth in accessing employment opportunities across different occupational sectors. Internet based job search portals and websites have emerged as modern avenues for job search. Post the internet revolution, online job search portals have become the most popular means for directly accessing job opportunities. Company websites, online job advertisements, etc have made it easier for the educated, internet literate individuals to directly acquire information and access the hiring/recruitment process for all types of employment opportunities across the labour market. The spread of Internet services has given rise to greater connectivity among people through social networking websites which has helped individuals in forming networks and building informal linkages through mutual contacts across regions among different socio-economic groups. Social networking websites like LinkedIn, Facebook, Twitter, etc have also become popular means for accessing jobs. While earlier information related to jobs was highly restricted, with the expansion of technological literacy, many companies have used such channels for disseminating information related to vacancies and required qualification levels for each of them. As a mainstream newspaper reported (2013), in most of the IT and IT-enabled service sectors, telecommunication sectors and other industrial sectors, internet based direct hiring channels were used for hiring approximately 70 to 90 per cent of the workers. It further added that employers have shown preference for such services because it has helped them in hiring the most suitable employees and at the same time proven to be cost-effective by bringing down the dependence on expensive Human Resource consultant firms for
80

recruitments. At the same time, this may be another source of labour market segmentation, for it excludes a large section of the workforce who lack the technical capabilities and internet access. Another means for accessing employment, especially for a large section of the educated youth, is through Placement Weeks organized by some of the higher educational institutions in the final year of their course. The Placement Weeks serves dual interest – while it serves the interest of the employers who are able to hire some of the country freshest and most educated youth into their companies; it also offers the youth the opportunity to access the hiring process of some of the biggest companies and industries of the region. Most of the high-ranked Technological and Management institutes like the IITs and IIMs and many of the professional institutes arrange for such placement weeks. Large sections of the educated youth are hired through this process. Hence, a wide range of means are used for accessing employment opportunities in the private sector; workers have often resorted to using one or more of these institutions to gain information with regard to employment opportunities and the process of hiring/recruitment. In some cases, private companies prefer to provide internships and apprenticeships to workers in order to train them; this often acts as a means for jobs access. Rural areas The system of job access differs between rural and urban areas. In the rural areas, especially in agriculture, employment has been primarily driven by family background and informal networks. In rural areas, labour for agriculture and other related activities is generally found within the family or among friends and relatives living in the same village. Agricultural land is one of the most valued sources of family wealth and it passes from one generation to the next. This makes the family farm an important reference point, where labour usually comes from within the family networks and extends up to friends, neighbours and co-villagers. It is also strongly influenced by ties of caste, community and language as rarely does one find a complete stranger being employed to do agricultural work. Of course, there are strong divisions on the basis of gender and caste discrimination, by which the low-skilled work and ‘dirty’ physically intensive work is relegated to the women and low-caste workers respectively. Government programs in rural areas like the MGNREGA, which guarantees 100 days of employment to all rural labourers, has been helpful in reducing these inequalities in access to rural work. MGNREGA has been credited for providing employment large section of women workers in rural areas who are otherwise have limited access to work and are paid extremely low wages; however the work guaranteed under this scheme is mostly low-skilled and physically intensive in nature. Migration But of course, most young rural residents, the men at least, look beyond the local labour market. The process of migration by workers in search for employment and better income is a form of institutional access to employment. Much job search involves migration from rural to urban areas, and between urban areas, in search of better employment and better income earning opportunity. This process also has strong institutional dimensions, for workers generally move from rural to urban areas on the basis of information from workers who were already working in the urban labour market; these workers would either be a relative, friend, a co-villager or a contractor. Destinations for migration are usually dependent on job information and on the presence of someone in the town or city on which the migrant worker
81
could depend on. Over the years, movement of labour from village to the city becomes more regular and spontaneous. Often particular niches in local urban labour markets or enterprises come to be largely occupied by workers from one village or area. This process has been used by all segments of the workforce to seek employment across the various categories of employment in the labour market at the local, regional and national level. But, like other institutions, it tends to fragment labour markets around particular networks.
5.4.3 Evaluation of various institutions Despite the existence of formal institutions, informal mechanisms are more popularly used to recruit labour because the formal ones either are not adequate or are costlier. Employment exchanges have failed to provide employment to large sections of the unemployed workforce; this has partly been because of the employers' preference to use informal channels that they are able to control more directly. In the informal system of recruitment, the worker or the contact that introduces or recommends the new recruit assumes the responsibility of ensuring the quality and attributes of the worker; such a system is preferred by the employer because it generally reduces the risk of indolence, misbehaviour and protest. The system of NES has not been very effective in providing employment. It may be noted that registration of unemployed persons, is not compulsory under this system; at the same time, those already employed also often register, hoping to secure better jobs. Placements are not always made out of the candidates recommended by exchanges against notified vacancies on the plea that they are not suitable, which is sometimes the fact, but quite often only a pretext to appoint persons of the employer's own choice (Papola, 1992). In the period between 1990 and 2001, the majority of the job seekers, (63.6%) were inexperienced freshers and did not fall in any category of occupation, (22.2%) were in the production and transport related work, and a small group (0. 7 lakh), were in the sales workers groups (GoI-MoL&E, 2002). The phenomenon of concentration of workers from the same village, region, caste, community and linguistic group in particular sections and departments of factories and mills that has been observed in the past, and continues even today, is primarily a result of the attempt to corner the economic benefits of scarce jobs for one's own people (Morris,1966). The system, however, is inequitable and unfair in so far as it limits access to jobs to only a few groups. Though the situation seems to be changing with the spread of education and training and many of the new industries resort to formal channels of recruitment for hiring the high skilled workforce, the large category of unskilled and semi-skilled jobs continued to be filled by informal mechanisms.
5.5 Labour market structure and segmentation
5.5.1 Labour market structure from Independence to the 1980s At the time of Independence, India’s economy and society was overwhelmingly rural. Nearly 85 per cent of the people lived in villages and derived their livelihood essentially from agriculture. Out of 140 million workers, only 3 million were working in modern industry (Vaidyanathan, 1983).
82

As discussed in section 3, in the early period after Independence there was a considerable emphasis on growth in large scale industry, much of it in the public sector. Industrial output grew at 7 per cent per year between 1950 and 1965, and this led to a fairly substantial rise in organized sector employment (from 9 million in 1956 to 15 million in 1971)(Lahiri, 1969). But since the growth in industrial employment was concentrated in larger scale manufacturing, rather than in small and medium firms, and was starting from a small base, total employment in industry rose very slowly as a share of employment a whole, from 10.6 per cent in 1951 to 11.5 per cent in 1971 and 13.5 per cent in 1981 (Census data)(Nagaraj, 2012). Much of the growth in industry was in the public sector, which grew from 7.5% of GDP in 1950-51 to 14.2% in 1970-71, the increase being shared evenly between government administration, with the growth of the bureaucracy, and public enterprises. Table 5.5.1: Share of Employment (UPSS) by Industry (at one digit level): 1951-2011/12
Sector 1951 1961 1971 1972-
73 1981 1983 1993-
94 2004-
05 2011-
12 Agriculture & Allied Activities
72.4 71.9 72.0 73.9 68.8 68.6 64.0 56.3 48.9
Mining & Quarrying 0.5 0.5 0.4 0.6 0.6 0.7 0.6 0.5 Manufacturing 9.5 9.4 8.9 11.3 10.6 10.6 12.3 12.8 Electricity 0.2 0.3 0.2 0.4 0.3 0.4 0.3 0.4 Construction 1.5 1.4 1.8 1.6 2.3 3.2 5.7 10.6 Total Secondary Sector 10.6 11.7 11.5 11.3 13.5 13.8 15.0 18.8 24.4 Trade, Hotels & Restaurants
4.7 5.0 5.1 5.5 6.3 7.6 10.9 11.5
Transport, Storage & Communication
1.8 2.4 1.8 2.7 2.5 2.9 4.1 4.4
Financing, Real Estate & Business Services
0.1 0.2 0.5 0.2 0.7 1.0 1.7 2.6
Community, Social & Personal Services
7.7 5.7 7.4 7.4 8.1 9.6 8.2 8.2
Total Tertiary Sector 17.0 16.4 16.5 14.8 17.7 17.6 21.1 24.9 26.7 Total 100 100 100 100 100 100 100 100 100
Source: Institute for Human Development, 2014; based on various rounds of NSS data on employment and unemployment. 1951 to 1971 and 1981 from Nagaraj (2012), and from Census data, not fully comparable. The counterpart to slow growth in industrial employment was that agricultural employment as a share of all employment hardly fell, according to Census data. It was 72 per cent in 1951 and still 72 per cent in 1971, although it then declined to 69 per cent in 1981 (table 5.5.1 – Census data). Among agricultural workers, the majority were self-employed, mostly as small peasants. The share of agricultural labour rose from about 20 to 25 per cent of all workers by 1971, and then stabilized. Agricultural wages were stagnant throughout the period. In the decades after Independence, then, the dualistic foundation of the Indian economy was maintained, indeed probably strengthened because of the emphasis on urban and industrial growth. But although the overall picture appears to be one of stagnation, in reality there were major structural changes under way in the countryside, with an impact that was only fully felt after 1980. During the 1960s and 1970s rural labour markets were developing in much of India, in the sense of markets in which labour was free to move between jobs, and wages responded to
83

supply and demand. At the time of Independence, feudal and semi-feudal relations of bondedness and unfreedom were widespread (Bhalla, 1992). But by 1983 such relations only affected a minority of rural workers: only one fifth of regular employees were not free to change employers and only eleven per cent were not getting locally prevalent wages, though this varied a great deal across the country (it was much higher in Bihar, but very low in Kerala). Combined with the fact that over half of rural labour households were without land, this was an indicator of the development of a large scale casual wage labour market (Bhalla, 1992). It also meant that workers were free to migrate, with implications for the pace of urbanization and the growth of non-agricultural employment. While various forms of constraint and exploitation persisted, and persist to this day in some parts of the country, an increasing proportion of rural workers had alternative options. In urban areas, studies of labour markets were beginning to show clear patterns of inequality. Harriss (1989) summarizes several such studies in Bombay, Ahmedabad, Calcutta and Coimbatore. It was clear that simple dualistic models were not enough to capture the structure of the urban labour market: a wider concept of segmentation was needed. There was a minority of “protected” workers, consisting mainly of government workers and a stable, largely industrial workforce, which was increasingly unionized. Their advantages were not mainly the result of union activity, but rather because the stability of a core workforce was also an asset for employers, as it helped to maintain productivity and wages. But this industrial proletariat was small in relation to employment as a whole. At the same time, studies in several cities suggested that labour market segmentation in urban areas was intensifying. Deshpande (1979) showed that employment in unregistered manufacturing and construction (which included a substantial proportion of casual workers) was expanding fast in Bombay, though organized sector employment was growing as well. In Coimbatore too industrial growth was associated with sharp divisions in opportunities and incomes between different parts of the labour market (Harriss, 1989). The main point was that there was very little mobility of workers from one labour market segment to the other. It was for example very difficult to move from casual wage work or self-employment into regular employment. Similar differentiations could be found in Madras and Calcutta. In Calcutta, Bardhan’s (1989) analysis of the 1977-78 NSS showed that different labour market situations (self-employed versus wage work, regular versus casual), were closely associated with differences in consumption levels and wages. These segmentations obviously were not new. But the pattern of growth was reproducing them, and strengthening the overall pattern of differentiation. In the 1970s, the literature on the informal sector was expanding rapidly, and these urban labour market studies of course reflected that literature. But they also showed that a dualistic model was not enough, because there were multiple segments in the labour market, in which workers had greater or lesser degrees of protection and vulnerability. The distribution of workers across these different labour statuses connects the functioning of the labour market with overall outcomes in terms of inequality.
5.5.2 1980 to the present As we saw in section 4, in the 1980s the rate of growth of the Indian economy picked up, averaging 5.6 per cent in 1981-91 compared with 3.6 per cent in 1967-80. At the same time, for the first time there was a sustained rise in real wages of casual workers; real wages for this category rose by about one third between 1983 and 1993-4. But there was little sign of any substantial impact of economic growth on labour market structure. The share of industry increased, but this was mainly because of growth in construction, where casual wage labour
84
predominated. The other sectors whose share increased were trade, much of it marginal self-employment or casual wage labour, and community and personal services, a mixed category which included domestic workers but also government employment. And the fragmentation of urban labour markets continued. Growth of employment in the organized factory sector came to a halt (Jose, 1994), and since industrial employment continued to rise this must have been concentrated in unorganized enterprises and casual employment. In rural areas the shift away from agriculture continued, with a decline in employment of over 5 percentage points between 1977-8 and 1987-88, of which about 3 percentage points was a move into casual non-agricultural wage employment (Papola, 1994, table 2). And at the all India level, a comparison of 1993-4 with 1983 suggests stability in labour market structure or a slight deterioration, in that the share of regular wage employment dropped a fraction, and casual wage labour increased (table 5.5.2).
The situation in urban labour markets was illustrated by more detailed work in Coimbatore in the late 1980s (Harriss et al, 1990), which identified a variety of labour statuses, varying from regular, protected workers to marginal self-employed. There was a strong relationship between labour status and income status. Poverty was concentrated among unprotected, irregular or casual wage workers, the marginal self-employed and the unemployed; whereas there was little poverty among protected and regular workers, and among the self-employed with some capital (distinguished from the marginal self-employed on that basis). It might be supposed that the economic reforms would have led to a larger change in labour market structure, since there was a substantial acceleration in growth rates, reaching almost 7 per cent per annum in the period 1993 to 2010, and larger changes in economic structure with a sharp decline in the contribution of agriculture to GDP. But this was not the case. In fact, labour market structure changed surprisingly little in the 1990s and 2000s, at least in terms of the by now conventional categories of regular and casual work. Regular employment edged up from 13.2 per cent in 1993-94 to 14.3 per cent in 2004-05 and then jumped to 17.9 per cent in 2011-12 (table 5.5.2). But less than 40 per cent of this regular employment was “formal” in nature (i.e. with an employment contract and legal protection), so that formal, regular, protected work still amounted to less than 7 per cent of employment in 2011-12. Meanwhile, self-employment fluctuated around a slowly declining trend in the economy as a whole, while casual employment also fluctuated but with no significant long term trend. Self-employment remained surprisingly high – even in urban areas 42 per cent of employment was self-employment, with no sign of any decline even in 2011-12; the decline, such as it was, was in agriculture. Overall it can be said that the share of the organized sector rose but the quality of employment in the organized sector decreased - the share of informal workers in the organized sector rose from 41 per cent 1999–2000 to 58 per cent by 2011–12. As in the 1980s, the most striking change was in fact rising real wages, in both agriculture and other sectors, and in both regular and casual employment. Indian labour markets are of course segmented by sex as well as in other dimensions. Table 5.5.2 shows that in general, women are less well represented in the “good” jobs (regular or organized sector work), and more likely to be found in casual wage employment or self-employment than men (and much self-employment is in reality unpaid family labour). However, there is some sign in table 5.5.2 that the gap is narrowing. For instance, the share of economically active women in regular wage employment increased from 5.4% to 12.7 over the period 1983-2012, while the share of men rose less, from 17.7% to 19.8. However, as we note in section 7.1 on gender inequality, the overall participation of women in the labour force declined.
85
The main culprit for the rather poor employment outcomes is usually taken to be the “jobless growth” in the organized sector. How far this is an accurate observation is unsure. Certainly, the data on employment in organized industry show a decline until the mid 2000s, before starting to rise slowly. But this is also a period when outsourcing and the use of contract labour grew, and this – generally lower quality – employment is certainly underestimated in the industry level statistics. The growth in “informal” employment in the organized sector, noted above, supports this view. On the other hand, it is clear that public sector employment fell steadily from the 1990s on, and since this is counted as part of the organized sector the decline in public employment is one major explanation for the failure of organized sector employment overall to rise. By 2011-12 agriculture accounted for less than half of all employment, but the sectoral pattern of non-agricultural employment did not, on the whole, favour quality employment. The share of manufacturing had risen only two percentage points in almost 30 years. The large gains were in construction (8 percentage points) and trade (5 percentage points), sectors with a high proportion of casual work or – in the latter case - low productivity self-employment. The much-vaunted high tech sector is not visible in the figures in table 5.5.1 – it is probably divided between communications and business services – but it is clearly not making much of an impact on the overall employment figures. Segmentation of the labour market shows up in wage differentials, an important driver of overall inequality. There are large and persistent differences in wages between regular and casual work and between rural and urban areas. Since the economic reform, however, these gaps have not widened, on the whole; rural wages have been growing faster than urban, and casual faster than regular in rural areas. There is also a persistent gender wage differential of between 20 and 50 per cent (IHD, 2014), but this too has been declining, especially in casual work. On the other hand, the overall Gini coefficient of wages rose, from 0.48 in 1983 to 0.51 in 1993-94 and 0.54 in 2004-05, but it then fell back to 0.51 in 2011-12. That suggests that the regular-casual, rural-urban and male-female differentials do not capture the main changes. And indeed, more detailed investigation shows that there are other wage differentials that are widening substantially: between managerial/supervisory workers and production workers in organized industry, which have risen sharply since the mid 1990s, after remaining relatively constant since the early 1980s (IHD, 2014); perhaps more generally between more and less skilled workers; and between public sector and private sector workers as a result of the awards of successive pay commissions. The wages of public sector employees have risen by 190 per cent (in current prices) since 1993-94, while the wages of regular private employees have risen by only 70 per cent (IHD, 2014). In general there is evidence that wages and earnings are rising much faster at the very top of the income hierarchy, a change that is not picked up by NSS expenditure surveys. So although the aggregate figures suggest that there has been only a small increase in inequality in the post-reform period, there is reason to believe that more substantial changes are occurring. But they are not adequately captured by existing data sources. Another important change concerns the occupational structure. In 1983 68 per cent of workers were still “farmers, fishermen, hunters, loggers and related workers”, 16% were production workers and unskilled labourers, and only 6.5% were white collar workers (professional, technical, administrative, managerial, clerical, etc). By 2009-10 the agricultural category was down to 52%, production and related workers had risen somewhat to 23%, but the white
86

collar group had jumped to almost 15%. There is clearly a substantial structural change here which merits further investigation, with considerable implications for inequality.
87
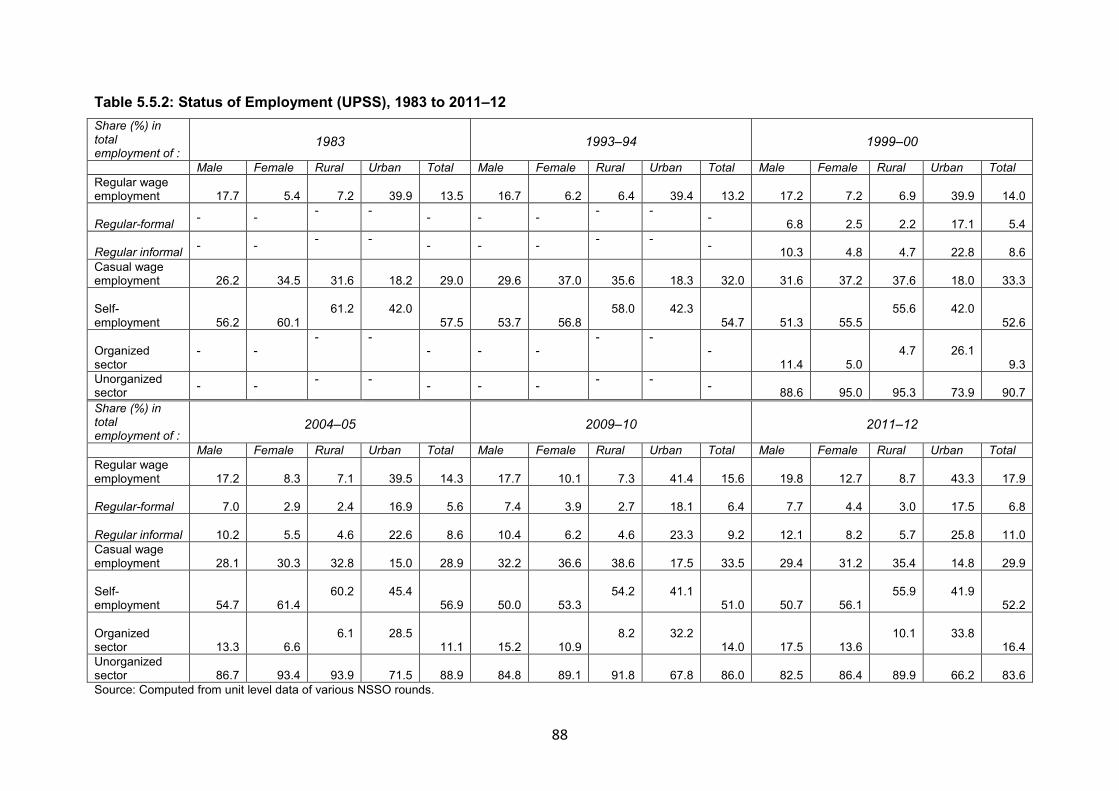
Table 5.5.2: Status of Employment (UPSS), 1983 to 2011–12
Share (%) in total employment of :
1983
1993–94
1999–00
Male Female Rural Urban Total Male Female Rural Urban Total Male Female Rural Urban Total Regular wage employment 17.7 5.4
7.2
39.9 13.5 16.7 6.2
6.4
39.4 13.2 17.2 7.2
6.9
39.9 14.0
Regular-formal - - - - - - - - - - 6.8 2.5
2.2
17.1 5.4
Regular informal - - - - - - - - - - 10.3 4.8
4.7
22.8 8.6
Casual wage employment 26.2 34.5
31.6
18.2 29.0 29.6 37.0
35.6
18.3 32.0 31.6 37.2
37.6
18.0 33.3
Self-employment 56.2 60.1
61.2
42.0
57.5 53.7 56.8
58.0
42.3
54.7 51.3 55.5
55.6
42.0
52.6 Organized sector
- - - -
- - - - -
- 11.4 5.0
4.7
26.1
9.3 Unorganized sector - - - - - - - - - - 88.6 95.0
95.3
73.9 90.7
Share (%) in total employment of :
2004–05
2009–10
2011–12
Male Female Rural Urban Total Male Female Rural Urban Total Male Female Rural Urban Total Regular wage employment 17.2 8.3
7.1
39.5 14.3 17.7 10.1
7.3
41.4 15.6 19.8 12.7
8.7
43.3 17.9
Regular-formal 7.0 2.9
2.4
16.9 5.6 7.4 3.9
2.7
18.1 6.4 7.7 4.4
3.0
17.5 6.8
Regular informal 10.2 5.5
4.6
22.6 8.6 10.4 6.2
4.6
23.3 9.2 12.1 8.2
5.7
25.8 11.0
Casual wage employment 28.1 30.3
32.8
15.0 28.9 32.2 36.6
38.6
17.5 33.5 29.4 31.2
35.4
14.8 29.9
Self-employment 54.7 61.4
60.2
45.4
56.9 50.0 53.3
54.2
41.1
51.0 50.7 56.1
55.9
41.9
52.2 Organized sector 13.3 6.6
6.1
28.5
11.1 15.2 10.9
8.2
32.2
14.0 17.5 13.6
10.1
33.8
16.4 Unorganized sector 86.7 93.4
93.9
71.5 88.9 84.8 89.1
91.8
67.8 86.0 82.5 86.4
89.9
66.2 83.6
Source: Computed from unit level data of various NSSO rounds.
88
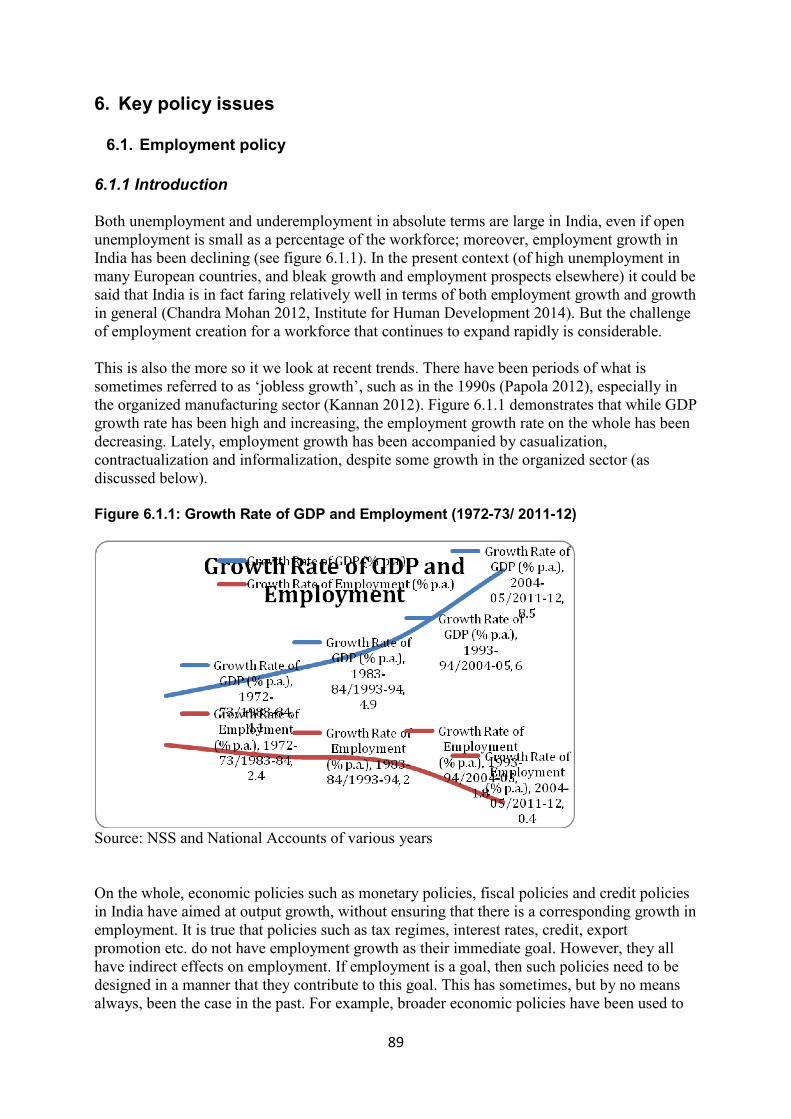
6. Key policy issues
6.1. Employment policy
6.1.1 Introduction Both unemployment and underemployment in absolute terms are large in India, even if open unemployment is small as a percentage of the workforce; moreover, employment growth in India has been declining (see figure 6.1.1). In the present context (of high unemployment in many European countries, and bleak growth and employment prospects elsewhere) it could be said that India is in fact faring relatively well in terms of both employment growth and growth in general (Chandra Mohan 2012, Institute for Human Development 2014). But the challenge of employment creation for a workforce that continues to expand rapidly is considerable. This is also the more so it we look at recent trends. There have been periods of what is sometimes referred to as ‘jobless growth’, such as in the 1990s (Papola 2012), especially in the organized manufacturing sector (Kannan 2012). Figure 6.1.1 demonstrates that while GDP growth rate has been high and increasing, the employment growth rate on the whole has been decreasing. Lately, employment growth has been accompanied by casualization, contractualization and informalization, despite some growth in the organized sector (as discussed below). Figure 6.1.1: Growth Rate of GDP and Employment (1972-73/ 2011-12)
Source: NSS and National Accounts of various years On the whole, economic policies such as monetary policies, fiscal policies and credit policies in India have aimed at output growth, without ensuring that there is a corresponding growth in employment. It is true that policies such as tax regimes, interest rates, credit, export promotion etc. do not have employment growth as their immediate goal. However, they all have indirect effects on employment. If employment is a goal, then such policies need to be designed in a manner that they contribute to this goal. This has sometimes, but by no means always, been the case in the past. For example, broader economic policies have been used to
89
promote/create more labour-intensive industries such as Small and Medium Enterprises (SMEs), and have been used to promote more labour-intensive exports. But on the whole, broader economic policies have paid at best lip service to employment goals. Employment has been seen as an additional focus, which has mainly received attention through special employment programmes such as the National Rural Employment Guarantee Scheme (NREGS), or special self employment programmes, some of them having considerable financial allocation and resulting in widespread impact. These programmes are discussed in section 6.1.3. 6.1.2 Five-Year Plans and employment policy: 1950s till the present13 Phase I (1950 till 1966): Employment; only a Long Term Growth Generated Objective At the time of independence approximately 76 per cent of India’s workers were engaged in agriculture, about 12 per cent in manufacturing and another 12 per cent in the services sector. India borrowed Russia’s planning model (Five year plans, FYPs), the first of which was developed for the period 1951-1956. Social and economic policy directions, including those relating to employment have largely been spelt out in these plan documents. In the period covering the first three FYPs, employment was viewed as a problem related to the ‘shortage of capital’ and not of excess supply of labour. Prevalence of forms of disguised unemployment and underemployment, were recognised largely in India. As a response, the First plan advocated a multi-pronged strategy: for the rural areas it suggested measures for improving irrigation, land reclamation, rural industry, old handicrafts, mixed farming and public works programmes. In order to tackle the issues of employment among the skilled workforce, it suggested expansion in new industries (both large and small scale industries). With respect to the unskilled workforce, it suggested expansion in trade and services. The conflict between capital formation and employment creation was recognised by the Second Five Year Plan (1956 – 1961). It also also recognized that ‘full employment’ could not be a short-term goal. Instead the plan focused on arresting the growth of unemployment. It advocated the use of labour intensive techniques, especially in agriculture but also in small-scale manufacturing of consumer goods. At the same time it accepted mechanization in heavy industries and in places where it would replace arduous physical labour. Following from the second plan, the Third Plan (1961-1966), recommended labour intensive techniques in areas such as construction, in order to compensate for mechanization in heavy industries. It suggested that in the short-run the attempt should be to absorb only the new labour market entrants (and the backlog of employment should be addressed only in the long-run). It also proposed the first post-independence rural works programme of India. As such during this period no direct measures were undertaken to increase employment. It was assumed that industrialization, high growth and growth of SMEs would be able to address the gap. Till the mid-1960s, there was a high growth rate as well as industrialization, however after the mid-1960s, the rate of industrialization declined and economic growth slowed down until the 1980s.
13 This section has been summarized and adapted from the work of T.S. Papola. Kindly refer to Papola (2013b)
90

Phase II (1966 till 1990): Employment Generation for Poverty Reduction By the late 1960s doubts regarding the efficacy of the strategy of heavy industrialisation to generate employment had started growing and by the start of the 1970s the realisation of the existence of large-scale poverty had dawned. As a result the period was marked by a sense of urgency to create employment with a view to reduce poverty. Anti-poverty special employment programmes became a prominent feature of five-year plans during this period. In the Fourth Five Year Plan (1969-1974) itself while emphasis on use of labour intensive techniques in both agriculture and industry was laid, its focus was more towards direct employment programmes and other sectors. Agricultural growth was expected to contribute to employment generation and address underemployment. The plan noted the immense scope (of employment generation) in sectors such as construction, village and household industries and transport infrastructure. At the same time, the need for a greater understanding of the employment situation was felt and the Dantwala Committee/Committee of Experts on Unemployment was set up in the first year of the fourth five year plan, 1969. During this time it became clear that economic growth on its own was not sufficient for well-being and owing to slow growth, and increasing population, the unemployment situation was becoming serious. It was felt that special employment programs for both wage employment and self-employment were required, to generate employment, especially for the poor. The problem of unemployment and under employment was assessed to be acute in rural areas, but a small but growing problem in urban areas owing to migration. The Fifth Plan (1974-79) advocated three crucial steps to generate employment: (1) agricultural extension, (2) local development and (3) tenancy reforms to ensure tenure security to small farmers. The manufacturing sector was also considered as a viable intervention for increasing employment generation. The first national self-employment programme, the Integrated Rural Development Programme (IRDP) was launched during this plan (in 1978). A longer term focus towards employment generation had already been adopted in India’s planning process, and the Sixth Five Year Plan (1980-1985) advocated the same, where the secondary and tertiary sector would absorb the labour. In the short term it hoped to address the distress caused by unemployment and the consequences of underemployment. The sixth plan continued to give emphasis to self-employment in both the agricultural and non-agricultural sector, and promoted SMEs through reservations, concessions, promotion of dairy and fishery. It extended the existing employment programmes, such as the minimum needs programme, and Training of Rural Youth for Self Employment (TRYSEM), a component of the IRDP; and the National Rural Employment Programme (NREP) was launched in 1980. Growth of GDP picked up in the 1990s, to around 5 per cent per annum. It was also a turning point, as some plan targets were beginning to be achieved. Estimates revealed that the target of 34.28 million standard person years (SPY)(made for the sixth plan) had been achieved. The NREP created 35.2 million person days, the Rural Landless Labour Employment Guarantee Programme (RLEGP) created 260 million person days and under the IRDP, 15 million families started self-employment ventures and more than 3 million SPYs were generated during the sixth plan.
91
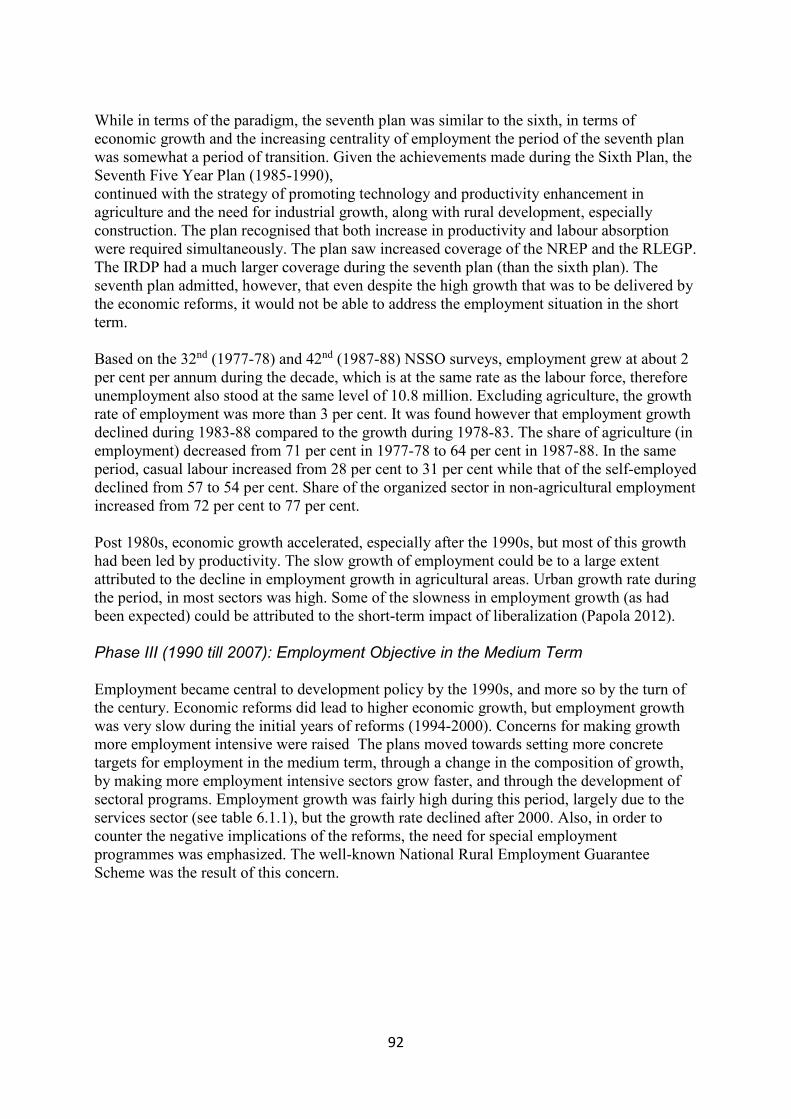
While in terms of the paradigm, the seventh plan was similar to the sixth, in terms of economic growth and the increasing centrality of employment the period of the seventh plan was somewhat a period of transition. Given the achievements made during the Sixth Plan, the Seventh Five Year Plan (1985-1990), continued with the strategy of promoting technology and productivity enhancement in agriculture and the need for industrial growth, along with rural development, especially construction. The plan recognised that both increase in productivity and labour absorption were required simultaneously. The plan saw increased coverage of the NREP and the RLEGP. The IRDP had a much larger coverage during the seventh plan (than the sixth plan). The seventh plan admitted, however, that even despite the high growth that was to be delivered by the economic reforms, it would not be able to address the employment situation in the short term. Based on the 32nd (1977-78) and 42nd (1987-88) NSSO surveys, employment grew at about 2 per cent per annum during the decade, which is at the same rate as the labour force, therefore unemployment also stood at the same level of 10.8 million. Excluding agriculture, the growth rate of employment was more than 3 per cent. It was found however that employment growth declined during 1983-88 compared to the growth during 1978-83. The share of agriculture (in employment) decreased from 71 per cent in 1977-78 to 64 per cent in 1987-88. In the same period, casual labour increased from 28 per cent to 31 per cent while that of the self-employed declined from 57 to 54 per cent. Share of the organized sector in non-agricultural employment increased from 72 per cent to 77 per cent. Post 1980s, economic growth accelerated, especially after the 1990s, but most of this growth had been led by productivity. The slow growth of employment could be to a large extent attributed to the decline in employment growth in agricultural areas. Urban growth rate during the period, in most sectors was high. Some of the slowness in employment growth (as had been expected) could be attributed to the short-term impact of liberalization (Papola 2012). Phase III (1990 till 2007): Employment Objective in the Medium Term Employment became central to development policy by the 1990s, and more so by the turn of the century. Economic reforms did lead to higher economic growth, but employment growth was very slow during the initial years of reforms (1994-2000). Concerns for making growth more employment intensive were raised The plans moved towards setting more concrete targets for employment in the medium term, through a change in the composition of growth, by making more employment intensive sectors grow faster, and through the development of sectoral programs. Employment growth was fairly high during this period, largely due to the services sector (see table 6.1.1), but the growth rate declined after 2000. Also, in order to counter the negative implications of the reforms, the need for special employment programmes was emphasized. The well-known National Rural Employment Guarantee Scheme was the result of this concern.
92
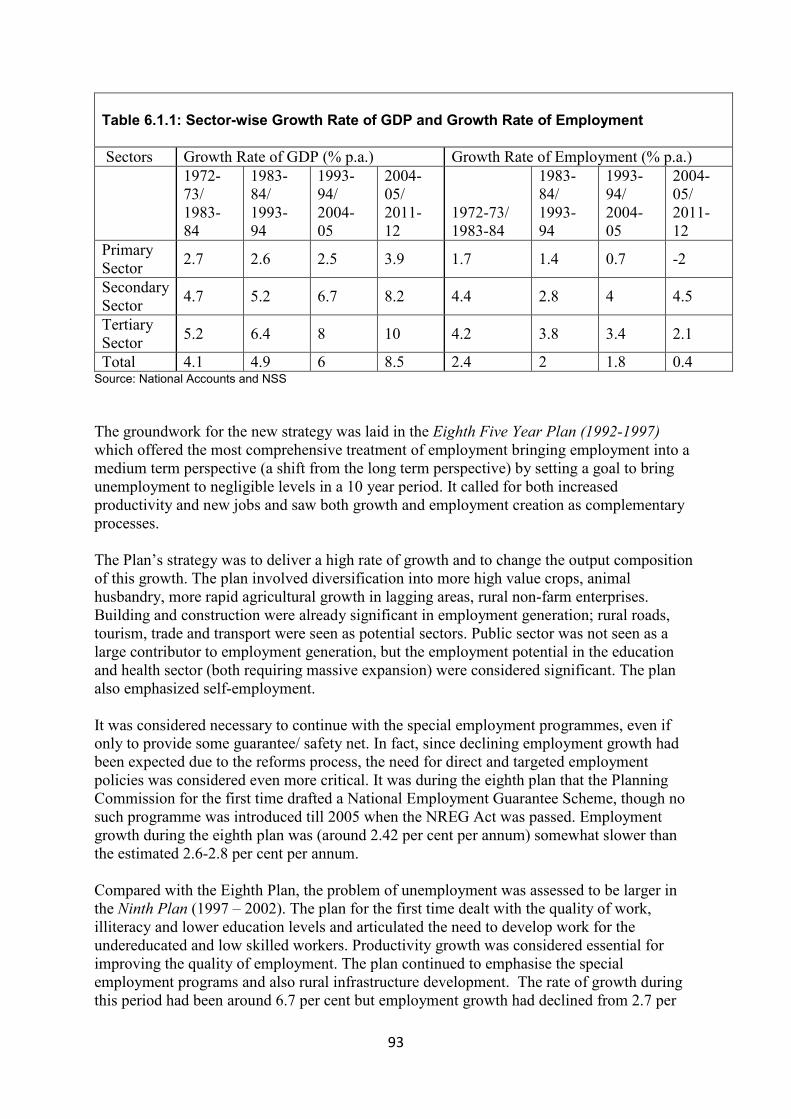
Table 6.1.1: Sector-wise Growth Rate of GDP and Growth Rate of Employment Sectors Growth Rate of GDP (% p.a.) Growth Rate of Employment (% p.a.)
1972-73/ 1983-84
1983-84/ 1993-94
1993-94/ 2004-05
2004-05/ 2011-12
1972-73/ 1983-84
1983-84/ 1993-94
1993-94/ 2004-05
2004-05/ 2011-12
Primary Sector 2.7 2.6 2.5 3.9 1.7 1.4 0.7 -2
Secondary Sector 4.7 5.2 6.7 8.2 4.4 2.8 4 4.5
Tertiary Sector 5.2 6.4 8 10 4.2 3.8 3.4 2.1
Total 4.1 4.9 6 8.5 2.4 2 1.8 0.4 Source: National Accounts and NSS The groundwork for the new strategy was laid in the Eighth Five Year Plan (1992-1997) which offered the most comprehensive treatment of employment bringing employment into a medium term perspective (a shift from the long term perspective) by setting a goal to bring unemployment to negligible levels in a 10 year period. It called for both increased productivity and new jobs and saw both growth and employment creation as complementary processes. The Plan’s strategy was to deliver a high rate of growth and to change the output composition of this growth. The plan involved diversification into more high value crops, animal husbandry, more rapid agricultural growth in lagging areas, rural non-farm enterprises. Building and construction were already significant in employment generation; rural roads, tourism, trade and transport were seen as potential sectors. Public sector was not seen as a large contributor to employment generation, but the employment potential in the education and health sector (both requiring massive expansion) were considered significant. The plan also emphasized self-employment. It was considered necessary to continue with the special employment programmes, even if only to provide some guarantee/ safety net. In fact, since declining employment growth had been expected due to the reforms process, the need for direct and targeted employment policies was considered even more critical. It was during the eighth plan that the Planning Commission for the first time drafted a National Employment Guarantee Scheme, though no such programme was introduced till 2005 when the NREG Act was passed. Employment growth during the eighth plan was (around 2.42 per cent per annum) somewhat slower than the estimated 2.6-2.8 per cent per annum. Compared with the Eighth Plan, the problem of unemployment was assessed to be larger in the Ninth Plan (1997 – 2002). The plan for the first time dealt with the quality of work, illiteracy and lower education levels and articulated the need to develop work for the undereducated and low skilled workers. Productivity growth was considered essential for improving the quality of employment. The plan continued to emphasise the special employment programs and also rural infrastructure development. The rate of growth during this period had been around 6.7 per cent but employment growth had declined from 2.7 per
93
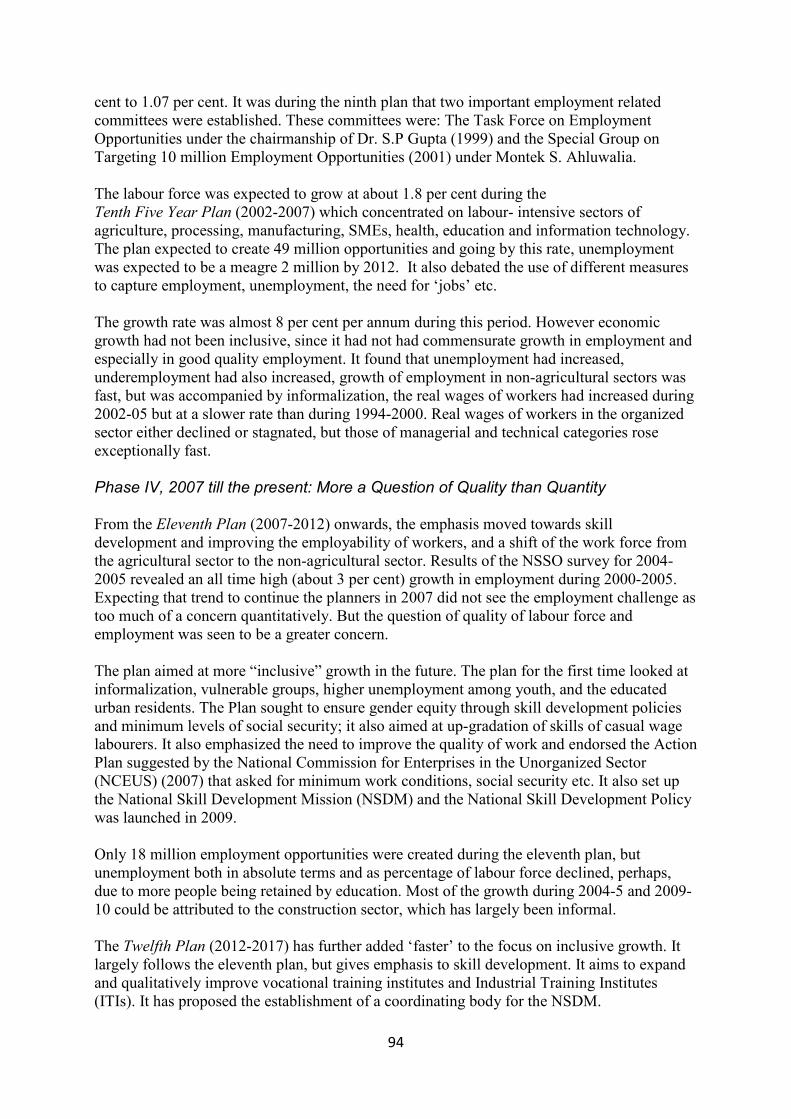
cent to 1.07 per cent. It was during the ninth plan that two important employment related committees were established. These committees were: The Task Force on Employment Opportunities under the chairmanship of Dr. S.P Gupta (1999) and the Special Group on Targeting 10 million Employment Opportunities (2001) under Montek S. Ahluwalia. The labour force was expected to grow at about 1.8 per cent during the Tenth Five Year Plan (2002-2007) which concentrated on labour- intensive sectors of agriculture, processing, manufacturing, SMEs, health, education and information technology. The plan expected to create 49 million opportunities and going by this rate, unemployment was expected to be a meagre 2 million by 2012. It also debated the use of different measures to capture employment, unemployment, the need for ‘jobs’ etc. The growth rate was almost 8 per cent per annum during this period. However economic growth had not been inclusive, since it had not had commensurate growth in employment and especially in good quality employment. It found that unemployment had increased, underemployment had also increased, growth of employment in non-agricultural sectors was fast, but was accompanied by informalization, the real wages of workers had increased during 2002-05 but at a slower rate than during 1994-2000. Real wages of workers in the organized sector either declined or stagnated, but those of managerial and technical categories rose exceptionally fast. Phase IV, 2007 till the present: More a Question of Quality than Quantity From the Eleventh Plan (2007-2012) onwards, the emphasis moved towards skill development and improving the employability of workers, and a shift of the work force from the agricultural sector to the non-agricultural sector. Results of the NSSO survey for 2004-2005 revealed an all time high (about 3 per cent) growth in employment during 2000-2005. Expecting that trend to continue the planners in 2007 did not see the employment challenge as too much of a concern quantitatively. But the question of quality of labour force and employment was seen to be a greater concern. The plan aimed at more “inclusive” growth in the future. The plan for the first time looked at informalization, vulnerable groups, higher unemployment among youth, and the educated urban residents. The Plan sought to ensure gender equity through skill development policies and minimum levels of social security; it also aimed at up-gradation of skills of casual wage labourers. It also emphasized the need to improve the quality of work and endorsed the Action Plan suggested by the National Commission for Enterprises in the Unorganized Sector (NCEUS) (2007) that asked for minimum work conditions, social security etc. It also set up the National Skill Development Mission (NSDM) and the National Skill Development Policy was launched in 2009. Only 18 million employment opportunities were created during the eleventh plan, but unemployment both in absolute terms and as percentage of labour force declined, perhaps, due to more people being retained by education. Most of the growth during 2004-5 and 2009-10 could be attributed to the construction sector, which has largely been informal. The Twelfth Plan (2012-2017) has further added ‘faster’ to the focus on inclusive growth. It largely follows the eleventh plan, but gives emphasis to skill development. It aims to expand and qualitatively improve vocational training institutes and Industrial Training Institutes (ITIs). It has proposed the establishment of a coordinating body for the NSDM.
94
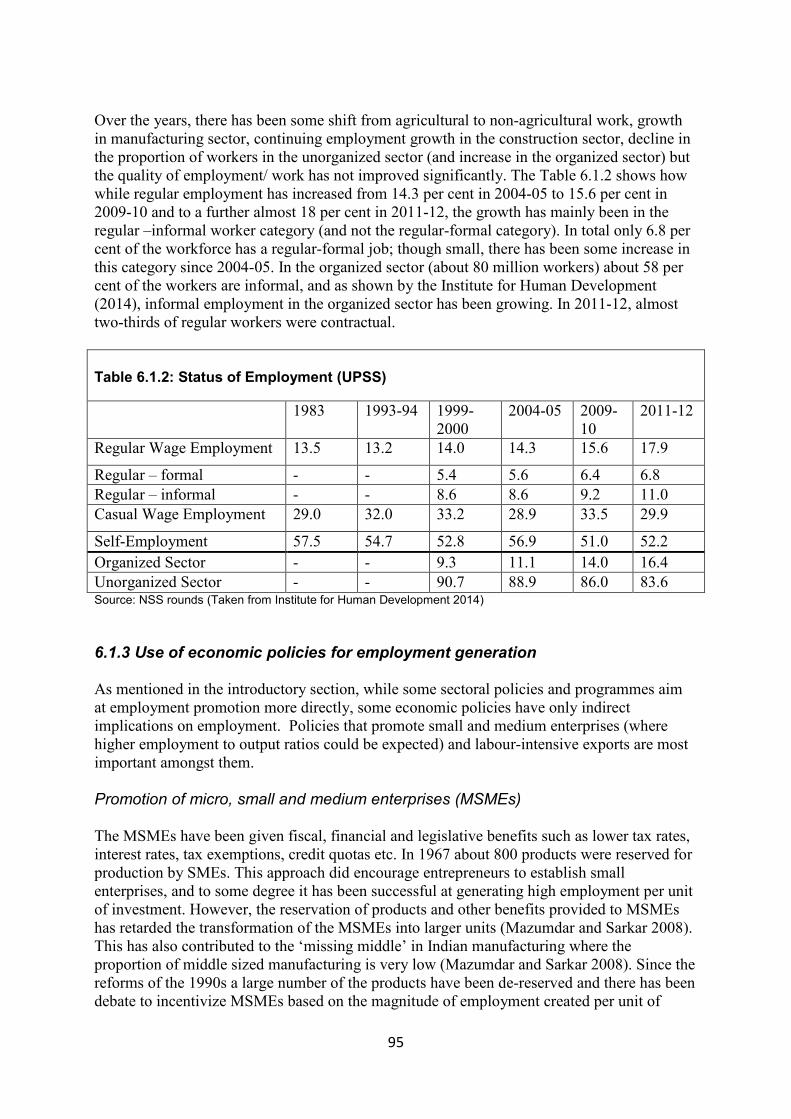
Over the years, there has been some shift from agricultural to non-agricultural work, growth in manufacturing sector, continuing employment growth in the construction sector, decline in the proportion of workers in the unorganized sector (and increase in the organized sector) but the quality of employment/ work has not improved significantly. The Table 6.1.2 shows how while regular employment has increased from 14.3 per cent in 2004-05 to 15.6 per cent in 2009-10 and to a further almost 18 per cent in 2011-12, the growth has mainly been in the regular –informal worker category (and not the regular-formal category). In total only 6.8 per cent of the workforce has a regular-formal job; though small, there has been some increase in this category since 2004-05. In the organized sector (about 80 million workers) about 58 per cent of the workers are informal, and as shown by the Institute for Human Development (2014), informal employment in the organized sector has been growing. In 2011-12, almost two-thirds of regular workers were contractual. Table 6.1.2: Status of Employment (UPSS) 1983
1993-94 1999-
2000 2004-05 2009-
10 2011-12
Regular Wage Employment 13.5 13.2 14.0 14.3 15.6 17.9
Regular – formal - - 5.4 5.6 6.4 6.8 Regular – informal - - 8.6 8.6 9.2 11.0 Casual Wage Employment 29.0 32.0 33.2 28.9 33.5 29.9
Self-Employment 57.5 54.7 52.8 56.9 51.0 52.2 Organized Sector - - 9.3 11.1 14.0 16.4 Unorganized Sector - - 90.7 88.9 86.0 83.6 Source: NSS rounds (Taken from Institute for Human Development 2014) 6.1.3 Use of economic policies for employment generation As mentioned in the introductory section, while some sectoral policies and programmes aim at employment promotion more directly, some economic policies have only indirect implications on employment. Policies that promote small and medium enterprises (where higher employment to output ratios could be expected) and labour-intensive exports are most important amongst them. Promotion of micro, small and medium enterprises (MSMEs) The MSMEs have been given fiscal, financial and legislative benefits such as lower tax rates, interest rates, tax exemptions, credit quotas etc. In 1967 about 800 products were reserved for production by SMEs. This approach did encourage entrepreneurs to establish small enterprises, and to some degree it has been successful at generating high employment per unit of investment. However, the reservation of products and other benefits provided to MSMEs has retarded the transformation of the MSMEs into larger units (Mazumdar and Sarkar 2008). This has also contributed to the ‘missing middle’ in Indian manufacturing where the proportion of middle sized manufacturing is very low (Mazumdar and Sarkar 2008). Since the reforms of the 1990s a large number of the products have been de-reserved and there has been debate to incentivize MSMEs based on the magnitude of employment created per unit of
95
capital. In 2011-12 there were about 45 million MSME employing around 101 million workers. They also contributed to about 40 per cent of India’s exports in 2011-12 (IHD 2014). Though capital intensity has increased in both MSMEs and in all other industries, MSMEs continue to be more labour intensive (Papola 2013b) than larger industries. However, Goyal (1996), found that even the small-scale sector has been increasingly controlled by a small group of elite entrepreneurs and larger business interests. Promotion of labour intensive exports India has a comparative advantage of abundant and cheap labour to promote labour intensive exports and any increases in exports are expected to engender greater employment. India’s exports and imports, as a proportion of GDP have increased from 19 per cent in 1997-98 to 43 per cent in 2010-11 (IHD 2014) and during 1996-99, 45 per cent of India’s manufacturing exports were comprised of unskilled labour intensive products (Sen 2008). Exporting industries have also shown higher employment growth than non-exporting industries (Papola 2013b). But Sen (2008) writes that while the share of labour intensive exports has grown in total manufacturing exports during 1975-99, the increase has not been substantial, and Papola (2013b) points out that the high rate of growth of export related employment is not only due to its labour intensive nature, but mostly due to a fast growth of exports themselves. In reality India has not been able to exploit its labour intensive export potential. DN (2004) writes that while China’s first phase of exports was of labour intensive goods, India’s was of medium and high technology products. He mentions figures from Mohan (see DN 2004) which state that while India’s low technology production grew from 2.5 million dollars to 13 billion dollars during 1985 to 1995, in case of China they grew from 3 billion dollars to 72 billion dollars. DN (2004) mentions that low technology manufacturing has become more expensive in the competitive market and that the Indian workers are half as productive as their Chinese counterparts (to some degree due to lower education levels and also incentive issues relating to SMEs and labour intensive exports). Since 2000-01, there has been a shift from labour-intensive light manufacturing to more heavy manufacturing and the share of labour intensive industries has declined from 24 per cent to 11 per cent of exports during the period 2000-01 and 2009-10 (see IHD 2014). So on balance it must be concluded that attempts to promote employment through labour intensive exports have failed. 6.1.4 Special Employment Programmes in India India’s economic policies did not prioritize employment over growth and due to rising unemployment and large-scale underemployment, the need for special employment programmes was perceived around the latter half of the 1960s. Thereafter, self-employment programmes and wage-employment programmes were introduced at the national level, beginning with the IRDP in 1978. Self-employment programmes The special employment programmes were obviously meant to fill the gaps left by the lack of an employment oriented approach; as such they focused on both self-employment and wage employment, and the related needs of training, finance, market linkages among others. The first major such programme was the Integrated Rural Development Programme (IRDP) that was launched in 1978 and was aimed at the promotion of self-employment, through the provision of productive assets, on the basis of a loan cum subsidy scheme of assistance to the
96

poor households. It ran two sub-programmes: Training of Rural Youth for Self-Employment (TRYSEM) and Development of Women and Children in Rural Areas (DWCRA) that organized women into producers groups. By 1999, the programme had assisted 54 million rural households. Its contribution to income supplementation was significant (almost 80 per cent were able to raise earnings) but not enough to raise incomes above poverty level – of all those assisted under the programme, only 15 per cent crossed the poverty line, mainly those who were already not far below the poverty line (Papola 2013b). The programme was also criticized for faulty identification of beneficiaries, especially in some states such as Gujarat, where almost 47 per cent were non-poor households (see Subbarao 1985). Kurian (1987) finds that in most states, on average, the destitute and the extremely poor were offered less assistance. The programme suffered from other issues also; such as the attitudes of participating banks and the absence of preparatory work. The evaluation of the programme on the basis of percentage of houses that ‘crossed the poverty line’ was itself faulty, as it was related to the initial income of the household (which was influenced by faulty selection of beneficiaries). Even in case of TRYSEM, Subbarao (1985) writes that the success of the scheme was dependent on the demand for the services/skill promoted by it. The scheme in general did not do as well in areas with higher poverty, as the demand in these areas was also lower. In 1999, the IRDP was replaced by the Swarnajayanti Gram Swarojgar Yojana (SGSY). The SGSY brought together all the previous self-employment plans and emphasized the formation of Self Help Groups along with infrastructure building, market linkages, marketing, technology, improved skill level of beneficiaries (which were some of the weaknesses of IRDP). The only weakness that lingered from the IRDP was the low investment per beneficiary, such that it was not enough to start meaningful enterprises. Again, the poorer states performed worse leading to untrained SHGs; almost 50 per cent of the SHGs were involved in dairy activities and average monthly income per participant was very low (IHD 2014). As Papola (2013b) describes, like IRDP, SGSY was also successful, but it did not result in massive upward mobility of BPL households. Examples from successful states such as Andhra Pradesh and Kerala demonstrate the need for tremendous social mobilization, and capacity building of both institutions and individuals (IHD 2014). SGSY was further restructured into the National Rural Livelihoods Mission in 2011. The NRLM learnt from the SGSY and is also focusing on institutional capacity, promotion of financial inclusion, diversification of livelihoods and skill formation. Instead of targeting all districts, the NRLM is spreading phase-wise, and making intensive interventions in select blocks and districts. It aims to have 50 per cent SC/ST household beneficiaries and 15 per cent from the minorities. Up to the end of December 2011, around 1 million had been assisted, of which 69 per cent were women (IHD 2014). Wage employment programmes: Building on earlier regional programmes (such as the Maharashtra Employment Guarantee Scheme, that guaranteed demand based wage employment through out the year), the first national level wage employment programmes namely the National Rural Employment Programme, was introduced in 1980, and aimed at providing wage income to the rural poor and also create infrastructure; and the Rural Labour Employment Guarantee Programme (RLEGP) implemented along with NREP to provide landless labourers at least 100 days of work. NREP was later restructured as the Jawahar Rozgar Yojana (JRY) in 1989. Later in 1993, a similar programme as RLEGP, known as the Employment Assurance Scheme (EAS)
97
was initiated in select poor and backward areas. In 2001, all rural wage employment programmes were integrated under the Sampoorna Gram Rojgar Yojana (SGRY). The above-mentioned programmes have by and large been successful in providing some employment and wage to poor sections. During 1998-99, EAS and JRY together generated 4.4 million person years of employment (1.5 per cent of labour force years of employment in that year). Neelakantan (1994) shows that wage: non-wage ratio was lower than the 60:40 norm. In Punjab it was as low as 20.25 per cent. In general, the interference and involvement of contractors was minimal, except for Karnataka and Orissa that had more than 10 per cent involvement. A noteworthy feature of the programme was the involvement of SC/STs (53.6 per cent nationally) and the landless (38.28 per cent). As such even the wages given to unskilled workers were more than or equal to the minimum wages, in some states however, women were given lower wages than men (but they were also more than or equal to minimum wages). However the employment generated was not significant (Papola 2013b). In case of the Maharashtra Employment Guarantee Scheme, it was seen that it prevented people from going hungry and did not allow rural wages to fall very low. All important employment plans were merged into the National Rural Employment Guarantee Scheme under a legally binding Act of 2005. It was more comprehensive and effective as it made it legally binding to provide a minimum of 100 days of wage work, along with empowering and giving various responsibilities to local bodies. NREGS had made significant contribution in terms of coverage of households, inclusion of women and socially disadvantaged groups (see Table 6.1.2), the types of assets created (mostly water, irrigation, and road connectivity), financial inclusion, reduction in hunger and poverty. Till 2009-10 the number of households benefitting kept increasing, however, after 2009, it has been declining. Average earnings of households from NREGS have been Rs.5500, which is substantial (Papola 2013b). While the proportion of SCs and STs participating in the NREGS has been substantially more than their proportion of population, their participation rates are declining (see Table 6.1.3). However since 80 per cent of the poor in India are SCs and STs (as per NSS 2004-05), the self-targeting nature of the programme seems to be rightly aligned (see Mehrotra 2008). Another feature of the NREGS has been the large-scale participation of women. Ghosh (2014) writes that NREGS has stabilized rural wages and has also resulted in a reduction in the gender gap of wages, therefore reducing gender inequality. At the same time NREGS may also have reduced women’s work participation, owing to better standards of living (along with the low wages, arduous work etc). In case of Rajasthan, Andhra Pradesh and Maharashtra - Jha, Gaiha and Shankar (2008) find that even with respect to asset class, the NREGS seems to be well targeted. They find that the (nearly) landless class worked for greater number of days than the highest land owned class. According to them “both in terms of participation and duration of participation, the targeting of NREGS in far from dismal (pp.46)”. However, it has been documented that many problems exist in the programme; such as utility of infrastructure created, low wages, late payments, but better managed than before, also because better monitoring procedures exist. The NREGS has also contributed to a perception of labour scarcity and many places it has been resisted by the elites, due to its uplifting impact in rural India. Overall, it has been felt that the NREGS has contributed significantly to additional wage employment, even though its impact has been somewhat countered by rising inflation. As such it has been the only programme which has had a substantial impact on wage employment given its universal nature and scaling-up. In 2010-11 almost 40 per cent of rural
98
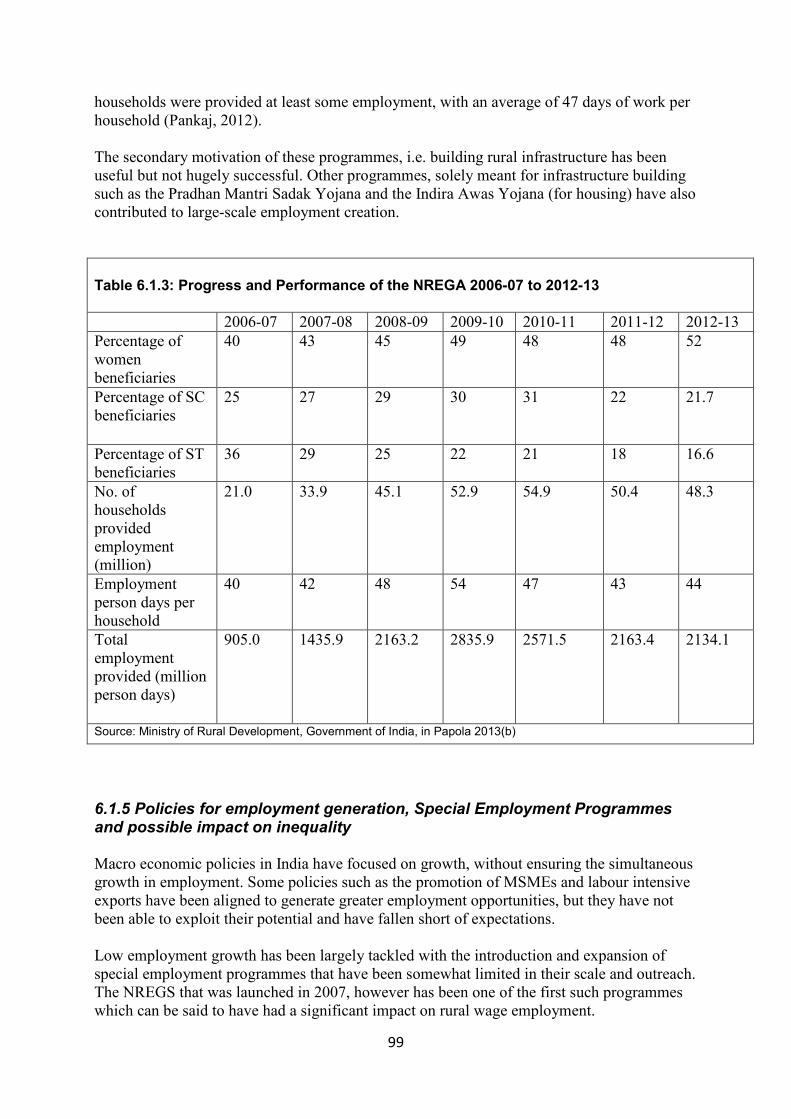
households were provided at least some employment, with an average of 47 days of work per household (Pankaj, 2012). The secondary motivation of these programmes, i.e. building rural infrastructure has been useful but not hugely successful. Other programmes, solely meant for infrastructure building such as the Pradhan Mantri Sadak Yojana and the Indira Awas Yojana (for housing) have also contributed to large-scale employment creation. Table 6.1.3: Progress and Performance of the NREGA 2006-07 to 2012-13 2006-07 2007-08 2008-09 2009-10 2010-11 2011-12 2012-13 Percentage of women beneficiaries
40 43 45 49 48 48 52
Percentage of SC beneficiaries
25 27 29 30 31 22 21.7
Percentage of ST beneficiaries
36 29 25 22 21 18 16.6
No. of households provided employment (million)
21.0 33.9 45.1 52.9 54.9 50.4 48.3
Employment person days per household
40 42 48 54 47 43 44
Total employment provided (million person days)
905.0 1435.9 2163.2 2835.9 2571.5 2163.4 2134.1
Source: Ministry of Rural Development, Government of India, in Papola 2013(b)
6.1.5 Policies for employment generation, Special Employment Programmes and possible impact on inequality Macro economic policies in India have focused on growth, without ensuring the simultaneous growth in employment. Some policies such as the promotion of MSMEs and labour intensive exports have been aligned to generate greater employment opportunities, but they have not been able to exploit their potential and have fallen short of expectations. Low employment growth has been largely tackled with the introduction and expansion of special employment programmes that have been somewhat limited in their scale and outreach. The NREGS that was launched in 2007, however has been one of the first such programmes which can be said to have had a significant impact on rural wage employment.
99
The assessments of earlier employment programmes such as JRY and EAS demonstrate that they were creating some employment in rural areas and in fact were instrumental in facilitating the rise of some households above the poverty line, but they were limited. So while they may have helped in reducing inequalities, the proportion of people benefited and the overall impact on inequality was very small. Despite being plagued by issues such as faulty identification of beneficiaries and lower levels of assistance provided to poorer households, programmes such as DWCRA, TRYSEM and SGSY were somewhat more successful. As mentioned earlier, the low investment per beneficiary and overall limited nature was an issue that was present in all these programmes, including the SGSY. It seems that public works and rural works programmes have had a positive impact during both state led and post-economic reform periods. Perhaps, this consistency in their impact (despite major ideological shifts in regimes) is due to the wide scale underemployment, seasonality of agricultural work and long-term exclusion of women and disadvantaged groups. They may have not been significant in pulling the poor out from poverty, but they have certainly prevented a further deepening of poverty. The NREGS, despite its lacuna, has been credited with creating a safety net, preventing hunger, and for its role in the uplifting of poor households. The NREGS has been particularly significant by being a safety net for many after the retrenchment caused by the global financial crisis post 2008 (Ghosh 2014). It has also been remarkable due to the particularly high participation of women in it (unlike earlier programmes) (World Bank 2010). There is evidence that underemployment has reduced in rural areas and this is evident from the convergence in the different measures of unemployment (principal status, weekly status, daily status etc.) (Chandra Mohan 2013). This could be attributed to the special employment programmes as well as the structural shifts in the workforce. While Scheduled Castes and Tribes continue to face social prejudices there has been greater inclusion through programs such as NREGS (which is a legal act). Kannan (2012) describes how inclusive growth needs to address both absolute poverty and also issues of relative poverty and inequality that is likely to give rise to tension and alienation in a fast growing economy. In this context it appears that while the early employment programmes may have addressed absolute poverty to some degree they were limited in scope and coverage, and were not legally enforceable. However it is evident that the NREGS has impacted absolute poverty and in that it has prevented a further deepening of inequalities.
100
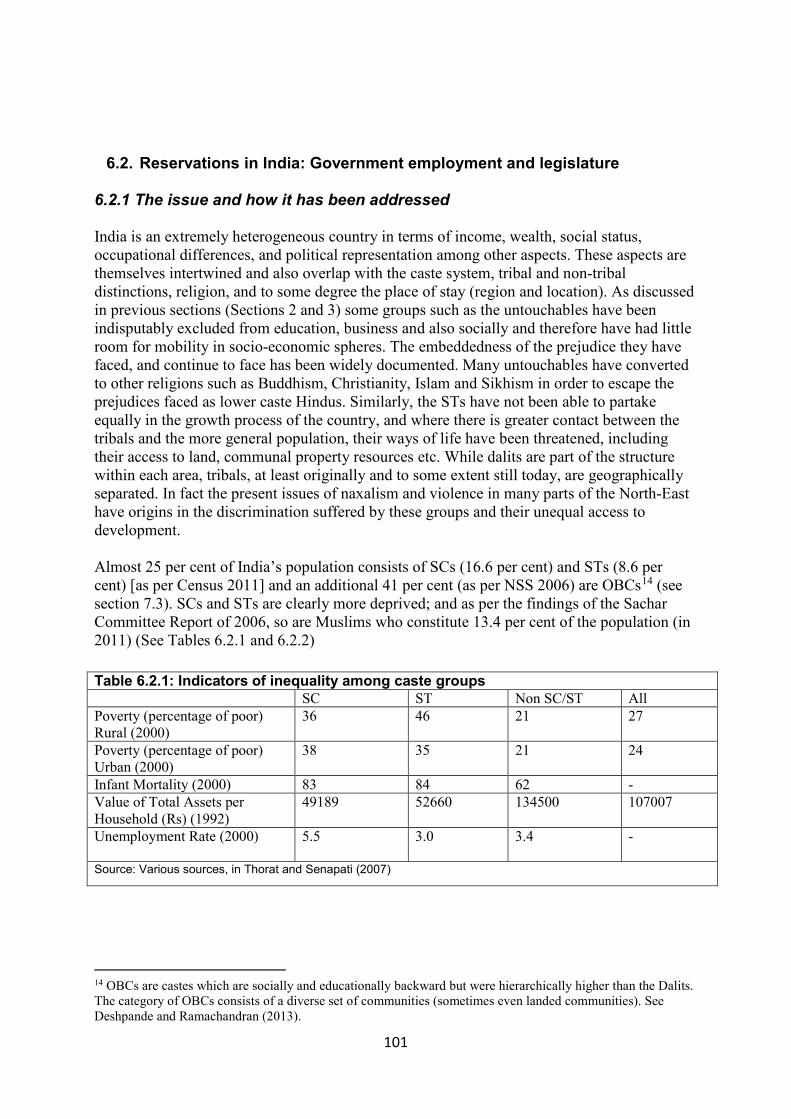
6.2. Reservations in India: Government employment and legislature
6.2.1 The issue and how it has been addressed India is an extremely heterogeneous country in terms of income, wealth, social status, occupational differences, and political representation among other aspects. These aspects are themselves intertwined and also overlap with the caste system, tribal and non-tribal distinctions, religion, and to some degree the place of stay (region and location). As discussed in previous sections (Sections 2 and 3) some groups such as the untouchables have been indisputably excluded from education, business and also socially and therefore have had little room for mobility in socio-economic spheres. The embeddedness of the prejudice they have faced, and continue to face has been widely documented. Many untouchables have converted to other religions such as Buddhism, Christianity, Islam and Sikhism in order to escape the prejudices faced as lower caste Hindus. Similarly, the STs have not been able to partake equally in the growth process of the country, and where there is greater contact between the tribals and the more general population, their ways of life have been threatened, including their access to land, communal property resources etc. While dalits are part of the structure within each area, tribals, at least originally and to some extent still today, are geographically separated. In fact the present issues of naxalism and violence in many parts of the North-East have origins in the discrimination suffered by these groups and their unequal access to development. Almost 25 per cent of India’s population consists of SCs (16.6 per cent) and STs (8.6 per cent) [as per Census 2011] and an additional 41 per cent (as per NSS 2006) are OBCs14 (see section 7.3). SCs and STs are clearly more deprived; and as per the findings of the Sachar Committee Report of 2006, so are Muslims who constitute 13.4 per cent of the population (in 2011) (See Tables 6.2.1 and 6.2.2)
14 OBCs are castes which are socially and educationally backward but were hierarchically higher than the Dalits. The category of OBCs consists of a diverse set of communities (sometimes even landed communities). See Deshpande and Ramachandran (2013).
Table 6.2.1: Indicators of inequality among caste groups SC ST Non SC/ST All Poverty (percentage of poor) Rural (2000)
36 46 21 27
Poverty (percentage of poor) Urban (2000)
38 35 21 24
Infant Mortality (2000) 83 84 62 - Value of Total Assets per Household (Rs) (1992)
49189 52660 134500 107007
Unemployment Rate (2000) 5.5 3.0 3.4 -
Source: Various sources, in Thorat and Senapati (2007)
101
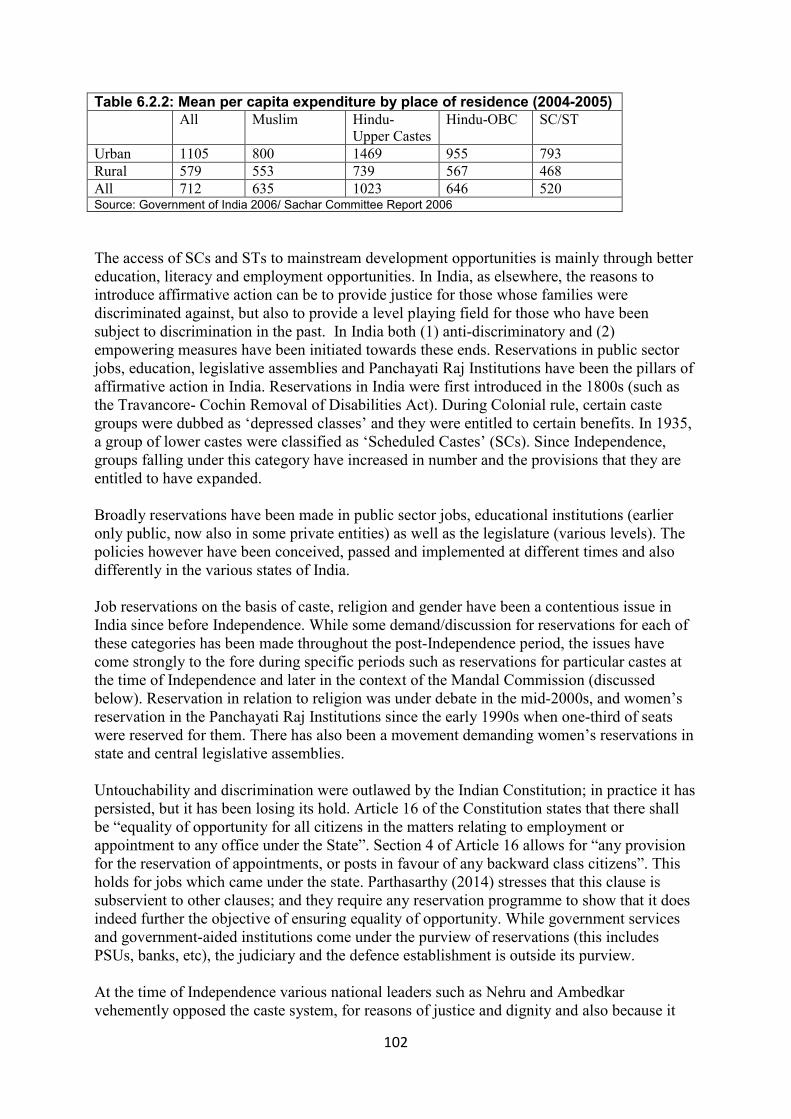
Table 6.2.2: Mean per capita expenditure by place of residence (2004-2005) All Muslim Hindu-
Upper Castes Hindu-OBC SC/ST
Urban 1105 800 1469 955 793 Rural 579 553 739 567 468 All 712 635 1023 646 520 Source: Government of India 2006/ Sachar Committee Report 2006 The access of SCs and STs to mainstream development opportunities is mainly through better education, literacy and employment opportunities. In India, as elsewhere, the reasons to introduce affirmative action can be to provide justice for those whose families were discriminated against, but also to provide a level playing field for those who have been subject to discrimination in the past. In India both (1) anti-discriminatory and (2) empowering measures have been initiated towards these ends. Reservations in public sector jobs, education, legislative assemblies and Panchayati Raj Institutions have been the pillars of affirmative action in India. Reservations in India were first introduced in the 1800s (such as the Travancore- Cochin Removal of Disabilities Act). During Colonial rule, certain caste groups were dubbed as ‘depressed classes’ and they were entitled to certain benefits. In 1935, a group of lower castes were classified as ‘Scheduled Castes’ (SCs). Since Independence, groups falling under this category have increased in number and the provisions that they are entitled to have expanded. Broadly reservations have been made in public sector jobs, educational institutions (earlier only public, now also in some private entities) as well as the legislature (various levels). The policies however have been conceived, passed and implemented at different times and also differently in the various states of India. Job reservations on the basis of caste, religion and gender have been a contentious issue in India since before Independence. While some demand/discussion for reservations for each of these categories has been made throughout the post-Independence period, the issues have come strongly to the fore during specific periods such as reservations for particular castes at the time of Independence and later in the context of the Mandal Commission (discussed below). Reservation in relation to religion was under debate in the mid-2000s, and women’s reservation in the Panchayati Raj Institutions since the early 1990s when one-third of seats were reserved for them. There has also been a movement demanding women’s reservations in state and central legislative assemblies. Untouchability and discrimination were outlawed by the Indian Constitution; in practice it has persisted, but it has been losing its hold. Article 16 of the Constitution states that there shall be “equality of opportunity for all citizens in the matters relating to employment or appointment to any office under the State”. Section 4 of Article 16 allows for “any provision for the reservation of appointments, or posts in favour of any backward class citizens”. This holds for jobs which came under the state. Parthasarthy (2014) stresses that this clause is subservient to other clauses; and they require any reservation programme to show that it does indeed further the objective of ensuring equality of opportunity. While government services and government-aided institutions come under the purview of reservations (this includes PSUs, banks, etc), the judiciary and the defence establishment is outside its purview. At the time of Independence various national leaders such as Nehru and Ambedkar vehemently opposed the caste system, for reasons of justice and dignity and also because it
102
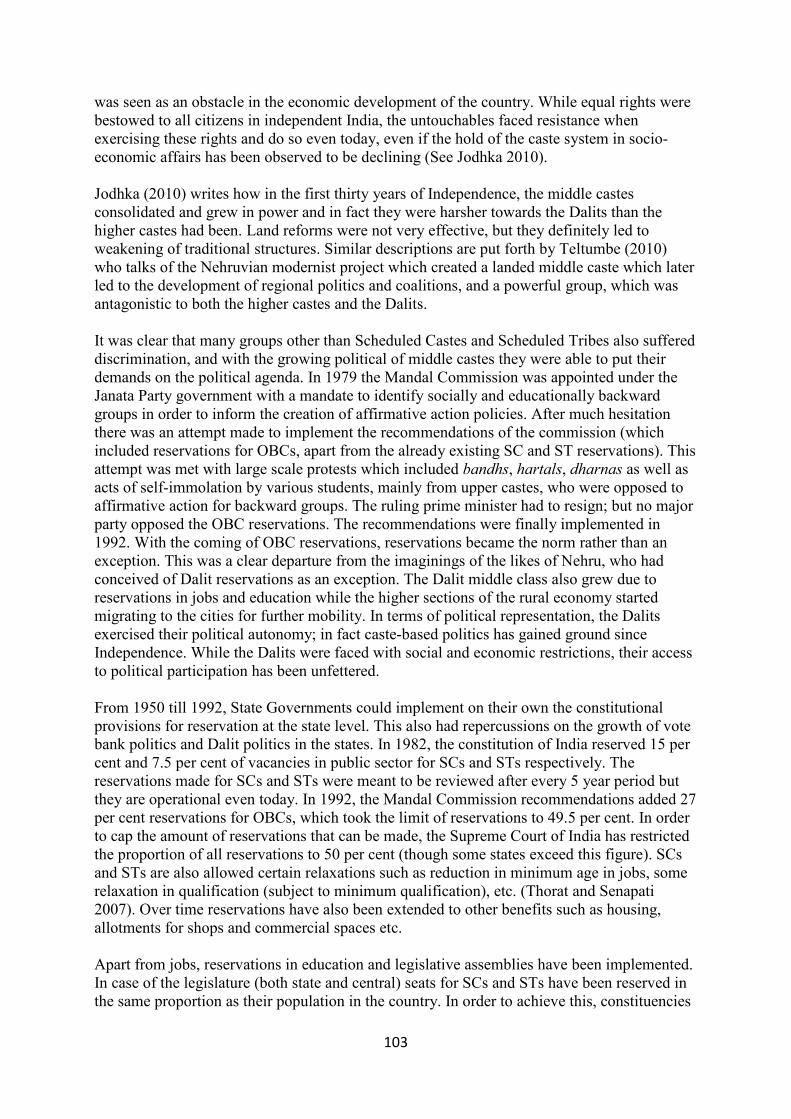
was seen as an obstacle in the economic development of the country. While equal rights were bestowed to all citizens in independent India, the untouchables faced resistance when exercising these rights and do so even today, even if the hold of the caste system in socio-economic affairs has been observed to be declining (See Jodhka 2010). Jodhka (2010) writes how in the first thirty years of Independence, the middle castes consolidated and grew in power and in fact they were harsher towards the Dalits than the higher castes had been. Land reforms were not very effective, but they definitely led to weakening of traditional structures. Similar descriptions are put forth by Teltumbe (2010) who talks of the Nehruvian modernist project which created a landed middle caste which later led to the development of regional politics and coalitions, and a powerful group, which was antagonistic to both the higher castes and the Dalits. It was clear that many groups other than Scheduled Castes and Scheduled Tribes also suffered discrimination, and with the growing political of middle castes they were able to put their demands on the political agenda. In 1979 the Mandal Commission was appointed under the Janata Party government with a mandate to identify socially and educationally backward groups in order to inform the creation of affirmative action policies. After much hesitation there was an attempt made to implement the recommendations of the commission (which included reservations for OBCs, apart from the already existing SC and ST reservations). This attempt was met with large scale protests which included bandhs, hartals, dharnas as well as acts of self-immolation by various students, mainly from upper castes, who were opposed to affirmative action for backward groups. The ruling prime minister had to resign; but no major party opposed the OBC reservations. The recommendations were finally implemented in 1992. With the coming of OBC reservations, reservations became the norm rather than an exception. This was a clear departure from the imaginings of the likes of Nehru, who had conceived of Dalit reservations as an exception. The Dalit middle class also grew due to reservations in jobs and education while the higher sections of the rural economy started migrating to the cities for further mobility. In terms of political representation, the Dalits exercised their political autonomy; in fact caste-based politics has gained ground since Independence. While the Dalits were faced with social and economic restrictions, their access to political participation has been unfettered. From 1950 till 1992, State Governments could implement on their own the constitutional provisions for reservation at the state level. This also had repercussions on the growth of vote bank politics and Dalit politics in the states. In 1982, the constitution of India reserved 15 per cent and 7.5 per cent of vacancies in public sector for SCs and STs respectively. The reservations made for SCs and STs were meant to be reviewed after every 5 year period but they are operational even today. In 1992, the Mandal Commission recommendations added 27 per cent reservations for OBCs, which took the limit of reservations to 49.5 per cent. In order to cap the amount of reservations that can be made, the Supreme Court of India has restricted the proportion of all reservations to 50 per cent (though some states exceed this figure). SCs and STs are also allowed certain relaxations such as reduction in minimum age in jobs, some relaxation in qualification (subject to minimum qualification), etc. (Thorat and Senapati 2007). Over time reservations have also been extended to other benefits such as housing, allotments for shops and commercial spaces etc. Apart from jobs, reservations in education and legislative assemblies have been implemented. In case of the legislature (both state and central) seats for SCs and STs have been reserved in the same proportion as their population in the country. In order to achieve this, constituencies
103
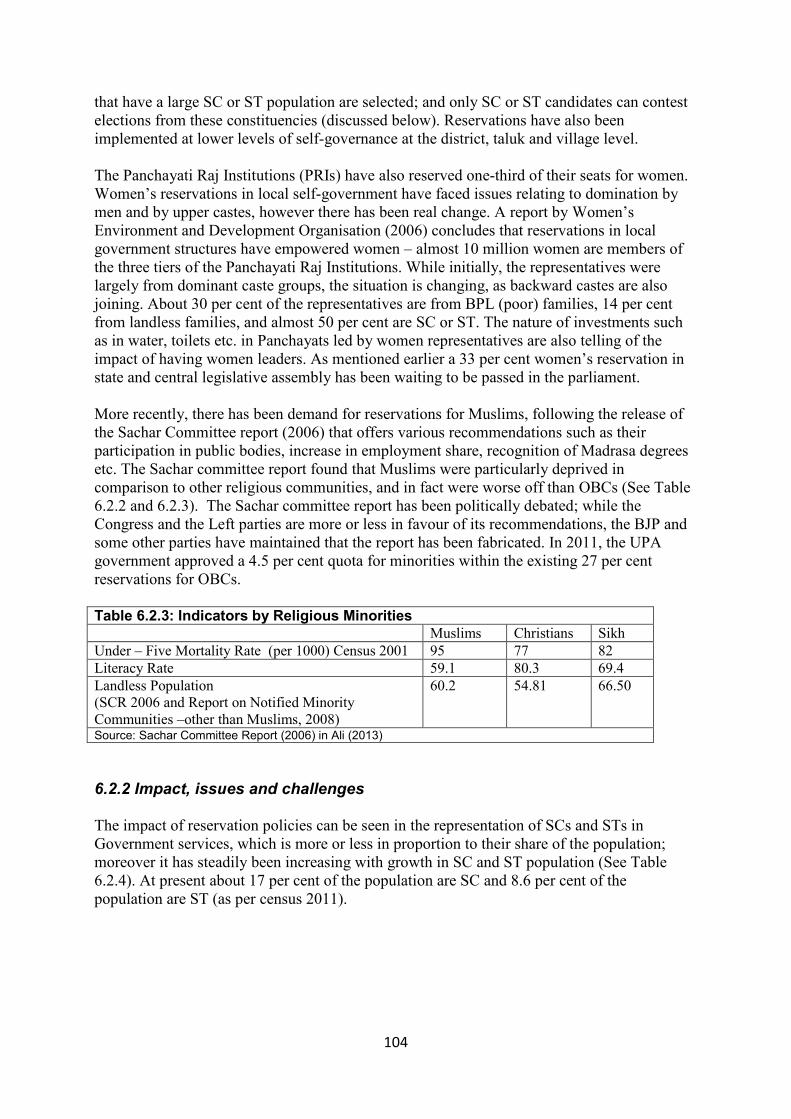
that have a large SC or ST population are selected; and only SC or ST candidates can contest elections from these constituencies (discussed below). Reservations have also been implemented at lower levels of self-governance at the district, taluk and village level. The Panchayati Raj Institutions (PRIs) have also reserved one-third of their seats for women. Women’s reservations in local self-government have faced issues relating to domination by men and by upper castes, however there has been real change. A report by Women’s Environment and Development Organisation (2006) concludes that reservations in local government structures have empowered women – almost 10 million women are members of the three tiers of the Panchayati Raj Institutions. While initially, the representatives were largely from dominant caste groups, the situation is changing, as backward castes are also joining. About 30 per cent of the representatives are from BPL (poor) families, 14 per cent from landless families, and almost 50 per cent are SC or ST. The nature of investments such as in water, toilets etc. in Panchayats led by women representatives are also telling of the impact of having women leaders. As mentioned earlier a 33 per cent women’s reservation in state and central legislative assembly has been waiting to be passed in the parliament. More recently, there has been demand for reservations for Muslims, following the release of the Sachar Committee report (2006) that offers various recommendations such as their participation in public bodies, increase in employment share, recognition of Madrasa degrees etc. The Sachar committee report found that Muslims were particularly deprived in comparison to other religious communities, and in fact were worse off than OBCs (See Table 6.2.2 and 6.2.3). The Sachar committee report has been politically debated; while the Congress and the Left parties are more or less in favour of its recommendations, the BJP and some other parties have maintained that the report has been fabricated. In 2011, the UPA government approved a 4.5 per cent quota for minorities within the existing 27 per cent reservations for OBCs. Table 6.2.3: Indicators by Religious Minorities Muslims Christians Sikh Under – Five Mortality Rate (per 1000) Census 2001 95 77 82 Literacy Rate 59.1 80.3 69.4 Landless Population (SCR 2006 and Report on Notified Minority Communities –other than Muslims, 2008)
60.2 54.81 66.50
Source: Sachar Committee Report (2006) in Ali (2013) 6.2.2 Impact, issues and challenges The impact of reservation policies can be seen in the representation of SCs and STs in Government services, which is more or less in proportion to their share of the population; moreover it has steadily been increasing with growth in SC and ST population (See Table 6.2.4). At present about 17 per cent of the population are SC and 8.6 per cent of the population are ST (as per census 2011).
104
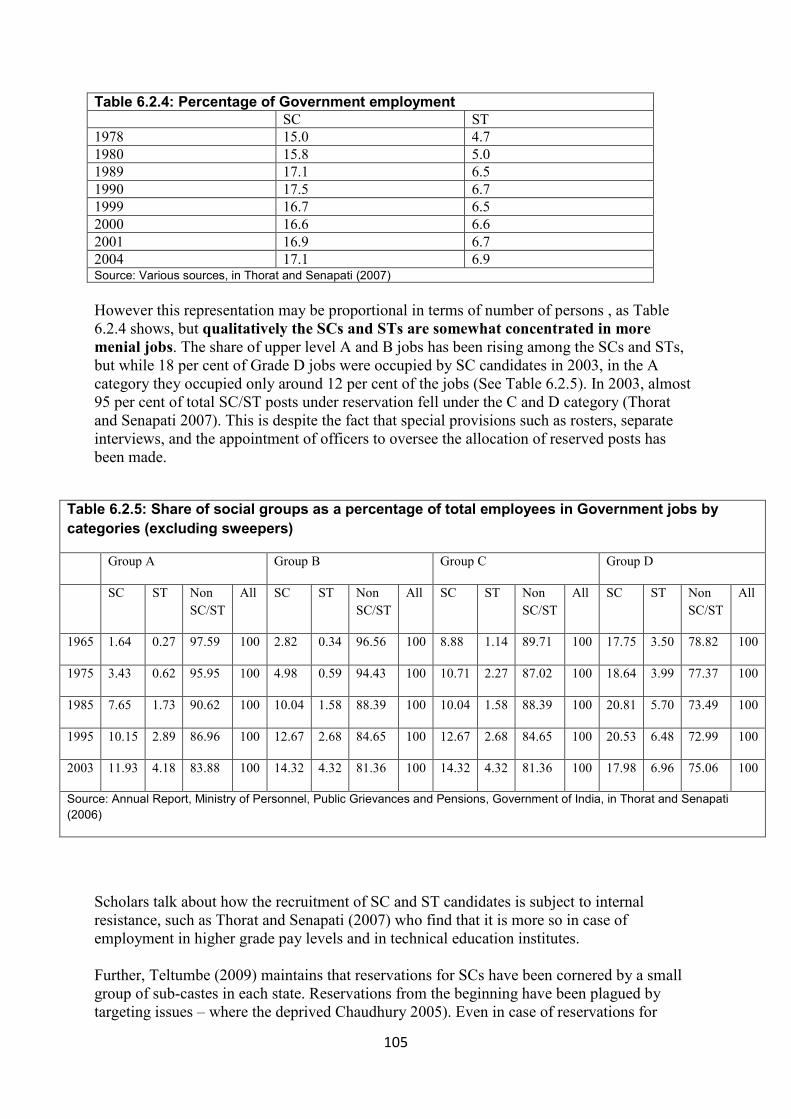
Table 6.2.4: Percentage of Government employment SC ST 1978 15.0 4.7 1980 15.8 5.0 1989 17.1 6.5 1990 17.5 6.7 1999 16.7 6.5 2000 16.6 6.6 2001 16.9 6.7 2004 17.1 6.9 Source: Various sources, in Thorat and Senapati (2007) However this representation may be proportional in terms of number of persons , as Table 6.2.4 shows, but qualitatively the SCs and STs are somewhat concentrated in more menial jobs. The share of upper level A and B jobs has been rising among the SCs and STs, but while 18 per cent of Grade D jobs were occupied by SC candidates in 2003, in the A category they occupied only around 12 per cent of the jobs (See Table 6.2.5). In 2003, almost 95 per cent of total SC/ST posts under reservation fell under the C and D category (Thorat and Senapati 2007). This is despite the fact that special provisions such as rosters, separate interviews, and the appointment of officers to oversee the allocation of reserved posts has been made.
Scholars talk about how the recruitment of SC and ST candidates is subject to internal resistance, such as Thorat and Senapati (2007) who find that it is more so in case of employment in higher grade pay levels and in technical education institutes. Further, Teltumbe (2009) maintains that reservations for SCs have been cornered by a small group of sub-castes in each state. Reservations from the beginning have been plagued by targeting issues – where the deprived Chaudhury 2005). Even in case of reservations for
Table 6.2.5: Share of social groups as a percentage of total employees in Government jobs by categories (excluding sweepers)
Group A Group B Group C Group D
SC ST Non SC/ST
All SC ST Non SC/ST
All SC ST Non SC/ST
All SC ST Non SC/ST
All
1965 1.64 0.27 97.59 100 2.82 0.34 96.56 100 8.88 1.14 89.71 100 17.75 3.50 78.82 100
1975 3.43 0.62 95.95 100 4.98 0.59 94.43 100 10.71 2.27 87.02 100 18.64 3.99 77.37 100
1985 7.65 1.73 90.62 100 10.04 1.58 88.39 100 10.04 1.58 88.39 100 20.81 5.70 73.49 100
1995 10.15 2.89 86.96 100 12.67 2.68 84.65 100 12.67 2.68 84.65 100 20.53 6.48 72.99 100
2003 11.93 4.18 83.88 100 14.32 4.32 81.36 100 14.32 4.32 81.36 100 17.98 6.96 75.06 100
Source: Annual Report, Ministry of Personnel, Public Grievances and Pensions, Government of India, in Thorat and Senapati (2006)
105
Muslims, Ali (2013) believes that they are likely to be appropriated by the higher castes (Ali 2013). In addition to the above limitations and challenges, the public sector itself is shrinking, therefore shrinking the employment opportunities for the deprived groups. It provides only about 4 per cent of India’s total employment. It has been noted that the decline in Central Government jobs among SC/STs has been faster than the decline in other categories (Thorat and Senapati 2007) Teltumbe (2009) states that while the ‘base of reservations has been contracting during the neo liberal reforms, the din over it is becoming louder and louder (pp.18). There is an additional clamour now for reservations in the private sector in India – something that has been debated in the present elections (of 2014). Demand for private sector jobs has been made by SCs and STs and this is backed by the small number of opportunities that government jobs provide. This is resisted fiercely by the business community. The national business federation FICCI made a statement to the effect that reservation in the Private Sector is ill-conceived, though the private sector itself can take up affirmative action (Radhakrishnan 2005). Private-sector consciousness and a hiring practice aimed at equality of opportunity and positive discrimination, would definitely help in reducing inequality. However, studies reveal the entrenched nature of caste and religious discrimination even in corporate institutions which claim having robust mechanisms for unbiased hiring. Thorat and Attewell (2010) find that a Dalit or a Muslim with equal qualifications (as those of upper caste candidates) is less likely to be hired, that too by a significant margin. It has been seen that the SC and ST candidates elected to state and central legislatures are often unable to represent their own interests. This seems to be a result of the structure of the process of selection and election. Constituencies with a large SC /ST population are reserved – and only SC and ST candidates can fight elections for those seats. However, since the majority population of those constituencies is not SC or ST, they are compelled to take support from other social groups -higher castes and majority groups – and therefore end up representing the interest of the higher castes. However Thorat and Senapati (2007) argue that without this reservation in the legislatures, their representation in the assemblies would have been negligible. Studies described by them reveal that even those who are elected are less articulate, assertive and independent (than those from higher caste groups) (Thorat and Senapati (2007). The number of constituencies (based on proportion of SC and ST population) is to be revised with every decennial census of India, however the number has not been revised since 1981. The reservations in legislature have been made time bound with possibilities for extension. They can be eliminated if it is felt that discrimination is no more a major issue.
6.2.3 Affirmative Action policies: How have they affected inequality? It seems that while reservations in government employment and in the legislature has provided some scope for mobility to backward groups, their effect in terms of the proportion of SC and STs who are benefitted is probably marginal. Chaudhury (2005) writes how caste remains a tool of division as reservations are a means for absorbing the powerful from the lower castes and making them a part of the ruling class – which only allows the caste system to survive. “It pushes the economic problems facing the poor away from centre stage” pp. 305. Chandhoke (2005) has similar views when she says
106
that reservations take the attention away from issues such land reforms, income generation etc., which are the real equalizing forces. Her argument is that it does not guarantee minimal benefits, it has become integral to electoral politics, given rise to claims of victimhood, and is unable to address intra-group inequalities (such as within SCs, STs, OBCs, Muslims, etc.). Further shrinking of the public sector since liberalization has also led to a shrinking of job opportunities which come under the ambit of reservations. However it could be looked upon as one of the components of a wider policy to promote equality. Reservations have provided a voice and platform for collective bargaining by the backward groups. It has politically empowered them – opening doors for social and economic empowerment. It is apparent that they are concentrated more in low paying categories of employment and also in the municipal workers category – however a lack of even these opportunities would have resulted in greater inequality. Barooah, Dubey and Iyer (2007) compare the probability of SCs and STs (who are eligible for reservation) getting a certain kind of job/employment compared to Muslims (who do not have reservations). They find that reservations provide a boost of about 5 per cent in general for SCs and STs. Based on their findings they maintain that reservations have helped the SC and the ST community representation in both regular jobs and wage employment jobs. As such they found that reservations for OBCs are ‘misconceived’ because these groups are already represented in such jobs. This has also been found by other studies such as the Sachar Committee Report (see above) as well as in case of reservations made in the education sector for the OBCs. In fact, Barooah, Dubey and Iyer (2007) feel that Muslims have a more compelling case compared to the OBCs for receiving reservation benefits in employment. It could be said that job reservations have had some impact on preventing growing inequalities between the SC and STs, and the upper castes. However, it may have increased gaps between the Muslims and the SCs and the STs. The impact of job reservations, theoretically, could have been greater if disparities in education, especially literacy and the quality of schooling, had been lower. This has to do with India’s education policy, which early on concentrated on higher education, and reservations were introduced in higher education rather than in improving the lower levels of the educational system. This had implications for the ability of SC/ST candidates to meet minimum requirements to get into Category A and B jobs. Primary qualifications and learning achievements of SCs and STs have been lower which has retarded their ability to compete for higher grade jobs. The critical nature of the issue of educational quality in the context of job reservations has also been made by others such as Illiah (2005), and Barooah, Dubey and Iyer (2007). Indeed, a successful policy to ensure equality in education is likely to be a much more powerful force in the long term than the reservation of jobs. Reservations in the legislative assemblies have achieved proportional representation with respect to numbers, however the efficacy in terms of the real representation of SC and ST concerns through the elected representatives is doubtful. As discussed above, the articulateness and assertiveness of SC/ST candidates in the legislature has been seen to be lower, another possible limitation towards the representation of SC and ST concerns. As in the case of reservations in employment, once the differences in education level and quality of education of backward groups and the others are minimized, SC candidates in the legislature may be able to put forth their concerns better.
107
As discussed above, the reservations for women in the PRIs, has had an empowering effect on them in rural India and over time there has been increased participation by socio-economically backward women. This has also led to a change in the nature of investments in rural areas – a sign of the effectiveness of having women leaders. The demand for the reservations for women in both the central and the state legislatures is being considered by the parliament. As such it can be said that the reservations in employment have had some impact on reducing the gap between the SC and the STs and the general castes, but given the size of the public sector, and its decreasing relevance, the impact cannot be significant in terms of employment. Politically, however, the impact may have been significant – allowing them to leverage other benefits. As such the process of land reforms, the Green Revolution, the trajectory of education policies, including job reservations for OBCs have all contributed towards the making of a stronger and large middle class. This may have reduced the gap in employment between the highest classes and them. However the benefits received by the middle classes, may have widened the gap between themselves and the lower classes that would include a large proportion of the SCs and STs and other poor groups.
6.3. Education policies and inequalities in India
6.3.1 Education policies and their changes over time Education in India has come a long way from 18 per cent adult literacy at the time of Independence to about 63 per cent in 2006. However differences in levels of education among socio-economic groups and regional variations were present long before Independence and continue to persist (see Table 6.3.1). Policies of universalization, affirmative action, and broader social change have helped in reducing gaps. Nevertheless issues of quality, embedded intergenerational factors, dynamics of development, liberalization and globalization have brought new challenges. Issues relating to lack of access such as in case of tribals, humiliation faced by Dalits, and social taboos for women have been reduced but not eliminated. 1950s till late 1968
Table 6.3.1: Effective literacy rate (above 6 years) of total population, SC and ST
108
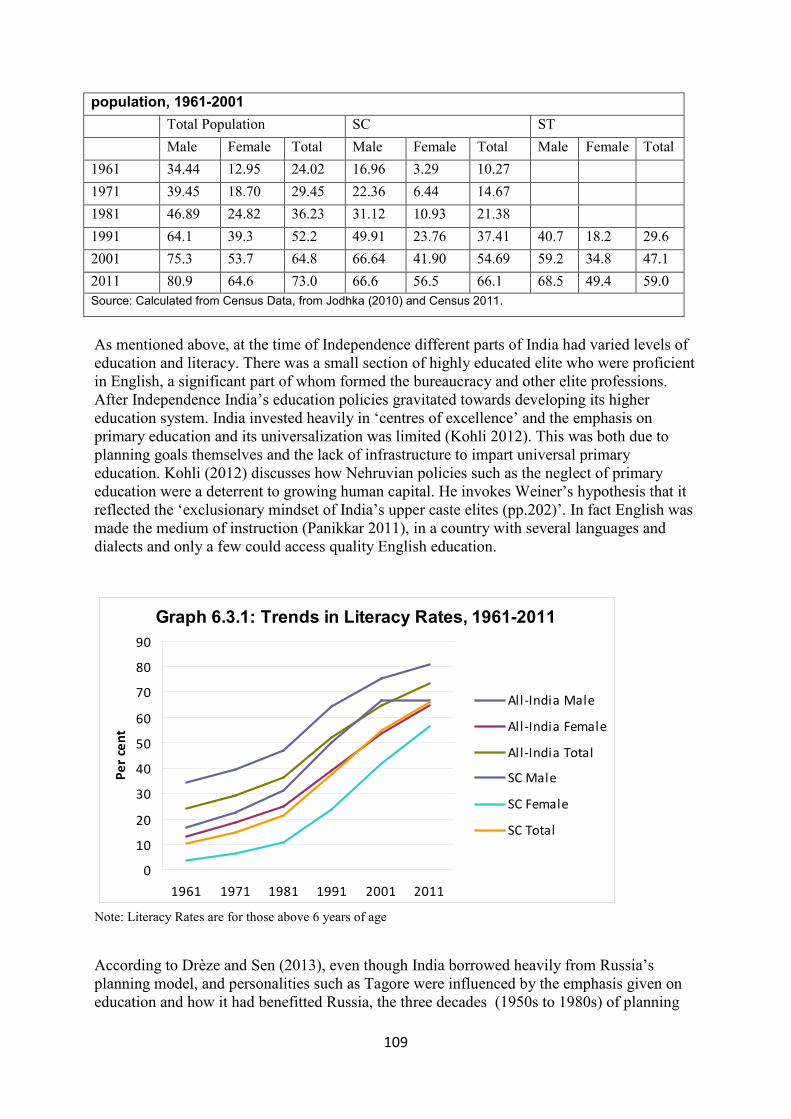
As mentioned above, at the time of Independence different parts of India had varied levels of education and literacy. There was a small section of highly educated elite who were proficient in English, a significant part of whom formed the bureaucracy and other elite professions. After Independence India’s education policies gravitated towards developing its higher education system. India invested heavily in ‘centres of excellence’ and the emphasis on primary education and its universalization was limited (Kohli 2012). This was both due to planning goals themselves and the lack of infrastructure to impart universal primary education. Kohli (2012) discusses how Nehruvian policies such as the neglect of primary education were a deterrent to growing human capital. He invokes Weiner’s hypothesis that it reflected the ‘exclusionary mindset of India’s upper caste elites (pp.202)’. In fact English was made the medium of instruction (Panikkar 2011), in a country with several languages and dialects and only a few could access quality English education.
Graph 6.3.1: Trends in Literacy Rates, 1961-2011
0
10
20
30
40
50
60
70
80
90
1961 1971 1981 1991 2001 2011
Per c
ent
All-India Male
All-India Female
All-India Total
SC Male
SC Female
SC Total
Note: Literacy Rates are for those above 6 years of age
According to Drèze and Sen (2013), even though India borrowed heavily from Russia’s planning model, and personalities such as Tagore were influenced by the emphasis given on education and how it had benefitted Russia, the three decades (1950s to 1980s) of planning
population, 1961-2001 Total Population SC ST Male Female Total Male Female Total Male Female Total 1961 34.44 12.95 24.02 16.96 3.29 10.27 1971 39.45 18.70 29.45 22.36 6.44 14.67 1981 46.89 24.82 36.23 31.12 10.93 21.38 1991 64.1 39.3 52.2 49.91 23.76 37.41 40.7 18.2 29.6 2001 75.3 53.7 64.8 66.64 41.90 54.69 59.2 34.8 47.1 2011 80.9 64.6 73.0 66.6 56.5 66.1 68.5 49.4 59.0 Source: Calculated from Census Data, from Jodhka (2010) and Census 2011.
109
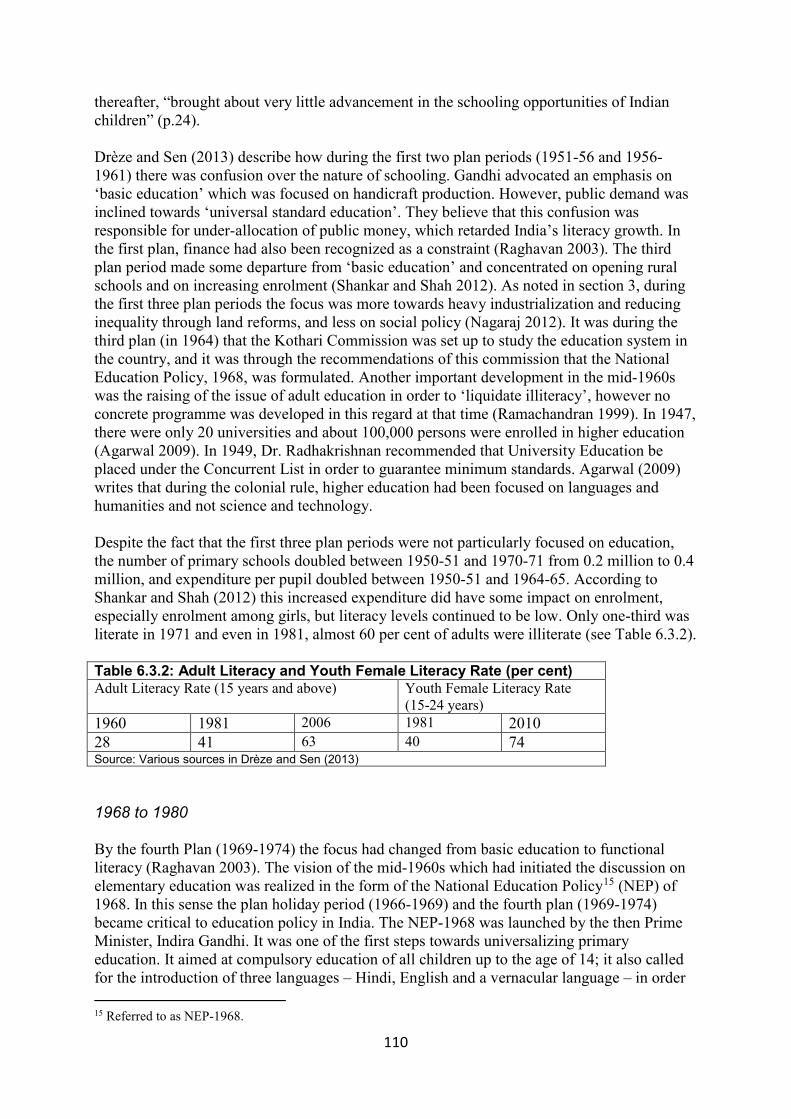
thereafter, “brought about very little advancement in the schooling opportunities of Indian children” (p.24). Drèze and Sen (2013) describe how during the first two plan periods (1951-56 and 1956-1961) there was confusion over the nature of schooling. Gandhi advocated an emphasis on ‘basic education’ which was focused on handicraft production. However, public demand was inclined towards ‘universal standard education’. They believe that this confusion was responsible for under-allocation of public money, which retarded India’s literacy growth. In the first plan, finance had also been recognized as a constraint (Raghavan 2003). The third plan period made some departure from ‘basic education’ and concentrated on opening rural schools and on increasing enrolment (Shankar and Shah 2012). As noted in section 3, during the first three plan periods the focus was more towards heavy industrialization and reducing inequality through land reforms, and less on social policy (Nagaraj 2012). It was during the third plan (in 1964) that the Kothari Commission was set up to study the education system in the country, and it was through the recommendations of this commission that the National Education Policy, 1968, was formulated. Another important development in the mid-1960s was the raising of the issue of adult education in order to ‘liquidate illiteracy’, however no concrete programme was developed in this regard at that time (Ramachandran 1999). In 1947, there were only 20 universities and about 100,000 persons were enrolled in higher education (Agarwal 2009). In 1949, Dr. Radhakrishnan recommended that University Education be placed under the Concurrent List in order to guarantee minimum standards. Agarwal (2009) writes that during the colonial rule, higher education had been focused on languages and humanities and not science and technology. Despite the fact that the first three plan periods were not particularly focused on education, the number of primary schools doubled between 1950-51 and 1970-71 from 0.2 million to 0.4 million, and expenditure per pupil doubled between 1950-51 and 1964-65. According to Shankar and Shah (2012) this increased expenditure did have some impact on enrolment, especially enrolment among girls, but literacy levels continued to be low. Only one-third was literate in 1971 and even in 1981, almost 60 per cent of adults were illiterate (see Table 6.3.2). Table 6.3.2: Adult Literacy and Youth Female Literacy Rate (per cent) Adult Literacy Rate (15 years and above) Youth Female Literacy Rate
(15-24 years) 1960 1981 2006 1981 2010 28 41 63 40 74 Source: Various sources in Drèze and Sen (2013) 1968 to 1980 By the fourth Plan (1969-1974) the focus had changed from basic education to functional literacy (Raghavan 2003). The vision of the mid-1960s which had initiated the discussion on elementary education was realized in the form of the National Education Policy15 (NEP) of 1968. In this sense the plan holiday period (1966-1969) and the fourth plan (1969-1974) became critical to education policy in India. The NEP-1968 was launched by the then Prime Minister, Indira Gandhi. It was one of the first steps towards universalizing primary education. It aimed at compulsory education of all children up to the age of 14; it also called for the introduction of three languages – Hindi, English and a vernacular language – in order
15 Referred to as NEP-1968.
110

to bridge the gulf between those who knew English and Hindi and those who did not. The Kothari Commission also recommended an increase in the budgetary allocation to education to around 6 per cent of the GNP by 1985-86 (Shankar and Shah 2012). The 5th plan (1974-79) focused on poverty, self-reliance and minimum needs which implied a continuing focus on elementary education. Public expenditure and per capita expenditure on education rose during this period (see Table 6.3.3); however in terms of GDP and total public expenditure, the percentage spent on education did not show any drastic increase even after the launch of specific policy measures. After the launch of the NEP-1968, the proportion spent on education as part of total public expenditure remained around 10 per cent (from 1955-56 till 1980-81), however in terms of proportion of GDP there was gradual increase during the 1960s to the 1980s. Table 6.3.3: Expenditure on Education 1951-52/2005-06 Public Expenditure
on Education Per Capita Expenditure on Education
Public Expenditure on Education as per cent of
Public Expenditure on Elementary Education
Constant Prices at 1999-2000
Constant Prices at 1999-2000
GDP Public Expenditure
GNP
1951-52 14,610 40.0 0.6 7.90 0.37 (1950-51)
1955-56 30,740 78.2 1.1 10.7 0.67 1960-61 48,180 111.0 1.4 11.9 0.78 1965-66 63,970 131.9 1.5 9.80 0.80 1970-71 99,780 184.4 1.9 10.2 0.97 1975-76 130,970 215.8 2.2 10.3 1.04 1980-81 185,800 273.6 2.7 10.7 1.07 1985-86 276,890 366.7 3.1 12.9 1.39 1990-91 411,050 489.9 3.4 13.4 1.58 1995-96 489,940 528.0 3.2 13.3 1.44 2000-01 796,810 782.0 3.9 14.4 1.58 2005-06 948,470 856.8 3.3 13.1 1.44 (2003-04) Source: National Accounts Statistics in Shankar and Shah (2012) Other programmes related to education were introduced during this period; such as the Integrated Child Development Services (ICDS) in 1975. Another important development in the 1970s was the 42nd Amendment to the Constitution, which made education a Concurrent issue (earlier it had been state responsibility) and therefore made the universalization of elementary education a responsibility of both the state and the central governments. In fact India had made a commitment towards universalizing education much before the landmark Jomtien Conference (1990) and the World Declaration on Education for All (Tilak 2009). During the mid-70s, another drive was initiated in order to liquidate illiteracy and this led to the National Adult Education Programme (NAEP) which was launched in 1978. Ramachandran (1999) states that “the 1970s was an era of radical literacy movements which saw literacy as an emancipatory tool (p.877)”. The adult education model was based on participation of voluntary organisations; while many organisations did genuine work, eventually due to corruption and other factors the programme did not work. It was later merged into the Total Literacy Campaign (TLC).
111

The impact of the National Education Policy was not stellar, but moderate. Even in 1981, about 61 per cent of India’s population was illiterate (see Table 6.3.2). There were a multitude of efforts during this period (as mentioned above) towards realizing education-related goals. Their impact from the 1950s till the 1980s can be seen in enrolment of both boys and girls in all levels of schooling as mentioned in Batra (2012) (see Table 6.3.4). The impact of education policies launched during this period can also be seen in Graph 6.3.1, which shows a faster growth in literacy from 1981 onwards. During 1961 to 1981, literacy rates increased from 24 per cent to 36 per cent. Among females (total) and for SCs literacy rates doubled from 12.95 per cent to 24.82 per cent and from 10.27 per cent to 21.38 per cent respectively; among SC females it more than trebled from a very low base of 3.3 per cent to 10.93 per cent. Table 6.3.4: Total school enrolment 1950-51 to 2004-05 (in millions) Boys Girls Total Boys Girls Total Boys Girls Total Primary Middle Secondary 1950-51
13.8 5.4 19.2 2.6 0.5 3.1 1.3 0.2 1.5
1980-81
45.3 28.5 73.8 13.9 6.8 20.7 7.6 3.4 11.0
2004-05
69.7 61.1 130.8 28.5 22.7 51.2 21.7 15.4 37.1
Source: Government of India in Batra (2009). Till the 1980s higher education in India continued to focus on humanities and languages, however there were some engineering colleges (such as the prestigious Indian Institutes of Technology, other engineering institutes, management studies institutes and others). During the 1960s and 70s, various private colleges developed, which were financially aided by the government; by the 1980, almost one-third of the colleges were private-aided. While the number of institutes grew (Agarwal 2009), the growth in quality institutes remained minimal. 1980 till 2007 The Sixth Plan (1980-85) which began in 1980 was significant with respect to education. The plan focussed on the issue of quality and also paid emphasis to optimum utilization of resources and maintaining linkages with other development programmes (Raghavan 2003). This period was also important as the NPE-1968 was revised under the Rajiv Gandhi government in 1986 and was called the New Education Policy; the revised policy paid special attention to women, SCs and STs. It proposed scholarships, adult education, recruitment of SC teachers etc., and recommended a minimum strength of 2 teachers per school. It also paid attention to infrastructure issues such as teaching materials and all-weather classrooms. The Mahila Samakhya, a programme aimed at women’s empowerment, was launched in 1989. In 1987 ‘operation blackboard’, a programme conceived out of the NEP -1986, was launched to ensure the above mentioned infrastructure provisioning. However, operation blackboard did not match expectations (see Shankar and Shah 2012) and this can be seen in the slow growth in the number of schools during 1990-91 and 2001-01 (Table 6.3.5). However, while the growth may be slow, the trends were in positive with respect to many indicators such as literacy, enrolment and number of schools etc. (see Table 6.3.1,Table 6.3.2, Table 6.3.4 and Table 6.3.5).
112
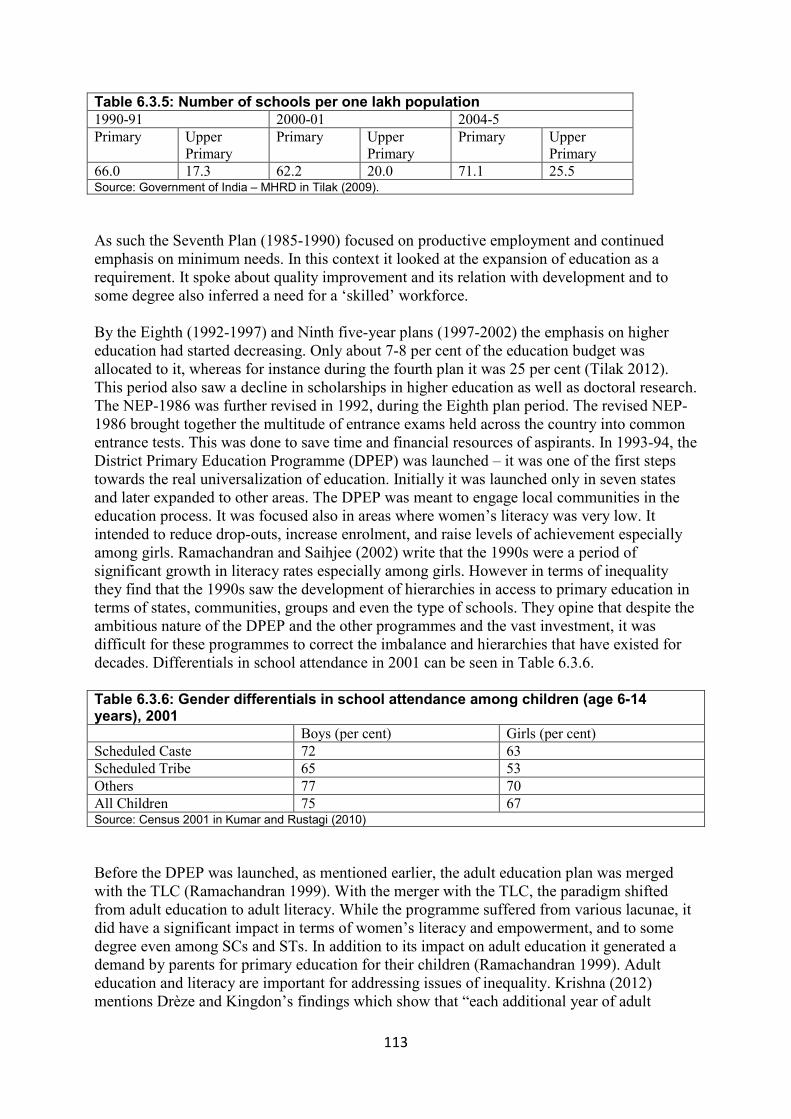
Table 6.3.5: Number of schools per one lakh population 1990-91 2000-01 2004-5 Primary Upper
Primary Primary Upper
Primary Primary Upper
Primary 66.0 17.3 62.2 20.0 71.1 25.5 Source: Government of India – MHRD in Tilak (2009). As such the Seventh Plan (1985-1990) focused on productive employment and continued emphasis on minimum needs. In this context it looked at the expansion of education as a requirement. It spoke about quality improvement and its relation with development and to some degree also inferred a need for a ‘skilled’ workforce. By the Eighth (1992-1997) and Ninth five-year plans (1997-2002) the emphasis on higher education had started decreasing. Only about 7-8 per cent of the education budget was allocated to it, whereas for instance during the fourth plan it was 25 per cent (Tilak 2012). This period also saw a decline in scholarships in higher education as well as doctoral research. The NEP-1986 was further revised in 1992, during the Eighth plan period. The revised NEP-1986 brought together the multitude of entrance exams held across the country into common entrance tests. This was done to save time and financial resources of aspirants. In 1993-94, the District Primary Education Programme (DPEP) was launched – it was one of the first steps towards the real universalization of education. Initially it was launched only in seven states and later expanded to other areas. The DPEP was meant to engage local communities in the education process. It was focused also in areas where women’s literacy was very low. It intended to reduce drop-outs, increase enrolment, and raise levels of achievement especially among girls. Ramachandran and Saihjee (2002) write that the 1990s were a period of significant growth in literacy rates especially among girls. However in terms of inequality they find that the 1990s saw the development of hierarchies in access to primary education in terms of states, communities, groups and even the type of schools. They opine that despite the ambitious nature of the DPEP and the other programmes and the vast investment, it was difficult for these programmes to correct the imbalance and hierarchies that have existed for decades. Differentials in school attendance in 2001 can be seen in Table 6.3.6. Table 6.3.6: Gender differentials in school attendance among children (age 6-14 years), 2001 Boys (per cent) Girls (per cent) Scheduled Caste 72 63 Scheduled Tribe 65 53 Others 77 70 All Children 75 67 Source: Census 2001 in Kumar and Rustagi (2010) Before the DPEP was launched, as mentioned earlier, the adult education plan was merged with the TLC (Ramachandran 1999). With the merger with the TLC, the paradigm shifted from adult education to adult literacy. While the programme suffered from various lacunae, it did have a significant impact in terms of women’s literacy and empowerment, and to some degree even among SCs and STs. In addition to its impact on adult education it generated a demand by parents for primary education for their children (Ramachandran 1999). Adult education and literacy are important for addressing issues of inequality. Krishna (2012) mentions Drèze and Kingdon’s findings which show that “each additional year of adult
113
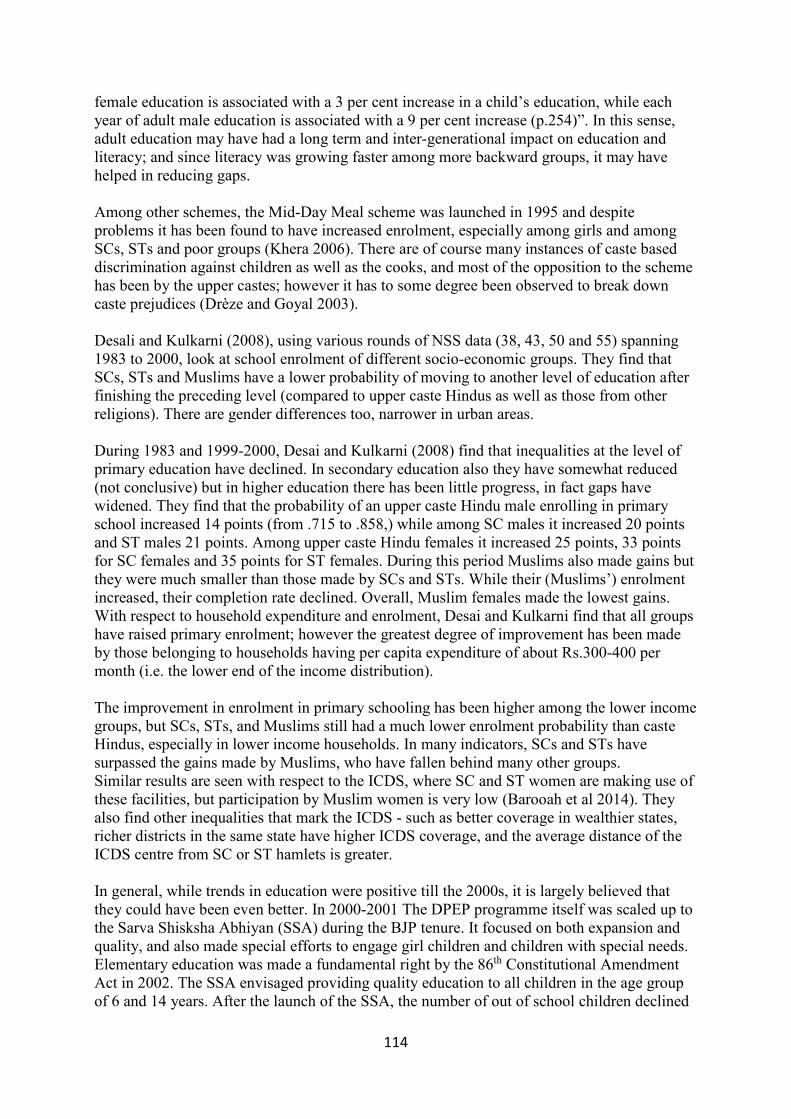
female education is associated with a 3 per cent increase in a child’s education, while each year of adult male education is associated with a 9 per cent increase (p.254)”. In this sense, adult education may have had a long term and inter-generational impact on education and literacy; and since literacy was growing faster among more backward groups, it may have helped in reducing gaps. Among other schemes, the Mid-Day Meal scheme was launched in 1995 and despite problems it has been found to have increased enrolment, especially among girls and among SCs, STs and poor groups (Khera 2006). There are of course many instances of caste based discrimination against children as well as the cooks, and most of the opposition to the scheme has been by the upper castes; however it has to some degree been observed to break down caste prejudices (Drèze and Goyal 2003). Desali and Kulkarni (2008), using various rounds of NSS data (38, 43, 50 and 55) spanning 1983 to 2000, look at school enrolment of different socio-economic groups. They find that SCs, STs and Muslims have a lower probability of moving to another level of education after finishing the preceding level (compared to upper caste Hindus as well as those from other religions). There are gender differences too, narrower in urban areas. During 1983 and 1999-2000, Desai and Kulkarni (2008) find that inequalities at the level of primary education have declined. In secondary education also they have somewhat reduced (not conclusive) but in higher education there has been little progress, in fact gaps have widened. They find that the probability of an upper caste Hindu male enrolling in primary school increased 14 points (from .715 to .858,) while among SC males it increased 20 points and ST males 21 points. Among upper caste Hindu females it increased 25 points, 33 points for SC females and 35 points for ST females. During this period Muslims also made gains but they were much smaller than those made by SCs and STs. While their (Muslims’) enrolment increased, their completion rate declined. Overall, Muslim females made the lowest gains. With respect to household expenditure and enrolment, Desai and Kulkarni find that all groups have raised primary enrolment; however the greatest degree of improvement has been made by those belonging to households having per capita expenditure of about Rs.300-400 per month (i.e. the lower end of the income distribution). The improvement in enrolment in primary schooling has been higher among the lower income groups, but SCs, STs, and Muslims still had a much lower enrolment probability than caste Hindus, especially in lower income households. In many indicators, SCs and STs have surpassed the gains made by Muslims, who have fallen behind many other groups. Similar results are seen with respect to the ICDS, where SC and ST women are making use of these facilities, but participation by Muslim women is very low (Barooah et al 2014). They also find other inequalities that mark the ICDS - such as better coverage in wealthier states, richer districts in the same state have higher ICDS coverage, and the average distance of the ICDS centre from SC or ST hamlets is greater. In general, while trends in education were positive till the 2000s, it is largely believed that they could have been even better. In 2000-2001 The DPEP programme itself was scaled up to the Sarva Shisksha Abhiyan (SSA) during the BJP tenure. It focused on both expansion and quality, and also made special efforts to engage girl children and children with special needs. Elementary education was made a fundamental right by the 86th Constitutional Amendment Act in 2002. The SSA envisaged providing quality education to all children in the age group of 6 and 14 years. After the launch of the SSA, the number of out of school children declined
114
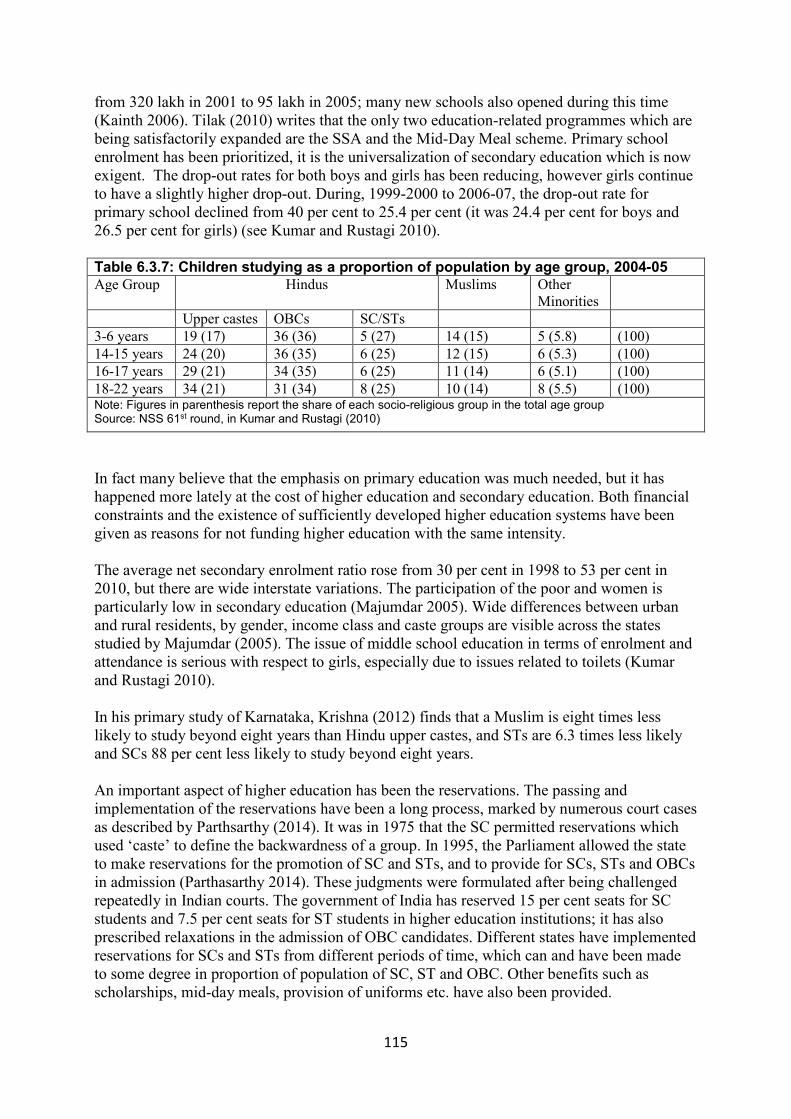
from 320 lakh in 2001 to 95 lakh in 2005; many new schools also opened during this time (Kainth 2006). Tilak (2010) writes that the only two education-related programmes which are being satisfactorily expanded are the SSA and the Mid-Day Meal scheme. Primary school enrolment has been prioritized, it is the universalization of secondary education which is now exigent. The drop-out rates for both boys and girls has been reducing, however girls continue to have a slightly higher drop-out. During, 1999-2000 to 2006-07, the drop-out rate for primary school declined from 40 per cent to 25.4 per cent (it was 24.4 per cent for boys and 26.5 per cent for girls) (see Kumar and Rustagi 2010). Table 6.3.7: Children studying as a proportion of population by age group, 2004-05 Age Group Hindus Muslims Other
Minorities
Upper castes OBCs SC/STs 3-6 years 19 (17) 36 (36) 5 (27) 14 (15) 5 (5.8) (100) 14-15 years 24 (20) 36 (35) 6 (25) 12 (15) 6 (5.3) (100) 16-17 years 29 (21) 34 (35) 6 (25) 11 (14) 6 (5.1) (100) 18-22 years 34 (21) 31 (34) 8 (25) 10 (14) 8 (5.5) (100) Note: Figures in parenthesis report the share of each socio-religious group in the total age group Source: NSS 61st round, in Kumar and Rustagi (2010)
In fact many believe that the emphasis on primary education was much needed, but it has happened more lately at the cost of higher education and secondary education. Both financial constraints and the existence of sufficiently developed higher education systems have been given as reasons for not funding higher education with the same intensity. The average net secondary enrolment ratio rose from 30 per cent in 1998 to 53 per cent in 2010, but there are wide interstate variations. The participation of the poor and women is particularly low in secondary education (Majumdar 2005). Wide differences between urban and rural residents, by gender, income class and caste groups are visible across the states studied by Majumdar (2005). The issue of middle school education in terms of enrolment and attendance is serious with respect to girls, especially due to issues related to toilets (Kumar and Rustagi 2010). In his primary study of Karnataka, Krishna (2012) finds that a Muslim is eight times less likely to study beyond eight years than Hindu upper castes, and STs are 6.3 times less likely and SCs 88 per cent less likely to study beyond eight years. An important aspect of higher education has been the reservations. The passing and implementation of the reservations have been a long process, marked by numerous court cases as described by Parthsarthy (2014). It was in 1975 that the SC permitted reservations which used ‘caste’ to define the backwardness of a group. In 1995, the Parliament allowed the state to make reservations for the promotion of SC and STs, and to provide for SCs, STs and OBCs in admission (Parthasarthy 2014). These judgments were formulated after being challenged repeatedly in Indian courts. The government of India has reserved 15 per cent seats for SC students and 7.5 per cent seats for ST students in higher education institutions; it has also prescribed relaxations in the admission of OBC candidates. Different states have implemented reservations for SCs and STs from different periods of time, which can and have been made to some degree in proportion of population of SC, ST and OBC. Other benefits such as scholarships, mid-day meals, provision of uniforms etc. have also been provided.
115
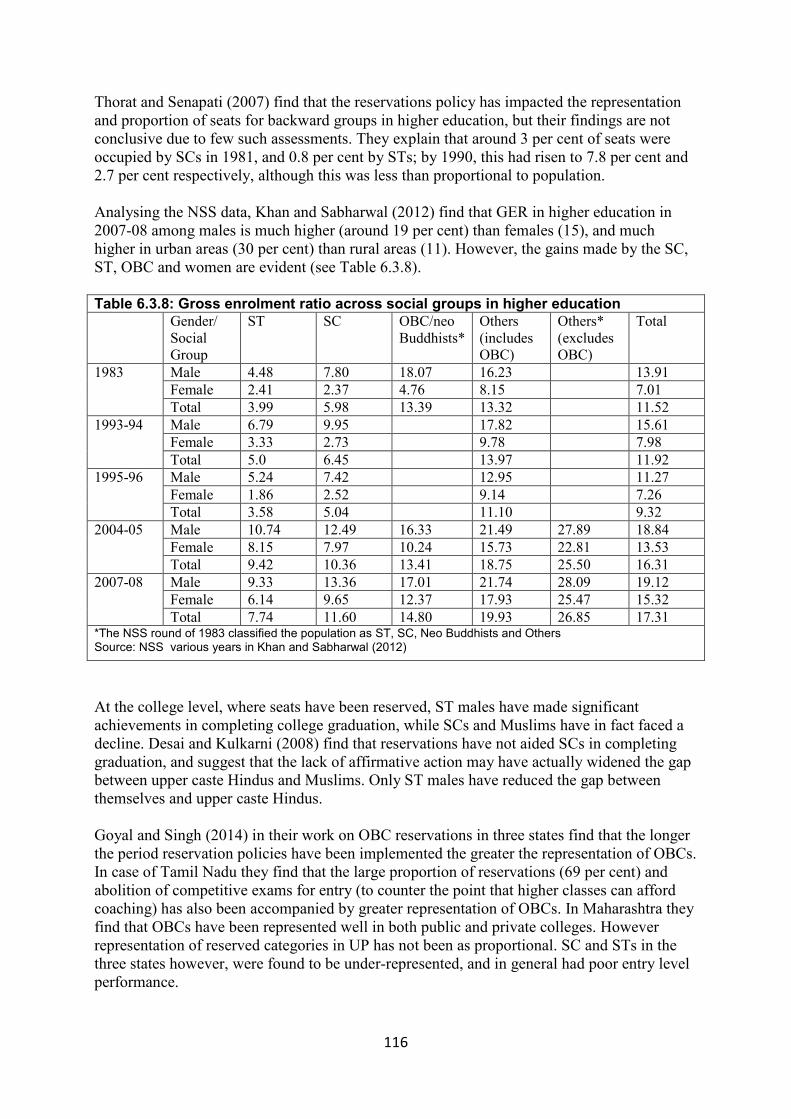
Thorat and Senapati (2007) find that the reservations policy has impacted the representation and proportion of seats for backward groups in higher education, but their findings are not conclusive due to few such assessments. They explain that around 3 per cent of seats were occupied by SCs in 1981, and 0.8 per cent by STs; by 1990, this had risen to 7.8 per cent and 2.7 per cent respectively, although this was less than proportional to population. Analysing the NSS data, Khan and Sabharwal (2012) find that GER in higher education in 2007-08 among males is much higher (around 19 per cent) than females (15), and much higher in urban areas (30 per cent) than rural areas (11). However, the gains made by the SC, ST, OBC and women are evident (see Table 6.3.8). Table 6.3.8: Gross enrolment ratio across social groups in higher education Gender/
Social Group
ST SC OBC/neo Buddhists*
Others (includes OBC)
Others* (excludes OBC)
Total
1983 Male 4.48 7.80 18.07 16.23 13.91 Female 2.41 2.37 4.76 8.15 7.01 Total 3.99 5.98 13.39 13.32 11.52
1993-94 Male 6.79 9.95 17.82 15.61 Female 3.33 2.73 9.78 7.98 Total 5.0 6.45 13.97 11.92
1995-96 Male 5.24 7.42 12.95 11.27 Female 1.86 2.52 9.14 7.26 Total 3.58 5.04 11.10 9.32
2004-05 Male 10.74 12.49 16.33 21.49 27.89 18.84 Female 8.15 7.97 10.24 15.73 22.81 13.53 Total 9.42 10.36 13.41 18.75 25.50 16.31
2007-08 Male 9.33 13.36 17.01 21.74 28.09 19.12 Female 6.14 9.65 12.37 17.93 25.47 15.32 Total 7.74 11.60 14.80 19.93 26.85 17.31
*The NSS round of 1983 classified the population as ST, SC, Neo Buddhists and Others Source: NSS various years in Khan and Sabharwal (2012)
At the college level, where seats have been reserved, ST males have made significant achievements in completing college graduation, while SCs and Muslims have in fact faced a decline. Desai and Kulkarni (2008) find that reservations have not aided SCs in completing graduation, and suggest that the lack of affirmative action may have actually widened the gap between upper caste Hindus and Muslims. Only ST males have reduced the gap between themselves and upper caste Hindus. Goyal and Singh (2014) in their work on OBC reservations in three states find that the longer the period reservation policies have been implemented the greater the representation of OBCs. In case of Tamil Nadu they find that the large proportion of reservations (69 per cent) and abolition of competitive exams for entry (to counter the point that higher classes can afford coaching) has also been accompanied by greater representation of OBCs. In Maharashtra they find that OBCs have been represented well in both public and private colleges. However representation of reserved categories in UP has not been as proportional. SC and STs in the three states however, were found to be under-represented, and in general had poor entry level performance.
116
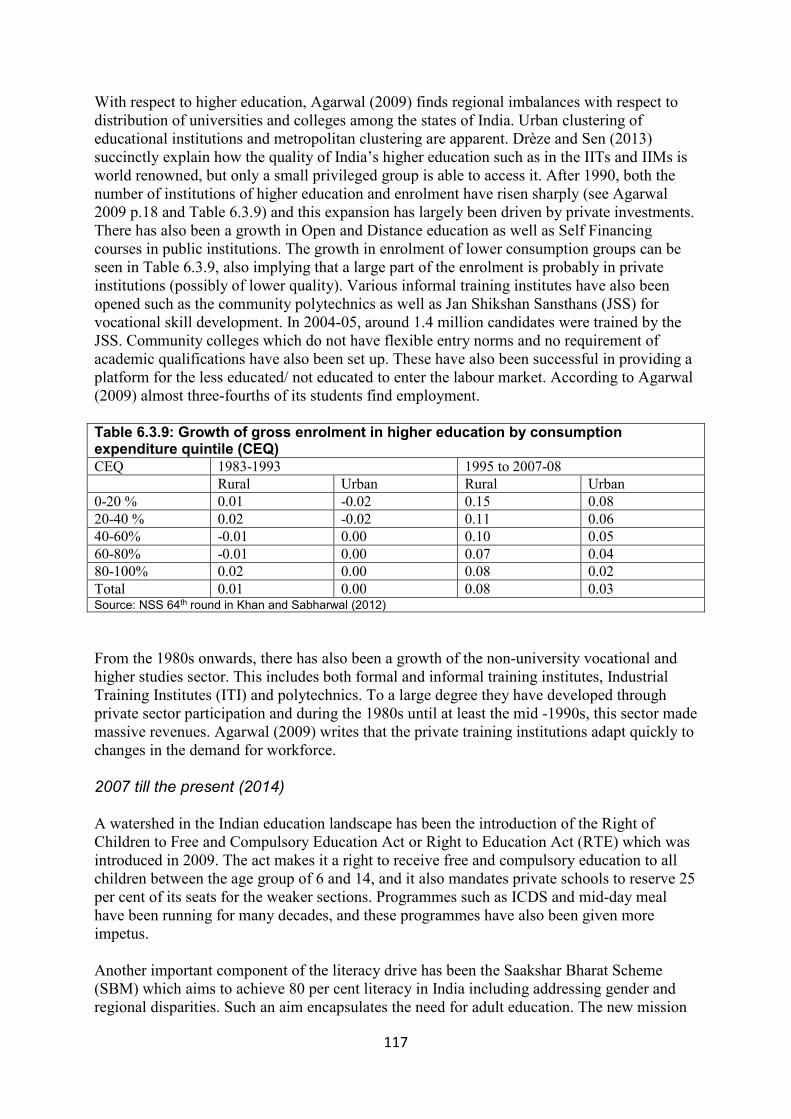
With respect to higher education, Agarwal (2009) finds regional imbalances with respect to distribution of universities and colleges among the states of India. Urban clustering of educational institutions and metropolitan clustering are apparent. Drèze and Sen (2013) succinctly explain how the quality of India’s higher education such as in the IITs and IIMs is world renowned, but only a small privileged group is able to access it. After 1990, both the number of institutions of higher education and enrolment have risen sharply (see Agarwal 2009 p.18 and Table 6.3.9) and this expansion has largely been driven by private investments. There has also been a growth in Open and Distance education as well as Self Financing courses in public institutions. The growth in enrolment of lower consumption groups can be seen in Table 6.3.9, also implying that a large part of the enrolment is probably in private institutions (possibly of lower quality). Various informal training institutes have also been opened such as the community polytechnics as well as Jan Shikshan Sansthans (JSS) for vocational skill development. In 2004-05, around 1.4 million candidates were trained by the JSS. Community colleges which do not have flexible entry norms and no requirement of academic qualifications have also been set up. These have also been successful in providing a platform for the less educated/ not educated to enter the labour market. According to Agarwal (2009) almost three-fourths of its students find employment. Table 6.3.9: Growth of gross enrolment in higher education by consumption expenditure quintile (CEQ) CEQ 1983-1993 1995 to 2007-08 Rural Urban Rural Urban 0-20 % 0.01 -0.02 0.15 0.08 20-40 % 0.02 -0.02 0.11 0.06 40-60% -0.01 0.00 0.10 0.05 60-80% -0.01 0.00 0.07 0.04 80-100% 0.02 0.00 0.08 0.02 Total 0.01 0.00 0.08 0.03 Source: NSS 64th round in Khan and Sabharwal (2012) From the 1980s onwards, there has also been a growth of the non-university vocational and higher studies sector. This includes both formal and informal training institutes, Industrial Training Institutes (ITI) and polytechnics. To a large degree they have developed through private sector participation and during the 1980s until at least the mid -1990s, this sector made massive revenues. Agarwal (2009) writes that the private training institutions adapt quickly to changes in the demand for workforce. 2007 till the present (2014) A watershed in the Indian education landscape has been the introduction of the Right of Children to Free and Compulsory Education Act or Right to Education Act (RTE) which was introduced in 2009. The act makes it a right to receive free and compulsory education to all children between the age group of 6 and 14, and it also mandates private schools to reserve 25 per cent of its seats for the weaker sections. Programmes such as ICDS and mid-day meal have been running for many decades, and these programmes have also been given more impetus. Another important component of the literacy drive has been the Saakshar Bharat Scheme (SBM) which aims to achieve 80 per cent literacy in India including addressing gender and regional disparities. Such an aim encapsulates the need for adult education. The new mission
117

centralizes the role of the Panchayati Raj Institutions (PRIs) in adult education, but Arya (2010) notes that the plan has ignored the already burdened PRIs and their often illiterate representatives. The Rashtriya Madhyamik Shiksha Abhiyan (RMSA), another programme aimed at the development of secondary education, was launched in 2009. It aims at achieving an enrolment ratio of 75 per cent in secondary schooling by 2014; in 2010 the ratio was 53 per cent. More recently in 2013, the Rashtriya Uchchatar Shiksha Abhiyan (RUSA) was launched in order to aid higher education. It aims to achieve a gross enrolment ratio of more than 30 per cent by 2016 along with other goals. The Eleventh Plan (2007-2012) has been named an Education Plan; it has emphasized elementary education, and has also greatly emphasized expansion in higher education. It calls for universal elementary education, including hard-to-reach segments and ensuring universalization among girls, and backward groups such as SCs and STs (Tilak 2010). With respect to higher education, it has placed many targets along with plans to open new universities (15 out of proposed 30 have been opened). However this expansion in higher education is being envisaged jointly though private capital, including foreign universities as well as Public-Private Partnerships. The Twelfth Plan (2012-2017) has in fact proposed involvement of the private sector in the delivery of mid-day meals etc. (Tilak 2012). Private sector participation has been increasing since liberalization; during the period 2007 to 2012, the share of the private sector in gross enrolment has increased from 54.2 per cent to 58.9 per cent. Education is constitutionally listed as a not-for-profit activity, but the 12th Plan, calls for a review of the definition of these clauses (Bhushan 2013). With respect to the growth of ITIs, polytechnics and vocational training institutes in the last two decades, the private sector component has been predominant. In the late 2000s, about 50 per cent of polytechnics and 63 per cent of ITI s and Industrial Training Centres (ITCs) were private initiatives. These institutes aim to cater more directly to professional demands of the employment sector. As such the ITI s and ITCs are focused on engineering related trades, other courses related to handicrafts and non-engineering courses are also available. Based on a World Bank study in Karnataka, Agarwal (2009) writes that labour market outcomes of those having ITI or ITC certificates are better than those who have completed Grade 10 or Grade 12, but about 60 per cent still remained unemployed after three years of having completed the course. The Eleventh and Twelfth five-year plans, considering that there was a shortage of skilled manpower, have given emphasis to ‘skilling’. The National Policy on Skill Development aims to skill 500 million by 2022 by providing resources and promoting private sector initiatives. The policy aims at enhancing employability, productivity and competitiveness and aims to attract investment for skill development. It will include vocational courses, polytechnics, apprenticeships, adult learning and e-learning. The policy also proposes to undertake ‘skilling’ in an equitable manner and has special provisions for SCs, STs, OBCs as well as minorities. State-wise and sector-wise assessments of demand (for labour) are being used to understand skilling needs (Government of India 2009). However, according to Mehrotra et al (2013), these policies provide no clarity on the definition of skill among other issues. For their analysis they consider those having vocational training, post secondary technical education and those having completed secondary education (up to class 10) as skilled. The low levels of education (a base for skill formation) are a
118
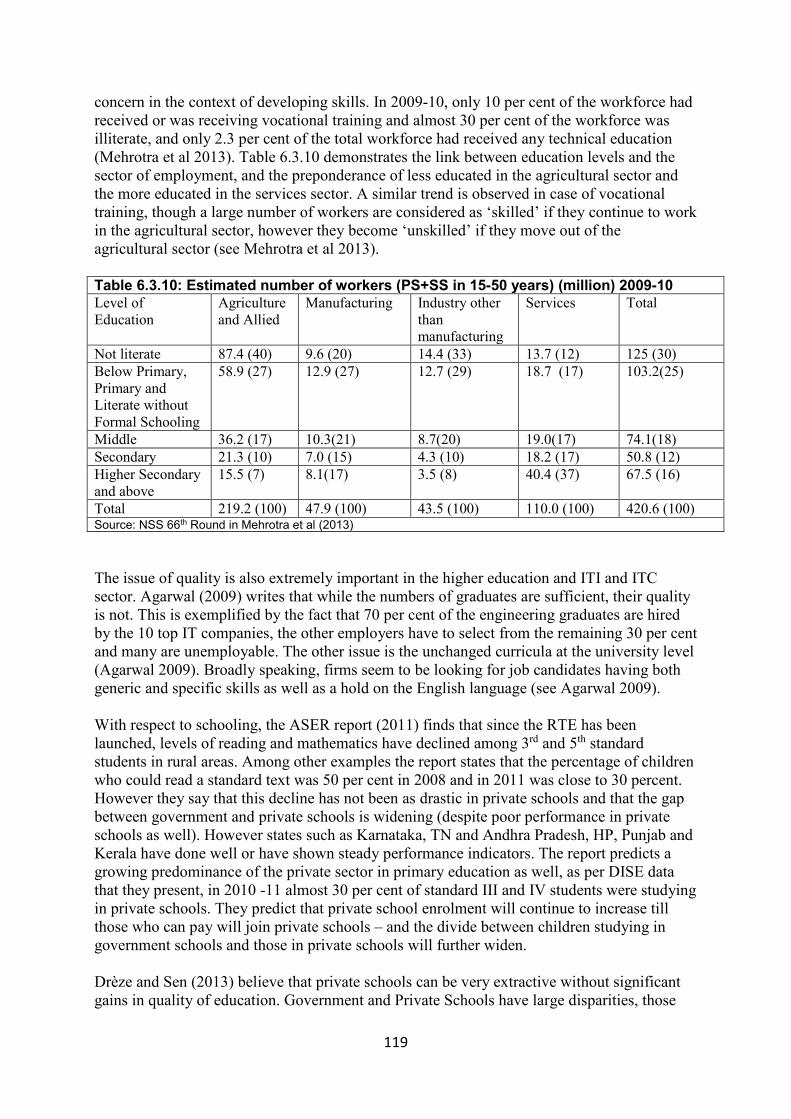
concern in the context of developing skills. In 2009-10, only 10 per cent of the workforce had received or was receiving vocational training and almost 30 per cent of the workforce was illiterate, and only 2.3 per cent of the total workforce had received any technical education (Mehrotra et al 2013). Table 6.3.10 demonstrates the link between education levels and the sector of employment, and the preponderance of less educated in the agricultural sector and the more educated in the services sector. A similar trend is observed in case of vocational training, though a large number of workers are considered as ‘skilled’ if they continue to work in the agricultural sector, however they become ‘unskilled’ if they move out of the agricultural sector (see Mehrotra et al 2013). Table 6.3.10: Estimated number of workers (PS+SS in 15-50 years) (million) 2009-10 Level of Education
Agriculture and Allied
Manufacturing Industry other than manufacturing
Services Total
Not literate 87.4 (40) 9.6 (20) 14.4 (33) 13.7 (12) 125 (30) Below Primary, Primary and Literate without Formal Schooling
58.9 (27) 12.9 (27) 12.7 (29) 18.7 (17) 103.2(25)
Middle 36.2 (17) 10.3(21) 8.7(20) 19.0(17) 74.1(18) Secondary 21.3 (10) 7.0 (15) 4.3 (10) 18.2 (17) 50.8 (12) Higher Secondary and above
15.5 (7) 8.1(17) 3.5 (8) 40.4 (37) 67.5 (16)
Total 219.2 (100) 47.9 (100) 43.5 (100) 110.0 (100) 420.6 (100) Source: NSS 66th Round in Mehrotra et al (2013) The issue of quality is also extremely important in the higher education and ITI and ITC sector. Agarwal (2009) writes that while the numbers of graduates are sufficient, their quality is not. This is exemplified by the fact that 70 per cent of the engineering graduates are hired by the 10 top IT companies, the other employers have to select from the remaining 30 per cent and many are unemployable. The other issue is the unchanged curricula at the university level (Agarwal 2009). Broadly speaking, firms seem to be looking for job candidates having both generic and specific skills as well as a hold on the English language (see Agarwal 2009). With respect to schooling, the ASER report (2011) finds that since the RTE has been launched, levels of reading and mathematics have declined among 3rd and 5th standard students in rural areas. Among other examples the report states that the percentage of children who could read a standard text was 50 per cent in 2008 and in 2011 was close to 30 percent. However they say that this decline has not been as drastic in private schools and that the gap between government and private schools is widening (despite poor performance in private schools as well). However states such as Karnataka, TN and Andhra Pradesh, HP, Punjab and Kerala have done well or have shown steady performance indicators. The report predicts a growing predominance of the private sector in primary education as well, as per DISE data that they present, in 2010 -11 almost 30 per cent of standard III and IV students were studying in private schools. They predict that private school enrolment will continue to increase till those who can pay will join private schools – and the divide between children studying in government schools and those in private schools will further widen. Drèze and Sen (2013) believe that private schools can be very extractive without significant gains in quality of education. Government and Private Schools have large disparities, those
119
who can afford to and those who can geographically access private schools, feel private schools are qualitatively better. Batra (2009) indicates that during 1986 and 1993, 60 per cent of growth in enrolment in primary education in urban areas was to private unaided schools. This also includes private schools which are of poor quality and not established. Using various primary survey results, Drèze and Sen show that the achievements of primary school students are dismal. The move to private schools in rural areas as Wadhwa (2009) describes has been initiated due to parents emulating the urban phenomenon where the elite moved from government to private schools perhaps for better English education among other factors. Ramachandran and Saihjee (2002) raise an important issue; they explain that “where children of the more powerful groups shift to private schools, the pressure on government schools declines sharply. The issue of quality of education is central to the discussion on inequality and therefore demands accountability. Drèze and Sen (2013) in this context write about the need for inspections, pupil and school evaluations, and cooperation from teachers. 6.3.2 Persisting and changing patterns of inequality While education is potentially one of the foremost instruments for bringing about greater equality, its unequal distribution or denial is also a tool to perpetuate inequality. Panikkar (2011) says that “Education is an instrument of power, particularly in present conditions when knowledge has emerged as a crucial factor for perpetuating the existing unequal relationships in society (pp.41)”. He believes that both the BJP-led and the Congress-led governments have been responsible for the state of Indian education; for emphasizing traditional knowledge in case of the former and for emulating the West in case of the latter. He also believes that the withdrawal of the state from providing education has been a big contributor to this. He maintains that the middle class has gained from the colonial education system; and after Independence the middle class has been further benefitted by the elitism of higher education. The middle class has grown in its size, more so after globalisation; it has not resisted inequalities in education, and in that it has been able to influence them to their benefit. Trends in education (access, enrolment, retention, infrastructure etc.) have been positive since the 1950s, with some instances of deterioration in indicators (such as in learning achievements mentioned earlier). It is evident that differences exist at all levels of education – primary, secondary, higher education and even vocational education, and among different socio-economic groups such as caste, religion, gender, place of stay among others. In case of literacy, while all groups have been making progress, it is perplexing that since 2001 the level of literacy in case of SCs has plateaued (see Graph 6.3.1). Educational progress among Muslims has also been slow. Similarly, while STs and especially ST males have been able to make more rapid strides with respect to education indicators, SCs have been unable to do so. While differences have reduced to a large degree in case of literacy and primary education (owing to the emphasis on universalization), they are now accumulating at the level of secondary education and higher education. As per Desai and Kulkarni’s (2008) findings, the gaps in primary education and to some degree in case of secondary education have been reduced, however according to them, the gaps in case of higher education have actually widened. This gap in higher education is critical to a discussion on inequality and labour market outcomes. Higher education, and particularly good quality higher education is a prerequisite for attaining higher income jobs and since inequalities are being reproduced at the level of higher education, they will generate similar inequalities in labour market outcomes.
120
One of the challenges in making the education less elitist, according to Majumdar (2005) is going to be to move from universal elementary education to universal secondary education. Secondary education is compulsory in developed nations and even in India both quantitative and qualitative demand for it is set to rise (see Majumdar 2005). On the broader pattern of schooling, Singh (1999) believes that structure of the education system has been flawed. He maintains that in developed countries, the school system is sufficient for finding decent work. However, the necessity of attending college (60 per cent of those who complete higher secondary education move on to attending college) to gain decent employment is a failure of the quality and focus of the school system. Batra (2009) points to the fact that while the debate on private and public schools has various dimensions of inequality, the government schools themselves are hierarchical and this can be seen with respect to the various tiers of ‘model schools’, ‘Navodaya schools’, Pratibha Vikas Vidhyalayas’ and ‘Sarvodaya Vidyalaya’. According to him, the hierarchy among government schools themselves is inducing greater inequality. Studies point out that those with higher education and skills have reaped greater benefits from the growth trajectory that India has followed. This means that the path of concentrating on higher education in the early years after Independence may have sowed the seeds of greater inequality. Many argue that despite large scale universalization of primary education today, the issue of quality may almost negate any benefits of education. Due to a low growth of jobs in general, even those having completed primary, secondary and often higher education are forced to undertake casual wage labour. In fact it is possible that due to the lack of adequate jobs, encouraging families to educate their children (for future benefits) may have actually increased inequality due to the opportunity cost of their schooling in terms of lost earnings. Another critical debate in the context of education and inequality is privatization. Privatization in education may imply some gains in quality (at the school level) but this is likely to be modest (as reported by Drèze and Sen 2013, Batra 2009). It is likely to lower the pressure on government schools to maintain quality standards. Moreover, since backward and poor groups are less likely to attend private education, the higher class/caste groups which do attend them are likely to be better equipped in English and other skills. Similarly, privatization of higher education and vocational training has already happened to a large scale. While one of the advantages of private training institutions has been their ability to adapt to changes in demand for skills, they require the households/ students to finance themselves, and those who complete their training cannot compete with those who have studied at premier institutes. However, they do provide increased and possibly better labour market opportunities to those who have had limited or no schooling, and no other options for training. In this sense, they may have helped reduce the inequality gap. In case of higher education, opportunities have expanded due to private initiatives, but the issue of both financing private education and quality issues might lead to similar reproductions of inequality. The knowledge of the English language seems to be important in determining labour market outcomes and given schooling trends, children from backward classes are likely to lose-out to richer classes studying in private schools. Even in case of reservations, it seems that the more backward groups (the SCs and the STs) do not have proportional representation at the university level, while OBCs have been proportionally represented. It could be said that the existing inequalities are being reproduced at the higher education level and therefore also in labour market outcomes. These inequalities are likely to be exacerbated
121
by increased privatization of both lower levels of schooling and of higher education, as it will be more difficult for the poorer groups to access them. In sum, the inequalities in education seem to be as great as before, and therefore the contribution of education to social and economic inequality is as great as before.
6.4. Social protection, social security and anti-poverty transfers 6.4.1 Socio-economic context of India’s social security policy India’s social security policies have been weak, variegated and different from those of the Western industrial countries. There are historical and other reasons for this. Firstly, unlike the Western countries where social security policies emerged out of industrialization, the contexts of India’s social security policies were different due to entirely different socio-economic conditions. Mass poverty, structural socio-economic inequality, predominantly rural society and agrarian economy set the contours of India’s social security policies. Secondly, while the goals of social security policies in Western industrial countries were limited, and aimed largely as relief measures against fall in wages, loss of employment following retrenchment, shut down, economic slowdown, etc., the goals of social security policies in India have been poverty centric, that is to reduce the vulnerability of the poor to starvation, hunger malnutrition, etc. Only recently has the gamut of social security policy been widened. Also there has been a shift in social sector development policy with a rights based development approach and greater emphasis on the aspects of human development. Thirdly, the tenor of social security policy in the West has been protective, i.e., mainly to insure against economic loss, while social policy in India has been promotional. The demand for adequate social protection measures has increased in the liberalization phase. More and more people are finding jobs in the private sector and their job is subject to the vagaries of market. Also, because of the complexity of socio-economic structure, the social sector policies in India have been very diverse. They not only aim at providing a minimum income, but also at positive discrimination, mitigating/eradicating structural roots of socio-economic inequalities and promoting socio-economic development of the vast majority of population, especially SCs, STs, Women and minorities. 6.4.2 Historical context of India’s social security policy Historically, probably the most important and widely implemented “social security” policy in India has consisted of public works programmes. Their philosophical genesis lies in the important ancient treatise Arthashashtra that laid down certain principles and policies to be followed by the King. Promoting welfare of the people was an important niti (policy) of the State to be followed by the King. A large number of big temples, especially in the South, were constructed by the then rulers to give employment to skilled and unskilled workers. During the medieval period, Moghul rulers continued with the policy of public works programme, and constructed irrigational canals, wells, and roads. Sher Shah Suri made a major impact through the construction of the famous Grand Trunk road, connecting east to west, and built shelter houses for the travelers along the road. He also took up irrigation works in his empire. While these programmes created lasting assets, they also frequently had the aim of transferring resources to the poor.
122
The Colonial Government continued with such public works programmes. Amidst frequent famines and starvation death, public works programmes were institutionalized as a relief measure by the Colonial Government. They were continued in the post-independence period, as the frequent failures of the monsoon and drought in major parts of the country made it an imperative for the democratic governments of Independent India to retain such measures. Dreze and Sen, (1991) have argued that the popular pressure on democratic government is an important factor that post-Independent India has avoided any large scale famine and starvation death in contrast to frequent famines and starvation death during the pre-independence period. 6.4.3 Social security measures in post-Independent India Indian Constitution and social security measures In post-Independence period, the Constitution of India set the broad contours of India’s social security measures, mainly through the Directive Principles of State Policy, contained in Part IV of the Constitution. It provided a set of policy guidelines for the State to promote various social security measures. Important provisions of the Directive Principles from the social security point of view are included in Articles 38,39,41,42,43 and 45. Article 38 declares: “The State shall, in particular, direct its policy towards securing— (a) that the citizens, men and women equally, have the right to an adequate means of livelihood; (b) that the ownership and control of the material resources of the community are so distributed as best to subserve the common good; (c) that the operation of the economic system does not result in the concentration of wealth and means of production to the common detriment; (d) that there is equal pay for equal work for both men and women; (e) that the health and strength of workers, men and women, and the tender age of children are not abused and that citizens are not forced by economic necessity to enter avocations unsuited to their age or strength; (f) that children are given opportunities and facilities to develop in a healthy manner and in conditions of freedom and dignity and that childhood and youth are protected against exploitation and against moral and material abandonment.” Article 41 makes provisions for right to work, education, unemployment allowance and social assistance for “old age, sickness and disablement, and in other cases of undeserved want”. Article 43 makes a provision for “living wages” for all types of workers. Article 45 directs the State to make a policy for the “early childhood care and education to children below the age of six years”. Article 47 emphasizes on improvement in nutrition, level of living and health conditions. While the provisions of the Directive Principles of State policy are not enforceable in the court of law, they work as moral binding on the policy of the State. However, a number of the above provisions have already been translated into legal rights of the citizens like the Mahatma Gandhi National Rural Employment Guarantee Act (MGNREGA) 2005, Right to Education Act 2009 (RTE) and National Food Security Act 2013 (NFSA), etc. The Supreme Court of India has also played an important role in enforcing some of the provisions contained in Part IV of the Constitution. There are enforceable provisions in the Constitution as well. Important among them is “Right to life and Liberty” under Article 21 of the Constitution, the
123

scope of which has been immensely widened by the Supreme Court that has declared that right to life includes right to livelihood. While the Constitution provided broad policy guidelines for social security measures, the Government of India has shown apathy towards the Directive Principles of State Policy for a variety of reasons. One plausible explanation, which is often given, is resource constraints. Another reason was the nature of socio-economic structure. In a primarily agrarian economy, the scope for social security policy, as it emerged in industrial countries, i.e. mainly built around the needs of industrial workers, was limited. In the 1950s and 1960s, providing food security through Public Distribution System and income through public works programme were the main social security measures. These programmes were meant for the rural areas where the bulk of population lived and worked in agriculture. However, with the increase in the number of non-agricultural workers, the context of social security policy changed. With increasing industrialization and urbanization, a large number of people were subject to different kinds of vulnerabilities. With economic liberalization and the new economic policy, employment in the non-farm sector increased, public sector employment decreased, and the proportion of regular employment in total organized sector employment also declined. With the above developments, the demand for a different kind of social security measures increased. These measures needed to reflect the different situations of workers in the organized and unorganized sectors. The National Commission for Enterprises in the Un-organised Sector showed that about 93 percent of total workers were employed in the unorganized sector with hardly any social security coverage to them (NCEUS, 2009). It pleaded for various kinds of social security measures for such workers ( NCEUS, 2006). But even otherwise, a number of social security measures like National Social Assistance -- Old Age Pension, Widow Pension, Disability Pension --, AAM Admi Bima Yojana, Rashtriya Swastha Bima Yojana, National Pension Scheme, etc. have been launched in this phase. The Mahtma Gandhi National Rural Employment Guarantee Scheme, National Food Security Act, etc. are other mega social security interventions. Five Year Plans and social security measures The Five Year Plans in India gave adequate attention to social sector policy, but adopted a much broader approach with a thrust on promotional aspects. Five Year Plans carried a separate chapter on social sector development, although emphasis varied from plan to plan. Upto the first ten plans, the tenor of social sector policy was broader with a focus on general issues of social development like poverty alleviation, income and employment generation. The Eleventh Plan gave special attention to social protection issues. The First Five year Plan outlined its priorities: “…It is no longer possible to think of development as a process merely of increasing the available supplies of material goods; it is necessary to ensure that simultaneously a steady advance is made towards the realisation of wider objectives such as full employment and the removal of economic inequalities. Maximum production, full employment, the attainment of economic equality and social justice which constitute the accepted objectives of planning under present-day conditions…” The Second Five Year Plan gave emphasis on rapid industrialization and increase in employment opportunities, and declared establishing ‘socialist pattern of society’ as the goal of planning. The Third Plan gave emphasis on agriculture, but prioritised poverty eradication as a major objective. It explained the priority: “The more immediate problem is to combat the
124
curse of poverty”. The Fourth Five Year Plan talked of restructuring of the society, and emphasized on bridging rural-urban gap. The Fifth Plan was not very ambitious, but reiterated goals like reducing poverty and bridging social, economic and regional inequality. The Sixth Plan continued with the policy of poverty eradication and increasing employment. It also introduced minimum needs programme for the poor. It stated its objectives: “The removal of poverty is the foremost objective of the Sixth Plan even though it is recognised that given the magnitude of the task, it cannot be accomplished in a short period of five years”. The Seventh Plan emphasized on accelerating “the growth in foodgrains production, increase employment opportunities and raise productivity” as the central objectives of planning. The Eighth Plan talked of employment generation as major objective. The Ninth Plan “accorded priority to agriculture and rural development with a view to generating adequate productive employment and eradication of poverty” and aimed at accelerating the growth rate of the economy with stable prices; ensuring food and nutritional security for all, particularly the vulnerable sections of society; providing the basic minimum services of safe drinking water, primary health care facilities, universal primary education, shelter, and connectivity to all in a time bound manner…”. The Tenth Five Year Plan prioritised social development as the key objective of planning in India, and emphasized that growth in national income does not lead automatically to social sector development. At the same time, in the absence of social sector development, growth is not sustainable. The Tenth Plan explained its perspective: “The last decade of the 20th Century has seen a more viable shift in the focus of development planning… Specific focus on the dimensions of social development is necessary because experience shows that economic prosperity, measured in terms of per capita income, alone does not always ensure enrichment in quality of life, as reflected, for instance, in the social indicators on health, longetivity, literacy and environmental sustainability. The latter must be valued as outcomes that are socially desirable in themselves, and hence made direct objectives of any development process” (p.1). Upto the Tenth Five Year Plan, the social sector development policy was hinged upon the development of the economy and other sectors. It was also considered that the development of social sectors would follow the overall development of the economy particularly rural and agricultural development, industrialization and employment generation, and poverty eradication. In most of the Plans, social sector policy was discussed under chapters on social welfare. The Eleventh Plan that made inclusive growth and social sector development its twin major objectives. More importantly, for the first time, social sector development policy gave specific focus on social security measures mainly for the unorganized sector workers and explained the changing contexts: “In India, traditionally, the aspects of social security were taken care of by the set up of family/community. Rapid industrialization/urbanization which began in the early 20th century has largely led to the collapse of the joint family set up, thus necessitating institutionalised intervention in the form of State-cum society regulated social security arrangements” ( p.156). Then it elaborated: “In the Eleventh Plan social security will be treated as an inclusive concept that also covers housing, safe drinking water, sanitation, health, educational and cultural facilities for the society at large” ( p.156). It also described recent initiatives like Rashtriya Swatha Bima Yojana 2007, Aam Admi Bima Yojana 2007, etc. as important steps towards the above objective.
125
The Twelfth Five Year Plan reiterated the major objectives of the Eleventh Plan with added emphasis that is “Faster, More Inclusive and Sustainable Growth”. The Twelfth Plan was finalised under the shadow of economic slowdown, and hence, considerable emphasis was given on restoring high growth rate. Nevertheless, it retained focus on social sector development and like the Eleventh Five Year Plan the entire one volume of the plan document was devoted to social sector development. The only difference is the reshuffling of the order. While the IInd Volume of the Eleventh Plan was devoted to social sector development, the IInd volume of the 12th Plan dealt with economic sectors and the IIIrd volume with social sector development. The economic slowdown and deceleration in the growth rate was the context of reshuffling of the priority in the 12th Plan. Major social security initiatives in recent years A number of bold steps towards social security measures have been taken in recent years. Important among them include rights based employment guarantee scheme and legal entitlement to food security under National Food Security Act. Apart from these two bold steps, the National Social assistance programme that consists of Old Age Pension, Disability Pension and Widow Pension has also been strengthened in recent years. Some other initiatives include Rashtriya Swastah Bima Yojana, Aam Admi Bima Yojana and National Pension Scheme. MGNREGS The MGNREGS is a legal guarantee to 100 days of employment at a minimum wages which should not be less than 100 rupees to every rural household whose adult members demand job under the programme. The programme guarantees demand based job upto 100 days during any part of the year, although the basic objective is to secure rural households from economic vulnerabilities during the lean season of agriculture. The programme guarantees unemployment allowance in case of the failure of the state machinery to provide employment on demand and the formula for the unemployment allowance has been worked in a manner that a household denied job on demand throughout the year is entitled to get 100 days of minimum wages to ensure that it earns minimum guaranteed income. There are various difficulties in the implementation of the scheme and complaints about the non-enforcement of certain provisions. Nevertheless, about five crore of rural households have been benfited yearly from this programme since 2008, the period of the extension of its coverage to all the rural districts of the country. This, however, is lower than the number of total households who have registered. Till December 2013, 12.72 crore of rural households have registered for availing employment guarantee scheme. The programme is an important social security measure, which however, suffers from a number of weaknesses, apart from the issues related to implementation. It covers only rural areas and provides limited income security at the household level. Notwithstanding ambitious programme, its implementation remains uneven across the States. Also against the minimum guarantee of 100 days per household, the average employment provided per household has remained less than fifty days in all the years except one. It was 43 persondays in 2006-07, 42 in 2007-08, 48 in 2008-09, 54 in 2009-10, 47 in 2010-11, 43 in 2011-12, and 47 in 2012-13. Of course, there are a few states like Andhra Pradesh, Rajastahn, TamilNadu, Himachal Pradesh, Tripura, etc., which have provided average employment days higher than the national average. The payment of minimum wages remains another grey area, as a large number of workers are not able to earn the minimum wages under the piece meal wage rate system. Nevertheless, huge amount of money has been transferred as wages to the poor. It
126
was 5842.37 crore ( 66 % of MGNREGA expenditure) in 2006-07, 10738.47 crores ( 68%) in 2007-08, 18200 crores ( 67 %) in 2008-09, 25579.32 crores (70 %) in 2009-10, 25686.53 crores (68 %) in 2010-11, 24306.22 crores ( 70 %) in 2011-12 and 27128.36 crores ( 72 %) in 2012-13. PDS and National Food Security Act The Public Distribution System has been a major social security measure and has been in implementation in one or the other form since Independence. The design of the programme has been changed from targeted to universal and then again to targeted. Finaly the ambitious National Food Security Act has adopted a qualified universal approach. The ambitious National Food Security Act has just been rolled out and it would be premature to assess its impacts. The impacts of the successful working of the PDS system have been documented (Himanshu and Sen, 2012). At the same time there are plenty of criticisms of the poor performance of the PDS and huge leakages and pilferages of subsidies. It has also been criticized severely for administrative wastages, as administrative cost of transferring of subsidies is unacceptably high (Programme Evaluation Office, Planning Commission, 2005). While a number of new initiatives have been rolled out, the social security measures remain inadequate and limited in coverage apart from daunting challenges of implementation. The National Social Assistance Programme is limited in coverage. For example, the OLD age pension scheme covers Below Poverty Line ( BPL) population above 60 years, revised from the earlier 65 years. The disability and widow pension schemes also cover only BPL families. Similarly, the Rashtriya Swastha Bima Yojana does not cover above poverty line family. Apart from others, the lack of universal approach is a major deficit of India’s nascent social security measures. The MGNREGS and National Food Security Act have adopted qualified universal approach. Most importantly, vast number of unorganized non-farm workers have not been covered through any comprehensive social security measures. The major recommendations of the National Commission for Enterprises in the Unorganized Sector in this regard remain unimplemented so far.
6.5. Industrial policies 6.5.1 Introduction At the time of Independence industrial workers represented around 11 per cent of the country's work force and a little over 10 per cent of them were employed in large-scale industry.16 Modern (or large-scale)17 industry co-existed with “traditional” industrial firms. Both types were labour-intensive and used locally available raw materials. Technology and capital goods were imported. Modern industry18 was essentially a product of India’s contact with Britain where the culture of large and hierarchically managed factories came from. At the beginning of British rule India’s capital market institutions were inadequate to channel household savings towards
16 The first three paragraphs of the Introduction draw on T. Roy's article Economic History and Modern India: Redefining the Link (2002). 17 Factory employment was overwhelmingly dominated by the textile industry: cotton and jute spinning and weaving; cotton ginning and jute pressing; and a few large firms in wool and silk spinning and weaving. The other mechanized industries were paper, sugar, matches, cement and steel. 18 Modern industries were mostly concentrated in two provinces: Bombay and Bengal. Large textile industries developed in Ahmedabad and Bombay and an iron and steel industry in Bihar and Orissa.
127
industrial investment thus the Indian pioneers in modern industry came essentially from communities of traders and bankers. But the size of modern industry remained limited and different interpretations have been put forward to explain the phenomenon. Standard narratives of Indian industrialization tend to focus on the demand side of the home market and the unwillingness of the colonial government to protect Indian industry from low-cost imports from Britain. More recently scholars have highlighted issues of resource endowments: the wide use of machinery was not cost effective in view of the scarcity of skilled labour and the high cost of Indian capital. For Roy (2002) historians of Indian industrialization have often neglected traditional industry through a mistaken belief that imports and modern industry killed it. He argues that traditional industries were not killed but were transformed by the spread of commercialization in product and input markets. As markets integrated, competition within crafts intensified. This induced a change in the use of labour and two types of non-specialized workers declined: women working in household industry and a group the early censuses called “general labour,” which performed a variety of labouring tasks in the villages and some manufacturing on the side. Some traditional crafts production moved to small or medium size towns and evolved towards a more productive utilisation of labour but labour was not replaced by machinery. Markets were segmented and modern industry and traditional crafts served different demands and customers. From the beginning of the XXth century Indian industrialists actively supported the national Freedom Movement as for them freedom from colonialism could only be possible if linked to economic independence. In 1944 a group of Indian leading industrialists got together and prepared a Plan (referred to as the “Bombay Plan”) which emphasized the importance of industrialization for the future independent country.19 Building on the Bombay Plan and Nehru’s views of modernization and planning to accelerate growth, the first Industrial Policy Resolution was issued in 1948. Since then India's Industrial Policy has evolved through successive resolutions and policy statements, and specific priorities laid down in the Five-Year Plans. For the first three decades India followed an inward looking state-directed industrialization model. In the 1980s the model started to erode. It evolved and became more favourable to private business. After the external liquidity crisis of 1991 it was fundamentally changed with the implementation of neo-liberal reforms and the opening-up of the economy. There are three sections below. The first presents the long term trends of industrial production since Independence, the second the evolution of India's industrial policy and the third the implications in terms of inequality.
19 The Bombay Plan recommended government support for industrialization, including a direct role in the production of capital goods.
128
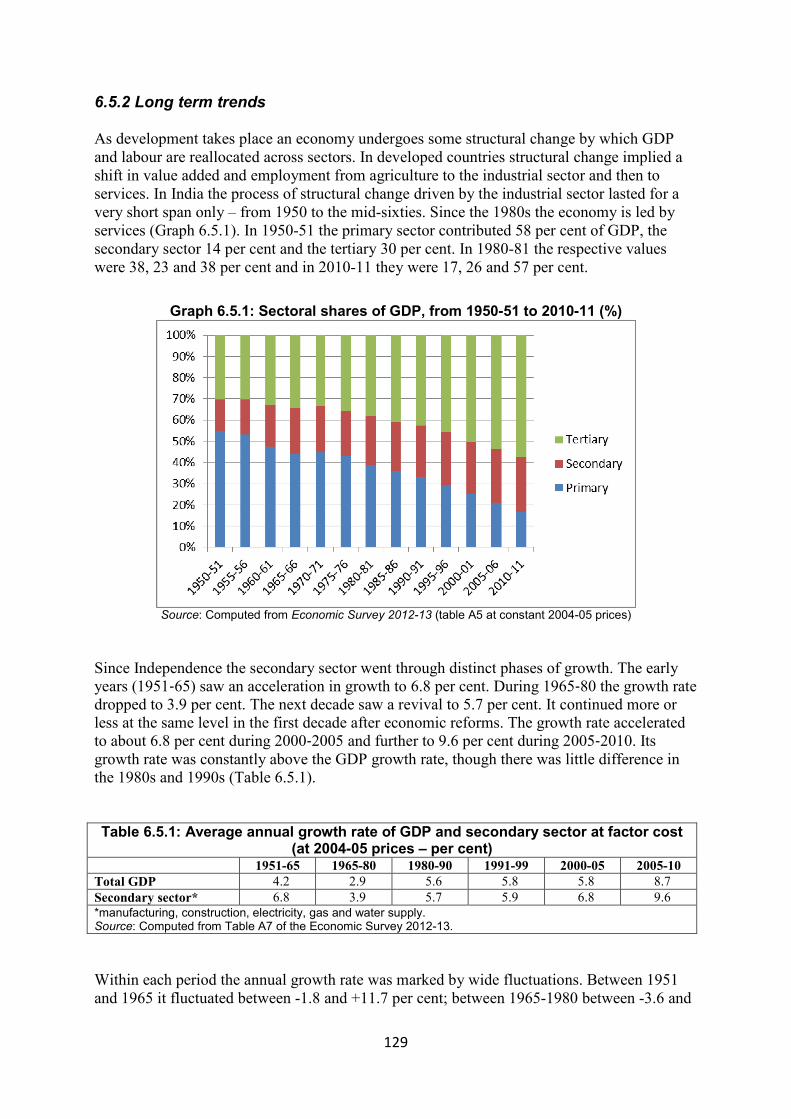
6.5.2 Long term trends As development takes place an economy undergoes some structural change by which GDP and labour are reallocated across sectors. In developed countries structural change implied a shift in value added and employment from agriculture to the industrial sector and then to services. In India the process of structural change driven by the industrial sector lasted for a very short span only – from 1950 to the mid-sixties. Since the 1980s the economy is led by services (Graph 6.5.1). In 1950-51 the primary sector contributed 58 per cent of GDP, the secondary sector 14 per cent and the tertiary 30 per cent. In 1980-81 the respective values were 38, 23 and 38 per cent and in 2010-11 they were 17, 26 and 57 per cent.
Graph 6.5.1: Sectoral shares of GDP, from 1950-51 to 2010-11 (%)
Source: Computed from Economic Survey 2012-13 (table A5 at constant 2004-05 prices)
Since Independence the secondary sector went through distinct phases of growth. The early years (1951‐65) saw an acceleration in growth to 6.8 per cent. During 1965‐80 the growth rate dropped to 3.9 per cent. The next decade saw a revival to 5.7 per cent. It continued more or less at the same level in the first decade after economic reforms. The growth rate accelerated to about 6.8 per cent during 2000‐2005 and further to 9.6 per cent during 2005‐2010. Its growth rate was constantly above the GDP growth rate, though there was little difference in the 1980s and 1990s (Table 6.5.1). Table 6.5.1: Average annual growth rate of GDP and secondary sector at factor cost
(at 2004-05 prices – per cent) 1951-65 1965-80 1980-90 1991-99 2000-05 2005-10
Total GDP 4.2 2.9 5.6 5.8 5.8 8.7 Secondary sector* 6.8 3.9 5.7 5.9 6.8 9.6 *manufacturing, construction, electricity, gas and water supply. Source: Computed from Table A7 of the Economic Survey 2012-13. Within each period the annual growth rate was marked by wide fluctuations. Between 1951 and 1965 it fluctuated between -1.8 and +11.7 per cent; between 1965-1980 between -3.6 and
129
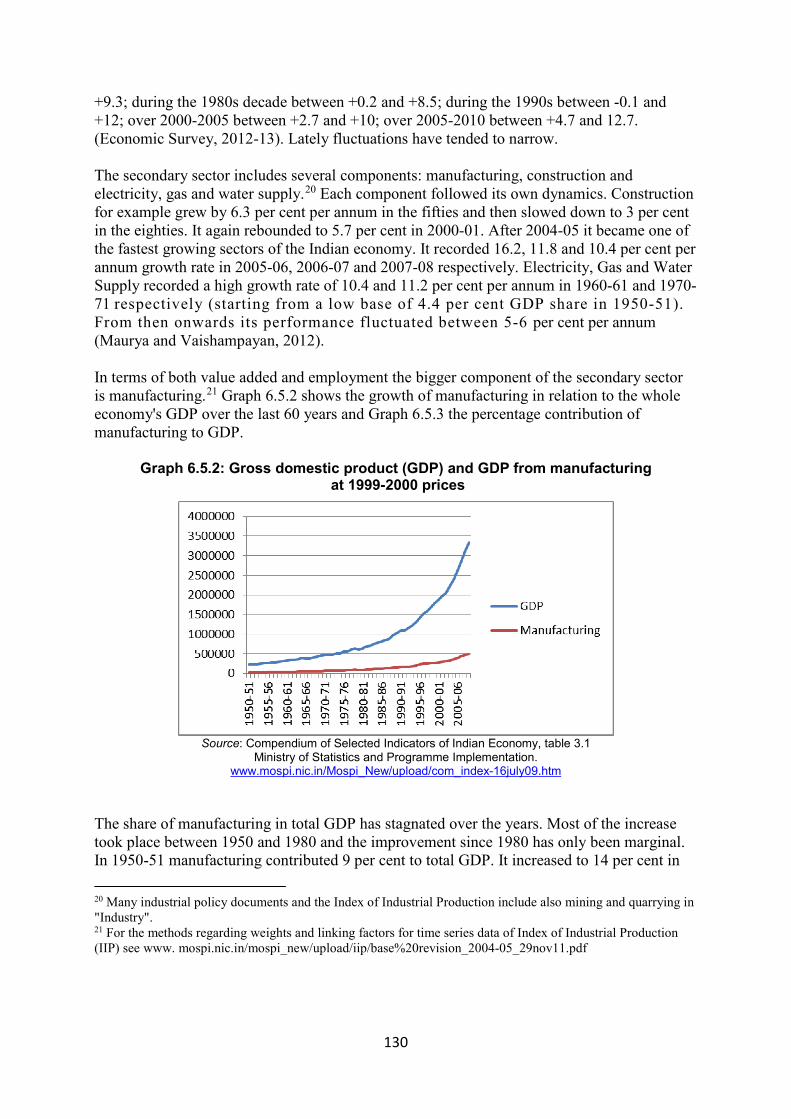
+9.3; during the 1980s decade between +0.2 and +8.5; during the 1990s between -0.1 and +12; over 2000-2005 between +2.7 and +10; over 2005-2010 between +4.7 and 12.7. (Economic Survey, 2012-13). Lately fluctuations have tended to narrow. The secondary sector includes several components: manufacturing, construction and electricity, gas and water supply.20 Each component followed its own dynamics. Construction for example grew by 6.3 per cent per annum in the fifties and then slowed down to 3 per cent in the eighties. It again rebounded to 5.7 per cent in 2000-01. After 2004-05 it became one of the fastest growing sectors of the Indian economy. It recorded 16.2, 11.8 and 10.4 per cent per annum growth rate in 2005-06, 2006-07 and 2007-08 respectively. Electricity, Gas and Water Supply recorded a high growth rate of 10.4 and 11.2 per cent per annum in 1960-61 and 1970-71 respectively (starting from a low base of 4.4 per cent GDP share in 1950-51). From then onwards its performance fluctuated between 5-6 per cent per annum (Maurya and Vaishampayan, 2012). In terms of both value added and employment the bigger component of the secondary sector is manufacturing.21 Graph 6.5.2 shows the growth of manufacturing in relation to the whole economy's GDP over the last 60 years and Graph 6.5.3 the percentage contribution of manufacturing to GDP.
Graph 6.5.2: Gross domestic product (GDP) and GDP from manufacturing at 1999-2000 prices
Source: Compendium of Selected Indicators of Indian Economy, table 3.1
Ministry of Statistics and Programme Implementation. www.mospi.nic.in/Mospi_New/upload/com_index-16july09.htm
The share of manufacturing in total GDP has stagnated over the years. Most of the increase took place between 1950 and 1980 and the improvement since 1980 has only been marginal. In 1950-51 manufacturing contributed 9 per cent to total GDP. It increased to 14 per cent in
20 Many industrial policy documents and the Index of Industrial Production include also mining and quarrying in "Industry". 21 For the methods regarding weights and linking factors for time series data of Index of Industrial Production (IIP) see www. mospi.nic.in/mospi_new/upload/iip/base%20revision_2004-05_29nov11.pdf
130

1980 and has remained around 15 per cent since 1990, with a slight dip in 2008-09 due to the impact of the global financial crisis. Contribution of manufacturing to growth of non‐agricultural GDP was estimated to be 24 per cent during the period 1950‐51 to 1979‐80 and only 18 per cent during the period 1979‐80 to 2007‐08 (Papola, 2012, p.7).
Graph 6.5.3: Share of Manufacturing in total GDP (Percent)
Source: Compendium of Selected Indicators of Indian Economy, table 3.1
Ministry of Statistics and Programme Implementation. www.mospi.nic.in/Mospi_New/upload/com_index-16july09.htm
http://mospi.nic.in/Mospi_New/upload/SYB2014/CH-14-INDUSTRY/INDUSTRY-WRITEUP.pdf
In spite of the stability in its share in GDP, the manufacturing sector has undergone significant structural changes during both the pre‐ and post‐reform periods. Structural changes within the manufacturing sector Manufacturing industries are diverse and aggregate trends in manufacturing can hide considerable variation at a lower level. Following the OECD classification, Aggarwal and Kumar (2012) identified four broadly defined segments in the manufacturing sector – the low tech (processing of agricultural raw materials and other labour-intensive industries with a low capital-labour ratio, small plants), the medium-low tech (mineral based infrastructure industries, large plants and high capital-labour ratios), the medium-high tech (chemical and engineering industries), and the high tech (science-based modern industries with a large percentage of R&D expenditure). We present here their main findings.
131
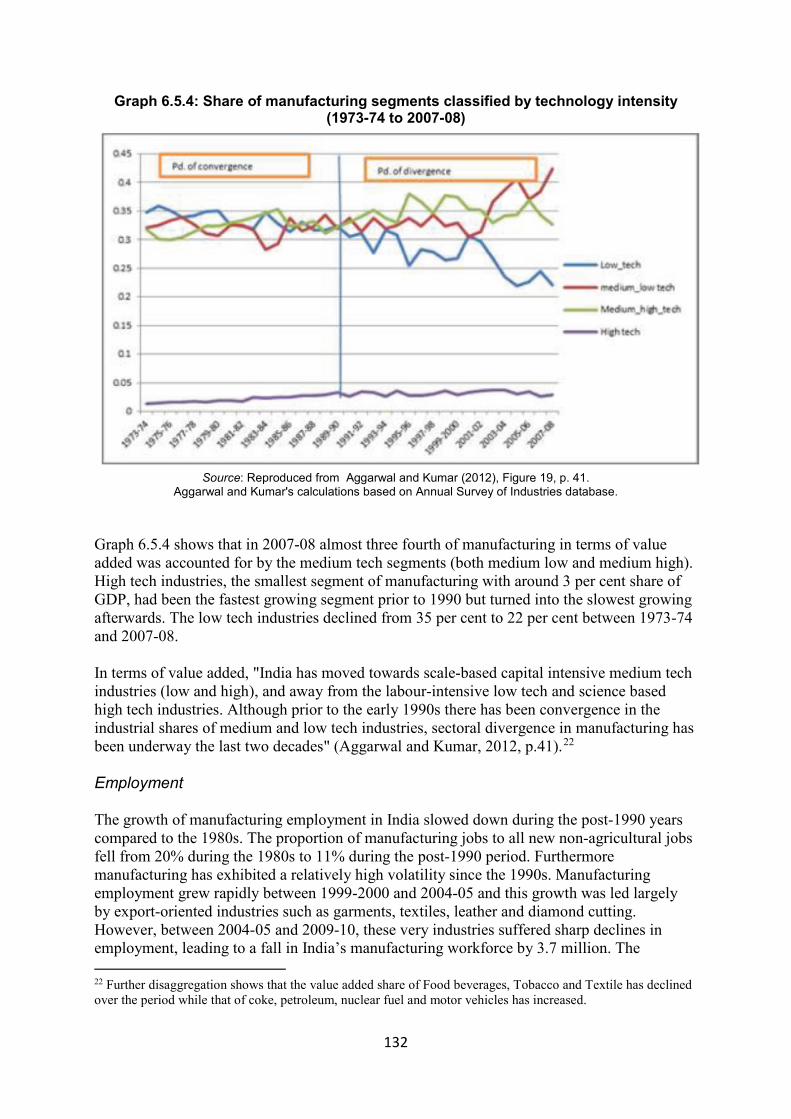
Graph 6.5.4: Share of manufacturing segments classified by technology intensity (1973-74 to 2007-08)
Source: Reproduced from Aggarwal and Kumar (2012), Figure 19, p. 41.
Aggarwal and Kumar's calculations based on Annual Survey of Industries database.
Graph 6.5.4 shows that in 2007-08 almost three fourth of manufacturing in terms of value added was accounted for by the medium tech segments (both medium low and medium high). High tech industries, the smallest segment of manufacturing with around 3 per cent share of GDP, had been the fastest growing segment prior to 1990 but turned into the slowest growing afterwards. The low tech industries declined from 35 per cent to 22 per cent between 1973-74 and 2007-08. In terms of value added, "India has moved towards scale-based capital intensive medium tech industries (low and high), and away from the labour-intensive low tech and science based high tech industries. Although prior to the early 1990s there has been convergence in the industrial shares of medium and low tech industries, sectoral divergence in manufacturing has been underway the last two decades" (Aggarwal and Kumar, 2012, p.41).22 Employment The growth of manufacturing employment in India slowed down during the post-1990 years compared to the 1980s. The proportion of manufacturing jobs to all new non-agricultural jobs fell from 20% during the 1980s to 11% during the post-1990 period. Furthermore manufacturing has exhibited a relatively high volatility since the 1990s. Manufacturing employment grew rapidly between 1999-2000 and 2004-05 and this growth was led largely by export-oriented industries such as garments, textiles, leather and diamond cutting. However, between 2004-05 and 2009-10, these very industries suffered sharp declines in employment, leading to a fall in India’s manufacturing workforce by 3.7 million. The
22 Further disaggregation shows that the value added share of Food beverages, Tobacco and Textile has declined over the period while that of coke, petroleum, nuclear fuel and motor vehicles has increased.
132
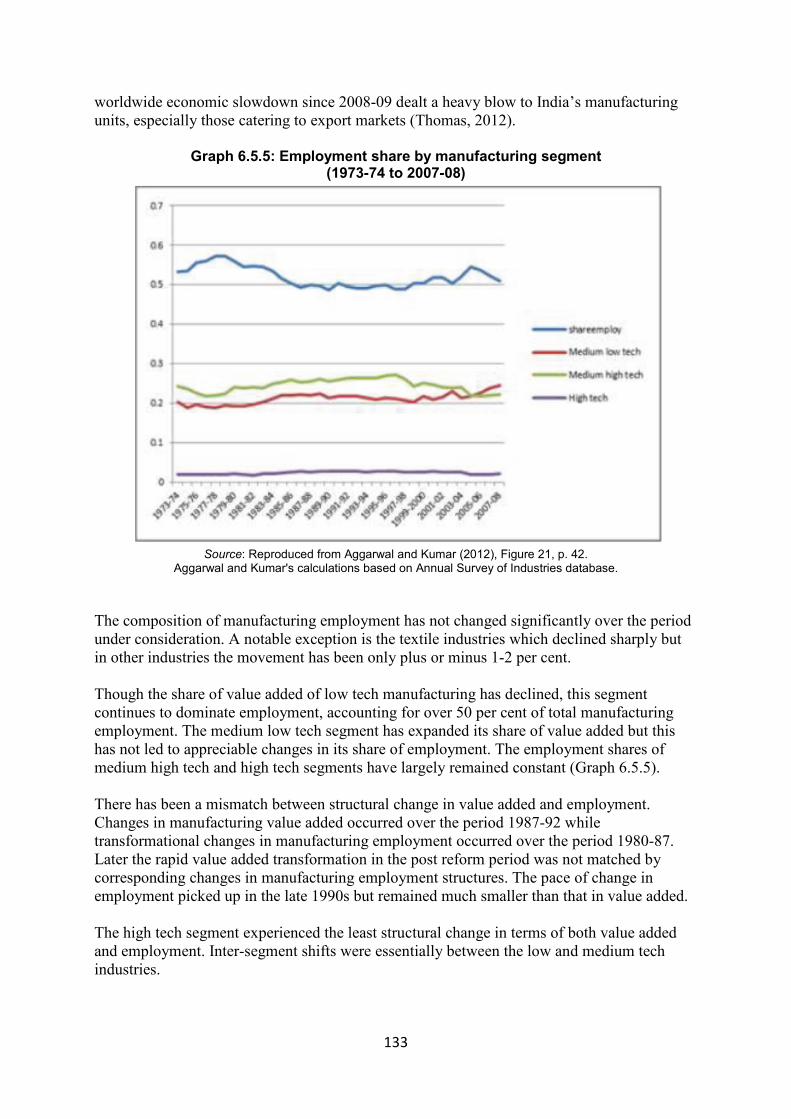
worldwide economic slowdown since 2008-09 dealt a heavy blow to India’s manufacturing units, especially those catering to export markets (Thomas, 2012).
Graph 6.5.5: Employment share by manufacturing segment (1973-74 to 2007-08)
Source: Reproduced from Aggarwal and Kumar (2012), Figure 21, p. 42.
Aggarwal and Kumar's calculations based on Annual Survey of Industries database. The composition of manufacturing employment has not changed significantly over the period under consideration. A notable exception is the textile industries which declined sharply but in other industries the movement has been only plus or minus 1-2 per cent. Though the share of value added of low tech manufacturing has declined, this segment continues to dominate employment, accounting for over 50 per cent of total manufacturing employment. The medium low tech segment has expanded its share of value added but this has not led to appreciable changes in its share of employment. The employment shares of medium high tech and high tech segments have largely remained constant (Graph 6.5.5). There has been a mismatch between structural change in value added and employment. Changes in manufacturing value added occurred over the period 1987-92 while transformational changes in manufacturing employment occurred over the period 1980-87. Later the rapid value added transformation in the post reform period was not matched by corresponding changes in manufacturing employment structures. The pace of change in employment picked up in the late 1990s but remained much smaller than that in value added. The high tech segment experienced the least structural change in terms of both value added and employment. Inter-segment shifts were essentially between the low and medium tech industries.
133
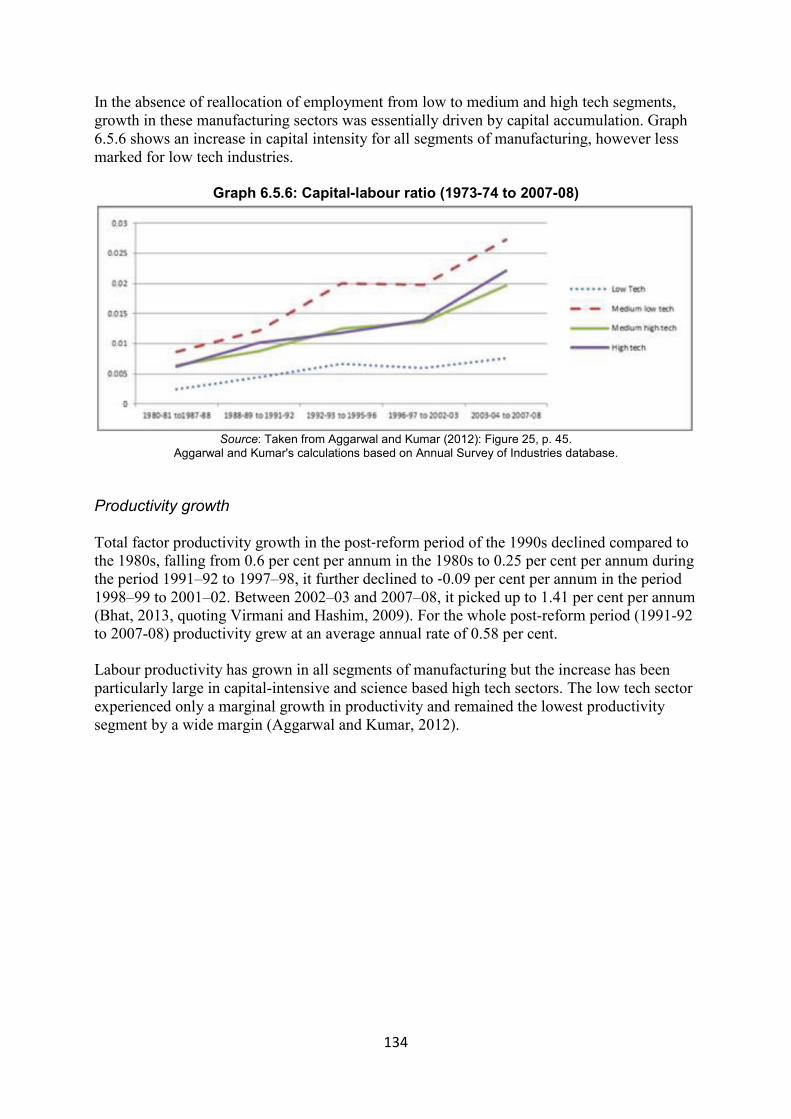
In the absence of reallocation of employment from low to medium and high tech segments, growth in these manufacturing sectors was essentially driven by capital accumulation. Graph 6.5.6 shows an increase in capital intensity for all segments of manufacturing, however less marked for low tech industries.
Graph 6.5.6: Capital-labour ratio (1973-74 to 2007-08)
Source: Taken from Aggarwal and Kumar (2012): Figure 25, p. 45.
Aggarwal and Kumar's calculations based on Annual Survey of Industries database. Productivity growth Total factor productivity growth in the post‐reform period of the 1990s declined compared to the 1980s, falling from 0.6 per cent per annum in the 1980s to 0.25 per cent per annum during the period 1991–92 to 1997–98, it further declined to ‐0.09 per cent per annum in the period 1998–99 to 2001–02. Between 2002–03 and 2007–08, it picked up to 1.41 per cent per annum (Bhat, 2013, quoting Virmani and Hashim, 2009). For the whole post-reform period (1991-92 to 2007-08) productivity grew at an average annual rate of 0.58 per cent. Labour productivity has grown in all segments of manufacturing but the increase has been particularly large in capital-intensive and science based high tech sectors. The low tech sector experienced only a marginal growth in productivity and remained the lowest productivity segment by a wide margin (Aggarwal and Kumar, 2012).
134
Manufacturing production units Indian manufacturing has been characterized by a persistent dualism with the prevalence of a large unorganized sector side by side with the formal or organized sector (Table 6.5.2).23 "There has been a strong bi-modal distribution in employment – even when confining the attention to the non-household sector in manufacturing – with strong concentration of employment at the small and large size-groups of establishments, with a conspicuous ‘missing middle’ "(Mazumdar D., 2010). The productivity (and wage) gap between the two extreme size groups is extremely large.
Table 6.5.2: Employment, value added and productivity in manufacturing by type of establishment (2000-01)
Own-account manufacturing
enterprises (only family
labour)
Non-directory manufacturing establishments (between 2-5
workers, at least 1 hired)
Directory manufacturing establishments (between 6-9
workers, at least 1 hired)
Organized (at least 10 workers)
Distribution of Employment (% of all manufacturing)
55.9 12.4 14.4 17.3
Distribution of Value Added (% of all manufacturing)
10.3 6.8 8.9 74.0
Productivity (Organized =100) 4.2 11.3 12.7 100
Source: Extracted from Table A.3, p.53 in Mazumdar D. (2010): Employment and Inequality Outcomes in India, http://www.oecd.org/employment/emp/45282802.pdf "The share of the registered (organized) enterprises has steadily increased in manufacturing GDP, and at a faster rate in recent years than in the first three decades after Independence. It accounted for 42 per cent in 1950‐51, its share increased to 55 per cent by 1979‐80 and 70 per cent by 2007‐08. Thus the organized segment is now predominant in manufacturing GDP, though its contribution to employment is only 18 per cent" (Papola, 2012, p.12). In 2005-06 a little over one third of casual labour was in the organized manufacturing sector and around two thirds in the unorganized manufacturing sector. But the ratio of contract workers to total persons engaged in organized manufacturing had increased from 11 per cent in 1995-96 to 22 per cent (Goldar and Aggarwal, 2012). The bulk of new jobs created in the formal sector of Indian manufacturing are low quality, informal jobs. Consequently the share of social protection benefits, which had increased slowly through the 1980s and 1990s, stagnated in 2000 and started to decline in 2002. This indicates an increasing use of informal contract labour within the formal sector. To some extent intensification of import competition in the post-reform period has been responsible for the increasing informalization of labour in Indian manufacturing (Aggarwal and Kumar, 2012).
23 The unorganized sector comprises: (i) Own-account manufacturing enterprises (OAME) which are household enterprises making use only of family labour; (ii) Non-directory manufacturing establishments (NDME) who employ at least one wage (hired) worker) and have between 2-5 workers in total: and (iii) Directory manufacturing establishments (DME) employing between 6-9 workers in total of which at least one would be a hired worker. The formal or organized enterprises are statistically defined (by the Factory Act) as employing ten or more workers.
135
Another characteristic of manufacturing production units is whether they belong to the public or private sector. The public sector accounted for 7 per cent of manufacturing output in 1960‐61, increasing to 26 per cent by 1980‐81. It experienced a decline in the post‐liberalisation period and in 2009‐10 public sector was estimated to contribute about 22 percent of manufacturing GDP (Papola, 2012). Wages The wage hierarchy is closely related to the size and type of firms and the type of employment relation. As seen above, since the 1980s there has been increasing informalization of industrial labour in India. It has taken two forms: a rising share of the unorganized sector in manufacturing employment and the informalization of the organized manufacturing sector itself through subcontracting and use of temporary and contract workers. Estimates from unit-level data of the National Sample Survey (NSS) 61st round employment-unemployment survey reveal that in 2004-05, the average wage earned per day by regular wage workers in organized manufacturing was about Rs 169 while that earned by casual workers was only about Rs 55. In unorganized manufacturing, the average wages earned per day by regular wage workers and casual workers in 2004-05, were Rs 83 and 54 respectively (Goldar & Aggarwal, 2012). Over the years real wages have increased in all sectors of manufacturing but wage differentials between low tech industries and more technology intensive industries have risen sharply. Most of the increase in the wage gap has been concentrated in the post 1991 period coinciding with liberalisation and high GDP growth rates. Increased openness seems to have induced an increase in skill premium. "But the manufacturing wage differentials cannot be explained in terms of education alone. They also reflect profits and product market competition and in turn inter industry variation in rent and industry structure" (Aggarwal and Kumar, 2012, p.48). This increase in wage dispersion may have contributed to greater income inequality. To sum up: The distribution of value added and employment across different manufacturing industries has changed. But the changes in value added have not been accompanied by commensurate changes in the sectoral patterns of employment. Both the low tech and high tech industries have experienced a decline in their value added share while medium tech industries have grown in importance. However, employment remains stuck in the low tech industries. Within the organized sector informal employment has been on the rise. While earnings have been rising so have wage differentials not only across industries but also within industries. These cannot be explained by skills and schooling. Industry premiums have exacerbated inequalities.
136
6.5.3. Evolution of the industrial policy After Independence, the Directive Principles of State Policy enunciated in the Indian Constitution and the "Socialist Pattern of Society" adopted by the Parliament in 1954 as objective of economic policy set the guidelines for the industrial scenario. Though the policy framework did not change significantly until 1991, the 1980s constitute a turning point as the Central government's attitude became more favourable towards the private sector. After the 1991 external liquidity crisis, the key words of the new policy were: liberalization, privatization and globalization. Table A1 in Annex 6.5.1 sketches out the detailed features of the main Industrial Policy - Resolutions, Statements and Regulations that shaped Indian Industrial Policy over the six decades since Independence. The Indian industrial policy during the first three decades after Independence After Independence India followed a state-directed industrialization model defined by Nehru and Mahalanobis. The emphasis was on heavy industry, the public sector assumed a leading role, and investments in the private sector were to be carried out according to the requirements of the overall national plan, and not on the basis of private profitability. The five-year plans emphasized technological self-reliance, and were inward-oriented. With limited availability of foreign exchange, the Government encouraged domestic production, anything that could be produced in the country, regardless of the cost, should not be imported. High tariff walls protected the manufacturing sector. The Government intervened extensively through a wide variety of measures. Controls were designed and exercised on capacity creation, production and prices. The most important were (Singh, 2008, p.5): • Industrial licensing: For much of the period, this entailed that any enterprise which wished
to manufacture a new article or sought a substantial expansion of its existing capacity had to obtain a licence.
• Strict regime of import controls. • Subsidization of exports through special measures. • Administered prices. • Investments by multinationals were subject to strict controls. The Industrial Policy Resolutions of 1948 and 1956 reflected the desire of the Indian State to achieve self sufficiency in industrial production. Huge investments by the State in heavy industries were designed to put the Indian industry on a higher long-term growth. Within this policy framework policy statements put forward different emphases. The policy statements of 1970 and 1973 were oriented towards regulating the growth of private industries, the 1975 statement put the accent on maximizing production, and the 1977 statement emphasized decentralization of the industrial sector with an increased role for small scale, tiny and cottage industries. The rate of industrial growth which surged during the first decade and a half of Indian planning started decelerating towards the late 1960s. This occurred despite the creation of sizeable capacities in a wide range of organized industries through public investment. This slowdown resulted from several contributory factors. On the one hand, on the demand side the potential of import substitution had reached a plateau and the sluggish growth in
137
agriculture impinged on the growth of the domestic market. On the supply side, the dependence on imports of basic and intermediate goods increased substantially and led to a foreign exchange bottleneck. Furthermore, the political context needs to be accounted for. The economy suffered from various shocks: two wars with Pakistan (1965 and 1971), suspension of foreign aid, severe drought (late 1960s), devaluation of the rupee and oil price-rise in 1973-74, the Emergency (1977-79), the change of government and the abandoning of the Fifth Plan. At the end of the 1970s the country was faced with decelerating exports, a worsening balance of payments and stagnating industrial growth. The turning point of the 1980s After 1980 industrial policy was re-oriented towards improving productive efficiency. The Industrial Policy Resolution 1980 stressed the need for an optimum utilization of installed capacity and for achieving higher productivity and to that effect proposed some liberalisation of the industrial licensing policies. The process of deregulation accelerated in the mid-1980s, when industrial licensing was abolished in a number of industries and major reforms were introduced in the foreign trade sector. The GDP and industrial growth rates rose again. Some scholars explain the improved rates by the focus on promoting competition in the domestic market, technological up-grading and modernization that laid the foundation of an increasingly competitive export base and on encouraging foreign investments in high-technology areas (Thakur et al., 2012). Bhat (2013) mentions that the turnaround in industrial output growth had been widely attributed to liberalisation, improvement in public investment and public sector performance. But Rodrik and Subramanian (2004) make a somewhat different diagnosis. For them the policy changes of the 1980s remained fairly limited and the rise in growth rates was triggered by a shift in the Central Government's attitude towards the private sector. The change prompted a large productivity response because India was far away from its income possibility frontier and manufacturing, built up through previous efforts, played a key role in determining the responses to the policy shifts. The policy of the 1980s was pro-business rather than pro-market. The change of attitude towards business was initiated by Indira Gandhi after she returned to power in 1980 and it gathered momentum under Rajiv Gandhi after her assassination. It was politically motivated more than due to a desire to enhance the efficiency of the economic regime. The changes introduced were essentially restricted to internal liberalisation measures: relaxation of industrial licensing, reduction of taxes, easier access to imported capital inputs and liberalisation of productive capacity restrictions. The role played by manufacturing, and in particular registered (or formal) manufacturing, was important in mediating the changes. The beneficiary of the government's attitudinal shift was the formal sector built up under the earlier policy regime. Pre-existing strengths were unleashed by more pro-business policy attitudes. Growth occurred where the earlier investments had been made. The 1980s limited reforms served to boost the profits of existing businesses without threatening them with real competition because external barriers remained largely in place. This pro-business rather than pro-market/pro-competition orientation manifested itself in the greater focus on 'internal' than 'external' reforms. "This approach had
138
the political economy merit of avoiding the creation of losers" (Rodrik and Subramanian, 2004, p.38). But the economic dynamism created a fertile environment that also allowed new entrants in new activities. Some IT enterprises that would export successfully a decade later were established in the early 1980s,24 just as the economic environment was turning more business-friendly (Singh, 2008). The Industrial Policy since 1991 The reforms of the 1990s were triggered by the 1991 external liquidity crisis. Thanks to the acceleration of growth registered in the 1980s India was able to respond to the crisis from a position of strength in the real sector of the economy. The reforms were a systemic shift towards neo-liberal policies: opening of the economy, greater reliance on market forces, larger role for the private sector including foreign investment, and restructuring of the role of government. Three sets of reforms were introduced: (i) deregulation of the industrial sector, (ii) liberalisation of foreign trade and currency transactions and (iii) easing foreign direct investment inflows. However, high tariffs (in 2000 tariffs averaged close to 30 per cent) and quotas on imports were not abandoned. In the period immediately after the reform (1991–92 to 1995–96), the number of manufacturing factories increased at the impressive rate of almost 4 per cent per annum, primarily in response to de‐licensing measures and also business optimism. The number of factories then declined during 1996–97 to 2000–01 and this trend continued till 2002–03. This period witnessed the restructuring of some industries, a downward trend in the global economy and the Asian financial crisis. The downward trend was reversed thereafter and the rise in the number of factories over the period 2000–01 to 2006–07 was 11.5 per cent. In the post-reform period the number of factories in capital‐intensive industries went up by 38 per cent, whereas those in labour-intensive industries increased by 28 per cent (Bhat, 2013). This confirms the move towards increasing capital intensity mentioned in the last section. The policy reforms have aimed not only at freeing private actors from government controls but also reducing the direct government participation in economic activities. There was a steep decline in the share of the public sector in total capital formation. The Government opted for a 'gradual' approach to the reforms. But ten years after their onset Montek Ahluwalia (2002, p.87) evaluated that the process of change had not been "so much gradualist as fitful and opportunistic." Progress in implementation was made as and when politically feasible. 6.5.4. Implications for inequality Regional disparities (see Annexes 6.5.2, 6.5.3 and 6.5.4) At Independence wide variations existed in the level of industrial development across states. In the 1950s policy mechanisms and instruments were devised to mitigate these disparities: establishment of central public sector undertakings in less industrially developed regions, use of “backwardness” of regions as a criterion in industrial licensing, special packages for development of industrial infrastructure in poorer states, and special fiscal and financial
24 For example Wipro and Infosys.
139
incentives for industrial development in backward areas. In 1967, an Industrial Licensing Policy Inquiry Committee (Dutt Committee) was set up to review the Industrial Licensing Policy. It reported that, in the decade 1955-65, the four industrially advanced States of Maharashtra, Gujarat, West Bengal and Tamil Nadu accounted for 59.3 per cent of the applications and 62.4 per cent of the licences approved. On the other hand, the poor States of Bihar, Orissa, Uttar Pradesh and Madhya Pradesh received only 15.5 per cent of total licences approved (Thakur et al., 2012). So, contrary to the stated objective of the 1956 Resolution, inter-state disparities had increased. Over the long term (1981-2009) growth rates of manufacturing in different states seem to show some tendency towards divergence. More industrialized states grew slower than less industrialized during 1981–91, but the reverse seems to have happened in recent decades. The correlation between initial level of industrialization and growth rate was negative during 1981-91 (-0.317), it turned positive and significant during 1991-01 (0.484) and 2001-09 (0.601). Thus, it appears that the trend towards a decline in differences in the level of industrialization among states observed at the beginning of the period has been reversed in the post-reform period. (Papola et al., 2011) Using Annual Survey of Industries data, Lall and Chakravorty (2004) show that new private sector industrial investments in India are biased toward existing industrial and coastal districts, whereas state industrial investments, in sharp decline after the reforms, are far less biased toward such districts. They conclude that reforms led to increased spatial inequality in industrialization, and therefore, income. Concentration of productive power A report of the Monopolies Inquiry Commission (set up in 1964) concluded that the industrial licensing system had enabled big business houses to obtain a disproportionately large share of licenses which had led to pre-emption and foreclosure of capacity. Subsequently, the Dutt Committee recommended that larger industrial houses should be given licenses only for setting up industry in core and heavy investment sectors, thereby necessitating reorientation of the industrial licensing policy. The protection of small-scale units has been a constant aspect of Indian industrial policy since Independence. It has taken the form of reservation of a large number of items for production in exclusively small units and the provision of incentives - fiscal, financial and legislative. Reservation of products for exclusive manufacture in the small scale sector as a policy instrument was initiated in 1967 with 47 items whose list was enlarged to 504 items by 1978. In 1978, the reservation list was recast into NIC codes which converted these items to 807. According to the second All India Census of small scale industries held in 1987-88, reserved items accounted for 11.3% of the total number of items produced and 28.3 per cent of the total production in the SSI sector. And the units producing reserved items accounted for 36 per cent of the total number of registered units.25 Dipak Mazumdar (2010) estimates that "This package of measures [to protect SSI] provided on the one hand an umbrella for the establishment of large small-scale sector (and in particular the flourishing of the important non-household units employing less than 10 or 20
25 See Ministry of Micro, Small and Medium Enterprises http://dcmsme.gov.in/publications/reserveditems/itemrese.htm
140
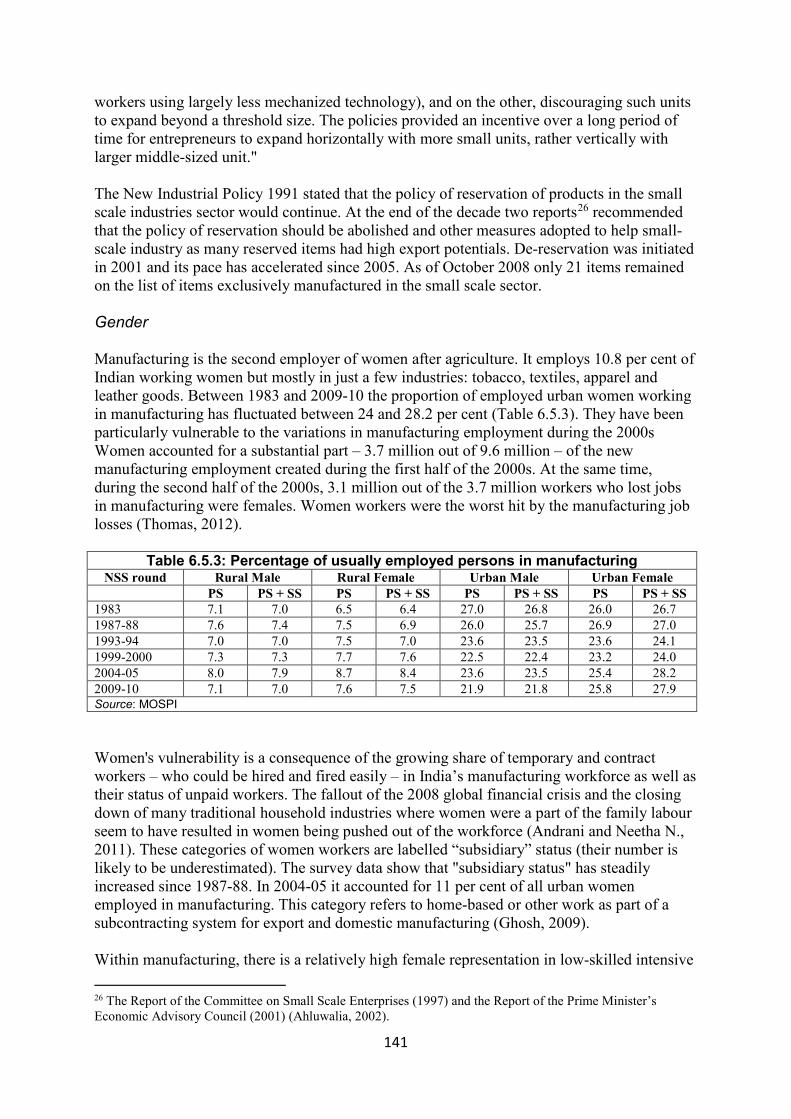
workers using largely less mechanized technology), and on the other, discouraging such units to expand beyond a threshold size. The policies provided an incentive over a long period of time for entrepreneurs to expand horizontally with more small units, rather vertically with larger middle-sized unit." The New Industrial Policy 1991 stated that the policy of reservation of products in the small scale industries sector would continue. At the end of the decade two reports26 recommended that the policy of reservation should be abolished and other measures adopted to help small-scale industry as many reserved items had high export potentials. De-reservation was initiated in 2001 and its pace has accelerated since 2005. As of October 2008 only 21 items remained on the list of items exclusively manufactured in the small scale sector. Gender Manufacturing is the second employer of women after agriculture. It employs 10.8 per cent of Indian working women but mostly in just a few industries: tobacco, textiles, apparel and leather goods. Between 1983 and 2009-10 the proportion of employed urban women working in manufacturing has fluctuated between 24 and 28.2 per cent (Table 6.5.3). They have been particularly vulnerable to the variations in manufacturing employment during the 2000s Women accounted for a substantial part – 3.7 million out of 9.6 million – of the new manufacturing employment created during the first half of the 2000s. At the same time, during the second half of the 2000s, 3.1 million out of the 3.7 million workers who lost jobs in manufacturing were females. Women workers were the worst hit by the manufacturing job losses (Thomas, 2012).
Table 6.5.3: Percentage of usually employed persons in manufacturing NSS round Rural Male Rural Female Urban Male Urban Female
PS PS + SS PS PS + SS PS PS + SS PS PS + SS 1983 7.1 7.0 6.5 6.4 27.0 26.8 26.0 26.7 1987-88 7.6 7.4 7.5 6.9 26.0 25.7 26.9 27.0 1993-94 7.0 7.0 7.5 7.0 23.6 23.5 23.6 24.1 1999-2000 7.3 7.3 7.7 7.6 22.5 22.4 23.2 24.0 2004-05 8.0 7.9 8.7 8.4 23.6 23.5 25.4 28.2 2009-10 7.1 7.0 7.6 7.5 21.9 21.8 25.8 27.9 Source: MOSPI Women's vulnerability is a consequence of the growing share of temporary and contract workers – who could be hired and fired easily – in India’s manufacturing workforce as well as their status of unpaid workers. The fallout of the 2008 global financial crisis and the closing down of many traditional household industries where women were a part of the family labour seem to have resulted in women being pushed out of the workforce (Andrani and Neetha N., 2011). These categories of women workers are labelled “subsidiary” status (their number is likely to be underestimated). The survey data show that "subsidiary status" has steadily increased since 1987-88. In 2004-05 it accounted for 11 per cent of all urban women employed in manufacturing. This category refers to home-based or other work as part of a subcontracting system for export and domestic manufacturing (Ghosh, 2009). Within manufacturing, there is a relatively high female representation in low-skilled intensive
26 The Report of the Committee on Small Scale Enterprises (1997) and the Report of the Prime Minister’s Economic Advisory Council (2001) (Ahluwalia, 2002).
141
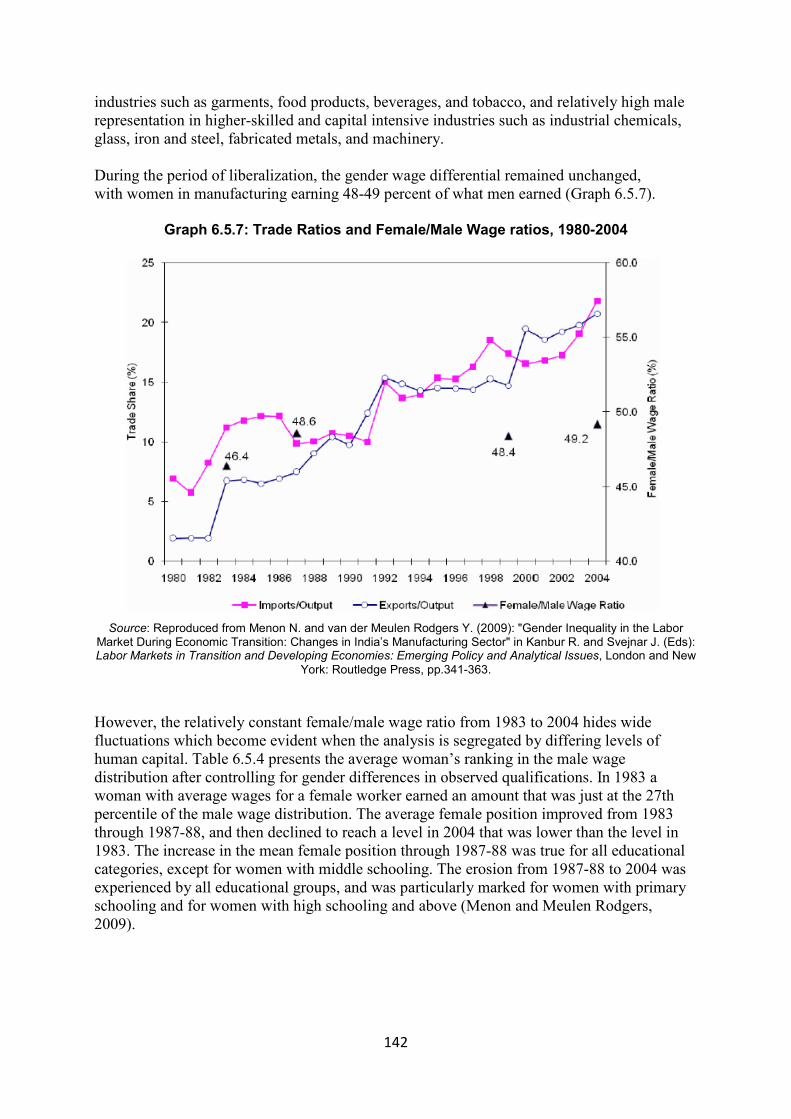
industries such as garments, food products, beverages, and tobacco, and relatively high male representation in higher-skilled and capital intensive industries such as industrial chemicals, glass, iron and steel, fabricated metals, and machinery. During the period of liberalization, the gender wage differential remained unchanged, with women in manufacturing earning 48-49 percent of what men earned (Graph 6.5.7).
Graph 6.5.7: Trade Ratios and Female/Male Wage ratios, 1980-2004
Source: Reproduced from Menon N. and van der Meulen Rodgers Y. (2009): "Gender Inequality in the Labor
Market During Economic Transition: Changes in India’s Manufacturing Sector" in Kanbur R. and Svejnar J. (Eds): Labor Markets in Transition and Developing Economies: Emerging Policy and Analytical Issues, London and New
York: Routledge Press, pp.341-363. However, the relatively constant female/male wage ratio from 1983 to 2004 hides wide fluctuations which become evident when the analysis is segregated by differing levels of human capital. Table 6.5.4 presents the average woman’s ranking in the male wage distribution after controlling for gender differences in observed qualifications. In 1983 a woman with average wages for a female worker earned an amount that was just at the 27th percentile of the male wage distribution. The average female position improved from 1983 through 1987-88, and then declined to reach a level in 2004 that was lower than the level in 1983. The increase in the mean female position through 1987-88 was true for all educational categories, except for women with middle schooling. The erosion from 1987-88 to 2004 was experienced by all educational groups, and was particularly marked for women with primary schooling and for women with high schooling and above (Menon and Meulen Rodgers, 2009).
142
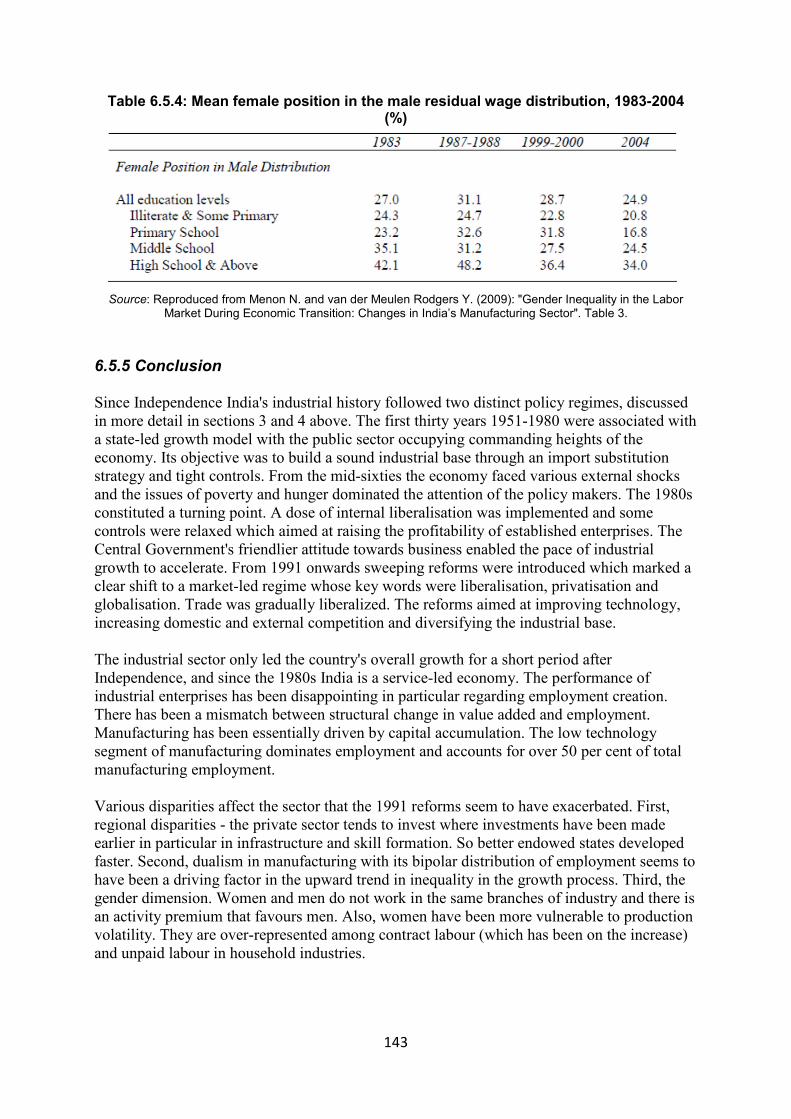
Table 6.5.4: Mean female position in the male residual wage distribution, 1983-2004 (%)
Source: Reproduced from Menon N. and van der Meulen Rodgers Y. (2009): "Gender Inequality in the Labor
Market During Economic Transition: Changes in India’s Manufacturing Sector". Table 3. 6.5.5 Conclusion Since Independence India's industrial history followed two distinct policy regimes, discussed in more detail in sections 3 and 4 above. The first thirty years 1951-1980 were associated with a state-led growth model with the public sector occupying commanding heights of the economy. Its objective was to build a sound industrial base through an import substitution strategy and tight controls. From the mid-sixties the economy faced various external shocks and the issues of poverty and hunger dominated the attention of the policy makers. The 1980s constituted a turning point. A dose of internal liberalisation was implemented and some controls were relaxed which aimed at raising the profitability of established enterprises. The Central Government's friendlier attitude towards business enabled the pace of industrial growth to accelerate. From 1991 onwards sweeping reforms were introduced which marked a clear shift to a market-led regime whose key words were liberalisation, privatisation and globalisation. Trade was gradually liberalized. The reforms aimed at improving technology, increasing domestic and external competition and diversifying the industrial base. The industrial sector only led the country's overall growth for a short period after Independence, and since the 1980s India is a service-led economy. The performance of industrial enterprises has been disappointing in particular regarding employment creation. There has been a mismatch between structural change in value added and employment. Manufacturing has been essentially driven by capital accumulation. The low technology segment of manufacturing dominates employment and accounts for over 50 per cent of total manufacturing employment. Various disparities affect the sector that the 1991 reforms seem to have exacerbated. First, regional disparities - the private sector tends to invest where investments have been made earlier in particular in infrastructure and skill formation. So better endowed states developed faster. Second, dualism in manufacturing with its bipolar distribution of employment seems to have been a driving factor in the upward trend in inequality in the growth process. Third, the gender dimension. Women and men do not work in the same branches of industry and there is an activity premium that favours men. Also, women have been more vulnerable to production volatility. They are over-represented among contract labour (which has been on the increase) and unpaid labour in household industries.
143
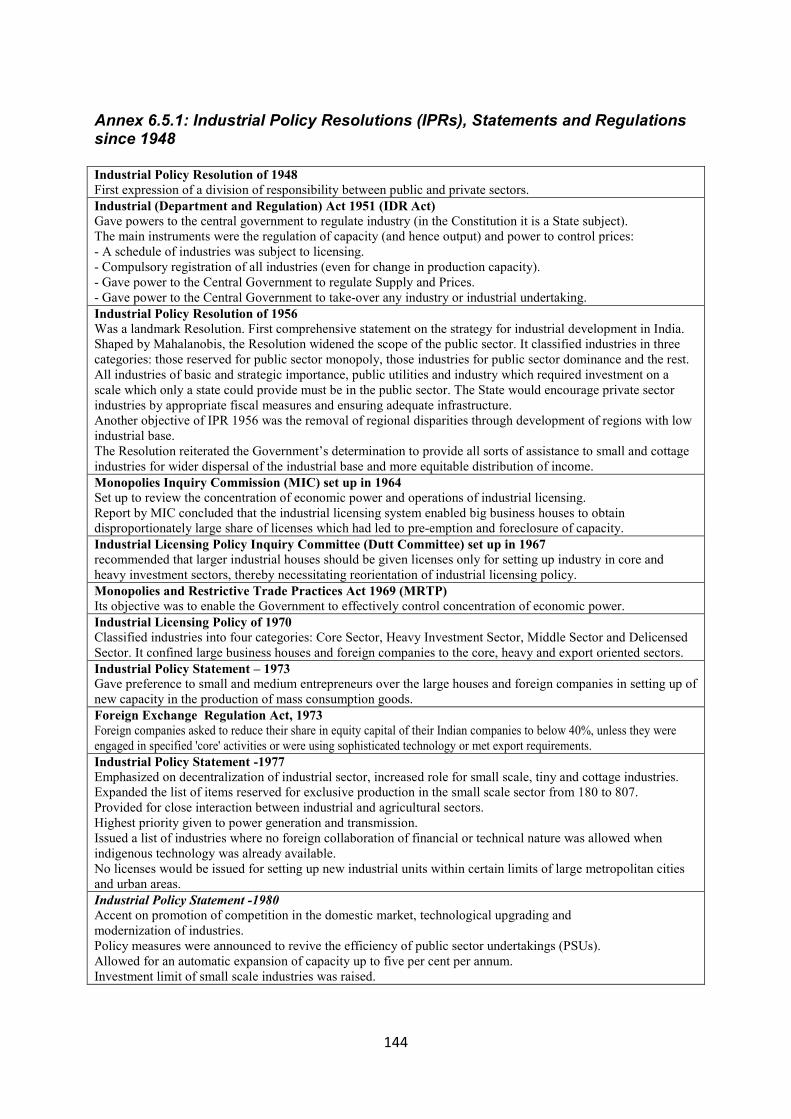
Annex 6.5.1: Industrial Policy Resolutions (IPRs), Statements and Regulations since 1948 Industrial Policy Resolution of 1948 First expression of a division of responsibility between public and private sectors. Industrial (Department and Regulation) Act 1951 (IDR Act) Gave powers to the central government to regulate industry (in the Constitution it is a State subject). The main instruments were the regulation of capacity (and hence output) and power to control prices: - A schedule of industries was subject to licensing. - Compulsory registration of all industries (even for change in production capacity). - Gave power to the Central Government to regulate Supply and Prices. - Gave power to the Central Government to take-over any industry or industrial undertaking. Industrial Policy Resolution of 1956 Was a landmark Resolution. First comprehensive statement on the strategy for industrial development in India. Shaped by Mahalanobis, the Resolution widened the scope of the public sector. It classified industries in three categories: those reserved for public sector monopoly, those industries for public sector dominance and the rest. All industries of basic and strategic importance, public utilities and industry which required investment on a scale which only a state could provide must be in the public sector. The State would encourage private sector industries by appropriate fiscal measures and ensuring adequate infrastructure. Another objective of IPR 1956 was the removal of regional disparities through development of regions with low industrial base. The Resolution reiterated the Government’s determination to provide all sorts of assistance to small and cottage industries for wider dispersal of the industrial base and more equitable distribution of income. Monopolies Inquiry Commission (MIC) set up in 1964 Set up to review the concentration of economic power and operations of industrial licensing. Report by MIC concluded that the industrial licensing system enabled big business houses to obtain disproportionately large share of licenses which had led to pre-emption and foreclosure of capacity. Industrial Licensing Policy Inquiry Committee (Dutt Committee) set up in 1967 recommended that larger industrial houses should be given licenses only for setting up industry in core and heavy investment sectors, thereby necessitating reorientation of industrial licensing policy. Monopolies and Restrictive Trade Practices Act 1969 (MRTP) Its objective was to enable the Government to effectively control concentration of economic power. Industrial Licensing Policy of 1970 Classified industries into four categories: Core Sector, Heavy Investment Sector, Middle Sector and Delicensed Sector. It confined large business houses and foreign companies to the core, heavy and export oriented sectors. Industrial Policy Statement – 1973 Gave preference to small and medium entrepreneurs over the large houses and foreign companies in setting up of new capacity in the production of mass consumption goods. Foreign Exchange Regulation Act, 1973 Foreign companies asked to reduce their share in equity capital of their Indian companies to below 40%, unless they were engaged in specified 'core' activities or were using sophisticated technology or met export requirements. Industrial Policy Statement -1977 Emphasized on decentralization of industrial sector, increased role for small scale, tiny and cottage industries. Expanded the list of items reserved for exclusive production in the small scale sector from 180 to 807. Provided for close interaction between industrial and agricultural sectors. Highest priority given to power generation and transmission. Issued a list of industries where no foreign collaboration of financial or technical nature was allowed when indigenous technology was already available. No licenses would be issued for setting up new industrial units within certain limits of large metropolitan cities and urban areas. Industrial Policy Statement -1980 Accent on promotion of competition in the domestic market, technological upgrading and modernization of industries. Policy measures were announced to revive the efficiency of public sector undertakings (PSUs). Allowed for an automatic expansion of capacity up to five per cent per annum. Investment limit of small scale industries was raised.
144

Reforms implemented since 1991 Most central government industrial controls have been dismantled. Policy measures and procedural simplifications have been reviewed on an ongoing basis: Industrial licensing was abolished except for 18 industries related to the security and strategic concerns, social reasons, hazardous chemicals and environmental reasons. As of 2012 there only 5.* Public Sector. Industries reserved to the public sector reduced from 17 to 8, later to 5 and currently to 3 (Atomic energy, substances linked to atomic energy, railways).** Industrial location. Spatial norms for setting up industries have been liberalized. Zoning and land use Regulations as well as Environment Legislation continue to regulate industrial locations. Monopolistic and Restrictive Trade Practice (MRTP) Act Act amended. The emphasis shifted to controlling unfair and restrictive trade practices. The provisions restricting mergers, amalgamations and takeovers repealed. Foreign investment and Technology agreements List of high tech and investment priority industries. Automatic permission for direct foreign investment up to 51 percent foreign equity. 100 per cent FDI allowed in Special Economic Zones for all manufacturing activities. Small scale sector Government started a policy of dereservation after 2001. The list of items reserved for SSI sector was reduced from 821 items in March 1999 to 506 items as of April 2005. The investment limit in plant and machinery of small scale units has been raised by from time to time. To enable some of the small scale units to achieve required economies of scale, a differential investment limit adopted in October 2001. * Alcohol, cigarettes, hazardous chemicals, electronic, aerospace and all types of defence equipment. ** In 2001, "arms and ammunition" was opened to the private sector. Sources: (i) Jadhav N. (2005): Industrial Policy since 1956, Gale Encyclopedia http://www.drnarendrajadhav.info/drnjadhav_web_files/Published%20papers/Indian%20Industrial%20Policy%20Since%201956.pdf (ii) Thakur B., Gupta R. and Singh R. (2012): “Changing Face of India’s Industrial Policy: A Look,” International Journal of Scientific and Research Publications, Volume 2, Issue 12, pp.1-7. (iii) Sivadasan J. (2006): Note on Regulatory regime in India: 1947 to 1998. http://webuser.bus.umich.edu/jagadees/other/indmfg_data/Reg_history_india.pdf
145
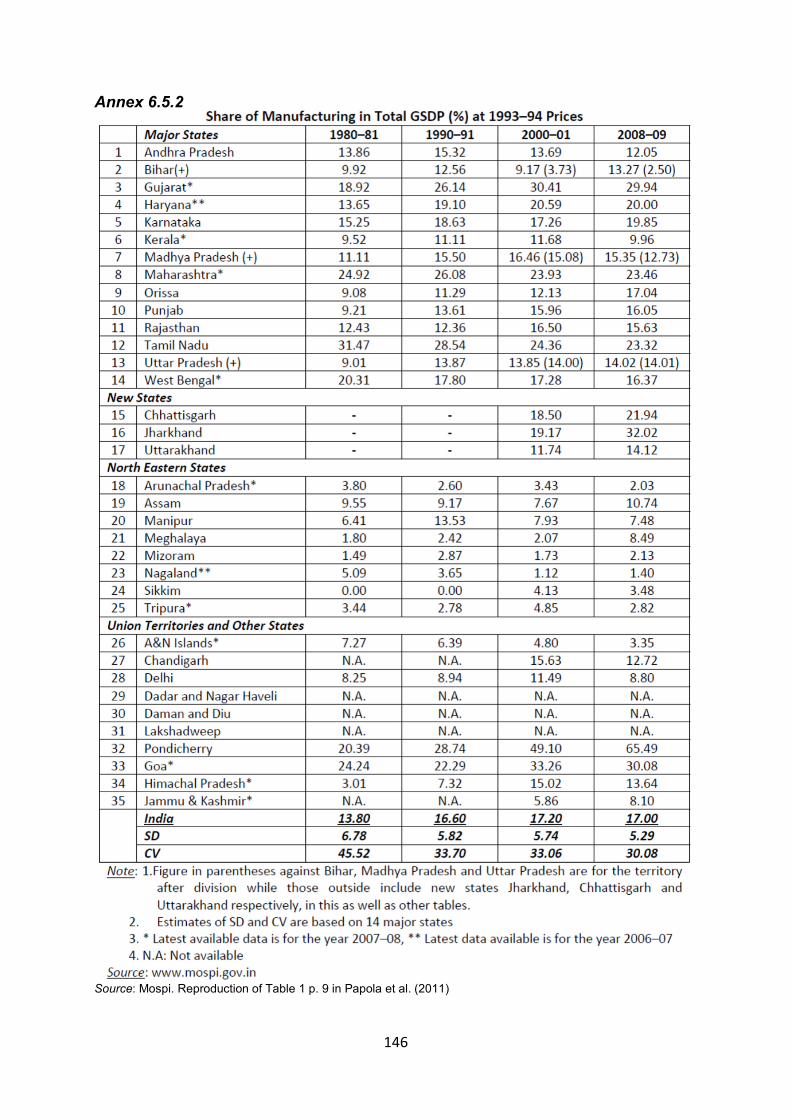
Annex 6.5.2
Source: Mospi. Reproduction of Table 1 p. 9 in Papola et al. (2011)
146
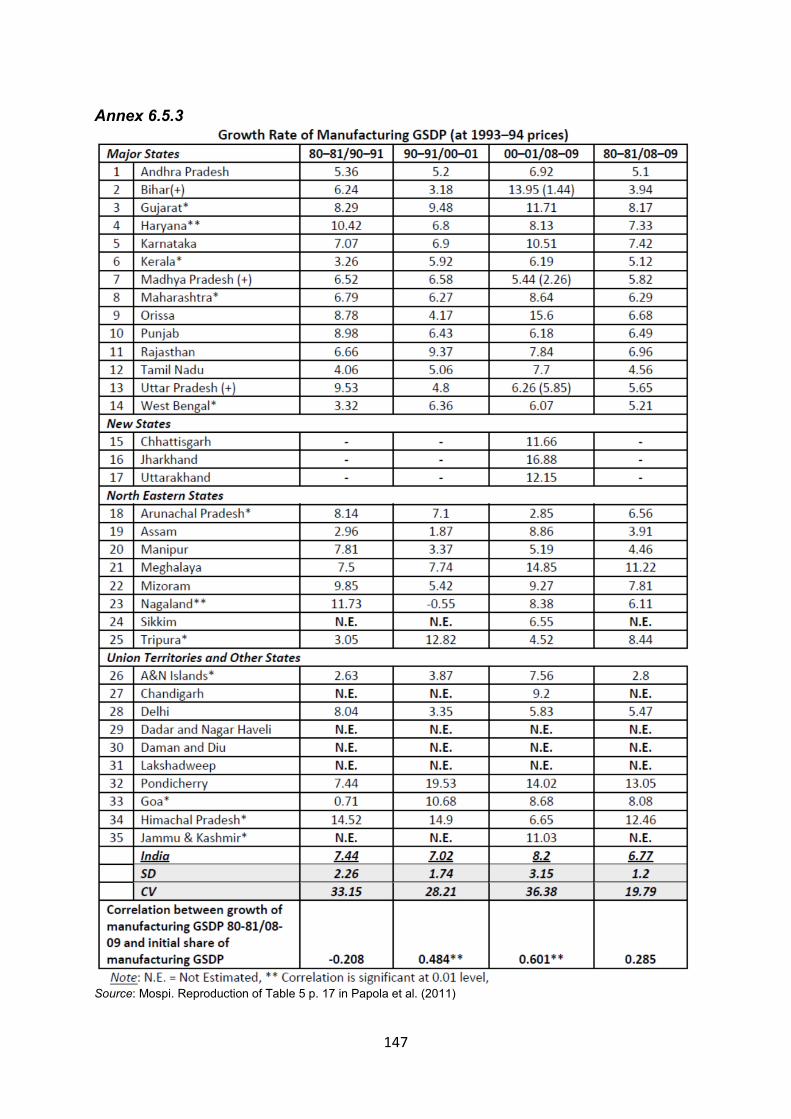
Annex 6.5.3
Source: Mospi. Reproduction of Table 5 p. 17 in Papola et al. (2011)
147
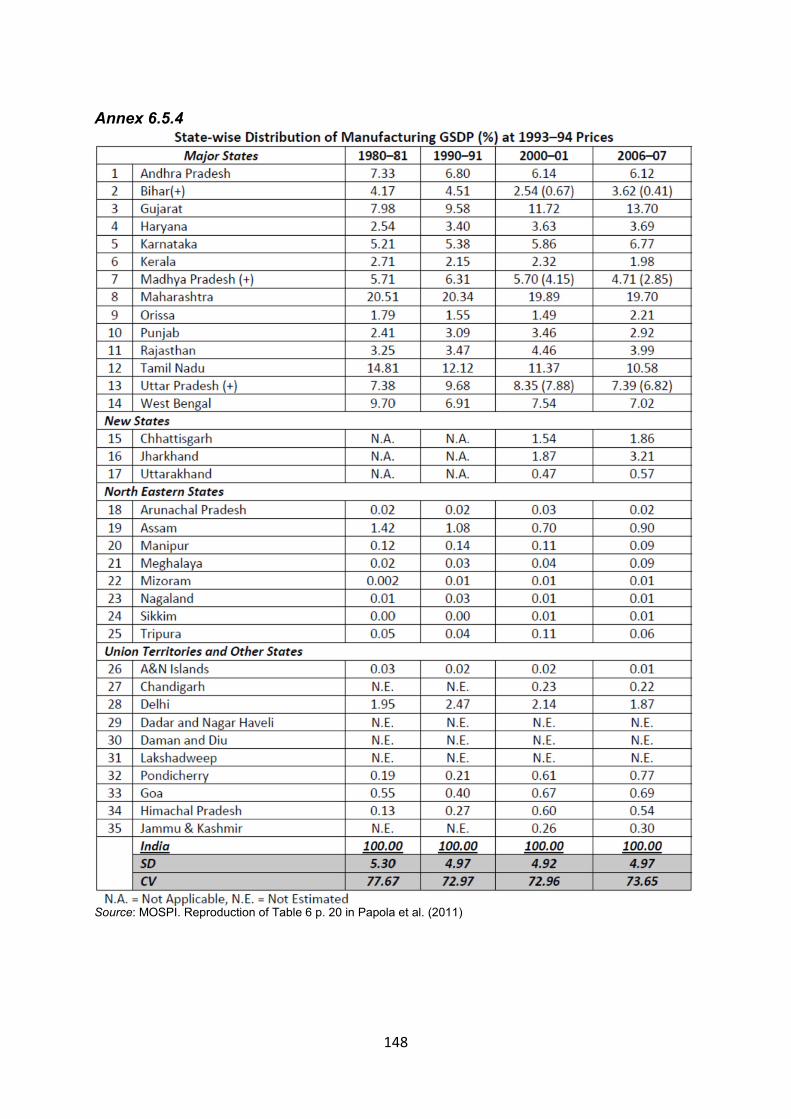
Annex 6.5.4
Source: MOSPI. Reproduction of Table 6 p. 20 in Papola et al. (2011)
148
7. Fractures and divides
7.1. The regional pattern of Inequality
7.1.1. Introduction
Regional inequality is a major component of overall inequality in the labour market. India is large and diverse, and includes at one extreme backward areas lacking in both resources and infrastructure, and at the other end modern city complexes with global lifestyles. These differences have historical origins, of course. The present backwardness of Bihar, for instance, has much to do with its status as an agricultural backwater during colonial times. Regions with large tribal populations such as Chhattisgarh, Jharkand and several North-eastern states were left outside the mainstream of development, with the notable exception of mining, which had little local spillover. Economic growth around Delhi and Mumbai reflected their status as capital and major port, respectively. Whatever the reasons, the result has been sharp differences in living standards across the country. These differences can be examined in several ways. One is to compare states in terms of patterns of development, levels of living and labour market outcomes, which permits us to consider the pattern of polarization and integration of the Indian economy as a whole. Clearly growth is highly concentrated in particular locations, partly because of the availability of infrastructure and local resources (including natural and human resources, as well as state support), but also for a variety of other reasons. For instance, the Freight Equalization Policy27 affected the incentives for investment in different regions. On the other hand, it seems probable that the labour market is becoming more integrated, because of the increase in information flows and migration. There are some 35 states and other territorial units in India, of which 15 to 20 (depending on the definition) are “major” states with a large population. Differences between States capture much of the regional diversity, and statistics are organized statewise, so it makes sense to start at that level. And there is an additional reason, namely that states in practice have a significant degree of policy autonomy, so development patterns vary from one state to another depending on the political choices and competence of the state governments concerned. Nevertheless there is a great deal of variation in the size of states. Uttar Pradesh is larger than all but five countries in the world, but several states have only two or three million inhabitants. In addition, an analysis at the level of states does not fully capture heterogeneity. Most large states are also quite diverse. For instance, Maharashtra includes both Mumbai and a large rural hinterland, parts of it quite backward. There is therefore a case for going below the level of states. Analysis at district level or between agro-climatic zones is one way of capturing regional inequality better, and there is a literature which follows this method. But there is also a case for going above the level of states, and trying to identify a smaller number of distinctive situations and growth regimes. One reason for doing so is that such a
27 The freight equalization policy was intended to promote regionally balanced industrial growth by subsidizing the transportation of coal and other minerals. In practice it created a highly unbalanced pattern of industrial investment, which affected industrial growth in states like Bihar and Jharkand even after the policy was abandoned in 1993.
149
regional breakdown is already standard practice in Brazil, around five major regions. A regional breakdown in India of a similar scale would therefore help to compare the importance of the regional dimension in the two countries. Another key regional divide that cuts across states is the urban-rural distinction. This distinction is becoming more blurred over time, as communications improve, and the rural habitat and social environment is quite different in Brazil and in India, and even in different parts of India. Nevertheless it remains a useful breakdown, because it is well documented and captures some important aspects of inequality. We do not consider this aspect of regional inequality in detail here, since it is incorporated in the analysis in other sections of this paper. In this section we first look at some of the main features of inequality across all states, and then explore regional differences in growth regime and outcomes. In order to address the latter it was necessary to examine the experience of particular states. Local conditions and policies influence patterns of growth and convergence or divergence among states, but are difficult to accommodate in an analysis at the all India level. States not only are different in terms of social and economic relations, resources and historical context, but also in terms of the quality, nature and implementation of government policies. We have decided to look at three states with differing experiences: Bihar, Tamil Nadu and Punjab/Haryana. The state of Jharkand was separated from Bihar only a little over a decade ago, so it is better to consider Bihar and Jharkand together. Punjab and Haryana were divided in the 1960s; Haryana was the relatively backward part of Indian Punjab, and they have different development trajectories since that date, which also make it interesting to consider them together. Tamil Nadu was earlier part of the Madras Presidency but has been a well-defined regional entity for almost half a century. For purposes of the project, when we look at individual states we are interested in three things:
• to what extent has the gap widened between the state concerned and other states of India (or the all-India average) over the period since Independence
• to what extent has the pattern of inequality within the state changed over time • what has been the role of state intervention (the policy regime) and the state level
process of accumulation and growth in these changes. Overall Differences among States Table 7.1.1.1 gives a variety of indicators of regional disparities, in which states are clustered into five regions. No clustering is perfect. In this case clustering has been largely based on the first six variables in the table, covering expenditure per capita, poverty, output per capita and its growth, and urbanization, which all share the same broad regional pattern. One state, Kerala, is so different from the others that it has been put in a category on its own. Some other states do not fit very easily into a cluster; for instance, Rajasthan is in some sense intermediate between three clusters. So this is only an approximate classification. In addition, the averages for each region are the simple averages of the states, without weighting for population size.
150
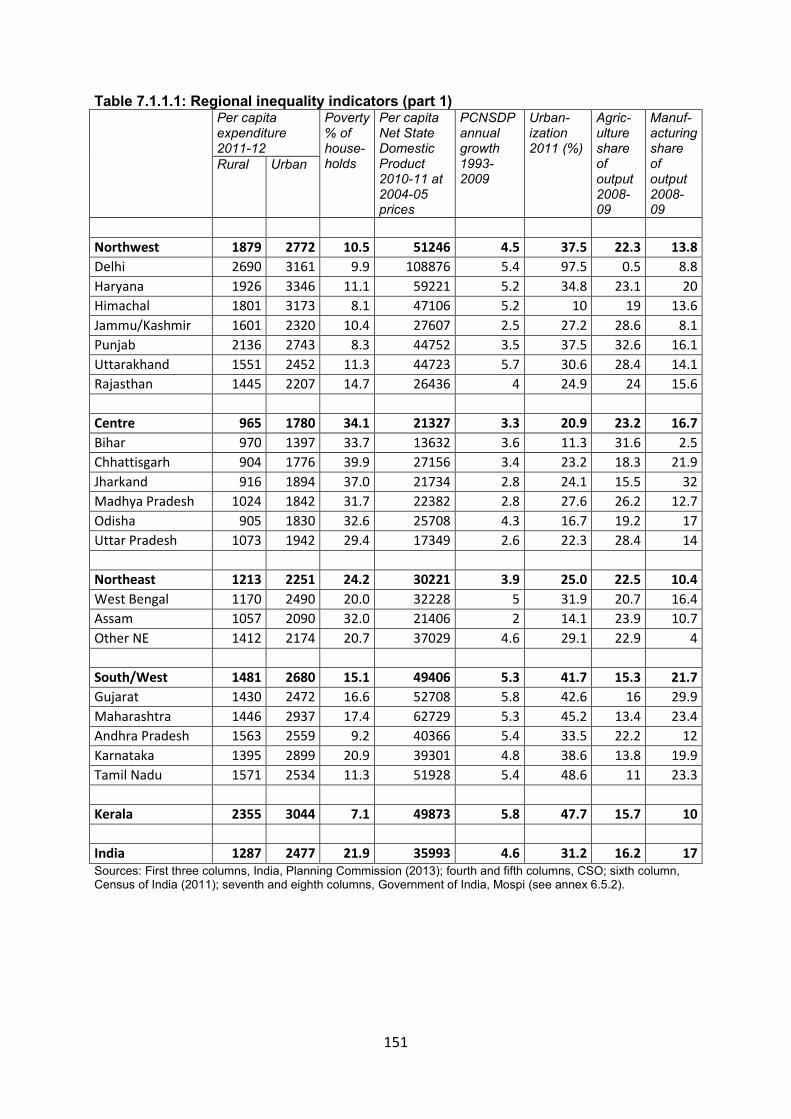
Table 7.1.1.1: Regional inequality indicators (part 1) Per capita
expenditure 2011-12
Poverty % of house-holds
Per capita Net State Domestic Product 2010-11 at 2004-05 prices
PCNSDP annual growth 1993-2009
Urban-ization 2011 (%)
Agric-ulture share of output 2008-09
Manuf-acturing share of output 2008-09
Rural Urban
Northwest 1879 2772 10.5 51246 4.5 37.5 22.3 13.8 Delhi 2690 3161 9.9 108876 5.4 97.5 0.5 8.8 Haryana 1926 3346 11.1 59221 5.2 34.8 23.1 20 Himachal 1801 3173 8.1 47106 5.2 10 19 13.6 Jammu/Kashmir 1601 2320 10.4 27607 2.5 27.2 28.6 8.1 Punjab 2136 2743 8.3 44752 3.5 37.5 32.6 16.1 Uttarakhand 1551 2452 11.3 44723 5.7 30.6 28.4 14.1 Rajasthan 1445 2207 14.7 26436 4 24.9 24 15.6 Centre 965 1780 34.1 21327 3.3 20.9 23.2 16.7 Bihar 970 1397 33.7 13632 3.6 11.3 31.6 2.5 Chhattisgarh 904 1776 39.9 27156 3.4 23.2 18.3 21.9 Jharkand 916 1894 37.0 21734 2.8 24.1 15.5 32 Madhya Pradesh 1024 1842 31.7 22382 2.8 27.6 26.2 12.7 Odisha 905 1830 32.6 25708 4.3 16.7 19.2 17 Uttar Pradesh 1073 1942 29.4 17349 2.6 22.3 28.4 14 Northeast 1213 2251 24.2 30221 3.9 25.0 22.5 10.4 West Bengal 1170 2490 20.0 32228 5 31.9 20.7 16.4 Assam 1057 2090 32.0 21406 2 14.1 23.9 10.7 Other NE 1412 2174 20.7 37029 4.6 29.1 22.9 4 South/West 1481 2680 15.1 49406 5.3 41.7 15.3 21.7 Gujarat 1430 2472 16.6 52708 5.8 42.6 16 29.9 Maharashtra 1446 2937 17.4 62729 5.3 45.2 13.4 23.4 Andhra Pradesh 1563 2559 9.2 40366 5.4 33.5 22.2 12 Karnataka 1395 2899 20.9 39301 4.8 38.6 13.8 19.9 Tamil Nadu 1571 2534 11.3 51928 5.4 48.6 11 23.3 Kerala 2355 3044 7.1 49873 5.8 47.7 15.7 10 India 1287 2477 21.9 35993 4.6 31.2 16.2 17 Sources: First three columns, India, Planning Commission (2013); fourth and fifth columns, CSO; sixth column, Census of India (2011); seventh and eighth columns, Government of India, Mospi (see annex 6.5.2).
151
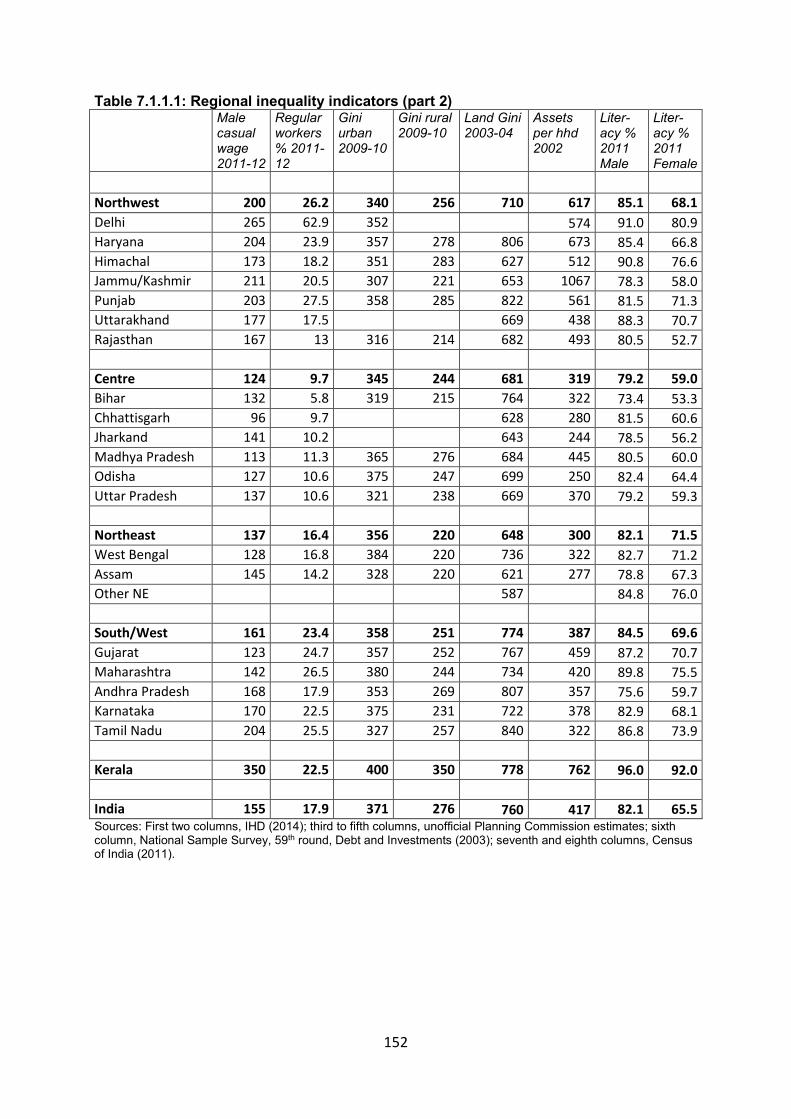
Table 7.1.1.1: Regional inequality indicators (part 2) Male
casual wage 2011-12
Regular workers % 2011-12
Gini urban 2009-10
Gini rural 2009-10
Land Gini 2003-04
Assets per hhd 2002
Liter-acy % 2011 Male
Liter-acy % 2011 Female
Northwest 200 26.2 340 256 710 617 85.1 68.1 Delhi 265 62.9 352 574 91.0 80.9 Haryana 204 23.9 357 278 806 673 85.4 66.8 Himachal 173 18.2 351 283 627 512 90.8 76.6 Jammu/Kashmir 211 20.5 307 221 653 1067 78.3 58.0 Punjab 203 27.5 358 285 822 561 81.5 71.3 Uttarakhand 177 17.5 669 438 88.3 70.7 Rajasthan 167 13 316 214 682 493 80.5 52.7 Centre 124 9.7 345 244 681 319 79.2 59.0 Bihar 132 5.8 319 215 764 322 73.4 53.3 Chhattisgarh 96 9.7 628 280 81.5 60.6 Jharkand 141 10.2 643 244 78.5 56.2 Madhya Pradesh 113 11.3 365 276 684 445 80.5 60.0 Odisha 127 10.6 375 247 699 250 82.4 64.4 Uttar Pradesh 137 10.6 321 238 669 370 79.2 59.3 Northeast 137 16.4 356 220 648 300 82.1 71.5 West Bengal 128 16.8 384 220 736 322 82.7 71.2 Assam 145 14.2 328 220 621 277 78.8 67.3 Other NE 587 84.8 76.0 South/West 161 23.4 358 251 774 387 84.5 69.6 Gujarat 123 24.7 357 252 767 459 87.2 70.7 Maharashtra 142 26.5 380 244 734 420 89.8 75.5 Andhra Pradesh 168 17.9 353 269 807 357 75.6 59.7 Karnataka 170 22.5 375 231 722 378 82.9 68.1 Tamil Nadu 204 25.5 327 257 840 322 86.8 73.9 Kerala 350 22.5 400 350 778 762 96.0 92.0 India 155 17.9 371 276 760 417 82.1 65.5 Sources: First two columns, IHD (2014); third to fifth columns, unofficial Planning Commission estimates; sixth column, National Sample Survey, 59th round, Debt and Investments (2003); seventh and eighth columns, Census of India (2011).
152
The Northwest region has the highest expenditure per capita in both urban and rural areas (apart from Kerala), the lowest poverty and the highest output per capita. This area includes Delhi, the productive agricultural regions nearby, and the western Himalayan states. In the mountain states, somewhat lower output per capita is compensated by inflows of remittances and public resources. Rajasthan has been included here; a part of the state which is close to Delhi fits this group quite well, but the state also has more backward areas, which bring down the average. The region includes high productivity agricultural areas, which is one reason why the share of agriculture is high, while manufacturing is low. Overall growth since the economic reform is close to the all India average. The labour market is more formalized than average, with the highest share of regular workers, and casual wages are high. Inequality is relatively low, and literacy is high. Overall this is an advanced region with a relatively successful social and economic model. The Centre is the poorest region by some margin, with a total population not far short of 500 million. Expenditure per capita is lowest in both rural and urban areas, and poverty highest at 34 per cent. Wages are low, and only 10 per cent of employment is regular. The area is more dependent than average on agriculture, but unlike in the Northwest this is a source of low incomes. Literacy is also the lowest, for both men and women, and urbanization is low. This region has the lowest output growth of any region. This large area is where backwardness and poverty are concentrated in India, and it occupies a large area in the centre of the country. The Northeast is a geographical region more than a homogenous economic one, since it extends from Kolkata to remote hilly areas, with diverse economic structures and histories. On balance it does slightly worse than average on the main economic indicators, with by far the lowest share of manufacturing (even West Bengal is below the all-India average), low wages and the lowest level of assets per household in urban areas. Output growth rates are also low. Educational levels, on the other hand are distinctly better than average for women. The South and West includes the important manufacturing areas in Gujarat and Maharashtra, and three of the major states in the South. While these are not normally grouped together, they have a number of elements in common, in particular high expenditure and output, low poverty, high shares of manufacturing and high output growth rates, and a high proportion of regular work. Casual wages, on the other hand, are not particularly high, especially in Gujarat where they are among the lowest in the country. Most of these states also have large backward areas, so inequality is fairly high, especially for land ownership. Education levels are high for both men and women. This region includes the manufacturing heartland of India, with a high level of urbanization, but it lags behind the Northwest in terms of wages and expenditure. Finally Kerala is quite distinctive, with very high expenditure levels (but remittances from migrants to the Gulf play a role here), heavy dependency on services (the shares of both agriculture and manufacturing are lower than average), very high wages and high inequality. It also has close to universal literacy. Kerala’s social and political history is different from other parts of India, and this also drives the economic indicators, making the state a special case. The interesting questions, for the point of view of our project, are:
(i) what share of overall inequality is due to differences between states? and (ii) how far have these differentials changed in the course of India’s development?
153

Many studies have acknowledged that regional disparity has been a feature of India’s economic growth (Sachs et al 2002; Ahluwalia 2001; Shetty 2003; Bhattacharya and Sakthivel, 2004); Bagchi and Kurian, 2005). Most of these have focused on the disparities in per capita incomes and report a tendency for divergence among states – in other words, the available evidence suggests that interstate inequality is increasing in India, and has been since at least the 1970s. Ramaswamy (2007) finds that the income Gini increased from 0.28 in 1993-94 to 0.36 in 2004-05. He also finds that GSDP growth in the high and medium income states grew faster than in the low income states over the period 1993-94 to 2004-05. We can also see this in table 7.1.1.1. The highest growth rates in the period 1993 to 2009 were in the better off North and South-West regions, and in Kerala. The more backward Centre region had the slowest growth rate. Ramaswamy finds that the coefficient of variation increased from 36.6 in the period 1993-94 to 1999-00 to 128 in the period 1999-2000 to 2004-05, also suggesting widening of regional disparities in the reform period. Nayyar (2008) shows that the growth rate of per capita SDP between 1978-79 and 2002-03 is strongly positively correlated with the level of per capita SDP in 1978-79. It is less certain that this increasing inequality in output is associated with an increasing inequality in wages. Chavan and Bedamatta (2006) find that the coefficient of variation of wage earnings of agricultural labourers (across states) was much the same in 1999-2000 as in 1977-78 or 1964-65 for men, although it is higher for women. Some papers investigating the convergence of per capita NSDP among the states have found absence of unconditional convergence, but this depends on the period under consideration. Sachs et al (2002) finds weak signs of convergence of per capita income (measured by GSDP) among 14 major states for the period 1980 to 1998. Thirlwall (2013) finds no empirical evidence of unconditional convergence in the first decade of the twenty first century, but weak evidence of conditional convergence controlling for population growth; credit growth; male literacy; the share of agriculture in State GDP, and State expenditure as a share of State GDP. Ahluwalia (2002) observed that the estimated Gini-coefficient of income inequality) has increased from about 0.16 in 1986-87 to 0.23 in 1997-98. The evidence on industrial development discussed in the last section suggests that there was some divergence in industrial growth in the early years after Independence and again after the 1980s. In fact, the balance of the empirical evidence suggests that there may have been some degree of convergence between states after Independence and up to the 1980s, or at least no great increase in inequality; but this has since been reversed. The change of pattern coincides fairly closely with a shift from the public sector to the private sector as the driver of growth in the 1980s. More recently there has been an acceleration of growth in some backward states (notably Bihar) but it remains to be seen whether this will be sustained (see section 7.1.2 below). Income disparities translate to labour market disparities. Ramaswamy (2007) finds that employment growth is faster in states that have had initially more diversified economies, and highly diversified states have high income to begin with. Low income states like Bihar, Uttar Pradesh, Madhya Pradesh and Rajasthan, started with less diversified structures and they are changing at a much slower pace. It is also observed that the manufacturing labour productivity is higher in the high income states. Educational attainment differs widely across states. This is not just a question of literacy, as in table 7.1.1.1. The low income states have much lower levels of enrolment of young
154
individuals in secondary and higher secondary education (Ramaswamy, 2007). The mean years of schooling in 2004-05 was lowest in Rajasthan (2.97 years) and highest in Kerala (6.19 years) (Suryanarayana, Agrawal, and Prabhu, 2011). Ramaswamy (2007) also finds that non-agricultural labour productivity has grown faster in states with initially higher educational attainment. All this tells us that regional disparities do play an important role in the overall pattern of inequality and its evolution over time. Not all the variables in the table show the same pattern, however. Urbanization does seem to be associated with other disparities, and so do assets per urban household, but the share of agriculture or manufacturing is a much less strong indicator. Nor do casual wages correlate perfectly with regional production and expenditure differences. They are low in the industrially advanced west, perhaps reflecting more exploitative labour markets. The Gini coefficients of expenditure within each state do not present a clear picture. There is not a great deal of variation between states in the urban Gini – but there is a fairly consistent pattern over time, with a rise in all states since 1973 (except Delhi, where it did not change), averaging over .05. The rural Gini has changed much less, and insofar as there has been a change it was a decline, concentrated in the poorer Central and North-eastern regions, perhaps as the result of a collapse of semi-feudal agrarian systems. These specific aspects of the growth and policy regimes require more detailed analysis of specific cases, to which we now turn.
7.1.2. Bihar and Jharkand Bihar is the second largest state in India in terms of population (104 million in 2011). Until 2000, the present state of Jharkand (population 33 million) was included within Bihar. Jharkand is essentially a hilly and plateau area, with a significant tribal population; present day Bihar lies almost exclusively on the Gangetic Plain. At the time of Independence, net domestic per capita production in present day Bihar was about 30 per cent below the all-India average. These are official figures which refer to Bihar within its present boundaries, i.e. they exclude Jharkand. At the time of separation from Bihar (2000), Jharkand had a total NSDP which was about 40 per cent of the combined NSDP of the two states, but a per capita income that was double that of Bihar. We have not found the corresponding numbers for 1950, but if the relative sizes of the economies of the two states were similar then to what they were in 2000, then the average income of Bihar and Jharkand combined would have been very close to the all India average, perhaps just a little lower but not much. Leaving Jharkand on one side, until the mid 1960s Bihar broadly maintained its relative position, between 60 and 70% of the all-India average but then started to fall further behind. After the famine of 1966-67, and through the decades of the 1970s and 1980s, Bihar’s income per capita varied in the range from 50 to 60% of the Indian average. There was some recovery in the 1980s, but then a steady decline until around 2005, when output per capita in Bihar had fallen to only one third of the all India level. Since then there has been some recovery, which continued after the data in graph (which end in 2008 because there is a change of data series); in 2011-12 Bihar had recovered to 42% of the all India level, according to the latest official data in current prices. But the gap is still far larger than 60 years ago.
155
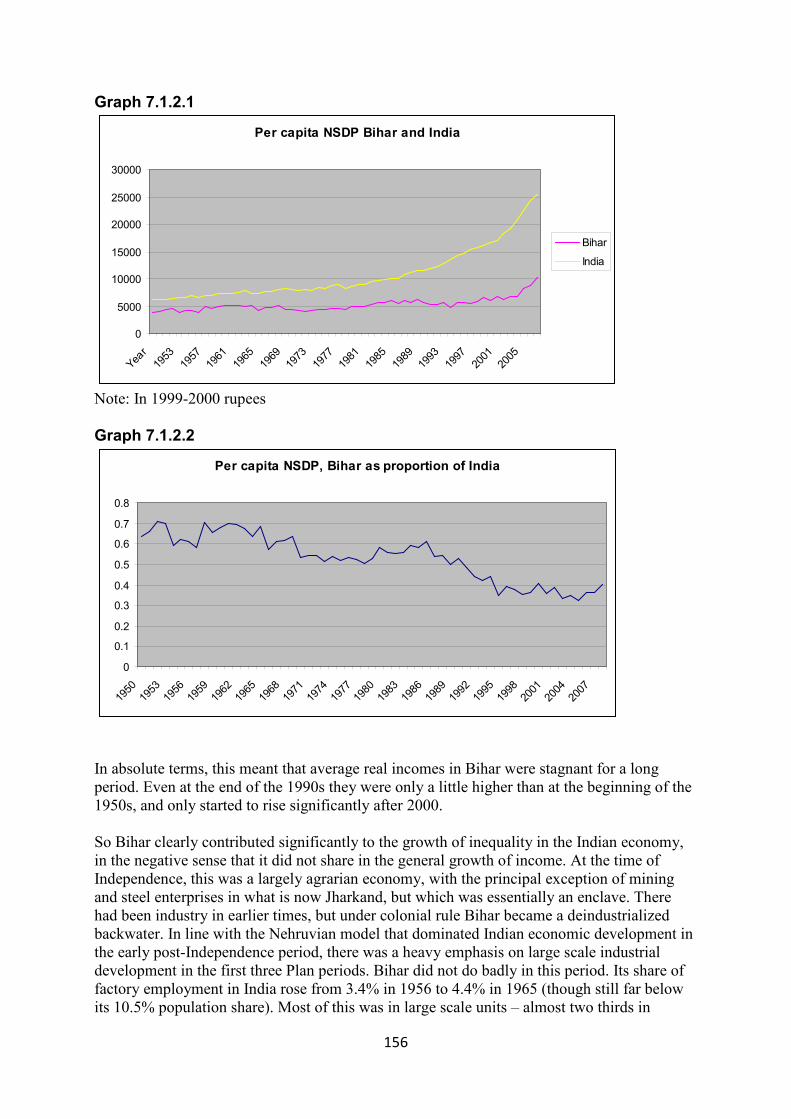
Graph 7.1.2.1
Per capita NSDP Bihar and India
0
5000
10000
15000
20000
25000
30000
Year
1953
1957
1961
1965
1969
1973
1977
1981
1985
1989
1993
1997
2001
2005
Bihar
India
Note: In 1999-2000 rupees Graph 7.1.2.2
Per capita NSDP, Bihar as proportion of India
0
0.1
0.2
0.3
0.4
0.5
0.6
0.7
0.8
1950
1953
1956
1959
1962
1965
1968
1971
1974
1977
1980
1983
1986
1989
1992
1995
1998
2001
2004
2007
In absolute terms, this meant that average real incomes in Bihar were stagnant for a long period. Even at the end of the 1990s they were only a little higher than at the beginning of the 1950s, and only started to rise significantly after 2000. So Bihar clearly contributed significantly to the growth of inequality in the Indian economy, in the negative sense that it did not share in the general growth of income. At the time of Independence, this was a largely agrarian economy, with the principal exception of mining and steel enterprises in what is now Jharkand, but which was essentially an enclave. There had been industry in earlier times, but under colonial rule Bihar became a deindustrialized backwater. In line with the Nehruvian model that dominated Indian economic development in the early post-Independence period, there was a heavy emphasis on large scale industrial development in the first three Plan periods. Bihar did not do badly in this period. Its share of factory employment in India rose from 3.4% in 1956 to 4.4% in 1965 (though still far below its 10.5% population share). Most of this was in large scale units – almost two thirds in
156
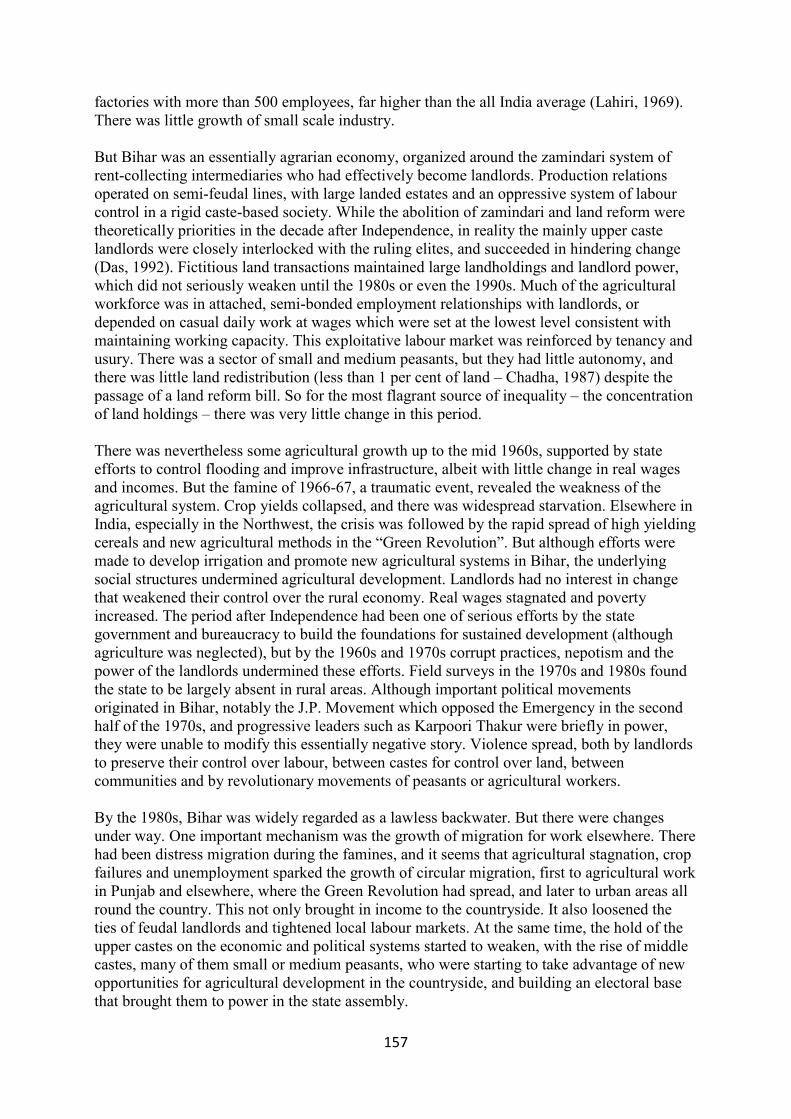
factories with more than 500 employees, far higher than the all India average (Lahiri, 1969). There was little growth of small scale industry. But Bihar was an essentially agrarian economy, organized around the zamindari system of rent-collecting intermediaries who had effectively become landlords. Production relations operated on semi-feudal lines, with large landed estates and an oppressive system of labour control in a rigid caste-based society. While the abolition of zamindari and land reform were theoretically priorities in the decade after Independence, in reality the mainly upper caste landlords were closely interlocked with the ruling elites, and succeeded in hindering change (Das, 1992). Fictitious land transactions maintained large landholdings and landlord power, which did not seriously weaken until the 1980s or even the 1990s. Much of the agricultural workforce was in attached, semi-bonded employment relationships with landlords, or depended on casual daily work at wages which were set at the lowest level consistent with maintaining working capacity. This exploitative labour market was reinforced by tenancy and usury. There was a sector of small and medium peasants, but they had little autonomy, and there was little land redistribution (less than 1 per cent of land – Chadha, 1987) despite the passage of a land reform bill. So for the most flagrant source of inequality – the concentration of land holdings – there was very little change in this period. There was nevertheless some agricultural growth up to the mid 1960s, supported by state efforts to control flooding and improve infrastructure, albeit with little change in real wages and incomes. But the famine of 1966-67, a traumatic event, revealed the weakness of the agricultural system. Crop yields collapsed, and there was widespread starvation. Elsewhere in India, especially in the Northwest, the crisis was followed by the rapid spread of high yielding cereals and new agricultural methods in the “Green Revolution”. But although efforts were made to develop irrigation and promote new agricultural systems in Bihar, the underlying social structures undermined agricultural development. Landlords had no interest in change that weakened their control over the rural economy. Real wages stagnated and poverty increased. The period after Independence had been one of serious efforts by the state government and bureaucracy to build the foundations for sustained development (although agriculture was neglected), but by the 1960s and 1970s corrupt practices, nepotism and the power of the landlords undermined these efforts. Field surveys in the 1970s and 1980s found the state to be largely absent in rural areas. Although important political movements originated in Bihar, notably the J.P. Movement which opposed the Emergency in the second half of the 1970s, and progressive leaders such as Karpoori Thakur were briefly in power, they were unable to modify this essentially negative story. Violence spread, both by landlords to preserve their control over labour, between castes for control over land, between communities and by revolutionary movements of peasants or agricultural workers. By the 1980s, Bihar was widely regarded as a lawless backwater. But there were changes under way. One important mechanism was the growth of migration for work elsewhere. There had been distress migration during the famines, and it seems that agricultural stagnation, crop failures and unemployment sparked the growth of circular migration, first to agricultural work in Punjab and elsewhere, where the Green Revolution had spread, and later to urban areas all round the country. This not only brought in income to the countryside. It also loosened the ties of feudal landlords and tightened local labour markets. At the same time, the hold of the upper castes on the economic and political systems started to weaken, with the rise of middle castes, many of them small or medium peasants, who were starting to take advantage of new opportunities for agricultural development in the countryside, and building an electoral base that brought them to power in the state assembly.
157

The change in political power, however, mainly served to change the beneficiaries of patronage. The state’s development agenda continued to consist largely of rhetoric, as it had in the past. The semi-feudal system unravelled, but there was little development in that industrial investment remained vanishingly small (the freight equalization policy being one reason), infrastructure (power, roads, drainage) was poor, and the local bureaucracy seemed mainly concerned with sharing the spoils of exploitation with local elites. Real wages rose, but this had much more to do with migration than with local development. Nevertheless, because there was an increase in incomes at the bottom of the pyramid, it is likely that inequality declined in the 1980s and 1990s. The separation of Jharkand, in 2000, was surprisingly smooth. Jharkand, however, is quite different from the rest of Bihar. There is a large tribal population, more urbanization and industry and agricultural conditions are quite different. It is true that most of the large scale industrial development of the state was located in Jharkand, but the beneficiaries were largely outside the state; the separation of Jharkand did not threaten the interests of the political elite in Patna. But Jharkand has continued to be corrupt and politically troubled after separation, with conflicts over livelihoods between tribal populations and mining companies. The ratio of NSDP per capita in Jharkand to that of Bihar in 2012 was exactly the same as in 1999, so the state has not been able to build on its better resource base. Outmigration from Jharkand is very high, as it is from Bihar. In the mid 2000s, there was a new political development in Patna, with the arrival in power of Nitish Kumar, a politician from a middle caste like his predecessor, but with a much more vigorous social and economic development agenda. Tough law and order measures and closer control of the local bureaucracy clearly had some impact, with social programmes for the first time reaching beneficiaries in large numbers. The Bihar economy started to grow rapidly, not on the basis of inflows of industrial investment but as a spillover from the increased rate of growth of the Indian economy, which was providing jobs and incomes outside the state to millions of Biharis, along with a sentiment that the state had become safer for economic activities, with less threat of extortion or kidnapping. The new politics was based more on a new social policy regime than on an economic policy regime, but a boom in construction and trade ensued, and there is widespread agreement, including among surveyed populations at the village level, that living standards improved. How far the rise in incomes could be traced to local development and how far to migration remained a moot point. One thing that is clear is that the benefits from the rapid growth of the state economy were highly concentrated. In rural areas, available data suggest that income inequality has increased even as wages have risen. And black money from earlier periods seems to be readily ploughed into real estate and trading activities in urban areas. The Bihar labour market remains very heavily rural. Only a little over 10 per cent of the population is urban. And among that urban population, relatively few have regular jobs – 21 per cent against double that number in India as a whole. In some ways Bihar replicates the structure of India’s labour market as a whole, but in an amplified way. Like the overall Indian labour market Bihar is largely informal and unprotected. But whereas the organized, protected segment of India’s labour market is small, the corresponding segment of Bihar’s labour market is miniscule, and consists largely of public sector employment. There are therefore few local opportunities for decent jobs, which are carefully protected by politically and economically influential groups, both rural and urban.
158
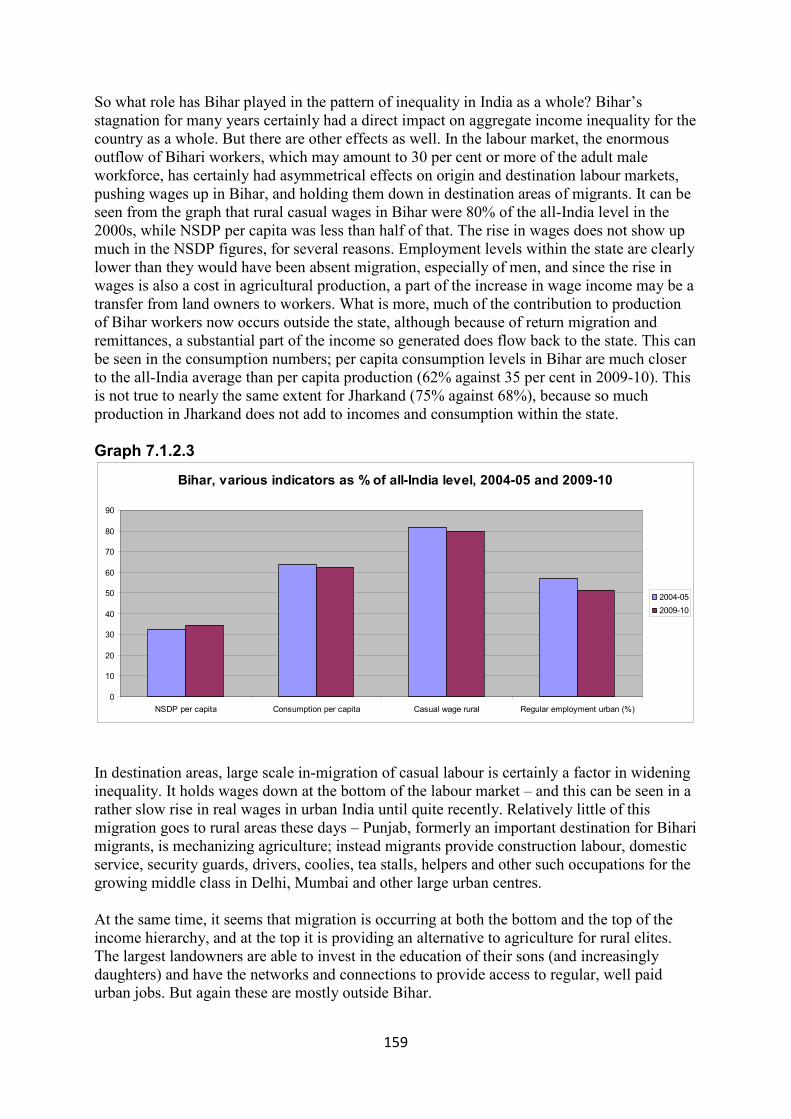
So what role has Bihar played in the pattern of inequality in India as a whole? Bihar’s stagnation for many years certainly had a direct impact on aggregate income inequality for the country as a whole. But there are other effects as well. In the labour market, the enormous outflow of Bihari workers, which may amount to 30 per cent or more of the adult male workforce, has certainly had asymmetrical effects on origin and destination labour markets, pushing wages up in Bihar, and holding them down in destination areas of migrants. It can be seen from the graph that rural casual wages in Bihar were 80% of the all-India level in the 2000s, while NSDP per capita was less than half of that. The rise in wages does not show up much in the NSDP figures, for several reasons. Employment levels within the state are clearly lower than they would have been absent migration, especially of men, and since the rise in wages is also a cost in agricultural production, a part of the increase in wage income may be a transfer from land owners to workers. What is more, much of the contribution to production of Bihar workers now occurs outside the state, although because of return migration and remittances, a substantial part of the income so generated does flow back to the state. This can be seen in the consumption numbers; per capita consumption levels in Bihar are much closer to the all-India average than per capita production (62% against 35 per cent in 2009-10). This is not true to nearly the same extent for Jharkand (75% against 68%), because so much production in Jharkand does not add to incomes and consumption within the state. Graph 7.1.2.3
Bihar, various indicators as % of all-India level, 2004-05 and 2009-10
0
10
20
30
40
50
60
70
80
90
NSDP per capita Consumption per capita Casual wage rural Regular employment urban (%)
2004-052009-10
In destination areas, large scale in-migration of casual labour is certainly a factor in widening inequality. It holds wages down at the bottom of the labour market – and this can be seen in a rather slow rise in real wages in urban India until quite recently. Relatively little of this migration goes to rural areas these days – Punjab, formerly an important destination for Bihari migrants, is mechanizing agriculture; instead migrants provide construction labour, domestic service, security guards, drivers, coolies, tea stalls, helpers and other such occupations for the growing middle class in Delhi, Mumbai and other large urban centres. At the same time, it seems that migration is occurring at both the bottom and the top of the income hierarchy, and at the top it is providing an alternative to agriculture for rural elites. The largest landowners are able to invest in the education of their sons (and increasingly daughters) and have the networks and connections to provide access to regular, well paid urban jobs. But again these are mostly outside Bihar.
159
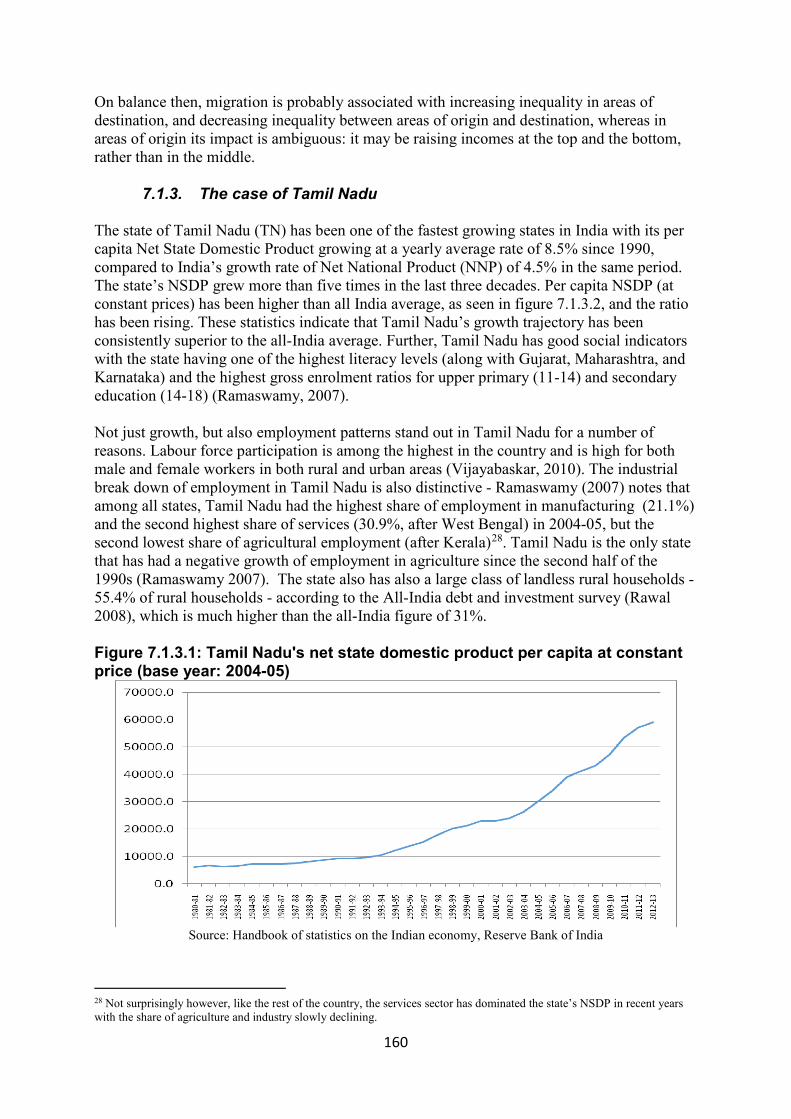
On balance then, migration is probably associated with increasing inequality in areas of destination, and decreasing inequality between areas of origin and destination, whereas in areas of origin its impact is ambiguous: it may be raising incomes at the top and the bottom, rather than in the middle.
7.1.3. The case of Tamil Nadu The state of Tamil Nadu (TN) has been one of the fastest growing states in India with its per capita Net State Domestic Product growing at a yearly average rate of 8.5% since 1990, compared to India’s growth rate of Net National Product (NNP) of 4.5% in the same period. The state’s NSDP grew more than five times in the last three decades. Per capita NSDP (at constant prices) has been higher than all India average, as seen in figure 7.1.3.2, and the ratio has been rising. These statistics indicate that Tamil Nadu’s growth trajectory has been consistently superior to the all-India average. Further, Tamil Nadu has good social indicators with the state having one of the highest literacy levels (along with Gujarat, Maharashtra, and Karnataka) and the highest gross enrolment ratios for upper primary (11-14) and secondary education (14-18) (Ramaswamy, 2007). Not just growth, but also employment patterns stand out in Tamil Nadu for a number of reasons. Labour force participation is among the highest in the country and is high for both male and female workers in both rural and urban areas (Vijayabaskar, 2010). The industrial break down of employment in Tamil Nadu is also distinctive - Ramaswamy (2007) notes that among all states, Tamil Nadu had the highest share of employment in manufacturing (21.1%) and the second highest share of services (30.9%, after West Bengal) in 2004-05, but the second lowest share of agricultural employment (after Kerala)28. Tamil Nadu is the only state that has had a negative growth of employment in agriculture since the second half of the 1990s (Ramaswamy 2007). The state also has also a large class of landless rural households -55.4% of rural households - according to the All-India debt and investment survey (Rawal 2008), which is much higher than the all-India figure of 31%. Figure 7.1.3.1: Tamil Nadu's net state domestic product per capita at constant price (base year: 2004-05)
Source: Handbook of statistics on the Indian economy, Reserve Bank of India
28 Not surprisingly however, like the rest of the country, the services sector has dominated the state’s NSDP in recent years with the share of agriculture and industry slowly declining.
160
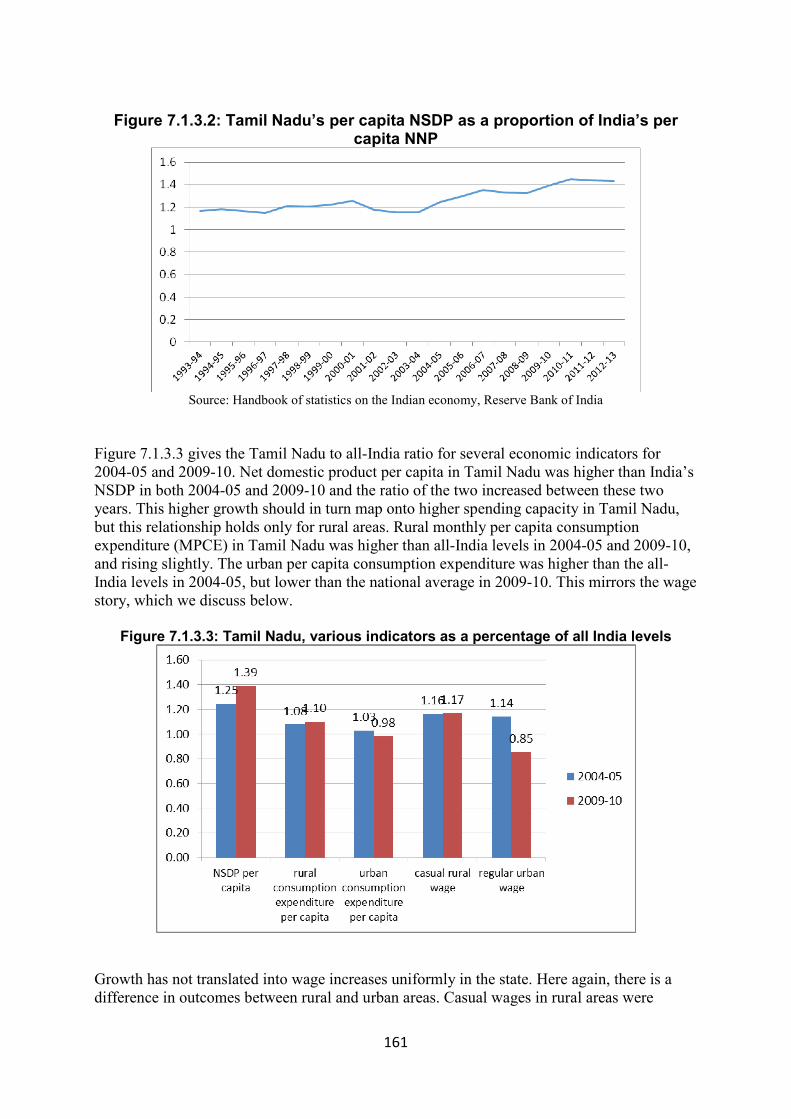
Figure 7.1.3.2: Tamil Nadu’s per capita NSDP as a proportion of India’s per
capita NNP
Source: Handbook of statistics on the Indian economy, Reserve Bank of India
Figure 7.1.3.3 gives the Tamil Nadu to all-India ratio for several economic indicators for 2004-05 and 2009-10. Net domestic product per capita in Tamil Nadu was higher than India’s NSDP in both 2004-05 and 2009-10 and the ratio of the two increased between these two years. This higher growth should in turn map onto higher spending capacity in Tamil Nadu, but this relationship holds only for rural areas. Rural monthly per capita consumption expenditure (MPCE) in Tamil Nadu was higher than all-India levels in 2004-05 and 2009-10, and rising slightly. The urban per capita consumption expenditure was higher than the all-India levels in 2004-05, but lower than the national average in 2009-10. This mirrors the wage story, which we discuss below.
Figure 7.1.3.3: Tamil Nadu, various indicators as a percentage of all India levels
Growth has not translated into wage increases uniformly in the state. Here again, there is a difference in outcomes between rural and urban areas. Casual wages in rural areas were
161

higher than the all-India rural casual wages in both 2004-05 and 2009-10 (Rs. 57 against 49, and Rs 109 against 93, respectively), with little change in the ratio. However for regular salaried wages in urban areas, the ratio was higher in Tamil Nadu than all-India in 2004-05 but lower in 2009-10 (Rs. 194 against 170, and 311 against 365 respectively). One possible explanation lies in the increasing capital intensity of manufacturing industries in Tamil Nadu, especially after 2004-05 (but figure 7.1.3.4 suggests that the capital labour ratio has been following a similar growth path in Tamil Nadu as in the rest of India).
Figure 7.1.3.4: Capital-labour ratio in Tamil Nadu
Source: calculations are based on the ASI data obtained from Manonmani (2013)
So many indicators, both economic and social, in Tamil Nadu are higher and better than the rest of India. Tamil Nadu’s spending power and social indicators are among the highest in the country. Various social and human development indices rank Tamil Nadu between 3rd and 8th out of 22 larger states in the period 2007-12 (CSD, 2013, p. 291). Tamil Nadu’s performance clearly stands out as contributing to regional inequality. The pattern of growth is based on industrial and service sector development, and there is a clear pattern of agricultural stagnation. Vijay Baskar (2010) argues that the agricultural stagnation in TN needs to be understood from the growing dynamism in the urban areas. In fact, Tamil Nadu is the most urbanized state in country (Census of India, 2011). There is a clear trend of employment and income diversification among rural households which has been aided by the even spread of urbanization across the state. Good infrastructure has additionally facilitated daily commuting to nearby urban areas, aiding the process of diversification and decreasing dependence in agriculture. The increasing dynamism in the urban areas has been accompanied by major socio-economic developments and destabilization of traditional caste barriers. In particular, “Other Backward” castes have taken major forward strides in the course of the last century and the anti-caste Dravidian movement, started by Periyar E.V. Ramasamy and continued by C. Annadurai in
162
the Madras presidency, played a significant role in this regard (Vijay Baskar, 2010). The movement was started originally in response to the disproportionate representation of Brahmins in government jobs before Independence and the resulting inequality that was perpetuated after Independence. This movement and the ensuing political movements based on it resulted in education and job reservation becoming an important strategy in combating caste-based inequality within the state. Tamil Nadu currently has a reservation quota of 69% - 30% for backward castes, 20% for Most backward castes and de-notified communities, 18% for Scheduled Castes and 1% for Scheduled Tribes, in educational institutions. In comparison, the all India levels of reservation for central government institutions are currently at 49.5% - 27% for OBCs, 15% for SCs and 7.5% for STs. Tamil Nadu’s level of reservations are much higher than the 50% limit notified by the Supreme Court and at odds with its suggestion to remove the creamy layer from getting the benefits of reservation to OBCs (in the case of Tamil Nadu OBCs comprises of BC (backward classes), MBC (most backward classes), and denotified communities). There is a consensus that these reservations have been instrumental in increasing the social and economic status of OBCs in Tamil Nadu, bringing them on par with the forward castes (MIDS, 1988; Vijay Baskar, 2010). However, several studies have demonstrated that the Dravidian movement did not uplift the Dalits. It is often argued that having gained political power from the stranglehold of the Brahmin minority, the backward and intermediate castes monopolized power in their turn (Karthikeyan 2009, 2011, 2012). Thevars, Gounders, Naickers, Nadars and Vanniyars, important groups among the OBCs in Tamil Nadu, all have pockets of dominance across the state and have been assiduously wooed by the Dravidian parties. On the other hand, the Dalits have or never had any strong presence or clout in any of the Dravidian parties. Their position still remains vulnerable in the state. Their daily lives in villages remain subject to cases of untouchability, social, economic and religious segregation, violent upper caste reaction to any assertion, and there is apparent state complicity in such attacks (EPW, 2012). EPW remarks that this is the case of Dalits in “a state that has taken pride in its record of strong anti-caste and rationalist movements that catapulted lower-caste political outfits to state power more than four decades ago.”29 Nevertheless, Tamil Nadu has a history of implementing pro-poor policies effectively and with care since the time of Independence. K. Kamaraj, the chief minister in 1954, strove to eradicate illiteracy by introducing free and compulsory education up to the eleventh standard. One of the first political acts of Kamaraj during his tenure as chief minister was to widen representation of the rising non-Brahmins in the cabinet, which was not the case earlier. One of the landmark schemes introduced by his Government was the mid-day meals scheme which was launched in 1957. In addition to food, the government supplied school uniforms to poor students. To make the education easily accessible to children from various backgrounds, full exemption from school fees was introduced. Further, thousands of villages were electrified which in turn led to the large-scale use of pump sets for irrigation purposes, giving
29 These are the cases of dalit oppressions as noted by EPW (2012) in Tamil Nadu: “Reports from Rajapalayam in southern Tamil Nadu in early July talked about how a school was boycotted by members of a middle caste community because it employed two Dalit women, one as a cook and, the other, as her help in the mid-day meal centre. Instead of rejecting their objections, the block development officer in the village transferred the Dalit workers from the school. Not long ago, elected Dalit panchayats in reserved areas were not allowed to function as caste Hindus boycotted them. It took the intervention of political movements to redress the situation. While in some places – such as in Uthapuram in Madurai district – temple entry movements led by dalits have been successful following prolonged political interventions and community meetings. Elsewhere, in places like Cuddalore in mid-June, caste Hindus have not taken kindly to Dalit demands to take part in religious processions and festivities. The plight of tribal communities is also as bad or even worse. A probe by the state’s revenue department recently found that Irula workers were made to work as bonded labourers in a village in Thanjavur district.”
163

an impetus to agriculture. Large- and small-scale industries were flagged off generating employment opportunities. Kamaraj made effective use of the funds available through the Five-Year Plans and guided Tamil Nadu in deriving the maximum benefit. The culture of state welfarism has continued. For instance, goods and services continue to be supplied by the state below market price, reflecting both the competition between major political parties (represented by lower castes) and social demands emanating from anti-caste and lower caste movements. Tamil Nadu fares relatively well in terms of key education indicators. It ranks first among Indian states in terms of gross enrolment ratio in middle schools, third in terms of education development index for primary and overall and female literacy, fifth in terms of composite index for elementary education, and sixth in terms of gross enrolment at primary level. During 1991 to 2001, literacy in Tamil Nadu increased significantly from 62.7 to 73.5 percent while the all-India literacy rate increased from 52.2 to 64.8 percent. This has been possible due to continued commitment from the state government – both in terms of budget and institutional support. The state’s revenue expenditure on education as a percentage of GSDP remained stagnant at around 2.5% in 1997-98 to 2.6% in 2009-10 (Government of Tamil Nadu, 2007), but the numbers of institutions - primary as well as middle - have been on the rise. The state has committed to provide an elementary school in every hamlet with a population of more than 300, within a radius of 1 km (State Planning commission, 2007). During the 10th Plan period, about 6000 new institutions were opened (Tamil Nadu- An Economic Appraisal (various issues) and DISE (2009)). Since the beginning of the 11th Plan, about 1500 new schools - primary and middle – have been opened (School Education Department, Policy Note, 2009-10). However, there is considerable inter-district disparity - Kanniyakumari district achieved the highest literacy of 88.1 percent in 2001, while Dharmapuri obtained the lowest rate of 59.2 percent. In 12 districts, the gender gap was more than 20 percent in 2001 (Shanmugam, 2011). In parallel with the welfare regime, there have been a slew of measures in the post-reforms period to attract foreign direct investments (Kennedy, 2004). These measures paid off and there has been a growth in foreign direct investments which contributed to industrial growth. Figure 7.1.3.5 shows the flow of foreign direct investment in India and Tamil Nadu & Pondicherry. Over the period 2000-February 2014 Tamil Nadu accounted for about 9 per cent of all FDI inflows to India for which the state is indicated, and Chennai was the third largest destination after Mumbai and Delhi. There have been large foreign investments in auto, telecom and hardware sectors including global majors like Ford, Hyundai, Renault, Dell Computers, Motorola, Samsung and Nokia-Siemens. Special economic zones (SEZ) and export promotion parks have been the most important method to promote industrial development. Land acquisition for these has been made easier by several government orders and laws – namely, GO Ms No 885, Revenue department dated 21 September 1995, and Tamil Nadu Acquisition of Land for Industrial Purposes Act (TNALIPA), a state level SEZ policy, and a subsequent state level SEZ Act. Since the late 1990s, until now, thousands of acres of land have been acquired through the above means. The process of land acquisition has been more peaceful in Tamil Nadu than other states in India because of the decreased dependence on agriculture of many rural households (Vijayabasar, 2010)30.
30 Presence in coalition governments at the centre has been another important component of the growth story in Tamil Nadu. The Dravida Munnetra Kazhagam (DMK) which heads the current government in TN has been part of the last two United Progressive Alliance governments at the centre with members occupying key ministerial berths and it is said that this has enabled them to bring in investments via the central government as well, particularly in the transport sector.
164
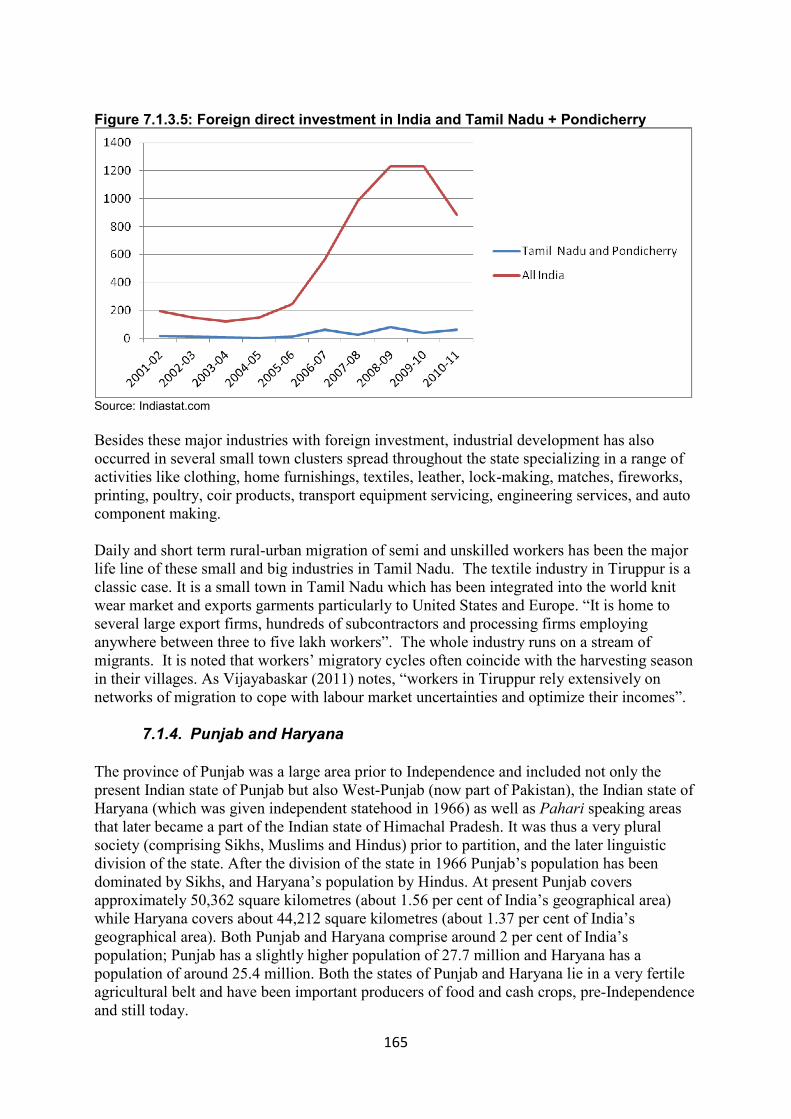
Figure 7.1.3.5: Foreign direct investment in India and Tamil Nadu + Pondicherry
Source: Indiastat.com Besides these major industries with foreign investment, industrial development has also occurred in several small town clusters spread throughout the state specializing in a range of activities like clothing, home furnishings, textiles, leather, lock-making, matches, fireworks, printing, poultry, coir products, transport equipment servicing, engineering services, and auto component making. Daily and short term rural-urban migration of semi and unskilled workers has been the major life line of these small and big industries in Tamil Nadu. The textile industry in Tiruppur is a classic case. It is a small town in Tamil Nadu which has been integrated into the world knit wear market and exports garments particularly to United States and Europe. “It is home to several large export firms, hundreds of subcontractors and processing firms employing anywhere between three to five lakh workers”. The whole industry runs on a stream of migrants. It is noted that workers’ migratory cycles often coincide with the harvesting season in their villages. As Vijayabaskar (2011) notes, “workers in Tiruppur rely extensively on networks of migration to cope with labour market uncertainties and optimize their incomes”.
7.1.4. Punjab and Haryana
The province of Punjab was a large area prior to Independence and included not only the present Indian state of Punjab but also West-Punjab (now part of Pakistan), the Indian state of Haryana (which was given independent statehood in 1966) as well as Pahari speaking areas that later became a part of the Indian state of Himachal Pradesh. It was thus a very plural society (comprising Sikhs, Muslims and Hindus) prior to partition, and the later linguistic division of the state. After the division of the state in 1966 Punjab’s population has been dominated by Sikhs, and Haryana’s population by Hindus. At present Punjab covers approximately 50,362 square kilometres (about 1.56 per cent of India’s geographical area) while Haryana covers about 44,212 square kilometres (about 1.37 per cent of India’s geographical area). Both Punjab and Haryana comprise around 2 per cent of India’s population; Punjab has a slightly higher population of 27.7 million and Haryana has a population of around 25.4 million. Both the states of Punjab and Haryana lie in a very fertile agricultural belt and have been important producers of food and cash crops, pre-Independence and still today.
165
Haryana and Punjab have always been different in many aspects, some of which have been critical in the creation of Haryana, such as language and religious identity. Haryana was carved out from the southern belt of Punjab. Despite these differences, both the states have been the top two agricultural producers in the country and are also ranked as having medium levels of human development based on the Human Development Index (Punjab is ranked 5 and Haryana is ranked 9 out of 23 states, see Government of India 2014). Their growth trajectories and other indicators such as Consumption Gini, annual rate of growth of NSDP show similar trends (when compared with other Indian states), however more recently since the 1980s Punjab has not been doing as well (as Haryana) (See Graph 7.1.4.1 and Graph 7.1.4.2) partly due to internal instability and conflict in the state. In fact, it emerges that Haryana may have benefitted from the instability in Punjab. 1950 to 1966 At the time of Independence, the more industrialized parts of undivided Punjab became part of Pakistan, as well as its agriculturally faster growing region (Krishnamurty, 1982). Punjab’s agriculture till the mid-1800s was dependent on rainfall and wells, it was only in the late 1800s that British developed large canals. By the early 1900s almost 50 per cent of India’s irrigated acreage was in Punjab (see Bhalla, 1995). However, despite such intensive investments, Punjab’s food supply was precarious, mainly due to the focus on cash crops, tenancy issues and financial barriers to modernization. During the colonial rule, the Mahalwari system was operational in Punjab which was based on intermediaries. Despite various legislative attempts to remove intermediaries and ensure tenant rights, in time many peasants were eventually forced to surrender their land. The legislation, however, was more effective in some areas such as the Patiala and East Punjab States Union (PEPSU), where the peasants had been strong. While the period around Independence was particularly disruptive as a result of Partition, and the state saw a massive exodus and in-migration, Punjab was able to recover rather effectively with a focus on infrastructure and investment in agriculture, which helped in increasing incomes and yields and created a growing market in the region. This focus on infrastructure and development was derived from the Nehruvian development model being propagated at the Centre. Soon after Independence, the process of consolidation of landholdings and rehabilitation was initiated in Punjab, and this was done under the incumbent Congress government that initiated resettlement and also took up the task of up-dating of land records. Later, the consolidation of land holdings was made mandatory and a considerable part of both Punjab and the area that became Haryana came under it. Even now, the average size of landholdings in Punjab is largest after Rajasthan, among all Indian states (Gill 2014). While the land reforms legislation was initiated in Punjab, the ceilings were not really implemented and one result was to encourage owner cultivation (as the landowners started cultivating their own land, so that it was not given away to tenants). The literature does not point to whether self-cultivation by landowners made the erstwhile tenants even poorer (since large numbers of tenants became agricultural labourers) but it can be supposed that it may have contributed to higher inequality. Bhalla (1995) notes that the total area leased by tenants declined from 40 per cent in 1953-54 to 19 per cent by 1982. In general the extent of marginalization was seen to have increased, this could be interpreted on the basis of the concentration of land holdings and operational holdings as explained by Bhalla (1995). Large farmers began working their own lands, and thus became critical agents for bringing in technological innovations and also became the main beneficiaries of the subsequent Green Revolution. This led to their
166
increasing economic and political influence and bargaining power for greater subsidies, infrastructure and credit. The existing unequal distribution of land in Punjab led to growing inequalities in other respects, as the benefits of agricultural modernizations were unequally reaped. During the early 1960s, poverty rates increased dramatically more or less across India; Based on primary data collected for NSS rounds, Rajaraman (1977) noted that rural poverty increased from 18 per cent in 1960-61 to 23 per cent in 1970. As noted above, at the time of Independence, East Punjab (which became part of India), was relatively less industrialized than West Punjab. In 1947, East Punjab had 547 registered factories, employing about thirty-seven thousand workers. With partition, 90 per cent of skilled labourers went to Pakistan (as they were mostly Muslims) forcing factories and small and cottage industries to close down. Despite this setback, and the fact that most of the raw-materials and the market for outputs of Punjab products were not from and not in Punjab, industry nevertheless grew despite the Partition-related shocks. Pandit (1978) attributes Punjab’s industrial resilience to four main factors. He describes how the displaced persons were instrumental in creating new industries in Punjab and Haryana. The displaced were mostly business men and skilled persons and due to the lack of other opportunities they were forced to start their own manufacturing units. A related factor was the urban origin of displaced persons; since most of those displaced were from urban areas, they came and settled in urban Punjab and became entrepreneurs. The proportion of urban population increased from 17 per cent to 24 per cent during 1941 to 1951. Thirdly, Punjab’s own rehabilitation policies were also instrumental in supporting the displaced in starting enterprises, and therefore contributing to industrial growth (Bhalla 1995) and policies such as that of freight equalization greatly benefitted Punjab as it made essential industrial items available at the same rate across the country, so Punjab was not disadvantaged by its distance from ports and mining areas. Fourthly, the early development of industries such as machine tools etc. in Punjab were critical for rapid industrialization, as the workforce was accustomed to working with machinery. In 1972, about 60 per cent of labour employed in small scale units was skilled and in addition about 14 per cent were managerial and supervisory staff. In addition to the above points, Bhalla (1995) believes that rapid agricultural growth in the region contributed to industrialization for two reasons, firstly, by generating surpluses which could finance industry and secondly by making raw materials available. It also led to demand for more agro-processing, machine goods etc. At the same time, however, other scholars maintain that the link between agriculture and industry has not been very strong in Punjab (Singh 2010). The above mentioned factors were critical in the development of industries, especially small-scale industries in Punjab. The development drive in both agriculture and industries was also significantly aided by the strong Congress leadership and the general approach of the ‘state intervention in development’ phase. The process of land consolidation and infrastructure building, including projects such as the Bhakra Nangal Dam (in 1963) emerged as factors critical to the effectiveness of the Green Revolution later. The Congress government, under the leadership of Partap Singh Khairon, was credited with supporting and nurturing both Punjabi speaking and Hindi speaking areas of Punjab. Since Khairon was close to Nehru, it is said that he was instrumental in leveraging finance from the central government, which he used to set up various industrial estates in Ludhiana, Faridabad and Jalandar; he allotted industrial areas, set up credit facilities, provided electricity. Extension services were developed and technology advancements were made under his tenure (1952-1964) such as in local self-government.
167
After 1956, even before the green revolution, Punjab had the highest per capita income among Indian states up till 1991-92 (Gill 2014). The areas of Ambala- Delhi- Punjab region, Karnal and Sonipat greatly benefitted from the industrial and other policies. New universities were set up in Ludhiana, Patiala, and Kurukshetra. The areas which were neglected somewhat were the southern regions of Gurgaon and Hissar (Gill 2014). The practice of out-migration of workers from Punjab to other countries, which had been established due to the intensive ‘Punjabization’ of the Indian army, even in the 1800s, continued during this period (Qureshi et al 2012). In their account of Punjabi migration to the UK, Qureshi et al (2012) find that by time of World War I, a large part of the UK army comprised of Punjabi migrants. Even in the 1950s and early 1960s they find that young migrants had been moving to the UK, and they had been further facilitated by the legal provisions being made by the UK government. Though Punjab ably managed to cope with the instability unleashed during partition, it was grappling with other divides. Even at the time of Independence, there was a separate demand for a Punjabi state (Punjabi Suba), on linguistic basis, however, Punjab was made a bilingual state after the Congress arrived at compromises with the Akali Dal and Punjabi speaking Hindus (who disowned Punjabi as their language in the census of 1951). However, the strife for a separate Punjabi speaking and Hindi speaking state continued and re-emerged strongly in the early 1960s, led by the Akali Dal (Punjabi speaking) and the Jan Sangh- RSS and the Arya Samaj (Hindi speaking). Eventually in 1966, the demand for a separate state was met, but the division was more religion based rather than language based (See Gill and Singhal, 1984). 1966 till the early 1980s The period from 1966 till 1980 witnessed the Green Revolution and manifold growth in agriculture productivity, increasing wages, increasing prices, decreasing poverty levels, somewhat rising inequality, and eventually the tapering of the effects of the Green Revolution. Even before the main technological improvements associated with the Green Revolution were introduced, Punjab’s agriculture has been growing. Between 1952-53 and 1964-65, agricultural output (for both Punjab and Haryana) grew at 4.6 per cent per annum, and yield increased by about 2.6 per cent (Bhalla 1995). By the mid -1960s, new seeds, fertilizers, mechanization, and other technologies were being introduced and this led to massive increase in agricultural productivity. Yield increased, especially in wheat followed by rice; at the same time animal husbandry also grew manifold, both due to technological advancements and also increased demand due to rising incomes (Gill and Gill 1990, Bhalla 1995). The canal irrigation developed during colonial rule was significant for the gains made during the Green Revolution, but this period saw a shift from canal irrigation towards tubewell irrigation which increased fifteen-fold between 1966 and 1987, and was also crucial for the Green Revolution. The effects of the Green Revolution which began in mid-1960s were most profound in Punjab and Haryana (compared to other states). During the period 1965 to 1972, wheat production in Punjab increased from 1.9 million tons to 5.4 million tons. The annual rate of increase in food grain production during 1961-62/ 1985-86 was the highest in Punjab (6.4 per cent) and second highest in Haryana (4.7 per cent) among Indian states. While many reports such as the HDG
168
report (See Dhanagare 1987), explain that a trickle-down effect was visible, even though a large degree of wage increase was offset by increase in prices as well as division of land and labour market segmentation (Dhanagare1987, Sidhu 1988), real wages of agricultural labourers increased. Even small farmers were able to take advantage of the opportunities. In fact some landless labourers were also able to invest earnings from agricultural work that had become available over long stretches, and were able to start non-farm activities (Bhalla 1995). However, the overall impact on inequality is uncertain. The initial period of the Green Revolution absorbed a lot of labour (Bhalla 1995), however after the 1970s till the late 1980s, mechanization increased drastically. Real wages in agriculture grew by 0.91 per cent per annum between 1970-71 and 1986-87. Apart from the increase in prices and other factors mentioned above, real wages were affected by in-migration of labourers from other parts of the country. While crops such as wheat and potato became more capital intensive, the increased labour requirement for the cultivation of paddy offset it. At the same time industrial development in Punjab started attracting labourers from the agricultural and construction sector. Skilled and unskilled workers from Punjab began to migrate to both the Middle East and North America. Punjab also became a triple-cropped area. In this context labour from Bihar, MP, UP, Jharkhand, Orissa, Himachal and Rajasthan migrated for work to Punjab. In his study of Jullender (Punjab) and Champaran (Bihar), Gill (1984) finds that the (1) higher profitability in paddy and therefore higher wages in Punjab, (2) longer duration of work available in Punjab (due to three cropping seasons) and in general (3) the labour surpluses in home-states are the reasons which explain this migration. This in-migration from other states was also responsible for the rather small increase in the real wages. Gill (1984) finds that the labourers from Champaran were marginally literate and owned little or no land in their state. The migration of poor labourers from other states to Punjab is likely to have increased its overall inequality. It was believed that the Green Revolution innovations would be scale neutral, i.e. all groups involved in agricultural production would benefit from it equally. As described above, even landless labourers seemed to have benefitted from it and even small and marginal farmers made great efforts to improve farm inputs – seen as acts of phenomenal risk-taking. However it emerges that the efforts of small and marginal farmers did not have substantial impacts and therefore they could not reduce the growing inequalities (Dhanagare 1987). Non-farm sources of income (such as livestock) were critical in the income of the marginal farmers. Poverty decline in Punjab was fastest during 1973-74 to 1977-78 when it declined at a rate of almost 2 per cent per annum (Singh 2010). Paul’s (1989) analysis of empirical data for Haryana shows that the real per capita farm income as well as the per capita overall income of farmers did not increase significantly during the Green Revolution in Haryana. The story is similar to that of Punjab. His study shows that the inequality of per capita income among farm families and the Gini coefficient of landholding in fact increased during 1969-70 to 1982-83 (See Table 7.1.4.1).
169

Table 7.1.4.1: Estimates of Inequality, Haryana 1969-70 to 1982-83 Gini
Coefficient (Land Distribution)
Percentage share in Per Capita Income Lower One-Third Families
Middle One-Third Families
Upper One-Third Families
1969-70 0.37 17.6 30.7 51.7 1970-71 0.33 18.1 30.8 51.1 1971-72 0.29 18.7 31.0 53.3 1972-73 0.31 16.0 27.0 57.0 1973-74 0.33 16.8 29.1 54.1 1974-75 0.32 13.8 28.3 57.0 1975-76 0.28 15.5 28.4 56.1 1976-77 0.30 11.6 26.2 62.1 1977-78 0.36 11.6 25.8 62.6 1978-79 0.39 11.5 26.3 62.2 1979-80 0.39 11.2 22.0 66.8 1980-81 0.40 11.9 24.8 64.3 1981-82 0.38 11.5 26.3 62.2 1982-83 0.36 12.0 23.9 64.1 Source: Paul (1989), Paul (1990) In 1972, both Haryana and Punjab had stable Congress governments, after which the first rural electrification programs were started. Many small and medium enterprises were also set-up and in fact became the other leg of Punjab’s economy (see Bhalla 1995). During this period, sugar mills and godowns were established, the Food Corporation of India operated efficiently in both Punjab and Haryana (Gill 2014). In 1975, the Akali Dal fought against Indira Gandhi and the emergency; after 1977, the Akali Dal came to power, and the Congress tried to overthrow them by siding with Bhindranwala, a Sikh political figure (who later became central to the separatist movement), leading to wide-scale destabilization which kept growing into the 1980s (as explained below). 1980s till the present (2014) The gains and growth from the Green Revolution had begun to wither in the beginning of the 1980s itself (Gill and Gill 1990). Punjab prospered while it worked under the developmental state paradigm, but it has not been able to cope efficiently with liberalization. It had been believed that the gains from the Green Revolution would continue to benefit Punjab; however, the post-reform period actually led to a reversal in Punjab’s performance. During the early 1980s, Punjab saw a lot of political turmoil and terrorism due to a separatist movement demanding the formation of a Sikh state. Various groups demanding the new state were formed, these groups tortured, threatened and killed Hindus living in Punjab and in this process they were forced to flee from Punjab. In case of the three villages studied by Bal (2005) the Hindus of the villages had been the main business and trading community, and they eventually fled to states such as Haryana, Uttar Pradesh, Rajasthan etc. The separatist groups even targeted affluent Sikhs on the pretext of providing them protection.
170
Industries moved from Punjab to Haryana and even to Meerut and as far as Tamil Nadu. During this period, Haryana gained as it did not have any turmoil. Till the 1980s, the government spending on development was around 70 per cent of the state budget; after that period it declined and in 1998-99 it was around 46 per cent (See Table 7.1.4.2). At the Central level, Development Expenditure also declined in the early 1990s, however it has shown an upward trend after the mid-2000s. Since the mid-1980s, tax collections in Punjab kept sliding down, electricity and taxation rates were not revised, user fee was not charged for urban services, corruption increased, police expanded, and society became more repressive in Punjab; some of these issues remain till today (Gill 2014). In the June of 1984, armed groups barricaded in the Golden Temple (popular Sikh shrine in the city of Amritsar), and holding hostage pilgrims were attacked by the army, leading to uproar regarding the desecration of the shrine. In retaliation, Indira Gandhi was killed by her two Sikh guards, which led to riots in Delhi. Table 7.1.4.2: Budgetary Expenditure and Development Expenditure in Punjab Budget Expenditure (in
crores) Development Expenditure (Per Cent of BE)
1967-68 95.74 60.15 1970-71 136.02 64.99 1975-76 278.27 72.14 1980-81 549.53 71.92 1985-86 1162.90 66.48 1990-91 2519.91 64.92 1996-97 6925.67 56.99 1997-98 8195.65 54.46 1998-99 9553.3 46.48 Source: RBI Bulletin, Mumbai in Singh, L. and Singh, S. (2002) As evident from Graph 7.1.4.1. Punjab and Haryana have had a much higher Per Capita NSDP than the all-India average. This is also the case with respect to other indicators of levels of living such as wages, consumption per capita etc. In fact in both states NSDP per capita was of the order of 50 percent higher than India’s overall levels up to the turn of the century. Since 2000-2001 however, the trends in the two states have been different. The ratio of Punjab’s NSDP to India’s fell below Haryana’s in 2000-01 and fell to 1.2 in the most recent data; this decline has been continuous since the early 1990s. Meanwhile, Haryana’s NSDP has increased significantly, mainly driven by the states’ service sector (the contribution of the service sector to the GDP increased from 46.5 per cent in 2004-05 to 55.4 per cent in 2010-11. Haryana has also benefitted from its proximity to Delhi (the capital of India) and the development of industrial and business cities such as Faridabad and Gurgaon. Moreover in the early 2010s Haryana has embarked on setting up a number of educational institutions as well as rail and land transport corridors. The annualized GSDP growth for Haryana during the period 1993-94 to 2004-5 has been 6.2 per cent and significantly lower for Punjab, around 4.4 per cent. After 2000-2001, Haryana’s GSDP has significantly outperformed that of Punjab (See Dubey 2009). From 1991-2000 to 2007-2008, per capita income of Haryana grew at 6 per cent per annum, while that of Punjab grew at 2.37 per cent per annum (Singh 2010). Punjab’s fastest period of growth was during
171
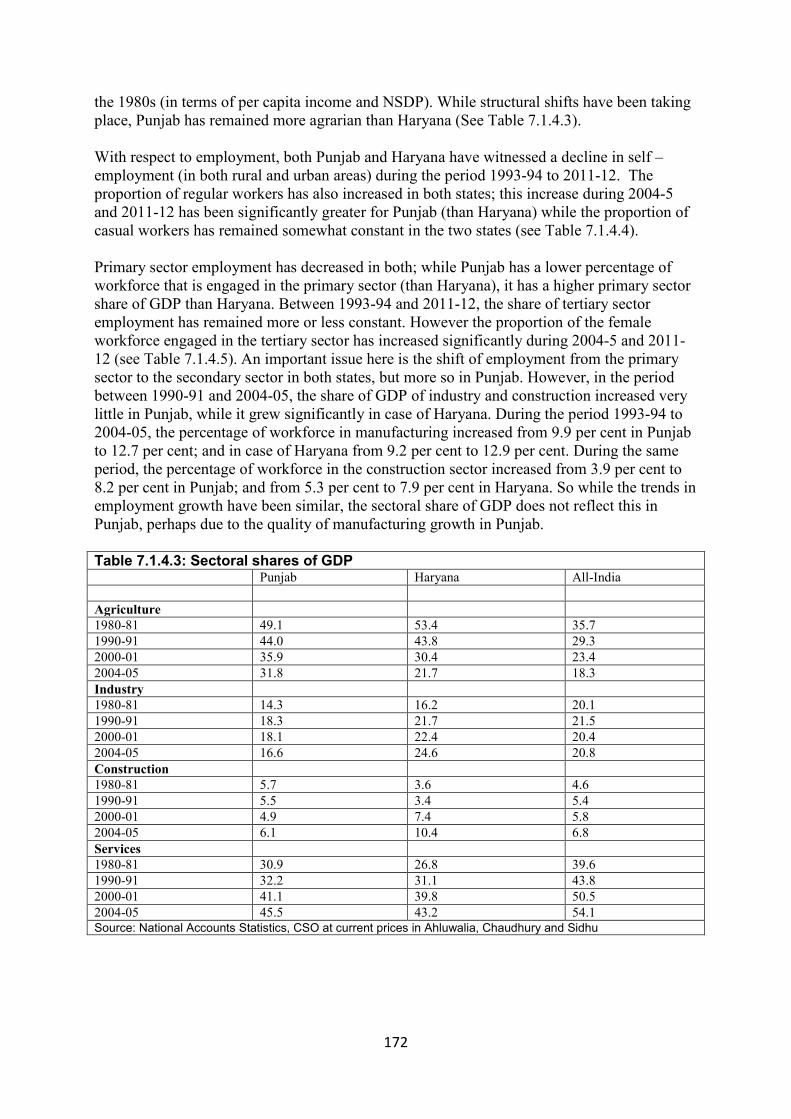
the 1980s (in terms of per capita income and NSDP). While structural shifts have been taking place, Punjab has remained more agrarian than Haryana (See Table 7.1.4.3). With respect to employment, both Punjab and Haryana have witnessed a decline in self –employment (in both rural and urban areas) during the period 1993-94 to 2011-12. The proportion of regular workers has also increased in both states; this increase during 2004-5 and 2011-12 has been significantly greater for Punjab (than Haryana) while the proportion of casual workers has remained somewhat constant in the two states (see Table 7.1.4.4). Primary sector employment has decreased in both; while Punjab has a lower percentage of workforce that is engaged in the primary sector (than Haryana), it has a higher primary sector share of GDP than Haryana. Between 1993-94 and 2011-12, the share of tertiary sector employment has remained more or less constant. However the proportion of the female workforce engaged in the tertiary sector has increased significantly during 2004-5 and 2011-12 (see Table 7.1.4.5). An important issue here is the shift of employment from the primary sector to the secondary sector in both states, but more so in Punjab. However, in the period between 1990-91 and 2004-05, the share of GDP of industry and construction increased very little in Punjab, while it grew significantly in case of Haryana. During the period 1993-94 to 2004-05, the percentage of workforce in manufacturing increased from 9.9 per cent in Punjab to 12.7 per cent; and in case of Haryana from 9.2 per cent to 12.9 per cent. During the same period, the percentage of workforce in the construction sector increased from 3.9 per cent to 8.2 per cent in Punjab; and from 5.3 per cent to 7.9 per cent in Haryana. So while the trends in employment growth have been similar, the sectoral share of GDP does not reflect this in Punjab, perhaps due to the quality of manufacturing growth in Punjab. Table 7.1.4.3: Sectoral shares of GDP Punjab Haryana All-India Agriculture 1980-81 49.1 53.4 35.7 1990-91 44.0 43.8 29.3 2000-01 35.9 30.4 23.4 2004-05 31.8 21.7 18.3 Industry 1980-81 14.3 16.2 20.1 1990-91 18.3 21.7 21.5 2000-01 18.1 22.4 20.4 2004-05 16.6 24.6 20.8 Construction 1980-81 5.7 3.6 4.6 1990-91 5.5 3.4 5.4 2000-01 4.9 7.4 5.8 2004-05 6.1 10.4 6.8 Services 1980-81 30.9 26.8 39.6 1990-91 32.2 31.1 43.8 2000-01 41.1 39.8 50.5 2004-05 45.5 43.2 54.1 Source: National Accounts Statistics, CSO at current prices in Ahluwalia, Chaudhury and Sidhu
172
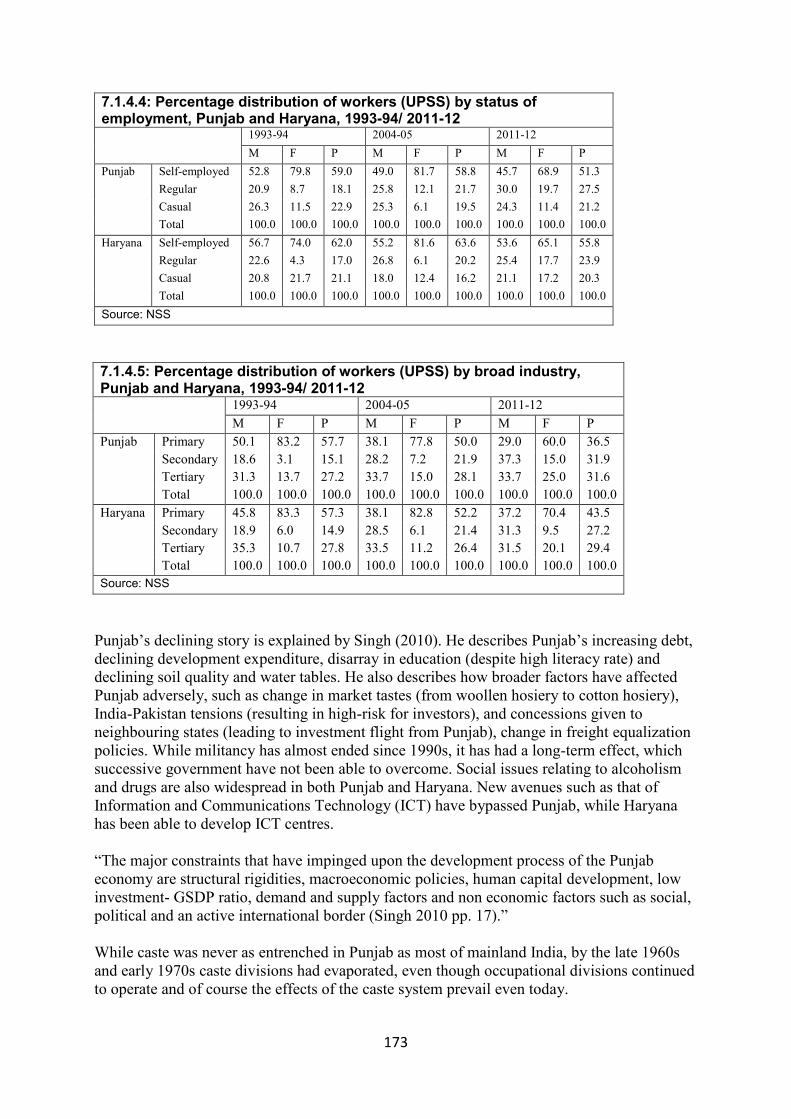
7.1.4.4: Percentage distribution of workers (UPSS) by status of employment, Punjab and Haryana, 1993-94/ 2011-12 1993-94 2004-05 2011-12
M F P M F P M F P Punjab Self-employed 52.8 79.8 59.0 49.0 81.7 58.8 45.7 68.9 51.3 Regular 20.9 8.7 18.1 25.8 12.1 21.7 30.0 19.7 27.5 Casual 26.3 11.5 22.9 25.3 6.1 19.5 24.3 11.4 21.2 Total 100.0 100.0 100.0 100.0 100.0 100.0 100.0 100.0 100.0 Haryana Self-employed 56.7 74.0 62.0 55.2 81.6 63.6 53.6 65.1 55.8 Regular 22.6 4.3 17.0 26.8 6.1 20.2 25.4 17.7 23.9 Casual 20.8 21.7 21.1 18.0 12.4 16.2 21.1 17.2 20.3 Total 100.0 100.0 100.0 100.0 100.0 100.0 100.0 100.0 100.0 Source: NSS
7.1.4.5: Percentage distribution of workers (UPSS) by broad industry, Punjab and Haryana, 1993-94/ 2011-12 1993-94 2004-05 2011-12
M F P M F P M F P Punjab Primary 50.1 83.2 57.7 38.1 77.8 50.0 29.0 60.0 36.5 Secondary 18.6 3.1 15.1 28.2 7.2 21.9 37.3 15.0 31.9 Tertiary 31.3 13.7 27.2 33.7 15.0 28.1 33.7 25.0 31.6 Total 100.0 100.0 100.0 100.0 100.0 100.0 100.0 100.0 100.0 Haryana Primary 45.8 83.3 57.3 38.1 82.8 52.2 37.2 70.4 43.5 Secondary 18.9 6.0 14.9 28.5 6.1 21.4 31.3 9.5 27.2 Tertiary 35.3 10.7 27.8 33.5 11.2 26.4 31.5 20.1 29.4 Total 100.0 100.0 100.0 100.0 100.0 100.0 100.0 100.0 100.0 Source: NSS
Punjab’s declining story is explained by Singh (2010). He describes Punjab’s increasing debt, declining development expenditure, disarray in education (despite high literacy rate) and declining soil quality and water tables. He also describes how broader factors have affected Punjab adversely, such as change in market tastes (from woollen hosiery to cotton hosiery), India-Pakistan tensions (resulting in high-risk for investors), and concessions given to neighbouring states (leading to investment flight from Punjab), change in freight equalization policies. While militancy has almost ended since 1990s, it has had a long-term effect, which successive government have not been able to overcome. Social issues relating to alcoholism and drugs are also widespread in both Punjab and Haryana. New avenues such as that of Information and Communications Technology (ICT) have bypassed Punjab, while Haryana has been able to develop ICT centres. “The major constraints that have impinged upon the development process of the Punjab economy are structural rigidities, macroeconomic policies, human capital development, low investment- GSDP ratio, demand and supply factors and non economic factors such as social, political and an active international border (Singh 2010 pp. 17).” While caste was never as entrenched in Punjab as most of mainland India, by the late 1960s and early 1970s caste divisions had evaporated, even though occupational divisions continued to operate and of course the effects of the caste system prevail even today.
173
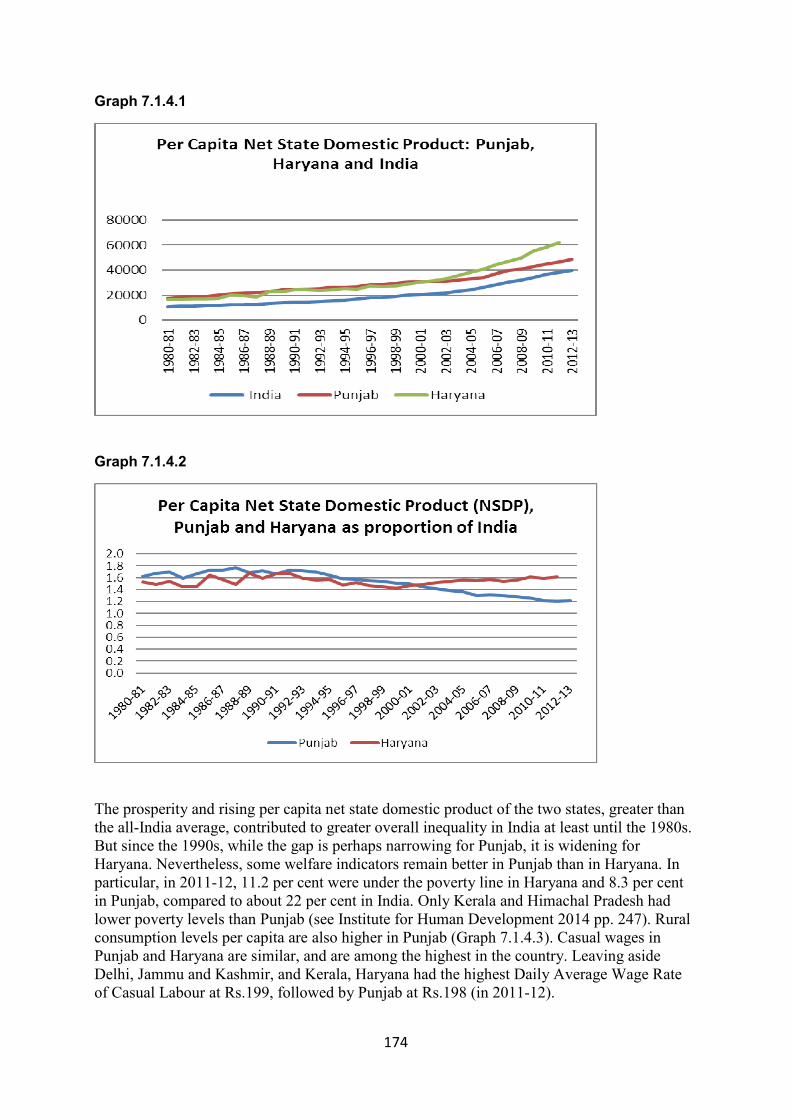
Graph 7.1.4.1
Graph 7.1.4.2
The prosperity and rising per capita net state domestic product of the two states, greater than the all-India average, contributed to greater overall inequality in India at least until the 1980s. But since the 1990s, while the gap is perhaps narrowing for Punjab, it is widening for Haryana. Nevertheless, some welfare indicators remain better in Punjab than in Haryana. In particular, in 2011-12, 11.2 per cent were under the poverty line in Haryana and 8.3 per cent in Punjab, compared to about 22 per cent in India. Only Kerala and Himachal Pradesh had lower poverty levels than Punjab (see Institute for Human Development 2014 pp. 247). Rural consumption levels per capita are also higher in Punjab (Graph 7.1.4.3). Casual wages in Punjab and Haryana are similar, and are among the highest in the country. Leaving aside Delhi, Jammu and Kashmir, and Kerala, Haryana had the highest Daily Average Wage Rate of Casual Labour at Rs.199, followed by Punjab at Rs.198 (in 2011-12).
174
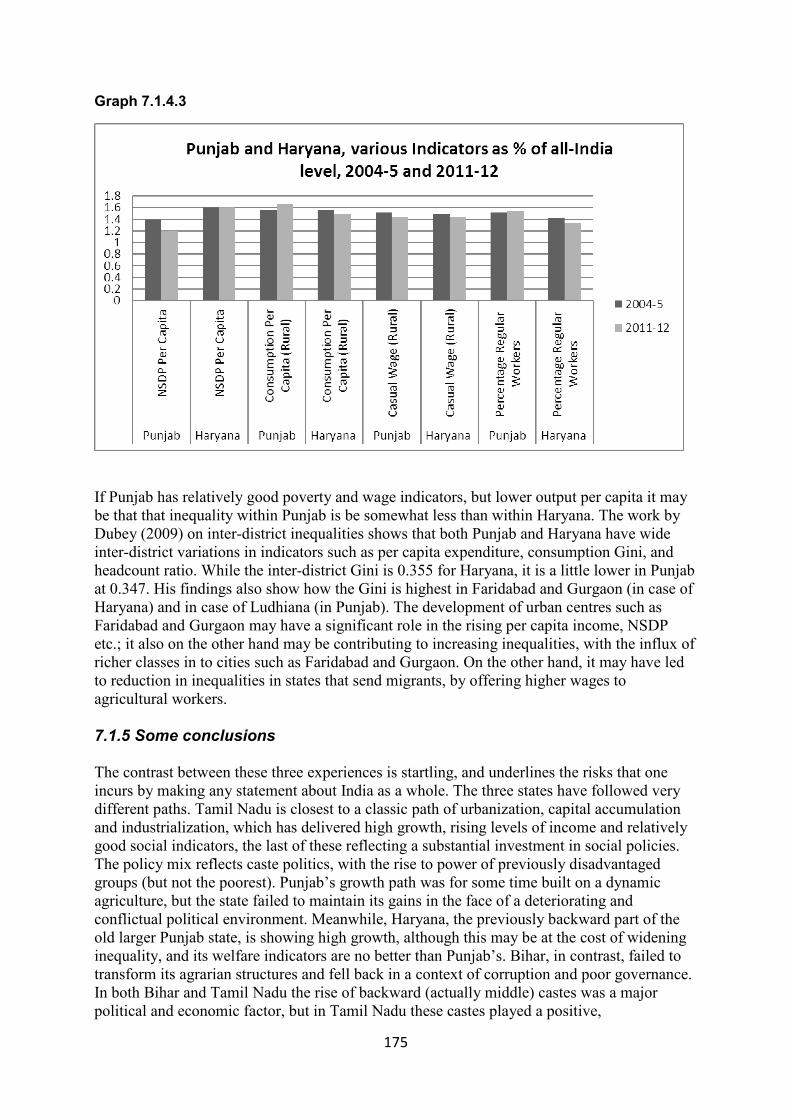
Graph 7.1.4.3
If Punjab has relatively good poverty and wage indicators, but lower output per capita it may be that that inequality within Punjab is be somewhat less than within Haryana. The work by Dubey (2009) on inter-district inequalities shows that both Punjab and Haryana have wide inter-district variations in indicators such as per capita expenditure, consumption Gini, and headcount ratio. While the inter-district Gini is 0.355 for Haryana, it is a little lower in Punjab at 0.347. His findings also show how the Gini is highest in Faridabad and Gurgaon (in case of Haryana) and in case of Ludhiana (in Punjab). The development of urban centres such as Faridabad and Gurgaon may have a significant role in the rising per capita income, NSDP etc.; it also on the other hand may be contributing to increasing inequalities, with the influx of richer classes in to cities such as Faridabad and Gurgaon. On the other hand, it may have led to reduction in inequalities in states that send migrants, by offering higher wages to agricultural workers. 7.1.5 Some conclusions The contrast between these three experiences is startling, and underlines the risks that one incurs by making any statement about India as a whole. The three states have followed very different paths. Tamil Nadu is closest to a classic path of urbanization, capital accumulation and industrialization, which has delivered high growth, rising levels of income and relatively good social indicators, the last of these reflecting a substantial investment in social policies. The policy mix reflects caste politics, with the rise to power of previously disadvantaged groups (but not the poorest). Punjab’s growth path was for some time built on a dynamic agriculture, but the state failed to maintain its gains in the face of a deteriorating and conflictual political environment. Meanwhile, Haryana, the previously backward part of the old larger Punjab state, is showing high growth, although this may be at the cost of widening inequality, and its welfare indicators are no better than Punjab’s. Bihar, in contrast, failed to transform its agrarian structures and fell back in a context of corruption and poor governance. In both Bihar and Tamil Nadu the rise of backward (actually middle) castes was a major political and economic factor, but in Tamil Nadu these castes played a positive,
175
developmental role whereas in Bihar for many years the political goal of the middle castes seemed to be to capture resources rather than to promote growth. Recent improvements in governance may have set Bihar on a higher growth path, but the state does not have the productive base of either Tamil Nadu or Punjab. The three states also have different economic connections with the national economy. Bihar’s main link is through migration of workers to other parts of India and their remittances. Punjab produces for the national market, for instance with a substantial food surplus. Tamil Nadu has stronger connections with the international economy, and weaker linkages with the domestic one. The regional pattern of inequality, then is the result of a mix of different forces, which are not very stable over time. There is both polarization – the strong industrial base of Tamil Nadu attracts investment, and so promotes further growth in the state – and integration, as Bihari migrants help to reduce wage differentials for casual labour across the country. But these outcomes depend on the political economy of the states concerned, their relationship with the Centre and the widely different growth regimes in each state. 7.2 Gender inequality
The principle of gender equality is enshrined in the Indian Constitution (operative since the 26th of January 1950). The Constitution not only guarantees equality to women, but also empowers the State to adopt measures of positive discrimination in their favour. Policy to promote gender equality has faced many challenges in terms of conceptualization, strategies, resources and institutional mechanisms. Furthermore, while the government has promulgated many laws to protect women’s rights (Annex 7.2.2), their application has been extremely weak and the gap between formal and substantive equality remains stubbornly wide.
7.2.1. The approach to the women’s question Two broad periods can be distinguished, the dividing line being the path breaking report of the Committee on the Status of Women in India "Towards Equality," released in 1974. The first period adopted a welfare approach to women's questions and women were treated as passive recipients of welfare services. The second period marked a shift of approach from welfare to development with the focus on the empowerment of women as agent of development (Mazumdar et al., 2001; Sharma, 2012b). First period: the welfare approach At the beginning of the 1950s the developmental goal of the government was to move ahead quickly through higher growth, modernisation and industrialisation, and social development was subordinated to this goal. Women were positioned marginally and precariously within the confines of a narrowly conceived social welfare sector that did not concern itself with legal rights and entitlements. "Social welfare services" were identified as appropriate interventions to tackle the basic problems of specified target groups including women and children. Three sets of services were considered by planners to be crucial for women – education, health and social welfare. Education and health were the responsibility of the state but there was no national structure, no organisational framework and no delivery mechanism to provide welfare services to women. The Community Development Programmes and the Central
176
Social Welfare Board, set up in 1952 and 1953 respectively, have been the most significant institutional developments during the first Plan to deliver welfare services. However, the two institutions followed different conceptual approaches. While the latter institution underscored the vulnerability of women, the former fitted rural women into different slots centred on the importance of home to the development of the community: services for women focussed on nutrition, education, food production and storage, pre-school feeding, Mahila mandals (local women’s organisations), feeding of pregnant or nursing mothers. Interventions in the field of agriculture, animal husbandry, village industries, cooperation, etc. were oriented exclusively towards men. It is only in the early 1960s when India faced food shortages that women farmers’ training and extension became components of the community development programmes. “But the earlier myopia regarding the exact nature of involvement of women in agriculture and allied activities continued and women farmers were consistently kept out of the process of modernisation of agriculture.” (Mazumdar et al., 2001 p.39). The importance of the report of the Committee on the Status of Women in India, published in 1974 (GoI, 1974) should be highlighted here because it changed the terms of the discourse on gender, equality and the Indian state on several accounts. First, it was the first review exercise on the conditions and status of women since Independence and it provided a benchmark for further research and analysis. It presented a shocking description of the reality of Indian women’s lives, illustrated by a declining sex ratio, a very high rate of female mortality and morbidity, the marginalization of women in the economy and discriminatory personal laws. Second, it framed the questions of women and development within the existing social imbalances and inequities, that is, through the access to economic resources, knowledge and political power. Third, its recommendations in terms of follow-up mechanisms and processes gave a clear signal that the state had constitutional duties towards women and therefore had a major role to play in fostering the empowerment of women. The report challenged the neutrality of the development process as it resulted in considerable divergence between stated national goals and actual achievements. It forced a reconceptualization of the discourse on issues of gender and poverty; livelihood, survival and economic well-being; political participation and representation; law, health and family welfare, etc. (Sharma, 2012b). Second period: the development approach For the first time in India’s planning history the Sixth Five Year Plan (1980-1985) incorporated a separate chapter on women.31 But an institutional set up for gender governance at both the national and state levels was slow to be put into place. The Ministry of Women and Child Development (MWCD) Until 1986 the subject of women was dealt with by the Ministry of Social Welfare. In 1986 a separate Department of Women and Children was constituted under the aegis of the Ministry of Human Resource Development and in January 2006 the Department was elevated to a full-fledged independent ministry (MWCD). It became the nodal agency for all matters pertaining to the welfare, development and empowerment of women. Schemes and programmes of the MWCD fall within three broad categories: (i) the economic empowerment of women; (ii) rescue and shelter of women in need of care and protection; (iii) provision of gender justice and safeguard the rights of women (Mishra and Pandey, 2012).
31 The successive Plans illustrate the shift in the approach to women’s issues from welfare to development. See annex 7.2.1.
177
National Commission for Women (NCW) The NCW was set up in 1992 to protect and safeguard the rights of women. It is an autonomous watch dog body independent of the government but political interests and hierarchies of state power have affected its functioning. As its statutory body has only recommendatory powers, it has been ineffective in addressing issues critical for women.32 National Policy for the Empowerment of Women A “National Policy for the Empowerment of Women” was adopted in 2001. It is an effort to bring about gender justice and gender equality with a long term policy perspective. Several states have also formulated a policy document on women (e.g. Tamil Nadu) detailing policies, strategies and action. The National Mission for Empowerment of Women (NMEW) NMEW was created on 8th March 2010 within the Ministry of Women and Child Development. Its mandate is inter-sector convergence, that is, the strengthening of processes that promote all-round development of women. How effective have the structures of governance for women been? Numerous programmes and schemes targeting women have been implemented (see below) but so far they have not been able to approach women’s question in the context of societal power relations and therefore have not been able to make any commitment to attack patriarchy and related aspects of caste and ethnic oppression (Mazumdar, 2000). Though the 73rd and 74th Constitutional Amendments adopted in 1993 and reserving one-third of the seats in local institutions of self-government (Panchayats) to women is considered a milestone in the political empowerment of women33 prevalent social norms continue to mediate outcomes around women’s work (Sudarshan, 2013). Many women continue to struggle for basic rights such as minimum wages, equal wages and property rights, etc. in spite of several protective legislations.
7.2.2. The economic empowerment of women From the late seventies onwards efforts to mobilize women as workers became more evident in government programmes and at the same time non-government efforts at organizing women workers increased. After 1991, liberalization and globalization had an impact on women workers. There was a marked increase of women in the unorganized or informal sector (NCEUS) and some new industries such as information technology and biotechnology absorbed an increasing number of educated women. But women’s participation in the labour market remains a puzzle as its long term trend has been declining even when the country displayed a high economic growth rate.
32 For an evaluation of the National Commission for Women see Sadhna Arya, 2009. 33 However, the compliance with the 73rd and 74th Amendments has been facing several challenges. See Nirmala Buch, 2000 and 2009; Sathe et al., 2013.
178
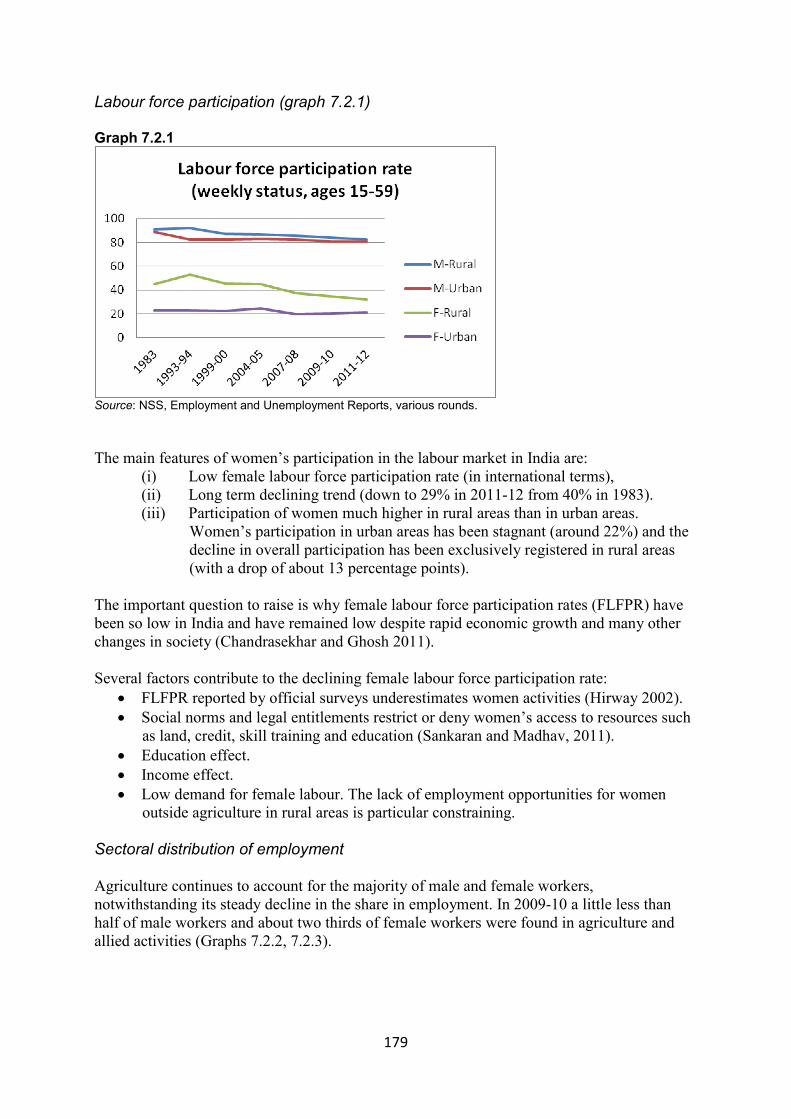
Labour force participation (graph 7.2.1) Graph 7.2.1
Source: NSS, Employment and Unemployment Reports, various rounds. The main features of women’s participation in the labour market in India are:
(i) Low female labour force participation rate (in international terms), (ii) Long term declining trend (down to 29% in 2011-12 from 40% in 1983). (iii) Participation of women much higher in rural areas than in urban areas.
Women’s participation in urban areas has been stagnant (around 22%) and the decline in overall participation has been exclusively registered in rural areas (with a drop of about 13 percentage points).
The important question to raise is why female labour force participation rates (FLFPR) have been so low in India and have remained low despite rapid economic growth and many other changes in society (Chandrasekhar and Ghosh 2011). Several factors contribute to the declining female labour force participation rate:
• FLFPR reported by official surveys underestimates women activities (Hirway 2002). • Social norms and legal entitlements restrict or deny women’s access to resources such
as land, credit, skill training and education (Sankaran and Madhav, 2011). • Education effect. • Income effect. • Low demand for female labour. The lack of employment opportunities for women
outside agriculture in rural areas is particular constraining. Sectoral distribution of employment Agriculture continues to account for the majority of male and female workers, notwithstanding its steady decline in the share in employment. In 2009-10 a little less than half of male workers and about two thirds of female workers were found in agriculture and allied activities (Graphs 7.2.2, 7.2.3).
179
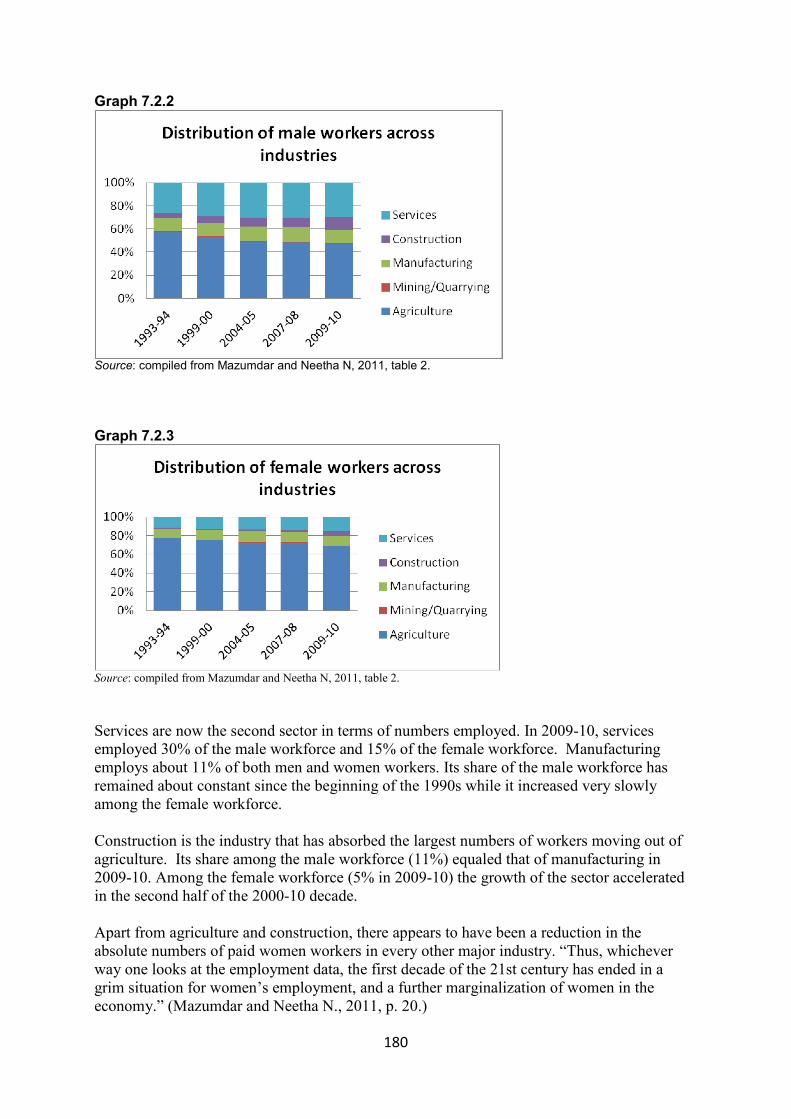
Graph 7.2.2
Source: compiled from Mazumdar and Neetha N, 2011, table 2. Graph 7.2.3
Source: compiled from Mazumdar and Neetha N, 2011, table 2. Services are now the second sector in terms of numbers employed. In 2009-10, services employed 30% of the male workforce and 15% of the female workforce. Manufacturing employs about 11% of both men and women workers. Its share of the male workforce has remained about constant since the beginning of the 1990s while it increased very slowly among the female workforce. Construction is the industry that has absorbed the largest numbers of workers moving out of agriculture. Its share among the male workforce (11%) equaled that of manufacturing in 2009-10. Among the female workforce (5% in 2009-10) the growth of the sector accelerated in the second half of the 2000-10 decade. Apart from agriculture and construction, there appears to have been a reduction in the absolute numbers of paid women workers in every other major industry. “Thus, whichever way one looks at the employment data, the first decade of the 21st century has ended in a grim situation for women’s employment, and a further marginalization of women in the economy.” (Mazumdar and Neetha N., 2011, p. 20.)
180

Status of employment Graph 7.2.4
0
10
20
30
40
50
60
70
1981 1993-94 1999-00 2004-05 2009-10 2011-12
Employment status of male and female workers (UPSS)
M-Regular
M-Casual
M-Self
F-Regular
F-Casual
F-Self
Source: NSS, several rounds. The distribution of workers across the three employment statuses (self-employed, casual and regular) follows the same pattern among each sex. Self-employment is the dominant status and its incidence varied between 50 and 60 percent of workers between 1981 and 2011-12. It is higher among women than among men. The second most frequent status is casual work varying between 26 and 37 per cent. Its incidence is again higher than among women and there is a long term tendency for the male and female curves to converge. The gender gap, which was 8 percentage points in 1981, has fallen to less than 2 in 2011-2012. The incidence of regular work is much lower (it varied between 5 and 20 per cent). It is much higher among men than women. It has been slowly increasing for both sexes and the gender gap has narrowed (from 12 percentage points in 1981 to 7 in 2011-12). The fluctuations of casual and self-employment present two interesting features (i) they fluctuate in opposite directions and (ii) the fluctuations are sharper for women than for men. The factors that explain such behaviour need to be investigated further. Self-employment comprises unpaid family workers and women are overrepresented in this group. In the NSS rounds covering the period 1993-94 to 2007-08, three fourths of the rural self-employed women were unpaid family workers, and the proportion of urban self-employed women hovered above 40% (Mazumdar and Neetha N., 2011). The unpaid workforce in rural areas is largely composed of peasant female family members cultivating or supervising the family land. In urban areas, unpaid workers are more evenly distributed across economic sectors in community and personal services (the numbers of women in education/teaching and the category of paid domestic workers are rapidly expanding) and manufacturing (primarily home-based piece rated work).. If we discount unpaid family labour, casual labour accounts for the majority of the paid female workforce. There is an inverse relationship between the shares of unpaid workers and casual labour. The former declines when the latter rises and vice versa through the years, suggesting that a significant number of unpaid self-employed women tend to go in for casual work when they are either able to find such work or are in special need. They revert to unpaid
181
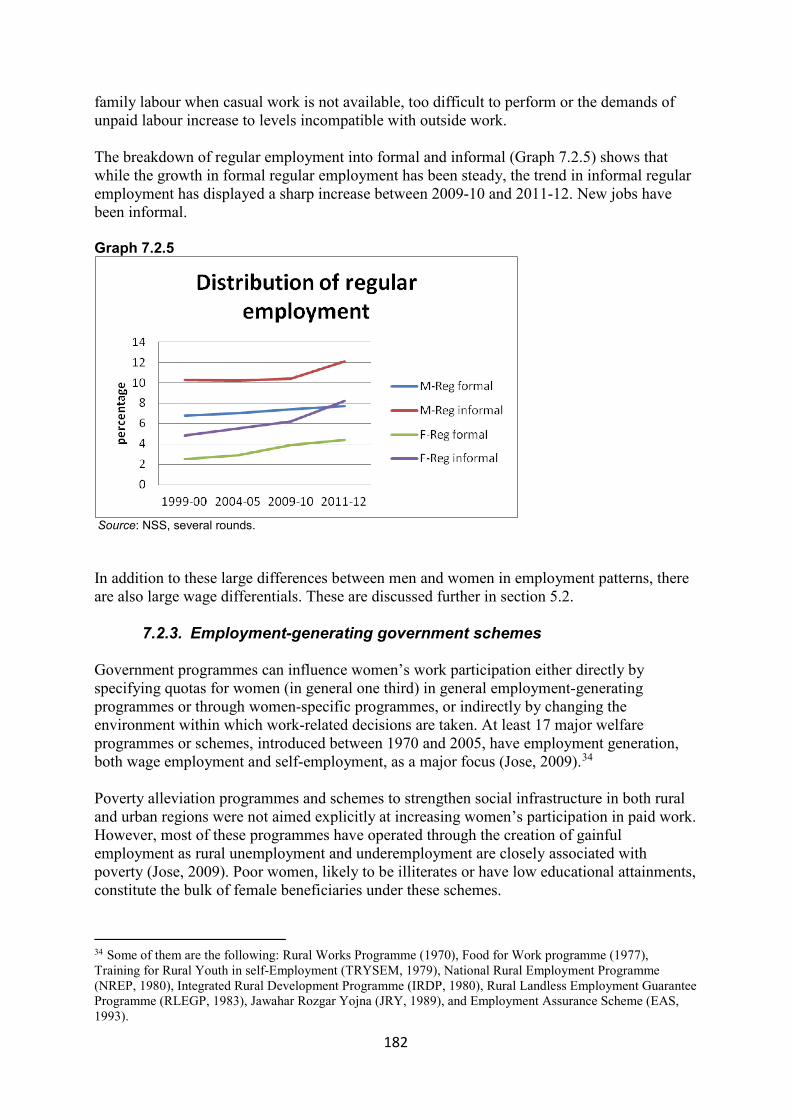
family labour when casual work is not available, too difficult to perform or the demands of unpaid labour increase to levels incompatible with outside work. The breakdown of regular employment into formal and informal (Graph 7.2.5) shows that while the growth in formal regular employment has been steady, the trend in informal regular employment has displayed a sharp increase between 2009-10 and 2011-12. New jobs have been informal. Graph 7.2.5
Source: NSS, several rounds. In addition to these large differences between men and women in employment patterns, there are also large wage differentials. These are discussed further in section 5.2.
7.2.3. Employment-generating government schemes Government programmes can influence women’s work participation either directly by specifying quotas for women (in general one third) in general employment-generating programmes or through women-specific programmes, or indirectly by changing the environment within which work-related decisions are taken. At least 17 major welfare programmes or schemes, introduced between 1970 and 2005, have employment generation, both wage employment and self-employment, as a major focus (Jose, 2009).34 Poverty alleviation programmes and schemes to strengthen social infrastructure in both rural and urban regions were not aimed explicitly at increasing women’s participation in paid work. However, most of these programmes have operated through the creation of gainful employment as rural unemployment and underemployment are closely associated with poverty (Jose, 2009). Poor women, likely to be illiterates or have low educational attainments, constitute the bulk of female beneficiaries under these schemes.
34 Some of them are the following: Rural Works Programme (1970), Food for Work programme (1977), Training for Rural Youth in self-Employment (TRYSEM, 1979), National Rural Employment Programme (NREP, 1980), Integrated Rural Development Programme (IRDP, 1980), Rural Landless Employment Guarantee Programme (RLEGP, 1983), Jawahar Rozgar Yojna (JRY, 1989), and Employment Assurance Scheme (EAS, 1993).
182

Those programmes have shown a steady increase in the share or number of women beneficiaries over the years. Let us take two examples. The share of women in the person-days employed through the flagship scheme under the Mahatma Gandhi Rural Employment Guarantee Act (MGNREGA) stood at 41% in 2006-07, 48% in 2008-09, and 51% in 2012-13 (Sudarshan, 2013; CSO, 2013). The share of women beneficiaries in the Integrated Rural Development Programme (IRDP) and Training for Rural Youth in Self-Employment (TRYSEM), which are self-employment programmes, increased steadily from 11.5% in 1986-87, 34.2% in 1995-96 to 57.6% in 2005-06. Ratna Sudarshan suggests that even if women’s initial participation is low, a policy of reservation draws women into them. The growth of micro credit through self-help groups for women has encouraged the development of micro-enterprises by women but has also tended to reduce policy concern about ensuring more extensive access of women to the regular channels of institutional finance, and left them confined to the ghetto of microcredit while the bulk of formal lending continues to go to men (Ghosh, 2009). Nowadays all government programmes channel financial support through Self-Help Groups (SHG).
7.2.4. Conclusion The process of economic empowerment has by-passed a large majority of women. While considering the position of women Nirmala Banerjee asked the question ‘What happened to the dreams of modernity of the Nehruvian era?’ (Banerjee, 1998). She argues that the pattern of economic development set by Nehru failed to get rid of gender discrimination within the household and at the work place and that challenging the patriarchal ethos has never been on the agenda of the Indian state. Social and cultural inequalities have a strong bearing on employment outcomes even when the latter are determined by market forces. The market operates within the existing structural inequalities of gender, caste, religion, class, location etc. Rather than altering these inequalities it tends to reinforce them (Neetha N., 2013). The different dimensions of social stratification create layers of exclusion and exploitation. Employment is determined largely by the existing structural inequalities. The domination of upper caste women in the growing sectors of the economy and in better skilled and paid occupational categories signals the path of caste-based consolidation. In such a context education is not a simple panacea for employment problems, concerted efforts to address the stereotyping of labour markets are required.
183
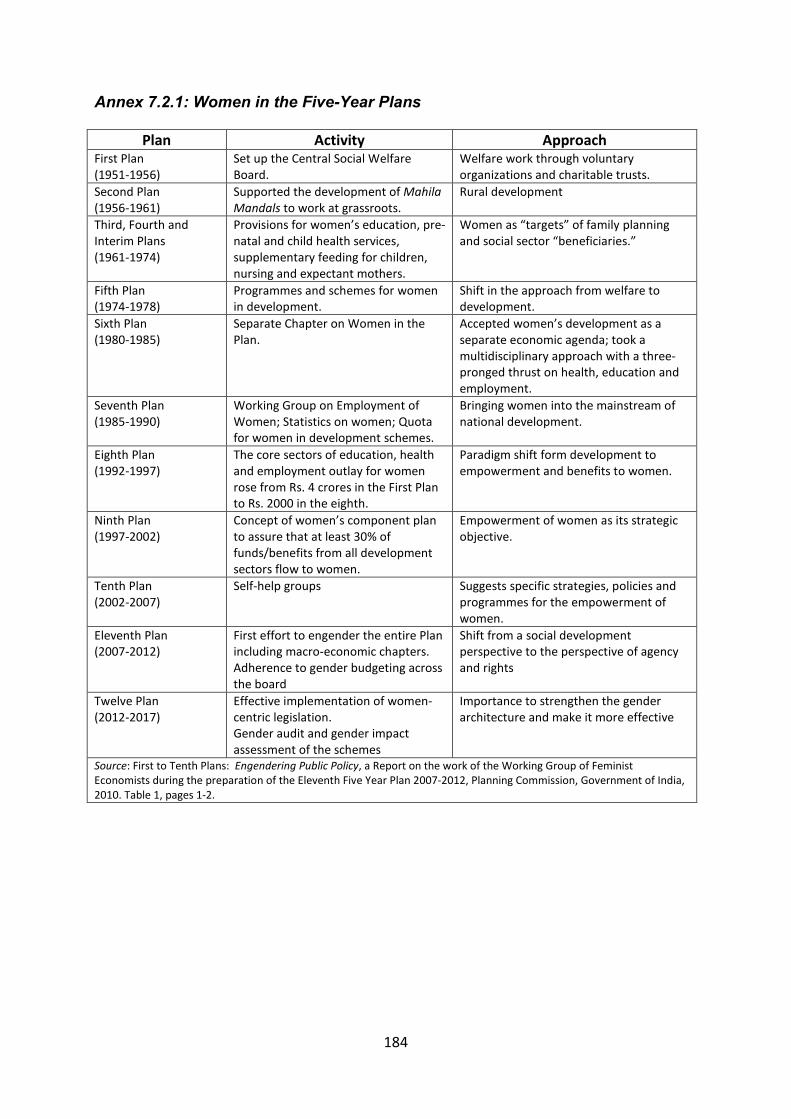
Annex 7.2.1: Women in the Five-Year Plans
Plan Activity Approach First Plan (1951-1956)
Set up the Central Social Welfare Board.
Welfare work through voluntary organizations and charitable trusts.
Second Plan (1956-1961)
Supported the development of Mahila Mandals to work at grassroots.
Rural development
Third, Fourth and Interim Plans (1961-1974)
Provisions for women’s education, pre-natal and child health services, supplementary feeding for children, nursing and expectant mothers.
Women as “targets” of family planning and social sector “beneficiaries.”
Fifth Plan (1974-1978)
Programmes and schemes for women in development.
Shift in the approach from welfare to development.
Sixth Plan (1980-1985)
Separate Chapter on Women in the Plan.
Accepted women’s development as a separate economic agenda; took a multidisciplinary approach with a three-pronged thrust on health, education and employment.
Seventh Plan (1985-1990)
Working Group on Employment of Women; Statistics on women; Quota for women in development schemes.
Bringing women into the mainstream of national development.
Eighth Plan (1992-1997)
The core sectors of education, health and employment outlay for women rose from Rs. 4 crores in the First Plan to Rs. 2000 in the eighth.
Paradigm shift form development to empowerment and benefits to women.
Ninth Plan (1997-2002)
Concept of women’s component plan to assure that at least 30% of funds/benefits from all development sectors flow to women.
Empowerment of women as its strategic objective.
Tenth Plan (2002-2007)
Self-help groups Suggests specific strategies, policies and programmes for the empowerment of women.
Eleventh Plan (2007-2012)
First effort to engender the entire Plan including macro-economic chapters. Adherence to gender budgeting across the board
Shift from a social development perspective to the perspective of agency and rights
Twelve Plan (2012-2017)
Effective implementation of women-centric legislation. Gender audit and gender impact assessment of the schemes
Importance to strengthen the gender architecture and make it more effective
Source: First to Tenth Plans: Engendering Public Policy, a Report on the work of the Working Group of Feminist Economists during the preparation of the Eleventh Five Year Plan 2007-2012, Planning Commission, Government of India, 2010. Table 1, pages 1-2.
184
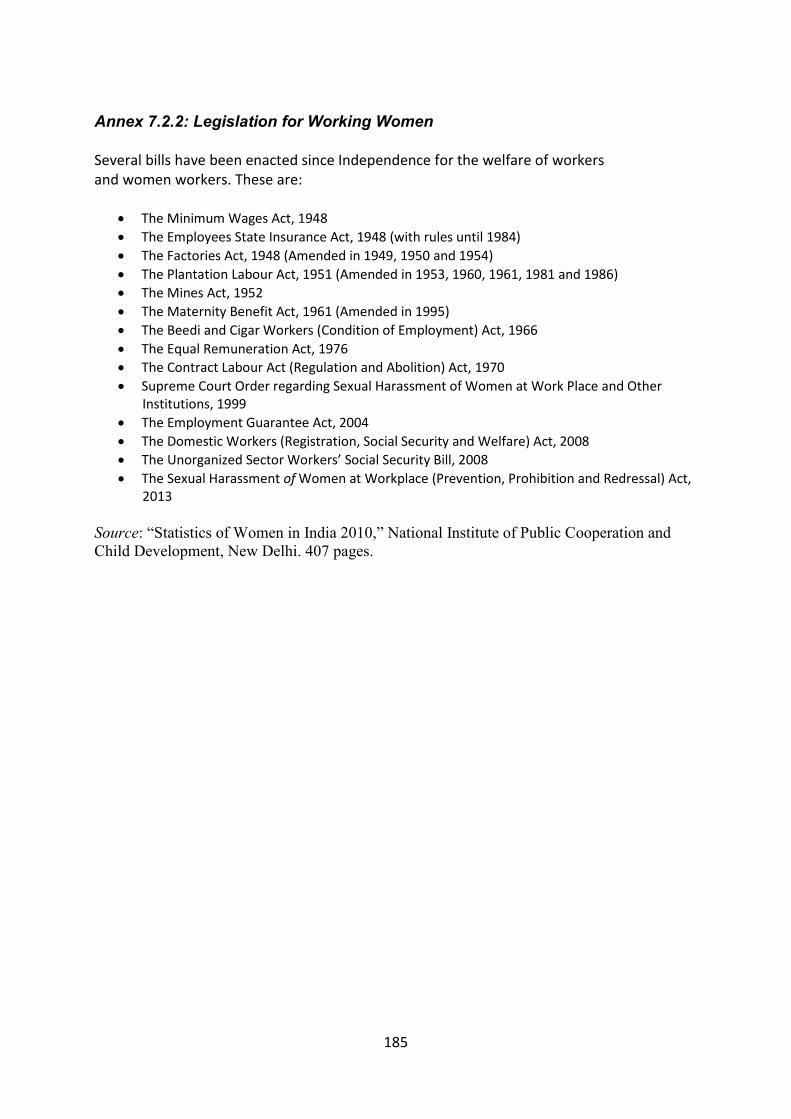
Annex 7.2.2: Legislation for Working Women Several bills have been enacted since Independence for the welfare of workers and women workers. These are:
• The Minimum Wages Act, 1948 • The Employees State Insurance Act, 1948 (with rules until 1984) • The Factories Act, 1948 (Amended in 1949, 1950 and 1954) • The Plantation Labour Act, 1951 (Amended in 1953, 1960, 1961, 1981 and 1986) • The Mines Act, 1952 • The Maternity Benefit Act, 1961 (Amended in 1995) • The Beedi and Cigar Workers (Condition of Employment) Act, 1966 • The Equal Remuneration Act, 1976 • The Contract Labour Act (Regulation and Abolition) Act, 1970 • Supreme Court Order regarding Sexual Harassment of Women at Work Place and Other
Institutions, 1999 • The Employment Guarantee Act, 2004 • The Domestic Workers (Registration, Social Security and Welfare) Act, 2008 • The Unorganized Sector Workers’ Social Security Bill, 2008 • The Sexual Harassment of Women at Workplace (Prevention, Prohibition and Redressal) Act,
2013 Source: “Statistics of Women in India 2010,” National Institute of Public Cooperation and Child Development, New Delhi. 407 pages.
185
7.3. Inequality across castes and communities
7.3.1. Caste and class
Caste is an ascriptive and traditional social institution, not found anywhere else in the world, which, nevertheless, plays an important economic role in Indian society. On the other hand, class in its economic term is considered as a modern institution, a creation of industrialization, and is identified with post-agricultural society. Epistemologically, caste and class appear belonging to two different domains. Dumont (1998 [1966]), Hocart (1950), Hutton (1946), Pocock (1955) and Srinivas (1962) subscribe to the view of dichotomy of caste and class. On the other hand, Barth (1960), Beteille (1966), Desai (1975), Ghurye (1950), Kothari (1970a; 1970b), Sharma (1980) consider caste and class belonging to the same structural reality.35 Notwithstanding the two positions, caste and class are interwoven in functionally inextricable relations in Indian society. Their functional relations are denounced by those who subscribe to the dichotomy of tradition and modernity and who consider caste as essentially a traditional institution with no role in modern society. Subscribers to this view treat modernization as a neat break with the past. Caste-class relations in rural India are largely explained through land ownership; the distribution of which is uneven across castes. Landlessness is higher among the SCs, STs and lower OBCs, and the lowest among the upper castes. Further, the proportion of large landholdings is the highest in upper castes and the lowest in the SCs, STs and lower OBCs. SCs and STs and lower OBCs are mostly small and medium landholders whereas large landholdings are concentrated in upper castes. Land ownership has strong relations with literacy (education), occupation and economic mobility in rural areas. Illiteracy was the highest among the landless and continues to be so, although the relation between land and literacy has weakened in recent years. Similarly, there is a correlation between land and occupation. The proportion of casual labour is the highest in landless and the lowest in landholders. A nexus between land and caste, and land, caste and occupation defines the caste class relations in rural India. While in the rural society classes are explained through the caste-land nexus, in the urban areas, education, occupation, and ownership of economic assets are important determinants of class position. Since caste plays an important role in education, occupation and ownership of economic resources, caste-class relations are found even in the urban areas. The correlations between caste and education and caste and occupations underline this nexus. Upper castes constitute the majority of upper classes and lower castes the majority of lower classes. Upper castes are more educated than the lower castes. The former dominate modern occupations, and are overrepresented in the ownerships of industries and services. Class formation in urban areas is also moulded in castes. At least the urban middle class is dominated by upper castes (Mishra, 1961, Rao, 1992). The job reservation policy has increased the representation of SCs, STs and recently OBCs in government services. Yet the representation of especially of SCs and STs is highly skewed, as they are over represented in class C and D positions which correspond to lower classes and
35 See Ashok K Pankaj (2004) “Engaging With Discourse On Caste, Class And Politics in India”, South Asia Research, Vol. 27(3): 333–353
186

their low social status. On the other hand, they are meagerly represented in the private sectors and independent professions, and have the lowest ownership of industries and services.
7.3.2. Tribe and religion
Caste is one social dimension of labour market in India. Other such dimensions include tribes and religions. Tribes in India have officially been enlisted in a schedule, and are known as Scheduled Tribes (STs). They constitute about nine percent of India’s population and are concentrated mostly in the North-East and the hilly and dry regions of Eastern and Central India. They have low access to education, income and employment, and economic resources leading to their low social and economic status. Their social and economic status is lower than that of the SCs. Their low socio-economic development is also because of their concentration in the backward regions of the country. Religion is another social category relevant for examining labour market pattern. Different religious communities have differential levels of socio-economic development with strong regional dimensions. Among all the religious minorities, Muslims and Dalit Christians have the lowest levels of development. Muslims living in Eastern and Northern India are backward than their counterparts in Southern and Western India. The Prime Minister’s Expert Group on Muslim Minority, headed by Justice Rajinder Sachchar, has also emphasized this dimension (Government of India, 2006). An interesting social dimension of religious minorities in India is the penetration of caste-like structures in the apparently egalitarian religions of Islam and Christianity. Caste hierarchies are found in Indian Muslims and Christians. A major reason for the penetration of caste-like hierarchy among Muslims and Christians is conversion of the erstwhile Hindus into Muslims and Christians. The converts carry social and cultural values, norms, practices from Hinduism to Islam and Christianity. This has resulted in social segregation within Muslims and Christians. For example, Ashraf and Azlaf are broad social divisions among Muslims; Ashraf represent upper caste and Azlaf lower caste Muslims (Ahmed, 1976). Even among Ashraf, there are Sayyed, Shaikh, Moghul and Pathan, similar to four upper caste Hindus namely Brahmin, Kshatriya, Kayastha and Vaish.36 However, the occupational division in Muslims is not as rigid as in the case of Hindus except for the fact that the Maulvi of a Masjid is invariably a Sayyed, equivalent to the priest Brahmin caste of Hindus. Among Indian Christians, Dalit Christian is a distinct social category that is equivalent to low castes in Hindus. Upper Christians discriminate against Dalit Christians so much so that the latter have to establish their separate Churches.
7.3.3. Social construction of labour market inequality in India Caste37-class convergence in India has social roots that have strong economic impacts. These impacts are found mainly through deep-rooted structural inequality in the society, resulting in unequal access to education, income and employment opportunity, and economic resources. The denial of equal access to education, economic resources and opportunities to the low caste Hindus, Muslims and Christians and tribes, who constitute large sections of Indian society, has a social sanction, which creates structural inequality in the labour market.
36 See Imtiaz Ahmed ed. (1978) Caste and Social Stratification among Muslims in India (Delhi: Manohar Book Services). 37 When we use the term caste here, we also mean tribes and caste-like structures among religious communities.
187

The structural inequality of the Indian labour market is similar to that of the Western industrial societies with respect to segmentation. However, while in the West, it is mainly a question of race, religion, gender and migrant status, in India it is more of a phenomenon of caste, religion, tribe and gender. Another dimension is ‘labour market polarization’, which is more pronounced in the West than in India. ‘Labour market polarization’ happens due to economic mechanisms and policies which result in the concentration of job creation either in the top segment or at the bottom or both. These distortions are amenable to corrections through a reversal of poor economic policies and other state measures—fiscal, budgetary, industrial policies. Labour market polarization is noticeable even in India in the post-liberalization phase; jobs have been created either at the top or the bottom (Mazumdar and Sarkar, 2008). Nevertheless, labour market inequality in India is still largely socially constructed so much so that it is not easily amenable to correction through economic policies. For example, the caste- and gender-based denial of education and discrimination in employment opportunity are socially constructed.38 Labour market segmentation arising out of such discrimination is rather rigid. The section below explains the social construction of labour market inequality in India, and analyses the magnitude and phenomenon of unequal access to education, employment and other economic resources39. It also explains state measures and their efficacies in reducing these aspects of labour market inequality.
7.3.4. Unequal access to education
Access to modern sector employment is dependent on the level of education. The more educated and skilled a person is, the greater is the chance of him/her getting employed in a modern occupation. Since education increases access to employment opportunity, unequal educational attainments of different social groups result in differential access to employment. Historically, knowledge creation and its spread have been controlled through social sanctions. Madhav Govind (2014) has shown the implications of control over knowledge production in the reproduction of subalterns in the society. Nita Kumar (2014) has explained the historical denial of education to the masses. In ancient times, the reading of Veda was a taboo for Shudras. The practice continued for a long time. The colonial government introduced secular Western education in India, and a number of modern schools were opened. Later on reformist Indians and nationalists of Swadeshi School also opened a number of modern educational institutions across the country. The opening of these schools and colleges on the lines of Western educational institutions resulted in increased availability of educational opportunities. But the social milieu was still adverse for the SC, STs, and women who were not encouraged to get educated. Rather they were discriminated against, and continue to face such discrimination. Even today, instances of denial of education to the SCs, STs and women are reported from different parts of the country. Differential levels of enrolment in primary education and then relatively higher drop-out rates among them are also because of the adverse conditions.
38 The Indian Institute of Dalit Studies has conducted a number of studies of caste based discrimination in labour market in the era of globalisation. See Summary of IIDS Research (2003-2011), Delhi, Indian Institute of Dalit Studies, pp. 1-12. 39 See Summary of IIDS Research, pp. 21-37 and 38-51 for various studies examining discriminatory practices denying access to education, food, health and government programmes.
188
While Hindus adopted modern education, a large proportion of the Muslim minority adhered to their old Arabic and Persian schools of education. The adoption of modern secular education was relatively slow among them. At the same time, Madarsas and Maqtabas, the elementary education institutions of the Muslim community, have shown reluctance to adopt a modern curriculum. Efforts to modernize Madarsas have not been very successful. Madarsa-educated children find it difficult to get employment in modern sectors of the economy. In the post-independence period, universal education became a goal of the Constitution. Article 45 of the Indian Constitution provides for free and compulsory education for all children up to the age of 14 years. The provision was dormant until the 86th Constitutional Amendment Act that inserted Article 21A into the Constitution, making Right to Education a Fundamental Right. The Act became operational only after the enactment of the The Right of Children to Free and Compulsory Education Act 2009, which came into operation on April 1, 2010. The Act makes a provision for compulsory enrolment of all children and their free education up to the age of 14 years. The equal access to education was provided in the Constitutional provision, but social and economic factors continued to deny equal access to education to all segments of the society. Some of these factors can be listed as follows:
(a) Immediately after Independence, the major challenge was to provide access to schools which was not universal. A large number of rural habitations were without any kind of schools. Private schools had not come up in the rural areas and government schools were limited in number. A disturbing pattern was found in the location of government schools, which were invariably established in those villages with a concentration of upper caste population. A large number of villages inhabited by lower caste people were left out. Further, the density of schools was very thin in the remote and inaccessible hilly and forest areas where the majority of tribal population lived in. A major consequence of that was the denial of equal education to all through discriminatory access to schools. The differential literacy rates among the different sections of the population are also a consequence of denial of schools to all. The coverage of schools has increased, especially after the introduction of the Sarva Siksha Abhiyan (SSA: The Education for All Movement, an Indian Government programme aimed at the universalization of elementary education), yet because of the historical denial of education, SCs, STs and women continue to lag behind others in literacy rates. For example, in 2001 (as per Census 2001), the overall literacy rate was 68.8 percent, but it was 54.7 percent among SCs, and 47.1 percent among STs. There was a gap of 14.1 percentage points between SCs and others and 21.7 percentage points between STs and others. In the case of females, the gap was larger. The literacy figures have improved for all social categories in 2011. Yet the literacy rate is the lowest in the STs, followed by the SCs.
189
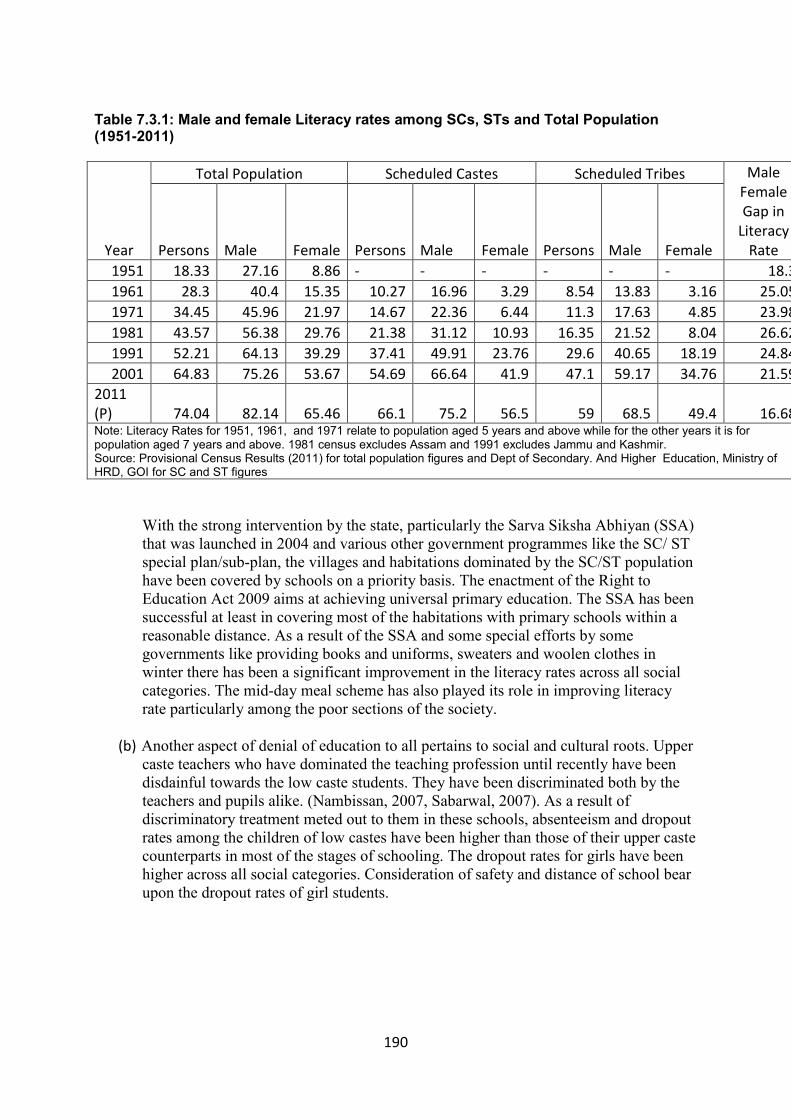
Table 7.3.1: Male and female Literacy rates among SCs, STs and Total Population (1951-2011)
With the strong intervention by the state, particularly the Sarva Siksha Abhiyan (SSA) that was launched in 2004 and various other government programmes like the SC/ ST special plan/sub-plan, the villages and habitations dominated by the SC/ST population have been covered by schools on a priority basis. The enactment of the Right to Education Act 2009 aims at achieving universal primary education. The SSA has been successful at least in covering most of the habitations with primary schools within a reasonable distance. As a result of the SSA and some special efforts by some governments like providing books and uniforms, sweaters and woolen clothes in winter there has been a significant improvement in the literacy rates across all social categories. The mid-day meal scheme has also played its role in improving literacy rate particularly among the poor sections of the society.
(b) Another aspect of denial of education to all pertains to social and cultural roots. Upper
caste teachers who have dominated the teaching profession until recently have been disdainful towards the low caste students. They have been discriminated both by the teachers and pupils alike. (Nambissan, 2007, Sabarwal, 2007). As a result of discriminatory treatment meted out to them in these schools, absenteeism and dropout rates among the children of low castes have been higher than those of their upper caste counterparts in most of the stages of schooling. The dropout rates for girls have been higher across all social categories. Consideration of safety and distance of school bear upon the dropout rates of girl students.
Year
Total Population Scheduled Castes Scheduled Tribes Male Female Gap in
Literacy Rate Persons Male Female Persons Male Female Persons Male Female
1951 18.33 27.16 8.86 - - - - - - 18.3 1961 28.3 40.4 15.35 10.27 16.96 3.29 8.54 13.83 3.16 25.05 1971 34.45 45.96 21.97 14.67 22.36 6.44 11.3 17.63 4.85 23.98 1981 43.57 56.38 29.76 21.38 31.12 10.93 16.35 21.52 8.04 26.62 1991 52.21 64.13 39.29 37.41 49.91 23.76 29.6 40.65 18.19 24.84 2001 64.83 75.26 53.67 54.69 66.64 41.9 47.1 59.17 34.76 21.59
2011 (P) 74.04 82.14 65.46 66.1 75.2 56.5 59 68.5 49.4 16.68 Note: Literacy Rates for 1951, 1961, and 1971 relate to population aged 5 years and above while for the other years it is for population aged 7 years and above. 1981 census excludes Assam and 1991 excludes Jammu and Kashmir. Source: Provisional Census Results (2011) for total population figures and Dept of Secondary. And Higher Education, Ministry of HRD, GOI for SC and ST figures
190
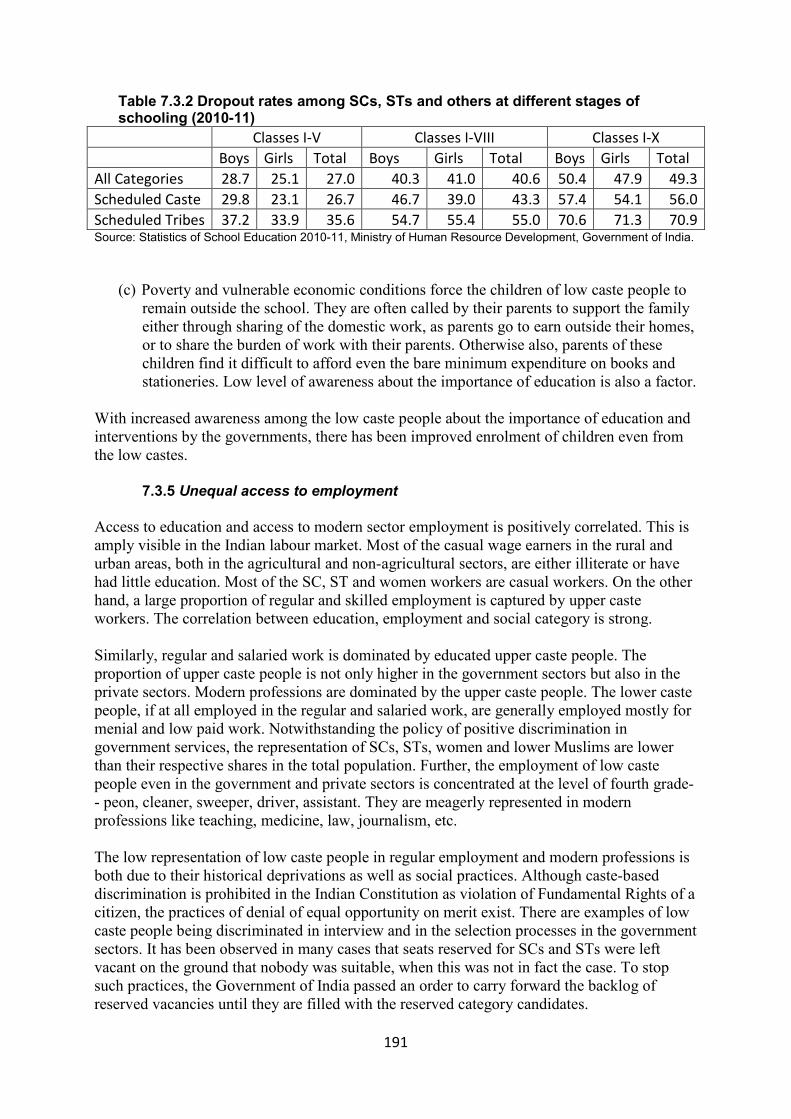
Table 7.3.2 Dropout rates among SCs, STs and others at different stages of schooling (2010-11)
Classes I-V Classes I-VIII Classes I-X Boys Girls Total Boys Girls Total Boys Girls Total All Categories 28.7 25.1 27.0 40.3 41.0 40.6 50.4 47.9 49.3 Scheduled Caste 29.8 23.1 26.7 46.7 39.0 43.3 57.4 54.1 56.0 Scheduled Tribes 37.2 33.9 35.6 54.7 55.4 55.0 70.6 71.3 70.9 Source: Statistics of School Education 2010-11, Ministry of Human Resource Development, Government of India.
(c) Poverty and vulnerable economic conditions force the children of low caste people to remain outside the school. They are often called by their parents to support the family either through sharing of the domestic work, as parents go to earn outside their homes, or to share the burden of work with their parents. Otherwise also, parents of these children find it difficult to afford even the bare minimum expenditure on books and stationeries. Low level of awareness about the importance of education is also a factor.
With increased awareness among the low caste people about the importance of education and interventions by the governments, there has been improved enrolment of children even from the low castes.
7.3.5 Unequal access to employment
Access to education and access to modern sector employment is positively correlated. This is amply visible in the Indian labour market. Most of the casual wage earners in the rural and urban areas, both in the agricultural and non-agricultural sectors, are either illiterate or have had little education. Most of the SC, ST and women workers are casual workers. On the other hand, a large proportion of regular and skilled employment is captured by upper caste workers. The correlation between education, employment and social category is strong. Similarly, regular and salaried work is dominated by educated upper caste people. The proportion of upper caste people is not only higher in the government sectors but also in the private sectors. Modern professions are dominated by the upper caste people. The lower caste people, if at all employed in the regular and salaried work, are generally employed mostly for menial and low paid work. Notwithstanding the policy of positive discrimination in government services, the representation of SCs, STs, women and lower Muslims are lower than their respective shares in the total population. Further, the employment of low caste people even in the government and private sectors is concentrated at the level of fourth grade-- peon, cleaner, sweeper, driver, assistant. They are meagerly represented in modern professions like teaching, medicine, law, journalism, etc. The low representation of low caste people in regular employment and modern professions is both due to their historical deprivations as well as social practices. Although caste-based discrimination is prohibited in the Indian Constitution as violation of Fundamental Rights of a citizen, the practices of denial of equal opportunity on merit exist. There are examples of low caste people being discriminated in interview and in the selection processes in the government sectors. It has been observed in many cases that seats reserved for SCs and STs were left vacant on the ground that nobody was suitable, when this was not in fact the case. To stop such practices, the Government of India passed an order to carry forward the backlog of reserved vacancies until they are filled with the reserved category candidates.
191
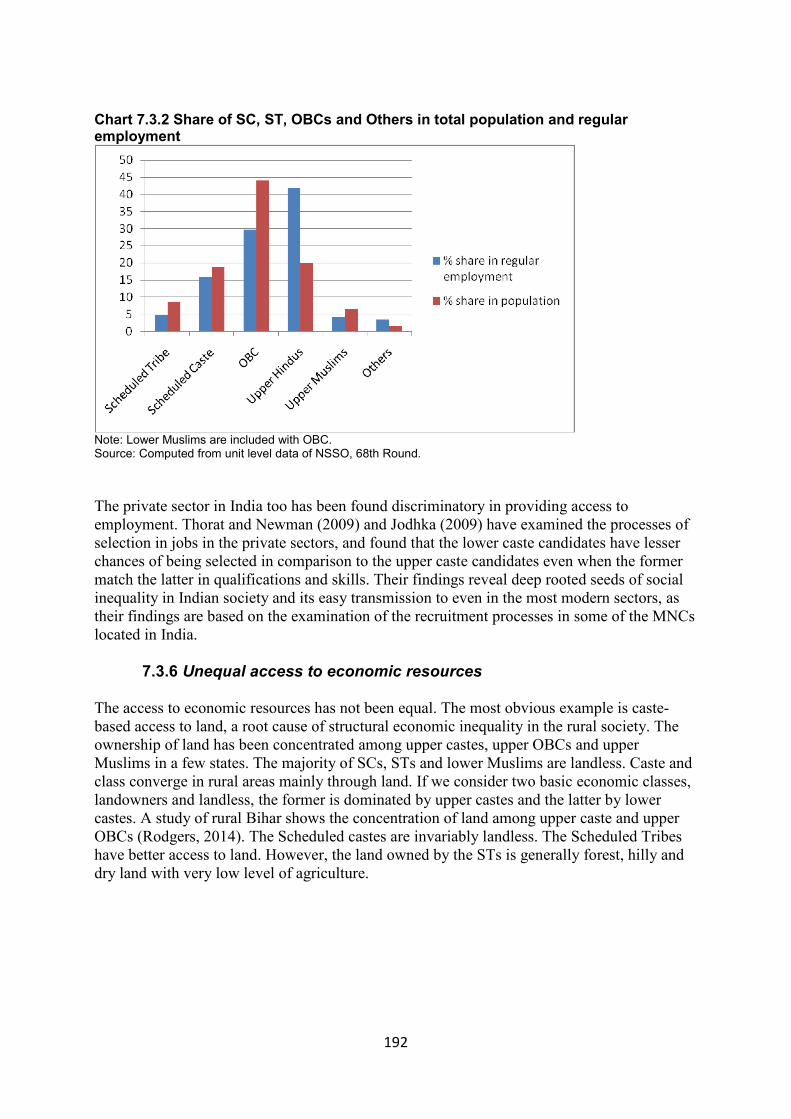
Chart 7.3.2 Share of SC, ST, OBCs and Others in total population and regular employment
Note: Lower Muslims are included with OBC. Source: Computed from unit level data of NSSO, 68th Round. The private sector in India too has been found discriminatory in providing access to employment. Thorat and Newman (2009) and Jodhka (2009) have examined the processes of selection in jobs in the private sectors, and found that the lower caste candidates have lesser chances of being selected in comparison to the upper caste candidates even when the former match the latter in qualifications and skills. Their findings reveal deep rooted seeds of social inequality in Indian society and its easy transmission to even in the most modern sectors, as their findings are based on the examination of the recruitment processes in some of the MNCs located in India.
7.3.6 Unequal access to economic resources
The access to economic resources has not been equal. The most obvious example is caste-based access to land, a root cause of structural economic inequality in the rural society. The ownership of land has been concentrated among upper castes, upper OBCs and upper Muslims in a few states. The majority of SCs, STs and lower Muslims are landless. Caste and class converge in rural areas mainly through land. If we consider two basic economic classes, landowners and landless, the former is dominated by upper castes and the latter by lower castes. A study of rural Bihar shows the concentration of land among upper caste and upper OBCs (Rodgers, 2014). The Scheduled castes are invariably landless. The Scheduled Tribes have better access to land. However, the land owned by the STs is generally forest, hilly and dry land with very low level of agriculture.
192
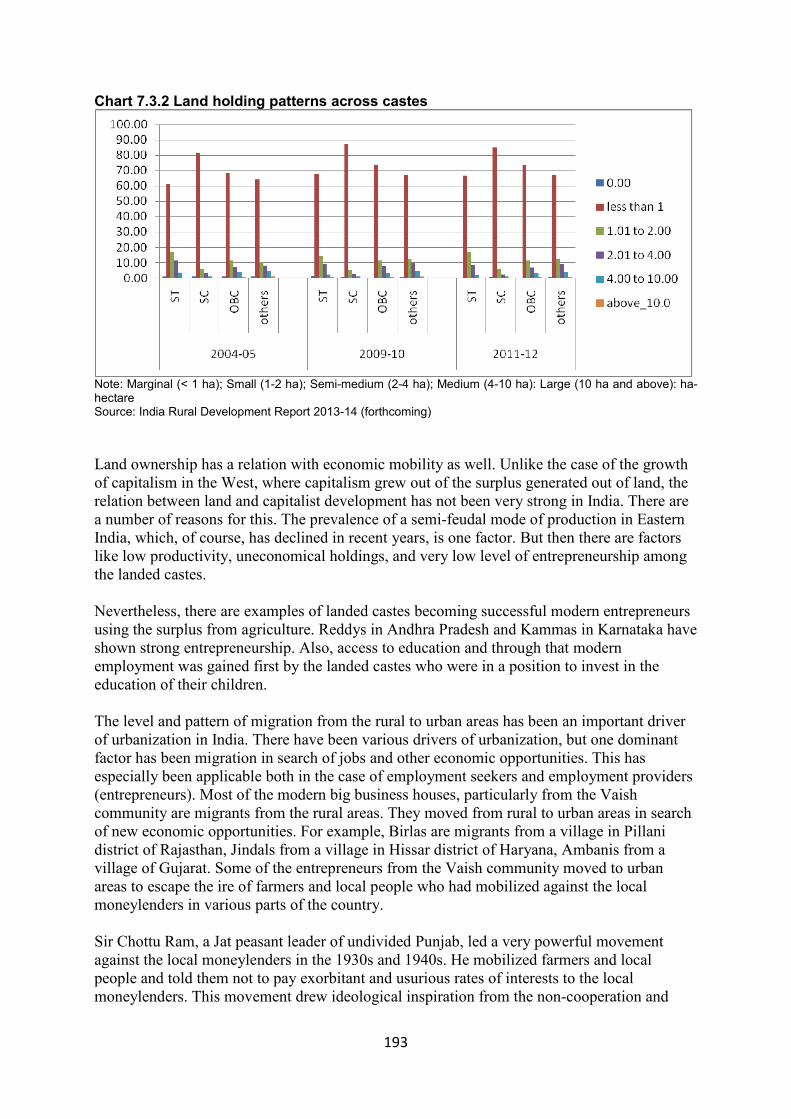
Chart 7.3.2 Land holding patterns across castes
Note: Marginal (< 1 ha); Small (1-2 ha); Semi-medium (2-4 ha); Medium (4-10 ha): Large (10 ha and above): ha-hectare Source: India Rural Development Report 2013-14 (forthcoming) Land ownership has a relation with economic mobility as well. Unlike the case of the growth of capitalism in the West, where capitalism grew out of the surplus generated out of land, the relation between land and capitalist development has not been very strong in India. There are a number of reasons for this. The prevalence of a semi-feudal mode of production in Eastern India, which, of course, has declined in recent years, is one factor. But then there are factors like low productivity, uneconomical holdings, and very low level of entrepreneurship among the landed castes. Nevertheless, there are examples of landed castes becoming successful modern entrepreneurs using the surplus from agriculture. Reddys in Andhra Pradesh and Kammas in Karnataka have shown strong entrepreneurship. Also, access to education and through that modern employment was gained first by the landed castes who were in a position to invest in the education of their children. The level and pattern of migration from the rural to urban areas has been an important driver of urbanization in India. There have been various drivers of urbanization, but one dominant factor has been migration in search of jobs and other economic opportunities. This has especially been applicable both in the case of employment seekers and employment providers (entrepreneurs). Most of the modern big business houses, particularly from the Vaish community are migrants from the rural areas. They moved from rural to urban areas in search of new economic opportunities. For example, Birlas are migrants from a village in Pillani district of Rajasthan, Jindals from a village in Hissar district of Haryana, Ambanis from a village of Gujarat. Some of the entrepreneurs from the Vaish community moved to urban areas to escape the ire of farmers and local people who had mobilized against the local moneylenders in various parts of the country. Sir Chottu Ram, a Jat peasant leader of undivided Punjab, led a very powerful movement against the local moneylenders in the 1930s and 1940s. He mobilized farmers and local people and told them not to pay exorbitant and usurious rates of interests to the local moneylenders. This movement drew ideological inspiration from the non-cooperation and
193
civil disobedience movements of Mahatma Gandhi and identified local moneylenders as another group of exploiters. The large section of Vaish community in Punjab and Haryana migrated to urban areas because they were threatened by the agitation of Chottu Ram. Some of the farmers also moved to urban areas to start modern enterprises. They drew their initial capital from the surplus in agriculture. Sometimes they also sold their lands in rural areas. In the process, the caste based inequality was transmitted as class inequality in urban areas. Caste-based division of occupation was another reason. Business and trade were socially earmarked for the Vaish, one of the four upper castes. It is not surprising that many of the big modern entrepreneurs are from the traditional Vaish community, including the Ambanis, Birlas, Mittals, Ruias and Jindals. For a long time Dalit businessmen and entrepreneurs were almost absent. Recently there has been some growth in the numbers of Dalit businessmen and entrepreneurs. Some of them started their businesses as petty shopkeepers, businessmen and traders and rose to higher positions. An association of Dalit entrepreneurs has been established to promote the cause of Dalit businessmen. The Dalit Chamber of Business and Commerce has three thousand entrepreneurs as its members. It has acquired an accumulated capital base of 30,000 crore rupees. Some of them have spread their businesses even outside India. There is also a growth of small businessmen from Dalits who have moved to local towns and cities and started shops and petty businesses. But most of them are found to be opting for their traditional occupation related business. Cobblers turning into shoe makers, barbers becoming a salon owner, carpenter opening a furniture shop are very common. Lynch, in a study of shoe makers of Agra, has documented the socio-economic transformation of Jatavas (Chamar) of Uttar Pradesh who became modern shoemakers (Lynch in Singer, 1968). The socio-political empowerment of Jatavas of Uttar Pradesh is linked to their changed economic status through ownership of shoe making industries. Access to financial resources too has been unequal. Initially, banks were mainly in the private sector. With the nationalization of banks in 1969, the chances of equal access to banks increased. But a number of other factors have denied access to financial resources to SCs and STs. Apart from economic reasons there are social reasons as well. Muslims have another consideration as borrowing and lending money for profit is taboo for them. To encourage the modern banking habit among the Muslims, the Government of India has recently given permission for the opening of Islamic Banks. This also restricts their economic mobility.
194
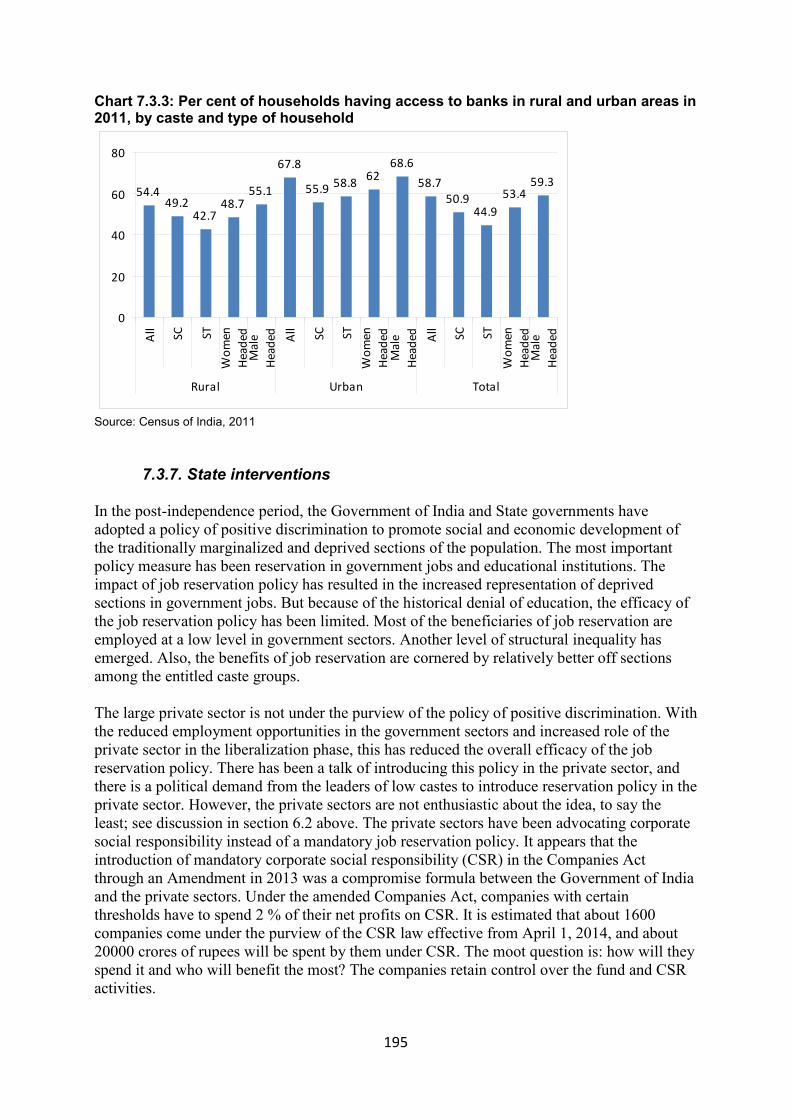
Chart 7.3.3: Per cent of households having access to banks in rural and urban areas in 2011, by caste and type of household
54.449.2
42.748.7
55.1
67.8
55.9 58.8 6268.6
58.750.9
44.953.4
59.3
0
20
40
60
80Al
l
SC STW
omen
Head
edM
ale
Head
ed All
SC STW
omen
Head
edM
ale
Head
ed All
SC STW
omen
Head
edM
ale
Head
ed
Rural Urban Total
Source: Census of India, 2011
7.3.7. State interventions
In the post-independence period, the Government of India and State governments have adopted a policy of positive discrimination to promote social and economic development of the traditionally marginalized and deprived sections of the population. The most important policy measure has been reservation in government jobs and educational institutions. The impact of job reservation policy has resulted in the increased representation of deprived sections in government jobs. But because of the historical denial of education, the efficacy of the job reservation policy has been limited. Most of the beneficiaries of job reservation are employed at a low level in government sectors. Another level of structural inequality has emerged. Also, the benefits of job reservation are cornered by relatively better off sections among the entitled caste groups. The large private sector is not under the purview of the policy of positive discrimination. With the reduced employment opportunities in the government sectors and increased role of the private sector in the liberalization phase, this has reduced the overall efficacy of the job reservation policy. There has been a talk of introducing this policy in the private sector, and there is a political demand from the leaders of low castes to introduce reservation policy in the private sector. However, the private sectors are not enthusiastic about the idea, to say the least; see discussion in section 6.2 above. The private sectors have been advocating corporate social responsibility instead of a mandatory job reservation policy. It appears that the introduction of mandatory corporate social responsibility (CSR) in the Companies Act through an Amendment in 2013 was a compromise formula between the Government of India and the private sectors. Under the amended Companies Act, companies with certain thresholds have to spend 2 % of their net profits on CSR. It is estimated that about 1600 companies come under the purview of the CSR law effective from April 1, 2014, and about 20000 crores of rupees will be spent by them under CSR. The moot question is: how will they spend it and who will benefit the most? The companies retain control over the fund and CSR activities.
195
8. Conclusion This paper shows how inequality in India is embedded in the overall pattern of growth and development. Independent India inherited a colonial, social and dynastic legacy of extremes of inequality, with wealth concentrated in a rather small fraction of the population, and a hierarchical society in which a large proportion of the population was excluded from adequate participation in economic and social life. The decades after Independence saw some inroads made into these inequalities, as untouchability was banned, hereditary privileges gradually reduced, and land tenure systems rendered somewhat less unequal. The share of the richest in income declined, and state policies increasingly aimed to eliminate poverty, albeit with little success. But growth was slow, and thirty years after Independence real wages had hardly risen. From the 1980s on, the socialist perspective that had guided state action was gradually replaced by an increasing reliance on market forces, with the liberalization of investment and external trade, and closer coordination between the state and private business. This led to an increase in the rates of investment and growth, and incomes rose too, though not as fast as overall growth; for the gains from higher growth were concentrated among higher income groups, and the previous tendency towards decreasing inequality was reversed. What have been the key forces driving inequality in the two thirds of a century since Independence? How are they changing as the accumulation regime changes? What is the implication for distribution of today’s model of growth and development? i. The pace and pattern of investment has been a key factor, because it has shaped the
growth path. In the period up to 1980, the state was the dominant investor, both in the development of infrastructure and in large scale industry. The overall rate of investment gradually rose over time, but the growth of output remained disappointing. After the 1980s the investment rate continued to rise, but now it was private investment that increased, and from the 1990s onwards public investment declined. This reflected a shift in the relationship between the state and the private sector, with the state disengaging from productive activities. Instead, a range of tax, subsidy, regulatory and incentive policies were put in place to support business - though public sector investment in infrastructure clearly fell short of the demands of the private sector. This shift in the accumulation regime was associated with a rise in the share of profits and a decline in the share of wages in the organized sector. Capital-intensive investment also generated a relatively weak growth in demand for labour, leading to stagnation in the formal labour market. The opening up of the Indian economy to global markets also played a role, but the process was essentially domestically led. Today growth is increasingly dependent on financial resources generated within the corporate sector, with a rising share of FDI, and a growing financial services sector has developed around this, leading to a concentration of resources and incomes.
ii. The sectoral pattern of growth has also played an important role. The decline in
agriculture’s share in production has been much more rapid than its decline in employment, and has accelerated since 1980. As a result, productivity and income differentials between agriculture and the rest of the economy have widened. Manufacturing industry has grown slowly, and has failed to create regular jobs on a large scale, in contrast to many other labour-abundant economies. The highest rate of growth in industrial employment has been in construction, largely organized around low-wage casual labour. On the other hand, services have grown rapidly, but in a dualistic fashion, with high technology and high incomes in some parts of the sector
196
alongside low productivity informal activities in others. These productivity differences across sectors can be important sources of growing inequality, with high incomes in IT and financial services, but low incomes in personal services and small scale retail trade.
iii. The most remarkable feature of the Indian economy is the persistence of a large
unorganized sector, in the sense of small, unregistered, and mostly non-capitalist enterprises and household businesses. In addition, a substantial share of employment consists of unprotected casual daily labour in organized and unorganized sectors alike. This segmentation of the labour market is remarkably stable over time. It grew with the process of urbanization and industrialization prior to 1980, partly because of the emphasis on large scale industry at that time and the consequent neglect of other forms of production; and it has persisted through the process of economic reform, and in some respects seems to have been reinforced. Labour market segmentation is therefore a basic determinant of inequality in both incomes and the quality of working life.
iv. The other key dimension of labour market structure is the occupational hierarchy. In
recent years there have been growing gaps in wages and incomes between the top and the bottom of the occupational scale, between managers, professionals and supervisory workers on the one hand, and production workers on the other. This has been one source of widening inequality. This in turn can be related to failures in the educational system, which have resulted in an unbalanced pattern of skills and capabilities. In particular, the education and training system delivers high levels of capability but only to a small fraction of young people, and does poorly on a wide range of intermediate skills and qualifications.
v. A variety of labour market institutions and organizations influence these patterns, but
there is little sign that they offset the tendency for wage and income differentials to increase. Trade unions devote most energy to protecting insiders, regular workers in the organized sector, who are already relatively protected; although they have been an important force in the labour market ever since Independence (and before), they have on the whole not been a force for greater equality among workers, and have clearly not succeeded in protecting workers against a falling share of wages in value added. Wage setting mechanisms do not favour the unskilled and unorganized, and the powerful institutions for setting wages in the public sector tend to widen differentials between insiders and outsiders rather than reduce them. There are a variety of other institutions and organizations operating in the labour market, and many of them protect the interests of poorer groups. But they do not have enough power to influence the overall trend.
vi. A notable feature of inequality is the way traditional identities, particularly around
caste, community and gender, are associated with different labour market opportunities and outcomes. In the case of caste and community, this reflects both discrimination (implicit or overt) and access to networks of influence and information. Gender differentials too are persistent and sharply limit opportunities. These differentials are often less visible in the aggregate inequality statistics than in patterns of social exclusion. Policies to reduce some of these differentials, notably job reservations for particular castes, were introduced very early, and have been widened since. But in practice they have not much reduced overall differences, mainly providing good jobs for a small minority of the groups concerned; indeed they tend to reinforce and perpetuate caste identity and the inequalities with which it is associated. Muslims, the
197
largest minority community, have on the whole not benefitted from reservations and remain relatively deprived. On the other hand, some communities with a business tradition have taken advantage of liberalization and gained significantly. As for gender differentials, they were always deeply embedded in Indian society, and despite increasing education and widening social recognition little practical progress has been made towards a narrowing of these differences, while female labour force participation appears to be declining. In fact, an increased role of market forces seems to serve to intensify these inequalities, whether for caste, community or gender.
vii. A quite different source of inequality lies in the dynamics of regional development,
which tends to concentrate growth, both in some parts of the country and in urban areas. Although much policy is set centrally, there are considerable degrees of freedom at the state level, and policy implementation depends on local governance structures, which vary from the moderately effective to the deeply corrupt. To these differences in policy regimes across states must be added the polarizing tendencies of market forces, which have tended to concentrate growth in areas where infrastructure is best and markets most developed. Central policies to offset these tendencies have been largely ineffective. As a result, the states with the highest incomes have tended to show the highest rates of growth since the implementation of economic reforms. The contrasting trajectories of Punjab, Tamil Nadu and Bihar show that in reality India’s growth regime consists of a number of parallel regimes, and that this has generated large differentials in income and consumption between the states concerned.
viii. The role of the overall policy regime in the changing structures of inequality has varied
over time. Four principal components of the policy regime can be identified: state participation in and support to the production process; labour market regulation; investment in skills and capabilities; and social transfers and benefits. Each of these has its own trajectory, but overall the policy regime has moved from a state-led development process in the early decades after Independence, with a focus on industrialization and modernization, in which it was expected that all would benefit; to a private sector-led development path with state support, along with complementary social policies to create employment or subsidize wage goods in order to offset the adverse effects of market forces. In this process it can be argued that important equalizing policies such as investing heavily in education and health have been relatively neglected, while labour market regulation has been unable to counter the tendencies towards segmentation, leaving most workers unprotected while failing to promote large scale employment creation.
An issue about which we have been able to say little for lack of good information is the pattern of inequality of wealth. At Independence the dominant asset was land, and land redistribution was seen as the primary means to achieve greater equality. Over time, land has been supplanted by financial capital and real estate (which of course includes land, but in a different context). There seems little doubt that wealth inequality is rising, and this is important not only in its own right but because it is also a major determinant of income inequality. There is evidence that the share in income of the top 1 per cent and even the top 0.1% has been rising since 1980, after falling over the previous 50 years, and this seems likely to be related to the increasing concentration of wealth. There is also evidence that the way education has developed has led to a concentration of human capital.
198
A high concentration of wealth, especially when combined with some of the factors of differentiation and segmentation noted above, such as caste and community, is likely to be a powerful force limiting mobility. This is an important issue, and may be one that differentiates India from Brazil. Mobility in the sense of migration between locations has been growing in India, but the evidence on rural to urban migration is that the better off groups in villages migrate to higher segments of the urban labour market, while agricultural labourers migrate to the casual labour market, so structures of inequality are simply reproduced in the areas of destination. Beyond this, there are important forces that limit occupational mobility. It is true that reservation policies have succeeded in promoting social and economic mobility for a few, either through the reservation of jobs in the public sector or the reservation of places in public educational institutions. But labour markets seem to be increasingly fragmented, and reservation policies have not changed the larger pattern, which is one in which the opportunities for mobility, either within a lifetime, or across generations, are fairly limited. All of these changes, remarkably, have occurred in a stable democratic environment. Electoral pressures, one might imagine, would drive a much stronger redistributive policy agenda. But the political parties of the left, which are the most explicitly committed to redistribution, have been losing support. Local factors seem to play an important role, with caste and community identity still influencing voting patterns, and populist measures provide a substitute for structural change. Still, the continuation of large scale food subsidies and public works employment programmes aimed at the poor appears to reflect electoral pressures, so there is some connection between democracy and distribution. These, then, are issues which emerge from an examination of patterns of inequality in India since Independence. A number of these issues can be investigated in more depth by using household survey data to explore the strength of these different forces and factors, the degree to which they are changing, and their influence on the longer term trend in inequality. That will be the subject of the next paper.
199

9. References Aggarwal A. and Kumar N. (2012), Structural Change, Industrialization and Poverty
Reduction, The Case of India, ESCAP-Development Papers 1206, Bangkok, ESCAP, p.75 Aggarwal, Pawan (2009), Indian Higher Education, Envisioning the Future, Sage
Publications, New Delhi Ahluwalia, Montek S. (2011), “Prospects and Policy Challenges in the Twelfth Plan”,
Economic and Political Weekly, Vol. 46, No. 21, May 21. Ahluwalia, I, Chaudhury, S., and Sidhu, S. (2008), Punjab Industrial Review, Available at,
http,//www.unido.org/fileadmin/user_media/Publications/Pub_free/Punjab_industrial_review.pdf
Ahluwalia M. (2002), "Economic reforms in India since 1991, has gradualism worked?" in Journal of Economic Perspectives, Vol. 16, No.3, pp 67– 88.
Ahluwalia, M S (2001), State Level Performance under Economic Reforms in India, Working Paper No 96, Centre for Research on Economic Development and Policy Reform, Stanford University.
Alavi, Hamza (1975), “India and the colonial mode of production” Economic and Political Weekly, Special Number, August 1975.
Ali, Manzoor (2013), “Post- Sachar Reservation Politics”, Economic and Political Weekly, Vol. 48, No. 39
Anant, T. C. A., & Sundaram, K. (1998), “Wage Policy in India, A Review”, The Indian Journal of Labour Economics, Vol. 41, No. 4, pp. 815-834.
Appaswamy, Paul, S.Guhan, R.Hema, Manabi Majumdar and A.Vaidyanathan (1996), Social Exclusion from a Welfare Rights Perspective in India, Research Series 106, Geneva, International Institute for Labour Studies.
Appu, P.S. (1975), “Tenancy Reform in India” Economic and Political Weekly, Vol. 10, No. 33-35, August 06.
ASER (2012), Annual Status of Education Report (Rural) Provisional, ASER Centre New Delhi
Arya, T.S. (2010), “Panchayat Participation in Adult Literacy Programmes”, Economic and Political Weekly, Vol. 45, No. 26-27.
Bagaram, Tulpule and R.C.Datta (1989), “Real Wages and Productivity in Industry: A Disaggregated Analysis”, Economic and Political Weekly, August 26. Bagchi, Amaresh and Kurian, John (2005), “Regional Inequalities in India, Pre- and Post-
reform Trends and Challenges for Policy” in Mooji, Jos (ed), The Politics of Economic Reforms in India, New Delhi, Sage Publications.
Bal, Gurpreet (2005), “Violence, Migration and Entrepreneurship, Punjab during the Khalistan Movement”, Economic and Political Weekly
Bannerjee, Abhijit and Thomas Piketty (2004), Top Indian Incomes, 1922-2000, Working Paper 4632, London, Centre for Economic Policy Research.
Banerjee, A. and LaxmiIyer (2005), “History, Institutions and Economic Performance, The Legacy of the Colonial Land Tenure Systems in India”, The American Economic Review, Vol. 95, No. 4. pp. 1190-1213.
Banerjee, A., and Piketty, T. (2005), Top Indian Incomes, 1922–2000, The World Bank Economic Review, Vol. 19, No. 1, pp. 1-20.
Banerjee, B. (1983), “Social Networks in the Migration Process, Empirical Evidence on Chain Migration in India”, The Journal of Developing Areas, pp.185-196.Bardhan, Pranab (1989), “Poverty and employment characteristics of urban households in West Bengal, India, An analysis of the results of the National Sample Survey, 1977-78” in Gerry
200
Rodgers (ed.), Urban Poverty and The Labour Market, Geneva, International Institute for Labour Studies.
Bardhan, Pranab (1984), Land, Labour and Rural Poverty, Essays In Development Economics. Delhi, Oxford University Press.
Barooah, Vani K., Diwakar, D. and Sabharwal, N.S. (2014), “Evaluating the Social Orientation of the Integrated Child Development Services Programme”, Economic and Political Weekly, Vol. 49,No. 12
Barooah,V., Dubey, A and Iyer. S (2007), “The Effectiveness of Jobs Reservation, Caste, Religion, and Economic Status in India” MPRA Paper No. 19421 Online at http,//mpra.ub.uni-muenchen.de/19421/
Barth, Fredrik (1960), “The System of Social Stratification in Swat, North Pakistan”, in E.R. Leach (ed.) Aspects of Caste in South India, Ceylon and North Pakistan (pp. 113– 46), Cambridge: Cambridge University Press.
Batra, Sunil (2009), “Inequalities in Elementary Education” in Preet Rustagi (Eds), Concerns, Conflicts and Cohesions, Universalization of Elementary Education in India, Oxford University Press, New Delhi
Bayly, Susan (1999), “Caste, Society and Politics in India from the Eighteenth Century to the Modern Age”, New York, Cambridge University Press.
Beteille, André (1966), Caste, Class and Power, Berkeley: University of California Press. Beteille, André (1969), Caste Old and New. Essays in Social Stratification, Delhi: Asia
Publishing House. Bhagwati, Jagdish and Arvind Panagariya (2013), Why Growth Matters, How Economic
Growth in India Reduced Poverty and the Lessons for Other Developing Countries, New York, Public Affairs.
Bhalla, G.S. and Gurmail Singh (2010), Final report on Planning Commission Project – Growth of Indian Agriculture; A District Level Study. New Delhi, Jawaharlal Nehru University.
Bhalla, G.S. (2004), “Is growth sans industrialisation sustainable?”, Foundation Day Lecture, Institute for Studies in Industrial Development, New Delhi.
Bhalla, G.S. (1995), “Agricultural Growth and Industrial Development in Punjab”, in Mellor, J.W (ed.), Agriculture on the Road to Industrialization, Baltimore and London, Johns Hopkins University
Bhalla, Sheila (1992), “The formation of rural labour markets in India” in T.S.Papola and Gerry Rodgers (eds.), Labour Institutions and Economic Development in India, Geneva, International Institute for Labour Studies.
Bhalotra, Sonia (2002), The Impact of Economic Liberalization on Employment and Wages in India, Paper Submitted to International Policy Group, Geneva, International Labour Organization.
Bhasin, L. (2007), Labour and Employment Laws of India, Retrieved from, http,//unpan1.un.org/intradoc/groups/public/documents/apcity/unpan029043.pdf, last accessed on 20th January, 2014.
Bhat T.P. (2013), Growth and Structural Changes in Indian Industries, ISID Working Paper 2013/02. New Delhi, ISID, p. 58
Bhattacharya, B B and S Sakthivel (2004), “Regional Growth and Disparity in India, Comparison of Pre- and Post-reform Decades”, Economic and Political Weekly, Vol. 39, No 10, pp 1071-77.
Bhattacherjee, D. (1999), “Organized labour and economic liberalization, India, Past, present and future”, Vol. 105, Geneva, International Institute for Labour Studies.
201
Bhattacharjee, D. (1989), “Evolution of Unionism and Labour Market Structure, Case of Bombay Textile Mills, 1947-1985”, Economic and Political Weekly, Vol. 24, No. 21, pp. M67-M76.
Bhattacherjee, D. (1987), “Union-Type Effects on Bargaining Outcomes in Indian Manufacturing”, British Journal of Industrial Relations, Vol. 25, No. 2, pp. 247-266
Bhattacharya, B. B. and Sakthivel, S. (2004), “Regional Growth and Disparity in India, Comparison of Pre- and Post-reform Decades”, Economic and Political Weekly, Vol. 39, No 10, pp 1071-77.
Bhowmik, Sharit, K. (2012), Industry, Labour and Society, Noida, Blackswan Publications. Bhushan, Sudhanshu (2013), Higher Education in the 12th Plan, Paradigm Shift in Favour of
‘For Profit’, Vol - XLVIII No. 04 Binswanger-Mkhize, Hans (2012), India 1960-2010; Structural Change, the Rural Non-Farm
Sector, And The Prospects For Agriculture, Stanford University, Centre on Food Security and the Environment.
Brass, Paul R. (1994), “The Politics of India since Independence” Cambridge, Cambridge University Press.
Buch N. (2000), Women’s experience in new Panchayats, The emerging leadership of rural women, Occasional Paper, Centre for Women’s Development Studies, New Delhi.
Central Statistical Office (2013), Men and Women in India – 2013, 15th issue, New Delhi, Central Statistical Organization.
Chandrasekhar C.P. and Ghosh J. (2014), Women's Work, Has Anything Changed?, The Hindu Business Line, http,//www.thehindubusinessline.com/ accessed on 26 February 2014.
Chandra Mohan (2013), “Unemployment in the Era of Jobless Growth”, Working Paper 2013/ 07, New Delhi, Institute for Studies in Industrial Development.
Chavan, Pallavi and Rajshree Bedamatta (2006), “Trends in agricultural wages in India, 1964-65 to 1999-2000”, Economic and Political Weekly, Vol. 41, No. 38, pp. 4041-4051, September 23.
Chibber, Vivek (2012), “Organized Interests, Development Strategies and Social Policies”, in R. Nagaraj (ed.) (2012), Growth, Inequality and Social Development in India, Basingstoke, Palgrave Macmillan.
Chandhoke, Neera (2005), “Reservations about Reservation”, in Sukhadeo Thorat, Arayama, Prashant Negi (Eds.), Reservation and Private Sector, Quest for Equal Opportunity and Growth
Chandrasekhar, C P and Jayati Ghosh (2011), “Public Works and Wages in Rural India” in Macroscan an alterantive economics website, 11 January
Chudhury, Pradipta (2005), “The Creamy Layer, Political Economy of Reservations” in Sukhadeo Thorat, Arayama, Prashant Negi (Eds.), Reservation and Private Sector, Quest for Equal Opportunity and Growth
Chaudhuri, Pramit (1978), The Indian Economy, Poverty and Development, London, Crosby Lockwood Staples.
Damodaran, Harish (2008), “India’s New Capitalists, Caste, Business and Industry in a Modern Nation”, Ranikhet, Permanent Black.
Dandekar, V.M. and Rath, N (1971): “Poverty in India”, Economic and Political Weekly,Vol. 6, No. 40.
Das, Panchanan (2012), “Wage Inequality in India, Decomposition by Sector, Gender and Activity Status”, Economic and Political Weekly, Vol. 47, No. 50, pp. 58-64.
Das, Subesh (2010), Managing People at Work, Employment Relations in Globalizing India, New Delhi, Sage Publications.
202
Das, Subesh K. (2008), “Trade Unions in India, Union Membership and Union Density”, Indian Journal of Labour Economics, Vol. 51, No. 4, pp. 969-982.
Das, Amarendra (2007), “How Far have We Come in Sarva Shiksha Abhiyan?”, Economic and Political Weekly, Vol. 42, No. 01
Das, Arvind N. (1992), The Republic of Bihar, New Delhi, Penguin Books. Das, Subesh K. (1998), “Wage Policy Issues in the Informal Sector”, The Indian Journal of
Labour Economics, Vol. 41, No. 4, pp.893-902. Dastidar, Ananya Ghosh (2004), Structural Change and Income Distribution in Developing
Economies, Evidence from a Number of Asian and Latin American Countries, Working Paper 121, Centre for Development Economics, Delhi School of Economics, February.
Datt, Ruddar (2008), “Regional and Industrial Spread of Trade Union in India”, Indian Journal of Labour Economics, Vol. 51, No. 4, pp. 993-1000.
Datt, Gaurav (1998), Poverty in India and Indian States: An update, FCND Discussion Paper No. 47, Washington, DC, International Food Policy Research Institute.
Datta, K. L. (1915) “Report on an Enquiry into the Rise in Prices in India and a Resolution of the Government of India Reviewing the Report: Resolution and report with appendices”, Government of India, Calcutta
Davala, S (ed.) (1992), Employment and Unionization in Indian Industry, New Delhi, FES. De, Rahul and Vamsi Vakulabharanam (2013), “Growth and distribution regimes in India
after Independence”, paper presented to the World Economics Association Conference on Inequalities in Asia, 12 May-8 June.
Desai, S. and Kulkarni, Veena (2008): “Changing Educational Inequalities in India in the Context of Affirmative Action Demography”, Economic and Political Weekly, Vol. 45 No. 2 pp. 245-27
Deshpande, Ashwini and Rajesh Ramachandran (2013), “How backward are the Other Backward Classes? Changing Contours of Caste Disadvantage in India”, Working Paper No. 223, Centre for Development Economics, Delhi School of Economics.
Deshpande, L. K. (1979), The Bombay Labour Market, Department of Economics (mimeo), University of Bombay, Bombay.
Desouza, S. (2011), Mapping The Women’s Movement in India, Available at: http://shodhganga.inflibnet.ac.in/bitstream/10603/2722/13/13_chapter%204.pdf
Dhal, Manoranjan; Srivastava, B.L. ( 2002), “Trade Unionism, Perceptions and Attitudes of Workers, Managers and Leaders”, Indian Journal of Industrial Relations, Vol. 38, No. 2 Oct., 2002, pp. 177-198.
Dhanagare, D.N. (1987), “Green Revolution and Social Inequalities in Rural India”, Economic and Political Weekly Vol. 42, No 19, 20 and 21
DISE (2009), District Information for Education (website), various reports (http,//www.dise.in/dise.html)
DN (2004), “Low Employment Growth, Reviving Labour-Intensive Manufacturing”, Economic and Political Weekly, Vol. 39, No. 22
Dore, R.P. http://www.ide.go.jp/English/Publish/Periodicals/De/pdf/65_04_06.pdf. Dreze, Jean and Amartya Sen (1991), Hunger and Public Action, Delhi, Oxford University
Press. Drèze, Jean and Amartya Sen (2013), An Uncertain Glory, India and Its Contradictions,
London, Allen Lane. Drèze, J. and Goyal, A. (2003), “Future of Mid-Day Meals”, Economic and Political Weekly D’Souza, R. 1994. “Informalisation of Work and the Legal Process”, in S. Davala (ed.),
Unprotected Labour in India, Issues and Concerns, New Delhi, Sage Publications, pp.139-168.
203
Dubey, Amaresh (2009), “Intra- State Disparities in Gujarat, Haryana, Kerala, Orissa and Punjab”, Economic and Political Weekly Vol. 44,. Nos. 26 and 27.
Dumont, Louis (1998 [1966])n Homo Hierarchicus, Reprint, Delhi: Oxford University Press. Dutt, Ruddar (ed.) (1997), Organising the Unorganised Workers, Vikas Publishing House,
New Delhi. Dutta, P., Murgai, R., Ravallion, M., & Van de Walle, D. (2012), “Does India's employment
guarantee scheme guarantee employment?”, Economic and Political Weekly, Vol. 47, no. 16, pp 55-64.
Fernandes, L. (1999), “Displacing Women Workers on the Margins of Working Politics on Jute Mills”, pp. 185-190.
Fonesca, A.J. (1975), Wage issues in a Developing Economy – the Indian Experience, Oxford University Press, Bombay.
Friedman, Joseph S. (2008): “Mahatma Gandhi's Vision for the Future of India: The Role of Enlightened Anarchy”, Penn History Review, Vol.16, No. 1
Gail, Omvedt (1981), “Capitalist Agriculture and Rural Classes in India”, Economic and Political Weekly, Review of Agriculture, December 1981.
Ghosh J. (2009), Never Done and Poorly Paid, Women’s Work in Globalising India, New Delhi, Women Unlimited.
Ghosh, A.K (2008), “Globalisation and Employment in Developing Countries” Indian Journal of Labour Economics, Vol.51, No. 4.
Ghosh, Jayati (2014), “MNREGA, The Impact”, Presented at the International Seminar on Development from the Perspective of Labour- Experiences, Challenges and Options, 21-23 February, 2014, Lucknow.
Ghurye, G.S. (1950), Caste and Class in India, Bombay: Popular Book Depot. Ghurye, G.S. (1961), Caste Class and Occupation, Bombay: Popular Prakashan. Gill, S.S., and Singhal K.C. (1984), “The Punjab Problem, Its Historical Roots”, Economic
and Political Weekly Gill, S.S. (1988), “Contradictions of Punjab Model of Growth and Search for an Alternative”,
Economic and Political Weekly Gill, S.S. (1989), “Changing Land Relations in Punjab and Implications for Land Reforms”,
Economic and Political Weekly Gill, K.K. and S.S. Gill (1990), “Agricultural Development and Industrialisation in Punjab,
Some Issues Related to the Pepsi Model”, Economic and Political Weekly Gill, S.S (2014) Discussion with S. S. Gill at the India International Centre, 11th March 2014 Goldar B. and Aggarwal S.C. (2010), "Informalization of Industrial Labour in India, Are labor
market rigidities and growing import competition to blame?", The Developing Economies, Vol.50, No.2, pp. 141–169.
Government of India, (2006), “Social, Economic and Educational Status of the Muslim Community in India: A Report”, Prime Minister’s High Level Committee, Government of India.
Goyal, Jaya and Singh, D.P. (2014), “Academic Performances of OBC Students in Universities, Findings from Three States”, Economic and Political Weekly, Vol. 49, No. 5
Goyal, S.K. (1996), “Political Economy of India’s Economic Reforms”, Presented at The Workshop on Evolutionary Economics, International Trade and Industrialisation in Developing Countries, 7-8 October, Oslo.
Guha, Ramachandra (2007), India after Gandhi. London, Macmillan. Harriss, John (1989), “Vulnerable Workers in the Indian Labour Market” in Gerry Rodgers
(ed.), Urban poverty and the labour market, Geneva, International Institute for Labour Studies.
204
Heston, A. (1982), “National Income”, in Dharma Kumar (eds), Cambridge Economic History of India, Vol. II, Orient Longman, New Delhi
Himanshu and Abhijit Sen (2013), “In-Kind Food Transfers – I, Impact on Poverty”, Economic and Political Weekly, Vol. 48, No 45-46, November 16, 2013.
Himanshu and Abhijit Sen (2013), “In-Kind Food Transfers – II, Impact on Poverty”, Economic and Political Weekly, Vol. 48, No 47, November 23, 2013.
Himanshu (2007), “Recent trends in poverty and inequality, Some preliminary results”, Economic and Political Weekly, Vol. 42, No. 6, pp. 497-508, Feb 10 2007.
Hirway I. (2002), “Employment and unemployment situation in the 1990s – How good is the NSS data?”, Economic and Political Weekly, Vol. 37, No.21, pp 2027-36.
Hocart, A.M. (1950), Caste: A Comparative Study, London: Methuen. Hutton, J.M. (1946), Caste in India: Its Nature, Function and Origin, Cambridge: Cambridge
University Press. ILO (2000), Organization, Bargaining and Dialogue for Development in a Globalizing World,
Governing Body, 279th Session, Geneva. Illiah, Kancha (2005), “Reservations, A Wake-up Call” in Sukhadeo Thorat, Arayama,
Prashant Negi (Eds.), Reservation and Private Sector, Quest for Equal Opportunity and Growth
India, Government of, (2013), Economic Survey 2012-13 - Statistical Appendix, New Delhi, p. 130, retrieved from, http,//indiabudget.nic.in/
India, Government of, (2012), Report of the National Commission on Labour, Government of India, Ministry of Labour, New Delhi.
India, Government of, Ministry of Labour and Employment (2011), Report of the Working Group on “Labour Laws and Other Regulations for the Twelfth Five Year Plan (2012-17), Ministry of Labour and Employment, Government of India.
India, Government of, (2011), India Human Development Report 2011, Institute of Applied Manpower Research, Planning Commission
India, Government of, (2011), Key Indicators of Employment and Unemployment in India, 2009-10, New Delhi, MOSPI, p. 235, retrieved from, http,//mospi.nic.in/Mospi_New/upload/Key_Indicators_Emp_&_Unemp_66th_round.pdf
India, Government of, Ministry of Labour and Employment (2010), Trade Union in India, 2010, Ministry of Labour and Employment, Government of India, 2010. Retrieved from, www.labourbureau.gov.in, 1st October, 2013.
India, Government of, Ministry of Labour and Employment (2009) National Policy on Skill Development
India, Government of, (2006), Social, Economic and Educational Status of the Muslim Community in India Available at, http,//www.minorityaffairs.gov.in/sites/upload_files/moma/files/pdfs/sachar_comm.pdf
India, Government of, Ministry of Labour and Employment (2002), Employment Exchange Statistics, Government of India, Ministry of Labour and Employment, Directorate General of Employment and Training, New Delhi.
India, Government of, Planning Commission (2002), National Human Development Report 2001, New Delhi, Government of India, 2002.
India, Government of, (1986) New Education Policy, 1986 India, Government of, (1974), Towards Equality, Report of the Committee on the Status of
Women in India, Ministry of Education and Social Welfare, Department of Social Welfare, New Delhi. Retrived from, http,//pldindia.org/wp-content/uploads/2013/04/Towards-Equality-1974-Part-1.pdf, and http,//pldindia.org/wp-content/uploads/2013/04/Towards-Equality-1974-Part-2.pdf.
205
India, Government of, (1969), Report of the National Commission on Labour, Ministry Of Labour and Employment and Rehabilitation, Government of India, New Delhi.
India, Government of, (1969), Report of the National Commission on Labour, Ministry Of Labour and Employment and Rehabilitation, New Delhi, Government of India.
India, Government of, (1968) National Policy on Education, 1968 India, Government of, Planning Commission (1951), First Five Year Plan 1951-56, New
Delhi. India, Government of, Planning Commission (1956), Second Five Year Plan 1956-61, New
Delhi India, Government of, Planning Commission (1961), Third Five Year Plan 1961-66, New
Delhi. India, Government of, Planning Commission (1969), Fourth Five Year Plan 1969-74, New
Delhi. India, Government of, Planning Commission (1974), Fifth Five Year Plan 1974-79, New
Delhi. India, Government of, Planning Commission (1980), Sixth Five Year Plan 1980-85, New
Delhi. India, Government of, Planning Commission (1985), Seventh Five Year Plan 1985-90, New
Delhi. India, Government of, Planning Commission (1992), Eighth Five Year Plan 1992-1997, New
Delhi. India, Government of, Planning Commission (1997), Ninth Five Year Plan 1997-2002, New
Delhi. India, Government of, Planning Commission (2002), Tenth Five Year Plan 2002-07, New
Delhi. India, Government of, Planning Commission (2007), Eleventh Five Year Plan 2007-12, New
Delhi. India, Government of, Planning Commission (2012), Twelfth Five Year Plan 2012-17, New
Delhi. India, Government of, Planning Commission (2013), Poverty estimates for 2011-12, Planning
Commission, Government of India, New Delhi. Institute for Human Development (2014), India Labour and Employment Report, New Delhi,
Academic Foundation. Jadhav N. (2005), Industrial Policy since 1956, Gale Encyclopedia, retrieved from:
http,//www.drnarendrajadhav.info/drnjadhav_web_files/Published%20papers/Indian%20Industrial%20Policy%20Since%201956.pdf
Jafferlot, Christophe (2009), Dr.Ambedkar’s Strategies Against Untouchability and the Caste System, Working Paper Indian Institute of Dalit Studies Volume III Number 04
Jannuzi, F. Tomassan (1994), “India’s Persistent Dilemma, The Political Economy of Agrarian Reform”, New Delhi, Orient Longman.
Jayadev, Arjun, Sripad Motiram and Vamsi Vakulabharanam (2007), “Patterns of wealth disparities in India, 1991-2002”. Paper for Conference “A Great Transformation”, New York, Columbia University.
Jha, R., Gaiha, R., and Shankar, S. (2008), “Reviewing the National Rural Employment Guarantee Programme”, Economic and Political Weekly, Vol. 43, No. 11
Jodhka, Surinder (2010), “Engaging with Caste, Academic Discourses, Identity Politics and State Policy”, Working Paper Series, Indian Institute of Dalit Studies and UNICEF
Jodhka, Surinder S. and Katherine Newman, (2007): “In the Name of Globalization: Meritocracy, Productivity and the Hidden Language of Caste.” Economic and Political Weekly. Vol. 42, No. 41, pp. 4125–32.
206

Jogdand (2007), “Caste System in India: Dr.Ambedkar’s Perspective” in Imtiaz Ahmad and ShashiBhushanUpadhyay (eds), Dalit Assertion in Society, Literature and History, Deshkal Publication, New Delhi.
Jose, A. V. (2013), “Changes in Wages and Earnings of Rural Labourers”, Economic and Political Weekly, Vol. 48, No. 26 and 27, pp. 107-113.
Jose S. (2009), Women, Paid Work and Empowerment in India, A Review of Evidence and Issues, Occasional Paper series, New Delhi, Centre for Women’s Development Studies.
Jose, A. V. (2008), “Labour Regulation and Employment Protection in Europe, Some Reflections for Developing Countries”, Economic and Political Weekly, Vol. 43, No. 22
Jose, A.V. (1994), “Earnings, employment and productivity trends in the organised industries of India” in L. K. Deshpande and Gerry Rodgers (eds.), The Indian Labour Market And Economic Structural Change, New Delhi, B.R. Publishing Corporation.
Jose, A. V. (1988), “Agricultural Wages in India”, Economic and Political Weekly, pp. A46-A58.
Jose, A. V. (1978), “Real Wages, Employment and Income of Agricultural Labourers”, Economic and Political Weekly, pp. A16-A20.
Jose, A. V. (1974), “Trends in Real Wage Rates of Agricultural Labourers”, Economic and Political Weekly, pp. A25-A30.
Kainth, G.S. (2006), “A Mission Approach to Sarva Shiksha Abhiyaan”, Economic and Political Weekly, Vol. 41, No. 30
Kannan, K.P. (2012), “How inclusive is inclusive growth in India?” The Indian Journal of Labour Economics, Vol. 55, No. 1.
Karan, A. K., and Sakthivel, S. (2008), Trends in wages and earnings in India, Increasing wage differentials in a segmented labour market, ILO Asia-Pacific Working Paper Series, ILO Subregional Office for South Asia, New Delhi.
Kar, Sabyasachi and Sakthivel, S. (2007), “Reforms and regional inequality in India”, Economic and Political Weekly, Vol. 42, No. 47, pp. 69-77.
Karthikeyan, D. (2012), “Remembering the precursor of Dravidian movement”, The Hindu, 20 May 2012, Viewed on 18 February 2014, http,//www.thehindu.com/todays-paper/tp-national/tp- tamilnadu/article3438425.ece
Karthikeyan, D. (2009), “Tamil Nadu’s Dalit Vote”, The Hindu Verdict 2009, 12 May 2009, Viewed on 18 February 2014, http,//blogs.thehindu.com/elections2009/?p=2860
Karthikeyan, D. (2011), “How Dalit Politics in Tamil Nadu lost Track”, The Hindu, 02 April 2011, Viewed on 18 February 2014, http,//www.thehindu.com/news/cities/Madurai/article1592230.ece
Kautilya (2012), The Arthashastra, Delhi, Penguin Books. Kelkar G. (2013), At the Threshold of Economic Empowerment, Women, Work and Gender
Regimes in Asia, ILO Asia-Pacific Working Paper Series, New Delhi, International Labour Organisation.
Kennedy, L (2004), “The Political Determinants of Reforming Packaging, Contrasting Responses to Economic Liberalisation in Andhra Pradesh and Tamil Nadu” in Jenkins, R (ed.), Regional Reflections, Comparing Politics across India’s States (New Delhi, Oxford University Press), pp 29-65.
Khan, K. and Sabharwal, Nidhi S. (2012), “Access and Equity in Higher Education, Aspects of Gender, Caste, Ethnicity, Religion, Occupation and Economic Groups in Rural and Urban Areas During Pre and Post Reform Periods”, Working Paper VI No. 04, Indian Institute of Dalit Studies
Khera, Reetika (2006), “Mid- Day Meals in Primary Schools, Achievements and Challenges”, Economic and Political Weekly, Vol. 41, No. 46
207
Krishna, Anirudh (2012), “The Spatial Dimension of Inter-Generational Education Achievement in Rural India”, Indian Journal of Human Development, Vol. 6 No.2
Krishnamurty, J. (1982), “The Occupational Structure” in Dharma Kumar (ed.) (1982) The Cambridge Economic History of India Volume II (1757- 1970), New Delhi, Orient Longman.
Kohli, Atul (2013), Poverty amid Plenty in the New India, New Delhi, Cambridge University Press.
Kohli, Atul (2012), “State and Redistributive Development in India” in Nagaraj, R. (ed.), Growth, Inequality And Social Development In India, Is Inclusive Growth Possible?, Basingstoke, Palgrave Macmillan.
Krishnamurty, J. (1983), “The occupational structure” in Dharma Kumar (ed.) The Cambridge Economic History of India, Volume 2, Cambridge, Cambridge University Press.
Krishnamurty, J. (1979), “The Distribution of the Working Force, 1910-851” in Chaudhuri, K. N. and Dewey, Clive J (eds.) Economy and Society: Essays in Indian Economic and Social History, Delhi, Oxford University Press.
Kumar, A. K. Shiva and Rustagi, Preet (2010), “Elementary Education in India, Progress, Setbacks, and Challenges” IHD and Oxfam India Working Paper Series
Kumar, Sharat and Praveen Jha (eds) (2001), Development of Bihar and Jharkhand, New Delhi, Shipra Publishing House.
Kumar, Utsav and Subramanian, Arvind (2012), “Growth in India’s states in the first decade of the 21st Century”, Economic and Political Weekly, Vol. 47, No. 3, pp. 48-57.
Kumar, D. (1998), “Landownership and inequality: Madras Presidency, 1853-1947” in Dharma Kumar, Colonialism, Property and the State, Oxford University Press, Delhi 1998, pp.19-54
Kumar, D. (1982), “The Fiscal System” in Dharma Kumar (eds), Cambridge Economic History of India Vol. II, Orient Longman, New Delhi
Kumar, Dharma and J. Krishnamurty (1981), “Regional and international economic disparities since the Industrial Revolution, the Indian evidence,” in Paul Bairoch and Maurice Levy-Leboyer (eds), Disparities in Economic Development since the Industrial Revolution. London, Palgrave MacMillan.
Kurian, N.J. (1987), “IRDP, How Relevant Is It?”, Economic and Political Weekly, Vol. 22, No. 52
Lahiri, R.K. (2005), Caste System in Hinduism, Available Online at: http://www.boloji.com/index.cfm?md=Content&sd=Articles&ArticleID=1211
Lahiri, R.K. (1969), “Some aspects of inter-state disparity in industrial development in India, 1956-65”, Sankhya, Series B, Vol. 31, No. 3-4.
Lal, Deepak (1988), “Trends in real wages in rural India, 1880-1980” in T N Srinivasan and Pranab K Bardhan (eds.), Rural Poverty in South Asia, New York, Columbia University Press.
Lall S.V. and Chakravorty S. (2004), Industrial Location and Spatial Inequality, Theory and Evidence from India, Research Paper No. 2004/49, Helsinki, WIDER, p.27
Madheswaran, S and Attewell, P. (2007), “Caste Discrimination in the Indian Urban Labour Market, Evidence from the National Sample Survey”, Economic and Political Weekly, Vol. 42, No. 41, pp. 4146-4153.
Mahalanobis, P C and Bhattacharya, D (1969), Growth of Population of India and Pakistan 1801-1961, Calcutta 1969, Available at: [http://library.isical.ac.in/jspui/bitstream/10263/2075/1/329.pdf]
Mahendra Dev, S. and C. Ravi (2007), “Poverty and inequality, All-India and states, 1983-2005”, Economic and Political Weekly, Vol. 42, No. 6, pp. 510-521.
208
Majumdar, Manabi (2005), “Schooling and ‘Skilling’ of the Country’s Youth, Secondary Education in Four Indian States”, Economic and Political Weekly, Vol. 40, No. 22-23
Mamoria, C.B. and Mamoria, S. (1991), Dynamics of Industrial Relations in India, New Delhi, Himalaya Publishing House.
Mayer, Peter (2006), “Trends in real income in Tiruchirapalli and the upper Kaveri delta, 1819-1980, A footnote in honour of Dharma Kumar,” Indian Economic and Social History Review, Volume 43, pp. 349-364.
Mazumdar A. and Neetha N. (2012), "Gender Dimensions, Employment Trends in India, 1993-94 to 2009-10," Economic and Political Weekly, Vol.46, No.43, pp. 118-126.
Mazumdar D. (2010), “Decreasing poverty and increasing inequality in India” in Tackling Inequalities in Brazil, China, India and South Africa, The Role of Labour Market and Social Policies, Paris, OECD, pp 157–207.
Mazumdar, Surajit (2010), Indian Capitalism, A Case That Doesn’t Fit?”, Working Paper WP2010/10, New Delhi, ISID.
Mazumdar, Dipak and Sandip Sarkar (2008), Globalization, Labour Markets and Inequality in India, Abingdon, Routledge.
Mazumdar, Dipak and Sandip Sarkar (2008), “Dualism in Indian Manufacturing, Causes and consequences” in Mazumdar and Sarkar (ed.) (2008) Globalisation, Labour Markets and Inequality in India, New York, Routledge.
Mazumdar I. and Neetha N. (2011), “Gender Dimensions, Employment Trends in India, 1993-94 to 2009-10”, Economic and Political Weekly, Vol. 46, No. 43, pp.118-126.
Mazumdar V., Sharma K., Buch N. and C.P. Sujaya, (2001), Gender and Governance, a country paper, India, New Delhi, Centre for Women Development Studies.
Mearns, Robin (1999), “Access to Land in Rural India, Policy Issues and Options”, Working Paper 2123, World Bank Policy Research, May 1999.
Mehrotra, S., Gandhi, A. and Bimal K Sahoo (2013), “Estimating India’s Skill Gap on a Realistic Basis for 2022”, Economic and Political Weekly, Vol.48, No. 13
Mehrotra, S. (2008), “NREG Two Years On, Where Do We Go from Here?”, Economic and Political Weekly, Vol. 43, No. 31
Menon N. and van der Meulen Rodgers Y. (2009), "Gender Inequality in the Labor Market During Economic Transition, Changes in India’s Manufacturing Sector" in Kanbur R. and Svejnar J. (Eds), Labor Markets in Transition and Developing Economies, Emerging Policy and Analytical Issues, London and New York, Routledge Press, pp.341-363.
Mishra S.K. and Pandey P.K. (2012), Women Status and Empowerment in India, New Delhi, New Century Publications.
Mishra, B B. (1961), The Indian Middle Class: Their Growth in Modern Times, London: Oxford University Press. Mohanty, M (2006), ‘Social Inequality, Labour Market Dynamics and the Need for
Expanding Reservation, Some Issues for Consideration’, WPS No 594, Working Paper Series, Indian Institute of Management, Calcutta.
Mohanty, M (2006), Social Inequality, Labour Market Dynamics and Reservation, Economic and Political Weekly, Vol. 41, No. 35, pp. 3777-3789.
Mohaptra, P. P. (2005), “Regulated Informality, Legal Construction of Labour Relations in Colonial India”, in Lucassen and Bhattacharya (ed.), Workers in the Informal Sector, Studies in Labour History, 1800 – 2000, New Delhi.
Montek Ahluwalia (2011), “Prospects and Policy Challenges in the Twelfth Plan”, Economic and Political Weekly, Vol. 46, No. 21, pp. 88-105.
Morris, M. D. (1955), “Labor discipline, trade-unions and the State in India”, The Journal of Political Economy, Vol. 63, No. 4, pp. 293-308.
209
Morris, D. Morris (1982), “The Growth of the Large-Scale Industry to 1947” in Dharma Kumar (ed.) (1982), The Cambridge Economic History of India Volume II (1757- 1970).
Motiram, Sripad and Vamsi Vakulabharanam (2011), “Indian inequality, Patterns and Changes, 1993-2010”, in IGIDR, India Development Report 2011, Mumbai.
Mitchell, R., Mahy, P., & Gahan, P. (2012), “The Evolution of Labour Law in India, An Overview and Commentary on Regulatory Objectives and Development”, Working Paper No. 18, Monash University, Workplace and Corporate Law Research Group.
Menon, V.K.R. (1956), “The Influence of International Labour Conventions on Indian Labour Legislations”, International Labour Review, No. 551, p. 555.
Maurya N.K. and Vaishampayan J.V. (2012),"Growth and Structural Changes in India's Industrial Sector", International Journal of Economics, Volume 6, Number 2, December 2012, pp. 321-33.
National Institute of Public Cooperation and Child Development (2010), “Statistics of Women in India 2010,” New Delhi.
Nayyar, Gaurav (2008), “Economic growth and regional inequality in India”, Economic and Political Weekly, Vol. 43, No. 6, pp. 58-67, February 9.
Nagaraj, R. (2012), Growth, Inequality And Social Development In India, Is Inclusive Growth Possible?, Basingstoke, Palgrave Macmillan.
Nagaraj, R. (2012), “Development Strategies and Poverty Reduction” in Nagaraj, R. (Eds) in Growth, Inequality and Social Development in India, Is Inclusive Growth Possible? Palgrave Macmillan, Basingstoke
Nagaraj, R. (2004), “Fall in organised manufacturing employment, A brief note”, Economic and Political Weekly, pp. 3387-3390.
Nambissan, Geetha B. (2007), Exclusion and Education: Perspectives and Experiences of Dalit Children, Institute of Dalit Studies.
NCEUS (2009), The Challenge of employment in India, An Informal Economy Perspective, National Commission for Enterprises in the Unorganized Sector, Vol. 1, Main Report, New Delhi.
Neelakantan, M. (1994), “Jawahar Rozgar Yojana, An Assessment through Concurrent Evaluation”, Economic and Political Weekly, Vol. 29, No. 49
Neetha N. (2013), Inequalities reinforced? Social groups, gender and employment, Occasional Paper No. 59, New Delhi, Centre for Women’s Development Studies.
Neetha, N. (2009), “Contours of Domestic Service, Characteristics, Work Relations and Regulations”, The Indian Journal of Labour Economics, Vol. 52, No. 3, pp. 489-506
Oberoi, A.S. and Singh, Manmohan H.K. (1980): “Migration Flows in Punjab’s Green Revolution Belt”, Economic and Political Weekly, Vol. 15, No. 13
Pais, Jesim (2014), Growth and structure of the services sector in India, Working Paper No. 160, New Delhi, Institute for Studies in Industrial Development.
Pal M. (2009), “Why Rethink Rotation of Reservation in Panchayats” in Economic and Political Weekly, Vol. 44, No.23, June 6, pp. 70-71.
Pal, Parthapratim and Jayati Ghosh (2007), Inequality in India, A Survey of Recent Trends, UN-DESA Working Paper No. 45. New York.
Pandit, M.L. (1978), “Some Less Known Factors behind Recent Industrial Change in Punjab and Haryana”, Economic and Political Weekly
Pankaj, Ashok K and Ajit K Pandey eds. (2014), Subalternity Exclusion and Social Change in India, Delhi: Cambridge University Press. Pankaj, Ashok, ed. (2012), Right to work and rural India, New Delhi, Sage Publications.
Pankaj, Ashok K. (2007): “Engaging With Discourse on Caste, Class and Politics in India”, South Asia Research, Vol. 27(3): 333–353
210
Pannikar, K. M. (2011), “India’s Educational Policy, From National to Commercial”, Economic and Political Weekly, Vol. 46, No. 17
Papola, T.S. (2013), “Economic Growth and Employment Linkages, the Indian Experience”, Working Paper 2013/01, New Delhi, Institute for Studies in Industrial Development.
Papola, T.S. (2013b), Employment in India’s Economic Development, Approaches, Policies and Performance, New Delhi, Institute for Studies in Industrial Development.
Papola, T.S. (2012), Structural Changes in the Indian Economy, Emerging Patterns and Implications, Working Paper 2012/02, New Delhi, Institute for Studies in Industrial Development.
Papola T.S. and Sahu P.P. (2012), Growth and Employment Structure in India, Long-Term and Post-Reform Performance and the Emerging Challenge, ISID Working Paper, p.84
Papola T.S., Maurya N. and Jena N. (2011), Inter-Regional Disparities in Industrial Growth and Structure, ISID Working Paper, p. 92
Papola, T.S. (2012), Labour Market Segmentation in India, Role of Regulation and Reforms, Presented as a Country Case Study on Labour Market Segmentation for Global research Project on Employment and the Quality of Jobs, Geneva, International Labour Organisation.
Papola, T.S. (1994), “Rural Non-Farm Employment, An Assessment of Recent Trends” in L.K. Deshpande and Gerry Rodgers (eds.), The Indian labour market and economic structural change, New Delhi, B.R.Publishing Corporation.
Parthasarthy, Suhrith (2014), “The Politics of Quota and Merit”, The Hindu, April 16th, New Delhi Edition, pp.8
Paul, Satya (1989), “Green Revolution and Income Distribution among Farm Families in Haryana (1969-70 to 1982-83)”, Economic and Political Weekly
Paul Satya (1990), “Green Revolution and Poverty among Farm Families in Haryana (1969-70 to 1982-83)”, Economic and Political Weekly
Piketty, Thomas (2014), Capital in the 21st Century, Cambridge, Mass., Harvard University Press.
Pradeep, D. (2012), “Gender Differences in Social Capital and Job Search Methods in the Information Technology Industry in Bangalore”, The Indian Journal of Labour Economics, Vol. 55, No. 3, pp. 501-517.
Qureshi, K., Varghese, V.J. et al (2012), “Migration, Transnationalism, and Ambivalence: The Punjab–United Kingdom Linkage” in PirkkoPitkänen, Ahmet Içduygu and DenizSert (eds) Migration and Transformation: Multi-Level Analysis of Migrant Transnationalism, Springer, Hiedelberg.
Radhakrishnan, P. (2005), “Job quotas in the Private Sector” in Sukhadeo Thorat, Arayama, Prashant Negi (Eds.), Reservation and Private Sector, Quest for Equal Opportunity and Growth
Raghavan, J.V. (2003), “Education Planning” in Jandhyala B. G. Tilak (Eds.) India in Education, Society and Development, National Institute of Education Planning and Administration
Rajaraman, I. (1977), “Growth and poverty in rural areas of the Indian state of Punjab” in Poverty and Landlessness in rural Asia, ILO, Geneva.
Ramachandran, Vimla and Aarti Saihjee (2002), “The New Segregation, Reflections on Gender and Equity in Primary Education”, Economic and Political Weekly, Vol. 37, No. 17
Ramachandran, Vimla (1999), “Adult Education, A Tale of Empowerment Denied”, Economic and Political Weekly, Vol. 34, No. 15
Ramaswamy, K V (2007), “Regional Dimension of Growth and Employment”, Economic and Political Weekly, Vol. 42, No. 49, pp.47-56.
211
Ramaswamy, K.V. (1999), “The search for flexibility in Indian manufacturing, New evidence on outsourcing activities”, Economic and Political Weekly, Vol. 34, pp. 363-368.
Rao, S.R. (2010), History of Indian Labour Unions, Retrieved from, http,//www.citeman.com/10985-history-of-indian-labor-unions.html, last accessed on 16th April, 2014.
Rao, M S A (1992), Urban Sociology in India, Hyderabad: Orient Longman Rao, V.M. and Deshpande, R. S. (1986), “Agricultural Growth in India, A review of
experiences and prospects” Economic and Political Weekly, Vol. 21, Nos. 38 and 39, Review of Agriculture, September 20-27, 1986.
Ratnam, C.S.V. (1999), “Trade Unions in The Informal Sector, Finding Their Bearings - India Country Paper”, Labour Education 1999/3, No. 116, ILO Bureau for Workers’ Activities.
Rawal, V. (2008), “Ownership Holdings of Land in Rural India, Putting the Record Straight”, Economic and Political Weekly, Vol. 43, No. 10, pp. 43-47.
Rodrik, Dani and Arvind Subramanian (2005), From “Hindu Growth” to Productivity Surge, The Mystery of the Indian Growth Transition”, Working Paper WP/04/77, Washington, D.C., IMF.
Roy, Satyaki (2011), High Non-wage Employment in India, Revisiting the Paradox in Capitalist Development, Working Paper 2011/05, New Delhi, Institute for Studies in Industrial Development.
Roy, Tirthankar (2007), “Globalisation, factor prices and poverty in colonial India”, Australian Economic History Review, Volume 47, No. 1, March 2007, p. 86.
Roy, Tirthankar (2005), “Agricultural labour and economic transition in colonial India: Lessons from wage data”. Paper for the Economic History Seminar, Department of Economics, Yale University. Roy Tirthankar (2002), "Economic History and Modern India – Redefining the Link", Journal
of Economic Perspectives, Vol. 16, No.3, pp 109-130 Roy, Tirthankar (2000), The Economic History of India, 1857-1947, Delhi, Oxford University Press. Sabarwal, Nidhi Sadana (2007), Dalit Children in Rural India: Issues Related To Exclusion and Deprivation, Institute of Dalit Studies. Sachs, Jeffrey, Bajpai, Nirupam, and Ramaiah, Ananthi (2002), Understanding Regional
Economic Growth in India, Working Paper No 88, Centre for International Development, Harvard University.
Sahoo, Chandan Kumar, Tripathy, Santosh Kumar ( 2004), “Industrial Relations, Trade Unions and Labour Legislation by P. R. N. Sinha; Indu Bala Sinha”, Indian Journal of Industrial Relations, Vol. 39, No. 4, April, 2004, pp. 570-574.
Sankaran K. and Madhav R. (2011), Gender equality and social dialogue in India, Industrial and Employment Relations Department and Bureau for Gender Equality, Working Paper 1/2011, Geneva, International Labour Office.
Sankaran, Kamala (2007), Labour Laws in South Asia, The Need for an Inclusive Approach, International Institute for Labour Studies, Geneva, International Labour Organization.
Sankaran, Kamala (2012), Making Labour Laws Work, The Challenges Ahead, The Long Road to Social Security, No. 7, Hague, Hivos Knowledge Programme.
Sanyal, S.K. (1988), “Trends in landholding and poverty in rural India,” in T N Srinivasan and Pranab K Bardhan (eds) Rural Poverty in South Asia, Columbia University Press, New York.
Sarkar, Sandip and Mehta, B.S. (2010), “Global Production Networks and Decent Work in India’s Information Technology and IT-Enabled Services Sector, Recent Experience and Trends”, in Posthuma, Anne and Nathan, Dev (eds.), Economic and Social Implications of Global Production Networks in India, New Delhi, Oxford University Press.
212

Sarkar, Sandip and Balwant Mehta (2010), “Income Inequality in India, Pre and Post – Reform Period”, Economic and Political Weekly, 11 September, Vol. 45, No.37.
Sathe D., Klasen S., Priebe J. and M. Biniwale (2013), “Can the female Sarpanch deliver?”, Economic and Political Weekly, Vol. 48, No.11. pp. 50-57.
Seal, K. C. (1965), “A Critical Review of Research and Literature on Wages in India”, Indian Journal of Industrial Relations, Vol. 1, No. 1, pp. 41-69.
Sen, Kunal (2008), Trade Policy, Inequality and Performance in Indian Manufacturing, London, Routledge.
Sen A. (1990), "More Than 100 Million Women Are Missing", New York Review of Books , Vol. 37, No. 20, 20 December.
Sengupta, A. K. (2007), Report On Conditions Of Work And Promotion Of Livelihoods In The Unorganised Sector, National Commission for Enterprises in the Unorganised Sector, Government of India, New Delhi.
Shankar, Vijay P.S. and Mihir Shah (2012), “Rethinking Reforms, A New Vision for the Social Sector in India” in Nagaraj, R. (Eds), Growth, Inequality and Social Development in India, Is Inclusive Growth Possible? Palgrave Macmillan, Basingstoke
Shanmugam (2012), “Monitor able indicators and performance, Tamil Nadu”, Madras School of economics publications. January 2012. Available at, http,//www.mse.ac.in/pub/Monograph%20-%2017.pdf, last accessed on February 28, 2014.
Sharma K., Sujaya C.P. (eds.) and V. Mazumdar (General editor), (2012a), Towards Equality, Report of the Committee on the Status of Women in India, New Delhi, Centre for Women’s Development Studies.
Sharma K. (ed.) and Mazumdar V. (General editor), (2012b), Changing the terms of the discourse, Gender, equality and the Indian state, New Delhi, Centre for Women Development Studies.
Sharma, Alakh N. and Gupta, Shaibal (eds) (1987), Bihar, Stagnation or Growth, Patna, Spectrum.
Sharma, K.L. (1980), Essays on Social Stratification. Jaipur: Rawat. Sheth, N.R. (2001), “Trade Unions in Word and Deed”, Indian Journal of Industrial
Relations, Vol. 37, No. 2 Oct., 2001, pp. 280-284. Sheth, D.L. (1999): “Secularisation of Caste and Making of New Middle Class”, Economic and Political Weekly, Vol. 34, No. 34–35, pp. 2502–10. Shetty, S. L. (2003), “Growth of SDP and Structural Changes in State Economies, Interstate
Comparisons”, Economic and Political Weekly, Vol. 39, No 49, pp 5189-5200. Shramshakti (1988), Report of the National Commission on self employed women and women
in the informal sector, Retrieved from,http,//indialabourarchives.org/usr/local/gsdl/cgi-bin/library?e=d-000-00---0ncl-ncl-01-0-0-0prompt-14-Document---0-0l--1-en-50---20-preferences---001-001-1-0isoZz-8859Zz-1-1&a=d&c=ncl&cl=CL2.16&d=HASH833421cbbc416806cb89b5, last accessed on 11
February 2014. Sidhu, H.S. (1988): “Wage Determination in the Rural Labour Market: The case of Punjab and
Haryana”, Economic and Political Weekly, Vol. 23, No. 52-53 Singer, Milton and Cohn, Bernard (1968), Structure and Change in Indian Societies, Chicago: Aldine. Singh A. (2008), The Past, Present and Future of Industrial Policy in India, Adapting to the
Changing Domestic and International Environment, Working Paper No. 376, Centre for Business Research, University of Cambridge, p.34
213
Singh, Lakhwinder (2010), “Post Reform Economic Development in Punjab, Constraints and Remedies” MPRA Paper No. 2674. Accessed Online. Available at http,//mpra.ub.uni-muenchen.de/26741/
Singh, L. and Sukhpal Singh (2002), “Deceleration of Economic Growth in Punjab, Evidence, Explanation, and a Way-out”, Economic and Political Weekly
Singh, Amrik (1999), “Educational Imbalance in India, Transition from School to College”, Economic and Political Weekly, Vol. 34, No. 26.
Singh, Yogendra (1986), Modernization of Indian Tradition, Jaipur: Rawat. Sidhu, H.S. (1988), “Wage Determination in the Rural Labour Market, The case of Punjab
and Haryana”, Economic and Political Weekly Sivadasan J. (2006), Note on Regulatory regime in India, 1947 to 1998, retrieved from:
http,//webuser.bus.umich.edu/jagadees/other/indmfg_data/Reg_history_india.pdf Sivananthiran, A., and Ratnam, C. V. (2005), Informal Economy, The Growing Challenge for
Labour Administration,Geneva, International Labour Office. Srinivasan, T.N. (2007), “Development Strategy, The State and Agriculture since
Independence” Available at, http,//www.igidr.ac.in/conf/money/mfc_10/TN%20Srinivasan_Developmt_Strategy-corrected_version.pdf , last accessed on 25th February 2014.
Srinivasan, K. (2004): “Population and Development in India since Independence: An Overview”, Population and Development, Vol. 50.
Srinivas, M.N. (ed.) (1996), Caste: It’s Twentieth Century Avata, New Delhi: Viking Penguin. Srinivas, M.N. (1962), Caste in Modern India and Other Essays, Bombay: Asia Publishing House. Srivastava, Ravi and Richa Singh (2006), “Rural wages during the 1990s, A Re-estimation”,
Economic and Political Weekly, Vol. 41, No. 38, pp. 4053-4062. Srivastava, D.K. (2006), “Trade Union Response to Declining Membership Base, Best
Practices from Mumbai Based Trade Unions”, Indian Journal of Industrial Relations, Vol. 41, No. 4 Apr., 2006, pp. 355-374.
Subbarao, K. (1985), “Regional Variations in Impact of Anti-Poverty Programmes, A Review of Evidence”, Economic and Political Weekly, Vol. 20, No. 43
Subramanian, K.N. (1977), Wages in India, New Delhi, Tata McGraw – Hill Publishing Company Limited.
Sudarshan R.M. (2013), “Women workers, Addressing constraints to work,”, The Indian Journal of Industrial Relations, Vol.48, No. 3, pp. 428-437.
Suryanarayana, M.H. (2012), “Economic development and inequalities”, in Nagaraj, R. (ed.) (2012), Growth, inequality and social development in India, Is inclusive growth possible?, Basingstoke, Palgrave Macmillan.
Suryanarayana, M.H. and Mousumi Das (2014), “How inclusive is India’s Reform (ed) growth?”, Economic and Political Weekly, Vol. 49, No. 6, pp. 44-52.
Sundar, K. S. (2008), “Trade unions in India, From Politics of Fragmentation to Politics of Expansion and Integration”, Trade Unions in Asia, Routledge.
Sundar, K. S. (2006), “Trade Unions and the New Challenges, One Step Forward and Two Steps Backward”, Indian Journal of Labour Economics, Vol. 49, No. 4, pp. 895-910.
Teltumbe, Anand (2010), “One more Reservation”, Economic and Political Weekly Vol. 45, No. 14
Teltumbe, Anand (2009), “Reservations within Reservations, A solution”, Economic and Political Weekly Vol. 44, No. 41-42
214

Thakur B., Gupta R. and Singh R. (2012), “Changing Face of India’s Industrial Policy, A Look,” International Journal of Scientific and Research Publications, Volume 2, Issue 12, pp.1-7.
The Hindu (2012), “Remembering the precursor of Dravidian movement”, The Hindu 20 May 2012, Viewed on 18 February 2014, http,//www.thehindu.com/todays-paper/tp-national/tp- tamilnadu/article3438425.ece.
Tiwari N (2009), “Rethinking the rotation terms of reservation in Panchayats” in Economic and Political Weekly, Vol. 44, No.5, January 31, pp. 23-25.
The Minimum Wages Act, 1948. Act No. 11 of 1948 [15th March, 1948] Thorat, Sukhadeo and Attewell, Paul (2010) The Legacy of Social Exclusion, A
correspondence Study of Job Discrimination in India’s Urban Private Sector in Sukhadeo Thorat and Katherine Newman (Eds.) Blocked by Caste, Economic Discrimination in Modern India, New Delhi, Oxford University Press
Thorat, S. (2008), “Labour Market Discrimination, Concept, Forms and Remedies in the Indian Situation”, The Indian Journal of Labour Economics, Vol. 51, No. 1, pp. 31-52.
Thorat, Sukhadeo and Senapati, Chittaranjan (2007), “Reservation in Employment, Education and Legislature – Status and Emerging Issues”, Working Paper Series, Indian Institute of Dalit Studies Vol. II No. 7
Thorat, Sukhadeo and Senapati, Chittaranjan (2006), “Reservation Policy in India – Dimensions and Issues”, Working Paper Series, Indian Institute of Dalit Studies, Vol. I No. 2
Tilak, Jhandyala B.G. (2012), “Higher Education Policy in India in Transition”, Economic and Political Weekly, Vol. 47, No. 13
Tilak, Jhandyala B.G. (2010), “Neither Vision nor Policy for Education”, Economic and Political Weekly
Tilak, Jhandyala B.G. (2009), “Universalizing Elementary Education, A Review of Progress, Policies and Problems”, in Rustagi, Preet (Eds), Concerns, Conflicts and Cohesions, Universalisation of Elementary Education in India, Oxford University Press, New Delhi.
Unni, J. (2001), “Gender and Informality in Labour Markets in South Asia”, Economic and Political Weekly, Vol. 36, No. 26, pp. 2360 – 2377.
Vaidyanathan, A. (1983), “The Indian Economy since Independence (1947-70)” in The Cambridge Economic History Of India, Volume II, General Editors; Dharma Kumar and Tapan Raychaudhuri, Cambridge, Cambridge University Press.
Vaidyanathan, A. (1982), “The Indian Economy since Independence (1947-1970)” in Dharma Kumar (ed) (1982) Cambridge Economic History of India Volume II (1757-1970), New Delhi, Orient Longman.
Vakulabharanam, Vamsi (2010), “Does class matter? Class structure and worsening inequality in India”, Economic and Political Weekly, Vol. 45, No. 29, pp. 67-76, July 17, 2010.
Venkataratnam, C.S. (1996), Industrial Relations in India, Paper presented in a Seminar on “Labour Market and Industrial Relations in South Asia, Emerging Issues and Policy Options”, New Delhi, India International Centre.
Venkataratnam, C.S.(1994), “Changing Role of Trade Unions in a Period of Transition”, In Labour and Unions in a Period of Transition, Sinha, P., Venkat Ratnam, C.S. and Botterweck, G., New Delhi, Friedrich Ebert Stiftung.
Venugopal, K R. (2012), The Integrated Child Development Services: A Flagship Adrift, Delhi: Konark Publishers Pvt Ltd. Vijay Shankar, P.S. and Mihir Shah (2012), “Rethinking reforms, A new vision for the social
sector in India” in Nagaraj, R. (ed.), Growth, inequality and social development in India, Is inclusive growth possible?, Basingstoke, Palgrave Macmillan.
215
Vijayabaskar (2011), “Global Crises, Welfare Provision and Coping Strategies of Labour in Tiruppur”, Economic and Political Weekly, Vol.46, No. 22, pp. 38-46.
Vijayabaskar (2010), “Saving Agricultural Labour from Agriculture, SEZs and Politics of Silence in Tamil Nadu”, Economic and Political Weekly, Vol. 45, No. 6, pp. 36-43.
Visaria, Leela and Visaria, Pravin (1982), “Population”, in Dharma Kumar (ed.) (1982) Cambridge Economic History of India Volume II (1757- 1970), New Delhi, Orient Longman.
Wadhwa, Willima (2009), “Are Private Schools Really Performing Better than Government Schools”, Annual Status of Education Report (Rural) 2009 Provisional, Pratham Resource Centre, Mumbai.
Williamson, Jeffrey G. (1965): “Regional Inequality and the Process of National Development, A Description of the Patterns,” Economic Development and Cultural Change, Vol. 13, No. 4, Part 2, July, pp. 1-84.
Women’s Environment and Development Organisation (2006), Women and Local Self Governance, In an Indian Context, available at, http,//www.google.co.in/url?sa=t&rct=j&q=&esrc=s&source=web&cd=1&ved=0CCwQFjAA&url=http%3A%2F%2Fwww.wedo.org%2Fwp-content%2Fuploads%2Fwomen-local-self-governance-in-indian-context.doc&ei=3E9WU8PpOMfk8AX59oL4Bg&usg=AFQjCNHodAx3MaDwX6ll2Unf9wX-N-pzOQ&sig2=Y_OjYIxxy1BWto7WEBWDJw&bvm=bv.65177938,d.dGc
World Bank (2010), India’s Employment Challenge, Creating Jobs, Helping Workers, New Delhi, Oxford University Press.
216