Characterizations of long-run producer optima and the short-run
Upload
khangminh22Category
view
0download
0
Working Futures 2017-2027: Long-run labour market and skills projections for the UK Main report
February 2020
Rob Wilson & Sally-Anne Barnes – Institute for Employment Research, University of Warwick Mike May-Gillings, Shyamoli Patel & Ha Bui – Cambridge Econometrics
Preface and acknowledgements The authors are grateful to the Department for Education for commissioning this research. Special thanks are due to Shivali Chotai, Patrick Vanderpant and Eleanor Adamiw from the Skills Policy Analysis team at the Department for Education.
This report has been a team effort, involving a large number of people. Mike May-Gillings, Shyamoli Patel and Ha Bui from Cambridge Econometrics, together with Luke Bosworth, Rosie Day, Peter Millar and David Owen from the Institute for Employment Research, all made important contributions to the data analysis and processing. Derek Bosworth was responsible for developing key elements of the modelling of the supply of qualified people. The responsibility for the views expressed and for any remaining errors lies with the authors.
The opinions expressed in this report are those of the authors and do not necessarily reflect the views of the Department. The projections should be regarded as indicative of likely developments for the economy and the labour market, rather than precise forecasts of what will inevitably happen. Many of the trends presented are resilient and are not sensitive to modest unanticipated shocks. They present a view of medium to longer-term trends for the UK economy and labour market (5-10 years ahead). The results should be regarded as a robust benchmark for debate and used in conjunction with a variety of other sources of Labour Market Information.
Contents Executive summary i
Working Futures: Long-run labour market and skills projections for the UK i
Key findings ii
1. Introduction and background 1
1.1. Background 1
1.2. Rationale for the Working Futures projections 2
1.3. Reviews of the need for skills forecasts 3
1.4. Aims and objectives of the Working Futures projections 5
1.5. General methodological approach and data sources 6
1.6. Outline and structure of the report 7
2. Macroeconomic and general labour market context 8
2.1. Introduction 8
2.2. Global prospects 8
2.3. Uncertainties related to Brexit 9
2.4. UK macroeconomic prospects 10
2.5. Macroeconomic uncertainties 12
2.5.1. Emerging markets 12
2.5.2. The strength of the Eurozone recovery 12
2.5.3. Macroeconomic uncertainties associated with Brexit 13
2.5.4. Analyses of the Macroeconomic uncertainties associated with Brexit 16
2.5.5. Possible sectoral impacts of Brexit 22
2.5.6. Persistent low productivity 25
2.5.7. UK deficit reduction measures 25
2.5.8. UK house prices 25
2.6. UK labour market prospects 26
2.6.1. Population and the labour force 26
2.6.2. Employment 30
2.6.3. Employment by gender and employment status 32
2.6.4. Claimant Count and ILO Unemployment 36
3. Sectoral output and employment prospects 37
3.1. General prospects 38
3.1.1. Output 38
3.1.2. Employment 41
3.2. Prospects by broad sector 46
3.2.1. Primary sector and utilities 46
3.2.2. Manufacturing 49
3.2.3. Construction 52
3.2.4. Trade, accommodation and transport 55
3.2.5. Business and other services 58
3.2.6. Public administration, health and education (or non-marketed services) 61
4. Changing occupational structure and replacement demands 65
4.1. Introduction and general approach 66
4.2. Drivers of occupational change 67
4.3. Changes for broad occupational groups: History and projections 70
4.3.1. Latest historical developments 70
4.3.2. Projections to 2027 72
4.4. Occupational trends by gender / employment status 85
4.4.1. Gender 85
4.4.2. Employment status 85
4.5. Replacement demands 86
4.5.1. Measuring replacement demands 86
4.5.2. Estimates of replacement demands 87
4.6. More detailed occupational projections (SOC sub-major groups) 90
4.7. Components of occupational change 95
4.8. Detailed occupational changes within industries 103
5. Implications for qualifications 106
5.1. Introduction and general approach 106
5.1.1. Modelling the demand for and supply of qualifications 109
5.2. Supply trends 111
5.3. Demand for formal qualifications 117
5.4. Reconciliation, imbalances and mismatches 123
5.5. Concluding remarks 125
Glossary 126

Bibliography 128
List of figures Figure 2.1: Comparison of the impact of Brexit (WTO scenario / No Deal) ..................... 21
Figure 2.2: UK Population, labour force and unemployment profiles, 2000-2027 (000s) 27
Figure 2.3: Changes in key labour market indicators for the UK, 2017-2027 (000s) ....... 29
Figure 2.4: Employment status in the UK, 2017 (000s) .................................................. 34
Figure 2.5: UK Employment profiles by gender and employment status 1981-2027 (000s) ........................................................................................................................................ 34
Figure 2.6: Changes in employment in the UK by employment status, 2017-2027 (000s) ........................................................................................................................................ 35
Figure 2.7: Employment status in the UK, 2017 (% shares) ........................................... 35
Figure 3.1: UK Output profiles by broad sector, 1990-2027 (£ millions) ......................... 38
Figure 3.2: UK Output growth by broad sector, 2007-2027 (% per annum) .................... 39
Figure 3.3: UK Employment profiles by broad sector, 1990-2027 (000s) ....................... 42
Figure 3.4: UK Employment growth by broad sector, 2007-2027 (% per annum) ........... 43
Figure 3.5: UK Employment growth by broad sector, 2007-2027 (000s) ........................ 43
Figure 3.6: Sector shares in Primary sector and utilities, 1997-2027 .............................. 47
Figure 3.7: Sector shares in Manufacturing, 1997-2027 ................................................. 50
Figure 3.8: Sector Shares in Construction, 1997-2027 ................................................... 53
Figure 3.9: Sector shares in Trade, accommodation and transport, 1997-2027 ............. 55
Figure 3.10: Sector Shares in Business and other services, 1997-2027 ........................ 59
Figure 3.11: Sector Shares in Public administration, health and education, 1997-2007 . 62
Figure 4.1: Changes in occupational employment structure (000s), 2007-2027 ............. 74
Figure 4.2: Occupational trends (000s), 1997-2027 ........................................................ 75
Figure 4.3: Occupational trends (% shares), 1997-2027 ................................................ 76
Figure 4.4: Occupational change by gender, Total Employment (000s), 2017-2027 ...... 80
Figure 4.5: Occupational change by employment status, Males & Females (000s), 2017-2027 ................................................................................................................................ 81
Figure 4.6: Occupational change by employment status, Males (000s), 2017-2027 ....... 82
Figure 4.7: Occupational change by employment status, Females (000s), 2017-2027 .. 83
Figure 4.8: Net Requirements by SOC2000 Sub-major Group, 2017-2027 .................... 94
Figure 4.9: Detailed changes by occupation (000s), 2007-2017, 2017-2027 .................. 98
Figure 4.10: Occupational change across the 22 Industries, 2017-2027 ...................... 105
Figure 5.1: Levels within Regulated Qualifications Framework (RQF) .......................... 108
Figure 5.2: Changing patterns of qualification within the labour force (16+, % of total) 111
Figure 5.3: Changing qualification pattern of employment (workplace / jobs, % of total) ...................................................................................................................................... 112
Figure 5.4: Qualification profile of workforce, 2017-2027 .............................................. 119
Figure 5.5: Qualification pattern of employment by occupation (%), 2017 .................... 120
Figure 5.6: Changing qualification pattern of employment by sector (%), 2017-2027 ... 121
Figure 5.7: Spatial variations in employment patterns by qualification, 2017-2027 ....... 122
Figure 5.8: Reconciling demand and supply in 2027 – increasing qualification intensity ...................................................................................................................................... 124
List of tables Table 2.1: Macroeconomic Indicators for the UK ............................................................ 11
Table 2.2: Percentage difference in GDP level from baseline ......................................... 21
Table 2.3: Population and labour force in the UK ........................................................... 28
Table 2.4: Employment status, 2017-2027 ..................................................................... 33
Table 3.1: Output by broad sector, 2007-2027 ............................................................... 40
Table 3.2: Employment by broad sector, 2007-2027 ...................................................... 45
Table 3.3: Industry profile – Primary sector and utilities ................................................. 46
Table 3.4: Trends in output and employment 2017-2027 – Primary sector and utilities .. 46
Table 3.5: Industry profile – Manufacturing ..................................................................... 49
Table 3.6: Trends in output and employment 2017-2027 – Manufacturing ..................... 49
Table 3.7: Industry profile – Construction ....................................................................... 52
Table 3.8: Trends in output and employment 2017-2027 – Construction ....................... 52
Table 3.9: Industry profile – Trade, accommodation and transport ................................. 55
Table 3.10: Trends in output and employment 2017-2027 – Trade, accommodation and transport .......................................................................................................................... 55
Table 3.11: Industry profile – Business and other services ............................................. 58
Table 3.12: Trends in output and employment 2017-2027 – Business and other services ........................................................................................................................................ 58
Table 3.13: Industry profile – Public administration, health and education ..................... 61
Table 3.14: Trends in output and employment 2017-2027 – Public administration, health and education ................................................................................................................. 62
Table 4.1: Employment in SOC2010 occupational categories – Major Groups .............. 77
Table 4.2: Females, Occupational categories, SOC2010 – Major Groups ..................... 78
Table 4.3: Males, Occupational categories, SOC2010 – Major Groups .......................... 79
Table 4.4: Changing Composition of Employment by Occupation, 1997-2027 ............... 84
Table 4.5: Expansion and Replacement demand by occupation, 2017-2027 ................. 93
Table 4.6: Total occupational employment, UK: All industry sectors, 2007-2017 ........... 99
Table 4.7: Total occupational employment, UK: All industry sectors, 2017-2027 ......... 101
Table 5.1: Total numbers by qualification (total population 16+, 000s) ......................... 113
Table 5.2: Economically active population by qualification level (16+, 000s) ................ 113
Table 5.3: Unemployed by qualification level (16+, 000s) ............................................. 114
Table 5.4: Unemployment rates by qualification level (%) ............................................ 115
Table 5.5: Share of total unemployment by qualification level (16+, 000s) ................... 115
Table 5.6: Employment by qualification level (residence / heads, 16+, 000s) ............... 116
Table 5.7: Employment by qualification level (workplace / jobs, 000s) ......................... 116
Table 5.8: Changing qualification pattern of employment (workplace / jobs, % of total) 118
List of boxes Box 2.1: Trade, investment and migration assumptions in the Brexit literature .............. 15
Box 2.2: Model-based studies on the expected macroeconomic impacts of Brexit ......... 17
Box 2.3: Discussion by sector ......................................................................................... 23
Box 2.4: Definitions of employment and related labour market indicators ...................... 30
Box 4.1: Replacements demands: definitions and methods ........................................... 89
Box 4.2: Shift-share analysis of occupational change ..................................................... 95
i
Executive summary
Working Futures: Long-run labour market and skills projections for the UK Working Futures 2017-2027 is the latest in a series of quantitative assessments of the employment prospects in the UK labour market over a 10-year horizon. It presents historical trends and future prospects by sector for the UK and its constituent nations and the English regions. The prime focus of Working Futures is on the demand for skills as measured by employment by occupation and qualification, although the supply side is also considered. Its prime objective is to provide useful labour market information that can help to inform policy development and strategy around skills, careers and employment, for both policy makers and a much wider audience. The results are intended to provide a sound statistical foundation for reflection and debate among all those with an interest in the demand for and supply of skills. This includes individuals, employers, education and training providers, as well as the various agencies and departments of government.
Sectoral change is one of the key drivers of the changing demand for skills. The main analysis focuses on broad sectors, but this is built up from a much more detailed picture of change by industry. The projections are based on the use of a multi-sectoral, regional macroeconomic model, combined with occupational, replacement demand and qualification modules. The results take account of the latest official data published by the Office for National Statistics. These data are used to paint a comprehensive and detailed picture of the changing face of the UK economy and labour market. A separate Technical Report (Wilson et al., 20191) provides full details of sources and methods used to produce the results, including information about even more detailed sub-national / sub-regional results.
The future cannot be predicted with precision or certainty. However, all the participants in the labour market make plans for the future. The rationale behind Working Futures is that a comprehensive, systematic, consistent and transparent set of projections can help to inform everyone about the world they are likely to face.
The Working Futures projections are grounded in a forecast of the future macroeconomic and labour market context. This is especially difficult at the present time with all the uncertainties associated with Brexit. The forecast is therefore subject to a number of risks and uncertainties. Most notable among them is the impact of Brexit on barriers to trade and the movement of people.
1 Wilson, R. A., M. May-Gillings, S. Patel and H Bui, (2019). Working Futures 2017-2027: Technical report on sources and methods. Department for Education.
ii
The literature on the possible range of impacts of Brexit on the UK economy suggest a large range of possible scenarios. These depend upon two main factors:
i. the future trading relationship between the UK and the EU and possible impacts on investment patterns (varying across sectors, and dependent on the nature of the transition arrangements and final deal negotiated with the EU); and
ii. migration flows (ranging from a relaxed approach to EU migration to a points-based approach).
At one end of the spectrum, some studies suggest that a possible ‘European Economic Area’ scenario could result in the UK’s GDP being between 1.25% and 11% lower than was expected before the 2016 referendum by 2027.2 At the other end of the spectrum, studies that looked at “no deal” scenarios (reverting to World Trade Organisation (WTO) rules) found that the UK’s GDP could be between 2.7% and 18.5% lower than was expected before the 2016 referendum, with one outlier suggesting that UK GDP could be 4% higher in the longer term.
It is important to emphasise that the view presented here is not the only possible future. It represents a benchmark for debate and reflection that can be used to inform policy development and other choices and decisions. The detailed projections present a carefully considered view of what the future might look like, assuming that past patterns of behaviour and performance are continued over the longer term. The results should be regarded as indicative of general trends and orders of magnitude and are not intended to be prescriptive. If policies and patterns of behaviour are changed then alternative futures can result.
Key findings Working Futures 2017-2027 provides a comprehensive and detailed picture of the UK labour market, focusing on employment prospects for up to 75 industries, 369 occupations, 6 broad qualification levels, gender and employment status.
The latest results indicate:
• Significant increases in the size of the working age population and the economically active workforce but with a slight decline in overall labour market participation rates, reflecting the ageing of the population;
• The labour force (those economically active aged 16+) is set to increase from 32.5 million in 2017 to 34.25 million by 2027 reflecting increases in the size of the population as a whole;
2 Or thereabouts, different studies have different end dates for the scenarios explored, but most are looking around 10 years ahead.
iii
• There is a very slight decline in overall labour market participation rates (of age 16+) from 61.9% to 61.4%, reflecting the ageing of the population;
• Slow but steady output growth, combined with increases in labour productivity, resulting in a modest 0.3% p.a. increase in employment over the 2017-2027 period;
• the total number of jobs is projected to rise by just under a million over the next decade (this net increase is referred to as “expansion demands”);
• “Replacement demands” (arising from the need to replace workers leaving the labour force for retirement and other reasons) mean that the total number of new job openings (also referred to as “total requirements” will be substantially higher (by a factor of over 11 times) than this “expansion demand”;
• Some rebalancing of the economy is expected as a direct consequence of fiscal retrenchment, with a shift away from employment in public sector activities, and a projected decline in total employment in public administration, health and education between 2017 and 2027;
• The UK and European Union will face continuing political and economic uncertainty around the impacts of Brexit, but in the short to medium term, it is anticipated that the UK leaving the European Union will have relatively modest impacts on trade, investment and migration patterns;
• Agricultural output is expected to grow modestly, driven by changing consumer patterns. However, productivity improvements are expected to result in a fall in employment;
• The Manufacturing sector is projected to experience a further decline in its share of total employment as well as its overall level;
• Employment and GVA growth in Construction are expected to slow notably compared to the previous 20 years, partly driven by the skills shortage facing the sector;3
• Output in Trade, accommodation and transport is forecast to grow in line with the economy as a whole, whilst employment in the sector is expected to grow much more slowly than employment in the UK as a whole, driven by a shift in consumer patterns towards online shopping;
• The Business and other services sector is forecast to see a moderation in its rate of growth in output and employment compared with the previous decade, although it is expected that it will still outpace growth in the wider economy as a whole;
3 City & Guilds Group and The Work Foundation (2018). Constructing the future: How the skills needed for success in the workplace are changing. London: City & Guilds. Available from: http://www.theworkfoundation.com/wp-content/uploads/2018/09/CG_Constructing-the-future_A4_32pp_LR_no-crops.pdf
iv
• The Public administration, health and education sector is expected to see some of the strongest growth in both employment and GVA compared with the other broad sectors, supported largely by increased demand for health services as the size of the population increases and it ages;
• The main increases in employment levels are expected to continue to be focused in the private (marketed) parts of the service sector such as Business and other services;
• Around 59% (20.7 million) of all jobs in the UK in 2017 were full-time, while around 28% (9.6 million) were part-time and the remaining 13% (4.5 million) were self-employed;
• Employment status projections show the percentage of workers who are expected to be part-time, full-time, or self-employed by gender is expected to remain broadly stable over the decade to 2027. These patterns are driven principally by the mix of industry sectors in which jobs are forecast to be created or lost;
• While full-time jobs account for about 60% of all jobs going forward, it is expected that most of the newly created jobs will be in part-time roles. Part-time jobs account for just under 30% of all jobs by 2027;
• Following the recovery of the economy after the 2008 financial crisis, self-employment is also expected to fall slightly over the forecast period across most broad sectors, with self-employment accounting for just over 10% of all jobs by 2027;
• Focusing on skills, as measured by occupation and formal qualifications held, the results suggest a continued trend in favour of more highly skilled, white-collar occupations, but with some growth in employment for a number of less skilled occupations too;
• Again, it is important not to focus just on projected changes in employment levels, even in occupations where employment is expected to decline there will often be many new job openings and a need to recruit and train new entrants to replace those leaving the workforce for retirement or other reasons;
• Focusing on the other key measure of skills used in Working Futures, the supply of people holding higher-level qualifications such as degrees is projected to grow steadily to 2027;
• The proportion of the labour force remaining unqualified is expected to represent only a small minority by 2027;
• Measuring the demand for formal qualifications is more difficult, but the number of jobs in occupations typically requiring a high-level qualification is expected to continue to grow, albeit more slowly than over the previous decade;
v
• It is projected that the supply of highly qualified people will grow more quickly than demand for such qualifications, as implied by projections of the patterns of employment by qualification level within industries and occupations;
• This results in an increase in qualification intensity within most occupations, especially those that have not previously employed many people with higher-level qualifications (there is greatest scope for increases in such areas (rather than in those occupations in which the workforce is already highly qualified, such as professionals));
• This does not necessarily indicate an excess supply of such qualifications; in many occupations, the nature of jobs is changing, making higher qualifications a necessary requirement for those jobs.
The overall outlook for changing employment levels and patterns by sector, occupation, qualification and geographical area show many similarities to those set out in the previous set of Working Futures projections. Thus despite the uncertainties associated with Brexit many of the underlying trends regarding skills remain unchanged.

1
1. Introduction and background
1.1. Background Since the previous Working Futures report (Wilson et al., 2016a4), the UK has voted to leave the EU following the EU referendum in June 2016. The official withdrawal process began when Article 50 was triggered on 29 March 2017. The impact on the UK economy of the vote to leave the EU is likely to be substantial although the magnitude of these effects remains inherently uncertain. They depend on the eventual form of the relationship of the UK with the EU post-Brexit. This will affect various aspects of the UK economic environment across a range of dimensions such as trade, migration, and regulation.
The report focuses on three main questions:
• Where will the jobs of the future be concentrated in the UK?
4 Ibid.
Key messages
Working Futures 2017-2027 is the 7th in series of assessments of UK labour market prospects carried out every 2-3 years since 2002.
The rationale for carrying out such work is to inform participants in the UK labour market about the world they may face and to stimulate reflection and debate.
The approach to developing a quantitative view of the future labour market involves the use of a detailed multi-sectoral, multiregional econometric model, based on official data.
The results paint a comprehensive, consistent and very detailed picture of employment prospects in the UK, covering industries, occupations, qualifications, gender and employment status, including results for the devolved nations and the English regions.
The results presented provide a benchmark for debate and thinking about the future. They should not be regarded as precise forecasts of what will necessarily happen. Rather, they indicate a likely future, given a continuation of past patterns of behaviour and performance. The results should be used in conjunction with a variety of other sources of labour market information.
The forecast is subject to a number of risks and uncertainties. Most notable among them is the impact of Brexit on barriers to trade and the movement of people. An orderly transition is assumed.
2
• What are the implications of this for skill demand, as measured by occupation and qualification?
• How does this compare with developments on the supply of skills?
Section 2 explores the remaining uncertainties and sets out the assumptions underlying this new set of projections for the UK.
Section 3 focuses on prospects for the different sectors within the UK economy, considering the contributions they are likely to make in generating growth and employment, and the extent Brexit might affect this. It also considers the supply side, developing projections of labour supply by age and gender, taking into consideration the impact Brexit could have on prospects for inward migration, particularly from the EU.
Section 4 focuses on the changing occupational structure of the UK labour market, which are driven by long-term trends, including changing sectoral employment patterns and technological and organisational trends influencing the patterns of occupational demand within sectors. Replacement demands are also examined. These indicate that there will be significant numbers of job opportunities even in areas where employment is projected to fall.
Section 5 examines the implications of sectoral and occupational changes for qualifications in terms of demand and supply. Formal qualification is a key way in which skills are defined and measured in Working Futures.
The projections take account of the latest official employment data, including the results from the Labour Force Survey (LFS). The stance of government policy is taken into account by factoring in the consequences of the various government public spending measures and other official policy statements, including the UK’s decision to leave the EU.
The projections are based on the Cambridge Econometrics (CE) macroeconomic forecasts, (produced using MDM - CE’s detailed multi-sectoral dynamic macroeconomic model (MDM-E3), MDM C182 (revision 13406), conducted in November 2018). Based on this analysis, the projections indicate what may happen to the structure of employment in the UK – disaggregated by sector, gender, occupation, etc. Labour market prospects are driven by the macroeconomic scenario and prospects for detailed sectors in different parts of the country. The prospects for sectoral output are independent of those produced by any other forecasters. They are based on CE’s own models, judgements and assumptions as set out in section 2.
1.2. Rationale for the Working Futures projections The case for a regular and systematic assessment of future skills needs has been set out in previous Working Futures reports and is summarised next. This also draws upon various international and other reviews.
3
The results presented provide a benchmark for debate and thinking about the future. They should not be regarded as precise forecasts of what will necessarily happen. Rather, they indicate a likely future, given a continuation of past patterns of behaviour and performance.5 If policies and patterns of behaviour are changed then alternative futures might be achieved. The present results provide a consistent and systematic benchmark view across the whole economy and labour market. They are indicative of general trends and orders of magnitude, given the assumptions made, which are summarised below. The forecast is subject to a number of risks and uncertainties. Most notable among them is the impact of Brexit on barriers to trade and the movement of people. When developing the UK macroeconomic forecast (in the autumn of 2018), assumptions were made based on announcements and published reports by think-tanks, non-profit organisations and the stance of the UK government at that time.
The forecasts are not necessarily a substitute for projections produced by/for individual sectors or other interest groups (defined by say spatial area or occupational group). However, the Working Futures results show how the more detailed results for particular sectors, occupations or regions fit into a broader macroeconomic context, covering all these in a consistent, systematic and comparable manner. The results should be regarded as a robust benchmark for debate and used in conjunction with a variety of other sources of labour market information.
1.3. Reviews of the need for skills forecasts Since the last Working Futures projections were produced there have been a number of new reviews of Skills Anticipation and Forecasting. This has included projects supported by the Business, Industry and Science Department (BIS)6 and the Department of Education (DfE) in the UK, as well as a number of international exercises. These have confirmed the cases for carrying out such exercises on a regular basis in order to better inform labour market participants, education and training providers and policy makers more generally about the labour market they may face over the next decade or so.
For example, in 2017 DfE organised an Academic Workshop to discuss the need for regular employment projections in the UK. Papers presented, such as that by Dickerson and Wilson (20177), concluded that such work was an essential component of a modern labour market information system. Similar conclusions were reached in a review conducted as part of the Foresight Future of skills and lifelong learning project, sponsored by BIS8.
5 For more detailed discussion see the various references Section 1.3. 6 In 2016, BIS was merged with the Department for Energy and Climate Change to become the Department for Business, Energy & Industrial Strategy (BEIS). 7 Dickerson, A., and Wilson, R. A. (2017). How Should We Consider Future Skills Demand? Skills Demand Workshop 2017, Convened by the U.K. Department for Education, 18 July 2017, Church House Conference Centre, London. 8 For the reports see: https://www.gov.uk/government/collections/future-of-skills-and-lifelong-learning

4
A number of similar reviews have been conducted at international level. In 2016, the European Council concluded that "Anticipating and matching labour market needs” is a key responsibility of Member States. Comprehensive assessments of future skills requirements can make a key contribution to the identification of labour market trends and skills shortages, helping to contribute to a better matching between labour market needs and skills supply developments. More recent reviews, such as those by van Breugel (20179) and Wilson (201810) reach similar conclusions. More effective anticipation and matching of labour market needs, it is argued, can contribute to the promotion of better labour utilisation and higher labour productivity, and therefore to growth and jobs, helping to reduce both frictional and structural unemployment. The Working Futures series is a key element in the UK’s response to this request.
There is on-going interest amongst policy makers to ensure that the UK has the appropriate skills base to sustain economic growth and compete internationally. However, such information is potentially of interest not just to policy makers but also for all those having to make decisions about education and training, including individuals making careers choices, as well as education and training providers.
The main rationale for producing these kinds of projections is no longer that policy makers will engage in any kind of detailed, top down, planning (or anticipation) of the labour market. It is more about providing information to allow individual actors throughout the system (individuals making career choices, educational and training establishments and employers generally) to make better-informed decisions (Kriechel, Rašovec and Wilson, 201611). Of course, nobody can predict the future with certainty. Most people can and do make plans and try to prepare for it. In doing so they adopt assumptions about what the future might be like, even if it is simply that the future will be the same as the past. There are also advantages of providing such projections centrally, as a public good, rather than relying on organisations and individuals to develop their own views independently. These advantages include the fact that this approach can provide a comprehensive, methodical, consistent and transparent set of results. It also benefits from economies of scale.
A key advantage of the Working Futures forecasts is that they provide a common and consistent economy wide overview of skill needs, allowing detailed comparisons across sectors. This is based on a transparent, specific set of macroeconomic assumptions and economic relationships, affecting the whole economy and its structure. As such, the analysis is grounded in an understanding of the key drivers impinging upon the economy.
9 van Breugel, G. (2017). Identification and anticipation of skill requirements: Instruments used by international institutions and developed countries. Economic Commission for Latin America (ECLA) (Spanish acronym is CEPAL). Date Issued: 2017-10, Serie: Documentos de Proyectos, 110 p. United Nations UN symbol: LC/TS.2017/85. 10 Wilson, R. A., (2018). Skills Forecasts in a Rapidly Changing World: Through a Glass Darkly. In McGrath, S., Mulder, M., Papier, J., and Suart, R. (eds.) Handbook of Vocational Education and Training Developments in the Changing World of Work. Springer. Available from: https://link.springer.com/referenceworkentry/10.1007%2F978-3-319-49789-1_74-1 11 Kriechel, B., Rašovec, T., and Wilson, R. A. (2016). ''Skills Forecasts." Part B of the ETF, ILO and Cedefop Guide on Skills Foresights, Scenarios and Forecasts. CEDEFOP/ETF/ILO: Turin
5
It serves to act as an objective, economy-wide, explanatory tool to facilitate the examination of the changing pattern of skills demand.
1.4. Aims and objectives of the Working Futures projections Government policy has placed increasing emphasis on the need for labour market information to be made freely available at a more detailed spatial and sectoral level to assist in policy and planning for the provision of education and training, as well as helping to guide individual career choices and decisions. Working Futures 2017-2027 addresses these requirements, exploiting available official information in such a manner as to produce a more detailed, comprehensive and consistent picture of employment patterns than is available from any other source, while recognising the technical challenges that this imposes, and setting out transparently how these have been addressed.
The historical database and the related projections focus on employment by occupation, cross-classified by sector and a spatial dimension down to individual countries within the UK, and regions within England. Summary results for employment are reported by:
• gender;
• employment status (full-time/part-time/self-employed);
• occupation (one, two and four digit occupational groups);
• expansion and replacement demand, as well as net requirements; and
• qualifications (6 broad Regulated Qualifications Framework (RQF) levels).
The analysis also considers the labour and skills supply. Consistent projections of labour supply have been generated by:
• gender; and
• age (7 broad age groups: 0-15, 16-24, 25-34, 35-44, 45-59,60-64, 65+).
The labour supply projections are also developed distinguishing the highest qualifications held by the working age population and those economically active. These are consistent with results produced by Bosworth (2015a, b and c12) and Bosworth and Leach (201513). By making assumptions about the distribution of unemployment between qualification
12 Bosworth, D. (2015a). UK Qualifications Projections – Time Series Model: Technical Report, 2013. Report for UK Commission for Employment and Skills: Wath on Dearne. Institute for Employment Research, University of Warwick: Coventry. Bosworth, D. (2015b). National Qualifications Projections – Apportionment Model: Technical Report. Report for UK Commission for Employment and Skills: Wath on Dearne. Institute for Employment Research, University of Warwick: Coventry. Bosworth, D., (2015c) Regional Qualifications Projections – Apportionment Model: Technical Report, Report for UK Commission for Employment and Skills: Wath on Dearne. Institute for Employment Research, University of Warwick: Coventry. 13 Bosworth, D., and Leach, A. (2015). UK Skill Levels and International Competitiveness. Report for UK Commission for Employment and Skills: Wath on Dearne. Warwick Institute for Employment Research, University of Warwick: Coventry.

6
categories, projections of employment by highest qualification held have also been developed.
1.5. General methodological approach and data sources The general methodological approach to developing the Working Futures projections has been discussed in previous reports (Wilson et al., 2016a14) and is set out in detail in the accompanying Technical Report (Wilson et al., 201915). It focuses on sectoral and occupational employment structures, qualifications, and general workforce trends (including replacement demand). The approach exploits existing official data, including the LFS, generating more detailed estimates than are available from official sources. The results also include a full set of SOC 2010 4-digit occupational categories that are used in the LMI for All data portal.16
The complete Working Futures database presents a range of historical data and projections that meet the needs of the DfE (and those of its partners) for detailed information and intelligence on likely sectoral developments and their implications for skill requirements. The approach involves the detailed examination of sectoral as well as occupational employment change and their implications for skill requirements at both a micro and macro level. This is based upon the use of a variety of research methods, ranging from complex econometric modelling, to other more qualitative approaches, depending upon the objectives of the work and the nature of the basic data available. For example, the analysis of trends in occupational structure is based on more qualitative approaches in contrast to the more sophisticated econometric analysis possible in other parts of the model where better time series data are available.
At the heart of the projections is the latest CE multi-sectoral multi-regional macroeconomic forecast. This is used to produce detailed 75 industry projections, for the period 2017-2027, covering all the English regions and the devolved nations of the UK (as well as custom results for Wales in separate workbooks). The 75 industries are classified using the Standard Industrial Classification (SIC2007). Official ONS data on output and various other economic indicators as well as employment are used. The prospects for sectors / industries is the key driver of changes in employment by occupation.
Data from the LFS and other sources are used to develop historical measures of the occupational and qualification structure of employment within industries. A combination of simple econometric methods and judgement is then used to generate projections of
14 Wilson, R. A., May-Gillings, M., Pirie, J. and Beaven, R. (2016a). Working Futures 2014-2024: Main Report. UK Commission for Employment and Skills: Wath on Dearne. 15 Wilson, R. A., M. May-Gillings, S. Patel and H Bui, (2019). Working Futures 2017-2027: Technical report on sources and methods. Department for Education. 16 LMI for All is an online data portal, which connects and standardises existing sources of high quality, reliable labour market information (LMI) with the aim of informing careers decisions. This data is made freely available via an Application Programming Interface (API) for use in websites and applications. The service is funded by the Department for Education. For more information see: http://www.lmiforall.org.uk/
7
these patterns forward to 2027. This is done using the Standard Occupational Classification (SOC2010). Analysis of labour supply by age and gender is carried out using econometric methods. These are then further disaggregated by formal qualifications held to obtain measures of the supply of skills by highest qualification held as defined by the Regulated Qualifications Framework, RQF (formerly the Qualifications and Credit Framework).
1.6. Outline and structure of the report Section 2 presents an overview of macroeconomic prospects for the global and UK economies, and the prospects for the UK labour market.17 Section 3 assesses the prospects for broad sectors in more detail. Section 4 draws out the implications for occupations, including replacement demands. Section 5 considers the implications for qualifications, covering both supply and demand. Separate annexes provide technical information about sources and methods, describing how the projections have been produced, as well as how these new projections compare to previous ones. These Annexes also cover the development of the 4-digit occupational results and the spatial results for the devolved nations of Scotland, Northern Ireland and Wales, and the nine English regions. A separate Technical Report (Wilson et al., 201918) provides full details on the methodological approach and data sources, as well as their limitations. This includes a detailed description of the macroeconomic and other models used to generate the projected demand for skills as well as the treatment of skills supply. A brief summary, providing details of the main data sources and methods, econometric analysis and model structure and content is included as one of the annexes to this Main Report.
17 Results have also been produced for the devolved nations and the regions of England that together make up the UK. 18 Wilson, R. A., M. May-Gillings, S. Patel and H Bui, (2019). Working Futures 2017-2027: Technical report on sources and methods. Department for Education.
8
2. Macroeconomic and general labour market context
2.1. Introduction The macroeconomic prospects for the UK provide the context for the detailed forecasts of employment and the labour market examined in more detail in subsequent sections of this report. The analyses of the prospects for individual sectors in Section 3 can be seen in the context of the general projections for the UK economy as a whole outlined in this section. These projections are produced using CE’s detailed multi-sectoral dynamic macroeconomic model (MDM-E3).
Section 2.2 begins with a brief overview of the key exogenous assumptions underlying the projections. This includes a detailed overview of the trade, investment and migration assumptions related to Brexit. The current situation is assessed in Section 2.3, drawing out general macroeconomic prospects for the UK over the next 5-10 years. The general prospects for the labour market are then summarised in Section 2.4. The sensitivity of the results to key assumptions, and the macroeconomic uncertainties, are discussed in Section 2.5. Comparisons with the previous set of Working Futures results are presented in the separate Annex B.
2.2. Global prospects Global growth prospects have improved in recent years since the financial crisis, but remain uncertain in light of rising political uncertainty in western nations, such as the UK,
Key messages
Following the referendum on Britain’s withdrawal from the European Union in 2016, UK GDP is not expected to keep pace with its initial post ‘Great Recession’ growth rate. In the near term, GDP growth is expected to slow significantly, to an average of around 1.1% each year over the next decade.
Overall, the number of jobs in the UK is projected to rise by around 1 million over the next decade – more of these jobs are expected to be taken by female workers (0.8m) than male (0.3m). The unemployment rate is expected to rise slightly from its current rate of 4.4% to 4.6% over the next decade, with a temporary rise in the intervening period.
The expansion of the UK's labour supply is forecast to slow over the next decade, curbed by slower population growth (than during 2007-2017) and an ageing population. The female labour force is expected to increase faster than the male labour force, reflecting the increasing participation of women in the labour market and the gradually increasing pension age for women.

9
US and Italy. World GDP is estimated to grow by around 3.4% in 2018, and is set to accelerate over 2018-2022 to reach 3.8% p.a., and then remain steady for the rest of the forecast period. Global growth is expected to be driven by emerging economies. China and India are expected to grow by 5-8% p.a. Growth in the US is expected to stabilise at around 2.5% p.a, and while growth in the Eurozone economies is expected to continue, it is expected to grow at slower rates than before the 2008 recession.19
In the US, growth is expected to temporarily slow from 2.5% in 2018 to 2.1% in 2019 before picking back up to 2.4% in 2020, amid growing household consumption, increasing private investment and falling unemployment rates. Short-term growth has been revised down compared to the previous Working Futures projections, partly due to the instability the economy has experienced following the election of President Trump. The US holds an advantage over other developed economies in its demographic profile, which is favourable towards long-term growth. However, for such growth to be achieved the US will have to solve problems related to productivity and competitiveness. These might see a relative improvement due to rising wages in China and other developing economies. They are expected to be accompanied by low labour force participation rates and rising inequality.
China is undergoing a significant transition as growth slows from the relatively high rates of growth of the 2000s. Nonetheless, emerging economies are expected to be the driving force of global economic growth over the forecast period. In China, the effects of an ageing population are likely to weigh down on growth over 2017-2027, with the repeal of the one child law not expected to have an impact on the supply of labour until the late 2030s. Nonetheless, it is assumed that China will experience stable and robust growth over the long term, at around 5.5% p.a. up to 2027. Meanwhile, India’s economic growth rate is expected to average 6.2% p.a. over 2017-2027, with Mexico and Brazil also growing strongly amongst other emerging economies. A range of factors, such as favourable demographics, competitive currencies, growing disposable incomes and their move up the global value chain, make these economies well positioned to fuel global growth over the long term.
2.3. Uncertainties related to Brexit The Eurozone continues to face uncertainty over the long-term effects of Brexit. Despite a recent upturn, growth in the Eurozone has been sluggish in recent years, with many countries facing persistent high unemployment and low productivity, which has impacted on wage growth and household spending. This has been further exacerbated following the 2016 EU referendum and the UK’s decision to leave the EU. The associated uncertainty has dampened business investment in the short-term and is likely to play an important factor in people’s employment decisions. Separately, in the face of increasing competition from developing economies, a key long-term challenge will be to lift
19 World GDP assumptions are based on CE estimates, informed by historical data from the International Monetary Fund (IMF): http://data.imf.org
10
productivity, especially in the southern members of the Eurozone, and boost competitiveness. The Eurozone also faces the challenge of an ageing population. Achieving higher productivity and sustained economic growth will depend on the Eurozone’s ability to widen its labour force by increasing participation among women and the elderly.
A detailed discussion of the uncertainties related to Brexit for the UK economy itself is contained in Section 2.5 below. This includes an overview of the trade, investment and migration assumptions explored in other literature.
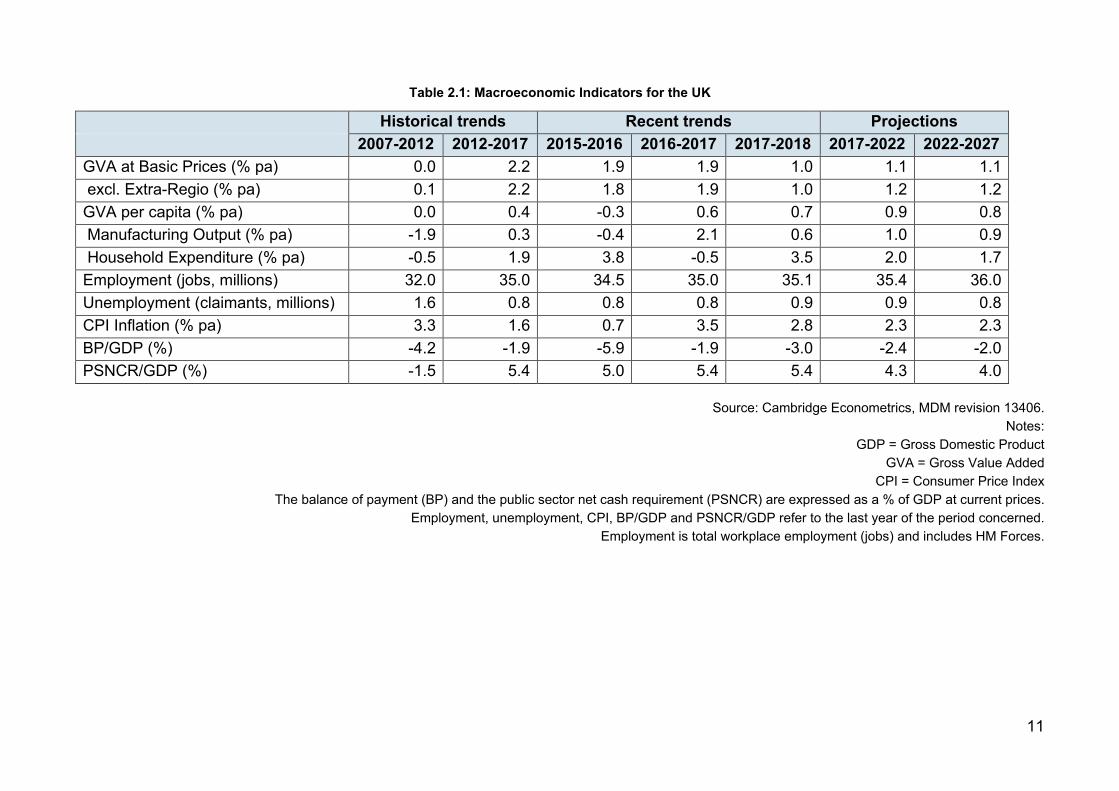
2.4. UK macroeconomic prospects Since 2012, the UK has experienced steady GVA growth (1.9-2.2% p.a.) and a declining unemployment rate from about 8% in 2012 to 4% in 2018. However, the UK’s impending withdrawal from the EU and the surrounding uncertainty is expected to dampen UK growth in the short and medium term, to about 1% p.a. (see Table 2.1). Brexit is likely to increase the barriers to trade for companies based in the UK, resulting in lower future GVA and employment growth than would otherwise be expected (at least over the medium term).
The Bank of England raised the Bank Rate from the historical low of 0.25% to 0.5% in November 2017, the first rate rise in 10 years (Bank of England, 201820). Since then there has been another rise to 0.75%, with indications that there could be further rate rises if the inflation rate stays above the target rate of 2%. This is dependent on the UK’s future relationship with the EU and the resulting changes in consumer patterns. On the one hand, rates could be lowered to help stimulate domestic investment in the wake of falling investment following the UK’s withdrawal from the EU to boost domestic demand. On the other hand, the Bank Rate could be raised to stem inflation that increased barriers to trade have the potential to cause.
A large increase in inflation in 2016-2017 (3.5%) was coupled with a 0.5% fall in household expenditure, a considerable drop compared to the previous year, when household expenditure grew by 3.5% (see Table 2.1, based on Cambridge Econometrics, MDM revision 13406). Household expenditure is expected to bounce back in the long run to grow by 1.7-2% p.a. as the economy recovers from the uncertainty it currently faces. Whilst absolute household expenditure is unlikely to decrease, an increase in trade barriers could result in households facing higher prices for some goods and services.
20 The Bank of England (2018). EU withdrawal scenarios and monetary and financial stability. Available from: https://www.bankofengland.co.uk/-/media/boe/files/report/2018/eu-withdrawal-scenarios-and-monetary-and-financial-stability.pdf?la=en&hash=B5F6EDCDF90DCC10286FC0BC599D94CAB8735DFB.
11
Table 2.1: Macroeconomic Indicators for the UK
Historical trends Recent trends Projections 2007-2012 2012-2017 2015-2016 2016-2017 2017-2018 2017-2022 2022-2027 GVA at Basic Prices (% pa) 0.0 2.2 1.9 1.9 1.0 1.1 1.1 excl. Extra-Regio (% pa) 0.1 2.2 1.8 1.9 1.0 1.2 1.2 GVA per capita (% pa) 0.0 0.4 -0.3 0.6 0.7 0.9 0.8 Manufacturing Output (% pa) -1.9 0.3 -0.4 2.1 0.6 1.0 0.9 Household Expenditure (% pa) -0.5 1.9 3.8 -0.5 3.5 2.0 1.7 Employment (jobs, millions) 32.0 35.0 34.5 35.0 35.1 35.4 36.0 Unemployment (claimants, millions) 1.6 0.8 0.8 0.8 0.9 0.9 0.8 CPI Inflation (% pa) 3.3 1.6 0.7 3.5 2.8 2.3 2.3 BP/GDP (%) -4.2 -1.9 -5.9 -1.9 -3.0 -2.4 -2.0 PSNCR/GDP (%) -1.5 5.4 5.0 5.4 5.4 4.3 4.0
Source: Cambridge Econometrics, MDM revision 13406. Notes:
GDP = Gross Domestic Product GVA = Gross Value Added
CPI = Consumer Price Index The balance of payment (BP) and the public sector net cash requirement (PSNCR) are expressed as a % of GDP at current prices.
Employment, unemployment, CPI, BP/GDP and PSNCR/GDP refer to the last year of the period concerned. Employment is total workplace employment (jobs) and includes HM Forces.
12
Following the results of the 2016 EU referendum and the depreciation of the pound, net trade has been buoyed in recent years, improving the price competitiveness of UK exports in international markets. This effect is likely to wear off in the long run, as the future UK-EU relationship becomes more certain and as the UK might face increases in trade barriers following Brexit.
2.5. Macroeconomic uncertainties There are a number of risks and uncertainties surrounding the baseline macroeconomic forecast presented above; these are discussed below.
2.5.1. Emerging markets
While the outlook for developing economies looks strong, some uncertainties remain. China’s future is highly uncertain, as the economy is transitioning from an export-led growth model to a consumption-led growth model. China’s long-term success depends on whether it can achieve a ‘soft landing’ – an adjustment to lower but sustainable rates of growth without causing a crisis of expectations and a subsequent economic slowdown. A ‘hard landing’ is the major risk for the Chinese and global economies. More generally, there is some concern over the level of corporate debt that has built up in emerging markets since the global economic crisis. This has occurred largely due to recent low bond yields in developed markets, which led investors to look further afield in search of higher investment returns. With many emerging markets facing current difficulties from factors including low commodity prices and a strong dollar, there is uncertainty over the implications of such high debt levels for emerging markets and the wider global economy. The risk is that developing countries’ positions turn sour and growth falters, weighing down on demand for UK exports and, more generally, global growth. This would curb jobs growth in UK manufacturing and traded services, and investment-related sectors (such as construction) if household and business sentiment were severely dampened.
2.5.2. The strength of the Eurozone recovery
Though growth in the Eurozone has picked up in recent years, it has been relatively weak and it is still uncertain whether the Eurozone is on a sustainable long-term growth path. If longer-term growth in the Eurozone is more sluggish than expected, this would result in lower demand from the Eurozone for UK exports while the sustained weakness of the euro would undermine the competitiveness of UK exports to the Eurozone, thereby denting UK growth prospects and curbing jobs growth in UK traded goods and services sectors.
In addition, the Eurozone faces political and economic uncertainty around the future impacts of Brexit. In the short to medium term, it is anticipated that the effects of the UK
13
leaving the European Union is likely to affect trading, investment and migration patterns across the Eurozone, though the extent of the impacts are unclear.
2.5.3. Macroeconomic uncertainties associated with Brexit
General assessments of the possible impact of Brexit
The UK economy faces uncertainties related to Brexit. The range of possible scenarios are explored in more detail in Boxes 2.1-2.3. This includes an overview of the trade, investment and migration assumptions explored in other literature related to Brexit in Box 2.1. Box 2.2 explores the various macroeconomic scenarios that other analysts have published regarding possible Brexit outcomes. Box 2.3 draws out some possible implications for particular sectors and skills.
The macroeconomic assumptions on the impacts of Brexit developed for Working Futures 2017-2027 are based on what the authors thought most likely to happen at the time of preparing the forecasts, given announcements and published reports by think-tanks, non-profit organisations and the UK government. In very general terms, it assumed that the UK agrees a withdrawal deal with the EU (which it has) and there is an orderly transition. The following political assumptions were adopted:
• there is no “cliff-edge” moment, as the UK obtains a transitional deal with the EU;
• the UK agrees a bespoke deal with the EU;
• the UK secures an ability to reduce EU migration;
• the UK can remain in the single market for goods but not services (so there is no longer financial services passporting); and
• there are likely to be some continued payments for access to the EU from the UK.
Box 2.2 provides a more detailed discussion of the potential different impacts of Brexit, based on an analysis of other macro studies. Such studies suggest a wide range of possible impacts on the UK economy.
At one end of the spectrum, such studies have found that a possible ‘European Economic Area’ scenario could result in the UK’s GDP being between 1.25% and 11% lower by around 2027 than was expected before the referendum.21 While at the other end of the spectrum, studies that looked at WTO/no deal scenarios found that the UK’s GDP could be between 2.7% and 18.5% lower than was expected before the referendum, with one outlier suggesting that UK GDP could be 4% higher by 2027.22
Employment is also likely to be impacted in line with the GDP impacts. Some sectors, however, could face additional negative employment impacts, driven by a fall in
21 Different studies have different end dates for the scenarios explored, but most are looking around 10 years ahead. 22 Or thereabouts, see previous footnote.

14
productivity if the skills level of the UK labour force is affected by a change in migration or investment patterns. The discussion below also provides a more detailed assessment of possible sectoral impacts (see Box 2.3). The effect on the demand for skills will be dependent on the fortunes of particular sectors. Skills supply for some sectors could be adversely affected if inward migration and use of EU labour is restricted as a result of tighter controls on the movement of labour with Europe.

15
Box 2.1: Trade, investment and migration assumptions in the Brexit literature
Trade The recent (i.e. at the time of producing the forecasts) literature on Brexit covers a range of scenarios regarding the trading relationship between the UK and the EU. Under the scenarios where the UK negotiates a favourable deal, it is assumed that the UK would obtain EEA membership to give it access to the Single Market, or at least it negotiates a trade agreement that is as favourable as EEA membership.
At the other end of the spectrum, it is assumed that the UK would trade with the EU under WTO rules. All studies assume that the UK would enter a trade agreement that allows it to access the Single Market3, some under more restrictive provisions than others, at a relatively low cost (with respect to tariffs).
In terms of sectoral variations, it is generally the case that production or export-intensive sectors (including food & drinks, motor vehicles and electronics) would be most affected by an increase in trade costs (tariffs or non-tariff barriers) as a result of Brexit, which generates knock-on impacts further down the supply chain in transport and distribution. Finance & insurance is expected to see the largest impact from changes in non-tariff barriers such as passporting rights and regulations, but the distribution is unlikely to be even across different sub-sectors. For example, banking is likely to be more affected than insurance, private equity and hedge funds, as it is more closely connected to the EU (KPMG, 201723).
Investment There have been limited assumptions directly related to the investment impact in the literature, as it is inherently difficult to model and is related to corporate strategy, which is something that larger-scale macro models don’t account for very well.
Most of the discussion about investment in the context of Brexit has centred on inward foreign direct investment (FDI). It finds that FDI would be lower in any scenario compared to the baseline of the UK remaining in the EU.
The various studies reviewed suggest that the impacts on investment would be negative and not uniform across sectors. Those sectors mentioned in the literature most likely to be affected by Brexit are financial & insurance, manufacturing, construction and research & development.
In addition to long-term effects on investment, in October 2018 the CBI reported24 on a survey it had conducted which revealed that 80% of firms had already had investment decisions negatively affected by the uncertainty created by the Brexit process.

16
2.5.4. Analyses of the Macroeconomic uncertainties associated with Brexit
A number of model-based studies have been published looking at the expected macroeconomic impacts of Brexit on the UK economy and those produced at the time the macroeconomic forecast was produced are summarised in Box 2.2. Notwithstanding the difficulties in comparing models with different priors, assumptions, time frames and baseline comparators, we look briefly at where the Working Futures 2017-2027 UK forecast sits within the range of possible outcomes reported thus far. This is not a detailed attempt to disentangle these reported outcomes from the various factors inputting into the models, but rather a brief summary of the background to a selection of other results to allow it to be put in a limited context for comparability.
23 KPMG LLP (2017). Labour migration in the hospitality sector. A KPMG report for the British Hospitality Association. KPMG Available from: https://www.bha.org.uk/wordpress/wp-content/uploads/2017/05/BHA-EU-migration-final-report-170518-public-vSTC.pdf 24 See http://www.cbi.org.uk/news/8-out-of-10-businesses-say-brexit-hits-investment-as-speed-of-talks-outpaced-by-reality-firms-face-on-ground/ 25 Portesy, J., and Fortez, G. (2016). The Economic Impact of Brexit-induced Reductions in Migration. NIESR: London. 26 Migration Watch (2016). UK immigration policy outside the EU. Available from: https://www.migrationwatchuk.org/pdfs/European-Union-MW371.pdf. 27 Global Futures (2017). Beyond the Highly Skilled: The Needs of Other Stakeholders from Economic Migration. Our Global Future: London.
Box 2.1 (continued): Trade, investment and migration assumptions in the Brexit literature
Migration Few of the studies consider assumptions directly related to population, migration and the labour market. Those that do, only offer a qualitative discussion, but envision a Brexit in which the UK would not continue to have free movement of labour and would implement control of EU migration, particularly for work purposes. On one end of the spectrum, the current visa system could be maintained with a relaxed approach to EU migration, not too dissimilar to the current freedom of movement of people. On the other end of the spectrum, a points-based approach could be taken to EU migration, regulating it in the same way as for migrants from outside the EEA.
The impact of Brexit on migration is more often presented as the result of an estimation or a modelling exercise, rather than assumptions feeding into the analysis. A number of studies estimate that in the absence of free movement of labour, the level of net EU migration will be between 62,000 and 100,000 people lower each year than the pre-referendum current figure of about 189,000 (Portesy and Fortez, 201625; Migration Watch, 201626; Global Futures, 201727).

17
28 The Bank of England (2018). EU withdrawal scenarios and monetary and financial stability. Available from: https://www.bankofengland.co.uk/-/media/boe/files/report/2018/eu-withdrawal-scenarios-and-monetary-and-financial-stability.pdf?la=en&hash=B5F6EDCDF90DCC10286FC0BC599D94CAB8735DFB. 29 RAND (2017). After Brexit. Alternative forms of Brexit and their implications for the United Kingdom, the European Union and the United States. RAND: London. PwC: London 30 Dhingra, S., Ottaviano, G., Sampson, T., and Van Reenen, J. (2016). The consequences of Brexit for UK trade and living standards. Centre for Economic Performance Brexit Analysis, No. 2, Available from: http://cep.lse.ac.uk/pubs/download/brexit02.pdf.
Box 2.2: Model-based studies on the expected macroeconomic impacts of Brexit
The Bank of England (November 201828) The Bank’s suite of macroeconomic models were used to model short-term scenarios (i.e. for the next five years) relative to both the path the economy is currently on and the path the economy was on prior to the EU referendum. Two scenarios were modelled: Economic Partnership under the Withdrawal Agreement and Political Declaration; and a no deal and no transition outcome. The scenarios are based on gravity models and makes assumptions for trading relationships and trade barriers, with subsequent impacts on investment and productivity captured by empirical relationships. Net migration is assumed to decline in 2021 to a level consistent with annual net migration of 100,000, in line with the upper bound of the Government’s stated migration policy, with additional impacts from a change in the UK’s relative attractiveness captured by empirical relationships. Assumptions are also made for preparedness for new trading arrangements, macroeconomic policy (monetary and fiscal policy), financial conditions and macroeconomic uncertainty.
RAND Europe (December 201729) RAND use a mix of modelling and game theory analytics to report on the following five Brexit scenarios (WTO, a UK-EU free trade agreement (FTA), a UK-US-EU FTA, a UK-US FTA, and a transition period during which non-tariff barriers start to apply), as well as more orderly Brexit scenarios (EEA membership, bilateral arrangements, and remaining in the Customs Union). The model used is the same as that in the Dhingra and colleagues (201630) study, with further analysis undertaken for FDI and for the additional scenarios, which take into account existing EU trade deals that could affect UK trade costs.
RaboBank (October 201731) Three scenarios are assessed: a Brexit where only non-tariff barriers are introduced as the UK remains part of the Single Market and Customs Union, a Free Trade Agreement with larger non-tariff barriers and no freedom of movement of services, and a no deal Brexit using WTO rules. These are compared against a baseline scenario of the UK remaining in the EU. As with all other studies being compared, no transition period is assumed. The National Institute Global Econometric Model (NiGEM) is used, alongside additional in-house work to model and adjust total factor productivity, which creates a distinctly more negative outlook for the UK economy
18
31 RaboBank (2017). Assessing the economic impact of Brexit: background report. London. Available from: https://economics.rabobank.com/publications/2017/october/assessing-economic-impact-brexit-background-report/. 32 For discussions see: https://www.economistsforfreetrade.com/publications/ 33 For example, see http://blogs.lse.ac.uk/brexit/2017/08/23/economists-for-brexit-predictions-are-inconsistent-with-basic-facts-of-international-trade/ 34 PwC (2016b). Leaving the EU: Implications for the UK economy, March 2016. PwC: London. Available from: https://www.pwc.co.uk/economic-services/assets/leaving-the-eu-implications-for-the-uk-economy.pdf. 35 CGE models are large numerical models that combine economic theory with real economic data in order to derive computationally the impacts of policies or shocks in the economy. 36 CPB (2016). Brexit Costs for the Netherlands Arise from Reduced Trade. CPB Policy Brief 2016/07.
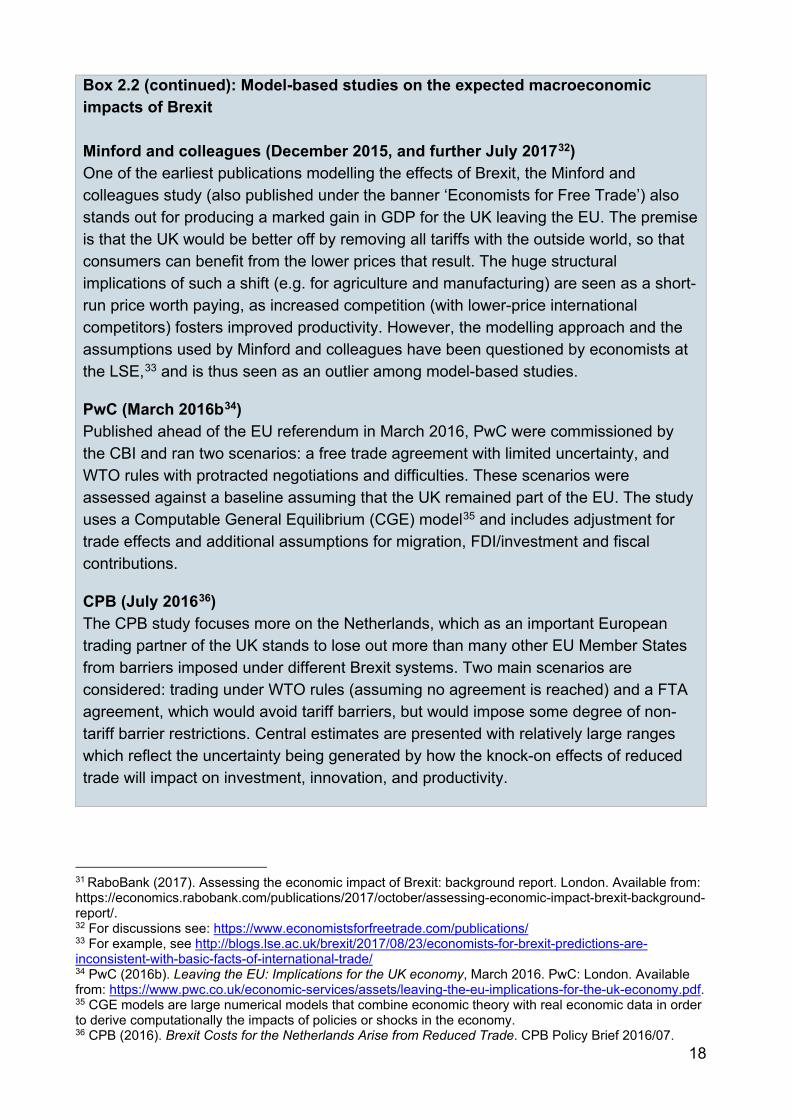
Box 2.2 (continued): Model-based studies on the expected macroeconomic impacts of Brexit Minford and colleagues (December 2015, and further July 201732) One of the earliest publications modelling the effects of Brexit, the Minford and colleagues study (also published under the banner ‘Economists for Free Trade’) also stands out for producing a marked gain in GDP for the UK leaving the EU. The premise is that the UK would be better off by removing all tariffs with the outside world, so that consumers can benefit from the lower prices that result. The huge structural implications of such a shift (e.g. for agriculture and manufacturing) are seen as a short-run price worth paying, as increased competition (with lower-price international competitors) fosters improved productivity. However, the modelling approach and the assumptions used by Minford and colleagues have been questioned by economists at the LSE,33 and is thus seen as an outlier among model-based studies.
PwC (March 2016b34) Published ahead of the EU referendum in March 2016, PwC were commissioned by the CBI and ran two scenarios: a free trade agreement with limited uncertainty, and WTO rules with protracted negotiations and difficulties. These scenarios were assessed against a baseline assuming that the UK remained part of the EU. The study uses a Computable General Equilibrium (CGE) model35 and includes adjustment for trade effects and additional assumptions for migration, FDI/investment and fiscal contributions.
CPB (July 201636) The CPB study focuses more on the Netherlands, which as an important European trading partner of the UK stands to lose out more than many other EU Member States from barriers imposed under different Brexit systems. Two main scenarios are considered: trading under WTO rules (assuming no agreement is reached) and a FTA agreement, which would avoid tariff barriers, but would impose some degree of non-tariff barrier restrictions. Central estimates are presented with relatively large ranges which reflect the uncertainty being generated by how the knock-on effects of reduced trade will impact on investment, innovation, and productivity.
19
Summary of previous studies findings of macroeconomic impact of Brexit
The different scenario results of the various studies (summarised in Box 2.2) are presented in Table 2.2 and Figure 2.1. They present the long-run GDP outcomes of the above-mentioned studies (as measured by the percentage difference in GDP level from baseline in the final year of the forecast). Although the studies were produced at different points in times, all seem to have taken account of any effects which might have already been apparent in historic data (over 2016-2017) and can be compared without this issue being a concern.
37 International Monetary Fund (2016). ‘United Kingdom – Selected Issues’, IMF Country Report No. 16/169, June 2016. Available from: https://www.imf.org/external/pubs/ft/scr/2016/cr16169.pdf. 38 Ebell, M., and Warren, J. (2016). The Long-Term Economic Impact of Leaving the EU. National Institute Economic Review No. 236, May 2016. 39 HM Government (2016). HM Treasury analysis: the long-term economic impact of EU membership and the alternatives. HM Treasury: London. 40 OECD (2016). The Economic Consequences of Brexit – A Taxing Decision. OECD Economic Policy Papers. OECD Publications: Paris.
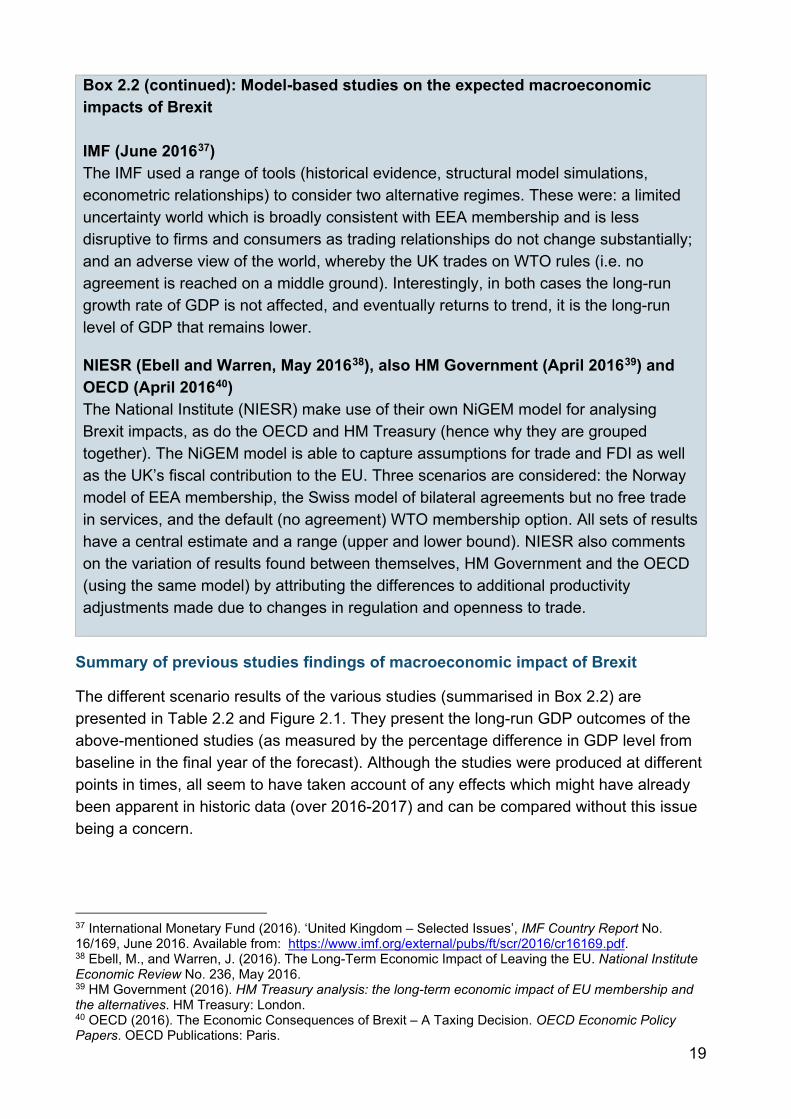
Box 2.2 (continued): Model-based studies on the expected macroeconomic impacts of Brexit IMF (June 201637) The IMF used a range of tools (historical evidence, structural model simulations, econometric relationships) to consider two alternative regimes. These were: a limited uncertainty world which is broadly consistent with EEA membership and is less disruptive to firms and consumers as trading relationships do not change substantially; and an adverse view of the world, whereby the UK trades on WTO rules (i.e. no agreement is reached on a middle ground). Interestingly, in both cases the long-run growth rate of GDP is not affected, and eventually returns to trend, it is the long-run level of GDP that remains lower.
NIESR (Ebell and Warren, May 201638), also HM Government (April 201639) and OECD (April 201640) The National Institute (NIESR) make use of their own NiGEM model for analysing Brexit impacts, as do the OECD and HM Treasury (hence why they are grouped together). The NiGEM model is able to capture assumptions for trade and FDI as well as the UK’s fiscal contribution to the EU. Three scenarios are considered: the Norway model of EEA membership, the Swiss model of bilateral agreements but no free trade in services, and the default (no agreement) WTO membership option. All sets of results have a central estimate and a range (upper and lower bound). NIESR also comments on the variation of results found between themselves, HM Government and the OECD (using the same model) by attributing the differences to additional productivity adjustments made due to changes in regulation and openness to trade.
20
For many of the results analysed, the spread of results across the studies (as noted by NIESR41) are usually due to how the models deal with the additional effects on productivity caused by changes to FDI, openness to trade, degree of regulation, innovation, and other factors that are not directly captured by the main model structure. This leaves open a wide area of interpretation (and off-model techniques), which then feed through to the GDP outcomes.
While one-for-one comparisons cannot be made with Table 2.2, the Working Futures 2017-2027 macro forecast is at the conservative end of the spectrum when it comes to the magnitude of GDP impacts following Brexit, as seen by the slowdown in growth prospects between Working Futures 2014-2024 and Working Futures 2017-2027.
Only one central scenario is modelled as part of Working Futures 2017-2027, so it is not possible to make a similar comparison of GDP differences from a baseline, as done in the other studies. Nonetheless, we can compare the UK growth prospects in Working Futures 2017-2027 with Working Futures 2014-2024 (which was published before the 2016 EU Referendum) to provide some comparison. UK GDP was expected to grow by 2.3% p.a. over 2019-2024 in Working Futures 2014-2024, compared to 1.5% p.a. in Working Futures 2017-2027. This is a slowdown of just under 1% point per annum. The slowdown in expected GDP growth is due to a number of reasons, including the potential impacts of Brexit.
41 Ebell, M., and Warren, J. (2016). The Long-Term Economic Impact of Leaving the EU. National Institute Economic Review No. 236, May 2016.

21
Table 2.2: Percentage difference in GDP level from baseline
Study EEA Scenario FTA Scenario WTO/No Deal Scenario
Minford et al +4.0
NIESR -1.8 (-1.5 to -2.1) -2.1 (-1.9 to -2.3) -3.2 (-2.7 to -3.7)
PWC -1.2 -3.5
CPB -3.4 (-2.0 to -5.9) -4.1 (-2.7 to -8.7)
IMF -1.5 -4.5
RAND* -4.9
OECD** -5.1 (-2.7 to -7.7)
HM Government -3.8 (-3.4 to -4.3) -6.2 (-4.6 to -7.8) -7.5 (-5.4 to -9.5)
Bank of England***
-1.25—3.75 -7.75—10.5
RaboBank -10 (-8.4 to -11) -12.5 (-11.3 to -13.7) -18 to -18.5 Note: Other than where indicated, most of the studies presented in this table look at the impacts to 2030.
* Only 10-year cumulative effects are reported, whereas most other studies tend to use 2030 as the comparison period. Other scenarios are difficult to assess as they are reported as relative to the WTO
scenario. ** It is not entirely clear what the OECD assumptions are regarding a particular version of Brexit, hence it is
assumed to fall somewhere in the FTA/WTO models, as also reported in NIESR (201642). **** Scenarios are modelled to 2023 (short-term 5 year forecasts).
Figure 2.1: Comparison of the impact of Brexit (WTO scenario / No Deal)
42 Ebell, M., and Warren, J. (2016). The Long-Term Economic Impact of Leaving the EU. National Institute Economic Review No. 236, May 2016.
22
The macroeconomic impact studies reviewed suggest a wide range of possible effects of Brexit on the UK economy. This depends on the precise form of Brexit being analysed (but also on the assumptions made by the different organisations doing the analysis). At one end of the spectrum, studies have found that a possible ‘European Economic Area’ scenario could result in the UK’s GDP being between 1.25% and 11% lower by 2027 than was expected before the referendum in 2016. While at the other end of the spectrum, most studies that looked at WTO/No Deal scenarios found that the UK’s GDP could be between 2.7% and 18.5% lower than was expected before the referendum. However, one outlier suggests that in the long run UK GDP could be 4% higher.
While it is difficult to make direct one-for-one comparisons with the Working Futures 2017-2027 macro forecast, it is probably at the more conservative end of the spectrum in terms of the negative magnitude of GDP impacts following Brexit. This is demonstrated by the predicted slowdown in growth prospects between the forecast in Working Futures 2014-2024 and the forecast in Working Futures 2017-2027.
The possible impacts on sectors and skills of alternative Brexit scenarios are discussed in more detail in Box 2.3.
2.5.5. Possible sectoral impacts of Brexit
This section explores the issues that certain UK sectors might face following Brexit, in terms of trade, investment and productivity. Box 2.3 presents the discussion by sector.
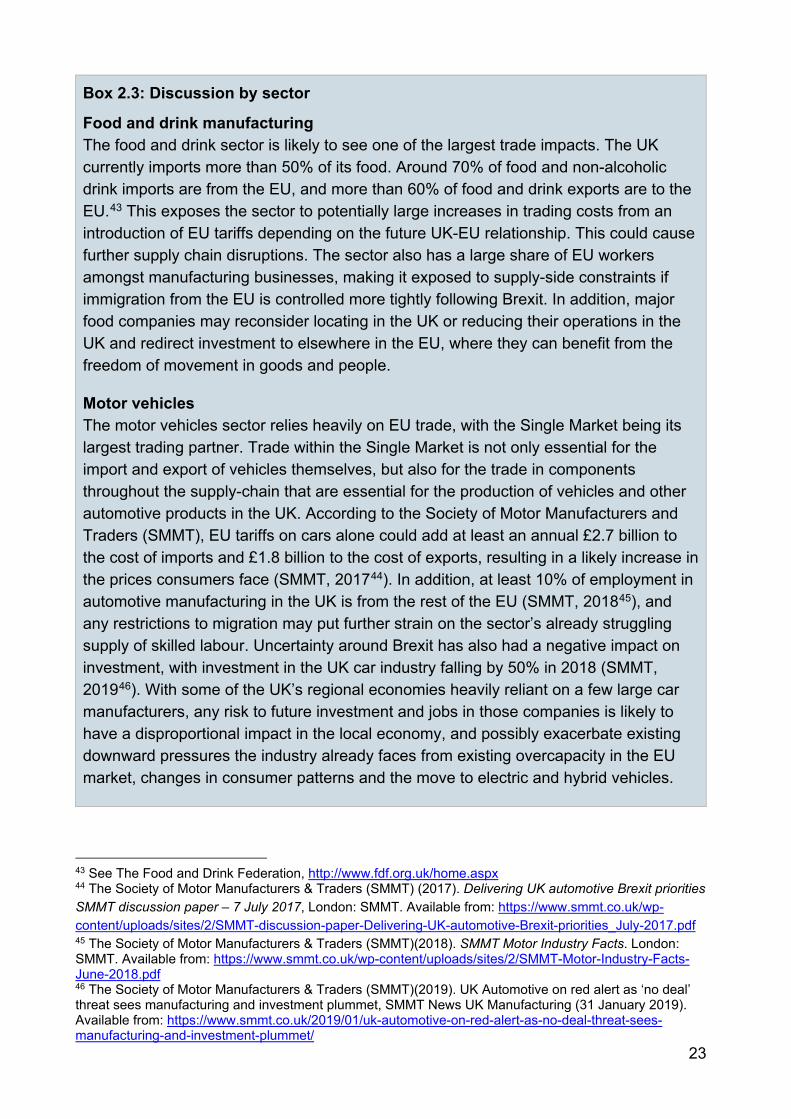
23
43 See The Food and Drink Federation, http://www.fdf.org.uk/home.aspx 44 The Society of Motor Manufacturers & Traders (SMMT) (2017). Delivering UK automotive Brexit priorities SMMT discussion paper – 7 July 2017, London: SMMT. Available from: https://www.smmt.co.uk/wp-content/uploads/sites/2/SMMT-discussion-paper-Delivering-UK-automotive-Brexit-priorities_July-2017.pdf 45 The Society of Motor Manufacturers & Traders (SMMT)(2018). SMMT Motor Industry Facts. London: SMMT. Available from: https://www.smmt.co.uk/wp-content/uploads/sites/2/SMMT-Motor-Industry-Facts-June-2018.pdf 46 The Society of Motor Manufacturers & Traders (SMMT)(2019). UK Automotive on red alert as ‘no deal’ threat sees manufacturing and investment plummet, SMMT News UK Manufacturing (31 January 2019). Available from: https://www.smmt.co.uk/2019/01/uk-automotive-on-red-alert-as-no-deal-threat-sees-manufacturing-and-investment-plummet/
Box 2.3: Discussion by sector
Food and drink manufacturing The food and drink sector is likely to see one of the largest trade impacts. The UK currently imports more than 50% of its food. Around 70% of food and non-alcoholic drink imports are from the EU, and more than 60% of food and drink exports are to the EU.43 This exposes the sector to potentially large increases in trading costs from an introduction of EU tariffs depending on the future UK-EU relationship. This could cause further supply chain disruptions. The sector also has a large share of EU workers amongst manufacturing businesses, making it exposed to supply-side constraints if immigration from the EU is controlled more tightly following Brexit. In addition, major food companies may reconsider locating in the UK or reducing their operations in the UK and redirect investment to elsewhere in the EU, where they can benefit from the freedom of movement in goods and people.
Motor vehicles The motor vehicles sector relies heavily on EU trade, with the Single Market being its largest trading partner. Trade within the Single Market is not only essential for the import and export of vehicles themselves, but also for the trade in components throughout the supply-chain that are essential for the production of vehicles and other automotive products in the UK. According to the Society of Motor Manufacturers and Traders (SMMT), EU tariffs on cars alone could add at least an annual £2.7 billion to the cost of imports and £1.8 billion to the cost of exports, resulting in a likely increase in the prices consumers face (SMMT, 201744). In addition, at least 10% of employment in automotive manufacturing in the UK is from the rest of the EU (SMMT, 201845), and any restrictions to migration may put further strain on the sector’s already struggling supply of skilled labour. Uncertainty around Brexit has also had a negative impact on investment, with investment in the UK car industry falling by 50% in 2018 (SMMT, 201946). With some of the UK’s regional economies heavily reliant on a few large car manufacturers, any risk to future investment and jobs in those companies is likely to have a disproportional impact in the local economy, and possibly exacerbate existing downward pressures the industry already faces from existing overcapacity in the EU market, changes in consumer patterns and the move to electric and hybrid vehicles.

24
47 Frenk, C., Hunt, T., Partridge, L., Thornton, J. and Wyatt, T. (2015). UK research and the European Union The role of the EU in funding UK research. The Royal Society: London. Available from: https://royalsociety.org/-/media/policy/projects/eu-uk-funding/uk-membership-of-eu.pdf
Box 2.3 (continued) : Discussion by sector
Construction One of the major issues currently facing the construction sector is the shortage of skills. The sector currently relies heavily on a foreign migrant labour force. Following Brexit, skills shortage could get worse, if the new agreements do not allow for free movement of people. This could, for example, reduce firms’ capacity to deliver new houses to meet the government's housing targets, and further deepen the housing crisis. The sector is also likely to be affected by trade impacts. If the UK faces a reduction in access to the EU market following Brexit, construction firms could experience an increase in their costs or a shortage of building materials, as they face an increase in tariffs or limits on quantities imported. In addition, the UK construction sector currently benefits from having access to the European Investment Bank (EIB) and the European Investment Fund (EIF). A loss of these financial aids could significantly impact the ability of firms to deliver big infrastructure projects.
Financial and professional services The sector is a major provider of high value and high productivity jobs across the country, and London, in particular, is considered one of the most important financial regions in the world and the financial centre of Europe. One of the largest threats to the sector is the potential loss of passporting rights for firms based in the UK that provide financial services to the EU. If the UK fails to negotiate full access to the EU market following Brexit, trade costs could rise and the UK could suffer from a fall in trade in this sector. The sector could also suffer from the introduction of the need for EU workers to obtain visas and work permits if the UK tightens its migration policy, reducing the UK’s access to high-skilled labour from the EU. Over time, if the UK loses its full access to the EU market and its high-skilled labour force, it may lose its competitive advantage as the EU financial hub. This could deter valuable investment and redirect it to other European financial centres.
Science and technology The main issue facing the science and technology sector in the UK after Brexit is its access to future funds. The UK receives more science and technology funding from the European Research Council (ERC) than the contribution it makes to the overall EU budget (Frenk et al., 201547). Consequently, the sector could face a loss of investment after Brexit when it no longer has access to these funds. In addition, the UK science and technology sector benefits from collaboration and skills from the rest of the EU. Depending on the agreements made after Brexit, sectors such as pharmaceuticals, for example, could experience less benefits from access to research groups and the skills and collaboration opportunities provided by the rest of the EU.
25
2.5.6. Persistent low productivity
UK productivity has stalled since the recession, puzzling economists and policymakers. Productivity is crucial for future economic growth; particularly as the UK employment and unemployment rates reach pre-recession levels. Output per worker fell by 0.3% in 2016, before picking back up by 0.6% in 2017. It is uncertain to what extent productivity will continue to improve in the future, particularly as there is little consensus on why productivity growth has been so weak since the recession. The Working Futures baseline forecast is of a modest recovery in productivity; faster than anticipated productivity growth could support a faster pick-up of average earnings growth with potential boosts to labour supply and to household incomes and spending.
2.5.7. UK deficit reduction measures
The government has indicated that the period of financial austerity is over, indicating that public spending is expected to increase after Brexit whilst the aim will be to continue to reduce the national debt. However, there is still uncertainty concerning planned UK deficit reduction measures that are still to come into effect and the impact that these will have on the post-Brexit economy, which could hit confidence and increase unemployment.
2.5.8. UK house prices
Following the uncertainties around the outcome of Brexit, UK house price inflation has been slowing since 2016, falling to 2.8% in the year to November 2018, the lowest growth rate since 2013. The slowdown in the housing market has mainly been driven by
48 KPMG LLP (2017). Labour migration in the hospitality sector. A KPMG report for the British Hospitality Association. KPMG Available from: https://www.bha.org.uk/wordpress/wp-content/uploads/2017/05/BHA-EU-migration-final-report-170518-public-vSTC.pdf
Box 2.3 (continued) : Discussion by sector Hospitality The hospitality sector is heavily reliant on foreign workers, with nearly a quarter of all jobs in the sector in the UK carried out by people from the rest of the EU (KPMG, 201748), highlighting the scale of potential negative supply-side impacts the sector could face if immigration from the EU is controlled more tightly following Brexit. However, demand from tourists for accommodation and food services continue to be strong, as international visitors to the UK face reduced travel costs following the depreciation of sterling against most currencies, and Britons substitute going abroad on holiday with staying within the UK on domestic holidays, which are relatively cheaper. Following Brexit, this could reverse if the pound recovers and the UK becomes a less attractive tourist destination.
26
a slowdown in the South and East of England and will have had a dampening effect on GDP growth. The lowest annual growth in house prices has been in London, where prices fell by 0.7% over the year to November 2018, continuing the monthly fall in house prices in the region since July 2018, as the area continues to be disproportionately affected by regulatory and tax changes. The strongest growth has been in the West Midlands (4.6% in the year to November 2018). The issue of a lack of affordable housing continues to prevail and has the risk of causing long-term structural problems for the UK economy, for example, by restricting the mobility of labour to high-priced areas.
2.6. UK labour market prospects
2.6.1. Population and the labour force
Over the period 2007-2017, the UK total resident population increased by 4.7 million (7.7%) to 66 million (see Figure 2.2). This was reflected in an 8.2% increase in the labour force, which rose by 2.5m to 33.4 million by 2017.
Over 2017-2027, the UK population is expected to grow by 0.5% per annum, a slightly slower increase compared to 2007-2017 (0.7% per annum). The population aged over 16 is also expected to grow at a slower rate over 2017-2027 than over 2007-2017 (see Table 2.3). The ageing population means that the working age population (16-64 years) is expected to increase by only around 780,000 (1.9%) over 2017-2027 (see Figure 2.2).
The number of children (aged less than 16 years) in the population rose during 2007-2017, alongside a continuing steady rise in the number of pensioners. Growth in the child population is expected to slow down over 2017-2027, with the number of children starting to fall from 2025. By 2027 the number of children is projected to be around 4.4% (around 550,000) higher than the 2017 level.
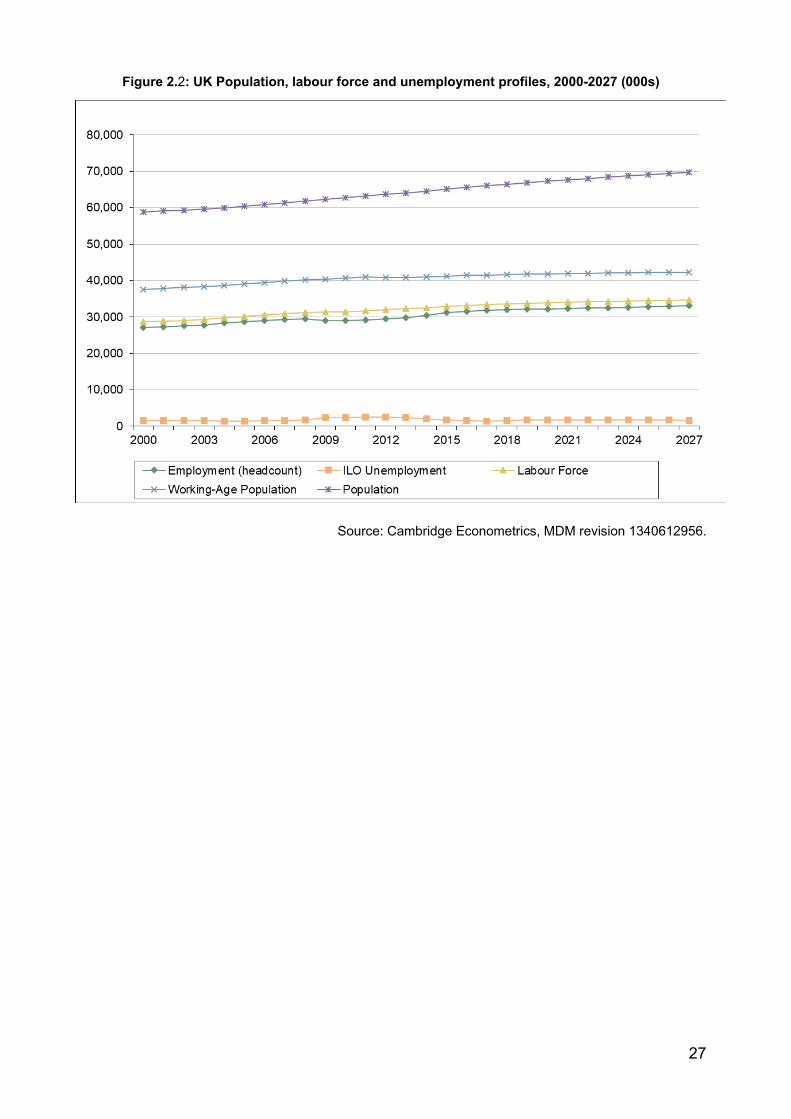
27
Figure 2.2: UK Population, labour force and unemployment profiles, 2000-2027 (000s)
Source: Cambridge Econometrics, MDM revision 1340612956.
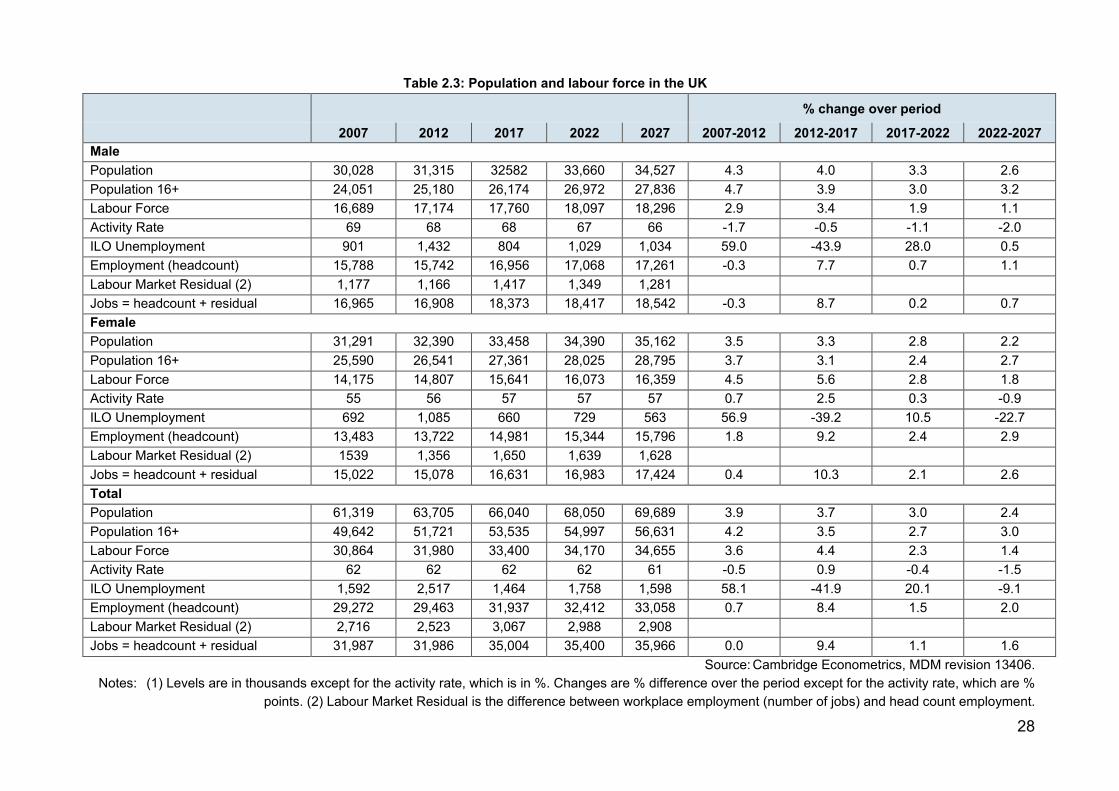
28
Table 2.3: Population and labour force in the UK
% change over period 2007 2012 2017 2022 2027 2007-2012 2012-2017 2017-2022 2022-2027 Male Population 30,028 31,315 32582 33,660 34,527 4.3 4.0 3.3 2.6 Population 16+ 24,051 25,180 26,174 26,972 27,836 4.7 3.9 3.0 3.2 Labour Force 16,689 17,174 17,760 18,097 18,296 2.9 3.4 1.9 1.1 Activity Rate 69 68 68 67 66 -1.7 -0.5 -1.1 -2.0 ILO Unemployment 901 1,432 804 1,029 1,034 59.0 -43.9 28.0 0.5 Employment (headcount) 15,788 15,742 16,956 17,068 17,261 -0.3 7.7 0.7 1.1 Labour Market Residual (2) 1,177 1,166 1,417 1,349 1,281 Jobs = headcount + residual 16,965 16,908 18,373 18,417 18,542 -0.3 8.7 0.2 0.7 Female Population 31,291 32,390 33,458 34,390 35,162 3.5 3.3 2.8 2.2 Population 16+ 25,590 26,541 27,361 28,025 28,795 3.7 3.1 2.4 2.7 Labour Force 14,175 14,807 15,641 16,073 16,359 4.5 5.6 2.8 1.8 Activity Rate 55 56 57 57 57 0.7 2.5 0.3 -0.9 ILO Unemployment 692 1,085 660 729 563 56.9 -39.2 10.5 -22.7 Employment (headcount) 13,483 13,722 14,981 15,344 15,796 1.8 9.2 2.4 2.9 Labour Market Residual (2) 1539 1,356 1,650 1,639 1,628 Jobs = headcount + residual 15,022 15,078 16,631 16,983 17,424 0.4 10.3 2.1 2.6 Total Population 61,319 63,705 66,040 68,050 69,689 3.9 3.7 3.0 2.4 Population 16+ 49,642 51,721 53,535 54,997 56,631 4.2 3.5 2.7 3.0 Labour Force 30,864 31,980 33,400 34,170 34,655 3.6 4.4 2.3 1.4 Activity Rate 62 62 62 62 61 -0.5 0.9 -0.4 -1.5 ILO Unemployment 1,592 2,517 1,464 1,758 1,598 58.1 -41.9 20.1 -9.1 Employment (headcount) 29,272 29,463 31,937 32,412 33,058 0.7 8.4 1.5 2.0 Labour Market Residual (2) 2,716 2,523 3,067 2,988 2,908 Jobs = headcount + residual 31,987 31,986 35,004 35,400 35,966 0.0 9.4 1.1 1.6
Source: Cambridge Econometrics, MDM revision 13406. Notes: (1) Levels are in thousands except for the activity rate, which is in %. Changes are % difference over the period except for the activity rate, which are %
points. (2) Labour Market Residual is the difference between workplace employment (number of jobs) and head count employment.
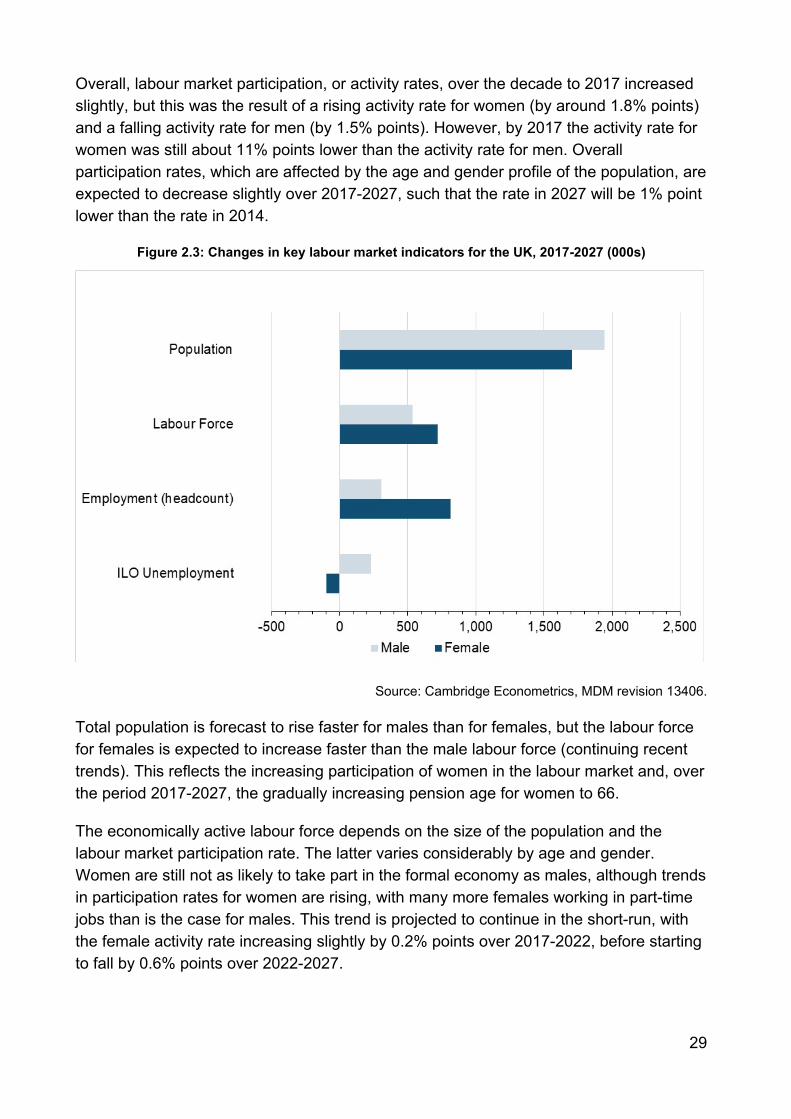
29
Overall, labour market participation, or activity rates, over the decade to 2017 increased slightly, but this was the result of a rising activity rate for women (by around 1.8% points) and a falling activity rate for men (by 1.5% points). However, by 2017 the activity rate for women was still about 11% points lower than the activity rate for men. Overall participation rates, which are affected by the age and gender profile of the population, are expected to decrease slightly over 2017-2027, such that the rate in 2027 will be 1% point lower than the rate in 2014.
Figure 2.3: Changes in key labour market indicators for the UK, 2017-2027 (000s)
Source: Cambridge Econometrics, MDM revision 13406.
Total population is forecast to rise faster for males than for females, but the labour force for females is expected to increase faster than the male labour force (continuing recent trends). This reflects the increasing participation of women in the labour market and, over the period 2017-2027, the gradually increasing pension age for women to 66.
The economically active labour force depends on the size of the population and the labour market participation rate. The latter varies considerably by age and gender. Women are still not as likely to take part in the formal economy as males, although trends in participation rates for women are rising, with many more females working in part-time jobs than is the case for males. This trend is projected to continue in the short-run, with the female activity rate increasing slightly by 0.2% points over 2017-2022, before starting to fall by 0.6% points over 2022-2027.
30
2.6.2. Employment
Employment can be defined and measured in a variety of ways (see Box 2.4 for details):
• numbers of jobs;
• numbers of people in employment (heads);
• by area of workplace; and
• by area of residence.
In most of Working Futures 2017-2027, the term employment is used to refer to the number of jobs located in a particular area (generally, where the workplace is located). Box 2.4 provides the alternative definitions of employment and other labour market indicators. Unless indicated otherwise, data on employment in tables and charts show the number of workplace jobs rather than numbers of people or place of residence.
Box 2.4: Definitions of employment and related labour market indicators
Alternative definitions There are various ways of looking at employment. For example, a distinction can be made between the number of people in employment (head count) and the number of jobs. These two concepts represent different things, as one person may hold more than one job. In addition, a further distinction can be made between area of residence and area of workplace.
Similarly, there are various different definitions of unemployment, the labour force, workforce and population. In Working Futures 2017-2027 the following definitions are used:
Residence basis: measured at place of residence, as in the Labour Force Survey (LFS).
Workplace basis: measured at place of work, as in the Annual Business Inquiry (ABI) and Business Register and Employment Survey (BRES).
31
Workplace employment (number of jobs): these are typically estimated using surveys of employers, such as the ABI and BRES, focusing upon the numbers of jobs in their establishments. In this report references to employment relate to the number of jobs unless otherwise stated.
Box 2.4 (continued): Definitions of employment and related labour market indicators
Employed residents (head count): the number of people in employment. These estimates are based primarily on data collected in household surveys, e.g. the LFS. People are classified according to their main job. Some have more than one job.
ILO unemployment: covers people who are out of work, want a job, have actively sought work in the previous four weeks and are available to start work within the next fortnight (or out of work and have accepted a job that they are waiting to start in the next fortnight).ox 2.4 (continued): Definitions of employment and related labour market indicators
Claimant Unemployed: measures people claiming Job Seeker’s Allowance benefits. This is also referred to as the “claimant count”.
Workforce: the size of the workforce is obtained by summing workplace employment (employee jobs and self-employment jobs), HM Forces, government-supported trainees and claimant unemployment.
Labour Force: economically active (employed residents plus ILO unemployed) age 16+.
Labour market participation or Economic activity rate: the number of people who are in employment or (ILO) unemployed as a % of the total population aged 16 and over. Labour Market Accounts Residual: workplace employment minus Residence employment. The main cause of the residual at national level is “double jobbing”. At a more disaggregated spatial level, net commuting across geographical boundaries is also very significant. The difference will also reflect data errors and other minor differences in data collection methods in the various sources.
Total Population: the total number of people resident in an area (residence basis).
Population 16+: the total number of people aged 16 and above (residence basis).
Working-age Population: the total number of people aged 16-64, (residence basis). The State Pension age of females was increased from 60 years in 2011 to 65 years in 2018. From 2019, the State Pension age for all (both males and females) will increase to 66 years by October 2020. The definition of working-age population is fixed at 16-64 years old for all periods in this study.
32
2.6.3. Employment by gender and employment status
In 2017, employment (workplace jobs) in the UK increased by just over 1.3%, supported by growth in female employment (see Figures 2.4 - 2.7). Female self-employment increased by 2.6% in 2017, whilst male self-employment decreased by 0.5%. There was also growth of around 1.8-2.2% in both male and female full-time employment. Male part-time employment also grew strongly in 2017 at 2.2%, while female part-time employment fell by about 0.4%.
The result is that around 59% (20.7 million) of all jobs in the UK in 2017 were full-time, while around 28% (9.6 million) were part-time. The remaining 13% (4.5 million) were self-employed (see Table 2.4).
Among men, full-time employee (jobs) was the dominant employment status, accounting for around 69% (12.7 million) of all jobs held by men. Around 2.6 million jobs held by men were part-time, representing 15% of all jobs held by men. Self-employment accounted for around 16% of jobs held by men. Amongst women, full-time employment accounted for just 48% of all jobs held by women in the UK in 2017, while around 42% were part-time jobs.
At 0.2% in 2018, employment growth is estimated to have been much weaker than it was in 2017, and this is expected to continue in 2019. The weaker growth applies generally across gender and employment type. After the strong growth in female self-employment in 2017, female self-employment is estimated to grow by only 0.4% in 2018 before a very slight decline.
The greatest increase is expected to be in part-time employment, driven by an increase in male part-time employment of 1.4%. Growth in full-time employment is expected to be very slow, while self-employment is expected to fall very slightly.
Overall, the number of jobs in the UK is projected to rise by around 962,000 over the next decade, which is an average annual growth of around 0.3%. More of these jobs are expected to be taken by female workers (791,000) than male (182,000). Female full-time employment is projected to grow at a faster pace (0.5% p.a.) than male full-time employment (-0.1% p.a.). Male part-time employment is projected to see the fastest growth (1.5% p.a.). These patterns are driven principally by the mix of industry sectors in which jobs are forecast to be created or lost (see Section 3). In addition, the expansion of self-employment (indicative of under-employment) seen in the earlier 2010s is not expected to be sustained over the longer term so that male self-employment is projected to fall slightly (-0.4% p.a.) and female self-employment to remain fairly static (-0.1% p.a.).
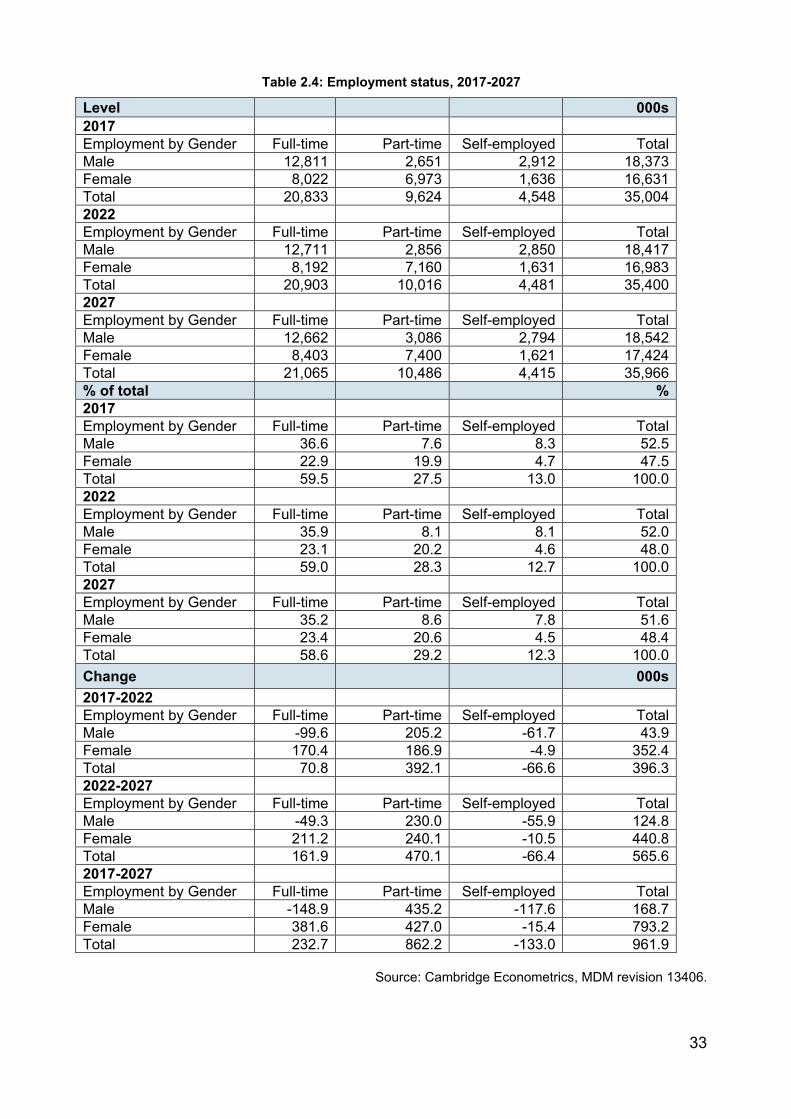
33
Table 2.4: Employment status, 2017-2027
Source: Cambridge Econometrics, MDM revision 13406.
Level 000s 2017 Employment by Gender Full-time Part-time Self-employed Total Male 12,811 2,651 2,912 18,373 Female 8,022 6,973 1,636 16,631 Total 20,833 9,624 4,548 35,004 2022 Employment by Gender Full-time Part-time Self-employed Total Male 12,711 2,856 2,850 18,417 Female 8,192 7,160 1,631 16,983 Total 20,903 10,016 4,481 35,400 2027 Employment by Gender Full-time Part-time Self-employed Total Male 12,662 3,086 2,794 18,542 Female 8,403 7,400 1,621 17,424 Total 21,065 10,486 4,415 35,966 % of total % 2017 Employment by Gender Full-time Part-time Self-employed Total Male 36.6 7.6 8.3 52.5 Female 22.9 19.9 4.7 47.5 Total 59.5 27.5 13.0 100.0 2022 Employment by Gender Full-time Part-time Self-employed Total Male 35.9 8.1 8.1 52.0 Female 23.1 20.2 4.6 48.0 Total 59.0 28.3 12.7 100.0 2027 Employment by Gender Full-time Part-time Self-employed Total Male 35.2 8.6 7.8 51.6 Female 23.4 20.6 4.5 48.4 Total 58.6 29.2 12.3 100.0 Change 000s 2017-2022 Employment by Gender Full-time Part-time Self-employed Total Male -99.6 205.2 -61.7 43.9 Female 170.4 186.9 -4.9 352.4 Total 70.8 392.1 -66.6 396.3 2022-2027 Employment by Gender Full-time Part-time Self-employed Total Male -49.3 230.0 -55.9 124.8 Female 211.2 240.1 -10.5 440.8 Total 161.9 470.1 -66.4 565.6 2017-2027 Employment by Gender Full-time Part-time Self-employed Total Male -148.9 435.2 -117.6 168.7 Female 381.6 427.0 -15.4 793.2 Total 232.7 862.2 -133.0 961.9
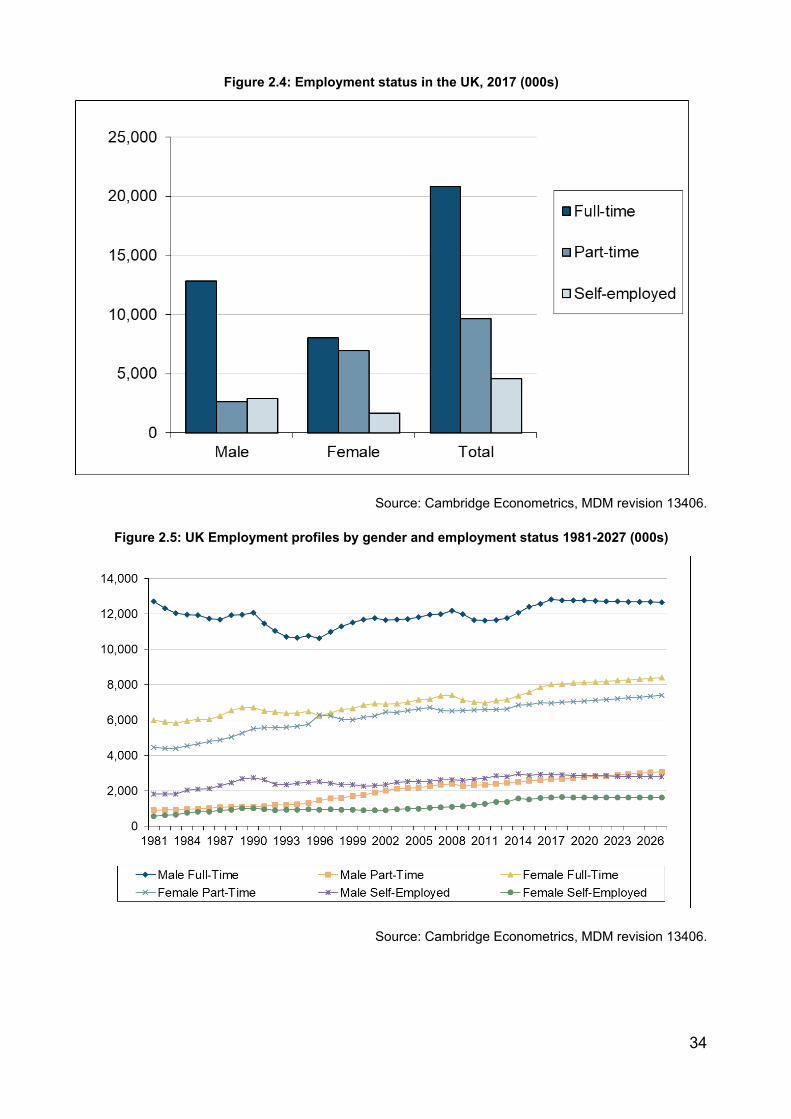
34
Figure 2.4: Employment status in the UK, 2017 (000s)
Source: Cambridge Econometrics, MDM revision 13406.
Figure 2.5: UK Employment profiles by gender and employment status 1981-2027 (000s)
Source: Cambridge Econometrics, MDM revision 13406.
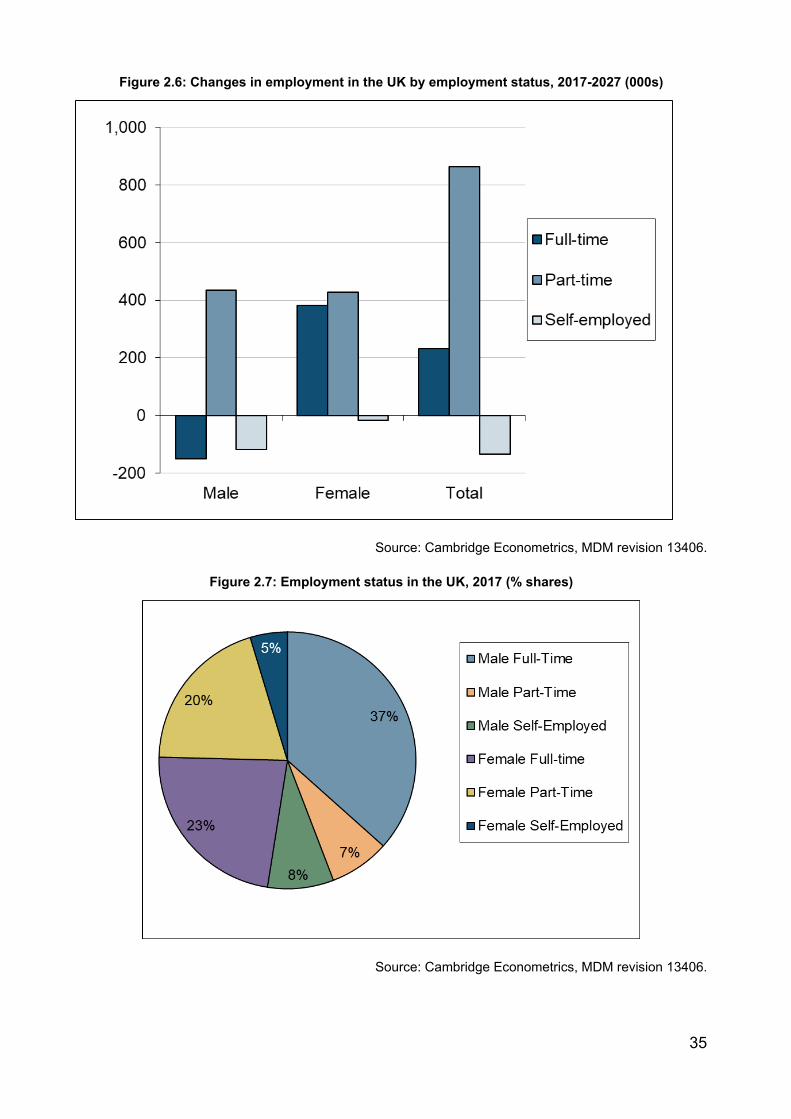
35
Figure 2.6: Changes in employment in the UK by employment status, 2017-2027 (000s)
Source: Cambridge Econometrics, MDM revision 13406.
Figure 2.7: Employment status in the UK, 2017 (% shares)
Source: Cambridge Econometrics, MDM revision 13406.

36
2.6.4. Claimant Count and ILO Unemployment
There are two commonly used measures of unemployment (see Table 2.4): the count of claimants and the ILO definition based on those actively searching for work. Again, Box 2.4 provides more detailed definitions of the terms.
The claimant count has recorded an increasing trend in unemployment since February 2016 from 0.76m to 1.1m in March 2019, its highest level since June 2014. It is worth noting that this is a less accurate measure of unemployment than the ILO definition, since it only counts people who claim jobseeker's allowance (JSA). Not everybody who is unemployed claims this benefit. Nevertheless, it is a clear signal that the labour market is worsening. The Department for Work and Pensions (DWP) has developed alternative measures of the unemployment rate.67
The LFS measure of unemployment, which is consistent with the ILO’s definition, however, records the unemployment rate at around 4.2% in 2018Q3, the lowest since the recession.68
While in previous years we have seen a shift away from employment in the public sector to employment in the private sector, due to the government attempt to decrease its fiscal deficit by reducing the number of public sector jobs, the LFS reveals that employment in both the public and private sector has increased recently. Between 2017Q3 and 2018Q3, the number employed in the public sector increased by 140,000 while the number employed in the private sector increased by 218,000.
ILO unemployment is forecast to rise slightly from 1.6 million in 2018 to 1.8 million in 2022, as the expansion of the labour force is outpaced by growth of employment. By 2027 unemployment is expected to start falling back to around 1.6 million. Over 2017-22, continued growth of activity rates among females will mean that the female labour force will grow slightly faster than employment. Consequently, there will be a rise in unemployment over 2017-22 for females. Over the same period, male unemployment is also expected to rise. During 2022-2027, the growth of female employment is forecast to remain fairly strong, in part because of the end to cuts in spending on public services, which typically employ a larger proportion of female workers. Consequently, female unemployment is forecast to fall once again to 2027.
67 The ONS advises that due to the impact of Universal Credit (UC), the claimant count is not a reliable labour market/economic indicator – because UC covers a broader range of claimants, so the claimant count will rise over time irrespective of economic/labour market conditions. DWP’s ‘alternative claimant count’ adjusts for this issue, and provides a consistent time series. 68 According to the DWP’s alternative measure unemployment did not rise over 2017/2018: Their unemployment rate (16+) shows a downward trend since September-November 2011. -Between Q1 2017 (Jan-Mar) and Q4 2018 (Oct-Dec) the unemployment rate fell 0.6 % points. -Between Q1 2017 (Jan-Mar) and Q1 2019 the unemployment rate fell 0.8 % points to 3.8%, the lowest rate since the 1970s.
37
3. Sectoral output and employment prospects
Key messages
This section presents the projections for six broad sectors, defined using the Standard Industrial Classification [divisions] as follows:
• Primary sector & utilities [01-09,35-39]
• Manufacturing [10-33]
• Construction [41-43]
• Trade, accommodation & transport [45-56]
• Business & other services [58-82,90-99]
• Public administration, education & health (or non-marketed services) [84-88]
Modest output growth is forecast over 2017 and 2027: with the exception of construction and business & other services, all broad sectors are forecast to grow faster per annum than in the ten years leading up to 2017, the period which included the global recession.
The sectors for which output is forecast to grow the fastest are business & other services, which despite slower growth than in the previous decade, will continue as a leading contributor to economy-wide growth; and public administration, education & health as the period of austerity after the recession comes to an end.
Consistent with current trends, manufacturing’s share of UK output is expected to decline, driven by increasing competition from overseas manufacturers and as the UK continues to move towards a service-orientated economy. However, manufacturing output is still forecast to grow, albeit at a slightly slower pace than the economy as a whole.
Employment will mostly reflect the trends observed in output across the six broad sectors; strongest growth is forecast in business & other services, and public administration, education & health.
Employment is anticipated to decrease in primary sector & utilities and manufacturing, in line with only modest output growth and anticipated productivity growth.
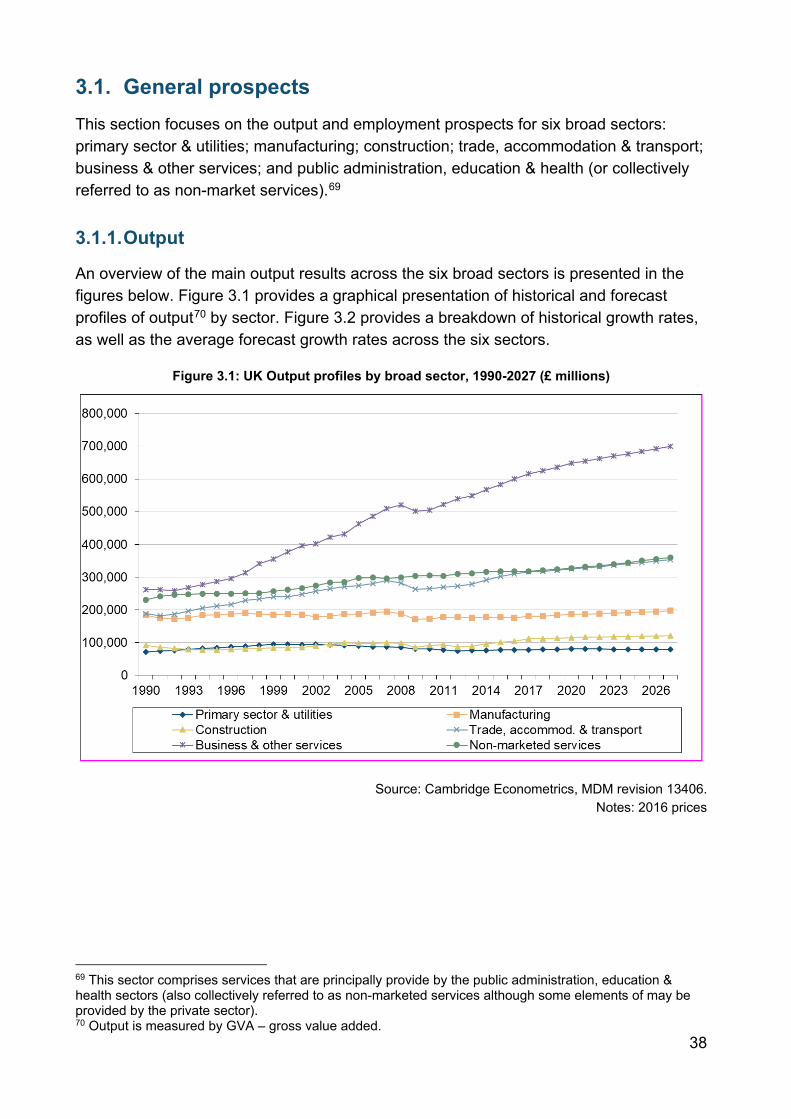
38
3.1. General prospects This section focuses on the output and employment prospects for six broad sectors: primary sector & utilities; manufacturing; construction; trade, accommodation & transport; business & other services; and public administration, education & health (or collectively referred to as non-market services).69
3.1.1. Output
An overview of the main output results across the six broad sectors is presented in the figures below. Figure 3.1 provides a graphical presentation of historical and forecast profiles of output70 by sector. Figure 3.2 provides a breakdown of historical growth rates, as well as the average forecast growth rates across the six sectors.
Figure 3.1: UK Output profiles by broad sector, 1990-2027 (£ millions)
Source: Cambridge Econometrics, MDM revision 13406. Notes: 2016 prices
69 This sector comprises services that are principally provide by the public administration, education & health sectors (also collectively referred to as non-marketed services although some elements of may be provided by the private sector). 70 Output is measured by GVA – gross value added.
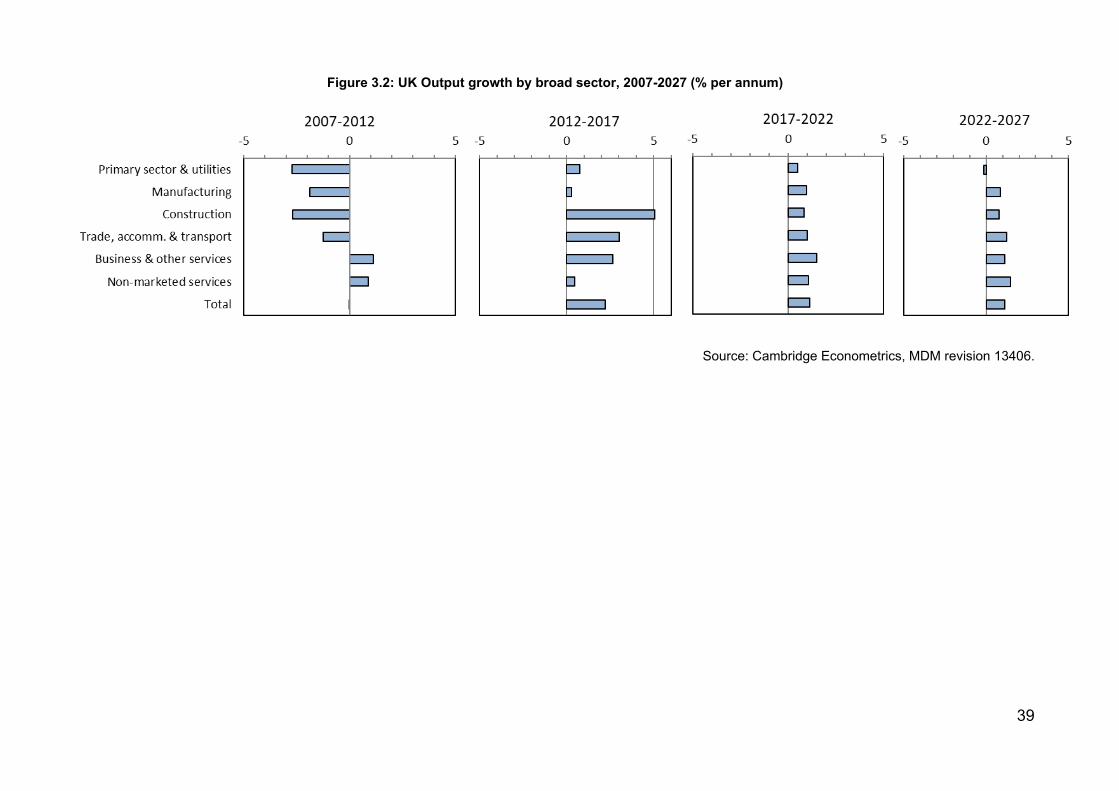
39
Figure 3.2: UK Output growth by broad sector, 2007-2027 (% per annum)
Source: Cambridge Econometrics, MDM revision 13406.
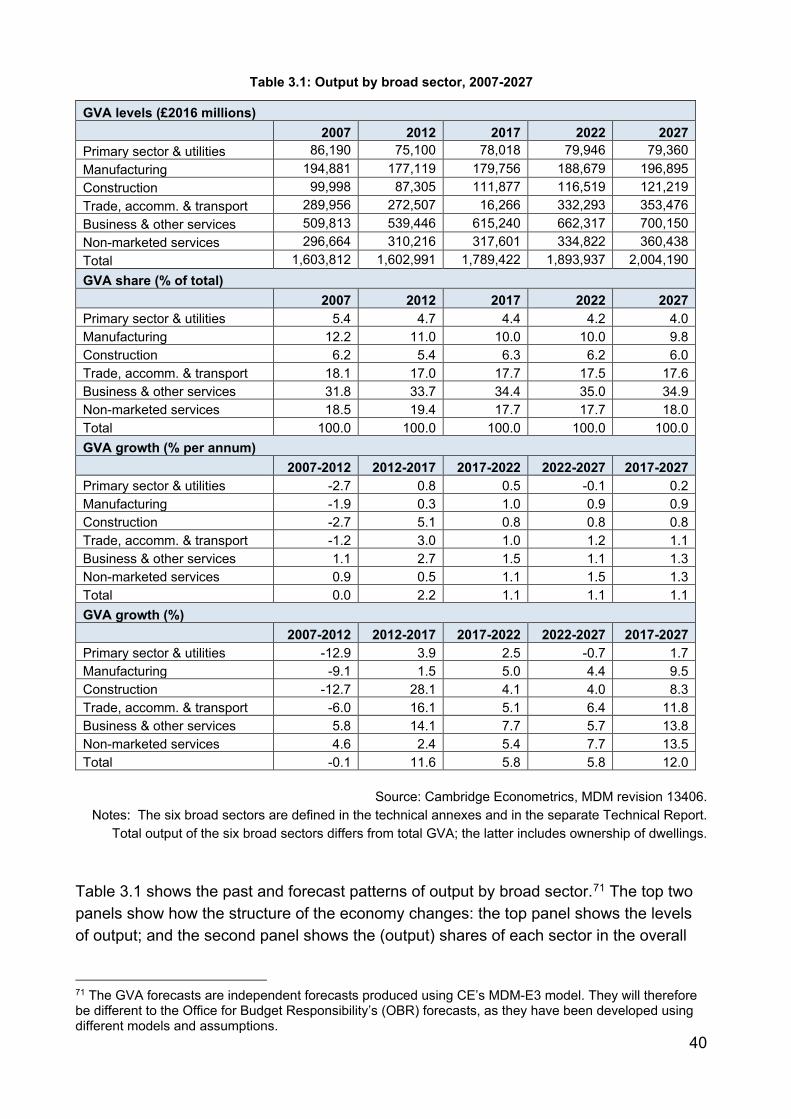
40
Table 3.1: Output by broad sector, 2007-2027
GVA levels (£2016 millions) 2007 2012 2017 2022 2027 Primary sector & utilities 86,190 75,100 78,018 79,946 79,360 Manufacturing 194,881 177,119 179,756 188,679 196,895 Construction 99,998 87,305 111,877 116,519 121,219 Trade, accomm. & transport 289,956 272,507 16,266 332,293 353,476 Business & other services 509,813 539,446 615,240 662,317 700,150 Non-marketed services 296,664 310,216 317,601 334,822 360,438 Total 1,603,812 1,602,991 1,789,422 1,893,937 2,004,190 GVA share (% of total) 2007 2012 2017 2022 2027 Primary sector & utilities 5.4 4.7 4.4 4.2 4.0 Manufacturing 12.2 11.0 10.0 10.0 9.8 Construction 6.2 5.4 6.3 6.2 6.0 Trade, accomm. & transport 18.1 17.0 17.7 17.5 17.6 Business & other services 31.8 33.7 34.4 35.0 34.9 Non-marketed services 18.5 19.4 17.7 17.7 18.0 Total 100.0 100.0 100.0 100.0 100.0 GVA growth (% per annum) 2007-2012 2012-2017 2017-2022 2022-2027 2017-2027 Primary sector & utilities -2.7 0.8 0.5 -0.1 0.2 Manufacturing -1.9 0.3 1.0 0.9 0.9 Construction -2.7 5.1 0.8 0.8 0.8 Trade, accomm. & transport -1.2 3.0 1.0 1.2 1.1 Business & other services 1.1 2.7 1.5 1.1 1.3 Non-marketed services 0.9 0.5 1.1 1.5 1.3 Total 0.0 2.2 1.1 1.1 1.1 GVA growth (%) 2007-2012 2012-2017 2017-2022 2022-2027 2017-2027 Primary sector & utilities -12.9 3.9 2.5 -0.7 1.7 Manufacturing -9.1 1.5 5.0 4.4 9.5 Construction -12.7 28.1 4.1 4.0 8.3 Trade, accomm. & transport -6.0 16.1 5.1 6.4 11.8 Business & other services 5.8 14.1 7.7 5.7 13.8 Non-marketed services 4.6 2.4 5.4 7.7 13.5 Total -0.1 11.6 5.8 5.8 12.0
Source: Cambridge Econometrics, MDM revision 13406.
Notes: The six broad sectors are defined in the technical annexes and in the separate Technical Report. Total output of the six broad sectors differs from total GVA; the latter includes ownership of dwellings.
Table 3.1 shows the past and forecast patterns of output by broad sector.71 The top two panels show how the structure of the economy changes: the top panel shows the levels of output; and the second panel shows the (output) shares of each sector in the overall
71 The GVA forecasts are independent forecasts produced using CE’s MDM-E3 model. They will therefore be different to the Office for Budget Responsibility’s (OBR) forecasts, as they have been developed using different models and assumptions.
41
economy. The bottom two panels show historical and forecast patterns of growth; the third panel presents annual growth rates, while the last panel shows the total % change over the period covered.
Over the decade 2017-2027, steady economic growth is expected, with total UK output forecast to grow at an average of 1.1% p.a. With the exception of construction and business & other services, all sectors are forecast to grow faster on average than during the ten years up to 2017, the period that included the global recession. The fastest growth is forecast in business & other services and public administration, education & health. Trade, accommodation & transport is forecast to grow at a similar pace to the economy average, whilst growth will be below average in primary sectors & utilities, manufacturing and construction.
The UK’s withdrawal from the EU and the surrounding uncertainty is expected to dampen UK growth in the short and medium term, leading to a continuation of the slower GVA growth rates seen after the recession. Depending on the future UK-EU relationship, a change in migration and demographic trends could impact demand, particularly in infrastructure and public administration, education & health. The composition of the UK economy split by the broad six sectors is expected to remain largely stable over the long term. One exception is primary sectors & utilities; consistent with historical trends, its share of total activity is expected to decline. Manufacturing is also following a similar trend, although the decline in the share of total activity is slower.
3.1.2. Employment
An overview of the main results for employment across the six broad sectors is presented in the charts below. Figure 3.3 provides a graphical representation of historical and forecast profiles of employment by sector, whilst Figure 3.4 and Figure 3.5 provide a breakdown of historical and forecast employment growth across the six sectors, as average percentage change per annum (Figure 3.4) and as changes in levels (Figure 3.5).
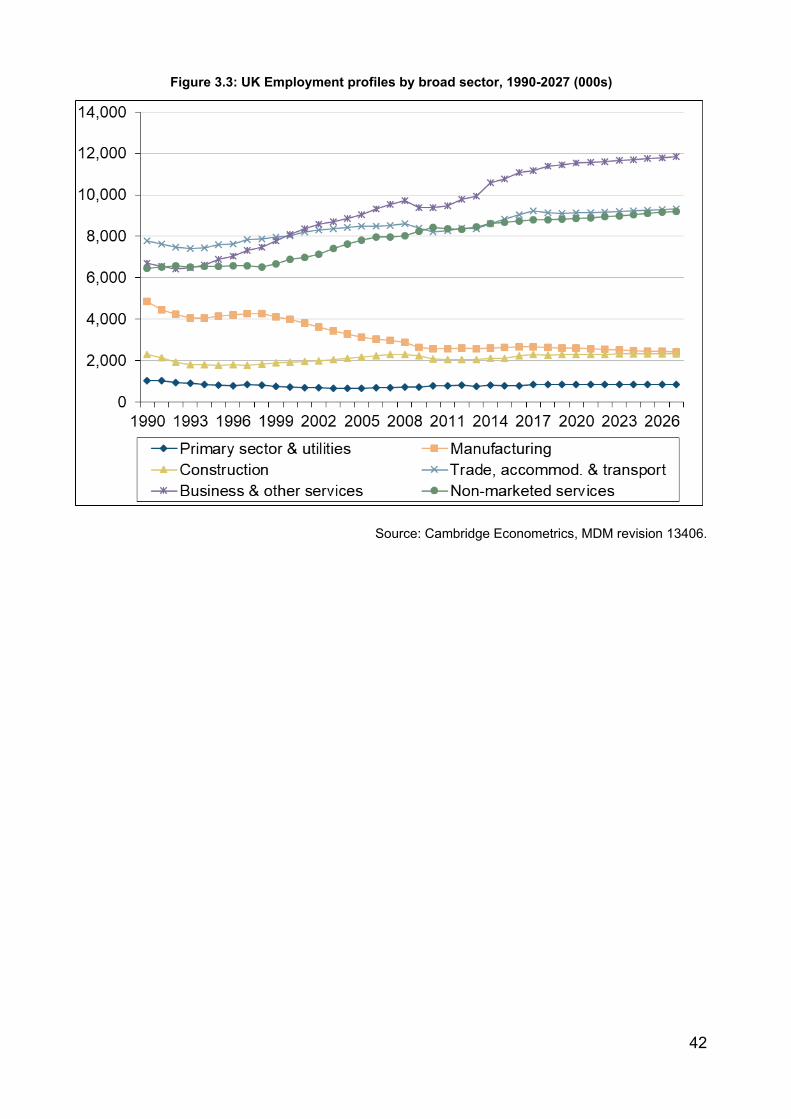
42
Figure 3.3: UK Employment profiles by broad sector, 1990-2027 (000s)
Source: Cambridge Econometrics, MDM revision 13406.
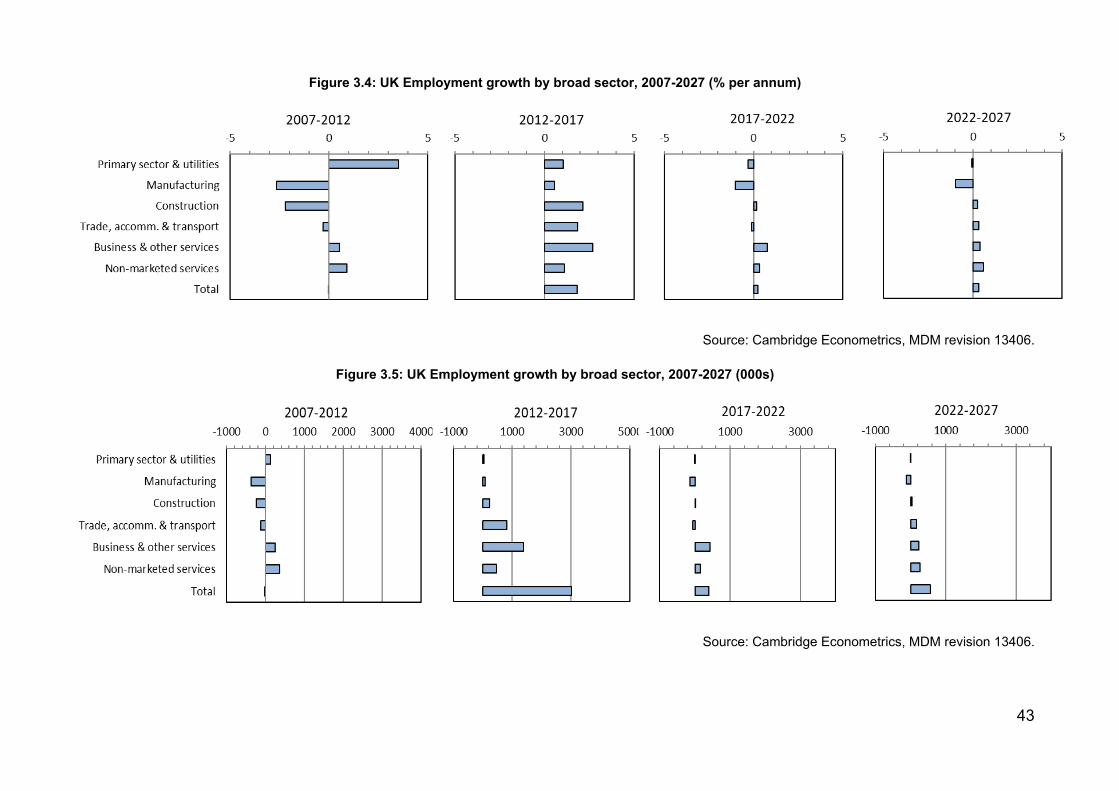
43
Figure 3.4: UK Employment growth by broad sector, 2007-2027 (% per annum)
Source: Cambridge Econometrics, MDM revision 13406.
Figure 3.5: UK Employment growth by broad sector, 2007-2027 (000s)
Source: Cambridge Econometrics, MDM revision 13406.
44
Table 3.2 shows the past and forecast patterns of employment by broad sector. The top two panels show how the structure of the economy changes: the top panel shows the levels of employment; and the second panel shows the (employment) shares of each sector in the overall economy. The bottom two panels show historical and forecast patterns of growth; the third panel presents annual growth rates, while the last panel shows the change in the numbers of jobs over the period covered.
Employment is forecast to grow modestly, at an average of 0.3% (or 96,000 jobs) p.a. over the forecast horizon. Total employment growth is likely to be lower than historical averages, and most notably, employment is expected to decrease at an average of around 0.2% p.a. in primary sectors & utilities and 1% in manufacturing over the forecast horizon. Cost pressures and technology improvements will likely decrease labour demand in traditional roles within these sectors.
The number of jobs in primary sectors & utilities is expected to decrease by just under 16,000 between 2017 and 2027, whilst the number of jobs in manufacturing is expected to decrease by around 257,000 over the same period. The number of jobs in public administration, education & health is expected to increase by 0.3% p.a. over 2017-2022, picking up to 0.6% p.a. by 2027, as austerity measures relax further.
Economy-wide employment growth over 2017-2027 is expected to be driven mainly by relatively stronger growth in jobs in business & other services and public administration, education & health, growing on average at 0.6% and 0.5% p.a. respectively. The modest growth rates reflect the uncertainty around Brexit, as businesses delay and deter investment decisions in the short-to-medium term.
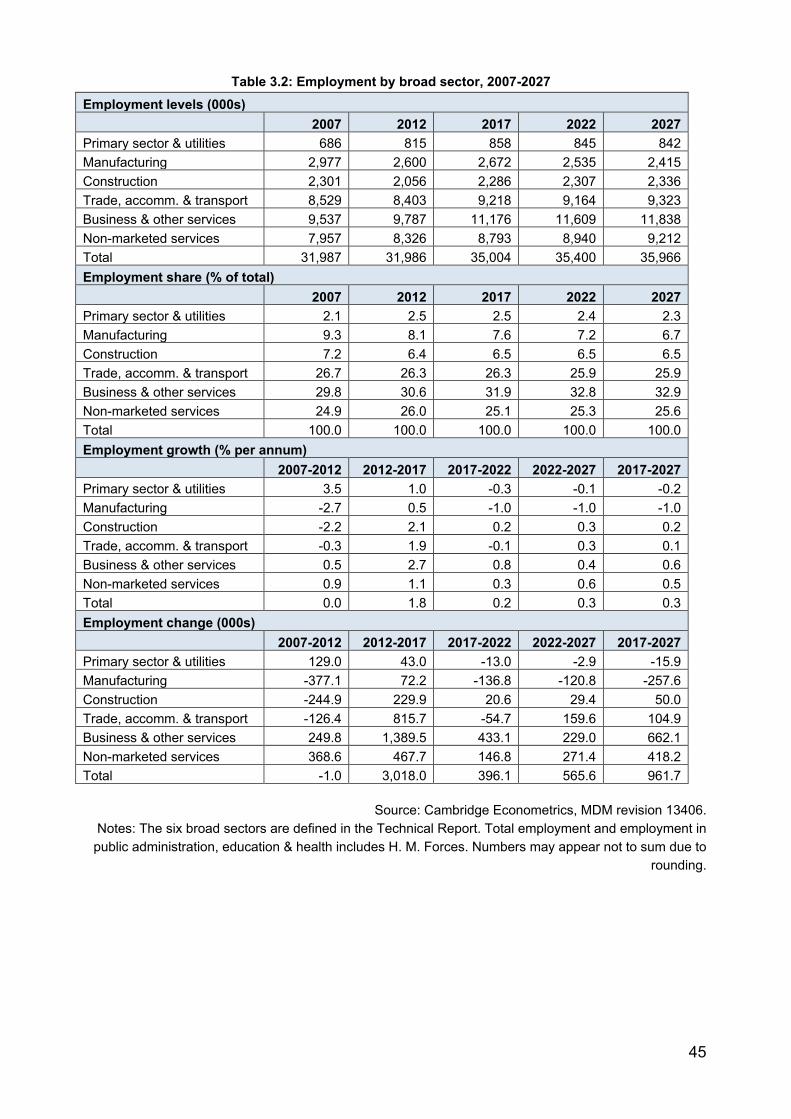
45
Table 3.2: Employment by broad sector, 2007-2027 Employment levels (000s) 2007 2012 2017 2022 2027 Primary sector & utilities 686 815 858 845 842 Manufacturing 2,977 2,600 2,672 2,535 2,415 Construction 2,301 2,056 2,286 2,307 2,336 Trade, accomm. & transport 8,529 8,403 9,218 9,164 9,323 Business & other services 9,537 9,787 11,176 11,609 11,838 Non-marketed services 7,957 8,326 8,793 8,940 9,212 Total 31,987 31,986 35,004 35,400 35,966 Employment share (% of total) 2007 2012 2017 2022 2027 Primary sector & utilities 2.1 2.5 2.5 2.4 2.3 Manufacturing 9.3 8.1 7.6 7.2 6.7 Construction 7.2 6.4 6.5 6.5 6.5 Trade, accomm. & transport 26.7 26.3 26.3 25.9 25.9 Business & other services 29.8 30.6 31.9 32.8 32.9 Non-marketed services 24.9 26.0 25.1 25.3 25.6 Total 100.0 100.0 100.0 100.0 100.0 Employment growth (% per annum) 2007-2012 2012-2017 2017-2022 2022-2027 2017-2027 Primary sector & utilities 3.5 1.0 -0.3 -0.1 -0.2 Manufacturing -2.7 0.5 -1.0 -1.0 -1.0 Construction -2.2 2.1 0.2 0.3 0.2 Trade, accomm. & transport -0.3 1.9 -0.1 0.3 0.1 Business & other services 0.5 2.7 0.8 0.4 0.6 Non-marketed services 0.9 1.1 0.3 0.6 0.5 Total 0.0 1.8 0.2 0.3 0.3 Employment change (000s) 2007-2012 2012-2017 2017-2022 2022-2027 2017-2027 Primary sector & utilities 129.0 43.0 -13.0 -2.9 -15.9 Manufacturing -377.1 72.2 -136.8 -120.8 -257.6 Construction -244.9 229.9 20.6 29.4 50.0 Trade, accomm. & transport -126.4 815.7 -54.7 159.6 104.9 Business & other services 249.8 1,389.5 433.1 229.0 662.1 Non-marketed services 368.6 467.7 146.8 271.4 418.2 Total -1.0 3,018.0 396.1 565.6 961.7
Source: Cambridge Econometrics, MDM revision 13406.
Notes: The six broad sectors are defined in the Technical Report. Total employment and employment in public administration, education & health includes H. M. Forces. Numbers may appear not to sum due to
rounding.
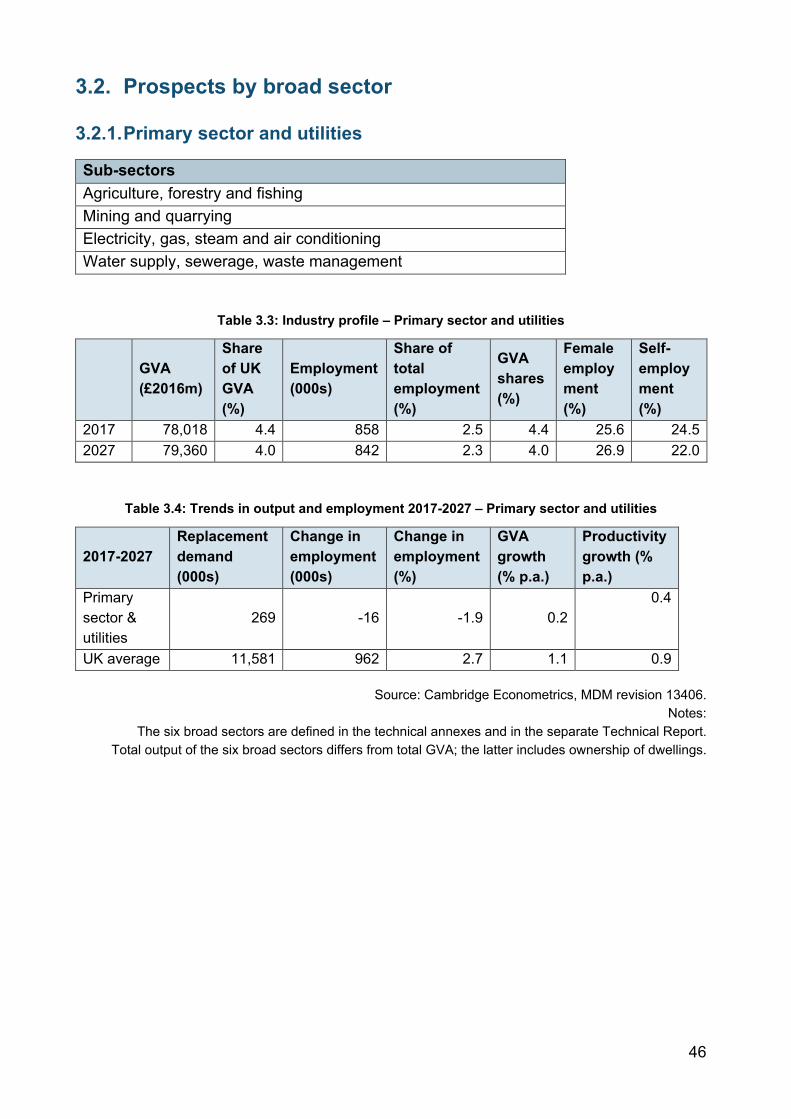
46
3.2. Prospects by broad sector
3.2.1. Primary sector and utilities
Sub-sectors Agriculture, forestry and fishing Mining and quarrying Electricity, gas, steam and air conditioning Water supply, sewerage, waste management
Table 3.3: Industry profile – Primary sector and utilities
GVA (£2016m)
Share of UK GVA (%)
Employment (000s)
Share of total employment (%)
GVA shares (%)
Female employment (%)
Self-employment (%)
2017 78,018 4.4 858 2.5 4.4 25.6 24.5 2027 79,360 4.0 842 2.3 4.0 26.9 22.0
Table 3.4: Trends in output and employment 2017-2027 – Primary sector and utilities
2017-2027 Replacement demand (000s)
Change in employment (000s)
Change in employment (%)
GVA growth (% p.a.)
Productivity growth (% p.a.)
Primary sector & utilities
269 -16 -1.9 0.2 0.4
UK average 11,581 962 2.7 1.1 0.9
Source: Cambridge Econometrics, MDM revision 13406. Notes:
The six broad sectors are defined in the technical annexes and in the separate Technical Report. Total output of the six broad sectors differs from total GVA; the latter includes ownership of dwellings.
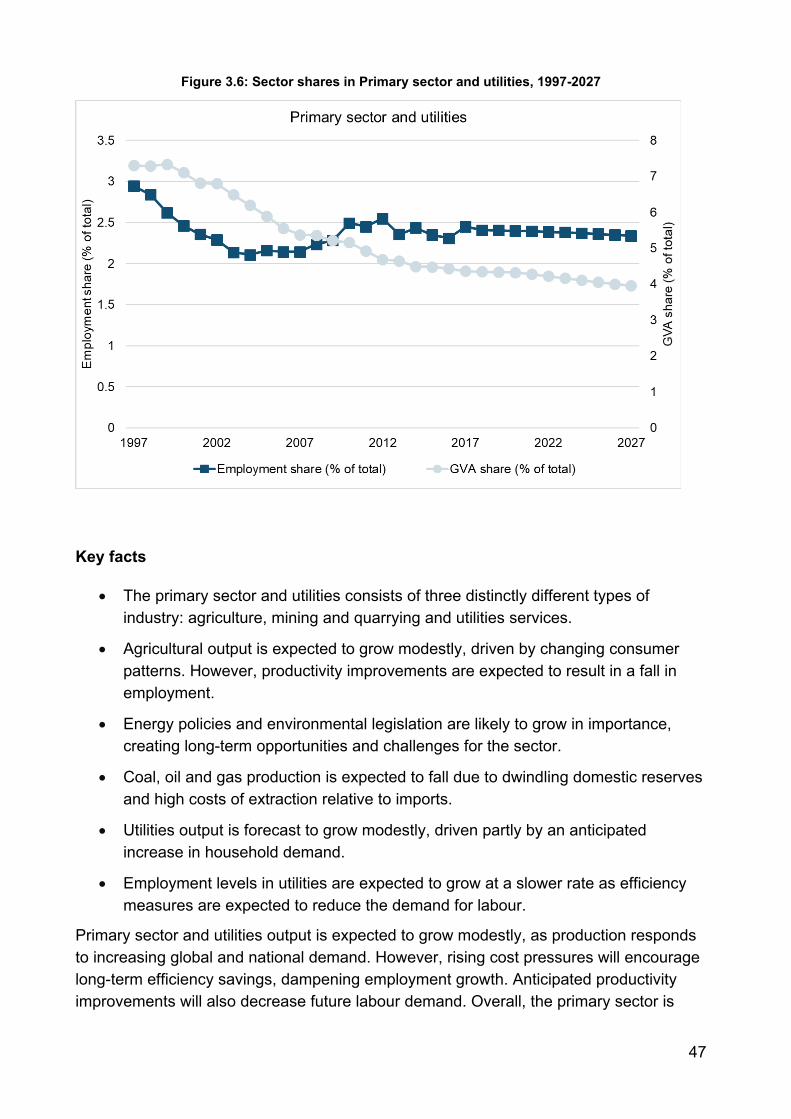
47
Figure 3.6: Sector shares in Primary sector and utilities, 1997-2027
Key facts
• The primary sector and utilities consists of three distinctly different types of industry: agriculture, mining and quarrying and utilities services.
• Agricultural output is expected to grow modestly, driven by changing consumer patterns. However, productivity improvements are expected to result in a fall in employment.
• Energy policies and environmental legislation are likely to grow in importance, creating long-term opportunities and challenges for the sector.
• Coal, oil and gas production is expected to fall due to dwindling domestic reserves and high costs of extraction relative to imports.
• Utilities output is forecast to grow modestly, driven partly by an anticipated increase in household demand.
• Employment levels in utilities are expected to grow at a slower rate as efficiency measures are expected to reduce the demand for labour.
Primary sector and utilities output is expected to grow modestly, as production responds to increasing global and national demand. However, rising cost pressures will encourage long-term efficiency savings, dampening employment growth. Anticipated productivity improvements will also decrease future labour demand. Overall, the primary sector is
48
expected to grow at an average of 0.2% p.a. from 2017 to 2027, with employment levels on average decreasing slightly over the same period.
As noted above, the sector comprises many different sub-sectors all of which have varying growth prospects. Because of structural differences, the prospects for these industries vary greatly, as reported below.
Growth in the UK’s agricultural output is expected to be modest, to meet changing domestic demand for food. Changes in consumption patterns are likely to be an important driver of changing demand for agricultural outputs, as changes in food and beverage purchases will affect food production’s demands for agricultural products. The UK remains a net importer of food and beverages, and this is expected to continue in the future, even as domestic products are substituted for imported foods in some markets (e.g. the move towards sourcing ‘local produce’). On balance, therefore, modest growth in agricultural and fishery activity is expected to increase demand for domestically produced foods and drinks, stimulating activity in agriculture and fishing industries. Depending on the outcome of Brexit, changes in the structure of subsidies or the level of subsidies in the agriculture sector could have either positive or negative impacts on food prices and UK agricultural production and imports.
Long-term increases in national demand for water and electricity are anticipated to stimulate utilities output. Energy policies and environmental legislation are likely to grow in importance for some of the primary & utilities sectors. In particular, pursuit of low-carbon energy alternatives, and waste reduction in water and minerals use may provide long-term opportunities and challenges for the sectors. Mining and quarrying activity will likely be dampened as a result of global carbon emission reduction targets, as demand for coal, oil and gas reduce. On the other hand, efforts to develop alternative energy-generating processes are likely to increase, generating increased demand for activity.
Other drivers will likely further harm the long-term prospects of mining and quarrying activities. Domestic resource depletion will be an important consideration. Consistent with current trends, lower extraction costs in other countries will increase demand for imports over domestic production.
Generally, improved productivity and efficiency savings will reduce traditional labour demand in the primary sectors. Investment, for example, into agricultural technology (“agri-tech”) within the UK will likely improve productivity. Cost pressures and competition from imports will encourage efficiency savings, reducing labour demand in the mining and quarrying industry. In the aggregate, employment levels in the Primary sector and utilities are expected to fall in the long-term.
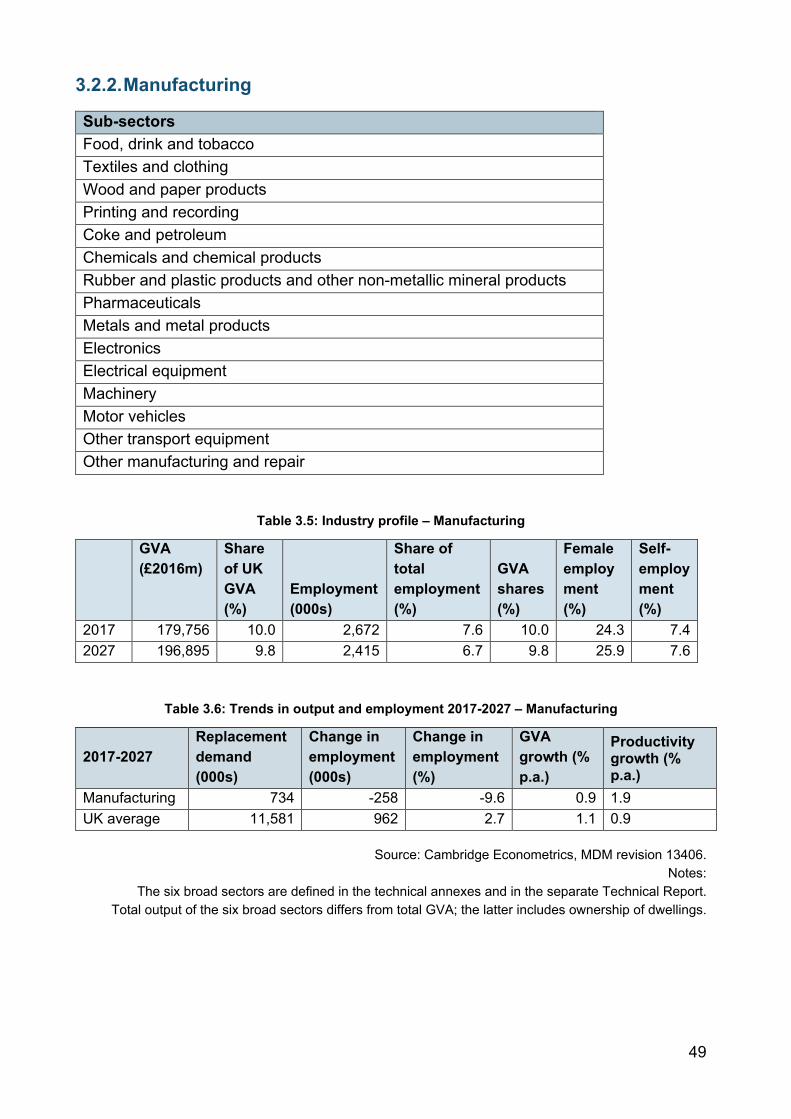
49
3.2.2. Manufacturing
Sub-sectors Food, drink and tobacco Textiles and clothing Wood and paper products Printing and recording Coke and petroleum Chemicals and chemical products Rubber and plastic products and other non-metallic mineral products Pharmaceuticals Metals and metal products Electronics Electrical equipment Machinery Motor vehicles Other transport equipment Other manufacturing and repair
Table 3.5: Industry profile – Manufacturing
GVA (£2016m)
Share of UK GVA (%)
Employment (000s)
Share of total employment (%)
GVA shares (%)
Female employment (%)
Self-employment (%)
2017 179,756 10.0 2,672 7.6 10.0 24.3 7.4 2027 196,895 9.8 2,415 6.7 9.8 25.9 7.6
Table 3.6: Trends in output and employment 2017-2027 – Manufacturing
2017-2027 Replacement demand (000s)
Change in employment (000s)
Change in employment (%)
GVA growth (% p.a.)
Productivity growth (% p.a.)
Manufacturing 734 -258 -9.6 0.9 1.9 UK average 11,581 962 2.7 1.1 0.9
Source: Cambridge Econometrics, MDM revision 13406. Notes:
The six broad sectors are defined in the technical annexes and in the separate Technical Report. Total output of the six broad sectors differs from total GVA; the latter includes ownership of dwellings.
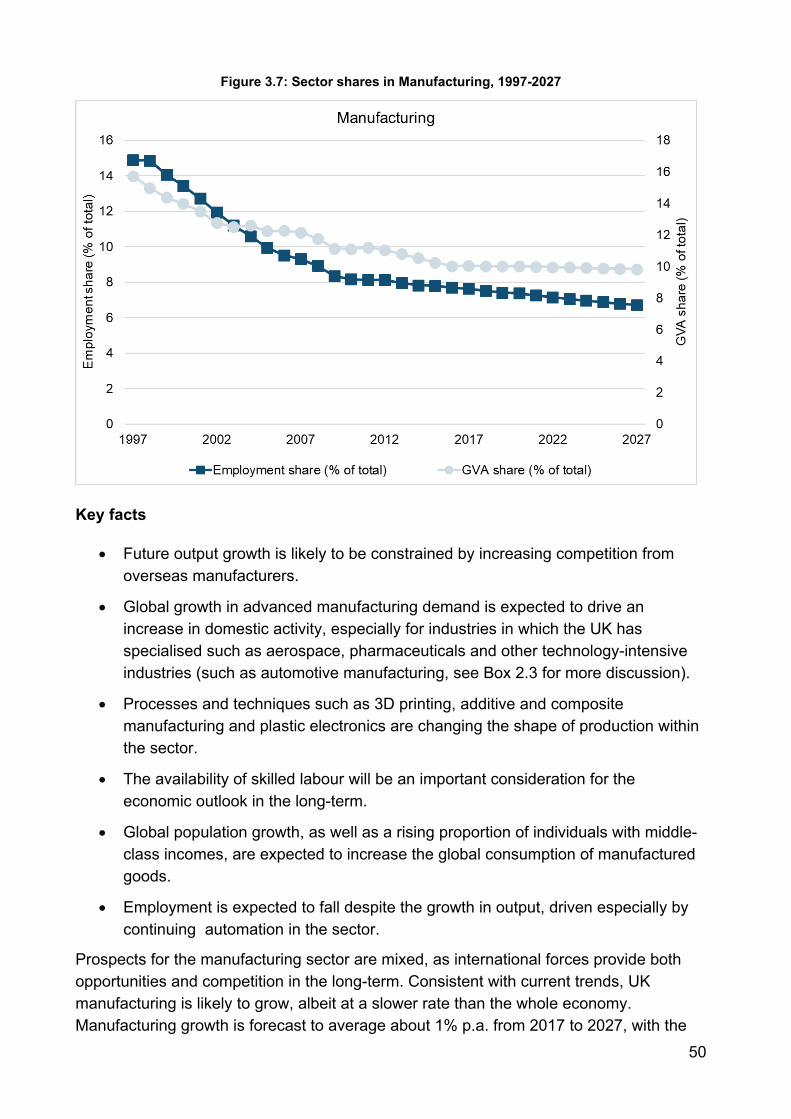
50
Figure 3.7: Sector shares in Manufacturing, 1997-2027
Key facts
• Future output growth is likely to be constrained by increasing competition from overseas manufacturers.
• Global growth in advanced manufacturing demand is expected to drive an increase in domestic activity, especially for industries in which the UK has specialised such as aerospace, pharmaceuticals and other technology-intensive industries (such as automotive manufacturing, see Box 2.3 for more discussion).
• Processes and techniques such as 3D printing, additive and composite manufacturing and plastic electronics are changing the shape of production within the sector.
• The availability of skilled labour will be an important consideration for the economic outlook in the long-term.
• Global population growth, as well as a rising proportion of individuals with middle-class incomes, are expected to increase the global consumption of manufactured goods.
• Employment is expected to fall despite the growth in output, driven especially by continuing automation in the sector.
Prospects for the manufacturing sector are mixed, as international forces provide both opportunities and competition in the long-term. Consistent with current trends, UK manufacturing is likely to grow, albeit at a slower rate than the whole economy. Manufacturing growth is forecast to average about 1% p.a. from 2017 to 2027, with the
51
number of jobs expected to fall by around 1% p.a. over the same period. Domestic drivers, such as long-term investment and specialisation, are expected to change the composition of manufacturing in the UK. Manufacturing as a share of total UK economic activity, therefore, is projected to decline.
International competitive forces are likely to weaken the growth in the UK manufacturing sector. Manufacturing industries activities within lower-income economies have been expanding in recent years, and this trend is likely to continue. Many emerging economies are also entering high-technology sectors54, areas in which the UK has specialised in recent years. Domestic firms are anticipated to continue offshoring and outsourcing the manufacturing process, diverting production and employment away from the UK.
Nevertheless, UK manufacturing output is still anticipated to grow, albeit modestly. Global demand for manufacturing exports is anticipated to increase, driven by growing population levels and increasing income per capita. The anticipated rise of the middle classes in developing countries will generate higher demand for goods and services. Global demand for UK manufacturing goods will be an important driver of increased manufacturing output, although the future trading relationships with the main markets to which UK exports (the European Union) are uncertain following the UK’s decision to leave the EU.
It is likely that manufacturing growth will be driven by advanced (high-technology) manufacturing in the future. Current trends indicate that manufacturing civil and defence aerospace components, machinery and equipment, and electronic goods are leaders or emerging leaders within manufacturing. It is anticipated that advanced manufacturing sectors such as these will show the strongest output growth within manufacturing.
The availability of skilled labour will be an essential determinant of activity. Current trends suggest that skill shortages are a sizeable concern55, and will be an important factor in the long-term, as UK manufacturers will require greater human capital to meet the growth in demand.
Innovation will play a major role in shaping the prospects of manufacturing. Innovation, especially in the high-tech industries that dominate the UK manufacturing sector such as aerospace component parts, pharmaceuticals, and green technologies, will be a crucial driver of productivity growth and competitiveness. However, whilst technological progress will improve production efficiency in the sector, it may also reduce the number of jobs in the long-term. Anticipated future technologies in manufacturing activities such as sensors technology, advanced and autonomous robotics, and big data and knowledge-based automation, will increase automation and improve production processes. These changes
54 Adopting the definitions of Eurostat, high-tech manufacturing encompasses manufacture of basic pharmaceutical products and pharmaceutical preparations; Manufacture of computer, electronic and optical products; and manufacture of air and spacecraft and related machinery. 55 The British Chambers of Commerce’s quarterly economic survey: https://www.britishchambers.org.uk/news/2019/01/bcc-quarterly-economic-survey-big-squeeze-on-firms-from-recruitment-prices-and-cash-flow
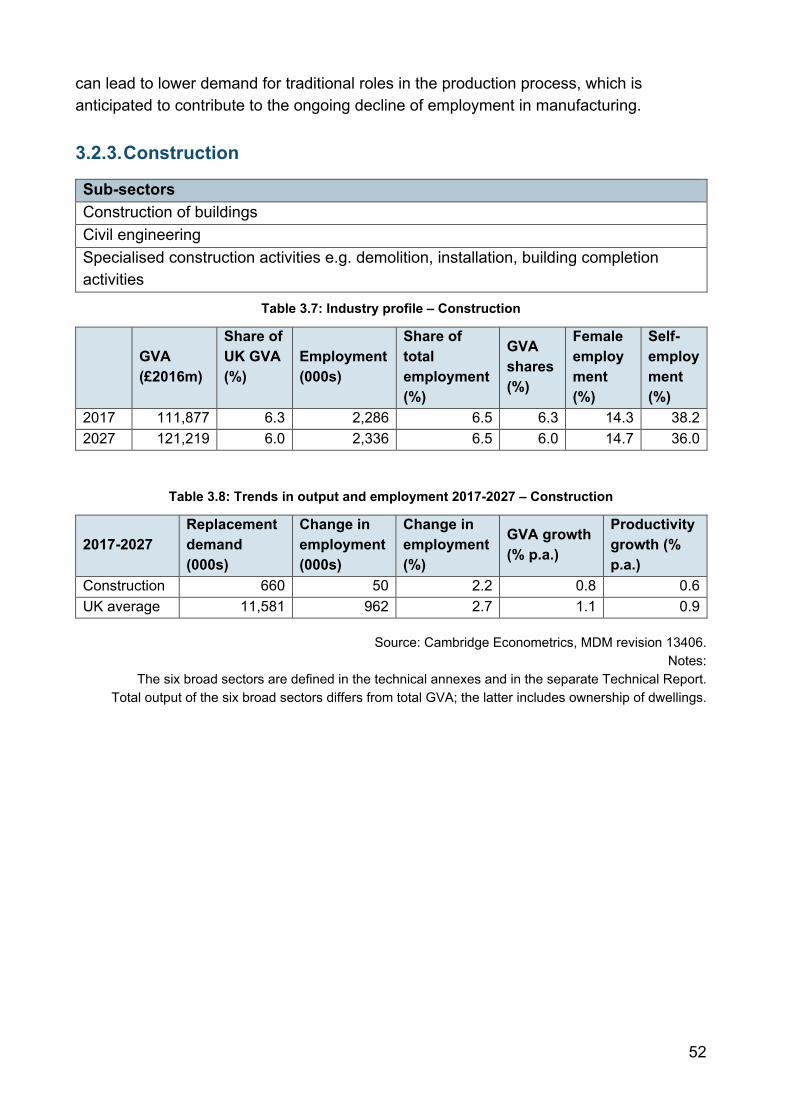
52
can lead to lower demand for traditional roles in the production process, which is anticipated to contribute to the ongoing decline of employment in manufacturing.
3.2.3. Construction
Sub-sectors Construction of buildings Civil engineering Specialised construction activities e.g. demolition, installation, building completion activities
Table 3.7: Industry profile – Construction
GVA (£2016m)
Share of UK GVA (%)
Employment (000s)
Share of total employment (%)
GVA shares (%)
Female employment (%)
Self-employment (%)
2017 111,877 6.3 2,286 6.5 6.3 14.3 38.2 2027 121,219 6.0 2,336 6.5 6.0 14.7 36.0
Table 3.8: Trends in output and employment 2017-2027 – Construction
2017-2027 Replacement demand (000s)
Change in employment (000s)
Change in employment (%)
GVA growth (% p.a.)
Productivity growth (% p.a.)
Construction 660 50 2.2 0.8 0.6 UK average 11,581 962 2.7 1.1 0.9
Source: Cambridge Econometrics, MDM revision 13406. Notes:
The six broad sectors are defined in the technical annexes and in the separate Technical Report. Total output of the six broad sectors differs from total GVA; the latter includes ownership of dwellings.
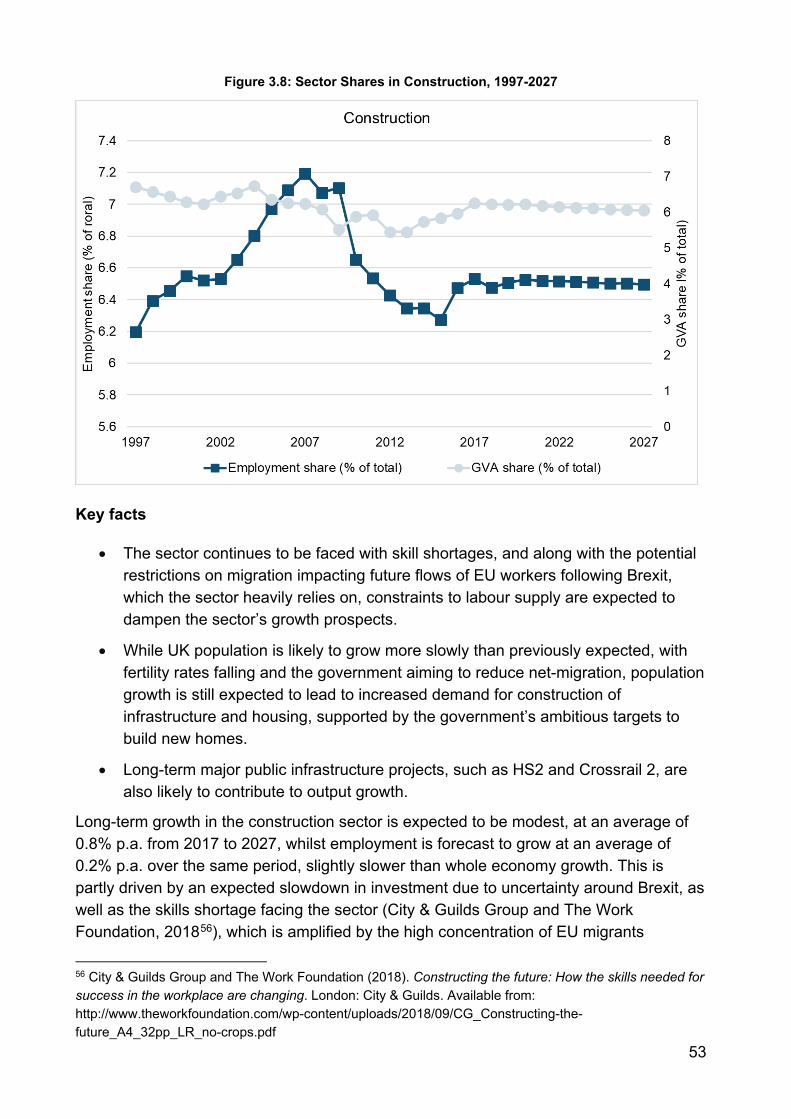
53
Figure 3.8: Sector Shares in Construction, 1997-2027
Key facts
• The sector continues to be faced with skill shortages, and along with the potential restrictions on migration impacting future flows of EU workers following Brexit, which the sector heavily relies on, constraints to labour supply are expected to dampen the sector’s growth prospects.
• While UK population is likely to grow more slowly than previously expected, with fertility rates falling and the government aiming to reduce net-migration, population growth is still expected to lead to increased demand for construction of infrastructure and housing, supported by the government’s ambitious targets to build new homes.
• Long-term major public infrastructure projects, such as HS2 and Crossrail 2, are also likely to contribute to output growth.
Long-term growth in the construction sector is expected to be modest, at an average of 0.8% p.a. from 2017 to 2027, whilst employment is forecast to grow at an average of 0.2% p.a. over the same period, slightly slower than whole economy growth. This is partly driven by an expected slowdown in investment due to uncertainty around Brexit, as well as the skills shortage facing the sector (City & Guilds Group and The Work Foundation, 201856), which is amplified by the high concentration of EU migrants
56 City & Guilds Group and The Work Foundation (2018). Constructing the future: How the skills needed for success in the workplace are changing. London: City & Guilds. Available from: http://www.theworkfoundation.com/wp-content/uploads/2018/09/CG_Constructing-the-future_A4_32pp_LR_no-crops.pdf
54
employed in the sector that may be affected following Brexit. In particular, the reports states the sector is struggling to attract and retain young workers and finds that skills demanded by the sector are becoming outdated due to technological advances.
Increased demand will come from the need for more private housing, commercial buildings and infrastructure, spurred by national population growth, increased economic activity, and the government’s ambitious targets to build new homes.
National population levels are forecast by the ONS to reach just under 70 million by mid-2027. Population is anticipated to grow slower in the future than it has done in the past, which is likely to have a dampening effect on demand.
Major railway and road-building projects initiated under previous administrations and continued by current and successive governments are expected to generate sustained demand for construction output. One example is the High Speed Two (HS2) Limited project, a major government-planned project that will likely continue to provide employment and business in construction during the project timespan; construction is expected to take place between 2019 and 2026. A similar example is the Crossrail project, for which work is almost complete; as the “biggest construction project in Europe” (Crossrail, 201557), this project alone has created 15,000 extra jobs (ibid.).
Long-term global commitments to climate change and sustainability will continue to be key concerns, generating new opportunities and challenges for the construction sector. For example, environment policy in the built environment is anticipated to create new opportunities and areas of growth in the sector, as firms seek innovative processes and technologies to adapt to wider environmental concerns.
New business opportunities will also generate new demand for construction goods. The focus in recent years on “smart construction” and “digital design” (HM Government, 2013, p.32) will grow as initiatives to create smart cities intensify. Smart cities are where “traditional networks and services are made more efficient with the use of digital and telecommunication technologies, for the benefit of its inhabitants and businesses” (European Commission, 201558). Replacing ageing energy infrastructure (Ove Arup & Partners Ltd, 2013, p.859) to meet the digital requirements, as well as creating and designing environments amenable for the implementation of ICT systems, are new types of demand that are expected to generate strong construction growth in the long-term.
57 Crossrail Ltd. (2015). Europe's largest construction project, November. Available from: http://www.crossrail.co.uk/construction/. 58 European Commission (2015). Smart Cities, Available from: http://ec.europa.eu/digital-agenda/en/smart-cities. 59 ARUP (2013). The Smart City Market: Opportunities for the UK. Department for Business, Innovation and Skills: London.
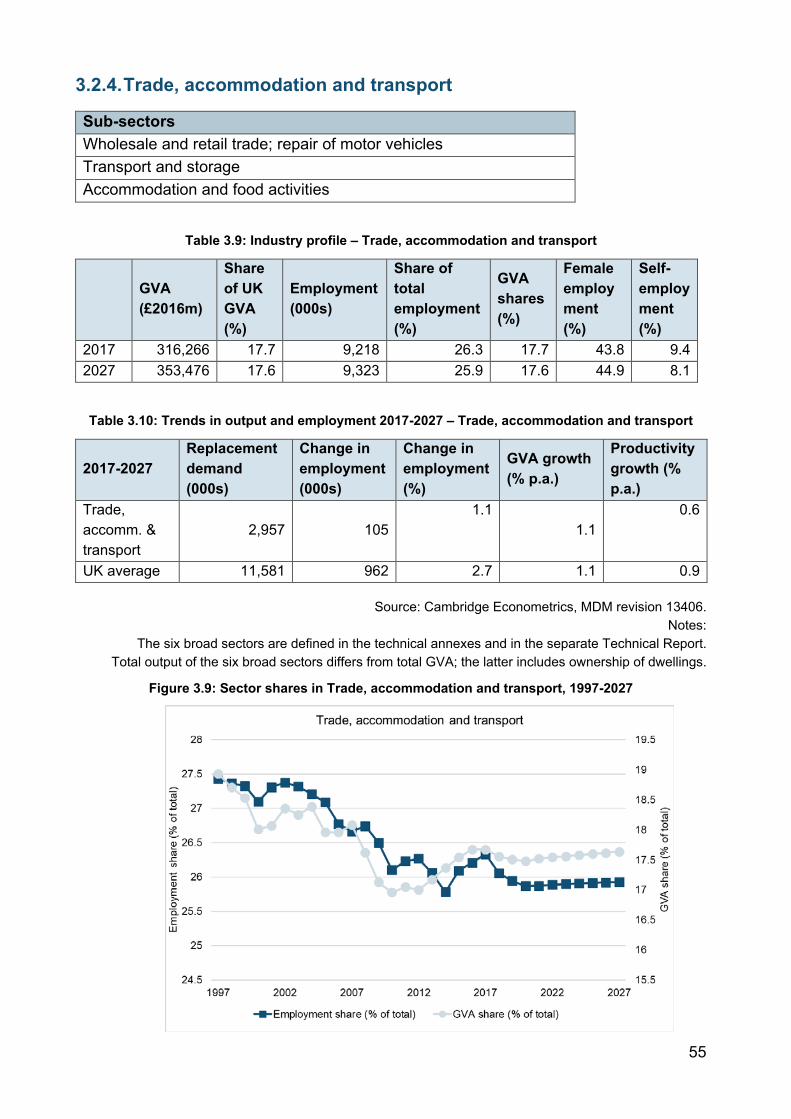
55
3.2.4. Trade, accommodation and transport
Sub-sectors Wholesale and retail trade; repair of motor vehicles Transport and storage Accommodation and food activities
Table 3.9: Industry profile – Trade, accommodation and transport
GVA (£2016m)
Share of UK GVA (%)
Employment (000s)
Share of total employment (%)
GVA shares (%)
Female employment (%)
Self-employment (%)
2017 316,266 17.7 9,218 26.3 17.7 43.8 9.4 2027 353,476 17.6 9,323 25.9 17.6 44.9 8.1
Table 3.10: Trends in output and employment 2017-2027 – Trade, accommodation and transport
2017-2027 Replacement demand (000s)
Change in employment (000s)
Change in employment (%)
GVA growth (% p.a.)
Productivity growth (% p.a.)
Trade, accomm. & transport
2,957 105 1.1
1.1 0.6
UK average 11,581 962 2.7 1.1 0.9
Source: Cambridge Econometrics, MDM revision 13406. Notes:
The six broad sectors are defined in the technical annexes and in the separate Technical Report. Total output of the six broad sectors differs from total GVA; the latter includes ownership of dwellings.
Figure 3.9: Sector shares in Trade, accommodation and transport, 1997-2027
56
Key facts
• The performance of this broad sector hinges on factors such as household disposable income and business activities.
• Employment growth in the sector is expected to be mainly driven by jobs growth in retail, accommodation and catering.
• The strongest output growth is likely to be observed in accommodation and air transport services, although there may be capacity constraints, especially in London.
• Changing consumer behaviour, such as continued switching to purchasing goods online, is expected to increase demand in postal and courier activities, and transportation and distributional services. At the same time, this shift in consumer patterns is likely to dampen employment growth in retail, as high streets continue to suffer from the rise of online shopping, particularly as new technologies improve the ease and efficiencies in online browsing and delivery.
• In addition, increased automation and improvements in technology are likely to reduce labour demand in some traditional roles, such as retail check-out staff, resulting in a slowdown in employment growth in the sector following decades of strong growth up to the recession.
• Retail, accommodation and food services, as well as transportation services are likely to be partly dependent on the outlook for tourism growth.
The performance of the trade, accommodation & transport sector is often dependent on the amount of activity in the wider economy. Output of trade, accommodation & transport is forecast to grow at a pace similar to the economy average (1.1% p.a.) over 2017-2027, whilst employment will grow a little slower than average at around 0.1% p.a.
Many different factors will drive this long-term trend, because the sector is formed of many structurally different industries, all of which have unique outlooks. The air transport, accommodation and retail trade sectors are expected to grow fastest, whilst warehousing and wholesale activity, which are closely associated with firm activity and household income, are expected to grow closer to the sector average over the same horizon period.
Although the growth of the air transport industry is expected to be faster than the sector average, it is anticipated to slow compared to historical trends for the industry. Air travel growth is driven partly by economic factors, such as oil prices, income and GDP growth, as well as wider societal considerations, such as carbon commitments and behavioural changes (DfT, 2017, p.1060). According to the Department for Transport, air travel per passenger is forecast to slow down to grow at approximately 1.2-1.5% p.a. compared to an annual rate averaging 3.8% since 1990, due to factors such as market maturity, lower long term economic forecasts, capacity constraints and a significant rise in carbon prices.
60 Department for Transport, (2017). UK Aviation Forecasts, Department for Transport: London.
57
Growth would also be constrained by existing airport capacity, hence current considerations to undertake airport expansion projects. In particular, one focus will be on improving airport capacity in the South East, in order to maintain the country’s status as a “global hub for aviation” (Airports Commission, 2015, p.961).
The expected future performance of the retail, accommodation and food industry will be an important driver of wider sectoral growth. Demand for this industry is closely tied to domestic income and spending. Household expenditure growth is forecast to be modest (1.7-2% p.a. over 2017-2027), as the economy recovers from the impact of the Brexit uncertainties it currently faces. At the same time, these sectors are heavily reliant on foreign workers, in particular from the EU, highlighting the scale of potential negative supply-side impacts the sectors could face if immigration from the EU is controlled more tightly following Brexit.
A key trend emerging within consumption patterns is the growth of ecommerce – the purchase of goods online. This is particularly noticeable in the UK, which (in 2014) had the highest proportion of individuals who made their last purchase online in the previous twelve months, out of all EU countries (ONS, 201562). ONS E-commerce and ICT activity (2017) finds that there has been a sharp (16%) rise in e-commerce over 2011-2017. The trend of increased digitisation is likely to continue, increasing trade, accommodation & transport sectoral activity, given extra need for warehousing, logistical services and courier services.
However, corresponding employment growth will be contingent on whether the labour supply will be able to adapt to the anticipated technological progress in the sector. As firms seek to adopt cost-saving measures, processes can become automated in the long-term. Existing technologies include automated checkouts, and current investment and research into unmanned aerial vehicles (UAVs) for delivery and automated warehouse systems for processing orders may in the future substitute labour in some of the traditional tasks in this sector.
61 Airports Commission (2015). Airports Commission: Final report. London: Airports Commission. Available from: https://assets.publishing.service.gov.uk/government/uploads/system/uploads/attachment_data/file/440316/airports-commission-final-report.pdf 62 Office of National Statistics (ONS)(2017). E-commerce and ICT activity, UK: 2017 Available from: https://www.ons.gov.uk/businessindustryandtrade/itandinternetindustry/bulletins/ecommerceandictactivity/2017.
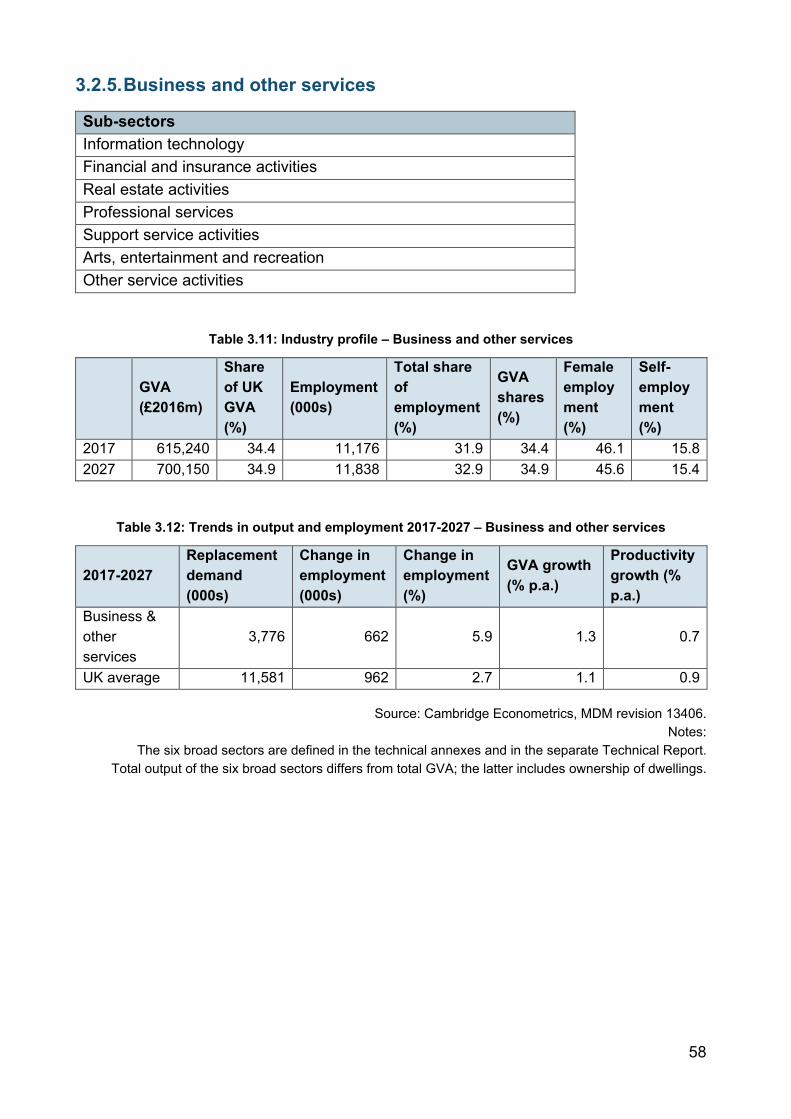
58
3.2.5. Business and other services
Sub-sectors Information technology Financial and insurance activities Real estate activities Professional services Support service activities Arts, entertainment and recreation Other service activities
Table 3.11: Industry profile – Business and other services
GVA (£2016m)
Share of UK GVA (%)
Employment (000s)
Total share of employment (%)
GVA shares (%)
Female employment (%)
Self-employment (%)
2017 615,240 34.4 11,176 31.9 34.4 46.1 15.8 2027 700,150 34.9 11,838 32.9 34.9 45.6 15.4
Table 3.12: Trends in output and employment 2017-2027 – Business and other services
2017-2027 Replacement demand (000s)
Change in employment (000s)
Change in employment (%)
GVA growth (% p.a.)
Productivity growth (% p.a.)
Business & other services
3,776 662 5.9 1.3 0.7
UK average 11,581 962 2.7 1.1 0.9
Source: Cambridge Econometrics, MDM revision 13406. Notes:
The six broad sectors are defined in the technical annexes and in the separate Technical Report. Total output of the six broad sectors differs from total GVA; the latter includes ownership of dwellings.
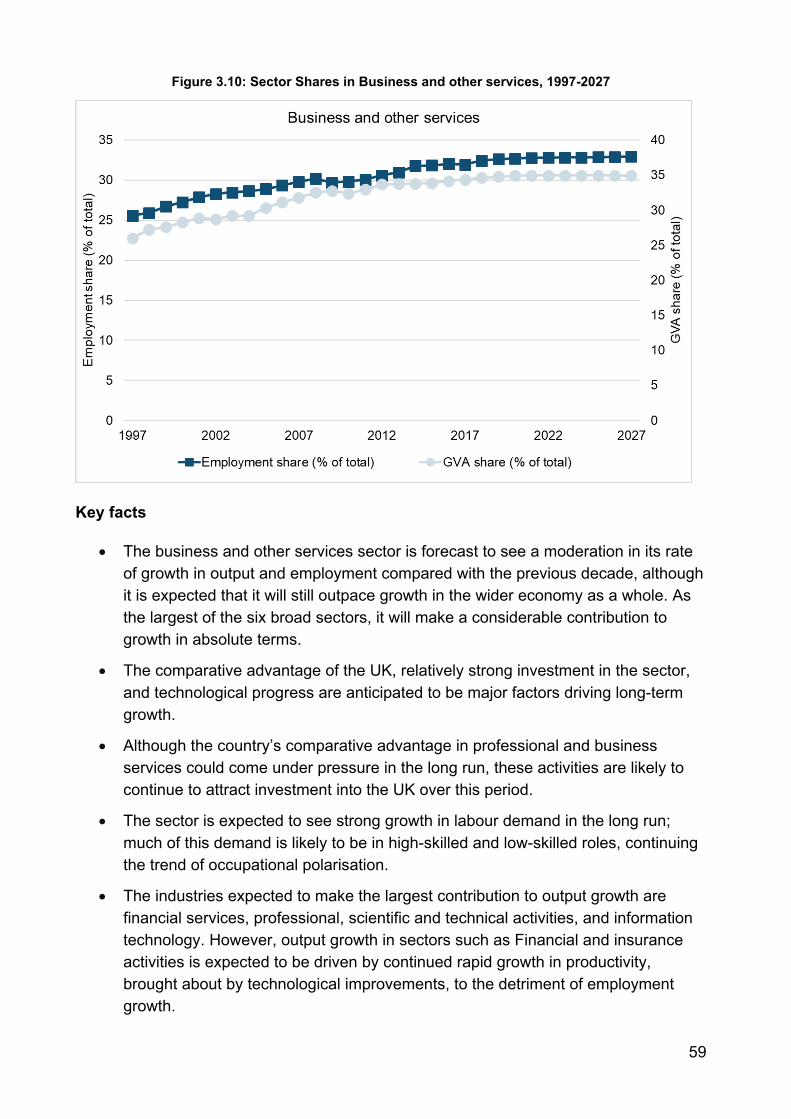
59
Figure 3.10: Sector Shares in Business and other services, 1997-2027
Key facts
• The business and other services sector is forecast to see a moderation in its rate of growth in output and employment compared with the previous decade, although it is expected that it will still outpace growth in the wider economy as a whole. As the largest of the six broad sectors, it will make a considerable contribution to growth in absolute terms.
• The comparative advantage of the UK, relatively strong investment in the sector, and technological progress are anticipated to be major factors driving long-term growth.
• Although the country’s comparative advantage in professional and business services could come under pressure in the long run, these activities are likely to continue to attract investment into the UK over this period.
• The sector is expected to see strong growth in labour demand in the long run; much of this demand is likely to be in high-skilled and low-skilled roles, continuing the trend of occupational polarisation.
• The industries expected to make the largest contribution to output growth are financial services, professional, scientific and technical activities, and information technology. However, output growth in sectors such as Financial and insurance activities is expected to be driven by continued rapid growth in productivity, brought about by technological improvements, to the detriment of employment growth.
60
• Technological progress supported by strong capital investment within the information technology industry is likely to be a major factor in stimulating long-term growth, even though it is likely to weaken employment growth in some traditional roles.
Business and other services is now the major sector in the UK, accounting for over one-third of total UK economic activity. Consistent with current trends, the sector is expected to outpace wider-economy growth. Output in the sector is forecast to grow by 1.3% p.a. between 2017 and 2027, with the number of jobs expected to grow by 0.6% p.a. over the same period. Overall, the comparative advantage of the UK, strong investment into the sector, and technology progress are anticipated to be major factors driving long-term growth in the sector.
Several industries are likely to be the main contributors of growth within the broad aggregate sector. Consistent with current trends, financial services, professional, scientific and technical activities, and information and communication industries are forecast to experience strong growth over the forecast period.
The expectation of sustained growth in these industries stems partly from the comparative advantage of the UK in the professional and business services industries. In a report analysing professional and business services, BIS highlighted several features behind UK’s competitiveness in these industries, including the geographic advantage of the UK being between two major markets, a university system which provides high-quality graduates, and a supportive business environment (p.7, BIS; 201363). This is anticipated to first, attract new firms to locate into the country, bringing increased investment, activity and labour demand; and second, increase international demand for these services from the UK, because of the industries’ reputation and competitiveness. The impacts Brexit could have on the UK’s current comparative advantage are uncertain and could dampen growth in the short-term.
New challenges may divert some of the growth in activity to countries closer to the developing markets and diminish the UK’s comparative advantage in the long term. Increasing compliance costs, rising demand from emerging economies and existing initiatives to establish “financial centres of the Far East” (ibid.), could divert some growth abroad. Nonetheless, faster than average growth is forecast in professional and business service industries.
Another important factor driving long-term growth is investment. Trends in recent years suggest that private investment into technology companies within the UK is growing at a fast pace. While UK venture capital funding for tech start-ups has dropped 28% since 2017, likely due to uncertainty around Brexit, it continues to outpace any other European
63 Department of Business, Innovation and Skills (BIS)(2013). UK construction: An economic analysis of the sector. Department of Business, Innovation and Skills: London.
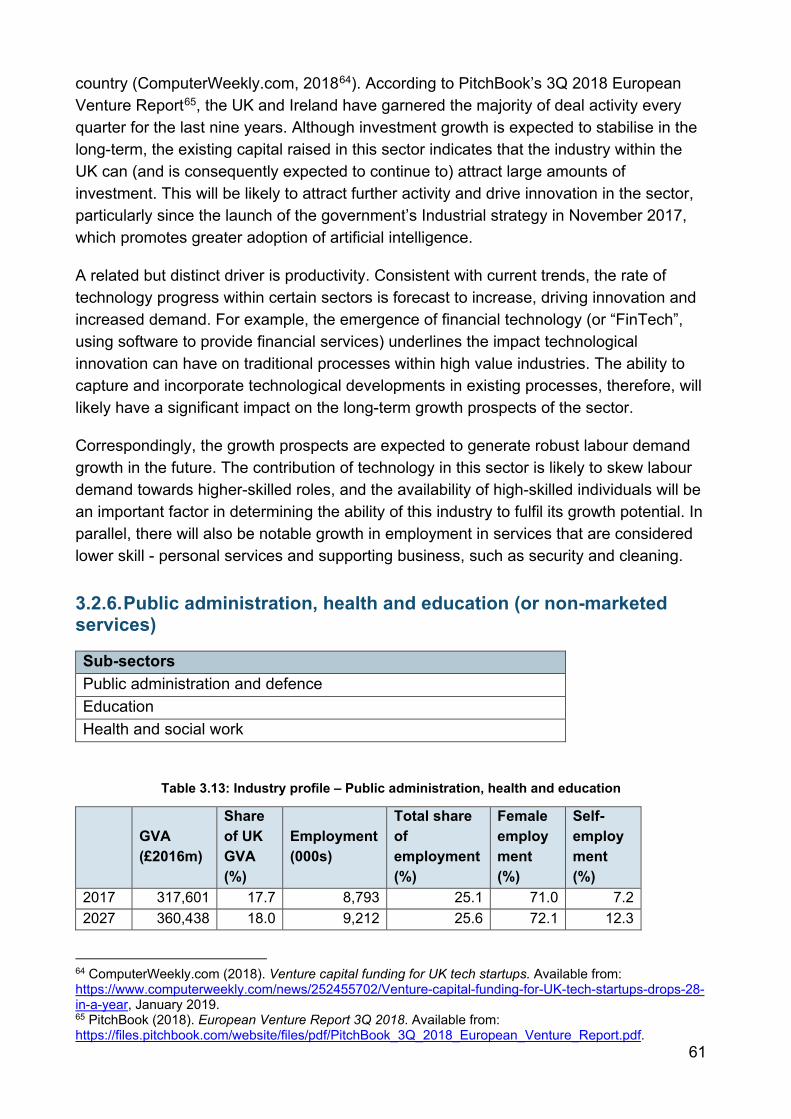
61
country (ComputerWeekly.com, 201864). According to PitchBook’s 3Q 2018 European Venture Report65, the UK and Ireland have garnered the majority of deal activity every quarter for the last nine years. Although investment growth is expected to stabilise in the long-term, the existing capital raised in this sector indicates that the industry within the UK can (and is consequently expected to continue to) attract large amounts of investment. This will be likely to attract further activity and drive innovation in the sector, particularly since the launch of the government’s Industrial strategy in November 2017, which promotes greater adoption of artificial intelligence.
A related but distinct driver is productivity. Consistent with current trends, the rate of technology progress within certain sectors is forecast to increase, driving innovation and increased demand. For example, the emergence of financial technology (or “FinTech”, using software to provide financial services) underlines the impact technological innovation can have on traditional processes within high value industries. The ability to capture and incorporate technological developments in existing processes, therefore, will likely have a significant impact on the long-term growth prospects of the sector.
Correspondingly, the growth prospects are expected to generate robust labour demand growth in the future. The contribution of technology in this sector is likely to skew labour demand towards higher-skilled roles, and the availability of high-skilled individuals will be an important factor in determining the ability of this industry to fulfil its growth potential. In parallel, there will also be notable growth in employment in services that are considered lower skill - personal services and supporting business, such as security and cleaning.
3.2.6. Public administration, health and education (or non-marketed services)
Sub-sectors Public administration and defence Education Health and social work
Table 3.13: Industry profile – Public administration, health and education
GVA (£2016m)
Share of UK GVA (%)
Employment (000s)
Total share of employment (%)
Female employment (%)
Self-employment (%)
2017 317,601 17.7 8,793 25.1 71.0 7.2 2027 360,438 18.0 9,212 25.6 72.1 12.3
64 ComputerWeekly.com (2018). Venture capital funding for UK tech startups. Available from: https://www.computerweekly.com/news/252455702/Venture-capital-funding-for-UK-tech-startups-drops-28-in-a-year, January 2019. 65 PitchBook (2018). European Venture Report 3Q 2018. Available from: https://files.pitchbook.com/website/files/pdf/PitchBook_3Q_2018_European_Venture_Report.pdf.
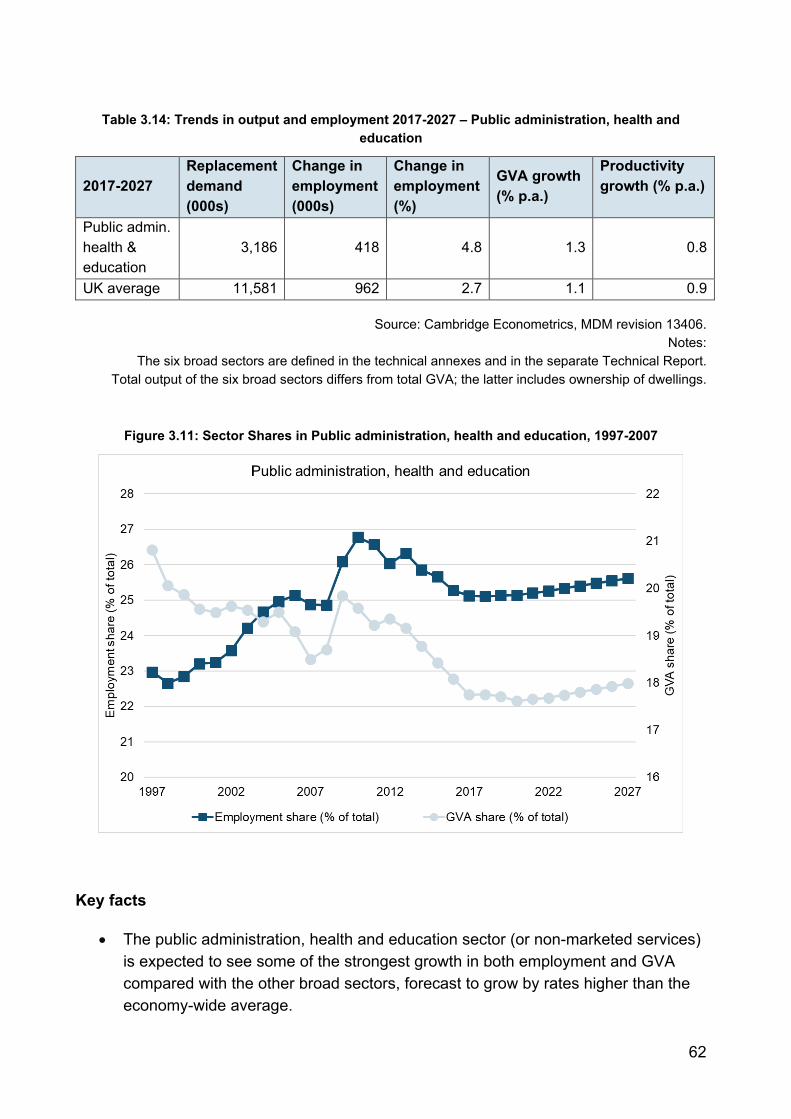
62
Table 3.14: Trends in output and employment 2017-2027 – Public administration, health and education
2017-2027 Replacement demand (000s)
Change in employment (000s)
Change in employment (%)
GVA growth (% p.a.)
Productivity growth (% p.a.)
Public admin. health & education
3,186 418 4.8 1.3 0.8
UK average 11,581 962 2.7 1.1 0.9
Source: Cambridge Econometrics, MDM revision 13406. Notes:
The six broad sectors are defined in the technical annexes and in the separate Technical Report. Total output of the six broad sectors differs from total GVA; the latter includes ownership of dwellings.
Figure 3.11: Sector Shares in Public administration, health and education, 1997-2007
Key facts
• The public administration, health and education sector (or non-marketed services) is expected to see some of the strongest growth in both employment and GVA compared with the other broad sectors, forecast to grow by rates higher than the economy-wide average.
63
• Activity66 in public administration, health and education are dependent on political decisions, as government policies determine demand for the sectors’ outputs and services.
• Employment in public administration is expected to decline, as local councils continue to face tight controls on government funding.
• Wider demographic trends, such as the ageing population, are expected to be a major driver of increased demand in the long run, especially in health, residential care and social work.
• Teacher shortages67 in the education sector is likely to have a negative impact on employment growth in the short-term, but continued growth in international students is expected to support output growth in the sector.
• The impact of Brexit on the public sector is particularly uncertain. The government could benefit from the removal of fiscal contributions to the EU budget, while at the same time face increased costs as certain benefits provided by the EU move back to being the responsibility of the UK government.
Activity in public administration, health and education are dependent on political decisions, as government is a major component of this sector’s demand. Activity in public administration, education and health is expected to grow at an average of 1.5% p.a. over 2017-2022, before slowing down over the period 2022-2027.
Over the longer term, demographic trends are expected to induce increased government and consumer spending for some industries within this broad sector. The UK has an ageing population; the latest projections by the Office of National Statistics estimate that the proportion of individuals over 65 will approximately 3% points higher in 2027 than it was in 2017.68 Demand for public spending and health services are anticipated to correspondingly as a result, boosting wider activity in the sector. This is expected to be the overriding concern in the long-term, driving increases in output and employment.
Employment in public administration, on the other hand, is expected to decline slightly in the short-term by -0.4% p.a. over 2017-2022, as local councils continue to face tight controls on government funding. This is expected to bounce back in the longer term, with employment in the sector expected to grow slightly by 0.2% p.a. over 2022-2027, as the government moves towards its aim of a budget surplus by the mid-2020s.
The education sector is also expected to see different trends between 2017 and 2027. As the country continues to face teacher shortages in the short-term, employment in the sector is expected to fall by 0.3% p.a. over 2017-2022, before returning to minimal
66 It is acknowledged that there are weaknesses of using gross value added (and other monetary indicators) to measure the output of public services. GVA is used here to be consistent with other sectors. 67 Teacher recruitment and retention in England, House of Commons Library: https://researchbriefings.files.parliament.uk/documents/CBP-7222/CBP-7222.pdf; and Teaching and Leadership: Supply and Quality, The Education Policy Institute: https://epi.org.uk/publications-and-research/the-teacher-labour-market-in-england/ 68 Currently, approximately 18% of the total UK population is over 65.

64
growth by 2027. While employment growth is expected to be stagnant, output is expected to continue to grow by about 1.1% p.a. over 2017-2027, supported by growth in international students. According to the British Council (201869), while international student mobility is expected to slow over the next decade, there is still expected to be growth of 1.7% p.a. to 2027, driven by students from China and India, which are expected to account for 60% of the growth.
69 British Council (2018). International student mobility to 2027: Local investment, global outcomes. Available from: https://ei.britishcouncil.org/educationintelligence/ei-feature-international-student-mobility-2027-local-investment-global-outcome
65
4. Changing occupational structure and replacement demands
Key messages
Changes in occupational employment structure are driven by long-term trends, including changing sectoral employment patterns and technological and organisational trends influencing the patterns of occupational demand within sectors.
The new results take account of information from the latest information from the LFS. These suggest that longer-term trends apparent before the worldwide recession of 2008 have now been firmly re-established.
Together, these data confirm that the occupational structure of employment is continuing to change in favour of white collar and higher skilled occupations, although there will still be many job opportunities for less skilled workers.
The results suggest significant employment growth for higher-level occupations such as managers, and most professional and associate professional and technical jobs.
Caring, leisure and other service occupations are also projected to see significant employment growth.
Job losses are projected for administrative & secretarial occupations; skilled trade occupations; and process, plant & machine operatives.
Elementary occupations are projected to experience mixed fortunes with some modest growth in jobs where tasks are not so easily subject to automation (such as waiting at tables), but job losses in other areas.
In combination these patterns suggest a continuing polarisation of demand for skills, with some growth at both high and low skill levels and a hollowing out in the middle.
There are considerable variations in the general patterns of occupational employment by gender and employment status, reflecting existing patterns of ‘gender segregation’.
The need to replace those leaving the workforce for reasons of retirement and other factors will generate significant numbers of opportunities even in areas where employment is projected to fall.
As well as the broad patterns of change at the 1-digit, major group and 2-digit sub-major group levels the full results also include indicative projections at the 4-digit level of the Standard Occupational Classification (some 369 categories).
66
4.1. Introduction and general approach Skills in Working Futures are measured in two ways - Occupation and Qualification.70 This section focuses on occupation. The jobs people undertake often require very different skill sets. The Standard Occupation Classification (SOC) reflects this, being based around a hierarchical system of classifying jobs dependent on formal qualifications and experience typically required.
The results reflect the latest information available from the LFS and other sources. These provide information on historical employment patterns. These data are linked to the sectoral analysis described in Section 3 to develop projections of future employment prospects by occupation.
The projections are based on categories defined using the SOC2010 occupational classification.71 The main focus is on the 25 sub-major occupation groups, but for presentational purposes much of the discussion here is at the broader major group level (the nine single digit major group level categories of SOC).72 More detailed projections down to the 4-digit level have also been developed. These are presented in a separate annex to this report.
Projections of occupational employment looking forward to 2027 are presented, covering all industry sectors.73 The main focus in this section is on results at a UK level, but projections have also been developed for the four nations of the UK and the nine English regions. These are also presented in a separate annex to this report.
Such data provide a useful indicator of changing patterns of the demand for skills. However, it is important to focus not just on projections of changing levels of employment by occupation, but also on replacement demands. Projections of change in the structure of employment provide only part of the picture of how the demand for skills is changing. Estimation of replacement needs recognises the significant outflows of those retiring from the existing workforce (or leaving for other reasons such as family formation). The results show that, despite projected declines in employment for many occupations, there will be significant demand for the skills concerned to replace those leaving the current workforce.
The many and varied drivers of change in occupational employment structure are complex. Some of the most important factors are summarised in section 4.2. One key driver is structural change in the economy, which affects the sectoral patterns of
70 There are of course other ways of defining and measuring skills, including various indicators of what are variously referred to as key, core and generic skills. Data are however much better established on occupation and qualification, so these remain the main focus of attention in the Working Futures projections. 71 These are described in more detail in: Wilson, R. A., M. May-Gillings, S. Patel and H Bui, (2019). Working Futures 2017-2027: Technical report on sources and methods. Department for Education. 72 Full detail of these classifications is provided in the technical annex. 73 More detailed results by sectors are available in the detailed Excel workbooks available via the Department for Education.
67
employment. As noted in Section 3, a complex combination of economic and technological forces is driving the fortunes of different parts of the economy. Some are expected to see rapid employment decline, while others have much brighter prospects. Given that sectors have very different needs for particular occupations; this has a strong impact on occupational employment prospects. The other key driver is the way that technological and organisational change affects the way work is done within each sector.
The remaining sections are structured as follows:
• Section 4.2 outlines the key drivers of changes in occupational employment structure.
• Section 4.3 provides a brief summary of recent historical developments in occupational employment structure, focusing on changes between 2017 and 2027.
• Section 4.4 discusses how these patterns vary across gender and employment status.
• Section 4.5 goes on to focus on replacement demands.
• Section 4.6 presents more detailed occupational projections at the 2-digit level of SOC (the 25 sub-major groups).
• Section 4.7 presents an analysis of the main components of change using shift-share methods.
• Section 4.8 presents a summary of detailed occupational changes within industries.
These results focus on the UK as a whole. Results for the devolved administrations and English regions, as well as more detailed analyses presenting a summary of the implications for occupational employment change at the more detailed 4-digit occupational level are provided in separate technical annexes to this report.
4.2. Drivers of occupational change Drivers of change: Skill requirements are a derived demand; they are dependent on the pattern of demand for goods and services in the economy (Kriechel, Rašovec and Wilson, 201674). The focus in this section is on occupational employment patterns, as opposed to qualifications or some other measure of skill. These demands are influenced by a range of factors, which vary over time and across sectors. The key factors can be broadly categorised into two groups: those that are external to the organisation and those which are primarily internal. These are reflected in the shift-share analysis used: industry effects can be regarded as primarily external; occupational effects are mainly driven by internal influences.
74 Kriechel, B., Rašovec, T., and Wilson, R. A. (2016). ''Skills Forecasts." Part B of the ETF, ILO and Cedefop Guide on Skills Foresights, Scenarios and Forecasts. CEDEFOP/ETF/ILO: Turin
68
External skills drivers: influence the pattern of goods and services produced and therefore the Sectoral structure of employment. These drivers include: technological change; globalisation; and public policy (including legislative and regulatory frameworks). These developments are taken into account by the multi-sectoral macroeconomic model and are summarised in Section 2. Some sectors benefit from such factors while others are affected negatively. Those sectors that benefit from such changes will see employment grow. Conversely, those that fail to adjust and respond will experience job losses. Occupations concentrated in the former sectors will gain employment in contrast to those concentrated in declining sectors (industry effects).
Internal skills drivers: produce significant changes in the patterns of employment within particular industries, including major restructuring of the way work is organised (occupational effects). Skill requirements within organisations are driven by the business strategies they adopt. These reflect choices about what products or services to deliver and where and how to pitch that delivery. Some may focus on product differentiation in high value added, premium markets while others may choose a low specification product or service, where the emphasis is keeping price and costs down. The former generally require higher skills, including the use of specialised and distinctive competencies, compared with strategies that focus on low-level specifications. Organisations facing technological changes, or trying to move up-market, usually need to upgrade their skills. The introduction of new products and services, major changes in equipment and in working methods or workforce organisation often require the deployment of new skills.
Both internal and external drivers are influenced by technology (especially ICT) and other general factors. A number of commentators have focused on the biased nature of technical change, which has tended to favour higher skills and to displace lower skilled jobs. For example, ICT has led to the displacement of many clerical and secretarial jobs previously concerned with information processing using paper technology (internal effect).
On the other hand, information technology (IT) has opened up many new product markets where information services (e.g. Facebook, Google) can be provided which were previously not feasible (external effect). These new businesses often require jobs of a professional, associate professional and managerial nature. The application of IT in other areas such as such as robots in motor manufacturing has led to the loss of many jobs for skilled workers.
Other factors have also been important. These include the drive for efficiency in response to global competition, increased emphasis on customer service and product quality and related changes in production methods and the management of human resources. The income elasticity of demand for different products and services, together with changes in tastes and preferences is altering the patterns of demand towards an emphasis on high value added, higher quality, high specification goods and services.
69
There is a major restructuring of production to meet these needs. Many of these products and services require expert knowledge as well as customer care, personal attention and face-to-face human interaction, (for example, leisure, hospitality, travel, personal care), increasing the need for such generic skills.
Changing patterns of industrial specialisation (industry effects) have had profound implications for the demand for different occupations as well as playing a key role in determining differences across spatial areas. The decline of employment in primary and manufacturing industries has resulted in a dramatic reduction in the need for many skills associated with the production of the output of these industries. For example: the agricultural sector now requires many fewer labourers; the coal industry now employs only a handful of skilled miners; the manufacturing sector no longer requires the same number of skilled engineering and other types of specific craft skills that were the foundation of its success in the past; utilities and transport now require far fewer workers than previously.
In contrast, the growth of the service sector has led to an increase in employment in many occupations. For example, the growth of non-market, public service, employment has (up until recently) led to substantial additional jobs for: professional, managerial and clerical workers in public administration; for doctors and nurses in health services; and for teachers in education services. Similarly, growth in marketed, private sector, services has resulted in many new jobs for: leisure and other personal service occupations (in hotels and other services); sales occupations in distribution; and for professional, associate professional, clerical and secretarial in business and financial services.
Future influences on occupational change: The combination of globalisation and technological change often increases skill requirements as work organisation and the nature of competitive advantage become more complex. Increasingly, the source of competitive edge in products and in processes is information and knowledge content. The increased emphasis on higher-level skills and the associated decline in demand for unskilled workers has been attributed to the expansion of international trade (especially with developing economies) and the continuing process of technological change (particularly related to ICT). On balance, the evidence seems to suggest that the latter has become increasingly important, with changes within sectors being of most significance. This is reflected in the shift-share analysis presented here, which suggests that occupational shifts within sectors are growing in importance compared to previous decades (occupational effects). Nonetheless, it seems likely that both technology and growing trade will continue to raise the demand for higher-level skills and drive down the demand for lower level skills.
The projected patterns of occupational change for the next decade are expected to mirror those of the recent past. The same basic forces are expected to operate. Changes in the industrial structure of employment in favour of the service sector (industry effects) will tend to favour white collar, non-manual occupations, while the continued loss of jobs in
70
manufacturing and primary industries will result in yet further job losses for many manual blue-collar jobs.
The impacts of IT and other related organisational changes are likely to reduce further the demand for clerical and basic secretarial skills across all industries (occupational effects). Similarly, the introduction of new technologies in manufacturing will tend to displace many skilled workers. Conversely, the management and operation of the new technologies will require greater shares in employment for managerial, professional and associate professional occupations, including technicians of various kinds.
4.3. Changes for broad occupational groups: History and projections
4.3.1. Latest historical developments
Table 4.1 and Figure 4.1 present historical information on employment trends for the nine SOC2010 major groups over the past two decades, as well as projections to 2027. The historical estimates are based on combining the estimates of employment by industry from the multi-sectoral model with the latest information from the LFS on changing occupational employment patterns within industries. The historical data prior to 2011 have all been reclassified onto the new basis using convertors provided by ONS.
The historical database is also based on information from Censuses of Population (up to and including 2011) although the main emphasis now is on information from the LFS. Comparison between the LFS and Census data suggest a broadly similar picture although there are a few significant differences between the Census and the current LFS estimates (and hence the Working Futures estimates).75
The recent historical trends already reflect two distinctive factors when comparing the current results with those published in earlier Working Futures reports.76 Technical modifications to the system of classifying occupations resulted in some shifts in employment shares between occupational categories as SOC2010 was introduced. Secondly, there have been a number of shifts in the structure of employment in the economy by both sector and occupation as a consequence of the 2008 global financial crisis and subsequent recession.
75 In particular the Census suggest a much smaller proportion of people employed in Science, Engineering and Technology Professions category. The reasons for these differences remain unclear so the current set of results relies on the official picture as presented by ONS in the published LFS data. 76 The first set of Working Futures projections were published in 2004 and covered the period 2002-2012. Subsequent series covered 2004-2014, 2007-2017, 2010-2020 and 2014-2024. The last two adopted SOC2010 to classify occupations but the earlier series used SOC2000.
71
The revision to SOC altered the employment patterns across a number of occupations. This included:
• managers, where the definition of managerial roles was tightened up between SOC200 and SOC 201077
• nurses, who were moved from the associate professional occupational category to the professional one in reflection of the changing nature of the work involved (reflecting the move towards nursing becoming an all-graduate occupation).
The 2008 recession impacted on some sectors much more than others (notably in construction and also Public administration, education and health services). This has had a direct effect on those occupations employed therein. There have also been some shifts in patterns within industries. The overall levels of employment also fell sharply following 2008, which affected all occupations (see Figure 4.2). Subsequently there was a recovery in most parts of the economy, especially the private as opposed to public sector. Nevertheless, the broad underlying trends in occupational employment shares have continued more or less unabated, Figure 4.3 shows that, for most occupations, the trend over the period 2008-2017 is almost linear (Figure 4.3 focuses on shares of total employment at the 1-digit level of SOC).
The key features have been:
• rising employment levels and shares for higher level, white-collar groups such as:
• managers, directors & senior officials; • professionals; and • associate professional & technical occupations;
• rapid increases for caring, leisure related and other personal service occupations;
• decline in employment for administrative & secretarial occupations;
• declining employment levels and shares for most blue collar/manual occupations;
• for elementary occupations, there was a slight decline in overall numbers over the decade 2007-2017, with a significant recovery in the second half of the decade.
The overall decline in employment levels for elementary occupations also disguises quite large job losses in some areas offset by growth in others (sectors and specific jobs with the overall elementary occupations umbrella).
These patterns remain broadly consistent with the idea of polarisation in the demand for skills. This hypothesis highlights the growth in demand for both high and low level skills with a hollowing out in the middle.
77 Job titles with manager in the title are now only included in the managerial group if the job involves substantial managerial control over people or resources.
72
4.3.2. Projections to 2027
Table 4.1 and Figures 4.1 and 4.2 present employment projections for the 9 major occupational groups. They cover the period from 2017-2027. These are also compared with developments over the previous decades. The pace of change in occupational structure to 2027 is expected to continue at about the same rate compared with the past two decades. This reflects a combination of continuing changes in sectoral employment structure, reinforced by skill-biased technical change (see Figure 4.1). The general trends are in favour of more highly skilled occupations, with some growth in less skilled employment in areas that are currently difficult to automate. They also indicate a reduction in the numbers of traditional clerical and skilled and semi-skilled manual jobs, (see Figure 4.2).
Managers, Professional, and Associate professional & technical occupations are all expected to show significant increases in employment to 2027.
Caring, leisure & other service occupations, and some parts of the Sales & customer service occupation group are projected to experience some positive employment prospects. These groups have exhibited employment growth since the early 1980s, reflecting positive shifts in sectoral employment structure in the sectors in which they are employed and the difficulties in replacing the non-routine manual and non-manual tasks which they undertake with machines.
Modest job losses are projected for the Sales & customer service occupation group as a whole, especially for the less skilled sales occupations sub-category.
Administrative & secretarial occupations have been one of the groups hardest hit by technological innovations in the office environment in recent years, albeit nowhere near as severe as first feared when the information and communications revolution first got underway in the late 1970s. These groups have seen significant job losses since the early 1990s, mainly as a consequence of the increasing use of IT systems to replace human effort. This trend is projected to accelerate over the next decade. Nevertheless, it is expected that this category will still employ well around 3 million people in 2027.
Skilled trades occupations and Process, plant & machine operatives are expected to experience further job losses as a whole, continuing the pattern of long-term decline. For many of these traditionally manual / blue-collar occupations this is largely driven by the continuing decline in the manufacturing, primary and distribution and transport sectors. There are however, some exceptions (with growth for occupations such as chefs and drivers) as illustrated by the analysis at a more detailed level below.
Some modest employment growth is expected for some parts of the Elementary occupations group, as many more industries, especially within the service sector, find a need for such occupations but this is offset by job losses elsewhere. This pattern has been argued to be part of a process of polarisation of the demand for skills, attributed to the difficulties of automating some relatively low skill jobs that require a human response.

73
This is especially important in some parts of the service sector. Figure 4.9 below illustrates how patterns of change vary by detailed 2-digit level occupations across industries.
Tables 4.2 - 4.3 present the details of change, including how they vary by gender. Figures 4.3 - 4.7 also illustrate this, as well as differences by employment status.
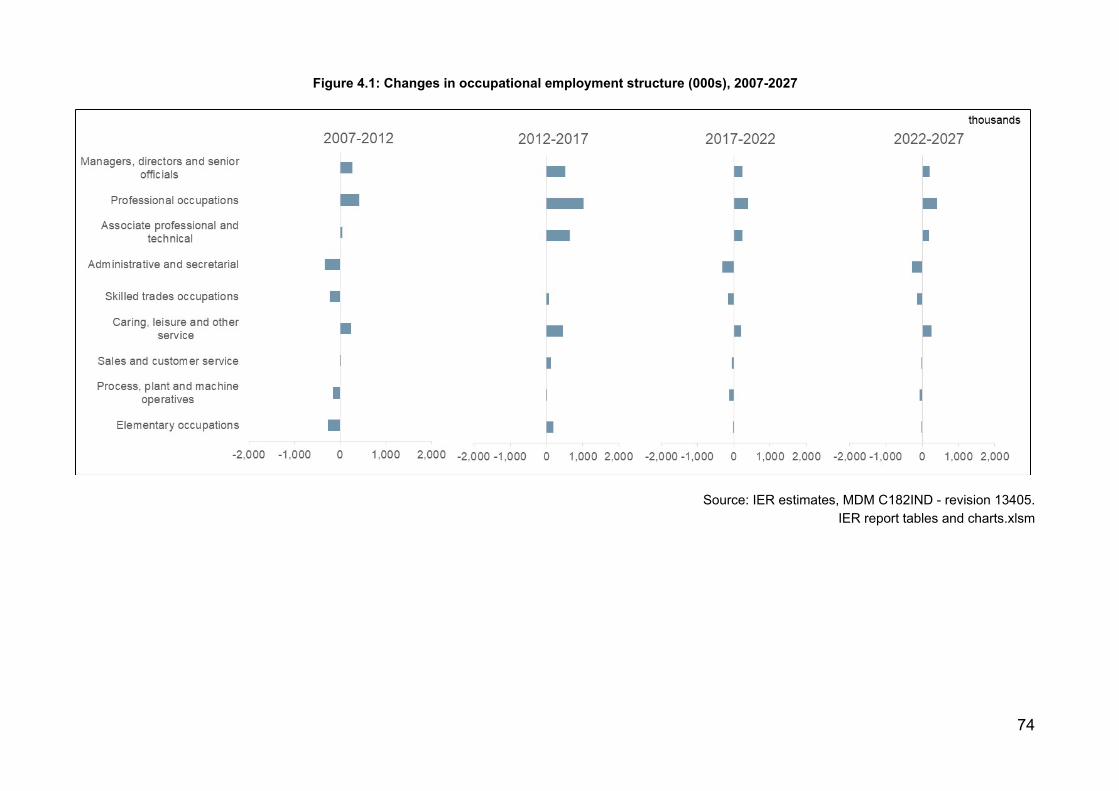
74
Figure 4.1: Changes in occupational employment structure (000s), 2007-2027
Source: IER estimates, MDM C182IND - revision 13405. IER report tables and charts.xlsm
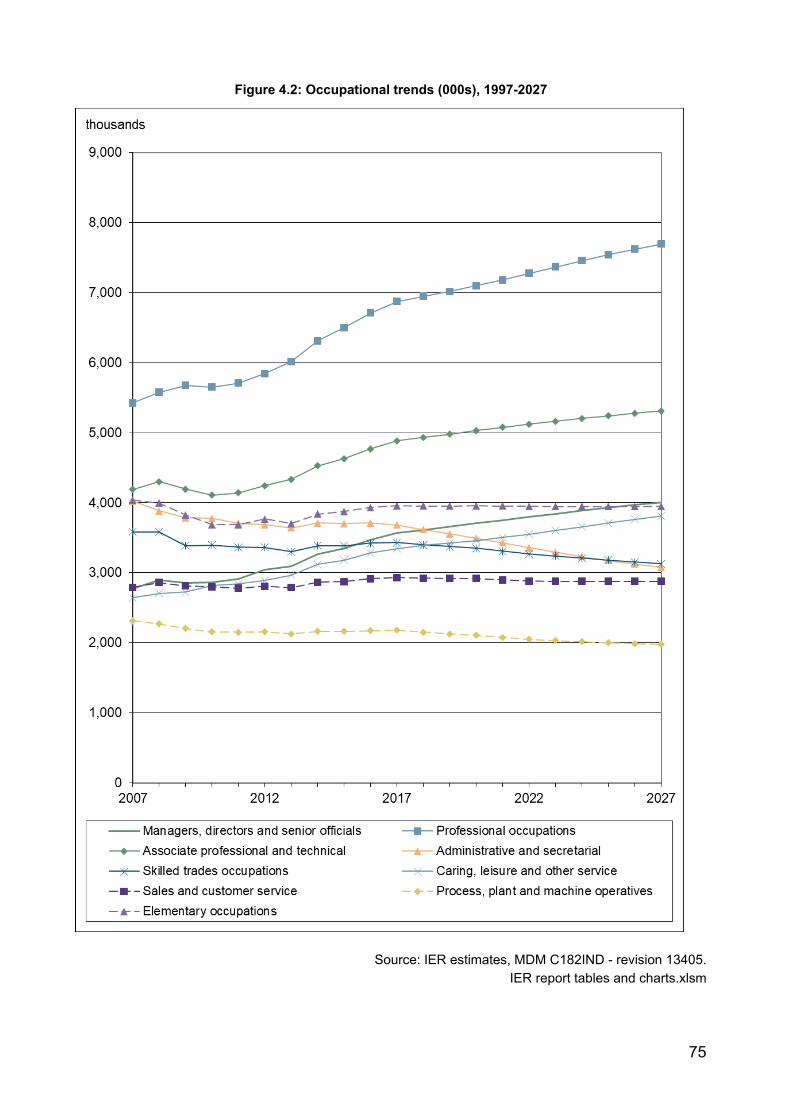
75
Figure 4.2: Occupational trends (000s), 1997-2027
Source: IER estimates, MDM C182IND - revision 13405. IER report tables and charts.xlsm
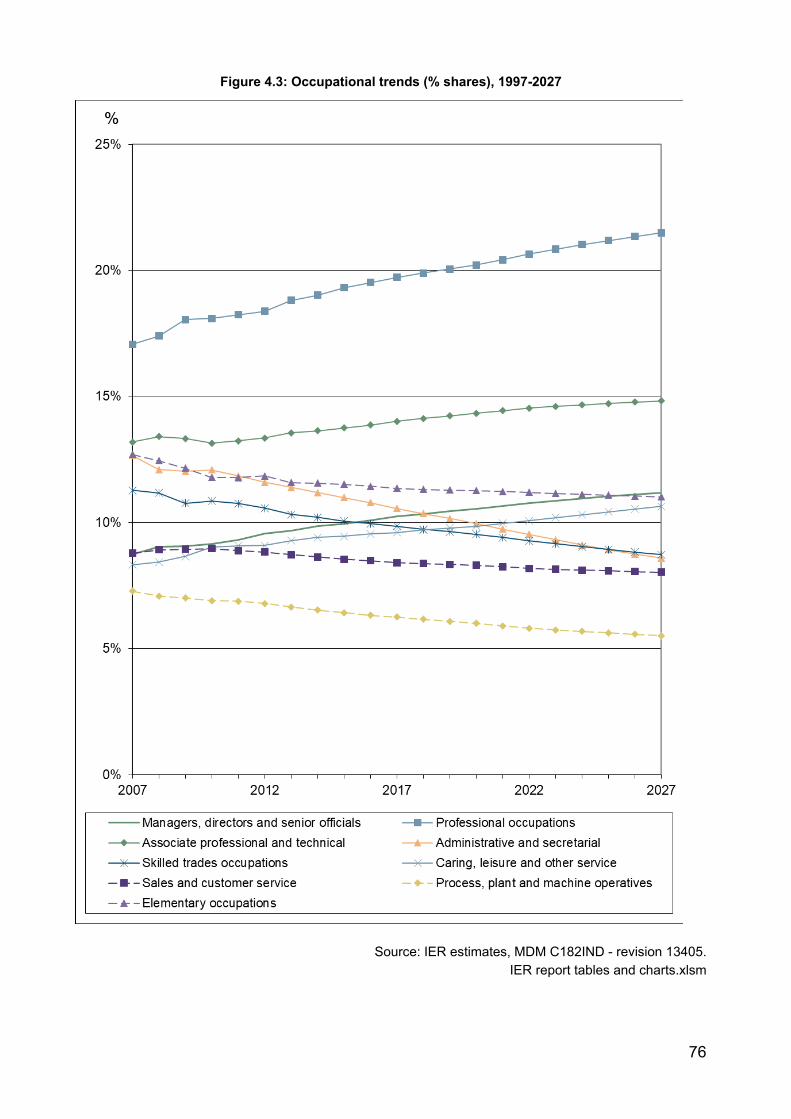
76
Figure 4.3: Occupational trends (% shares), 1997-2027
Source: IER estimates, MDM C182IND - revision 13405. IER report tables and charts.xlsm
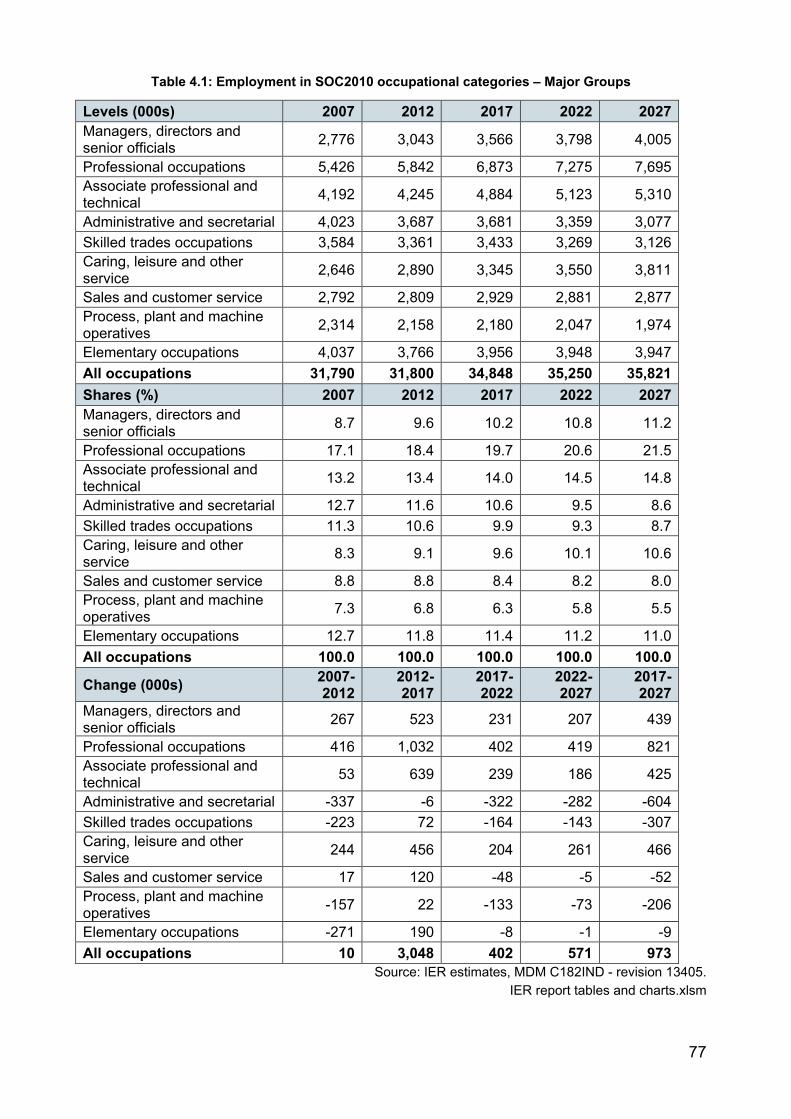
77
Table 4.1: Employment in SOC2010 occupational categories – Major Groups
Levels (000s) 2007 2012 2017 2022 2027 Managers, directors and senior officials 2,776 3,043 3,566 3,798 4,005
Professional occupations 5,426 5,842 6,873 7,275 7,695 Associate professional and technical 4,192 4,245 4,884 5,123 5,310
Administrative and secretarial 4,023 3,687 3,681 3,359 3,077 Skilled trades occupations 3,584 3,361 3,433 3,269 3,126 Caring, leisure and other service 2,646 2,890 3,345 3,550 3,811
Sales and customer service 2,792 2,809 2,929 2,881 2,877 Process, plant and machine operatives 2,314 2,158 2,180 2,047 1,974
Elementary occupations 4,037 3,766 3,956 3,948 3,947 All occupations 31,790 31,800 34,848 35,250 35,821 Shares (%) 2007 2012 2017 2022 2027 Managers, directors and senior officials 8.7 9.6 10.2 10.8 11.2
Professional occupations 17.1 18.4 19.7 20.6 21.5 Associate professional and technical 13.2 13.4 14.0 14.5 14.8
Administrative and secretarial 12.7 11.6 10.6 9.5 8.6 Skilled trades occupations 11.3 10.6 9.9 9.3 8.7 Caring, leisure and other service 8.3 9.1 9.6 10.1 10.6
Sales and customer service 8.8 8.8 8.4 8.2 8.0 Process, plant and machine operatives 7.3 6.8 6.3 5.8 5.5
Elementary occupations 12.7 11.8 11.4 11.2 11.0 All occupations 100.0 100.0 100.0 100.0 100.0
Change (000s) 2007-2012
2012-2017
2017-2022
2022-2027
2017-2027
Managers, directors and senior officials 267 523 231 207 439
Professional occupations 416 1,032 402 419 821 Associate professional and technical 53 639 239 186 425
Administrative and secretarial -337 -6 -322 -282 -604 Skilled trades occupations -223 72 -164 -143 -307 Caring, leisure and other service 244 456 204 261 466
Sales and customer service 17 120 -48 -5 -52 Process, plant and machine operatives -157 22 -133 -73 -206
Elementary occupations -271 190 -8 -1 -9 All occupations 10 3,048 402 571 973
Source: IER estimates, MDM C182IND - revision 13405. IER report tables and charts.xlsm
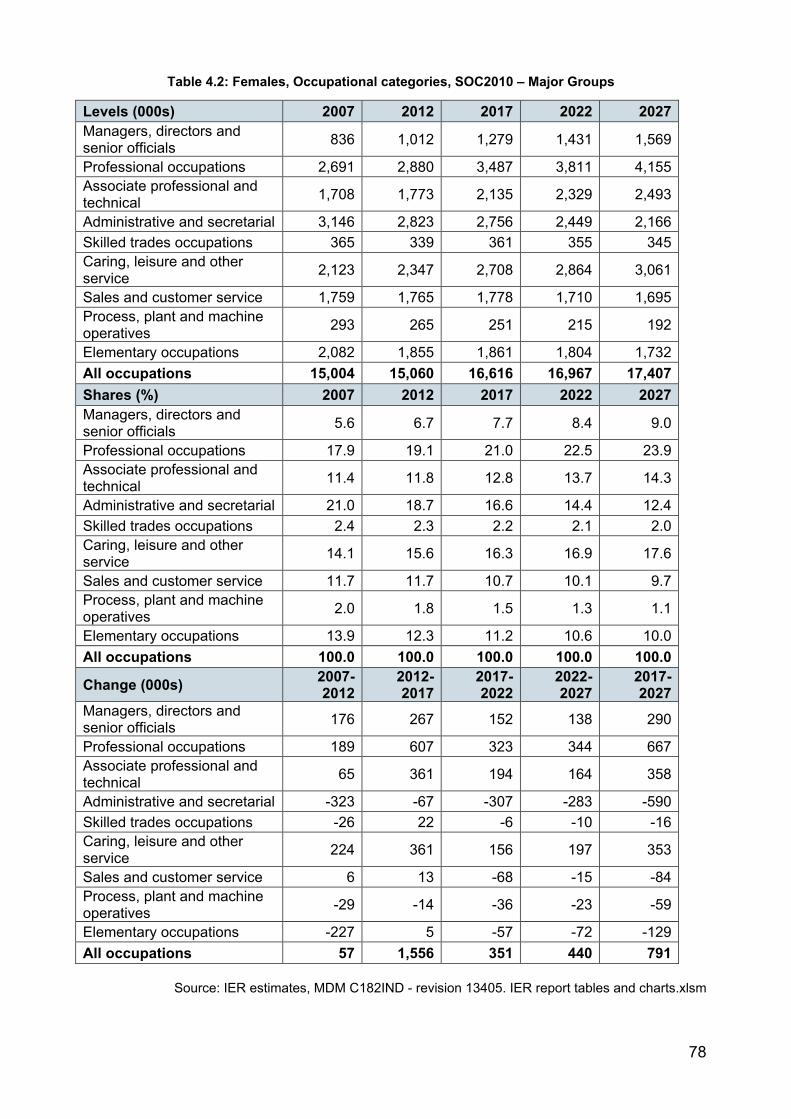
78
Table 4.2: Females, Occupational categories, SOC2010 – Major Groups
Levels (000s) 2007 2012 2017 2022 2027 Managers, directors and senior officials 836 1,012 1,279 1,431 1,569
Professional occupations 2,691 2,880 3,487 3,811 4,155 Associate professional and technical 1,708 1,773 2,135 2,329 2,493
Administrative and secretarial 3,146 2,823 2,756 2,449 2,166 Skilled trades occupations 365 339 361 355 345 Caring, leisure and other service 2,123 2,347 2,708 2,864 3,061
Sales and customer service 1,759 1,765 1,778 1,710 1,695 Process, plant and machine operatives 293 265 251 215 192
Elementary occupations 2,082 1,855 1,861 1,804 1,732 All occupations 15,004 15,060 16,616 16,967 17,407 Shares (%) 2007 2012 2017 2022 2027 Managers, directors and senior officials 5.6 6.7 7.7 8.4 9.0
Professional occupations 17.9 19.1 21.0 22.5 23.9 Associate professional and technical 11.4 11.8 12.8 13.7 14.3
Administrative and secretarial 21.0 18.7 16.6 14.4 12.4 Skilled trades occupations 2.4 2.3 2.2 2.1 2.0 Caring, leisure and other service 14.1 15.6 16.3 16.9 17.6
Sales and customer service 11.7 11.7 10.7 10.1 9.7 Process, plant and machine operatives 2.0 1.8 1.5 1.3 1.1
Elementary occupations 13.9 12.3 11.2 10.6 10.0 All occupations 100.0 100.0 100.0 100.0 100.0
Change (000s) 2007-2012
2012-2017
2017-2022
2022-2027
2017-2027
Managers, directors and senior officials 176 267 152 138 290
Professional occupations 189 607 323 344 667 Associate professional and technical 65 361 194 164 358
Administrative and secretarial -323 -67 -307 -283 -590 Skilled trades occupations -26 22 -6 -10 -16 Caring, leisure and other service 224 361 156 197 353
Sales and customer service 6 13 -68 -15 -84 Process, plant and machine operatives -29 -14 -36 -23 -59
Elementary occupations -227 5 -57 -72 -129 All occupations 57 1,556 351 440 791
Source: IER estimates, MDM C182IND - revision 13405. IER report tables and charts.xlsm
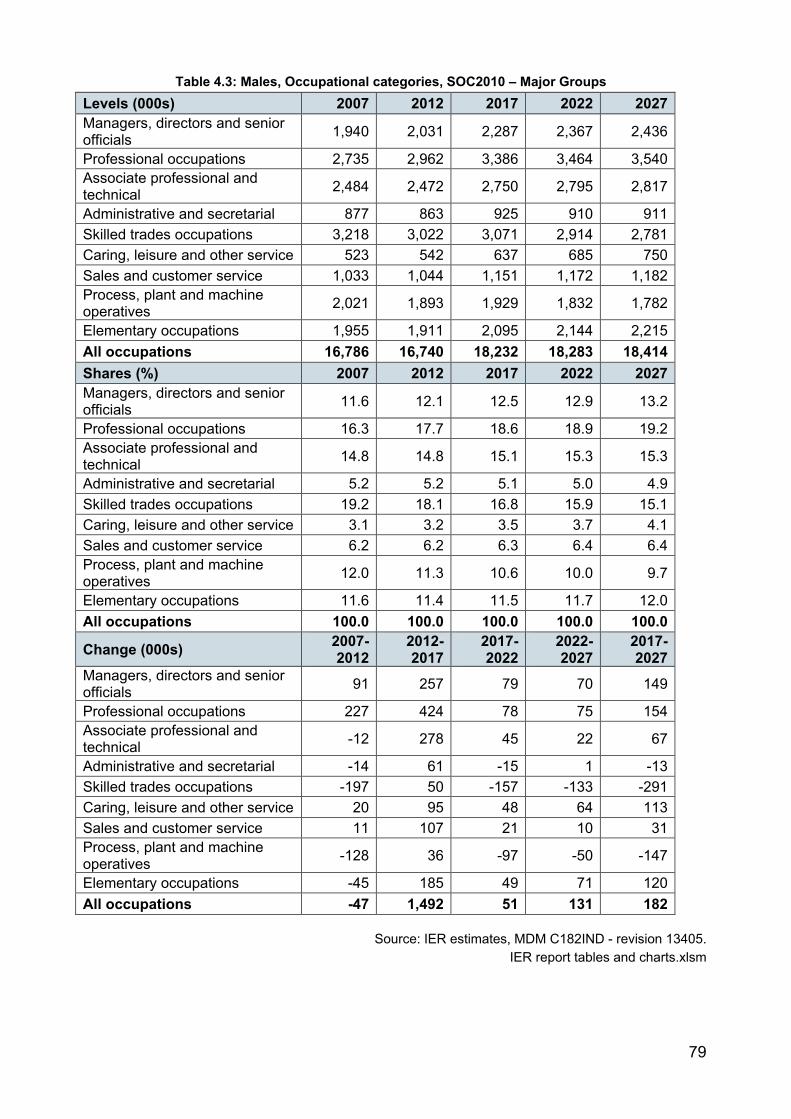
79
Table 4.3: Males, Occupational categories, SOC2010 – Major Groups Levels (000s) 2007 2012 2017 2022 2027 Managers, directors and senior officials 1,940 2,031 2,287 2,367 2,436
Professional occupations 2,735 2,962 3,386 3,464 3,540 Associate professional and technical 2,484 2,472 2,750 2,795 2,817
Administrative and secretarial 877 863 925 910 911 Skilled trades occupations 3,218 3,022 3,071 2,914 2,781 Caring, leisure and other service 523 542 637 685 750 Sales and customer service 1,033 1,044 1,151 1,172 1,182 Process, plant and machine operatives 2,021 1,893 1,929 1,832 1,782
Elementary occupations 1,955 1,911 2,095 2,144 2,215 All occupations 16,786 16,740 18,232 18,283 18,414 Shares (%) 2007 2012 2017 2022 2027 Managers, directors and senior officials 11.6 12.1 12.5 12.9 13.2
Professional occupations 16.3 17.7 18.6 18.9 19.2 Associate professional and technical 14.8 14.8 15.1 15.3 15.3
Administrative and secretarial 5.2 5.2 5.1 5.0 4.9 Skilled trades occupations 19.2 18.1 16.8 15.9 15.1 Caring, leisure and other service 3.1 3.2 3.5 3.7 4.1 Sales and customer service 6.2 6.2 6.3 6.4 6.4 Process, plant and machine operatives 12.0 11.3 10.6 10.0 9.7
Elementary occupations 11.6 11.4 11.5 11.7 12.0 All occupations 100.0 100.0 100.0 100.0 100.0
Change (000s) 2007-2012
2012-2017
2017-2022
2022-2027
2017-2027
Managers, directors and senior officials 91 257 79 70 149
Professional occupations 227 424 78 75 154 Associate professional and technical -12 278 45 22 67
Administrative and secretarial -14 61 -15 1 -13 Skilled trades occupations -197 50 -157 -133 -291 Caring, leisure and other service 20 95 48 64 113 Sales and customer service 11 107 21 10 31 Process, plant and machine operatives -128 36 -97 -50 -147
Elementary occupations -45 185 49 71 120 All occupations -47 1,492 51 131 182
Source: IER estimates, MDM C182IND - revision 13405. IER report tables and charts.xlsm
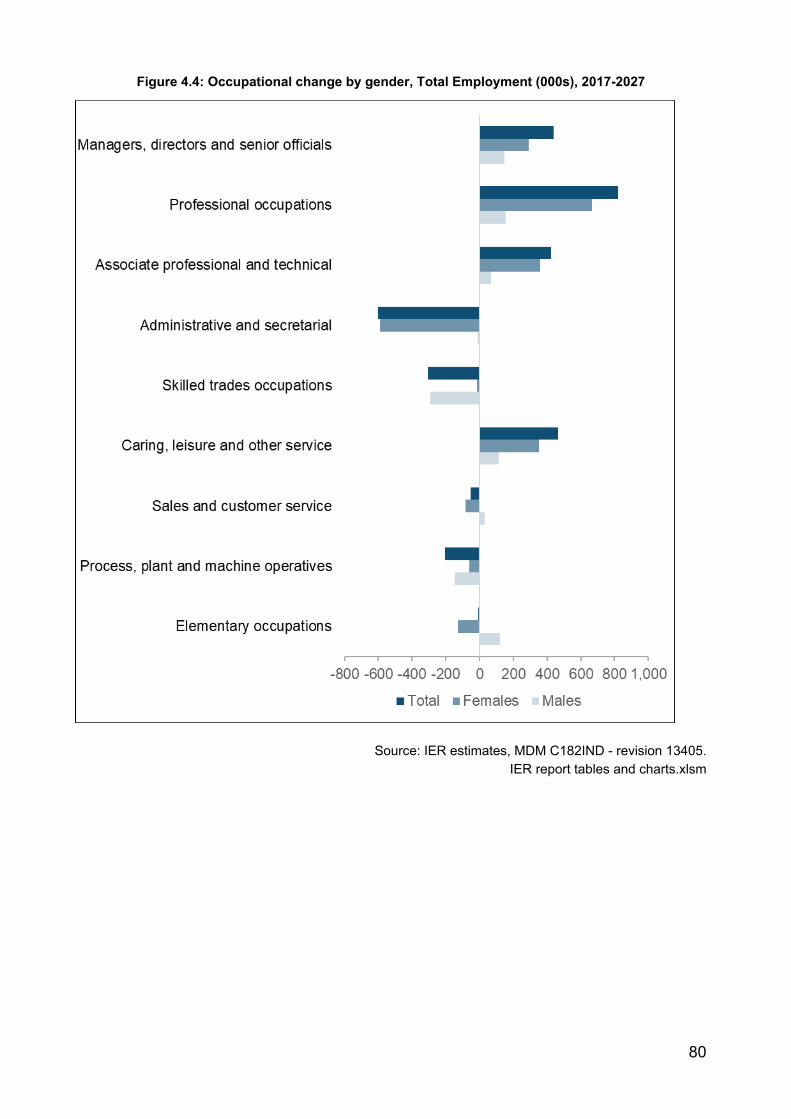
80
Figure 4.4: Occupational change by gender, Total Employment (000s), 2017-2027
Source: IER estimates, MDM C182IND - revision 13405. IER report tables and charts.xlsm
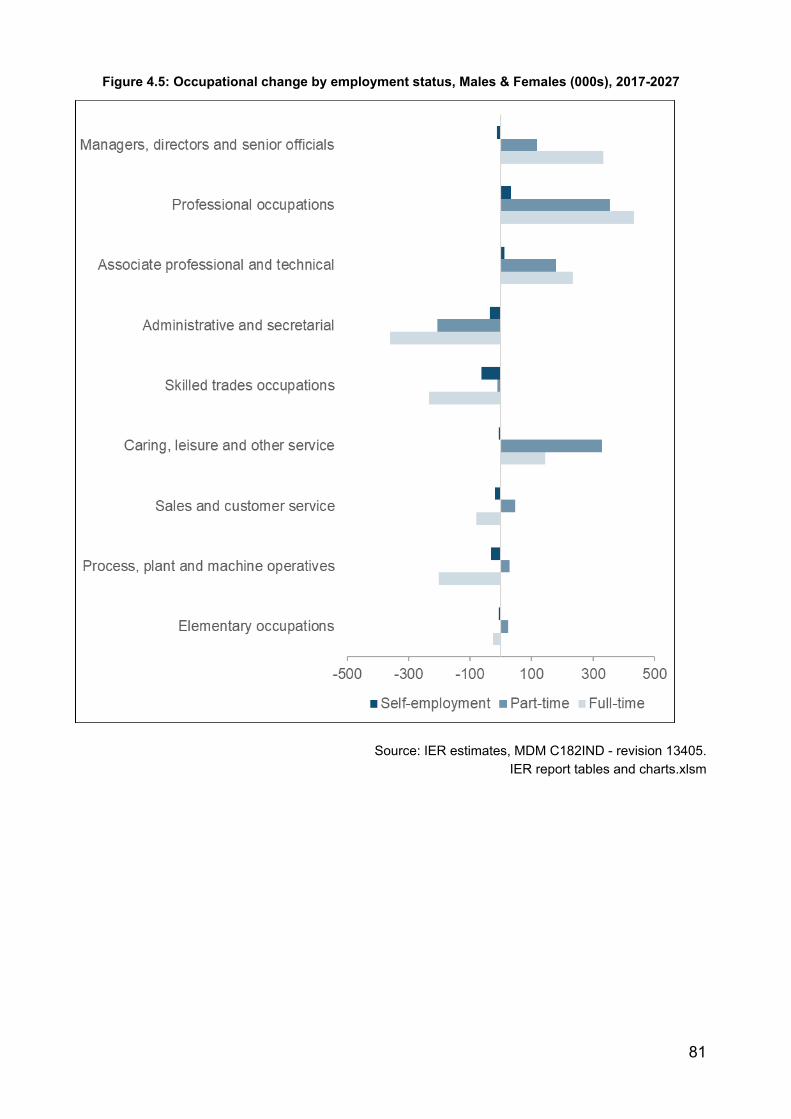
81
Figure 4.5: Occupational change by employment status, Males & Females (000s), 2017-2027
Source: IER estimates, MDM C182IND - revision 13405. IER report tables and charts.xlsm

82
Figure 4.6: Occupational change by employment status, Males (000s), 2017-2027
Source: IER estimates, MDM C182IND - revision 13405. IER report tables and charts.xlsm

83
Figure 4.7: Occupational change by employment status, Females (000s), 2017-2027
Source: IER estimates, MDM C182IND - revision 13405. IER report tables and charts.xlsm
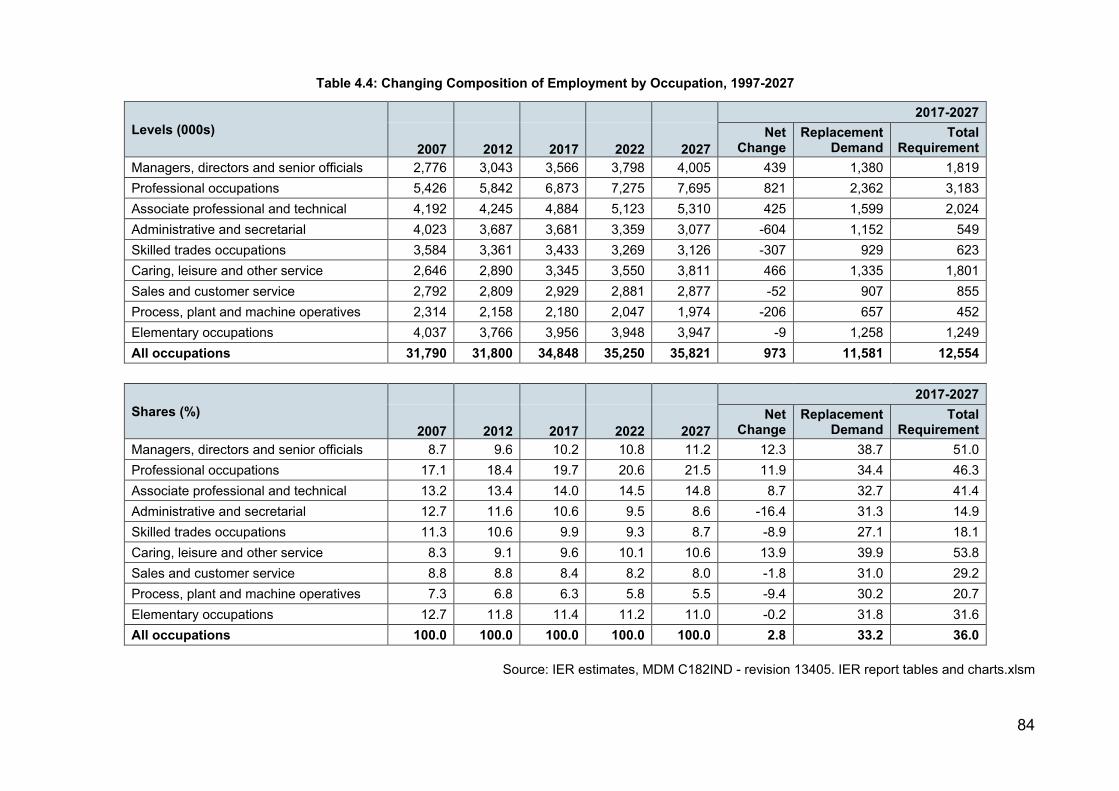
84
Table 4.4: Changing Composition of Employment by Occupation, 1997-2027
Levels (000s) 2017-2027
2007 2012 2017 2022 2027 Net
Change Replacement
Demand Total
Requirement Managers, directors and senior officials 2,776 3,043 3,566 3,798 4,005 439 1,380 1,819 Professional occupations 5,426 5,842 6,873 7,275 7,695 821 2,362 3,183 Associate professional and technical 4,192 4,245 4,884 5,123 5,310 425 1,599 2,024 Administrative and secretarial 4,023 3,687 3,681 3,359 3,077 -604 1,152 549 Skilled trades occupations 3,584 3,361 3,433 3,269 3,126 -307 929 623 Caring, leisure and other service 2,646 2,890 3,345 3,550 3,811 466 1,335 1,801 Sales and customer service 2,792 2,809 2,929 2,881 2,877 -52 907 855 Process, plant and machine operatives 2,314 2,158 2,180 2,047 1,974 -206 657 452 Elementary occupations 4,037 3,766 3,956 3,948 3,947 -9 1,258 1,249 All occupations 31,790 31,800 34,848 35,250 35,821 973 11,581 12,554
Shares (%) 2017-2027
2007 2012 2017 2022 2027 Net
Change Replacement
Demand Total
Requirement Managers, directors and senior officials 8.7 9.6 10.2 10.8 11.2 12.3 38.7 51.0 Professional occupations 17.1 18.4 19.7 20.6 21.5 11.9 34.4 46.3 Associate professional and technical 13.2 13.4 14.0 14.5 14.8 8.7 32.7 41.4 Administrative and secretarial 12.7 11.6 10.6 9.5 8.6 -16.4 31.3 14.9 Skilled trades occupations 11.3 10.6 9.9 9.3 8.7 -8.9 27.1 18.1 Caring, leisure and other service 8.3 9.1 9.6 10.1 10.6 13.9 39.9 53.8 Sales and customer service 8.8 8.8 8.4 8.2 8.0 -1.8 31.0 29.2 Process, plant and machine operatives 7.3 6.8 6.3 5.8 5.5 -9.4 30.2 20.7 Elementary occupations 12.7 11.8 11.4 11.2 11.0 -0.2 31.8 31.6 All occupations 100.0 100.0 100.0 100.0 100.0 2.8 33.2 36.0
Source: IER estimates, MDM C182IND - revision 13405. IER report tables and charts.xlsm
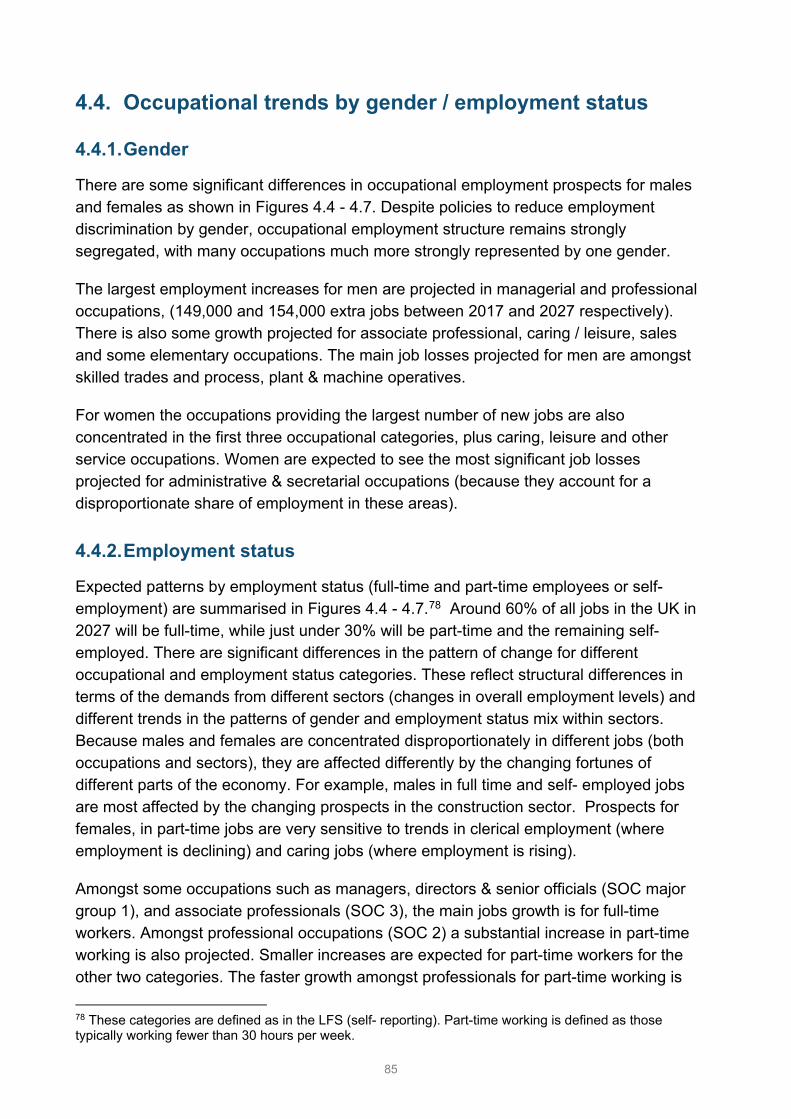
85
4.4. Occupational trends by gender / employment status
4.4.1. Gender
There are some significant differences in occupational employment prospects for males and females as shown in Figures 4.4 - 4.7. Despite policies to reduce employment discrimination by gender, occupational employment structure remains strongly segregated, with many occupations much more strongly represented by one gender.
The largest employment increases for men are projected in managerial and professional occupations, (149,000 and 154,000 extra jobs between 2017 and 2027 respectively). There is also some growth projected for associate professional, caring / leisure, sales and some elementary occupations. The main job losses projected for men are amongst skilled trades and process, plant & machine operatives.
For women the occupations providing the largest number of new jobs are also concentrated in the first three occupational categories, plus caring, leisure and other service occupations. Women are expected to see the most significant job losses projected for administrative & secretarial occupations (because they account for a disproportionate share of employment in these areas).
4.4.2. Employment status
Expected patterns by employment status (full-time and part-time employees or self-employment) are summarised in Figures 4.4 - 4.7.78 Around 60% of all jobs in the UK in 2027 will be full-time, while just under 30% will be part-time and the remaining self-employed. There are significant differences in the pattern of change for different occupational and employment status categories. These reflect structural differences in terms of the demands from different sectors (changes in overall employment levels) and different trends in the patterns of gender and employment status mix within sectors. Because males and females are concentrated disproportionately in different jobs (both occupations and sectors), they are affected differently by the changing fortunes of different parts of the economy. For example, males in full time and self- employed jobs are most affected by the changing prospects in the construction sector. Prospects for females, in part-time jobs are very sensitive to trends in clerical employment (where employment is declining) and caring jobs (where employment is rising).
Amongst some occupations such as managers, directors & senior officials (SOC major group 1), and associate professionals (SOC 3), the main jobs growth is for full-time workers. Amongst professional occupations (SOC 2) a substantial increase in part-time working is also projected. Smaller increases are expected for part-time workers for the other two categories. The faster growth amongst professionals for part-time working is
78 These categories are defined as in the LFS (self- reporting). Part-time working is defined as those typically working fewer than 30 hours per week.
86
probably related to the rising concentration of women in this occupational group and a preference for more flexible working patterns.
Amongst administrative & secretarial occupations (SOC 4) there are sharp declines expected, primarily focused on females, both full and part-time. Some significant job losses are also expected for female part-time sales occupations (SOC 7) although for males some growth is expected. As men increasingly take up jobs in this kind of occupation, they are tending to take on part-time roles. Social trends towards a more even balance in childcare and related responsibilities may also be encouraging more men to take on such part-time jobs.
For caring, leisure & other service occupations (SOC 6) the main growth is for part-time jobs, especially for women.
For skilled trades occupations, and for process, plant & machine operatives, the job losses are concentrated amongst full-time jobs, especially for men.
Self-employment numbers are not expected to change dramatically, but again, these patterns vary significantly within different sectors, with business and other services expected to account for a high proportion of growth.
The patterns by gender are generally similar for most of the employment status categories, but the occupational segregation of females and males into certain jobs results in some notable differences. For example, a much sharper growth in employment is expected for women than for men in caring, leisure & other service occupations.
Part time working is expected to increase amongst men in many occupations (most notably sales roles). Significant increases in male employment are projected for full-time workers in SOCs 1-3. The largest job losses for men are in SOCs 5 and 8. It is also notable that employment growth is expected for some male jobs in elementary occupations (mainly part-time), while for females there are predicted to be job losses. This reflects the different nature of the elementary jobs taken by men and women.
4.5. Replacement demands
4.5.1. Measuring replacement demands
The projections summarised in Tables 4.1-4.3 and Figure 4.1 focus on the total numbers of people who are expected to be employed in particular occupations in the future. Such estimates provide a useful indication of areas of change, highlighting the likely 'gainers' and 'losers'. However, this may give a misleading impression of job opportunities and related training requirements. Even those occupations where employment is projected to decline may still offer good career prospects, with a significant number of job openings. This is because, as long as significant numbers are employed in such jobs, employers
87
will need to replace those workers who leave due to retirement, career moves, mortality or other reasons.
Substantial changes in employment structure leading to job losses in a number of occupations are expected over the next decade. Nevertheless, there will be a need to recruit and train new entrants into these types of jobs to replace those retiring from the workforce or leaving for other reasons. Where employment is already projected to rise, such replacement demand elements will serve to reinforce this trend and lead to even greater requirements.
At any particular time, these outflows will include people leaving the employed workforce to start a family, etc., as well as those permanently retiring because of old age. Over the longer term, some of the former may return to the workforce, offsetting the other outflows (although in the very long run everyone departs from the labour force). Together these outflows are referred to as “replacement demand” (See Section 3).
The net change in employment levels is typically referred to as “expansion demand”, although in many cases this may be negative. A better term might be structural demand. The sum of expansion or structural demand and replacement demand is referred to as the net requirement. Further details of definitions and methods used to calculate the replacement demands and total requirements are given in Box 4.1.
Replacement demand can easily outweigh any negative changes resulting from any projected employment decline. At a macro level, replacement demands typically represent around 2-4% per annum of the employed workforce. These rates can vary significantly at a more micro level, where (for example) a workforce with many people approaching statutory retirement age will usually imply much higher replacement needs than a younger one (all else being equal).79
4.5.2. Estimates of replacement demands
Table 4.4 provides a summary for the 9 major occupational groups. Further detail on the 25 occupational sub-major groups is presented in Table 4.5 and Figure 4.8.
The total requirement for workers is positive in all occupational groups. Replacement demand is substantial and easily outweighs any negative structural (expansion) demand (see Table 4.4). The rates of replacement needs vary from 27-40% over the 10-year period for the 1-digit categories (again see Table 4.4). Over the decade as a whole, there is projected to be a net requirement of over 12.5 million new job openings. Replacement demand accounts for 11.5 million of these. Retirements from the workforce because of old age are the principal component of the latter. For all occupations together,
79 For example an occupational category such as managers or a particular sector such as some parts of manufacturing where much of the workforce has been in post for many years.
88
replacement demand over the period 2017-2027 is over 11 times larger than expansion demand.
In many occupations, the “expansion” or structural demand is negative (corresponding to declining employment levels). These include: administrative & secretarial occupations; skilled trades; sales & customer service occupations; and process, plant & machine operatives. In all these cases, the negative structural demand (the projected employment decline) is expected to be offset by positive replacement demand (mainly related to retirements from the workforce). Expansion demand is positive in all the other broad occupational groups. In such cases, expected retirements and other replacement demand elements will add to positive expansion demand to create even higher net requirements for new entrants. Similar patterns can be observed at the more detailed 2-digit level (see Table 4.5 and Figure 4.8). The estimates of replacement needs are based on quite limited information, using the latest data available from the LFS (see Box 4.1 for details)80. They should be regarded as indicative rather than precise. Nevertheless, they provide a broad indication of the scale of such demands, compared to the structural changes projected.
In principle, considerable variations in these patterns might be expected by sector and region, as well as by gender and employment status, reflecting in particular the different age structures of the different groups. In practice, the information available from the LFS does not make it easy to develop such customised estimates of age structures and flow rates.
The fundamental message is that actors in the labour market need to focus not just on the projected changes in occupational employment levels but on replacement needs. As individuals retire from the workforce or leave jobs for other reasons, important education and training needs arise. Even in occupations where employment is forecast to decline, such needs must be met in order to support existing operations. This also means that there may be good job opportunities for new entrants in many such areas, even where overall employment levels may be falling.
80 The estimated rates of outflow based on LFS data are significantly lower in this latest set of projections, possibly reflecting moves towards later retirement.
89
Box 4.1: Replacements demands: definitions and methods
Methodology and caveats The projections described in this section define the so-called “expansion” or structural demand arising from growth (or decline) in occupational employment levels. This is the net change in employment between two points in time. This is only part of the demand that needs to be met if employers are to maintain their operations. In order to do this they also need to replace those members of their staff who leave.
In principle, four components of replacement demands for occupations can be separately identified:
• losses due to retirement from the workforce, which require positive replacement. These may be retirements for old age or more temporary withdrawals from the labour force for reasons such as family formation, etc., (the latter may be partly offset by flows back in to the labour force);
• losses due to mortality;
• net occupational mobility, which, when outward, positively adds to replacement demand; if inward, it reduces such replacement demand;
• net geographical mobility, which, when outward, adds to replacement demand.
Total replacement demand is defined as the sum of these four elements. Some of these are net flows. In some instances, it may be appropriate to consider just gross outflows. The estimates here use net flows.
When total replacement demand as defined here is added to expansion demand, an estimate of expected net requirements for each occupation is obtained. This measure provides an indication of the number of newly qualified entrants likely to be required in each occupational group over a period of time.
The data used to estimate both the age structure of the workforce and the various flows are based upon very limited information, mostly taken from the LFS. The replacement demand estimates should, therefore, be regarded as indicative rather than precise.
90
4.6. More detailed occupational projections (SOC sub-major groups) Table 4.5 and Figure 4.8 present a more detailed analysis for the 25 sub-major occupation groups (the 2-digit level of SOC2010).
Managers, directors & senior officials: The corporate managers category has been a significant source of employment growth for many years. Despite attempts to tighten up the definition of managers with the introduction of the new SOC2010 system for classifying jobs this remains the case in the revised historical data. This pattern of growth is also expected to continue over the coming decade. The other category within this group is other managers & proprietors. This includes the owners and managers of many small businesses, especially in the service sector. This category has also experienced steady growth in the past decade. This is expected to continue over the coming decade, partly linked to the rebalancing of the economy towards the private sector. The growth is moderated by the restructuring of the distribution and retailing sector, including the shift towards the use of the internet, which is causing the closure of many small businesses as well as some larger retailers.82
Professional occupations: All the sub-major groups included in this major group experienced employment growth between 2007 and 2017. This is projected to continue. The highest rate of growth for 2017-2027 is projected for Health professionals as the
81 Wilson, R. A., M. May-Gillings, S. Patel and H Bui, (2019). Working Futures 2017-2027: Technical report on sources and methods. Department for Education. 82 For a review of the impact of the internet in retail businesses see the report from the Centre for Retail Research, see http://www.retailresearch.org/retail2018.php
Box 4.1 (continued): Replacements demands: definitions and methods
Data on net migration by occupation are not readily available, so this is set equal to zero by assumption in all the tables. Net occupational mobility measures based on turnover of those who change occupations within a 12-month period are available from the LFS. These exclude those who remain in the same occupation. They also exclude those who may change jobs more than once in a 12-month period. They are therefore a lower bound estimate of total turnover. However, it has proved impossible to develop a consistent set of such estimates for all the detailed specific sectors and geographical areas in the Working Futures database using data from the LFS. This is due to the latter’s limited sample size. The estimates shown here and in the more detailed tables are therefore based just on estimated losses from retirements and mortality.
The methods for preparing estimates of replacement demands are described in more detail in the separate Technical Report (Wilson et al. 201981).
91
health sector begins to recover from slowdown caused by austerity constraints. Science, research, engineering and technology professionals and Business, media and public service professionals are also expected to see significant growth. All these professional groups are projected to increase their share of overall employment.
Associate professional & technical occupations: Substantial employment growth has been experienced for a number of these sub-major groups. Employment has grown most rapidly over the previous decade for associate professionals engaged in the culture, media and sports occupations and for health and social care associate professionals. The latter was affected by cuts in public spending, but this is not expected to slow down the longer-term trend. This group is projected to experience one of the most rapid rates of increase of all sub-major groups between 2017 and 2027. Business and public service associate professionals are also projected to see substantial growth in job numbers. Within this broad occupational category, growth was slowest over the past decade for science, engineering & technology associate professionals and was actually negative for protective service occupations, which saw a net decline over the decade as a whole. These patterns are projected to continue over the decade from 2017-2027.
Administrative & secretarial occupations: The latest data suggests a continuation of the decline in employment for this group as a whole as ICT displaces many such jobs, especially amongst the secretarial and related occupations. Such job losses are projected to continue over the coming decade, if anything being even more concentrated on the latter group (which includes secretaries, typists and word processing operators, who are especially vulnerable to being displaced by advances in computer technology).
Skilled trades occupations: The recession has accelerated the already significant loss of jobs in many skilled trades occupations. Job losses in manufacturing and, post 2008 in construction, have impacted negatively on skilled metal & electrical trades, textile, printing & other skilled trades and construction & building trades. Construction trades are not expected to recover over the coming decade due to the relatively poor prospects for the construction sector. There is a small increase expected for skilled agriculture and related trades, but this is not sufficient to prevent a significant overall decline for skilled trades as a whole. For textiles, printing and other skilled trades declining employment levels are expected to continue but at a slower pace. Indeed the results of the projections at the more detailed 4-digit level suggest that there are some occupations within this group (such as chefs) that have brighter employment prospects.
Caring, leisure & other service occupations: Recent employment growth in these categories is expected to continue over the coming decade. Caring personal service occupations were one of the most rapidly growing occupational sub-major groups between 2007 and 2017. They are the fastest growing group of all over the projection period in terms of rate of growth over the period 2017-2027. Only customer service occupations outside the managerial, professional, and associate professional occupations are expected to see such growth over the coming decade. In absolute terms, the Caring personal service occupational group remain the most significant areas of job
92
growth, with an increase of almost half a million jobs projected. A key driver here is the rising demand for services from an ageing population. The majority of these jobs are expected to be taken by women. In contrast, the number of jobs in leisure, travel and related personal service occupations is expected to fall slightly.
Sales & customer service occupations: This group is dominated numerically by occupations such as sales assistants and check-out operators in retail outlets who fall into the Sales Occupations sub-major group. Females account for the greater part of employment in this occupational sub group, with many working part-time. This category has seen job losses in recent years as the retail and distribution sector restructures itself. Increasing concentration of businesses, competition from the Internet and technological developments, such as automated checkouts, are expected to reduce the need for more traditional sales occupations mean that this pattern is expected to continue. In contrast, the demand for customer service (more specialist sales and customer care) occupations represent a much smaller but rapidly growing category, which is expected to continue to increase in importance over the coming decade. These jobs are probably less vulnerable to the effects of technological change.
Process, plant & machine operatives: This group includes a variety of occupations, some operating fixed plant in factories (part of the manufacturing sector) while others drive mobile plant as well as passenger and goods vehicles (mostly in the distribution and transport sectors). Employment declined quite rapidly for the former category (process, plant & machine operators) over the last decade, linked to the loss of jobs in manufacturing. However, there were modest job gains for the transport & mobile machine drivers category. Over the coming decade, further substantial job losses are expected amongst process, plant & machine operators, whilst there is expected to be a very modest increase in the numbers of jobs for the transport & mobile machine drivers category.
Elementary occupations: The final occupational group contains elementary occupations that are not classifiable elsewhere. These are jobs that require little or no prior training. Employment levels across this group of occupations have been in long-term trend decline for many years, but there are some offsetting trends. The service sector, in particular, has generated a number of extra jobs in this area. The growth of employment in call centres, and fast food outlets, etc, has helped to offset the long-term trend decline in employment for elementary occupations in other areas (although some of these jobs may fall within the more skilled customer service occupations category). Overall, small increases in job numbers are expected, but especially in the service category (SOC 9.2).
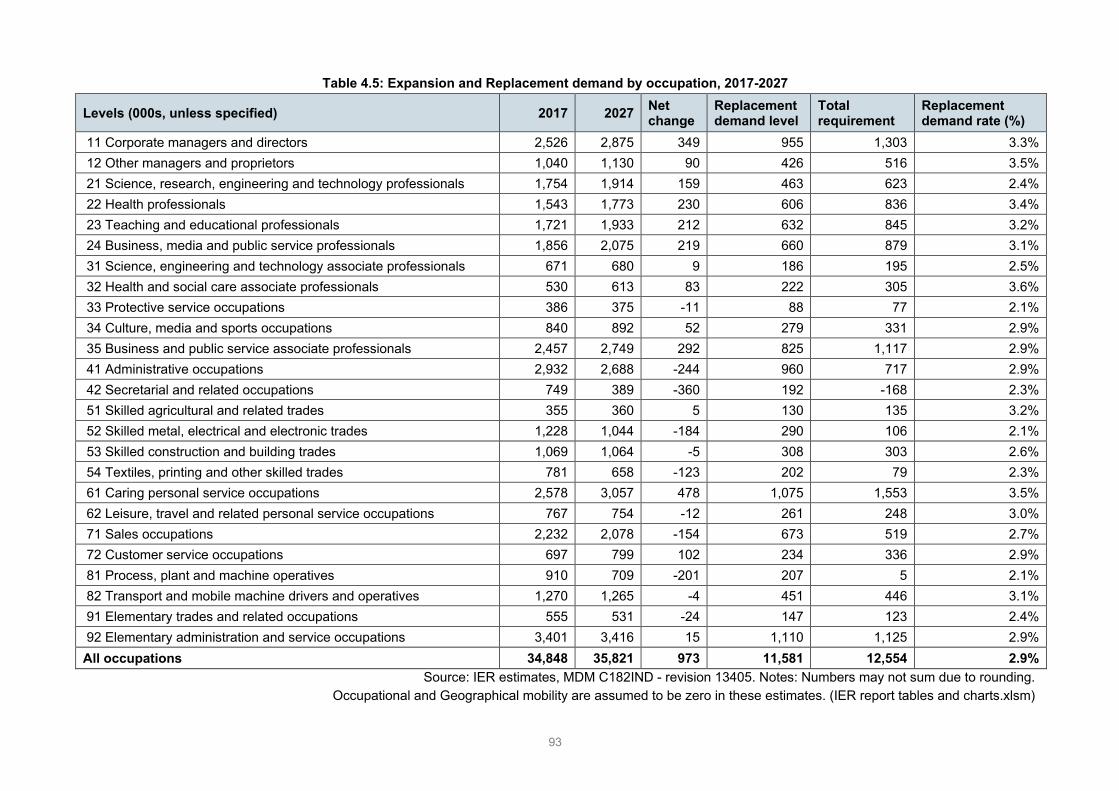
93
Table 4.5: Expansion and Replacement demand by occupation, 2017-2027
Levels (000s, unless specified) 2017 2027 Net change
Replacement demand level
Total requirement
Replacement demand rate (%)
11 Corporate managers and directors 2,526 2,875 349 955 1,303 3.3% 12 Other managers and proprietors 1,040 1,130 90 426 516 3.5% 21 Science, research, engineering and technology professionals 1,754 1,914 159 463 623 2.4% 22 Health professionals 1,543 1,773 230 606 836 3.4% 23 Teaching and educational professionals 1,721 1,933 212 632 845 3.2% 24 Business, media and public service professionals 1,856 2,075 219 660 879 3.1% 31 Science, engineering and technology associate professionals 671 680 9 186 195 2.5% 32 Health and social care associate professionals 530 613 83 222 305 3.6% 33 Protective service occupations 386 375 -11 88 77 2.1% 34 Culture, media and sports occupations 840 892 52 279 331 2.9% 35 Business and public service associate professionals 2,457 2,749 292 825 1,117 2.9% 41 Administrative occupations 2,932 2,688 -244 960 717 2.9% 42 Secretarial and related occupations 749 389 -360 192 -168 2.3% 51 Skilled agricultural and related trades 355 360 5 130 135 3.2% 52 Skilled metal, electrical and electronic trades 1,228 1,044 -184 290 106 2.1% 53 Skilled construction and building trades 1,069 1,064 -5 308 303 2.6% 54 Textiles, printing and other skilled trades 781 658 -123 202 79 2.3% 61 Caring personal service occupations 2,578 3,057 478 1,075 1,553 3.5% 62 Leisure, travel and related personal service occupations 767 754 -12 261 248 3.0% 71 Sales occupations 2,232 2,078 -154 673 519 2.7% 72 Customer service occupations 697 799 102 234 336 2.9% 81 Process, plant and machine operatives 910 709 -201 207 5 2.1% 82 Transport and mobile machine drivers and operatives 1,270 1,265 -4 451 446 3.1% 91 Elementary trades and related occupations 555 531 -24 147 123 2.4% 92 Elementary administration and service occupations 3,401 3,416 15 1,110 1,125 2.9% All occupations 34,848 35,821 973 11,581 12,554 2.9%
Source: IER estimates, MDM C182IND - revision 13405. Notes: Numbers may not sum due to rounding. Occupational and Geographical mobility are assumed to be zero in these estimates. (IER report tables and charts.xlsm)
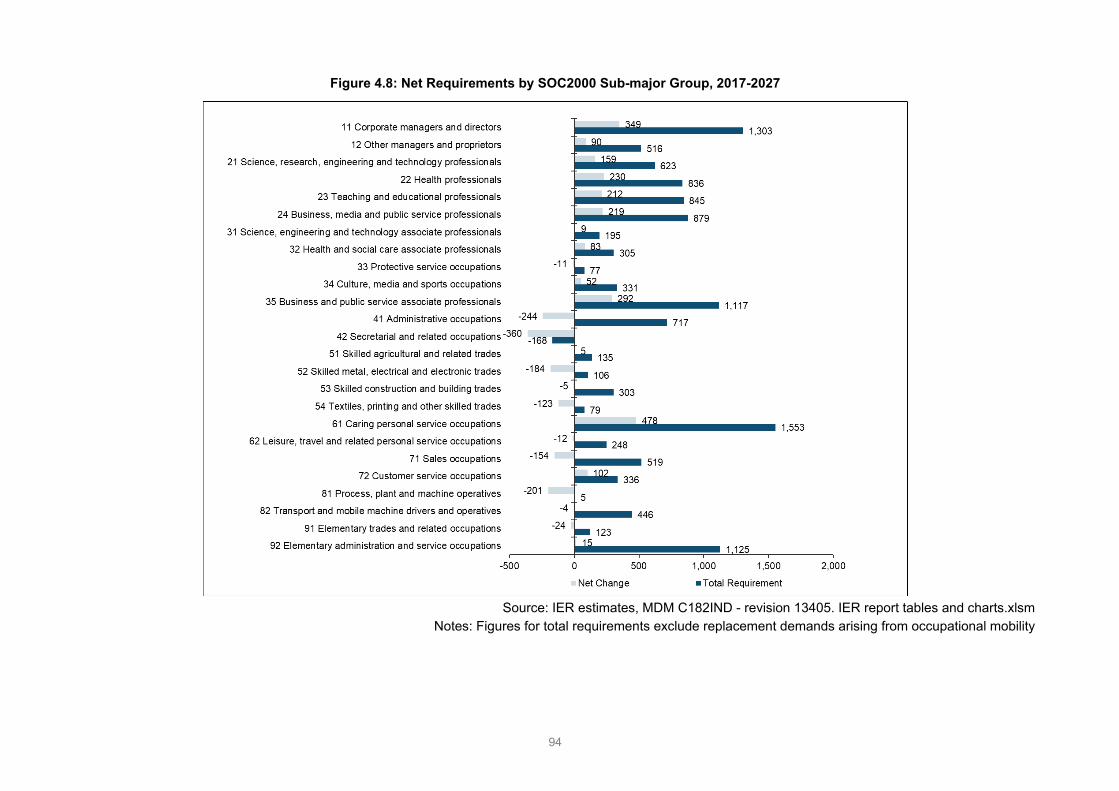
94
Figure 4.8: Net Requirements by SOC2000 Sub-major Group, 2017-2027
Source: IER estimates, MDM C182IND - revision 13405. IER report tables and charts.xlsm
Notes: Figures for total requirements exclude replacement demands arising from occupational mobility
95
4.7. Components of occupational change
The occupational projections and observed historical change can be analysed using shift-share techniques. This provides a description of how the changes can be broken down into three main components: a scale effect, an industrial mix effect and an occupational effect, (see Box 4.2 for details). The effects rarely all point in the same direction. The scale effect is uniformly positive over both the historical period 2007-2017 and for the
83 The shift share results are sensitive to the level of aggregation at which the analysis is conducted so the results here are disaggregated into the more detailed 22 industries, in contrast to the 6 broad sectors used elsewhere in the report.
Box 4.2: Shift-share analysis of occupational change83
The scale effect measures the impact of the overall expansion (or decline) of employment levels in the economy, assuming this applies strictly proportionally to all industries, and occupations.
The industrial mix effect measures the impact of the changing patterns of final demands on the industrial structure of employment, whilst holding constant the occupational composition within the industries. It is measured as the difference between the growth or decline in employment in the sector concerned and the scale effect.
The occupational effect measures the impact of organisational and technological changes on the occupational structure of employment within the industries. This is computed as the difference between the total change and the sum of the scale and industry effects.
The shift-share analysis is carried out at a detailed industry level, for the 25 SOC sub-major occupational groups, for males and females separately. The industry and occupational effects, by definition sum to zero when added up across all occupations.
The results depend upon the level of aggregation of both industry and occupation categories used. In Tables 4.6 and 4.7, the results of the shift-share analysis for the historical period 2007-2017 and for the projection period 2017-2027 are based on the 2-digit level of SOC and the 22 industry categories. These tables show the projected net employment changes across each of the 25 sub-major occupations in terms of both absolute levels and percentages. These net changes are decomposed into the three component effects.
Note that in the accompanying Working Futures workbooks the shift-share analysis and results will vary depending on the level of sectoral aggregation used in each workbook.
96
projected period 2017-2027. The scale effect reflects the overall employment increases projected across all categories. Over the decade 2007-2017, employment rose to 2008 before falling back and then recovering. The scale effect measures the overall change over the whole period. The other two effects both exhibit differing signs across the various occupational groups, in each case summing across all occupations to zero.
The dominant explanation of change for most occupations for the period 2007-2017 was attributable to occupational effects, the impact of changing industrial employment structure is significant but is general modest in comparison (see Table 4.6). The scale effect over the decade 2007-2017 as a whole was very important, despite the impact of the recession following 2008. All else being equal, the scale effect resulted in an increase of just under 10% in each occupational employment level over that decade.
In many occupations, the occupational effect was of a much greater significance, resulting in both large positive and negative changes. For many white-collar, (non-manual) occupations, it was a positive influence, although notably not for administrative, clerical, and secretarial occupations. For the latter the continuing impact of information and communications technology (ICT) has led to significant job losses as previously labour intensive but repetitive work in this area has increasingly been automated. Negative occupational effects were also observed for many blue-collar, (manual) workers as ICT and other technological developments have resulted in machines taking over much work previously done by craftsmen and machine operatives.
Over the period 2007-2017 the industry mix effect was important for a small number of occupations. Some of these are where these effects are negative (for those occupations linked to the fortunes of declining sectors such as manufacturing). In other cases, they are positive, linked most closely to growing parts of the service sector, most notably health and social care.
For the forecast period 2017-2027 the scale and occupational effects are again dominant (see Table 4.7). The scale effect results in an increase of just under 3% in employment levels for each occupation over the 2017-2027 period (all else being equal). Although there are not quite such extreme values as in 2007-2017, the overall changes in magnitude for the occupational effect in the projection period are generally much more significant than the industrial effects.
In absolute terms, the industry mix effects are insignificant except in a small number of occupations, such as plant and machine operatives (where it is negative) and caring personal service occupations (where it is positive). The former is linked to the decline in manufacturing employment. The latter is rooted in the growth of employment opportunities in some parts of the service sector for jobs involving care for the elderly.
The occupational effect is strongly positive for most professional and associate professional groups and especially in the case of the caring personal service occupations. In the period 2007-2017 there was a strong industry effect for this last

97
occupational group as the scale of social care activities grew. In the forecast, this continues to reinforce the occupational effect.
Occupational effects impose a strong negative impact for some other occupations, including administrative occupations, secretarial & related occupations, skilled metal & electrical trades, textile, printing and other skilled trades, and process, sales occupations and process, plant & machine operatives. In all of these sub-major groups, significant changes in organisation and technology within the employing industries are expected to have a marked negative impact on employment levels.
The nature of the industry effects are generally consistent with the results for the previous decade. However, they are generally much less significant than observed in previous decades, when the decline of employment in the primary and manufacturing industries and the shift to services was much more pronounced.
The key drivers of occupational employment change over the decade 2017-2027 are therefore expected to be more closely related to changing ways of working within industries and the way in which technological change, especially IT, impacts on the need for different skills. This is in contrast to earlier decades, when it has been the changing sectoral structure of employment that was the prime driver.
For the moment, more skilled non-manual occupations are less vulnerable to the effects of automation, but with the increasing sophistication of the development of expert systems, even these types of jobs seem likely to become increasingly vulnerable to automation beyond 2027 (Nedelkoska and Quintini, 201884).
.
84 Nedelkoska, L. and Quintini, G. (2018). "Automation, skills use and training", OECD Social, Employment and Migration Working Papers, No. 202, OECD Publishing: Paris. Available from: https://doi.org/10.1787/2e2f4eea-en.
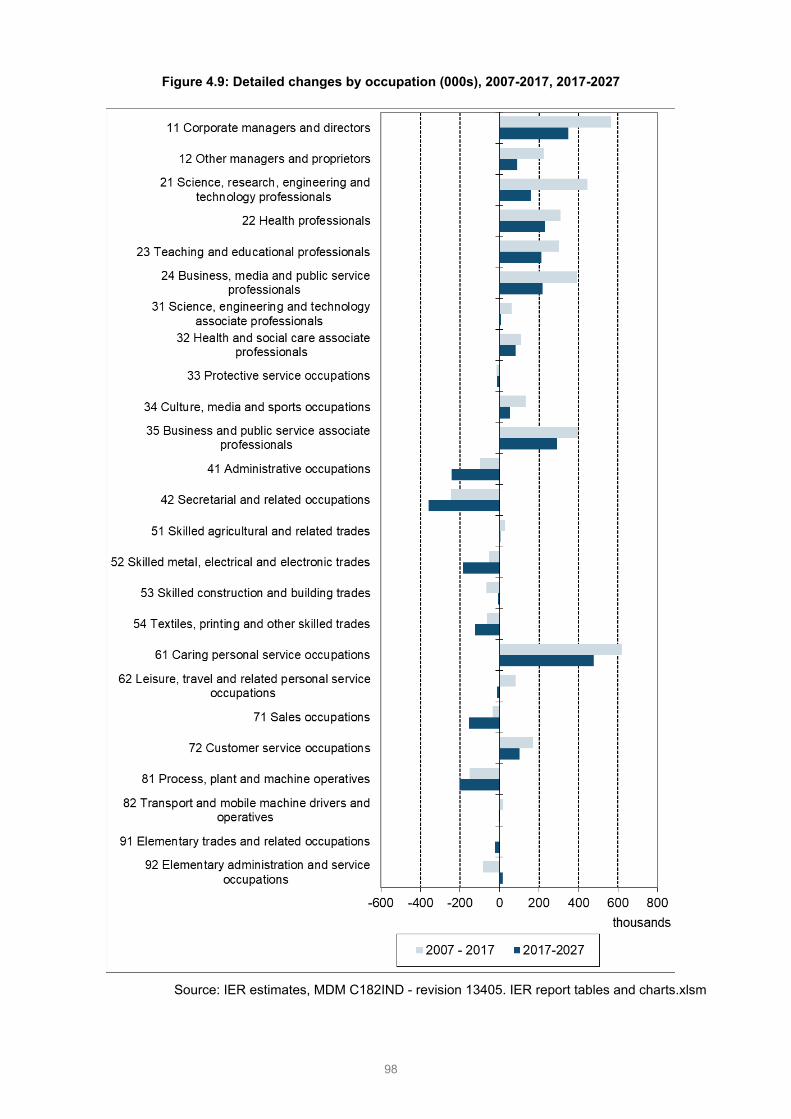
98
Figure 4.9: Detailed changes by occupation (000s), 2007-2017, 2017-2027
Source: IER estimates, MDM C182IND - revision 13405. IER report tables and charts.xlsm
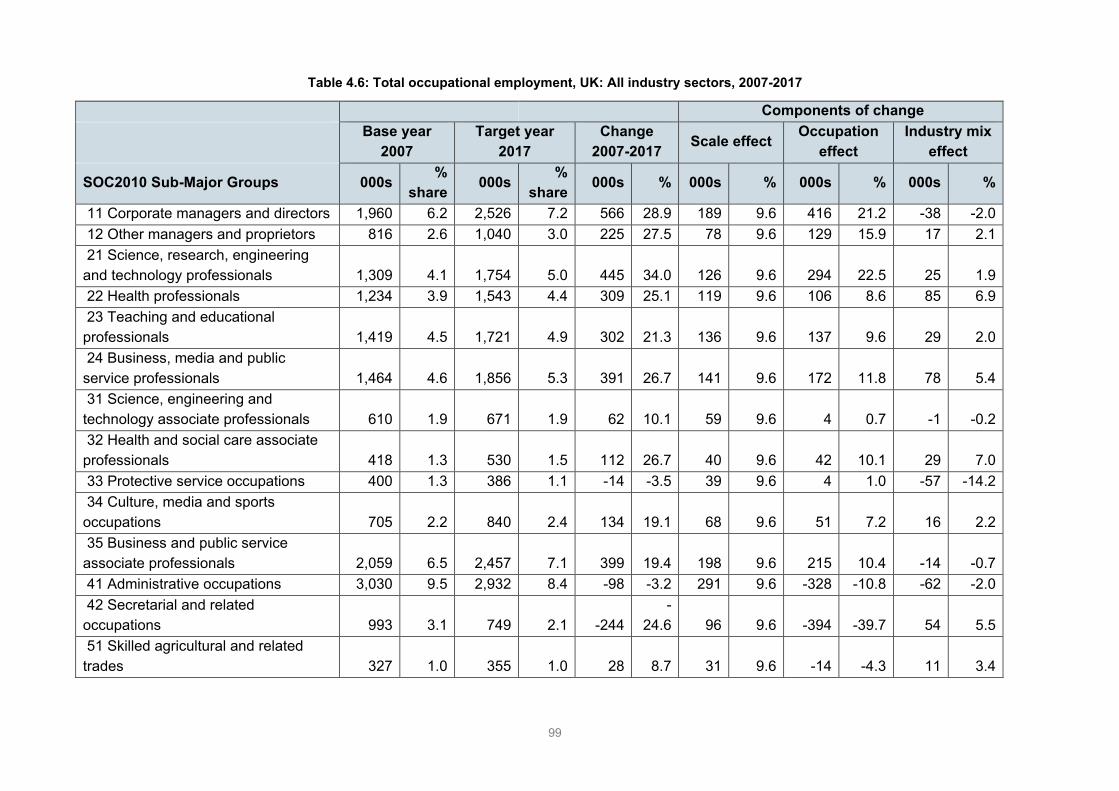
99
Table 4.6: Total occupational employment, UK: All industry sectors, 2007-2017
Components of change
Base year 2007
Target year 2017
Change 2007-2017 Scale effect Occupation
effect Industry mix
effect
SOC2010 Sub-Major Groups 000s % share 000s %
share 000s % 000s % 000s % 000s %
11 Corporate managers and directors 1,960 6.2 2,526 7.2 566 28.9 189 9.6 416 21.2 -38 -2.0 12 Other managers and proprietors 816 2.6 1,040 3.0 225 27.5 78 9.6 129 15.9 17 2.1 21 Science, research, engineering and technology professionals 1,309 4.1 1,754 5.0 445 34.0 126 9.6 294 22.5 25 1.9 22 Health professionals 1,234 3.9 1,543 4.4 309 25.1 119 9.6 106 8.6 85 6.9 23 Teaching and educational professionals 1,419 4.5 1,721 4.9 302 21.3 136 9.6 137 9.6 29 2.0 24 Business, media and public service professionals 1,464 4.6 1,856 5.3 391 26.7 141 9.6 172 11.8 78 5.4 31 Science, engineering and technology associate professionals 610 1.9 671 1.9 62 10.1 59 9.6 4 0.7 -1 -0.2 32 Health and social care associate professionals 418 1.3 530 1.5 112 26.7 40 9.6 42 10.1 29 7.0 33 Protective service occupations 400 1.3 386 1.1 -14 -3.5 39 9.6 4 1.0 -57 -14.2 34 Culture, media and sports occupations 705 2.2 840 2.4 134 19.1 68 9.6 51 7.2 16 2.2 35 Business and public service associate professionals 2,059 6.5 2,457 7.1 399 19.4 198 9.6 215 10.4 -14 -0.7 41 Administrative occupations 3,030 9.5 2,932 8.4 -98 -3.2 291 9.6 -328 -10.8 -62 -2.0 42 Secretarial and related occupations 993 3.1 749 2.1 -244
-24.6 96 9.6 -394 -39.7 54 5.5
51 Skilled agricultural and related trades 327 1.0 355 1.0 28 8.7 31 9.6 -14 -4.3 11 3.4
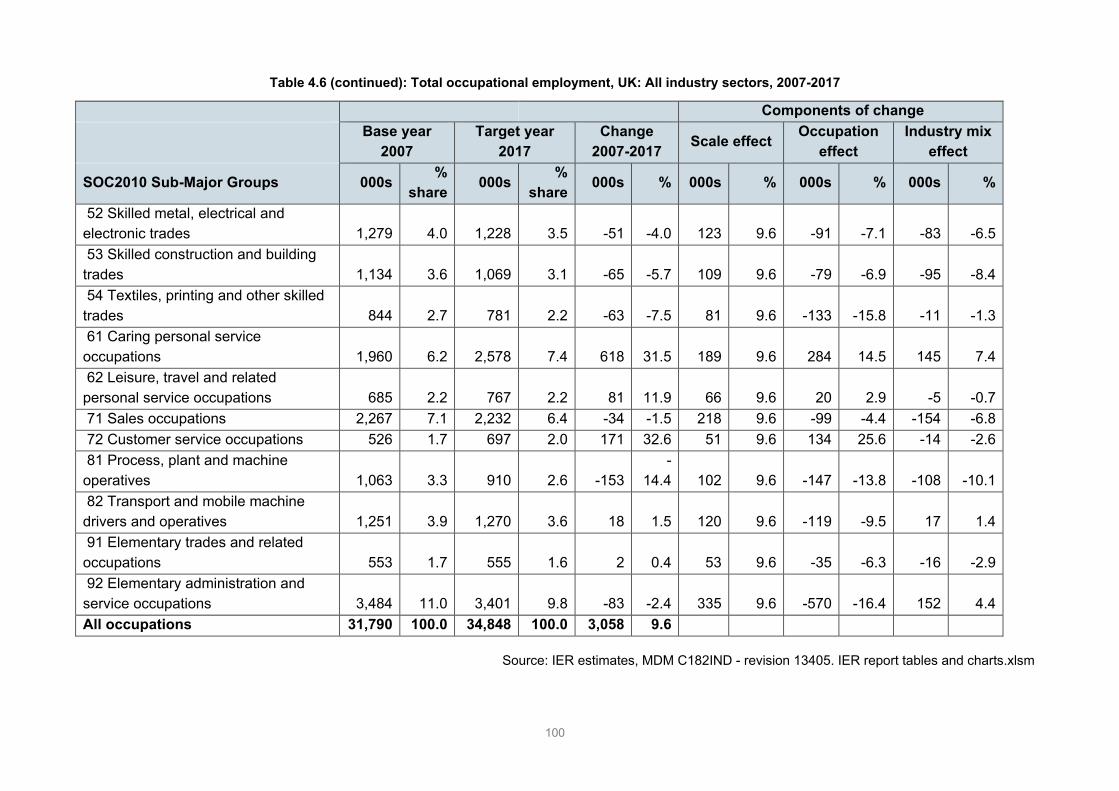
100
Table 4.6 (continued): Total occupational employment, UK: All industry sectors, 2007-2017
Components of change
Base year 2007
Target year 2017
Change 2007-2017 Scale effect Occupation
effect Industry mix
effect
SOC2010 Sub-Major Groups 000s % share 000s %
share 000s % 000s % 000s % 000s %
52 Skilled metal, electrical and electronic trades 1,279 4.0 1,228 3.5 -51 -4.0 123 9.6 -91 -7.1 -83 -6.5 53 Skilled construction and building trades 1,134 3.6 1,069 3.1 -65 -5.7 109 9.6 -79 -6.9 -95 -8.4 54 Textiles, printing and other skilled trades 844 2.7 781 2.2 -63 -7.5 81 9.6 -133 -15.8 -11 -1.3 61 Caring personal service occupations 1,960 6.2 2,578 7.4 618 31.5 189 9.6 284 14.5 145 7.4 62 Leisure, travel and related personal service occupations 685 2.2 767 2.2 81 11.9 66 9.6 20 2.9 -5 -0.7 71 Sales occupations 2,267 7.1 2,232 6.4 -34 -1.5 218 9.6 -99 -4.4 -154 -6.8 72 Customer service occupations 526 1.7 697 2.0 171 32.6 51 9.6 134 25.6 -14 -2.6 81 Process, plant and machine operatives 1,063 3.3 910 2.6 -153
-14.4 102 9.6 -147 -13.8 -108 -10.1
82 Transport and mobile machine drivers and operatives 1,251 3.9 1,270 3.6 18 1.5 120 9.6 -119 -9.5 17 1.4 91 Elementary trades and related occupations 553 1.7 555 1.6 2 0.4 53 9.6 -35 -6.3 -16 -2.9 92 Elementary administration and service occupations 3,484 11.0 3,401 9.8 -83 -2.4 335 9.6 -570 -16.4 152 4.4 All occupations 31,790 100.0 34,848 100.0 3,058 9.6
Source: IER estimates, MDM C182IND - revision 13405. IER report tables and charts.xlsm

101
Table 4.7: Total occupational employment, UK: All industry sectors, 2017-2027
Components of change
Base year 2017
Target year 2027
Change 2017-2027
Scale effect
Occupation effect
Industry mix effect
SOC2010 Sub-Major Groups 000s % share 000s %
share 000s % 000s % 000s % 000s %
11 Corporate managers and directors 2,526 7.2 2,875 8.0 349 13.8 71 2.8 295 11.7 -17 -0.7 12 Other managers and proprietors 1,040 3.0 1,130 3.2 90 8.6 29 2.8 54 5.2 7 0.6 21 Science, research, engineering and technology professionals 1,754 5.0 1,914 5.3 159 9.1 49 2.8 104 5.9 7 0.4 22 Health professionals 1,543 4.4 1,773 5.0 230 14.9 43 2.8 112 7.3 75 4.9 23 Teaching and educational professionals 1,721 4.9 1,933 5.4 212 12.3 48 2.8 194 11.3 -30 -1.7 24 Business, media and public service professionals 1,856 5.3 2,075 5.8 219 11.8 52 2.8 139 7.5 29 1.5 31 Science, engineering and technology associate professionals 671 1.9 680 1.9 9 1.3 19 2.8 -6 -0.9 -4 -0.6 32 Health and social care associate professionals 530 1.5 613 1.7 83 15.6 15 2.8 42 8.0 26 4.8 33 Protective service occupations 386 1.1 375 1.0 -11 -2.8 11 2.8 -16 -4.1 -6 -1.6 34 Culture, media and sports occupations 840 2.4 892 2.5 52 6.2 23 2.8 6 0.7 23 2.7 35 Business and public service associate professionals 2,457 7.1 2,749 7.7 292 11.9 69 2.8 234 9.5 -11 -0.5 41 Administrative occupations 2,932 8.4 2,688 7.5 -244 -8.3 82 2.8 -317 -10.8 -9 -0.3 42 Secretarial and related occupations 749 2.1 389 1.1 -360
-48.1 21 2.8 -391 -52.2 10 1.3
51 Skilled agricultural and related trades 355 1.0 360 1.0 5 1.5 10 2.8 10 2.9 -15 -4.1
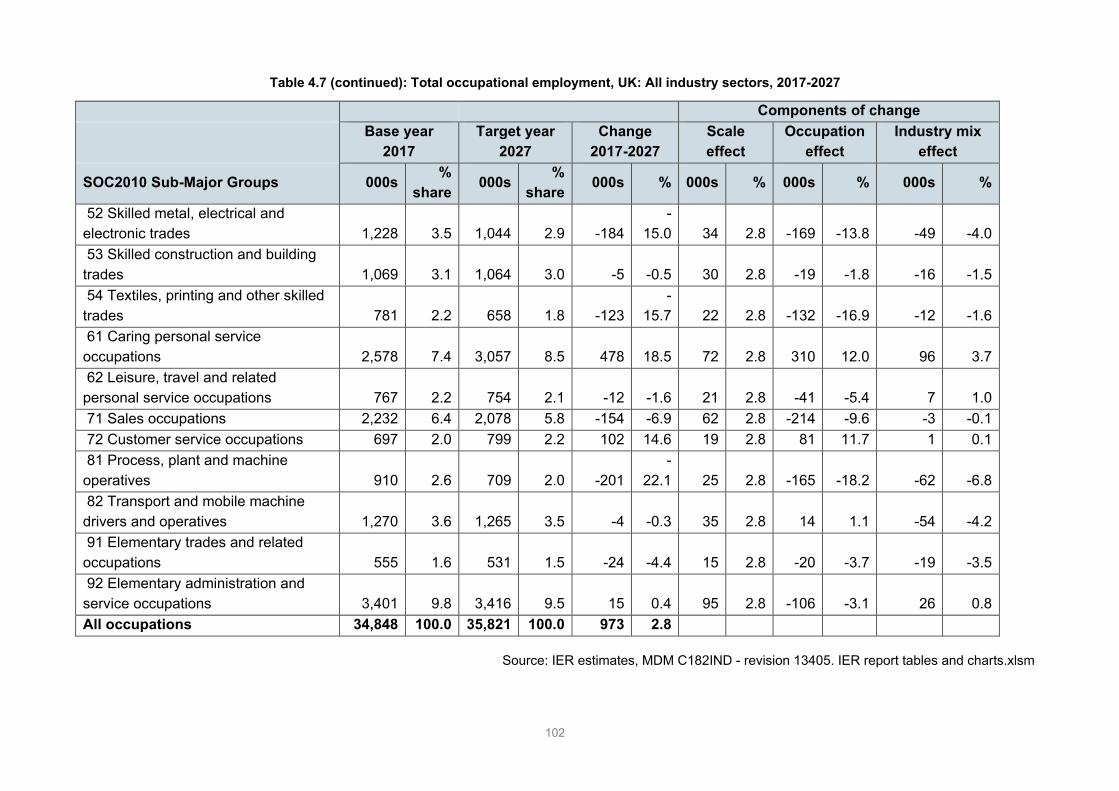
102
Table 4.7 (continued): Total occupational employment, UK: All industry sectors, 2017-2027
Components of change
Base year 2017
Target year 2027
Change 2017-2027
Scale effect
Occupation effect
Industry mix effect
SOC2010 Sub-Major Groups 000s % share 000s %
share 000s % 000s % 000s % 000s %
52 Skilled metal, electrical and electronic trades 1,228 3.5 1,044 2.9 -184
-15.0 34 2.8 -169 -13.8 -49 -4.0
53 Skilled construction and building trades 1,069 3.1 1,064 3.0 -5 -0.5 30 2.8 -19 -1.8 -16 -1.5 54 Textiles, printing and other skilled trades 781 2.2 658 1.8 -123
-15.7 22 2.8 -132 -16.9 -12 -1.6
61 Caring personal service occupations 2,578 7.4 3,057 8.5 478 18.5 72 2.8 310 12.0 96 3.7 62 Leisure, travel and related personal service occupations 767 2.2 754 2.1 -12 -1.6 21 2.8 -41 -5.4 7 1.0 71 Sales occupations 2,232 6.4 2,078 5.8 -154 -6.9 62 2.8 -214 -9.6 -3 -0.1 72 Customer service occupations 697 2.0 799 2.2 102 14.6 19 2.8 81 11.7 1 0.1 81 Process, plant and machine operatives 910 2.6 709 2.0 -201
-22.1 25 2.8 -165 -18.2 -62 -6.8
82 Transport and mobile machine drivers and operatives 1,270 3.6 1,265 3.5 -4 -0.3 35 2.8 14 1.1 -54 -4.2 91 Elementary trades and related occupations 555 1.6 531 1.5 -24 -4.4 15 2.8 -20 -3.7 -19 -3.5 92 Elementary administration and service occupations 3,401 9.8 3,416 9.5 15 0.4 95 2.8 -106 -3.1 26 0.8 All occupations 34,848 100.0 35,821 100.0 973 2.8
Source: IER estimates, MDM C182IND - revision 13405. IER report tables and charts.xlsm
103
4.8. Detailed occupational changes within industries Occupational employment structure varies considerably across industries, as does how it is expected to change over time. Figure 4.10 presents an overview of both history (employment levels in 2017) and projections (expected changes 2017 to 2027), focusing on the 22 Working Futures industries and 25 2-digit SOC2010 sub-major groups (see previous figure for key to occupational categories).
Those industries and occupations expected to grow or decline most rapidly are highlighted by shading of the row and column headers. The shading in row and column headers indicates sectors in which employment is projected to grow or decline by 10% or more between 2017 and 2027. In this set of projections, no industries are projected to grow by 10% or more. Just two, Mining and quarrying and the Rest of manufacturing, are projected to see declines of 10% or more.
The first of these industries does not employ large numbers of people. This is indicated by the lack of shading of any of the cells in that row. Within the body of the figure, cells that include 100,000 or more people employed are lightly shaded. These will be areas where there are significant replacement demands.
In contrast, the Rest of manufacturing sector does still employ significant numbers. These are concentrated in particular occupations such as corporate managers, professional occupations, associate professional, admin and clerical skilled trades and operatives
Similarly, the following occupational categories are projected to grow rapidly, by 10 % or more over the decade:
• 11 Corporate managers and directors;
• 22 Health professionals;
• 23 Teaching and educational professionals;
• 24 Business, media and public service professionals;
• 32 Health and social care associate professionals;
• 35 Business and public service associate professionals;
• 61 Caring personal service occupations; and
• 72 Customer service occupations.
Those occupations that are expected to decline by 10 % or more are also indicated by patterned shading of column headers. These comprise the following:
• 42 Secretarial and related occupations;
• 52 Skilled metal, electrical and electronic trades;

104
• 54 Textiles, printing and other skilled trades; and
• 81 Process, plant and machine operatives.
The cells with the most rapid changes (+ or – 20% or more), are indicated by a + or – symbol. Where such symbols occur in a shaded cell, the changes are most significant in terms of numbers involved.
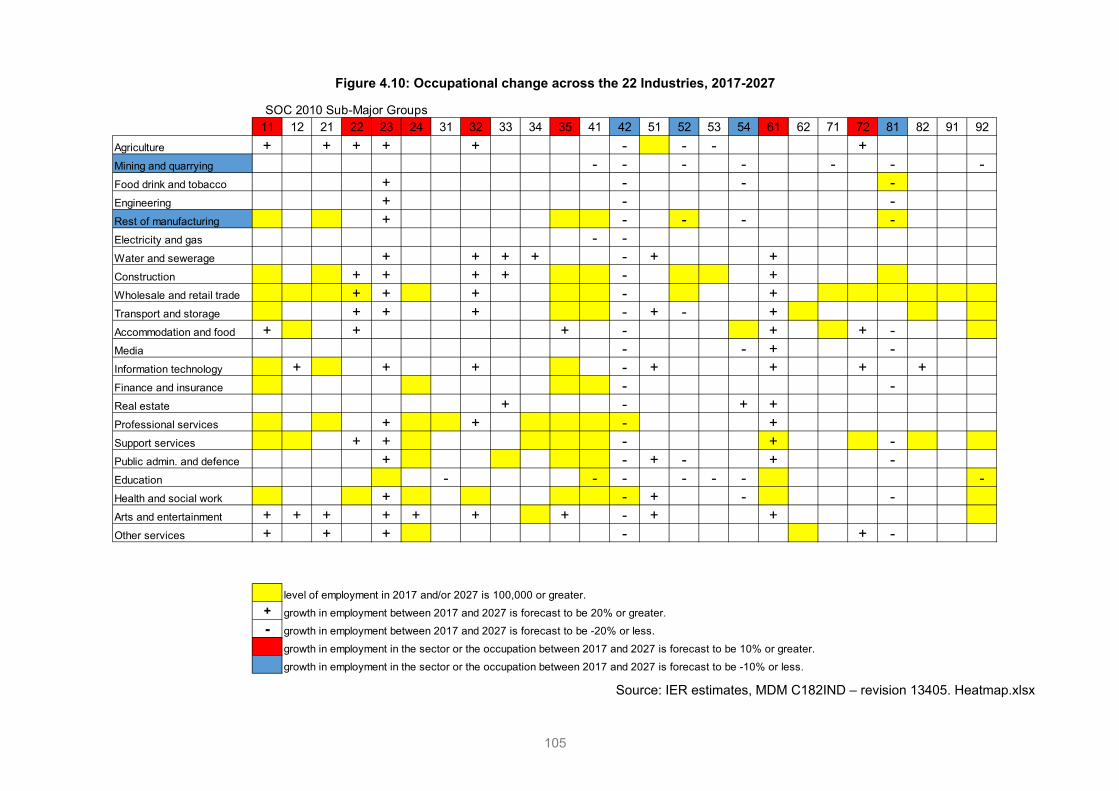
105
Figure 4.10: Occupational change across the 22 Industries, 2017-2027
Source: IER estimates, MDM C182IND – revision 13405. Heatmap.xlsx
SOC 2010 Sub-Major Groups11 12 21 22 23 24 31 32 33 34 35 41 42 51 52 53 54 61 62 71 72 81 82 91 92
Agriculture + + + + + - - - +Mining and quarrying - - - - - - -Food drink and tobacco + - - -Engineering + - -Rest of manufacturing + - - - -Electricity and gas - -Water and sewerage + + + + - + +Construction + + + + - +Wholesale and retail trade + + + - +Transport and storage + + + - + - +Accommodation and food + + + - + + -Media - - + -Information technology + + + - + + + +Finance and insurance - -Real estate + - + +Professional services + + - +Support services + + - + -Public admin. and defence + - + - + -Education - - - - - - -Health and social work + - + - -Arts and entertainment + + + + + + + - + +Other services + + + - + -
level of employment in 2017 and/or 2027 is 100,000 or greater.+ growth in employment between 2017 and 2027 is forecast to be 20% or greater.- growth in employment between 2017 and 2027 is forecast to be -20% or less.
growth in employment in the sector or the occupation between 2017 and 2027 is forecast to be 10% or greater.growth in employment in the sector or the occupation between 2017 and 2027 is forecast to be -10% or less.
106
5. Implications for qualifications
5.1. Introduction and general approach Formal qualifications held by individuals provide an alternative measure of skill to their occupation. Qualifications are awarded to accredit learning and skills acquired during education and training. In some respects, qualifications are better at measuring the supply of skills (numbers of people holding certain credentials) than the demand for skills. It is not so easy to measure the demand for qualifications by employers, as there is typically a broad range of qualifications held by the workforce in any particular job.
Better-qualified people (level 4 and above) have a higher probability of obtaining and retaining a job than someone less well qualified. They are also more likely to be active in the labour market than less-qualified people, except when they are young and still acquiring qualifications.
Demand is proxied in the present results by those in employment, although it is recognised that observed employment levels are the consequence of both demand and supply influences. The strong trends towards many more people being better qualified in recent years has seen the shares of those in employment holding higher level qualifications rise steadily while the share of those with no or few formal qualifications has fallen sharply.
Key messages
The holding of formal qualifications is a key way in which skills are defined and measured in Working Futures.
Skill supply, as measured by the number of people categorised by the highest formal qualification they hold, is rising rapidly as more young people in particular stay in education longer and acquire more higher level qualifications.
The proportion of the labour force who are unqualified is expected to represent only a small minority by 2027.
The demand for skills, as measured by the numbers employed in higher level occupations, and the numbers employed holding higher level qualifications, is also projected to rise.
The average level of qualifications held is rising in all occupations.
How much this is due to increases in demand as opposed to the supply side changes remains a point of contention, but there is some evidence of rising demand as well as supply.

107
Qualifications are defined here with reference to the Regulated Qualifications Framework (RQF). This framework defines formal qualifications by their level (i.e. level of difficulty) and size (how much time the average learner would take to complete the qualification). Level is the main dimension of interest in the present context. Figure 5.1 sets out the broad features. The framework has 8 main levels plus no formal qualifications. Further details are given in Bosworth (2015a, b and c111), as well as Bosworth and Leach (2015112).
In this section, a distinction is made between employed residents, technically referred to as “heads”, and employment in the workplace “jobs”. The prime focus is on numbers employed and the highest qualification held. A variety of different definitions of employment and related indicators are used in Working Futures (see section 2.6.2, Box 2.4). The starting point for the analysis of the supply of and demand for qualifications is the total number of people aged 16+ in possession of different qualifications (residence basis, heads). Not everyone is economically active, and of those that are economically active some are unemployed. Subtracting the latter from the total number economically active gives a measure of the number of employed residents (heads). A further complication is that some people have more than one job. Moreover, they may be employed in a workplace in a geographical area different from where they are resident. The latter is recognised in the use of an alternative measure of employment - workplace jobs - which is the main indicator used in Sections 2-4.
111 Bosworth, D. (2015a). UK Qualifications Projections – Time Series Model: Technical Report, 2013. Report for UK Commission for Employment and Skills: Wath on Dearne. Institute for Employment Research, University of Warwick: Coventry. Bosworth, D. (2015b). National Qualifications Projections – Apportionment Model: Technical Report. Report for UK Commission for Employment and Skills: Wath on Dearne. Institute for Employment Research, University of Warwick: Coventry. Bosworth, D., (2015c) Regional Qualifications Projections – Apportionment Model: Technical Report, Report for UK Commission for Employment and Skills: Wath on Dearne. Institute for Employment Research, University of Warwick: Coventry. 112 Bosworth, D., and Leach, A. (2015). UK Skill Levels and International Competitiveness. Report for UK Commission for Employment and Skills: Wath on Dearne. Warwick Institute for Employment Research, University of Warwick: Coventry.
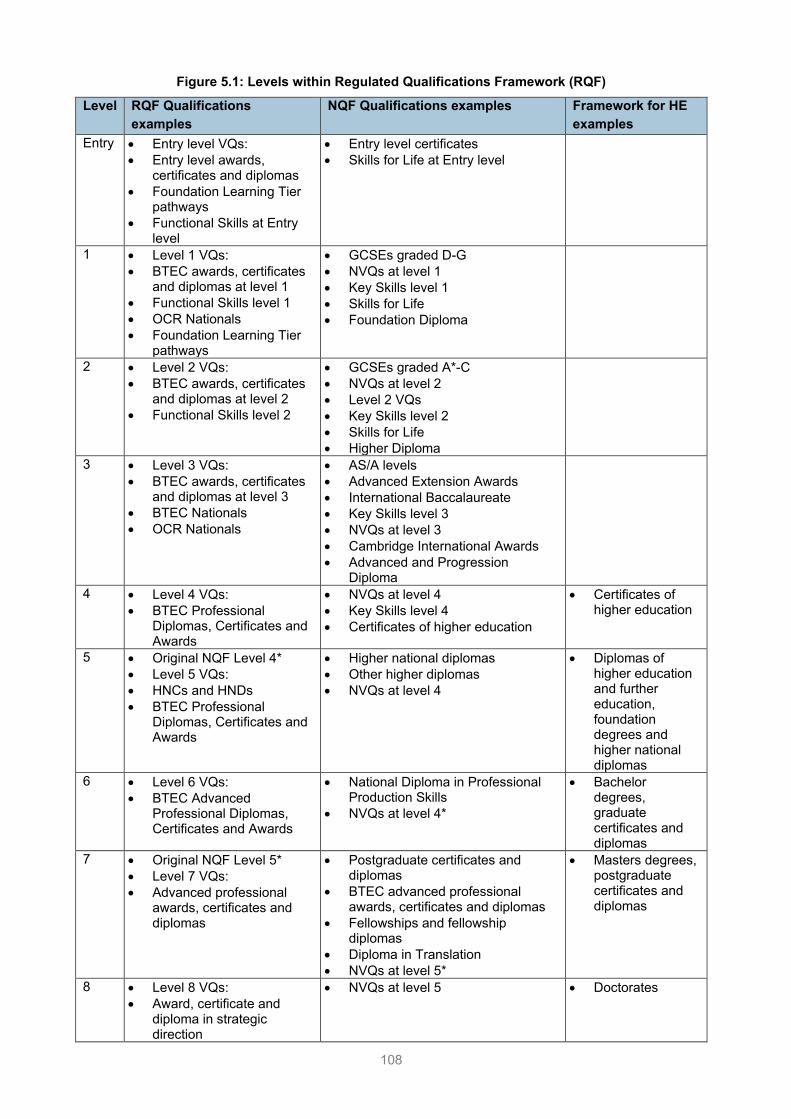
108
Figure 5.1: Levels within Regulated Qualifications Framework (RQF)
Level RQF Qualifications examples
NQF Qualifications examples Framework for HE examples
Entry • Entry level VQs: • Entry level awards,
certificates and diplomas • Foundation Learning Tier
pathways • Functional Skills at Entry
level
• Entry level certificates • Skills for Life at Entry level
1 • Level 1 VQs: • BTEC awards, certificates
and diplomas at level 1 • Functional Skills level 1 • OCR Nationals • Foundation Learning Tier
pathways
• GCSEs graded D-G • NVQs at level 1 • Key Skills level 1 • Skills for Life • Foundation Diploma
2 • Level 2 VQs: • BTEC awards, certificates
and diplomas at level 2 • Functional Skills level 2
• GCSEs graded A*-C • NVQs at level 2 • Level 2 VQs • Key Skills level 2 • Skills for Life • Higher Diploma
3 • Level 3 VQs: • BTEC awards, certificates
and diplomas at level 3 • BTEC Nationals • OCR Nationals
• AS/A levels • Advanced Extension Awards • International Baccalaureate • Key Skills level 3 • NVQs at level 3 • Cambridge International Awards • Advanced and Progression
Diploma
4 • Level 4 VQs: • BTEC Professional
Diplomas, Certificates and Awards
• NVQs at level 4 • Key Skills level 4 • Certificates of higher education
• Certificates of higher education
5 • Original NQF Level 4* • Level 5 VQs: • HNCs and HNDs • BTEC Professional
Diplomas, Certificates and Awards
• Higher national diplomas • Other higher diplomas • NVQs at level 4
• Diplomas of higher education and further education, foundation degrees and higher national diplomas
6 • Level 6 VQs: • BTEC Advanced
Professional Diplomas, Certificates and Awards
• National Diploma in Professional Production Skills
• NVQs at level 4*
• Bachelor degrees, graduate certificates and diplomas
7 • Original NQF Level 5* • Level 7 VQs: • Advanced professional
awards, certificates and diplomas
• Postgraduate certificates and diplomas
• BTEC advanced professional awards, certificates and diplomas
• Fellowships and fellowship diplomas
• Diploma in Translation • NVQs at level 5*
• Masters degrees, postgraduate certificates and diplomas
8 • Level 8 VQs: • Award, certificate and
diploma in strategic direction
• NVQs at level 5 • Doctorates
109
For each gender/RQF category, there are two accounting identities linking the following indicators:
• Total number economically active = Employment (residence/heads) plus (ILO) unemployment
• Economic activity rate = Total number economically active / Total number in the population
The database used for the supply model (LFS/GAD) focuses on resident employment (heads). The main Working Futures database (ABI/BRES /ONS) focuses on workplace employment (jobs).
5.1.1. Modelling the demand for and supply of qualifications
A UK level model developed and refined by Bosworth (2015a113), a Four Nations level model (Bosworth 2015b114) and a Regional level model for England (Bosworth, 2015c115), which are used to produce projections of the total number of people qualified at broad RQF level, as well as the numbers of those economically active. A further Activity Rate model has been added during the present round of work to link the activity rates more closely between the regional, four nations and the UK, as well as with the CE more aggregate measures of the active population.
This deals with the supply side. By making assumptions about unemployment patterns by qualification, this is then translated into implications for employment. These results have been extended to cover the individual countries and English regions within the UK using a spatial qualification model.116
The supply side results are compared with a demand side by analysing trends in employment patterns within occupations. Detailed patterns by occupation, cross classified by sector and region are considered. The projections are based on
113 Bosworth, D. (2015a). UK Qualifications Projections – Time Series Model: Technical Report, 2013. Report for UK Commission for Employment and Skills: Wath on Dearne. Institute for Employment Research, University of Warwick: Coventry. 114 Bosworth, D. (2015b). National Qualifications Projections – Apportionment Model: Technical Report. Report for UK Commission for Employment and Skills: Wath on Dearne. Institute for Employment Research, University of Warwick: Coventry. 115 Bosworth, D., (2015c) Regional Qualifications Projections – Apportionment Model: Technical Report, Report for UK Commission for Employment and Skills: Wath on Dearne. Institute for Employment Research, University of Warwick: Coventry. 116 The general approach adopted in analysing and modelling this aspect of the labour market is eclectic, involving a range of different data sets and models. Together the various inter-related models and modules cover various aspects of the supply of and demand for formal qualifications, at national and more detailed spatial levels. It builds upon earlier work, including the time series models developed over a number of years, leading to Bosworth (2015a, b and c). Adding in a qualifications dimension to the analysis of employment trends raises a number of technical and conceptual issues (which are discussed in more detail in separate technical reports (e.g: Bosworth and Wilson, 2011). These problems are addressed in a variety of ways, depending upon the availability of data and the prime objectives of each particular element.
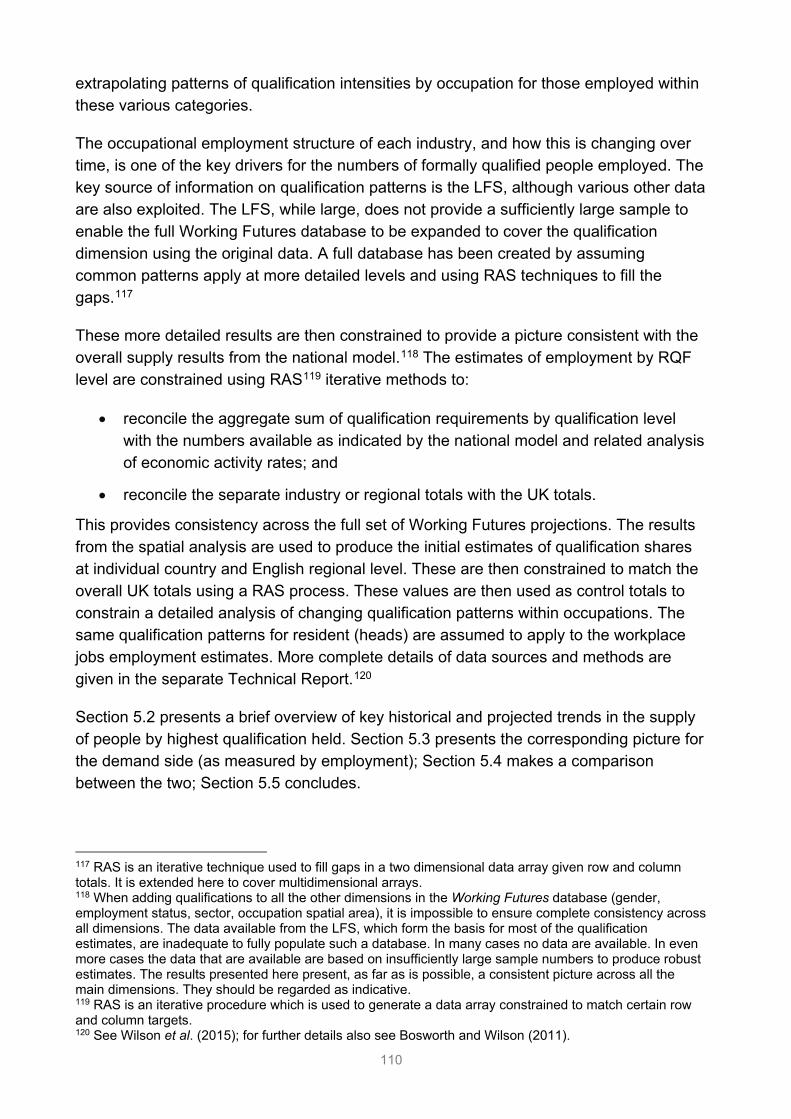
110
extrapolating patterns of qualification intensities by occupation for those employed within these various categories.
The occupational employment structure of each industry, and how this is changing over time, is one of the key drivers for the numbers of formally qualified people employed. The key source of information on qualification patterns is the LFS, although various other data are also exploited. The LFS, while large, does not provide a sufficiently large sample to enable the full Working Futures database to be expanded to cover the qualification dimension using the original data. A full database has been created by assuming common patterns apply at more detailed levels and using RAS techniques to fill the gaps.117
These more detailed results are then constrained to provide a picture consistent with the overall supply results from the national model.118 The estimates of employment by RQF level are constrained using RAS119 iterative methods to:
• reconcile the aggregate sum of qualification requirements by qualification level with the numbers available as indicated by the national model and related analysis of economic activity rates; and
Section 5.2 presents a brief overview of key historical and projected trends in the supply of people by highest qualification held. Section 5.3 presents the corresponding picture for the demand side (as measured by employment); Section 5.4 makes a comparison between the two; Section 5.5 concludes.
117 RAS is an iterative technique used to fill gaps in a two dimensional data array given row and column totals. It is extended here to cover multidimensional arrays. 118 When adding qualifications to all the other dimensions in the Working Futures database (gender, employment status, sector, occupation spatial area), it is impossible to ensure complete consistency across all dimensions. The data available from the LFS, which form the basis for most of the qualification estimates, are inadequate to fully populate such a database. In many cases no data are available. In even more cases the data that are available are based on insufficiently large sample numbers to produce robust estimates. The results presented here present, as far as is possible, a consistent picture across all the main dimensions. They should be regarded as indicative. 119 RAS is an iterative procedure which is used to generate a data array constrained to match certain row and column targets. 120 See Wilson et al. (2015); for further details also see Bosworth and Wilson (2011).
• reconcile the separate industry or regional totals with the UK totals.
This provides consistency across the full set of Working Futures projections. The results from the spatial analysis are used to produce the initial estimates of qualification shares at individual country and English regional level. These are then constrained to match the overall UK totals using a RAS process. These values are then used as control totals to constrain a detailed analysis of changing qualification patterns within occupations. The same qualification patterns for resident (heads) are assumed to apply to the workplace jobs employment estimates. More complete details of data sources and methods are given in the separate Technical Report.120

111
5.2. Supply trends The numbers of people obtaining formal qualifications, especially at the highest level, have risen steadily over the past half century. The share of people in the population of working age and the economically active labour force who possess formal qualifications has risen commensurately. The numbers and the shares of those with no or low qualifications have shrunk. Information from the LFS can be used to see how qualification profiles have been changing over time. Figure 5.2 shows estimates of the proportions of those in the economically active workforce holding different levels of qualification (by highest qualification held).
Very similar trends can be observed for the total population (active and inactive), for those in employment (Figure 5.3), and for both males and females.
There are of course significant differences in the levels and trends by age. In particular, younger people tend to be much more likely to possess or acquire qualifications than older people. However, the main focus here is on totals for both genders and across all ages. Both Table 5.2 and 5.3 present data on a residence/heads basis, and focus on results for the whole of the UK, for those aged 16+.121
Figure 5.2: Changing patterns of qualification within the labour force (16+, % of total)
Source: IER estimates based on LFS data, constrained to match Working Futures estimates.
data\StockflowData\UK Model Linked to CE Data.xlsx “FiguresWF7”
121 The LFS only collects information on qualifications for those in employment for those aged over 69 (and only then in recent years). Most of the analysis therefore focuses on this aged between 16 and 64.
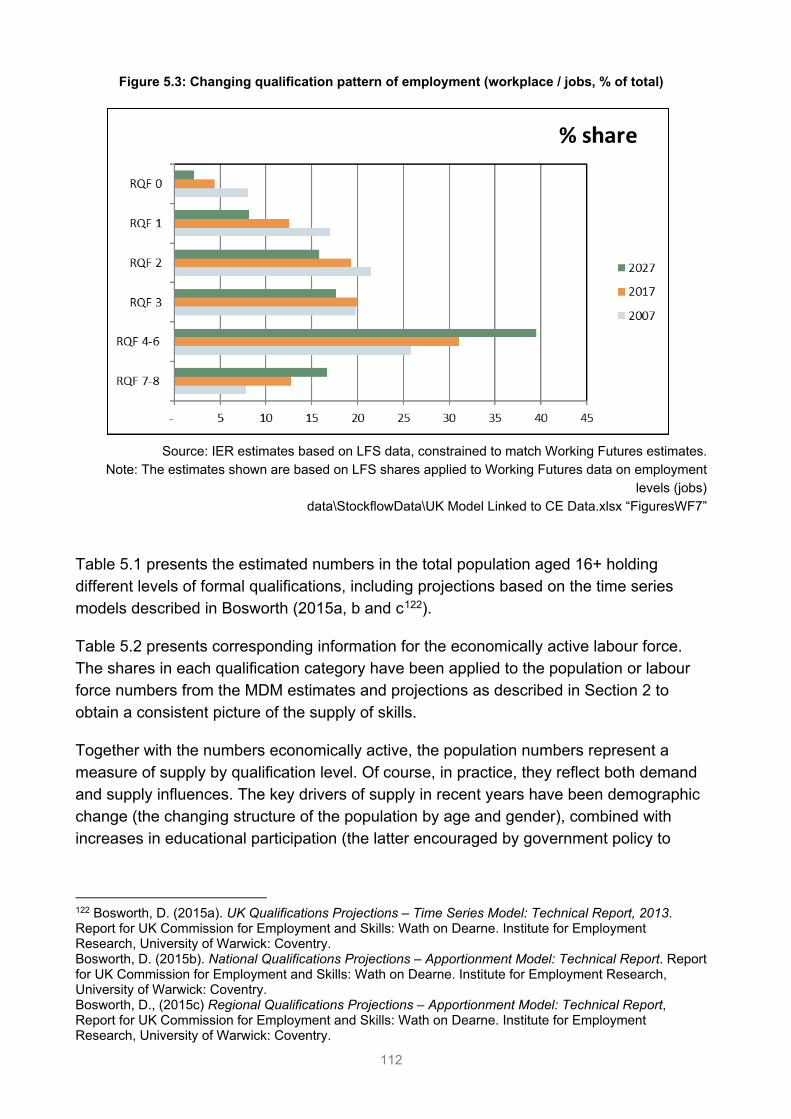
112
Figure 5.3: Changing qualification pattern of employment (workplace / jobs, % of total)
Source: IER estimates based on LFS data, constrained to match Working Futures estimates.
Note: The estimates shown are based on LFS shares applied to Working Futures data on employment levels (jobs)
data\StockflowData\UK Model Linked to CE Data.xlsx “FiguresWF7”
Table 5.1 presents the estimated numbers in the total population aged 16+ holding different levels of formal qualifications, including projections based on the time series models described in Bosworth (2015a, b and c122).
Table 5.2 presents corresponding information for the economically active labour force. The shares in each qualification category have been applied to the population or labour force numbers from the MDM estimates and projections as described in Section 2 to obtain a consistent picture of the supply of skills.
Together with the numbers economically active, the population numbers represent a measure of supply by qualification level. Of course, in practice, they reflect both demand and supply influences. The key drivers of supply in recent years have been demographic change (the changing structure of the population by age and gender), combined with increases in educational participation (the latter encouraged by government policy to
122 Bosworth, D. (2015a). UK Qualifications Projections – Time Series Model: Technical Report, 2013. Report for UK Commission for Employment and Skills: Wath on Dearne. Institute for Employment Research, University of Warwick: Coventry. Bosworth, D. (2015b). National Qualifications Projections – Apportionment Model: Technical Report. Report for UK Commission for Employment and Skills: Wath on Dearne. Institute for Employment Research, University of Warwick: Coventry. Bosworth, D., (2015c) Regional Qualifications Projections – Apportionment Model: Technical Report, Report for UK Commission for Employment and Skills: Wath on Dearne. Institute for Employment Research, University of Warwick: Coventry.
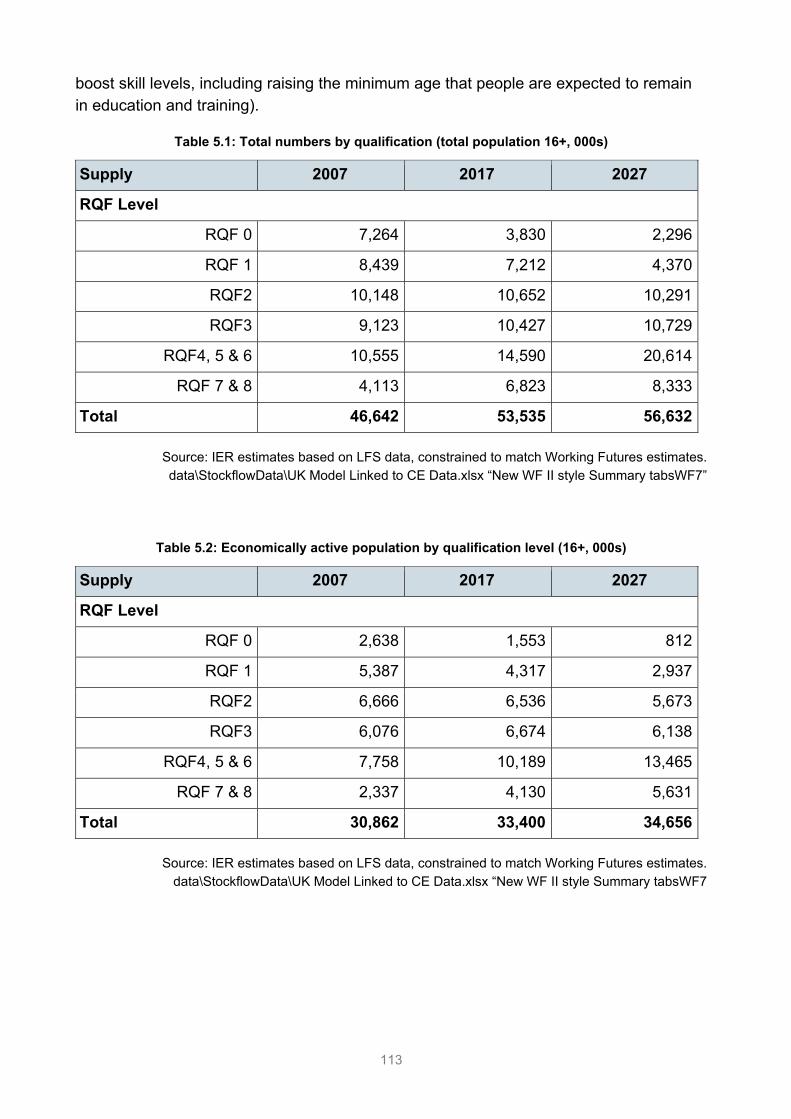
113
boost skill levels, including raising the minimum age that people are expected to remain in education and training).
Table 5.1: Total numbers by qualification (total population 16+, 000s)
Supply 2007 2017 2027
RQF Level
RQF 0 7,264 3,830 2,296
RQF 1 8,439 7,212 4,370
RQF2 10,148 10,652 10,291
RQF3 9,123 10,427 10,729
RQF4, 5 & 6 10,555 14,590 20,614
RQF 7 & 8 4,113 6,823 8,333
Total 46,642 53,535 56,632
Source: IER estimates based on LFS data, constrained to match Working Futures estimates. data\StockflowData\UK Model Linked to CE Data.xlsx “New WF II style Summary tabsWF7”
Table 5.2: Economically active population by qualification level (16+, 000s)
Supply 2007 2017 2027
RQF Level
RQF 0 2,638 1,553 812
RQF 1 5,387 4,317 2,937
RQF2 6,666 6,536 5,673
RQF3 6,076 6,674 6,138
RQF4, 5 & 6 7,758 10,189 13,465
RQF 7 & 8 2,337 4,130 5,631
Total 30,862 33,400 34,656
Source: IER estimates based on LFS data, constrained to match Working Futures estimates. data\StockflowData\UK Model Linked to CE Data.xlsx “New WF II style Summary tabsWF7
114
Table 5.3: Unemployed by qualification level (16+, 000s)
Supply 2007 2017 2027
RQF Level
RQF 0 286 160 91
RQF 1 403 455 243
RQF2 396 524 476
RQF3 266 383 364
RQF4, 5 & 6 190 352 533
RQF 7 & 8 51 65 180
Total 1,593 1,939 1,887
Source: IER estimates based on LFS data, constrained to match Working Futures estimates. data\StockflowData\UK Model Linked to CE Data.xlsx “New WF II style Summary tabsWF7”
In the past decade, there have been very large increases in both numbers and shares of the population and the economically active labour force qualified at higher levels (RQF 4+), and reductions in the numbers and shares qualified to RQF level 1 or below. Over the last decade the number and proportions qualified to RQF levels 2 and 3 have risen slightly. These patterns represent a continuation of previous longer-term trends.
This has resulted in a large increase in the numbers emerging on to the labour market with formal qualifications at higher levels. The proportion of young people with formal qualifications is much higher than for older people.
Some feared that the recession, as well as the increasing direct costs123 associated with participation in higher levels of education, would impact negatively on decisions of many young people to invest in higher and further education, (although others have argued that the poor state of the labour market would encourage young people to stay on in higher and further education).
In order to draw out the implications for projected total employment, assumptions are made about the distribution of unemployment by level of qualification. All else equal, the better qualified tend to have lower unemployment rates but their shares of total unemployment have been rising as their share of the labour force increases. All groups saw unemployment rates rise as the recession struck but then fell as the labour market improved. The hierarchy of unemployment rates has been maintained and this is assumed to continue as shown in Tables 5.3 – 5.5 that illustrate the implications in terms of levels, rates and shares of total unemployment respectively. Unemployment rates
123 It should be noted that different tuition fee systems for higher education apply across the UK nations.
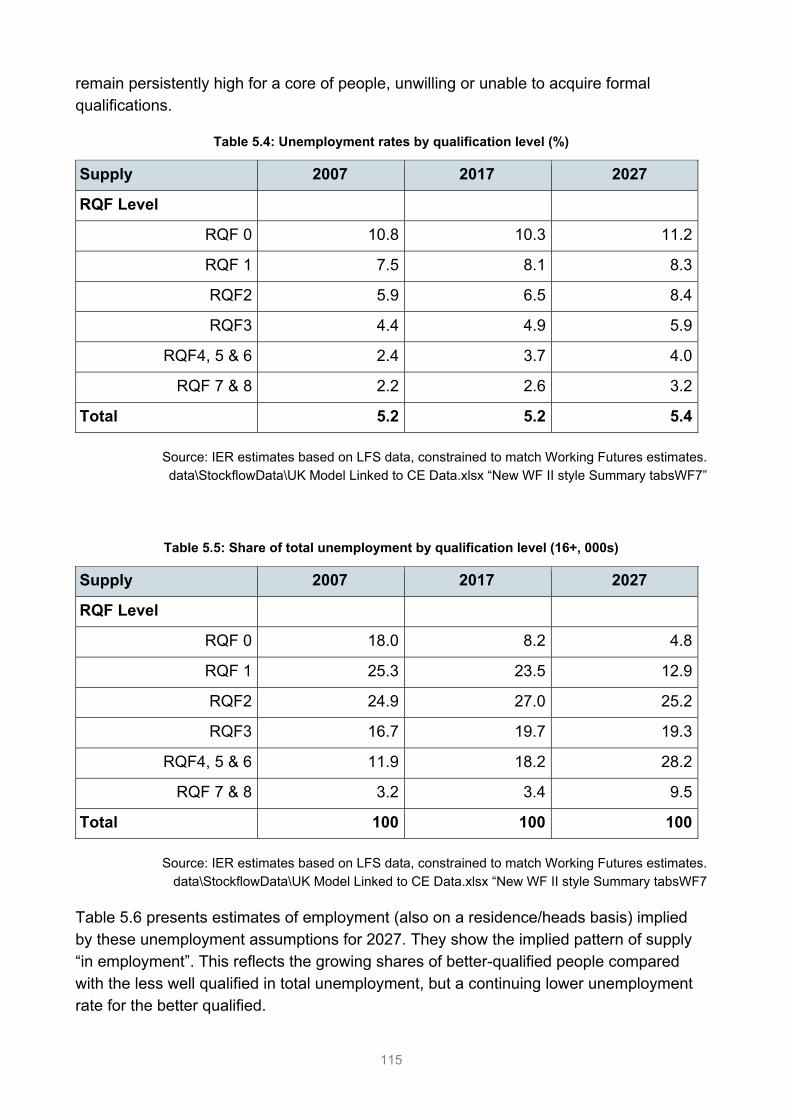
115
remain persistently high for a core of people, unwilling or unable to acquire formal qualifications.
Table 5.4: Unemployment rates by qualification level (%)
Supply 2007 2017 2027
RQF Level
RQF 0 10.8 10.3 11.2
RQF 1 7.5 8.1 8.3
RQF2 5.9 6.5 8.4
RQF3 4.4 4.9 5.9
RQF4, 5 & 6 2.4 3.7 4.0
RQF 7 & 8 2.2 2.6 3.2
Total 5.2 5.2 5.4
Source: IER estimates based on LFS data, constrained to match Working Futures estimates. data\StockflowData\UK Model Linked to CE Data.xlsx “New WF II style Summary tabsWF7”
Table 5.5: Share of total unemployment by qualification level (16+, 000s)
Supply 2007 2017 2027
RQF Level
RQF 0 18.0 8.2 4.8
RQF 1 25.3 23.5 12.9
RQF2 24.9 27.0 25.2
RQF3 16.7 19.7 19.3
RQF4, 5 & 6 11.9 18.2 28.2
RQF 7 & 8 3.2 3.4 9.5
Total 100 100 100
Source: IER estimates based on LFS data, constrained to match Working Futures estimates. data\StockflowData\UK Model Linked to CE Data.xlsx “New WF II style Summary tabsWF7
Table 5.6 presents estimates of employment (also on a residence/heads basis) implied by these unemployment assumptions for 2027. They show the implied pattern of supply “in employment”. This reflects the growing shares of better-qualified people compared with the less well qualified in total unemployment, but a continuing lower unemployment rate for the better qualified.
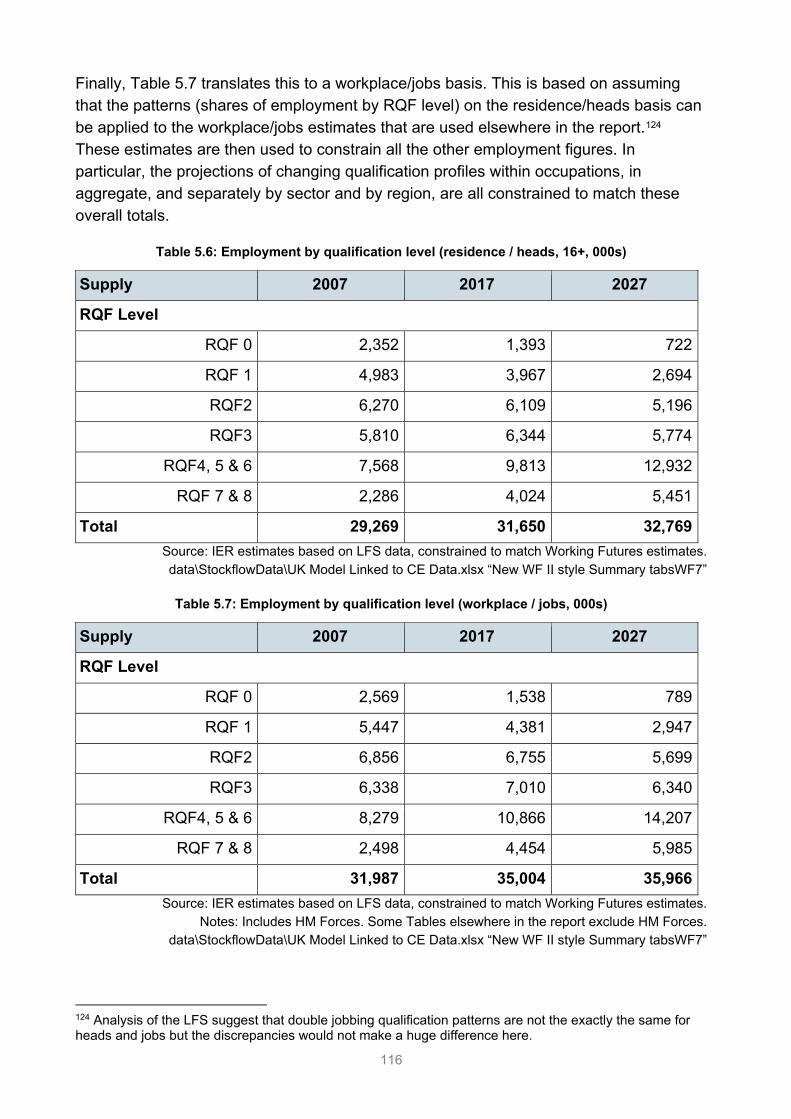
116
Finally, Table 5.7 translates this to a workplace/jobs basis. This is based on assuming that the patterns (shares of employment by RQF level) on the residence/heads basis can be applied to the workplace/jobs estimates that are used elsewhere in the report.124 These estimates are then used to constrain all the other employment figures. In particular, the projections of changing qualification profiles within occupations, in aggregate, and separately by sector and by region, are all constrained to match these overall totals.
Table 5.6: Employment by qualification level (residence / heads, 16+, 000s)
Supply 2007 2017 2027
RQF Level
RQF 0 2,352 1,393 722
RQF 1 4,983 3,967 2,694
RQF2 6,270 6,109 5,196
RQF3 5,810 6,344 5,774
RQF4, 5 & 6 7,568 9,813 12,932
RQF 7 & 8 2,286 4,024 5,451
Total 29,269 31,650 32,769 Source: IER estimates based on LFS data, constrained to match Working Futures estimates. data\StockflowData\UK Model Linked to CE Data.xlsx “New WF II style Summary tabsWF7”
Table 5.7: Employment by qualification level (workplace / jobs, 000s)
Supply 2007 2017 2027
RQF Level
RQF 0 2,569 1,538 789
RQF 1 5,447 4,381 2,947
RQF2 6,856 6,755 5,699
RQF3 6,338 7,010 6,340
RQF4, 5 & 6 8,279 10,866 14,207
RQF 7 & 8 2,498 4,454 5,985
Total 31,987 35,004 35,966 Source: IER estimates based on LFS data, constrained to match Working Futures estimates.
Notes: Includes HM Forces. Some Tables elsewhere in the report exclude HM Forces. data\StockflowData\UK Model Linked to CE Data.xlsx “New WF II style Summary tabsWF7”
124 Analysis of the LFS suggest that double jobbing qualification patterns are not the exactly the same for heads and jobs but the discrepancies would not make a huge difference here.

117
5.3. Demand for formal qualifications The numbers in employment by level of qualification can be regarded as an indicator of demand. Strictly speaking, employment levels are the result of a combination of both supply and demand factors; employment would only represent demand if there were excess supply. Separating demand and supply influences is not straightforward. Recent trends have seen a sharp rise in the formal qualifications held by those in employment. However, it is clear from the earlier discussion that, in part at least, this simply reflects the large increases on the supply side. Figure 5.4 provides an overview of the changing qualification profile of the workforce to 2027. By 2027, around 55.2% of people in employment are expected to be qualified at level 4125 and above, whilst the proportion of people with level 1 or no formal qualifications at all is expected to fall to 10.6%.
Figures 5.5 and 5.6 show that qualification patterns vary considerably across occupations. Generally speaking, occupations such as professionals and associate professionals, (and to a lesser extent managers), tend to be much better qualified than less skilled occupations, but average qualification levels are rising for most occupations. How much the latter is due to increasing demand requirements as opposed to “qualifications inflation” (as supply has risen) remains a bone of contention.126
The shift in occupational structure in favour of the occupational major groups 1-3 (as discussed in Section 4) have been a key factor in increasing the numbers of graduates in employment. However, qualification profiles (the shares of employment qualified at different levels) have changed in almost all occupations in favour of higher-level qualifications (RQF4+). They also exhibit sharp reductions in the employment shares of those less well qualified (RQF1 and below).
Some occupations have much higher proportions of well-qualified employees (RQF4+) than others do. For many of these occupations these proportions are close to 100%, so the scope for further growth is limited to the overall growth in employment levels in the occupation concerned. For others, where the shares are well below 100%, the scope for increasing shares is greater. Some occupations have quite a high concentration of employees with no or low (RQF1) qualifications.
Qualifications profiles also vary significantly across sectors (see Figure 5.6). Largely, this reflects their occupational structure. Sectors such as health, education and public administration employ large numbers of people in higher-level occupations and, as a consequence, large numbers of people qualified at RQF level 4+. In contrast, some other sectors, such as other parts of the service sector, employ large numbers in occupations that tend to be less well qualified.
125 For more information on RQF4 and other qualification levels, see https://www.gov.uk/what-different-qualification-levels-mean/list-of-qualification-levels. 126 See for example the debate between Brown and Hasketh (2004) and Purcell et al. (2005). Results by Elias and Purcell, (2011) suggest that rates of return to investment in Higher Education were still rising for some but declining for those in the bottom decile.
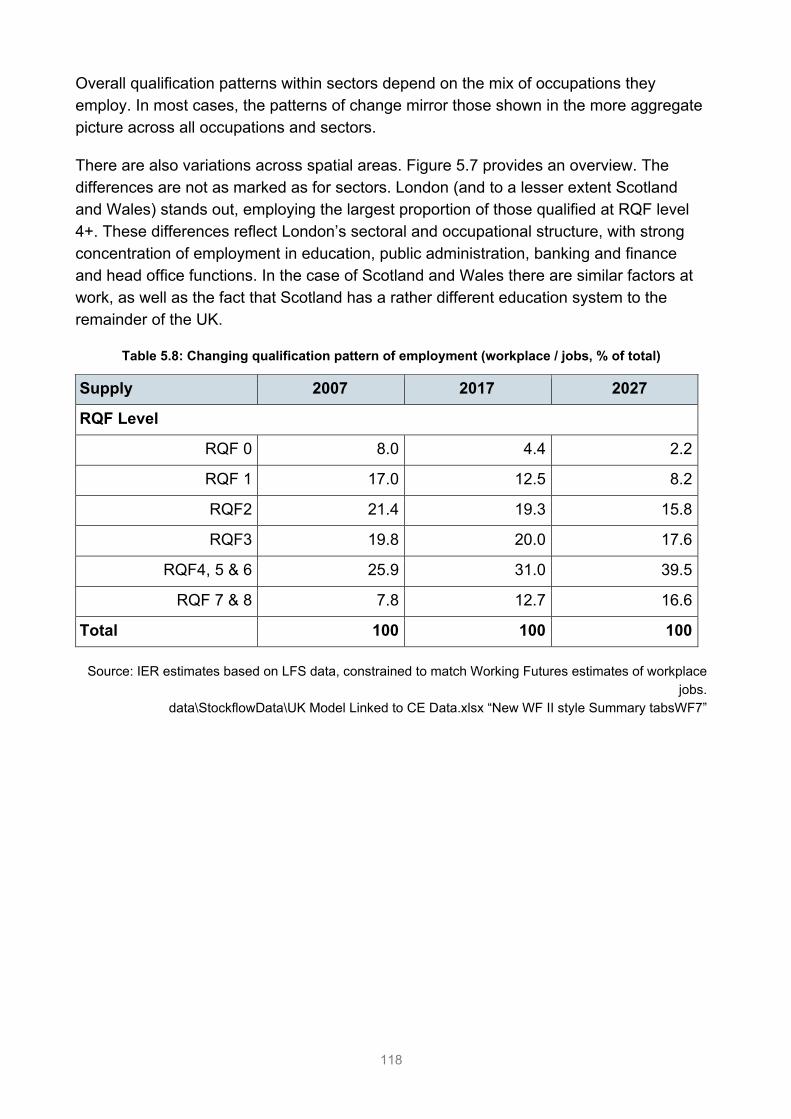
118
Overall qualification patterns within sectors depend on the mix of occupations they employ. In most cases, the patterns of change mirror those shown in the more aggregate picture across all occupations and sectors.
There are also variations across spatial areas. Figure 5.7 provides an overview. The differences are not as marked as for sectors. London (and to a lesser extent Scotland and Wales) stands out, employing the largest proportion of those qualified at RQF level 4+. These differences reflect London’s sectoral and occupational structure, with strong concentration of employment in education, public administration, banking and finance and head office functions. In the case of Scotland and Wales there are similar factors at work, as well as the fact that Scotland has a rather different education system to the remainder of the UK.
Table 5.8: Changing qualification pattern of employment (workplace / jobs, % of total)
Supply 2007 2017 2027
RQF Level
RQF 0 8.0 4.4 2.2
RQF 1 17.0 12.5 8.2
RQF2 21.4 19.3 15.8
RQF3 19.8 20.0 17.6
RQF4, 5 & 6 25.9 31.0 39.5
RQF 7 & 8 7.8 12.7 16.6
Total 100 100 100
Source: IER estimates based on LFS data, constrained to match Working Futures estimates of workplace jobs.
data\StockflowData\UK Model Linked to CE Data.xlsx “New WF II style Summary tabsWF7”
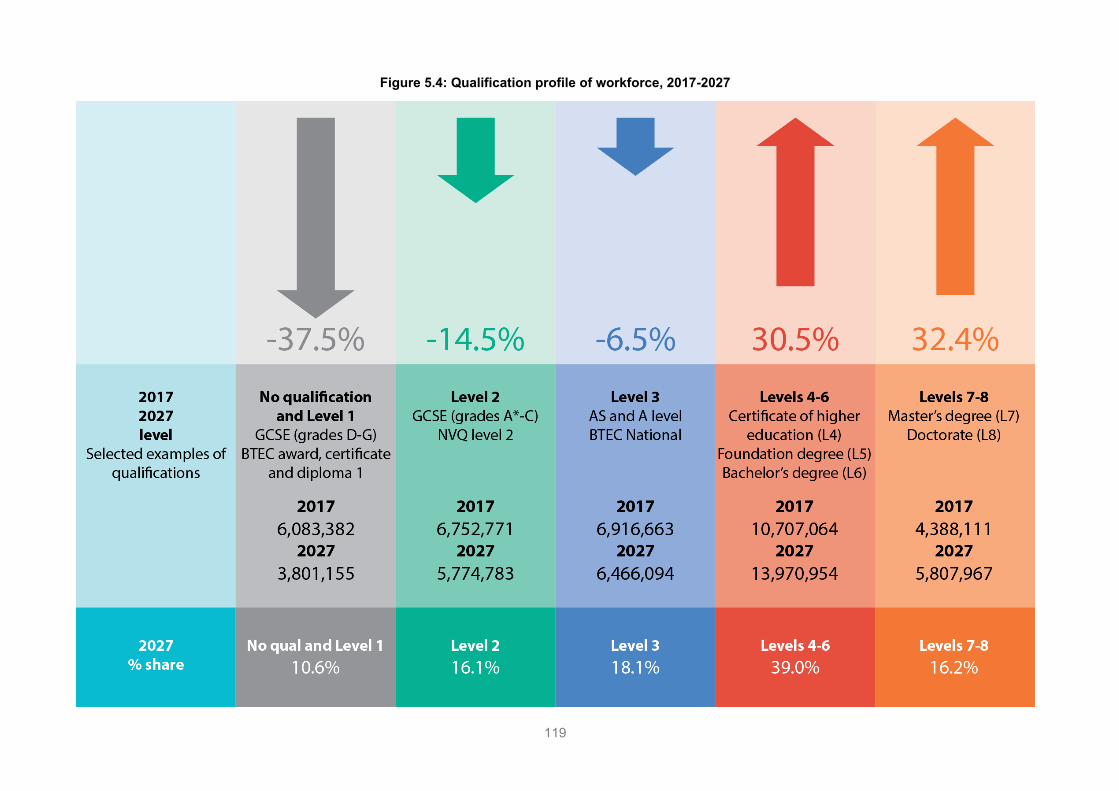
119
Figure 5.4: Qualification profile of workforce, 2017-2027
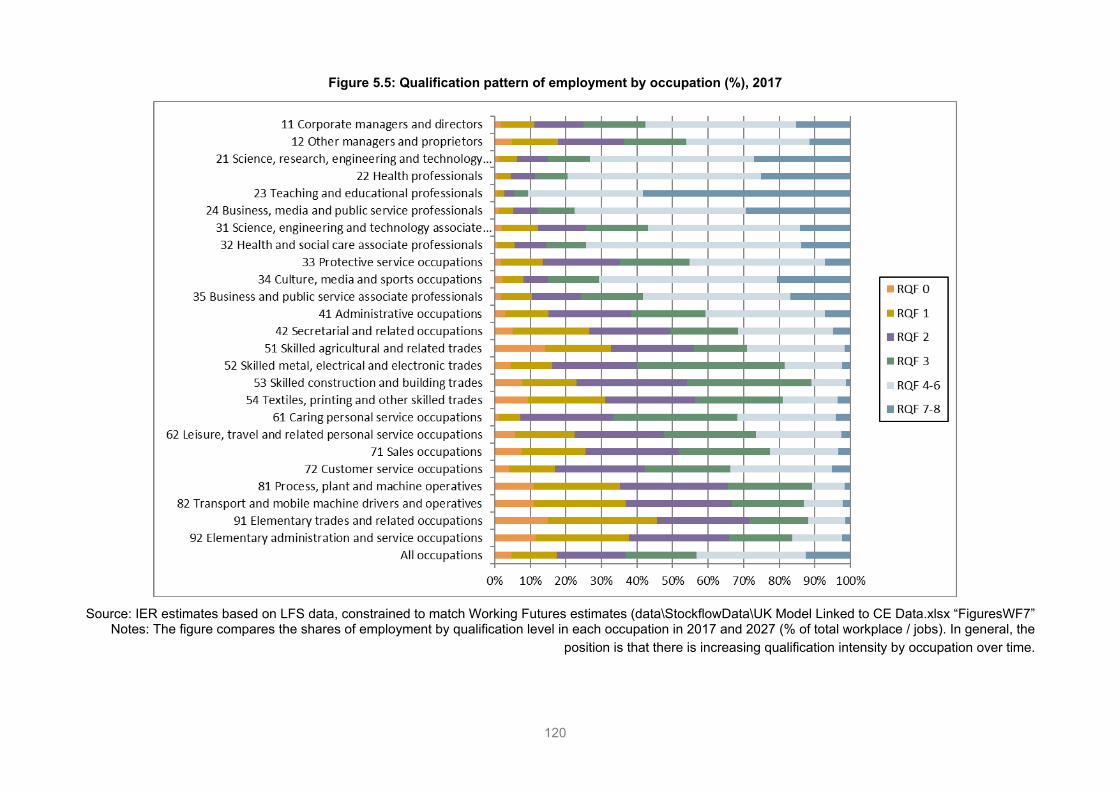
120
Figure 5.5: Qualification pattern of employment by occupation (%), 2017
Source: IER estimates based on LFS data, constrained to match Working Futures estimates (data\StockflowData\UK Model Linked to CE Data.xlsx “FiguresWF7” Notes: The figure compares the shares of employment by qualification level in each occupation in 2017 and 2027 (% of total workplace / jobs). In general, the
position is that there is increasing qualification intensity by occupation over time.
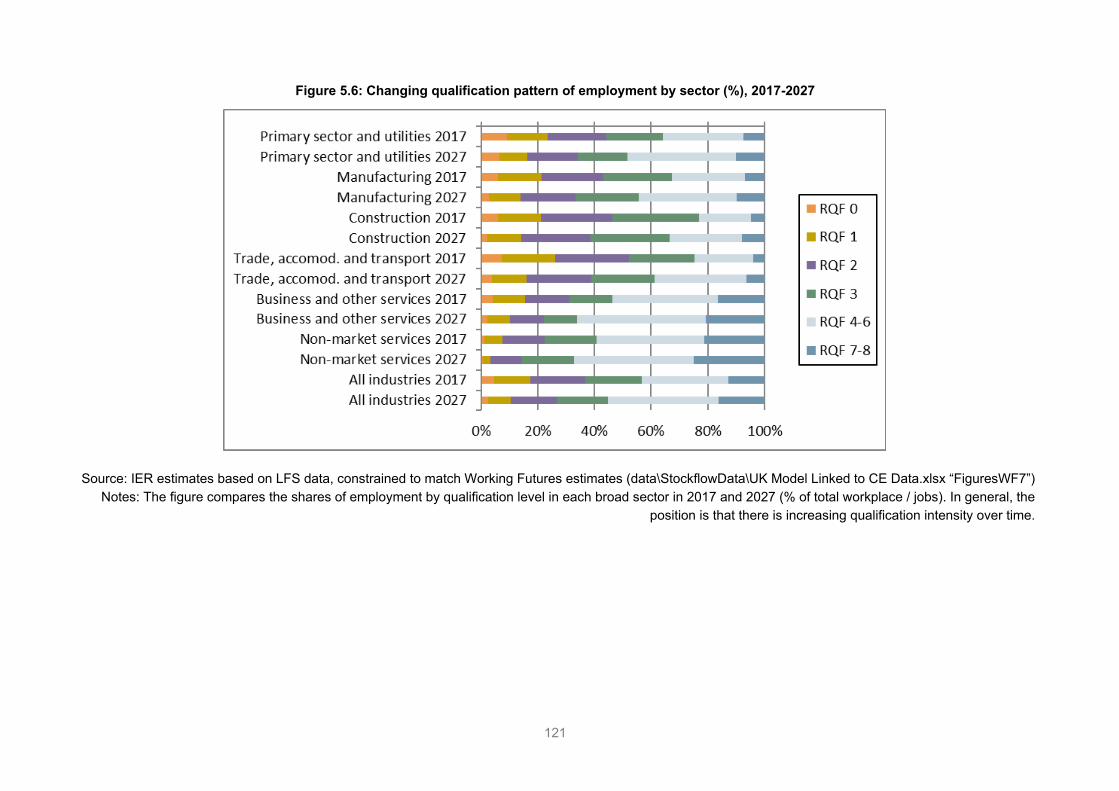
121
Figure 5.6: Changing qualification pattern of employment by sector (%), 2017-2027
Source: IER estimates based on LFS data, constrained to match Working Futures estimates (data\StockflowData\UK Model Linked to CE Data.xlsx “FiguresWF7”) Notes: The figure compares the shares of employment by qualification level in each broad sector in 2017 and 2027 (% of total workplace / jobs). In general, the
position is that there is increasing qualification intensity over time.
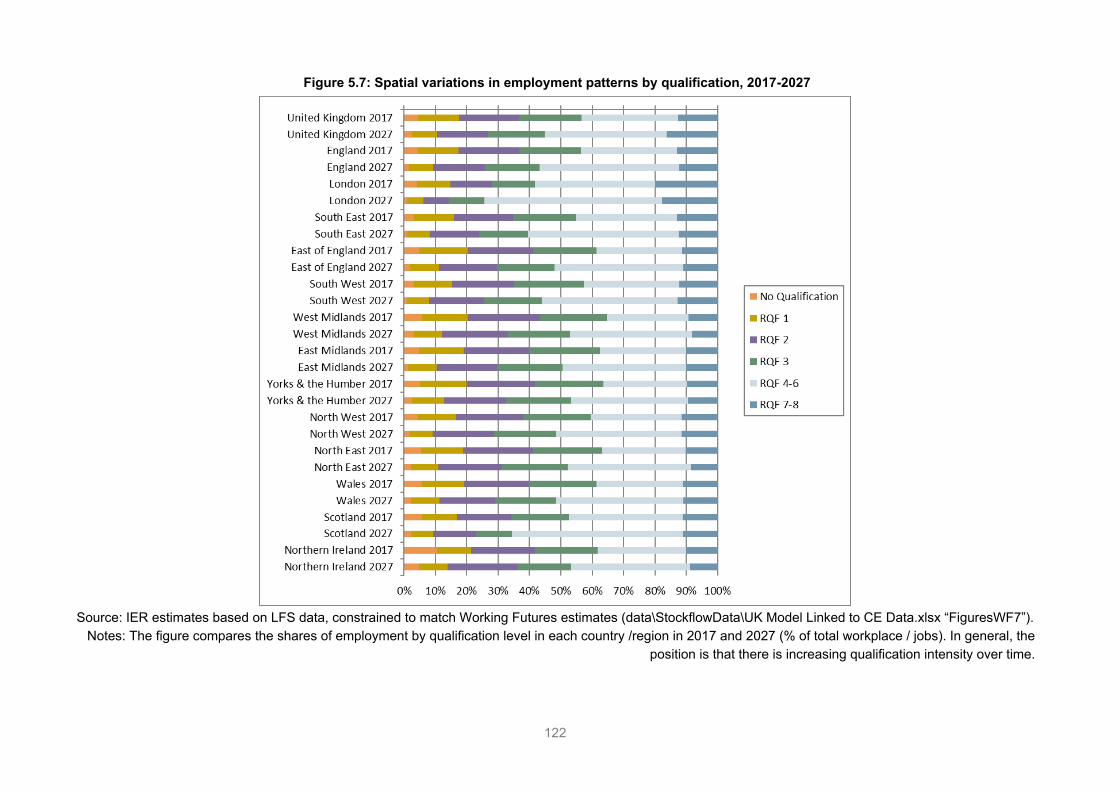
122
Figure 5.7: Spatial variations in employment patterns by qualification, 2017-2027
Source: IER estimates based on LFS data, constrained to match Working Futures estimates (data\StockflowData\UK Model Linked to CE Data.xlsx “FiguresWF7”).
Notes: The figure compares the shares of employment by qualification level in each country /region in 2017 and 2027 (% of total workplace / jobs). In general, the position is that there is increasing qualification intensity over time.
123
5.4. Reconciliation, imbalances and mismatches The projections of the supply of people by highest qualification held (population numbers and those economically active) and the projections of the patterns of employment by qualification level within industries and occupations are carried out independently. There is no guarantee these will match.
In order to ensure consistency, a reconciliation is imposed by making certain assumptions about unemployment rates by highest qualifications held, and then reallocating people to jobs until all those available are employed. This involves raising the qualifications intensity of all jobs if initial supply exceeds demand and reducing it if the converse is true. An iterative process is used to achieve this, maintaining the original patterns of employment by industry, occupation, gender, employment status and region. The assumptions regarding unemployment are set out in Tables 5.3 –5.4 above.
Figure 5.8 illustrates the impact of this adjustment process for 2027. For each sub major occupational group, and for the total of all occupations, two bars are shown. The top bar shows the pattern of qualifications based on extrapolating past trends in historical patterns of employment. The second bar shows how this has to be altered to reflect the numbers projected to be available in the labour market (i.e. those economically active in employment).
For most occupations, the qualification intensity (especially those holding qualifications at RQF 4+) has to be raised to bring demand into balance with supply. Those occupations in which the workforce is already highly qualified (such as professionals) have less room for further increases. Inevitably, this rise in qualifications intensity has been happening more in those occupations that have not previously employed higher-level qualifications, since this is where there is more scope for increase. This is not necessarily indicative of excess supply of such qualifications. The nature of jobs may be changing to make higher qualifications more necessary.101
101 Education and health professions are good examples of where the entry requirements have seen a steady rise as the technical demands of jobs for teachers and nurses have risen.
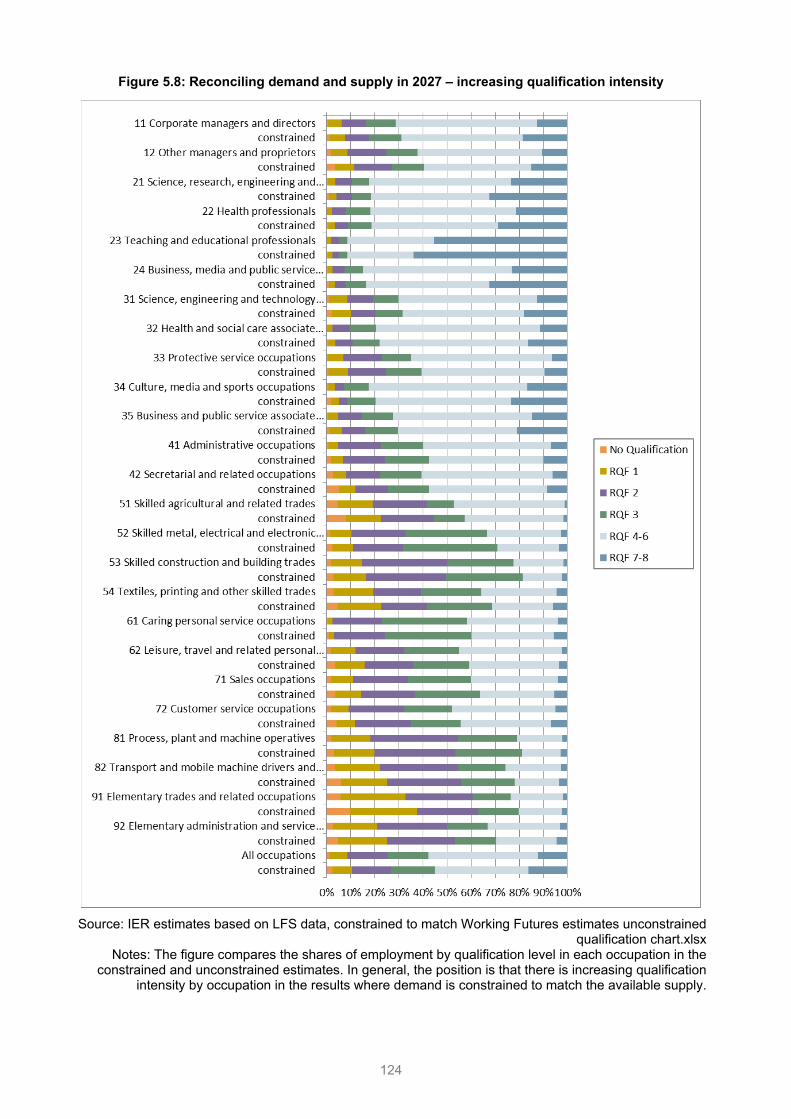
124
Figure 5.8: Reconciling demand and supply in 2027 – increasing qualification intensity
Source: IER estimates based on LFS data, constrained to match Working Futures estimates unconstrained qualification chart.xlsx
Notes: The figure compares the shares of employment by qualification level in each occupation in the constrained and unconstrained estimates. In general, the position is that there is increasing qualification
intensity by occupation in the results where demand is constrained to match the available supply.
125
5.5. Concluding remarks The supply of skills is set to continue to grow as more people acquire higher-level qualifications. The overall qualification profile of the workforce will improve significantly over the next decade. The proportion and numbers of people qualified at the highest levels (RQF4+) will rise substantially. In contrast, the proportion and number of those in the workforce with qualifications at RQF level 1 or below will fall.
Qualification levels amongst the employed workforce are also projected to rise significantly, in line with these trends. This reflects changing patterns of requirements in many jobs.
The relative significance of demand and supply influences is not easy to assess. The latest evidence suggests that rates of return to higher qualifications have shown some signs of decline, although they still indicate significant positive benefits from investing in courses of study at higher education and further education levels.
Patterns of unemployment rates by RQF level are assumed to maintain the same hierarchy (i.e. the less well-qualified are significantly more likely to be unemployed) although the better qualified will take an increasing share of total unemployment (commensurate with their increasing share of the labour force).
Qualification profiles vary significantly across both sectors and spatial areas. These differences are primarily driven by variations in their employment patterns by occupation (and also by sector in the case of spatial areas).
Nearly all sectors and spatial areas are projected to see significant improvements in average qualification levels, with increased proportions and numbers employed at RQF level 4+ and reductions at RQF levels 0 and 1.
126
Glossary BRIC – Brazil, Russia, India and China
CE – Cambridge Econometrics
ICT – Information and Communication technologies
IER – Institute for Employment Research, University of Warwick
ILO – International Labour Organization
Expansion demand – increase (or decrease) in employment levels between two years
LMI for All – A Department for Education project which makes labour market information (LMI) data freely available for careers guidance and advice
Labour Force – employed residents plus ILO unemployment
MDM – CE’s detailed multi-sectoral dynamic macroeconomic model (MDM-E3).
MDM C182 (revision 13406) – CE projections conducted in November 2018
NQF – National Qualification Framework
Qualifications – standardised awards to accredit learning and skills acquired during education and training
RQF – Regulated Qualifications Framework
Replacement demand – job openings created by those leaving the labour force.
Sector – 6 broad industries used: Primary sector & utilities; Manufacturing; Construction; Trade, accomm. & transport; Business & other services; Public administration, health and education (also referred to as Non-marketed services).
Shift-share – an analysis of changes in occupation into three main components: a scale effect, an industrial mix effect and an occupational effect
SIC – Standard Industry Classification
SOC – Standard Industry Classification
Terminology for quarters, etc. – 2012Q1 = first quarter of 2012, etc.
Unemployment, ILO – people who are out of work, want a job, have actively sought work in the previous four weeks and are available to start work within the next fortnight
Unemployed, Claimant – measures people claiming Job Seeker’s Allowance benefits

127
Workforce – the total number of workforce jobs is obtained by summing workplace employment (employee jobs and self-employment jobs), HM Forces, government-supported trainees and claimant unemployment.
Working Futures 2017-2027 – the latest in a long series of quantitative assessments of UK employment prospects over a ten-year horizon.
128
Bibliography Airports Commission (2015). Airports Commission: Final report. London: Airports Commission. Available from: https://assets.publishing.service.gov.uk/government/uploads/system/uploads/attachment_data/file/440316/airports-commission-final-report.pdf
ARUP (2013). The Smart City Market: Opportunities for the UK. Department for Business, Innovation and Skills: London.
Baldwin, R. E. (ed.)(2016). Brexit Beckons: Thinking ahead by leading economists. CEPR Press: London. Available from: https://repository.graduateinstitute.ch//record/294129/files/Brexit_Beckons_VoxEU_Baldwin_2016.pdf
Borchert (2016). Services trade in the UK - What is at stake? UK Trade Policy Observatory Briefing Paper, No. 6, November 2016. Available from: https://www.sussex.ac.uk/webteam/gateway/file.php?name=briefing-paper-6-final.pdf&site=18.
Bosworth, D. (2013a). The Changing Qualifications Mix of the UK to 2020, 2013. Report produced on behalf of UK Commission for Employment and Skills: Wath on Dearne.
Bosworth, D. (2013b). UK Qualifications Projections – Time Series Model: Technical Report, 2013. Report produced on behalf of UK Commission for Employment and Skills: Wath on Dearne.
Bosworth, D. (2013c). Regional Qualifications Projections – Apportionment Model: Technical Report, 2013, 2013. Report produced on behalf of UK Commission for Employment and Skills: Wath on Dearne.
Bosworth, D. (2015a). UK Qualifications Projections – Time Series Model: Technical Report, 2013. Report for UK Commission for Employment and Skills: Wath on Dearne. Institute for Employment Research, University of Warwick: Coventry.
Bosworth, D. (2015b). National Qualifications Projections – Apportionment Model: Technical Report. Report for UK Commission for Employment and Skills: Wath on Dearne. Institute for Employment Research, University of Warwick: Coventry.
Bosworth, D., (2015c) Regional Qualifications Projections – Apportionment Model: Technical Report, Report for UK Commission for Employment and Skills: Wath on Dearne. Institute for Employment Research, University of Warwick: Coventry.
Bosworth, D., and Leach, A. (2015). UK Skill Levels and International Competitiveness. Report for UK Commission for Employment and Skills: Wath on Dearne. Warwick Institute for Employment Research, University of Warwick: Coventry.
129
Bosworth, D., and Wilson, R. A. (2011). Working Futures Qualifications Technical Report. UKCES: Wath on Dearne.
British Council (2018). International student mobility to 2027: Local investment, global outcomes. Available from: https://ei.britishcouncil.org/educationintelligence/ei-feature-international-student-mobility-2027-local-investment-global-outcome
Brown, P., and Hesketh, A. (2004). The MisManagement of Talent: Employability and the Competition for Jobs in the Knowledge Economy. Oxford: Oxford University Press.
Cambridge Econometrics, Institute for Employment Research, IFF Research (2013). Working for a green Britain and Northern Ireland 2013-23: employment in the UK wind and marine energy industries. RenewablesUK: London.
City & Guilds Group and The Work Foundation (2018). Constructing the future: How the skills needed for success in the workplace are changing. London: City & Guilds. Available from: http://www.theworkfoundation.com/wp-content/uploads/2018/09/CG_Constructing-the-future_A4_32pp_LR_no-crops.pdf
ComputerWeekly.com (2018). Venture capital funding for UK tech startups. Available from: https://www.computerweekly.com/news/252455702/Venture-capital-funding-for-UK-tech-startups-drops-28-in-a-year, January 2019.
CPB (2016). Brexit Costs for the Netherlands Arise from Reduced Trade. CPB Policy Brief 2016/07. Available from: https://www.cpb.nl/sites/default/files/omnidownload/CPB-Policy-Brief-2016-07-Brexit-costs-for-the-netherlands-arise-from-reduced-trade.pdf.
Crossrail Ltd. (2015). Europe's largest construction project, November. Available from: http://www.crossrail.co.uk/construction/.
Davies, S. (2014). Venture capital funding of London tech start-ups doubles, Financial Times, December 30 2014.
Department for Transport, (2017). UK Aviation Forecasts, Department for Transport: London.
Department of Business, Innovation and Skills (2013). UK construction: An economic analysis of the sector. Department of Business, Innovation and Skills: London.
Department of Energy and Climate Change (2012). The government’s long- term plans to deliver secure, low carbon and affordable electricity. Department of Energy and Climate Change: London.
Dhingra, S., Ottaviano, G., Sampson, T., and Van Reenen, J. (2016). The consequences of Brexit for UK trade and living standards. Centre for Economic Performance Brexit Analysis, No. 2, Available from: http://cep.lse.ac.uk/pubs/download/brexit02.pdf.
130
Dickerson, A., and Wilson, R. A. (2017). How Should We Consider Future Skills Demand? Skills Demand Workshop 2017, Convened by the U.K. Department for Education, 18 July 2017, Church House Conference Centre, London. Available from: https://warwick.ac.uk/fac/soc/ier/research/forecasting/future_skills_demand.pdf
Ebell, M., and Warren, J. (2016). The Long-Term Economic Impact of Leaving the EU. National Institute Economic Review No. 236, May 2016. Available from: https://www.niesr.ac.uk/sites/default/files/publications/National%20Institute%20Economic%20Review-2016-Ebell-121-38.pdf.
Elias, P., and Purcell, K. (2011). Higher education, intergenerational mobility and earnings: the case of the UK. Institute for Employment Research, University of Warwick: Coventry.
European Commission (2015). Smart Cities, Available from: http://ec.europa.eu/digital-agenda/en/smart-cities.
Frenk, C., HUnt, T., Partridge, L., Thornton, J. and Wyatt, T. (2015). UK research and the European Union The role of the EU in funding UK research. The Royal Society: London. Available from: https://royalsociety.org/-/media/policy/projects/eu-uk-funding/uk-membership-of-eu.pdf
Global Futures (2017). Beyond the Highly Skilled: The Needs of Other Stakeholders from Economic Migration. Our Global Future: London. Available from: http://ourglobalfuture.com/wp-content/uploads/2017/07/Global-Future-THE_BREXIT_IMMIGRATION_MYTH.pdf.
Green, A., Homenidou, K., and Wilson, R. A. (2004). Working Futures: New Projections of Occupational Employment by Sector and Region, Volume 2, Regional Report. SSDA, DfES Publications: Nottingham.
Green, A., Homenidou, K., White, R., and Wilson, R. A. (2006). Working Futures 2004-2014: Spatial Report. Sector Skills Development Agency: Wath on Dearne.
HM Government (2013). Construction 2025. HM Government: London.
HM Government (2016). HM Treasury analysis: the long-term economic impact of EU membership and the alternatives. HM Treasury: London. Available from: https://www.gov.uk/government/uploads/system/uploads/attachment_data/file/517415/treasury_analysis_economic_impact_of_eu_membership_web.pdf.
International Monetary Fund (2011). World Economic Outlook, Slowing growth, rising risks, (September). Available from: https://www.imf.org/external/pubs/ft/weo/2011/02/pdf/text.pdf
131
International Monetary Fund (2016). ‘United Kingdom – Selected Issues’, IMF Country Report No. 16/169, June 2016. Available from: https://www.imf.org/external/pubs/ft/scr/2016/cr16169.pdf.
KPMG (2017). Brexit: The impacts on sectors. KPMG: London: Available from: https://assets.kpmg.com/content/dam/kpmg/uk/pdf/2017/03/brexit-the-sector-impact.pdf.
KPMG LLP (2017). Labour migration in the hospitality sector. A KPMG report for the British Hospitality Association. KPMG Available from: https://www.bha.org.uk/wordpress/wp-content/uploads/2017/05/BHA-EU-migration-final-report-170518-public-vSTC.pdf
Kriechel, B., Rašovec, T., and Wilson, R. A. (2016). ''Skills Forecasts." Part B of the ETF, ILO and Cedefop Guide on Skills Foresights, Scenarios and Forecasts. CEDEFOP/ETF/ILO: Turin
Lavery, S., Quaglia, L., and Dannreuther, C. (2017). The political economy of Brexit and the UK's national business model. Sheffield Political Economy Research Institute Paper, No. 41, May 2017. Available from: http://speri.dept.shef.ac.uk/wp-content/uploads/2017/05/SPERI-Paper-41-The-Political-Economy-of-Brexit-and-the-UK-s-National-Business-Model.pdf.
Lawless, M., and Morgenroth, E. (2016). The Product and Sector Level Impact of a Hard Brexit across the EU. Economic and Social Research Institute Working Paper No. 550, November 2016. Available from: https://www.esri.ie/publications/the-product-and-sector-level-impact-of-a-hard-brexit-across-the-eu/.
Management Consultancies Association (2015). The definitive guide to UK Consulting Industry 2015: Summary Report. Management Consultancies Association: London.
Migration Watch (2016). UK immigration policy outside the EU. Available from: https://www.migrationwatchuk.org/pdfs/European-Union-MW371.pdf.
Mulabdic, A., Osnago, A., and Ruta, M. (2017). Deep Integration and UK-EU Trade Relations. World Bank Policy Research Working Paper No. WPS 7947, January 2017. Available from: http://documents.worldbank.org/curated/en/853811484835908129/Deep-integration-and-UK-EU-trade-relations.
Nedelkoska, L. and Quintini, G. (2018). "Automation, skills use and training", OECD Social, Employment and Migration Working Papers, No. 202, OECD Publishing: Paris. Available from: https://doi.org/10.1787/2e2f4eea-en.
OECD (2016). The Economic Consequences of Brexit – A Taxing Decision. OECD Economic Policy Papers. OECD Publications: Paris. Available from: http://www.oecd-ilibrary.org/economics/the-economic-consequences-of-brexit_5jm0lsvdkf6k-en.
132
Office of National Statistics (ONS) (2017). E-commerce and ICT activity, UK: 2017 Available from: https://www.ons.gov.uk/businessindustryandtrade/itandinternetindustry/bulletins/ecommerceandictactivity/2017.
Pelkmans, J. (2017). Economic Impact of Brexit on EU27: Part 2 – Sectoral Consequences. Centre for European Policy Studies presentation at IMCO Workshop on Implications of Brexit, European Parliament.
PitchBook (2018). European Venture Report 3Q 2018. Available from: https://files.pitchbook.com/website/files/pdf/PitchBook_3Q_2018_European_Venture_Report.pdf.
Pont, M. (2008). Improvements to the measurement of government output in the National Accounts, Economic & Labour Market Review, 2(2), February 2008, ONS.
Portesy, J., and Fortez, G. (2016). The Economic Impact of Brexit-induced Reductions in Migration. NIESR: London. Available from: https://www.niesr.ac.uk/sites/default/files/publications/The%20Economic%20Impact%20of%20Brexit-induced%20Reductions%20in%20Migration%20-%20Dec%2016.pdf.
Powley, T. (2015). London’s £27bn Crossrail 2 plans advance, Financial Times: 27 October 2015.
Purcell, K., Elias, P., Davies, R., and Wilton, N. (2005). The Class of ’99. Department for Education and Skills: DfES Nottingham.
PwC (2016a). Brexit Monitor: The impact of Brexit on (global) trade. PwC: London. Available from: https://www.pwc.nl/nl/brexit/documents/pwc-brexit-monitor-trade.pdf.
PwC (2016b). Leaving the EU: Implications for the UK economy, March 2016. PwC: London. Available from: https://www.pwc.co.uk/economic-services/assets/leaving-the-eu-implications-for-the-uk-economy.pdf.
RaboBank (2017). Assessing the economic impact of Brexit: background report. London. Available from: https://economics.rabobank.com/publications/2017/october/assessing-economic-impact-brexit-background-report/.
RAND (2017). After Brexit. Alternative forms of Brexit and their implications for the United Kingdom, the European Union and the United States. RAND: London. PwC: London. Available from: https://www.rand.org/pubs/research_reports/RR2200.html.
SCQF (Scottish Credit and Qualifications Framework Partnership) (2011). Qualifications can cross boundaries: A rough guide to comparing qualifications in the UK and Ireland. SCQF, Glasgow.
133
The Bank of England (2018). EU withdrawal scenarios and monetary and financial stability. Available from: https://www.bankofengland.co.uk/-/media/boe/files/report/2018/eu-withdrawal-scenarios-and-monetary-and-financial-stability.pdf?la=en&hash=B5F6EDCDF90DCC10286FC0BC599D94CAB8735DFB.
The Society of Motor Manufacturers & Traders (SMMT) (2017). Delivering UK automotive Brexit priorities SMMT discussion paper – 7 July 2017, London: SMMT. Available from: https://www.smmt.co.uk/wp-content/uploads/sites/2/SMMT-discussion-paper-Delivering-UK-automotive-Brexit-priorities_July-2017.pdf
The Society of Motor Manufacturers & Traders (SMMT)(2018). SMMT Motor Industry Facts. London: SMMT. Available from: https://www.smmt.co.uk/wp-content/uploads/sites/2/SMMT-Motor-Industry-Facts-June-2018.pdf
The Society of Motor Manufacturers & Traders (SMMT)(2019). UK Automotive on red alert as ‘no deal’ threat sees manufacturing and investment plummet, SMMT News UK Manufacturing (31 January 2019). Available from: https://www.smmt.co.uk/2019/01/uk-automotive-on-red-alert-as-no-deal-threat-sees-manufacturing-and-investment-plummet/
UCAS (2013). 2013 Application Cycle: End of Cycle Report. UCAS Analysis and Research, UCAS, December. Available from: http://www.ucas.com/system/files/UCAS%202013%20End%20of%20Cycle%20Report.pdf
van Breugel, G. (2017). Identification and anticipation of skill requirements: Instruments used by international institutions and developed countries. Economic Commission for Latin America (ECLA) (Spanish acronym is CEPAL). Date Issued: 2017-10, Serie: Documentos de Proyectos, 110 p. United Nations UN symbol: LC/TS.2017/85. Available from: https://www.cepal.org/en/publications/42233-identification-and-anticipation-skill-requirements-instruments-used-international
Wilson, R, A. (1999). EMTA Quantitative Forecasting Model: Detailed specification. Institute for Employment Research, University of Warwick: Coventry.
Wilson R. A. (ed.) (2000). Projections of Occupations and Qualifications, 1999/2000. Department for Education and Employment/University of Warwick, Institute for Employment Research, Coventry.
Wilson, R. A. (ed.) (2001). Projections of Occupations and Qualifications, 2000/2001. Department for Education and Employment/University of Warwick, Institute for Employment Research, Coventry.
Wilson, R. A. (2011). Working Futures 2010-2020: Sectoral Report. UK Commission for Employment and Skills: Wath on Dearne.
134
Wilson, R. A. (2013). Skills Anticipation - the Future of Work and Education. International Journal of Educational Research, 61, pp.101-110. Available from: http://authors.elsevier.com/sd/article/S0883035513000335
Wilson, R. A, (2014). Working Futures 2012-2022: General Guidelines for using the Workbooks. UK Commission for Employment and Skills: Wath on Dearne.
Wilson, R. A., (2018). Skills Forecasts in a Rapidly Changing World: Through a Glass Darkly. In McGrath, S., Mulder, M., Papier, J., and Suart, R. (eds.) Handbook of Vocational Education and Training Developments in the Changing World of Work. Springer. Available from: https://link.springer.com/referenceworkentry/10.1007%2F978-3-319-49789-1_74-1
Wilson, R. A., Beaven, R., May-Gillings, M., Hay, G., and Stevens, J. (2014). Working Futures 2012-2022: Technical Report. UK Commission for Employment and Skills: Wath on Dearne.
Wilson, R. A., Czesana, V., Simova, Z., Kriechel, B., and Vetter, T. (2017). Labour Market Anticipation: Lessons from around the world. Review commissioned by BIS as part of the Foresight Future of skills and lifelong learning project. BIS: London. Available from: https://www.gov.uk/government/publications/skills-and-lifelong-learning-labour-market-anticipation and https://assets.publishing.service.gov.uk/government/uploads/system/uploads/attachment_data/file/608083/Labour_Market_Anticipation.pdf
Wilson, R. A., May-Gillings, M., Patel, S., and Bui, H. (2019). Working Futures 2017-2027: Technical report on sources and methods. Department for Education: London.
Wilson, R. A., May-Gillings, M., Pirie, J. and Beaven, R. (2016a). Working Futures 2014-2024: Main Report. UK Commission for Employment and Skills: Wath on Dearne.
Wilson, R. A., May-Gillings, M., Pirie, J., and Beaven, R. (2016b). Working Futures 2014-2024: Technical report on sources and methods. UK Commission for Employment and Skills: Wath on Dearne.
Wyman, O. (2016). Brexit Impact on the UK-based Financial Services Sector. Available from: http://www.oliverwyman.com/content/dam/oliver-wyman/global/en/2016/oct/OW%20report_Brexit%20impact%20on%20Uk-based%20FS.pdf.

135
Other outputs available from Working Futures include: Working Futures 2017-2027 Main report and associated technical reports. Full details on sources and methods are to be found in the technical report. The full length evidence report and associated Annexes contain:
• More detailed results for both sectors and occupations in the UK;
• Results for the various devolved administrations with the UK and the English regions;
• Comparisons with previous projections;
• Methodological details relating to the projections, including the macroeconomic model, methods used to derive implications for the demand for and supply of skills and the spatial analysis.
• Excel workbooks containing analysis for the UK, nations and English regions (to be published in due course).
For further details and to access the Working Futures 2017-2027 reports see www.gov.uk/government/publications and for previous Working Futures reports see warwick.ac.uk/fac/soc/ier/research/wf/.
© Department for Education 2020
Reference: DFE-RR970
ISBN: 978-1-83870-093-5
The views expressed in this report are the authors’ and do not necessarily reflect those of the Department for Education.
For any enquiries regarding this publication, contact us at: www.education.gov.uk/contactus
This document is available for download at www.gov.uk/government/publications
Copyright © 2022 FDOKUMEN