The internal cranial anatomy of the middle Pleistocene Broken ...
81
1 The internal cranial anatomy of the middle Pleistocene Broken Hill 1 cranium Antoine Balzeau a,b , Laura T. Buck c, d, e , Lou Albessard a , Gaël Becam a , Dominique Grimaud- Hervé a , Todd C. Rae e , Chris B. Stringer c a Équipe de Paléontologie Humaine, UMR 7194 du CNRS, Département Homme et Environnement, Muséum national d’Histoire naturelle, Paris, France. b Department of African Zoology, Royal Museum for Central Africa, B-3080 Tervuren, Belgium. c Earth Sciences Department, Natural History Museum, Cromwell Road, London, SW7 5BD, UK d Division of Biological Anthropology, University of Cambridge, Pembroke Street, Cambridge, CB2 3QG, UK e Centre for Evolutionary, Social and InterDisciplinary Anthropology, University of Roehampton, Holybourne Avenue, London, SW15 4JD, UK Running title: Anatomy of the Broken Hill 1 cranium Abstract The cranium (Broken Hill 1 or BH1) from the site previously known as Broken Hill, Northern Rhodesia (now Kabwe, Zambia) is one of the best preserved hominin fossils from the mid- Pleistocene. Its distinctive combination of anatomical features, however, makes its taxonomic attribution ambiguous. High resolution microCT, which has not previously been employed for gross morphological studies of this important specimen, allows a precise description of the internal anatomical features of BH1, including the distribution of cranial vault thickness and its
-
Upload
khangminh22 -
Category
Documents
-
view
1 -
download
0
Transcript of The internal cranial anatomy of the middle Pleistocene Broken ...

1
The internal cranial anatomy of the middle Pleistocene Broken Hill 1 cranium
Antoine Balzeau a,b, Laura T. Buck c, d, e, Lou Albessard a, Gaël Becam a, Dominique Grimaud-
Hervé a, Todd C. Rae e, Chris B. Stringer c
a Équipe de Paléontologie Humaine, UMR 7194 du CNRS, Département Homme et
Environnement, Muséum national d’Histoire naturelle, Paris, France.
b Department of African Zoology, Royal Museum for Central Africa, B-3080 Tervuren,
Belgium.
c Earth Sciences Department, Natural History Museum, Cromwell Road, London, SW7 5BD,
UK
d Division of Biological Anthropology, University of Cambridge, Pembroke Street, Cambridge,
CB2 3QG, UK
e Centre for Evolutionary, Social and InterDisciplinary Anthropology, University of
Roehampton, Holybourne Avenue, London, SW15 4JD, UK
Running title: Anatomy of the Broken Hill 1 cranium
Abstract
The cranium (Broken Hill 1 or BH1) from the site previously known as Broken Hill, Northern
Rhodesia (now Kabwe, Zambia) is one of the best preserved hominin fossils from the mid-
Pleistocene. Its distinctive combination of anatomical features, however, makes its taxonomic
attribution ambiguous. High resolution microCT, which has not previously been employed for
gross morphological studies of this important specimen, allows a precise description of the
internal anatomical features of BH1, including the distribution of cranial vault thickness and its

2
internal composition, paranasal pneumatisation, pneumatisation of the temporal bone and
endocranial anatomy. Relative to other chronologically and taxonomically relevant specimens,
BH1 shows unusually marked paranasal pneumatisation and a fairly thick cranial vault. For
many of the features analysed, this fossil does not exhibit the apomorphic conditions observed
in either Neandertals or Homo sapiens. Its morphology and the general shape of the brain and
of the skull may be partly explained by an allometric relationship relative to the features
observed in Homo erectus s.l. However, further research is still necessary to better appreciate
the cranial anatomy of BH1 and the role of Homo rhodesiensis/Homo heidelbergensis in the
course of human evolution.
This paper also deals with more general aspects of scientific practices in palaeoanthropology.
In particular, we give precise descriptions of many internal anatomical features of Broken Hill
1, a specimen discovered in 1921. This important and unique dataset will allow independent
comparative studies in the future. However, we were limited in our study by the very restricted
amount of comparative information available for Homo fossils. In our view, scientific papers
dealing with the anatomical description of hominin specimens, both in the case of
announcements of new discoveries and of discussions of important specimens found decades
ago, should always include qualitative and quantitative data that truly allow for further
independent research.
Key words: cranial vault thickness; pneumatisation; hominin evolution; imaging
methodologies; Homo heidelbergensis; Homo rhodesiensis.

3
Introduction
The cranium from Broken Hill (BH1, Figure 1) is a key specimen in the study of human
evolution as it is one of the best preserved fossils from the mid-Pleistocene. This time period
corresponds to an increase in morphological variability (and possibly in specific diversity) in
the hominin fossil record and the unusual combination of anatomical features in BH1 makes its
taxonomic attribution ambiguous (e.g., Wood, 2011; Stringer, 2012a; Rightmire, 2013, 2017;
Stringer & Buck, 2014). We present here a detailed description of its exo-, endo- and
intracranial features in order to: 1) clarify the anatomy of the specimen relative to existing
knowledge of cranial evolution and variation in the mid-Pleistocene; 2) contribute to
discussion about access to, and dissemination of, scientific data concerning our common
human heritage and future perspectives in Palaeoanthropology.
BH1 was discovered by lead miners in 1921 in a quarry at Broken Hill, Northern Rhodesia
(now Kabwe, Zambia) (Woodward, 1921; Schwartz & Tattersall, 2002; Wood, 2011). The site
was apparently named for the shape of the hill, which is marked by a depression, and because it
resembled a mine in Australia of the same name (Wood, 2011). In 1921-5, further fossil human
remains (all postcrania, with the exception of a small cranial fragment and a single maxilla –
see Buck & Stringer, 2015) representing at least two additional individuals were found
(Schwartz & Tattersall, 2002); extinct fauna and Middle Stone Age lithics were also recovered
from the same site (Wood, 2011). BH1 has been dated to approximately 700-300 ka mainly
using faunal correlations with other middle Pleistocene sites in southern and eastern Africa
(Millard, 2008, Klein, 2009). New ESR and U-series dating, however, is currently underway;
preliminary results suggest that the cranium is younger, dating to approximately 250-300 ka
(Stringer, 2013; Buck & Stringer, 2015).

4
Upon its discovery, BH1 was initially designated as the holotype for the new species, Homo
rhodesiensis (Woodward, 1921). Pycraft (1928) then mistakenly reconstructed a stooping
posture from the Broken Hill postcrania (Schwartz & Tattersall, 2002) and used this to propose
a new genus: ‘Cyphanthropus’. Fortunately, this taxonomic error was mostly ignored and the
specimen’s H. erectus, H. sapiens or supposed Neandertal* affinities were alternately
highlighted over the next few decades (Oakley et al., 1977). Recently, BH1 has often been
included in H. heidelbergensis, where it has formed an important part of the Euro-African
hypodigm for this taxon for many researchers (e.g., Wood, 2011; Stringer, 2012a; Rightmire,
2013; Stringer & Buck, 2014), due to its similarities to other mid-Pleistocene fossils,
particularly Petralona from Greece.
The external morphology of BH1 has been described previously (beginning with Pycraft,
1928), and its robusticity, the thickness of its cranial vault (Balzeau, 2013) and its extensive
paranasal pneumatisation (e.g., Seidler et al., 1997) have been remarked upon, but many
aspects of the anatomy of the specimen remain poorly documented and require quantitative
analysis in the context of the current knowledge of other fossil hominins. Here, high resolution
microCT is employed to describe and quantify the internal morphology (vault thickness, dental
root morphology, paranasal and temporal pneumatisation, endocast morphology and internal
palaeopathology) of BH1 in detail for the first time.
Cranial vault thickness (CVT) is a feature that is frequently discussed in analyses of fossil
hominin specimens (Weidenreich, 1943; Le Gros Clark, 1964; Hublin, 1978; Stringer, 1984;
Wood, 1984), yet previous studies (Bräuer, 1990; Kennedy, 1991; Kennedy et al., 1991; Bräuer
and Mbua, 1992; Pope, 1992; Brown, 1994; Gauld, 1996; Antón, 1997; Balzeau, 2006, 2007,
2013) have obtained dissimilar results and reached conflicting interpretations of this feature.
* It should be noted that some of the authors prefer the spelling “Neanderthal”.

5
This variation notwithstanding, CVT has often been used for taxonomic attribution of hominin
specimens, including BH1 (e.g., Kennedy et al., 1991; Delson et al., 2001; Baba et al., 2003;
Manzi et al., 2003; Potts et al., 2004; Kappelman et al., 2008; Rosas et al., 2008; Indriati and
Antón, 2010; Grimaud-Hervé et al., 2012; Curnoe and Green, 2013). CVT is awkward to
quantify and compare directly between specimens because various methodological limitations
make its precise and replicable quantification difficult, even when using modern slice-based
imaging methodologies (see Balzeau, 2006, 2007, 2013). When this feature has been quantified
in the past, generally only one or very few measurements with questionable anatomical
homology and reproducibility were compared. Here, we quantify the CVT of BH1 in a detailed
and replicable way using microCT data, in order both to characterise its expression in this
fossil and to enable better future comparisons with other specimens.
Recent study of CVT (Balzeau, 2013) has strengthened the view that “caution should be
exercised in treating absolute values of cranial bone thickness as diagnostic phylogenetic traits”
(Gauld 1996, p. 420). Indeed, a more detailed examination of the frontal squama and parietals
in the parasagittal area (Balzeau, 2013) cast serious doubt on the long-standing interpretation
that H. erectus displays an autapomorphically thicker cranial vault than other hominins. There
are some general differences between hominin species in the distribution of bone thickness
along the parasagittal region of the upper vault, however; Neandertals and H. sapiens show two
distinct apomorphic conditions (Balzeau, 2013). New comparative descriptive and quantitative
data, including more detailed information from other areas of the vault, such as that presented
here for BH1, are necessary to better understand variation in and patterns of CVT in hominins.
Furthermore, we analyse the relative position of inion and endinion and the relationships
between the exo- and endocranial structural features of the occipital bone (Balzeau et al., 2011)
in BH1 compared with other hominin specimens. These measurements characterise important
shape characteristics of the occipital bone, which is crucial to the study of hominin evolution

6
because it has several features that help to differentiate between various hominin species
(Balzeau et al., 2011). In addition, our study provides additional data to analyse and understand
cranial features and their related internal variations, which have been suggested to be
diagnostic of the taxonomically much disputed “mid-Pleistocene assemblage” (Rightmire,
2001; 2004, 2013).
The internal structure of teeth is also a matter of interest to document hominin evolution, with
differences in morphology reported to differentiate between closely related species (e.g., Smith
et al., 2012). We focus here on the tooth roots because of the many carious lesions that have
affected the crowns of BH1 (Lacy, 2014), obscuring their morphology, and because this
anatomical area has recently been shown to vary between hominin species (Le Cabec et al.,
2013) and also between other primate taxa (Moore et al., 2013, 2015).
Variation in hominin craniofacial pneumatisation is another aspect of internal cranial anatomy
that is still incompletely understood, despite a long history of study (e.g., Busk, 1861; Blake,
1864; Tillier, 1975, 1977; Zollikofer et al., 2008; Rae et al., 2011; Buck et al., 2012; Buck,
2014). Nevertheless, the presence and size of paranasal sinuses has been used in the systematic
evaluation of several species (Rae, 1999; Farke, 2010) and large sinuses have been proposed as
a diagnostic trait of H. heidelbergensis (Seidler et al., 1997; Prossinger et al., 2003; Stringer,
2013). As the alpha taxonomy of mid-Pleistocene hominins has been disputed for many years
(e.g., Stringer, 1983, 1985, 2012a, 2012b; Rightmire, 1996, 1998, 2008, 2013, 2017; Harvati,
2007; Mounier, 2009; Mounier et al., 2009; Buck & Stringer, 2014; Manzi, 2016), any
morphological trait, such as distinctive paranasal pneumatisation, that distinguishes between
species is potentially important. Since most mid-Pleistocene hominin material is craniodental,
their alpha taxonomy is best established on the basis of craniofacial or dental characters.

7
Therefore, investigating the size and level of variation in the pneumatisation of these
specimens, including BH1, can potentially clarify their taxonomy.
Temporal pneumatisation is also taxonomically variable within the tribe Hominini. The
primitive condition is represented by the extant non-human great apes, with extensive
pneumatisation throughout the entire temporal bone. Contrary to previous suggestions,
specimens attributed to Australopithecus africanus and Paranthropus do not share the ape-like
pattern of pneumatisation and show a reduction in the degree of cell expansion (Balzeau,
2015). H. erectus individuals from Zhoukoudian and possibly the fossils from Dmanisi as
illustrated by D 22800 (de Lumley et al., 2006; Rightmire et al., 2006) have a somewhat
reduced, but still extensive, propagation of pneumatisation with inter-individual variation.
Other early Homo, H. erectus individuals from Ngandong and Sambungmacan, Neandertals,
and H. sapiens have a still more restricted distribution of pneumatisation, but its level in mid-
Pleistocene Homo specimens, such as BH1, is largely uncharacterised. Although temporal bone
pneumatisation shows some individual variability, a similar pattern of distribution was found in
all adult Neandertal individuals from Krapina and western Europe, in which pneumatisation is
mainly restricted to most parts of the petromastoid areas (Balzeau and Radovčić, 2008).
Neandertals are unique in this configuration and particularly in its intraspecific homogeneity.
Conversely, temporal bone pneumatisation varies greatly in recent H. sapiens. It is generally
limited to the mastoid, perilabyrinthine and petrous regions, while propagation into the
squamous temporal is rare and not extensive (e.g., Allam, 1969; Wolfowitz, 1974; Schulter,
1976, Schulter-Ellis, 1979; Virapongse et al., 1985; Zonneveld, 1987; Scheuer and Black,
2000; Hill, 2008, 2011; Hill and Richtsmeier, 2008; Bronoosh et al., 2014). Correlations
between the shape of the pneumatisation and the shape of the temporal bone also illustrate
some particularities (Balzeau and Grimaud-Hervé, 2006), but this field of research also
requires further analyses. Our detailed characterisation of the temporal pneumatisation of BH1

8
will contribute to the emerging picture of its expression in the genus Homo and will facilitate
consideration of the morphological and environmental correlates of pneumatisation in
hominins.
Finally, palaeoneurology is an important field in the study of hominid evolution and hominin
diversity. Variation in the size and shape of the endocranium may differentiate fossil hominin
species; for example, Asian H. erectus specimens are differentiated from all other samples of
the genus Homo, including the African and Georgian specimens that are also often included in
H. erectus (Grimaud-Hervé and Lordkipanidze, 2010), by significantly smaller relative parietal
and temporal lobes compared with other groups (Balzeau et al., 2012). Neandertals and H.
sapiens, in addition to sharing some of the largest endocranial volumes of all hominins, show
different relative contribution of the frontal, parieto-temporal and occipital lobes (Grimaud-
Hervé, 1997; Balzeau et al., 2012). Completing a detailed study of the endocast of BH1 is
important because this specimen is encephalised compared to its probable predecessors – one
of the traits that could characterise a potential last common ancestor of Neandertals and H.
sapiens.
The study of these informative internal cranial traits is facilitated by high resolution microCT,
which has not previously been employed on this important specimen. The complete description
of the internal features of BH1 as detailed here is crucial to fully understand the anatomy of the
specimen. It will also be useful for future studies by all researchers. Following the description,
comparisons are made with data on these anatomical features in other chronologically and
geographically relevant specimens. Finally, we try to interpret the available information to
understand the anatomical characteristics of BH1 and modalities of evolution of mid-
Pleistocene hominins.

9
One dramatic limitation to this study has been access to appropriate comparative samples, as
the anatomy of most of the features studied here has not yet been described for the majority of
the most emblematic specimens of the mid-Pleistocene. Instead of conducting several separate
analyses for each feature on restricted and unsatisfactory samples, we decided to focus here on
the anatomy of the Broken Hill 1 cranium. We also provide a complete landmark description of
the skull (in Supplementary Information –SI1). The information detailed here will be useful for
future research, by us and others, and we hope that this work will stimulate similarly
exhaustive descriptions of other important fossil hominin specimens.
Material
BH1 is largely complete (Figure 1), missing only the right temporal bone, part of the occipital
bone, the cranial base on the right side and the area of the external occipital protuberance. The
missing bone corresponds endocranially to the right cerebellar and temporal lobes as well as to
most of the right occipital lobes. The preservation of the cranial surfaces, including the exo-
and endocranial surfaces, and of the internal structures, is exceptional in a fossil of this age.
The maxilla of BH1 includes 15 teeth, including 2 central incisors, 1 lateral incisor (left), 2
canines, 4 premolars and 6 molars. Some lesions are visible and will be described below.
Because anatomical description of the external aspects of the specimen is already available
elsewhere (Pycraft, 1928; Schwartz and Tattersall, 2003; Rightmire 2017), the focus of the
present contribution is instead on original information enabled by the internal imaging data.
The endocranial cast has already been partly described (Elliot Smith, 1928); this description is
completed here and comparisons are made with other fossil hominin endocasts, material that
was scarce at the time of the original description.
MicroCT data

10
The BH1 fossil was scanned by one of us (LTB) on a Metris X-Tek HMX ST 225 microCT
scanner at the Natural History Museum, London, with the following parameters: voltage: 210
KV, current: 175 µA, filter: 6mm Cu, exposure: 1415 ms. The resulting data were
reconstructed using CT-PRO software version 2.0 (Metris X-Tek, Santa Clara).
The specimen is highly mineralised, but this has not caused any substantial imaging artefacts;
there are no overflow artefacts and, although some noise is present, this has only limited
influence. Therefore, the main limitations of the data are due to the spatial resolution of the
data (due to the size of the specimen and the limited field of view available in the microCT
scanner) and to the partial volume averaging artefact, which is inherent to CT methodologies
(Balzeau et al., 2010). The resolution of the microCT dataset is 0.127 mm3, the resulting error
is therefore around ± 0.065 mm.
Comparative samples
The BH1 fossil is compared to the material used in recent studies of internal cranial features in
fossil hominins and hominids. For CVT, comparison is possible (Balzeau, 2006, 2007, 2013;
Balzeau and Charlier, 2016) with a total of 125 adult specimens, including 27 hominins from
several species (Sts 5, KNM-ER 1813, 3733, 3883, Tighennif 4, Sangiran 2, 4, 17, Ngandong
1, 7, 12, Ngawi 1, Sambungmacan 1, 3, Liang Bua 1, La Chapelle-aux-Saints 1, La Ferrassie 1,
Guattari, Krapina, 3, 4, 5, 6, La Quina H5, Saccopastore 1, Spy 1, Spy 10, Petralona), 23 fossil
anatomically modern humans (labelled fossil AMH below; Cro-Magnon 1, 2, 3, Mladeč 1,
Pataud 1, skulls from African Epi-Palaeolithic sites of Afalou Bou Rhummel (6) and Taforalt
(6), the Upper Palaeolithic skull from Rochereil, the skull from Song Terus dated between
5700 and 9400 BP, and three skulls from the Mesolithic site of Téviec), 40 recent European H.
sapiens (labelled recent AMH below) and 35 Pan paniscus.

11
For comparisons of paranasal pneumatisation, two important and relatively complete Mid-
Pleistocene (putative H. heidelbergensis) specimens were used: Bodo (Ethiopia) and Petralona
(Greece). The fossil cranium from Petralona was found in Petralona Cave, near Thessaloniki,
Greece in 1959. Due to a lack of preserved in situ sediments, it has been difficult to date; based
on fauna from the cave, the cranium is thought to be approximately 350-730 ka, but there is
considerable debate over whether the fauna and the hominin fossil are associated, and the
hominin cranium may be nearer the lower value, possibly about 400 ka (Stringer, 1983).
However, electron spin resonance analysis of a flowstone thought to have bracketed the
cranium suggests a much younger date of 150-200 ka (Grün, 1996). The Bodo cranium was
found in the Middle Awash Valley of Ethiopia in 1976. It is currently dated to approximately
600 ka using chronostratigraphic methods (Clark et al., 1994).
Information on temporal bone pneumatisation variations in recent H. sapiens was taken from
the literature (e.g., Allam, 1969; Wolfowitz, 1974; Schulter, 1976, Schulter-Ellis, 1979;
Virapongse et al., 1985; Zonneveld, 1987; Scheuer and Black, 2000; Hill, 2008, 2011; Hill and
Richtsmeier, 2008; Bronoosh et al., 2014) and from our own publications on the topic, which
also address the morphology of this feature in Neandertals, Asian H. erectus and African
hominins (Balzeau and Grimaud-Hervé, 2006; Balzeau and Radovčić, 2008; Balzeau, 2015).
A morphometric comparison of endocranial anatomy is performed with large samples of fossil
hominins (KNM-ER 1470, 1813, 3733, 3883, KNM-WT 15000, LH 18, Salé, Dmanisi 2280,
2282, Trinil 2, Sangiran 2, 10, 17, ‘Sinanthropus’ III, X, XI, XII, Erhingsdorf H9, Reilingen,
Spy 1, 10, Teshik-Tash, La Chapelle aux Saints, Le Moustier, La Quina H5, Feldhofer, Jebel
Irhoud 1, 2) and anatomically modern humans (Predmostí 3, 4, 9, 10, Cro-Magnon 1, 3, Dolní
Vĕstonice 1, 2, Pataud and 104 recent humans) (Grimaud-Hervé, 1997; Grimaud-Hervé and
Lordkipanidze, 2010; Balzeau et al., 2013).

12
Finally, a combined study of the exocranial and endocranial variation along the mid-sagittal
plane was carried out to analyse the position of the Broken Hill fossil relative to other Homo
specimens, following a protocol described elsewhere (Albessard et al., 2016). A sample of 41
recent humans and several fossils of the genus Homo was selected according to the
preservation state of the specimens. We analysed data from Chinese and Indonesian H. erectus
(Zhoukoudian III, X, XI, XII, Sangiran 2, Ngandong 7, 12, Ngawi, Sambungmacan 3), African
H. erectus specimens (KNM-ER 3733, 3883), the mid-Pleistocene fossil from Petralona, and
Neandertals (La Ferrassie 1, La Chapelle aux Saints 1, Guattari 1 and Spy 1). The fossil H.
sapiens sample comprises of Middle Palaeolithic specimen Skhūl V, Upper Palaeolithic
specimens Cro-Magnon 1 and 3, Pataud 1, Lafaye 1, Cioclovina 1, Mueirii 1 and Mladeč 1,
and Epipalaeolithic/Mesolithic specimens from Afalou Bou Rhummel (12,34), Taforalt (XIc1)
and Téviec (9,16). We used two-dimensional images of cross-sections of the skull extracted
from CT data for all extant and fossil H. sapiens, as well as for most of the fossil Homo
sample. For the Zhoukoudian individuals, we used cross-sections drawn and published by
Weidenreich (1943).
Methods
Multiplanar reformatting, thresholding procedures, three-dimensional volume rendering,
segmentation, 3D topographic mapping (with the module SurfaceDistance), measurement and
illustration acquisition were performed in Avizo 7 and 8 (FEI, Hillsboro, Oregon). Selection of
regions of interest on the 3D models for CVT analysis was performed using Geomagic (3D
Systems). Using the imaging datasets, the boundary between the bone and the surrounding air,
or when necessary with the existing sedimentary matrix, was identified on each individual slice
by manual segmentation. This procedure consists of measuring the median value (or half
maximum height, HMH) from the CT value of the two elements, of which the interface should

13
be defined (Spoor and Zonneveld, 1993). This manual segmentation was done at multiple
points along the bone surface of the vault with adapted settings to study CVT and the virtual
endocast. This procedure allowed for accurate identification of the interface between two
structures (Balzeau et al., 2010) and therefore the isolation of the exact area corresponding to
the bone extent to quantify CVT. The same procedure was used to delimit the extension of the
bone tables and of the diploë. Statistical procedures used to analyse the recorded data were
conducted in PAST 3 software (Hammer et al., 2001). Statistical comparisons of individual
values for bone thickness in BH1 and comparison with samples were performed with a specific
individual’s test score as described by Sokal and Rohlf (1995) and modified by Crawford and
Howell (1998).
We quantified the 3D coordinates of a long list of landmarks (N=70) on the 3D model of the
skull BH1 (in Supplementary Information –SI1) using Avizo (FEI, Hillsboro, Oregon). These
landmarks characterize the face (N=32), the calvaria (N=19) and the endocranial surface
(N=19).
Variations in CVT and structural bone composition
Imaging methodologies allow new possibilities (e.g., Spoor et al., 2000; Balzeau et al., 2010)
for the study of CVT and its inter- and intra-individual variation, but many aspects have to be
considered (Balzeau, 2013) and various limitations make the precise and repetitive
quantification of cranial vault thickness difficult when using slice-based technology. Here,
three distinct protocols developed to overcome the limitations of slice-based data are used to
quantify CVT; these have been tested and validated elsewhere (Balzeau, 2006, 2007, 2013).
1) The first quantifies CVT and structural composition of the cranial bones along the mid-
sagittal plane. This plane is reproducible in different hominin species, as its definition is not
influenced by variations in size and morphology of the different bones of the cranial vault. The
mid-sagittal plane is the only CT slice perpendicular to the cranial thickness along its full

14
extent. This methodological issue has not always been considered in previous studies of CVT,
resulting in thickness measurements whose validity is questionable and that may be impossible
to compare between specimens and studies (e.g., Curnoe and Brink, 2010). CVT and structural
bone composition are determined at 60 points along the mid-sagittal plane (Balzeau, 2006,
2007; figure 2). Between glabella and bregma, 20 values are measured. An additional 20 values
are located between bregma and lambda, 15 between lambda and inion and 5 are taken along
the nuchal plane. Bone thickness was not quantifiable on the complete mid-sagittal plane of
BH1 because of the incomplete preservation of the specimen (figure 2); the external cranial
surface is broken from the inferior third of the occipital plane to approximately the middle of
the nuchal plane. As a result, the values for six points along the mid-sagittal plane are missing,
including the value at the external occipital protuberance. Except for these points, CVT and
bone composition were quantifiable on the rest of the mid-sagittal plane without being altered
by post-mortem modifications of the specimen.
2) The second method uses computed maps of bone thickness variation to compare data over
larger anatomical areas, instead of a series of measurements at precise locations (Balzeau,
2013). From the 3D model of the skull, the exo- and endocranial surfaces were used to
compute a 3D topographic map of the variation in total bone thickness (figure 3). Bone
thickness was calculated with the Surface Thickness module of the Avizo program. This tool
computes the shortest distance of each vertex in the direction of its normal with all the triangles
of the same material. In the case of the vault of BH1, over 900,000 thickness measurements
were automatically quantified. These data were rendered using a chromatic scale, using a
colour scale between 2 and 22 millimetres from white to yellow. From the 3D topographic
map, variations in CVT in selected areas were also extracted. Following the methodology of
Copes (2012), mean thickness of the bone and its internal structure were quantified in a circular
area 1.2 cm in diameter in the centre of the frontal bone, and in a similar area with a 2.5 cm
diameter in the centre of the parietal bone. These sizes were selected, based on the preservation

15
of the bone and its orientation, to allow quantification of CVT only in well preserved areas,
and to allow comparisons with variation for the areas reported for large recent human samples
(Copes, 2012; Marsh, 2013).
3) Finally, CVT was quantified at classical anatomical landmarks. When calipers or a
cephalometer are used directly on the original specimen, the value is an approximation on a
small surface – due to the size of the surface of contact of the measuring tool – and for its
orientation. Three dimensional imaging methodologies, as used here, however, allow a much
higher precision, which results in thickness measurements that may vary by several millimetres
within a few millimetres of one another. Thus, here a mean value was obtained from multiple
local quantifications, rather than a measurement from a single 3D point.
We quantified using Avizo 7 (FEI, Hillsboro, Oregon) the relative position of inion and
endinion, measured the distances between inion (denoted I), endinion (E), lambda (L) and
opisthion (O), calculated the ratio between the exo- and endocranial distance of the squamous
occipital and the nuchal plane (labelled LI/IO and LE/EO) and the exo- and endocranial
proportions of the occipital bone as expressed by the L-inion cord (LIC), inion-opisthion cord
(IOC), lambda-endinion cord (LEC) and endinion-opisthion cord (EOC). When scaled to
endocranial volume, the distances were denoted with the suffix r.
Dental root morphology
Each of the maxillary teeth was virtually extracted from its alveolus by using the Watershed
tool in Avizo 7.1 to automatically segment out dental material based on thresholding. The
selections automatically made by this tool were then corrected manually by using the Brush
tool. The descriptions here concern only the tooth roots of BH1. We segmented out the pulp
cavity for each of the teeth; however, we did not virtually separate out the enamel from the
dentine, due to the voxel size of the microtomographic data (due to the imaging of the entire

16
cranium) and the impregnation of the fossil by heavy metals during its burial in the lead mine
at Broken Hill (Bartsiokas and Day 1993), which have changed the density of dental tissues. A
comparative metric analysis is performed only for the anterior teeth (incisors and canines),
given their greater simplicity and their lower degree of variation compared to the premolars
and molars roots. The measurement protocol established by Le Cabec et al. (2013) consists of a
virtual slice with an adjusted transverse plane through the lingual and labial sides of the
cervical line to separate the root from the crown. However, in the absence of enamel to enable
the location of the cervical line of BH1's central incisors, two virtual cutting planes were used
to record the minimum and maximum lengths of the roots. The first plane takes into account
the location of the tooth in the maxilla and follows the line of the alveoli. A second plane is
performed taking into account the height of the cervical line of the left lateral incisor and the
left canine, which retain their enamel (figure 4B). For all the anterior teeth, linear
measurements of the root dimensions were collected (root length: RL; mesiodistal and
labiolingual root diameters: R(MD) and R(LL) in mm), along with surface area (root surface
area of the labial and lingual parts: RSA lab and RSA ling) and volumetric parameters (root
volume: RV; root pulp volume: RPV) (Table 1).
Pneumatisation
Paranasal sinus size was measured in three ways: volume, surface area and extent. Frontal,
maxillary (left and right) and sphenoidal sinuses were manually segmented out slice-by-slice
from the raw CT data in Avizo 8.0. The volumes and surface areas of these materials were then
calculated using an Avizo automatic routine. A three-dimensional virtual reconstruction of the
cranium was created and rendered transparent. The extent of the sinuses in BH1 in different
directions was measured by placing craniometric landmarks (Fig. 5 and Table 2) on the virtual
reconstruction of the cranial surface and measuring from these landmarks to the greatest extent
of the solid sinus material in the required direction using the Avizo 3D line measurement tool

17
(see Fig. 5). The ethmoid sinuses were not considered since their size, position and
morphology make their measurement extremely difficult. This problem has prevented their
inclusion in most previous work, resulting in almost no comparative literature for this sinus
(e.g., Tillier, 1975, 1977; Buck, 2014; c.f. Zollikofer et al., 2008).
Sinus size in hominoids has been shown to scale with facial size (Lund, 1988; Koppe et al.,
1999a, b; Rae & Koppe, 2000; Rae et al., 2011; Holton et al., 2011; although see Butaric et al.,
2010); thus, measures of sinus size standardised using a proxy for facial size were also
examined when comparing sinus size in BH1 with that of other specimens. Following Rae et
al. (2011) and Buck (2014), the distance from glabella to frontomalare temporale (G-FMT) was
used to standardise measurements; this measurement has been shown to correlate strongly with
more complex measures of facial size, such as centroid size (Buck, 2014), but is less
problematic when comparing samples of fragmentary specimens. G-FMT was squared to
standardise areas and cubed to standardise volumes to preserve the same units of measurement.
Endocranial anatomy
The endocranial surface of BH1 was studied on both a physical replica of the original specimen
and on a virtual reconstruction produced from the microCT data.
Measurements of the endocast are given in Table 3. Measurements of the length, height and
width of different areas of the endocast were performed using sliding and spreading callipers
on physical endocasts and on drawings for dimensions quantified in projection views of the
endocast. The virtual models were quantified in Avizo. The frontal, parietal and occipital
chords were quantified based on anatomical landmarks related to brain structures. The surfaces
of the frontal, parieto-temporal, occipital and cerebellar lobes were also measured (Grimaud-
Hervé, 1997; Balzeau et al., 2013). These variables were selected because they refer to real

18
variation in the shape of the brain and not to internal distances within the endocranium as often
used (e.g., maximal dimensions of the intracranial cavity, distances from internal cranial
landmarks such as endobregma and others).
Various components of endocranial petalias (the antero-posterior, vertical and lateral
components of the protrusions of the frontal and occipital poles) (Balzeau and Gilissen, 2010;
Balzeau et al. 2012) were quantified, as well as the size, shape and bilateral asymmetries of the
third frontal convolution (or posterior inferior frontal gyrus) (Balzeau et al., 2014). The
parameter FA11 quantifies the asymmetries for all individuals and all traits, and is calculated
using the formula ∑(∑|Rxi-Lxi|)/N, where R is the right side, L the left side, x the value and i
the individual (Palmer, 1994). Morphometric data were scaled relative to each individual’s
endocranial volume; the cube-root of the endocranial volume (EV) for each individual was thus
used to scale each linear variable ((xi/(3√EVi)*100)) or for surface quantification
((2√xi)/(3√EVi)*100)).
Global shape of the skull
We carried out an analysis of the exo- and endocranial vault in the mid-sagittal plane using
two-dimensional geometric morphometrics. The mid-sagittal plane was defined through a
series of 3D cranial landmarks taken on the midline (nasion, glabella, supra-glabellar point,
bregma, lambda and inion) and used to create a cross-section of the skull using Avizo 7. This
cross section was then used as a reference to place midline points on the endocast (tip of the
encephalic rostrum, intersection of the sagittal and central sulci showing the midsagittal
posterior extension of the frontal lobe, intersection of the sagittal and parieto-occipital sulci
showing the midsagittal posterior extension of the parietal lobe, endinion). Projections of the
3D landmarks onto the 2D profile image created with the cross-section tool were then digitized
as 2D landmarks, and added semilandmarks along the boundary curves of the exo and

19
endocranial vaults. We used AVIZO 7 to define the mid-sagittal plane and extract the cross-
section, and the TPS suite (Rohlf 2008, 2009) to digitize 2D landmarks and semi-landmarks.
All semi-landmarks (exo- and endocranial) were slid simultaneously using the ‘bending
energy’ setting of the gpagen function of the R package geomorph (Adams & Otarola-Castillo
2013). Principal Component Analyses (PCA) of the shape variables computed through our
landmark configurations were performed using the R packages Shapes (Dryden 2013) and
Morpho (Schlager 2013). Generalised Procrustes Analyses (GPA) were performed before each
PCA to superimpose all specimens, removing size, location, and orientation effects from the
sample. For each individual, the ecto- and endocranial vaults were digitized as a single object
on which we performed a PCA.
Results - The internal anatomy of BH
Preservation and paleopathology
A small depression is visible exocranially on the left parietal bone at the intersection of its
anterior third and at its medial third. It is located along the course of the temporal lines, which
are affected by the presence of this depression. It measures 30x15 mm, with its long axis
parallel to the temporal line, which is also slightly depressed. It seems to impact mostly the
external extension of the external table, but not the underlying bone layers. Several lesions
were also described on the temporal bone of BH1 (Montgomery et al., 1994). The microCT
data helps to visualise the characteristics of all these features in greater detail than before. We
agree with previous suggestion that the retromeatal lesion, the mastoid tip lesion, and the
petrous lesions are post-mortem defects. However, in contrast to several previous assessments,
we consider that the squamous temporal bone lesion is also post-mortem. Indeed, the microCT
data clearly reveal that this defect is not associated with any healing or other biological
reaction.

20
Variations in CVT and structural bone composition
Along the mid-sagittal plane (figure 2), the maximal thickness at glabella is slightly over 31
mm. Bone thickness decreases rapidly posterior to the frontal torus. It then varies on the central
third of the frontal bone between 8 and 9 mm. Thickness measured at the centre of the glabella-
bregma distance (Mid G/B in Table 4) is 8.1 mm. Thickness then increases toward bregma,
where it reaches a value around 10.5 mm anterior to this point. At bregma, the thickness
measured directly on the 3D model is 9.4 mm. In terms of structural bone composition, the
frontal sinuses occupy the anterior third of the frontal bone. Posteriorly, the tables are well
differentiated and quantifiable as far as near bregma. In the posterior two thirds of the frontal
squama, the proportion of the external table increases antero-posteriorly from around 30 to
45% of total bone thickness, while the proportion of the internal table decreases from 45 to
30%, whereas the diploic layer remains quite stable in terms of relative contribution, with
values comprised between 25 and 30%. As a result, the diploic layer is always the least-
represented constituent of the posterior part of the frontal squama along the mid-sagittal plane.
Thickness decreases rapidly posteriorly to bregma, reaching 6.6 mm at one-third along the
parietal bone. It then increases all along the junction of the parietal bones. Thickness is 8.8 mm
at midway between bregma and lambda (note Mid B/L in table 4) and 11.7 mm at the level of
the lambda. Structural bone composition is not quantifiable in the mid-sagittal plane for the
parietal bones, as the sagittal suture is patent and therefore the bone tables are not differentiated
in this area.
Thickness continues to increase on the occipital bone posteriorly to lambda. It reaches a value
of 13 mm at the limit of the anterior third of the occipital plane. Thickness then decreases, and
increases again when getting closer to the area of the occipital torus. Unfortunately, this last
anatomical area is not completely preserved and its thickness cannot be estimated. Finally, the

21
thickness decreases slowly along the nuchal plane. On the occipital plane, the diploic layer is
the main component of the total bone thickness, representing around 36-43% of total bone
thickness. The external table constitutes around 23-26% and the internal table 33-37%.
For the complete vault (figure 3), in the areas where thickness is directly quantifiable between
the endo and exocranial surfaces – without going through cranial superstructures and where the
surfaces are roughly parallel – the maximum thickness is reached in the glabellar area. The
supraorbital torus is particularly well-developed in all directions. It is well isolated antero-
posteriorly from the vault, but it has also a continuous and substantial vertical development all
along its lateral extension. Another thickened area runs from the mastoid process towards the
mastoid crest and the junction with the occipital torus. The thinner areas of the upper vault are
located on the most infero-lateral extension of the frontal bone, in the centre of the temporal
squama and on the nuchal plane.
The frontal bone is thinner along the antero-posterior course of the first frontal convolution.
Areas of minimal thickness, around 5 to 6 mm, closely follow the shape of these endocranial
areas. Laterally, thickness is greater as far as the course of the temporal lines. Bone thickness
in this area varies between 8 and 11.5 mm, and follows the shape of the underlying second
frontal convolutions. Along the lateral walls of the frontal bone, thickness decreases toward its
most infero-posterior corners, where the bone is very thin, around 2 mm. This thinner area
extends vertically and corresponds exactly to the location of the lateral extension of the third
frontal convolution. There is a clear frontal keel on nearly all the frontal squama. It starts in the
glabellar area where it is a small relief and enlarges posteriorly in a large bregmatic eminence.
The frontal keel is not related unambiguously to variation in overall bone thickness, as it is
only slightly elevated above the rest of the external cranial surface, compared to the variations
in bone thickness due to larger endocranial traits.

22
The bregmatic eminence, on the other hand, is an external feature related to a slight increase (~
3 mm) of the total bone thickness, due to the variation in the endocranial surface associated
with the uppermost extension of the first frontal convolution. Thickness is around 10.5 mm in
the bregmatic area compared to a minimal value of 7.5 mm at the lateral border of the
eminence on the left side, around 1.5 cm from the mid-sagittal area. There is no coronal keel.
Bone thickness along the coronal suture is mainly affected by the presence of the suture.
Values are therefore lower than anteriorly and posteriorly.
The frontal sinuses play a major role in the internal anatomy of the frontal bone due to their
great extension (see below), including invading the anterior half of the frontal squama. In the
posterior half, the contribution of the internal table to CVT decreases antero-posteriorly and
appears to vary laterally in relation with total bone thickness. The external table is thicker
posteriorly and also where bone is thicker. The diploic layer shows more variation, particularly
in relation to the pattern of variation of the endocranial topography; whereas the inner and
outer bone tables show a general trend of thickness variation of the frontal bone, the diploic
layer is the one that varies most in relation to local modifications in bone thickness.
Several foramina are visible on the anterior surface of the frontal torus. They propagate
internally and many of them connect with the frontal sinuses. Just posterior to the frontal
sinuses and in the medial part of the frontal squama, several foramina on the endocranial
surface communicate with the diploic structure of the bone.
Parietal bone. The area of maximal thickness (15 mm) is the postero-lateral corner of the bone.
This is due to the presence of a marked external ridge, namely the mastoid crest, which
continues on the parietal bone and forms an angular torus that connects on the occipital bone

23
with the lateral extension of the occipital torus. The underlying endocranial structure is the
lateral sinus and the postero-basal extension of the temporal lobe, which is less projecting than
the adjacent middle temporal gyrus or the occipital lobe, contributing to the observed
thickening of the bone. The parietal bones are also globally thicker medially, with values
comprised between 11 and 13 mm, and thinner at their antero-lateral extension, with a minimal
thickness of around 4 mm. This pattern of distribution may be explained as follows: the thicker
area corresponds to the course of the interparietal sulci and is related posteriorly to the slight
development of the parietal lobes (i.e., supramarginal and angular gyri), while the bone is
thinner at the lateral border of the parietal bones, where the surface is more vertical. Indeed, the
deep imprints of the meningeal system on the endocranial surface in this area imply clear
localised thinning of the bone.
At the anterior junction of the parietal bones there is a V-shape area of thinner bone that
corresponds to the uppermost extension of the ascending frontal gyri. In addition, Pacchionian
impressions accentuate the relief in this area, causing a depression of the endocranial surface
and the observed thinning of the bone. This thinning also corresponds to the posterior
extension of the bregmatic eminence. There is no exocranial relief at the junction of the two
parietal bones, no keel and no parasagittal flattening are observable. On the contrary, the
exocranial surface of the bone seems to be flattened all along the extension of the suture. The
variation in bone thickness in this area is mainly due to the presence of the sagittal sinus, a
depression on the endocranial surface that decreases bone thickness. The slightly thicker area
in the posterior half of the junction of the parietal bones is related to the depressions on both
sides of this sagittal sinus. The diploic structure of the parietal bone is partly altered in its
inferior extension, particularly on the exposed right side and for the inferior half on the left
side. There, the diploic bone is highly mineralised, more so than in the inner and outer bone

24
tables, and its internal structure is not perfectly preserved. Above, the structure is visible and
some canals for diploic veins are observable.
The relative thickness of the inner and outer tables is consistent along the full extent of the
parietal bones. The diploic layer is the component whose contribution to total bone thickness
varies the most in relation with total bone thickness. It is the main component where thickness
is maximal and it is much thinner when total bone thickness decreases, where it contributes the
least to total bone thickness.
Temporal bone. Bone thickness is minimal in the area of most of the lateral course of the
middle temporal gyrus (~ 3-4 mm). Maximum values (~ 12 mm) are measured in the anterior
corner of the squama, and in and posterior to the mastoid area. The upper part of the squama
has a thickness of around 8 mm. This area of thicker bone corresponds endocranially to the
course of the sylvian valley.
Occipital bone. The course of the internal occipital crest creates a clear thickening of the bone;
the maximum value is ~ 13 mm, just posterior to lambda. The thinnest areas of the occipital
squama (~ 4 mm) correspond to the endocranial occipital poles. The preserved course of the
occipital torus is an area of thickened bone. Due to the incomplete preservation of the central
part of the bone, we cannot estimate the thickness at the external occipital protuberance.
Thickness reaches a minimal value of 3 mm on the cerebellar plane in the preserved areas of
the incurvation of the cerebellar fossa. Endinion was certainly below inion.
The distribution of bone thickness is generally symmetrical (with respect to the sagittal plane)
all over the vault, with no large bilateral variations. Some local and restricted variations are
visible, however. The clearest asymmetry is observed in the centre of the parietal bone, around

25
the area of the parietal eminence. Here, the left side is thicker that the corresponding area on
the right. This is due particularly to a slight differential development of the underlying
endocranial structures.
Additional metrics for CVT. The thickness of the frontal bone on a circular area of 1.2 cm in
the centre of the frontal bone has a mean value of 7.7 mm there. In this area, the mean
thickness of the external table is 2.3 mm, the mean value for the diploic layer is 2.5 mm, and
the mean value for the internal table is 2.9 mm. On the left parietal bone, a circular area of 2.5
cm in the centre of the bone has a thickness with a mean value of 10.9 mm. In this area, the
mean thickness of the external table is 2.7 mm, the mean value for the diploic layer is 6.1 mm,
and the mean value for the internal table is 1.8 mm. Additional values were quantified for
standard anatomical landmarks (Table 4).
Tooth Roots
Anterior tooth roots. The metric data are shown in Table 1. The roots of the upper central
incisors show an approximately circular section at the cervical line (R ratio (LL) / R (R): 0.9 -
1.0 for the right central incisor and 1.1 for the left) and retain this form throughout their length.
No mesial or distal groove is seen. Because of the partial obstruction of the pulp cavity of the
right central incisor by a secondary deposit (calcite or secondary dentine), the RPV (root pulp
volume) is clearly different between the two central incisors (CV: between 0.3 mm³ and 8.2
mm³ for the right incisor and between 11.5 mm³ and 21.3 mm³ for the left incisor). Due to the
same kind of deposit located at the extremities of the tooth, the pulp cavity volume of the left
central incisor is also underestimated. In the side view, the labial and lingual surfaces are
approximately straight from the apex to the cervical line.

26
The root of the upper left lateral incisor has a more oval cross section (ratio R(LL) / R(MD):
1.3) at the cervical marginal line than the central incisors, and retains this form throughout its
length. This root is characterized by the presence of a mesial and distal shallow groove, which
takes shape only on the middle third of the root. The pulp cavity is visible over the entire
length of the root, with the exception of the apical extremity and the RPV is 13.8 mm³. In side
view, the labial surface of the root is convex from the apical extremity to the cervical marginal
line, while the labial surface is approximately straight.
The upper canines present a more oval cross-section than the incisors (ratio R(LL) / R(MD):
1.4 for the left canine) at the cervical marginal line, and retain this shape throughout their
length. The right canine has a fracture of the root under the cervical marginal cervical line,
which greatly limits the available metrical data for this tooth. In the side view, the labial
surface of the root of the canines shows a concavity on the lower one-third and a convexity on
the upper two thirds, while the labial surface is relatively straight. In vestibular view, both
canines have an apex that is oriented distally compared to the main axis of the root. The RPV
of the right canine (31.2 mm³) is underestimated due to the obstruction of the apical pulp by a
secondary deposit.
Postcanine tooth roots. The premolars of the BH1 specimen have only one root. However, the
third premolars differ from fourth premolars by the presence of a deep and extensive mesial
groove, which is more pronounced on the right. The pulp cavity of the right third premolar has
two canals throughout the length of the root, while the root pulp of the left third premolar is
bifurcated only in the central third of the root. The roots of both fourth premolars are devoid of
mesial or distal grooves and have only one pulp canal.

27
The molars have three roots, with the exception of the right third molar which possesses only
two. However, the vestibular root is marked by a strong groove and the vestibular canal pulp is
bifurcated. Thus, all of the upper molars of BH1 have three pulp canals. The pulp chambers of
the second molars are the best preserved of all and have a total volume of 27.29 mm³ for the
right tooth and 34.83 mm³ for the left. One part of the crown and the root of the left second
molar is absent at the mesial side due to a carious lesion. The coronary pulps have a sub-
triangular shape in occlusal view and have two cusps marking the location of the paracone and
protocone.
Pneumatisation
Paranasal pneumatisation.
The frontal, maxillary and sphenoidal sinuses of BH1 are shown in situ below (Figs. 6 and 7);
their sizes, measured by volume and surface area, are shown in Table 5 and their extents are
given in Table 6. The relative extents of sinuses measured from virtual reconstructions (as
here) is difficult to compare between specimens, due to the difficulty of standarising
orientation between virtual specimens. Thus, the data presented here are intended only to
enable visualisation of the size of the sinuses within the cranium (a relationship that is difficult
to infer from volume and surface area measurements alone); these measurements are not
compared to those from other fossils. Only left maxillary sinus extent is reported, as there is
little bilateral asymetry in maxillary sinus size (Buck, 2014).
A single, undifferentiated frontal sinus fills the anteroposterior length of the very large
supraorbital torus and extends laterally to beyond the mid-point of each orbit; the sinus also
extends posteriorly far into the sloping frontal squama towards bregma and inferiorly extends
past nasion. The overall shape of the frontal sinus is fan-like, but is made up of many small
globular, coral-like extensions filling the entire depth of the bone thickness. This complex

28
shape is visible in its full detail for the first time via high-resolution microCT data. Although
this specimen shows a single, continuous frontal sinus, pneumatisation extends further laterally
on the left side than the right. The maxillary and sphenoidal sinuses are far less complex in
shape than the frontal sinus, largely conforming to, and filling, the respective bones they
pneumatise. The maxillary sinuses are roughly inverted pyramidoidal in shape, with shallow
division into several lobes laterally and anteriorly. The sphenoidal sinus fills the body of the
sphenoid and spreads into the greater sphenoidal wings, extending further on the right side than
the left.
Temporal bone pneumatisation (figure 8). The temporal pneumatisation is well preserved
inside the left temporal bone, except where a hole (see above) penetrates the antero-superior
portion of the mastoid process. Air cells are exposed at the bottom of this cavity, but also at the
lowermost extension of the mastoid process and at the postero-medial extension of the superior
surface of the petrous bone. The volume of the preserved pneumatisation is 5.4 cm3. Based on
the size of the hole (0.6 cm3), the estimated original volume of the temporal pneumatisation
probably did not exceed 6 cm3.
The antrum is large and the corresponding air cells extend from this cavity, particularly in
planar view. Pneumatisation is well developed in the petro-mastoid area. Anteriorly, cells are
present as far as above the external auditory meatus. Superiorly, the pneumatisation is limited
to the uppermost extension of the petrosal; cells do not invade the squamous temporal.
Inferiorly, cells are present in the anterior part of the mastoid process, reaching the most
inferior extension of this process, but are only present in the more anterior and uppermost
extension of the juxtamastoid eminence. Medially, some air cells reach the apex of the petrosal;
they are also the most anterior and superior portions of the temporal bone. Posteriorly, some
pneumatic cells, located in the summit of the mastoid, reach the level of the parietal notch. The

29
cells are globally larger inferiorly than superiorly; this is particularly true for the mastoid area
and the basal part of the petrous bone, where cells are larger than those observed above the
level of the external auditory meatus and when closer to the petrosal apex.
Endocast and brain anatomy (figure 9)
Endocranial volume for BH1 has been estimated previously between 1259 and 1325 cm3
(Elliot Smith, 1928; Seidler et al., 1997; Holloway et al., 2004). Here, the virtual reconstruction
of the BH1 endocast produced via mirror imaging of the missing parts from the existing areas
on the contralateral side has a volume of 1280 cm3, remarkably similar to the first estimation
published (Elliot Smith, 1928). The extreme values previously published for this individual
show a variation of less than ± 3%. This value of 1280 cm3 for the endocranial volume of BH1
is used in the rest of this article and can be considered as a reliable estimation for this specimen
in future works.
Overall morphology. The endocast is elongated, wide and low. The maximum width is in a low
position at the level of the temporal lobes, but with a relatively anterior position in the median
portion of the temporal lobes; as a result, the endocast is ovoid in shape in superior view. The
supramarginal gyri constitute a clear relief, meaning that the endocast seen in posterior view
has lateral walls that are weakly convergent towards the top. In lateral view, the sagittal
curvature is convex as far as the middle part of the parietal lobes; there it forms a depression
that continues towards the perpendicular sulci in front of the occipital lobes. Standard
measurements for this endocast are given in Table 3.
Vascular impressions. The superior sagittal sinus is visible between the frontal lobes in an
attenuated form. Its diameter increases from the area of the central sulci towards the occipital
lobes; it continues there in the right lateral sinus, which is only partly preserved. The left lateral
sinus is visible in the area of the confluence of the sinuses, where it has a smaller diameter

30
compared to the right sinus. Its diameter increases regularly all along its course toward the
sigmoid sinus. This last sinus is preserved throughout its length as far as the anterior part of the
left cerebellar lobe. Three granular foveolae are located in the anterior part of the frontal lobes,
one on the right side of the superior sagittal sinus and two on the left; all are located at the level
of the anterior rami of the middle meningeal system. There is no evidence of the sphenoparietal
sinuses. The left superior petrosal sinus forms a shallow depression. The structure that borders
the foramen magnum may correspond to the left marginal sinus.
The general pattern of the meningeal vessels is similar on both hemispheres. The anterior
ramus is the more developed, covering the posterior part of the frontal lobes and the complete
parietal lobes. On the left hemisphere, the common tract is visible from the base of the
temporal lobes. At the lateral extent of the junction of the middle and anterior fossae, which
also corresponds to the junction of the frontal and sphenoid bones, the vessel penetrates the
bone to a small extent (~ 5 mm). This explains why this vessel is not visible on the endocast
just above the sylvian valley. This feature implies a strong integration during growth and
development of the brain, the meningeal system and the skull.
The common tract of the meningeal vessels splits into three unequal branches along its course.
The anterior (or bregmatic) branch is the most prominent and has the widest diameter. At first,
this branch follows the course of the lateral sulcus; it then has a more vertical orientation and
splits in several branches that also show several rami. The anterior ramus is well developed
with long imprints that make some anastomoses together; these are less numerous on the left
side. The obelic branch has a reduced diameter in its anterior extension. It is parallel to the
posterior branch as far as the posterior part of the supramarginal gyrus, where it splits into two
rami. The posterior (or lambdatic) branch is also reduced, but is the first to separate from the

31
common tract along the temporo-cerebellar excavation. It shows some rami at the level of the
superior part of the third temporal convolution.
The general orientation of the middle meningeal system is oblique. On the right hemisphere,
the surface corresponding to the anterior branch is preserved and a similar pattern to that on the
left is observed; it also penetrates the bone for a few millimetres. This branch, however, is also
divided into an anterior section that is present for 1.5 cm anteriorly. It leaves the bone in the
centre of the sylvian valley, just behind the third frontal convolution.
In addition, some imprints of the anterior meningeal system are visible in the anterior part of
both hemispheres. They are numerous and very thin. They cover the lateral extension of the
third frontal convolution in the direction of the head of this convolution, reaching the middle
part of the second frontal convolution with a tree-like structure. Finally, thin imprints are also
visible on the encephalic rostrum.
Sulcal and gyral imprints. On the frontal lobes, the transverse curvature is regularly convex.
The interhemispheric sulcus is narrow. The encephalic rostrum is short and large. The anterior
parts of the first frontal convolution that constitutes this rostrum are larger on the right side.
The orbital part is exceptionally well preserved and concave on both sides. In anterior view, the
orientation of the orbital part is horizontal, joining laterally the basal part of the third frontal
convolution on both sides. This morphology is similar to that observed in H. sapiens.
On the inferior surface of the frontal lobes, only those imprints corresponding to the right
orbitofrontal sulci are visible. On the left side, the corresponding sulci have a disorganised
distribution and the external and internal orbital sulci cannot be discerned unambiguously. The

32
optic chiasm and the adjacent areas of the optic tracts are well preserved. A circular
protuberance in the centre of the chiasm could correspond to the imprint of the hypophysis.
The superior surface of the frontal lobe displays numerous depressions corresponding to the
frontal sulci that delimitate the three frontal gyri. The width of the first frontal convolution
increases from the frontal pole to the ascending frontal gyrus. The anterior limit of the
ascending frontal gyrus is not clear and is probably located in the area of the first frontal
convolution at the level of the imprint of the coronal suture. The imprints that delimi the third
frontal convolution are well marked. The cap incisure depresses the centre of this convolution
on both hemispheres. The third frontal convolution is more pronounced and projects more
laterally on the right side, which is possibly related to a lesser connexion with the temporal
pole; as a result, the width between the frontal and the temporal lobes is wider on the right
hemisphere.
The sylvian valley between the frontal and the temporal lobes continues into the lateral sulci,
whose orientation is slightly oblique toward the summit of the endocast. On the right side, the
lateral sulcus corresponds to the inferior limit of the preserved part of the endocast. The height
of the left temporal lobe is identical from the pole to the parietooccipital sulcus. The imprint of
the superior temporal sulcus is barely perceptible and the one for the inferior temporal sulcus
follows the inferior border of the lobe. The temporal gyri are therefore not perfectly
individualised all along their extension.
In the parietal lobes, the transversal curvature is maximal at the supramarginal gyri, depressed
at the level of the interparietal sulcus and strongly convex in the area of the first parietal
convolutions. These last are separated from each other by the width of the superior sagittal
sinus. On both sides, the central sulcus is difficult to identify. Conversely, the post-central sulci

33
are easy to locate thanks to the clear anterior limit of the supramarginal gyri on both sides. The
reliefs of the angular gyri are difficult to delimitate from those of the supramarginal gyri
because the intermedius primus (Jensen) sulcus is not visible. The foot of the second parietal
convolution is circular in shape and well separated on the left side, but not preserved on the
right hemisphere. The second parietal convolutions, where they are bilaterally preserved, have
a similar pattern.
The occipital and cerebellar lobes are preserved on the left hemisphere. The occipital lobe is
prominent, accentuated by the depression in the posterior part of the parietal lobes. The inferior
parts of the occipital sulci are clearly visible and separate the three occipital convolutions.
These convolutions are not discernible in the upper part of the occipital lobe. The preoccipital
incisura is covered by the transverse sinus. The parieto-occipital sulcus is apparent from the
pre-occipital notch on both sides, anterior to the lambdoid suture. The cerebellar lobe has an
anterior position, being equally located below the temporal and occipital lobes. The horizontal
fissure is the only imprint visible on the cerebellar surface.
Asymmetry. Concerning the pattern of fronto-occipital petalia, the BH1 endocast has a right
frontal lobe that is more anteriorly projecting, is below and has a more lateral position relative
to the mid-sagittal plane of the skull compared to the left pole. The left occipital pole has a
more posterior projection, is above and has a more medial position relative to the mid-sagittal
plane compared to the right pole. These bilateral variations, however, are very small; less than
1 mm for the antero-posterior variations and below 4.5 mm for the other components of the
petalia. Total asymmetry (FA11) for the petalia of BH1 is 8.9 mm, compared to a mean of 19.2
mm for H. sapiens, 15 mm for fossil hominins (including several taxa) and 9 mm for extant
non-human African great apes (Balzeau and Gilissen, 2010; Balzeau et al., 2012). This pattern
is known to be most common in right-handed humans (e.g., LeMay 1977; Galaburda et al.,

34
1978; Kertesz et al., 1990). The third frontal convolution is located more posteriorly, inferiorly
and laterally on the left hemisphere compared to the right side. The whole area has a more
compact shape on the left side. Its size is in the upper part of the range of variation observed
for fossil hominins (Balzeau et al., 2014).
Results - Comparative morphology
Comparisons of BH1 CVT and structural bone composition
To put the CVT of BH1 into context, a sample of 570 adult recent H. sapiens has a mean
thickness value of 5.8 mm (SD=1.363 mm) in the centre of the frontal bone and of 5.8 mm
(SD=1.260 mm) in the centre of the parietal bone (Copes, 2012). These results correspond
closely to the mean values obtained by Marsh (2013) on a similar sample (n=138). BH1 (Table
4) has a significantly thicker frontal bone than the H. sapiens sample of Copes (2012) (p<0.05);
94.2% of the comparative sample have thinner bone in this area. The same holds for the
parietal (p<0.01, thicker than 99.1% of the human sample).
Moreover, the H. sapiens sample (Copes, 2012) has a ratio of diploë/total thickness of 0.429
(SD=0.126) and 0.491 (SD=0.098) for the frontal and parietal, respectively. The values
calculated on BH1 are 0.32 and 0.56 for the same bones; these are within the range of variation
of parietal composition and total thickness for human frontal and parietal bones (Copes, 2012,
p. 113) but at the limits of high thickness values and relatively low diploic ratios. As observed
along the mid-sagittal plane (figure 2), the diploic layer is relatively thin in the upper part of
the frontal squama. It is relatively thicker along the occipital squama, but still represents less
than 50% of total bone thickness in this area. This pattern is not different from the variation
previously described for H. erectus or H. sapiens. Only few comparative data, however, are

35
available for fossil hominins (Balzeau, 2005, 2006) and this topic will require further
investigation to identify possible features of taxonomic relevance.
Our recent comparative analyses of CVT (Balzeau, 2013) have shown that BH1, together with
Petralona, had the thickest vault observed in our fossil hominin samples. This was observed
both for absolute and relative values. Along the mid-sagittal plane, the bone is very thick at the
supraorbital torus and then decreases rapidly. An increase in bone thickness along the junction
of the parietal bone is also noticeable. The ectocranial relief visible on BH1 is not related to
variations in bone thickness; the same pattern has been observed for the frontal keel in several
Neandertal specimens and in Petralona (Balzeau, 2013). A clear increase in bone thickness was
observable only in some H. erectus fossils, particularly the most robust ones with more marked
external relief. Unfortunately, good data are not available for some of the biggest Indonesian
H. erectus, nor Lantian or Yunxian, among others.
More generally, the pattern of CVT distribution in BH1, as shown in figures 3 and 10 is
characterised by relatively thicker parietal bones, particularly in the postero-medial area. This
feature resembles the morphology observed in H. erectus sensus lato. It corresponds to a
plesiomorphic expression, whereas the morphology observed in Neandertals and H. sapiens
correspond to two derived conditions (Balzeau et al., 2013). BH1 and Petralona display the
darker range of colour in the 3D topographic map (figure 10), reflecting the very thick cranial
bone in these specimens (Balzeau 2013). They share with H. erectus a thick frontal torus or a
thickened postero-lateral parietal bone (figure 10). Unfortunately, comparative data for early
European hominins such as the skulls from La Sima de los Huesos are currently unavailable.
The scan set for Petralona is of relatively low resolution, but this specimen also shows high
absolute values for CVT and seems to show a pattern of distribution that resembles the

36
plesiomorphic condition observed for BH1. The main peculiarity of BH1 is related to its large,
thick frontal torus and to high thickness values for the vault.
Tooth roots
The length, surface area and volume of the roots of the anterior teeth of BH1, as well as the
cervical diameters and surfaces, correspond to the highest values of the Neandertal sample and
are well outside the range of variation of the modern human samples. This observation is true
for the various virtual cutting planes used in this study. The length and volume of the incisor
roots observed on BH1 are also close to the values recorded for the KNM-WT 15000
specimen, specifically for the lateral incisor (Table 7). However, the pathological state of the
teeth of BH1 may have caused hypercementosis, which increases the size of the roots, mainly
on the radicular apex. This secondary deposit has not been recognised on the microCT slices of
BH1. In general, this deposit seems not exceed a few millimeters of thickness on the apex,
particularly for the anterior teeth of Neandertals (Le Cabec et al., 2013), which were subject to
high occlusal loads, according to some authors (Brace, 1962, 1975; Smith, 1976; Smith et
Paquette, 1989; Le Cabec et al., 2013). Thus, the overestimation of dimensions of the roots
caused by hypercementosis can be considered negligible, especially for the linear and surface
area parameters.
Pneumatisation
Paranasal pneumatisation
We compared the pneumatisation of BH1 to two other important mid-Pleistocene hominin
fossils: Bodo and Petralona (Figure 11). Neither Bodo nor Petralona preserves a full
complement of the three types of paranasal sinus addressed here; however, both the frontal
sinus and one maxillary sinus are measurable in all three specimens. There is a considerable
level of variation in sinus volume between these three individuals: Petralona has far larger

37
paranasal sinus volumes than Bodo, which in turn has far larger volumes than BH1,
particularly for the frontal sinuses (Table 6, Figure 11). The differences between specimens
also varies with paranasal sinus type; the frontal and maxillary sinus volumes are very similar
in BH1 (practically indistinguishable in the case of the frontal and left maxillary), whilst there
is a noticeable difference between the frontal and right maxillary sinus volumes in Bodo and a
large difference between the frontal and left maxillary sinus in Petralona. These relationships
hold broadly for surface area, as well (Table 8, Figure 11).
Bodo has a smaller frontal sinus surface area than might be expected from the other two fossils,
but this may be due to poor CT scan resolution (clinical rather than microCT). The results
presented in Table 9 and Figure 5 also give the impression that the sinuses of BH1 are more
complex in shape than its conspecifics, having greater surface area to volume (S/V) ratios, but
this may well be due to the greater resolution of the BH1 scan, which enables more accurate
segmentation of the sinus for this specimen. It is probably not appropriate to compare S/V
ratios between paranasal sinus types (rather than between specimens); if, as seems probable,
the sinuses opportunistically expand to fill their respective bones (e.g., Moss & Young, 1960;
Shea, 1977; Blaney, 1990; Vinyard & Smith, 1997; Zollikofer et al., 2008; Buck, 2014), then
the more complex shape of the sphenoid bone would be expected to lead to a more complex
sinus than that of the frontal.
Temporal pneumatisation
Knowledge about the variation of temporal bone pneumatisation in hominins is limited, due to
the lack of descriptive data available, but a distinctive pattern has been described for
Neandertals (Balzeau and Radovčić, 2008), whereas more variation has been reported for H.
sapiens and between different geographic and chronological samples of H. erectus (Balzeau
and Grimaud-Hervé, 2006). The temporal pneumatisation in Petralona is more extensive than

38
in BH1, with large cells reaching the central part of the squamous temporal. The
pneumatisation in BH1 is more developed than in Neandertals, resembling Homo erectus in
this feature.
Endocast and brain anatomy
Six standard endocranial measurements of the endocast of BH1 (Table 3) and a large sample of
fossil hominins (Grimaud-Hervé, 1997; Grimaud-Hervé and Lordkipanidze, 2010; Balzeau et
al., 2013) were subjected to PCA (figure 12). These measurements describe the overall shape
of the endocast in all directions and have been selected for their utility in discriminating
between hominin species. The analysis includes the maximum length, width and height, as well
as the frontal chord, the parietal chord and the occipital chord. All variables were scaled
relative to endocranial volume. The loadings of these variables are illustrated in figure 12. BH1
(the square in the centre of the figure) plots at the limit of the distribution of the H. sapiens
sample that is located on the bottom left of the chart, and of the other fossil hominins that are
on the right. Compared to the mean for H. sapiens, the endocast of BH1 is relatively longer,
wider and shorter. It shares this relatively extended length with the other fossil hominins, but it
is relatively wider and lower than the rest of the sample. The main difference between BH1 and
H. sapiens is that the former has a relatively low value for the parietal chord; a long parietal
chord is characteristic of H. sapiens. There is no clear separation between fossil hominin
species in this analysis of general dimensions of the endocast. As a group, Asian H. erectus
specimens fall on the right side of the distribution of fossil hominins, while African specimens,
including early Homo, are closer to BH1. Neandertals are scattered throughout the fossil
hominin distribution.
The relative values for the surface area of the different lobes in BH1 are 110.2 for the frontal
lobes (based on the values for both hemispheres), 126.7 for the parieto-temporal lobes (from

39
the value obtained on the left side) and 73.7 for the occipital lobes (also derived from the
valued measured on the left hemisphere). Comparative data for several fossil hominin species
have already been published for this feature (Grimaud-Hervé, 1997; Balzeau et al. 2012), and
BH1 falls within the range of variation of the H. erectus samples for the relative surface of the
frontal lobes, of Asian H. erectus for the parieto-temporal lobes, and of all the fossil samples
for the occipital lobes. BH1 has a relative value for the parieto-temporal lobes that is
significantly smaller (t=-3.302, p<0.001) than the mean for H. sapiens (mean=141 mm,
n=106).
Global shape of the skull
This morphometric analysis provides additional data about some cranial features and their
related internal variations, both of which have been suggested to be diagnostic of the “mid-
Pleistocene assemblage” (Rightmire, 2001; 2004, 2013).
We performed a first analysis on the whole sample (fossil species and Homo sapiens), and a
second analysis on the fossil taxa only (n=17), in order to gain a better understanding of profile
variations within the genus Homo when removing the globularisation phenomenon seen in H.
sapiens from the analysis.
The PCA of the data for the whole sample (figure 13) shows a clear separation between H.
sapiens and other species of Homo along PC1, which accounts for 41.2% of the total sample
variation. Fossil specimens also show some separation along PC2 (32.2% of total sample
variation), with the Chinese and more recent Indonesian H. erectus clustering respectively at
the positive and the negative end of the axis. Neandertals, the older Sangiran 2 fossil, the two
African H. erectus fossils, Petralona and Broken Hill 1 are intermediate, with Neandertals
nevertheless grouping together within this cluster. The greatest part of the variation in this
sample according to this PCA is accounted for by the differences between H. sapiens and other
species of Homo. Changes in the shape space include a drastic reduction in the frontal and

40
occipital superstructures, a globularisation of both the skull and endocranium with a vertical
development of the parietal lobes and bones, and a more retreating position of the tip of the
encephalic rostrum. Another important portion of the variation in this sample is accounted for
by the variables of PC2, which separates the three main clusters of fossil specimens (Chinese
and Indonesian H. erectus at the two extremes of the axis, and the other fossils clustering
together in an intermediate position). This shows (from negative to positive values) a further
reduction in frontal and occipital superstructures caused by a more projecting occipital lobe,
relatively shorter frontal bone and lobes, and relatively longer parietal bones and lobes.
The analysis of the fossil taxa only (figure 14) shows a similar distribution of the specimens
into clusters, but demonstrates a clearer separation between Neandertals and the rest of the
middle cluster. Separation according to taxonomic, chronological and geographical factors
occurs along the axis of the PC1, which alone accounts for 68% of the total sample variation.
The main shape variations represented are differences in the relative extension of the frontal
and the parietal lobes and bones, and a thicker occipital torus in the specimens scoring positive
numbers (in particular the younger Indonesian H. erectus of Ngandong, Ngawi and
Sambungmacan). This thicker occipital torus is caused by an extension of the cranial vault, but
also by an important reduction in the projection of the occipital lobe.
It is perhaps interesting to note that, in this analysis, Petralona and BH1, sometimes deemed to
exhibit a shared suite of 'middle Pleistocene' characteristics, are found in diagonally opposed
quadrants of the graph, although the distance between them is not greater than that between the
most extreme Neandertals or the African H. erectus specimens.
Discussion
Broken Hill 1 within the human fossil record

41
We have detailed numerous internal features of BH1 (see also in Supplementary Information –
SI1) and have evaluated these traits relative to the available knowledge of other fossil hominins
and extant hominids. Here, we synthethise and contextualise this new information.
The thick frontal torus and the distribution of CVT on the parietal bone distinguish BH1 (along
with Petralona and Asian H. erectus; Balzeau 2013, Balzeau and Charlier, 2016) from
Neandertals and H. sapiens (Schwartz and Tattersall, 2010). BH1 also shows a frontal keel that
is not related to a clear variation in bone thickness. Indeed, it is only a slight relief on the
external cranial surface compared to the variation in bone thickness due to wider endocranial
traits. The bregmatic eminence on BH1 is related to a slight increase in the total bone
thickness. These exocranial features have some variation in shape among H. heidelbergensis
and H. erectus (e.g., Bräuer and Mbua, 1992; Wu and Athreya, 2013) and are not always
related to a variation in CVT, because any extra thickness produced may be equalled or
surpassed by variation in the shape of the bones or the presence of endocranial convolutions
(Balzeau, 2013). A relatively thick upper vault with relief on the exocranial surface, and on the
endocranial surface, resulting in a thickening of the bone compared to the adjacent areas, was
observed in Pan paniscus and Asian H. erectus. In these cases, bone thickness distribution
resembles a cross radiating from the bregmatic area. We hypothesised that this “cross” pattern
corresponds to the symplesiomorphic state among hominids (Balzeau, 2013). In BH1, the
sutures result in a reduced thickness along their course, but the general pattern resembles the
plesiomorphic condition described above. Its degree of expression depends on the integration
of many features: the external relief features, of course, but also the shapes of the bones and of
the upper part of the frontal lobes. BH1 is robust when its superstructures are considered, and
its high vault thickness is associated with a relatively large cranial size compared to other
hominins. This combination is distinct in BH1, compared to the rest of the fossil hominin
record, but BH1 does not display any of the apomorphic traits for CVT observed in either

42
Neandertals or H. sapiens. This may be of interest in terms of the debate over whether it
belongs to the species (often called H. heidelbergensis) that may represent the last common
ancestor of these taxa. We need more detailed CVT data on mid-Pleistocene hominins to better
appreciate the characteristics of BH1 and to identify possibly shared features that will help to
recognise and define H. rhodesiensis/H. heidelbergensis.
Our study provides additional data to analyse and understand cranial features and their related
internal variations that have been suggested to be diagnostic of the “mid-Pleistocene
assemblage” (Rightmire, 2001; 2004, 2013), including a lambda-inion chord (LIC) that
exceeds the nuchal plane in length (IOC). This relationship, however, is not so simple. Indeed,
only 14 of the 24 specimens attributed to H. erectus have LIC>IOC (Rightmire, 2013). In
addition, both BH1 and Petralona have a lower LIC/IOC ratio than several specimens
attributed to H. erectus (Balzeau et al., 2011). There is a common organisation of the occipital
bone in the mid-sagittal plane shared by H. erectus and other robust hominin specimens, such
as BH1, that distinguishes them from H. sapiens. As a result, exo- and endocranial proportions
of the occipital bone as expressed by the LIC, IOC, L-endinion cord (LEC) and endinion-
opisthion cord (EOC), the relative position of inion and endinion (Balzeau, 2013), and the
probable important thickness of the occipital torus – not preserved in BH1– support the view
that BH1 resembles H. erectus in the morphology and dimensions of the occipital bone (Santa
Luca, 1978). In addition, Neandertals and H. sapiens have their own diagnostic morphology for
this anatomical area. Neandertals show, amongst other features, a lambdoidal flattening, an
occipital ‘‘bun,’’ a weak and bilaterally arched occipital torus, and the presence of a suprainiac
fossa (e.g., Balzeau and Rougier, 2010). H. sapiens is characterized by a narrow and high
occipital plane (Schwartz and Tattersall, 2010).

43
The increase in vertex height that is proposed as characteristic of mid-Pleistocene hominins
(Rightmire, 2013) appears to be an allometric effect. Indeed, based on the data provided by
Rightmire (2013), the ratio between the length of the skull (glabella-opisthocranion, GOL) and
its height (porion-vertex, PVH) in BH1 (49.3) falls within the range of variation of his sample
of H. erectus (mean=51.6, SD=2.4). Similarly, the ratio of maximum endocranial
height/maximum endocranial length in BH1 (70.2) is well within the variation observed for H.
erectus and below the mean value for H. sapiens (Grimaud-Hervé, 1997). As a result, the brain
of BH1 is not relatively high compared to earlier hominins, and does not show the derived
condition observed in later species.
The analysis of the profile morphology re-assesses the distance between the morphology of the
H. sapiens skull and that of other Homo specimens. There is a complete separation between the
fossils and the H. sapiens sample, and BH1 falls well within the fossil sample variation,
showing no particular affinities to H. sapiens. This is due to the elongated profile and robust
superstructures of BH1. When considered against the rest of the fossil sample, its position in
the middle cluster is explained by the fact that the BH1 skull and endocast are robust, but do
not show the reduced projection of the occipital area or the shorter frontal areas compared to
the parietals that are seen in the Ngandong, Ngawi and Sambungmacan individuals. On the
PCA of the fossils (figure 14), PC1 (68% of sample variation) separates three clusters while
PC2 (which accounts for a much smaller 9.5% of variation) separates Neandertals and the
Petralona skull from most of the rest of the sample (Homo erectus and BH1). The position of
BH1 on the plot suggests that it shows none of the strong characteristics exhibited by either the
Zhoukoudian group (more gracile, with longer parietal areas compared with the frontal bones
and lobes, and with a strongly projected occipital area on the endocranium) or the
Ngandong/Ngawi/Sambungmacan group (thick tori, a less projected occipital region on the
endocranium, and a longer frontal area relative to the parietal). BH1, unlike Petralona, does not
appear to show any of the Neandertal characteristics either (retreating encephalic rostrum, a

44
slightly shorter frontal area relative to the total length of the skull and endocast, and slightly
elevated parietal lobes), or, if it does, they are not strongly expressed.
These results emphasise the ambiguous position of BH1 within the fossil record and do not
allow us to either reject or accept close ties with putative H. heidelbergensis specimen
Petralona. They do not suggest the shared characteristics with both Neandertals and H. sapiens
that would be expected for a common ancestor either. Finally, the BH1 cranium and endocast
do not show any strongly expressed exclusive diagnostic characteristics. In sum, concerning
the cranial and endocranial profile of BH1, compared to other fossils, it does not allow us to
clarify relationships between BH1 and its potential conspecifics or descendants, re-asserting
instead that great caution should be exercised in the interpretation of this fossil until more
specimens are known and available for analysis.
Le Cabec et al. (2013) suggest that the large dimensions of the roots of the anterior teeth in
Neandertals could be an ancestral condition, also shared with early modern humans. This
characteristic could contrast with the derived condition of more recent modern humans, which
have reduced dimensions of their anterior teeth. The large sizes of the roots of the anterior teeth
of BH1 are consistent with these observations and can be considered as an ancestral condition.
It has been suggested that enlarged paranasal sinus morphology is diagnostic of the H.
heidelbergensis hypodigm (Seidler, et al., 1997; Prossinger et al., 2003; Stringer, 2012a). It
seems that at least the frontal sinus may be distinctively large in this group compared to
Neandertals and H. sapiens (Seidler et al., 1997; Prossinger et al., 2003; Zollikofer et al., 2008;
Stringer, 2012a; Buck, 2014), whilst there is no difference in frontal sinus size between these
latter taxa if cranial size is taken into account (Zollikofer et al., 2008; Rae et al., 2011; Buck,
2014). The use of sinus size as a diagnostic trait for the hypodigm, however, is complicated by
the variation that appears to be present in this trait in other taxa, such as H. sapiens (Brothwell

45
et al., 1968; Buckland-Wright, 1970; Fernandez, 2004a, b; Holton et al. 2013; Buck, 2014).
Putative H. heidelbergensis also appear to display variation in sinus size; although Petralona,
Bodo, and BH1 have all previously been noted to have large frontal sinuses (Seidler et al.,
1997; Prossinger et al., 2003; Zollikofer et al., 2008), other specimens, such as Ceprano
(Bruner & Manzi, 2005) and Arago 21 (Tillier, 1975, 1977; Stringer, 1984; Balzeau, 2005),
appear to have small frontal sinuses.
Despite their consistently large, and possibly distinctive, paranasal sinus size, the H.
heidelbergensis sample investigated here is not homogeneous. There are differences in relative
volume between BH1, Bodo, and Petralona. These differences are not geographically
patterned; there is as great a difference between Petralona (Europe) and Bodo (Africa) as
between Bodo and BH1 (Africa), in terms of sinus volume. Moreover, both the putative H.
heidelbergensis with small sinuses (Ceprano and Arago 21) and that with the largest frontal
sinus (Petralona) are from Europe. The paranasal sinus evidence to date does not support a split
between the African material and the European material, but could be argued to support the
Euro-African hypodigm (see above). The problem of characterising the level of H.
heidelbergensis paranasal pneumatisation can only be resolved with a larger sample of mid-
Pleistocene fossils of different species.
The results reported here also suggest that the paranasal sinuses of BH1 may be particularly
complex, but this could be due to the greater resolution of the BH1 microCT data. The other
two fossils would need to be imaged comparably to make this statement with confidence. If
this impression is borne out by data with improved resolution, however, it could have
interesting implications in terms of sinus function theories. The majority of research to date
supports the idea that the sinuses are spandrels, whose size largely depends on the size and
shape of the bones they pneumatise (e.g., Zollikofer et al., 2008; Rae et al., 2011; Buck, 2014).
However, there also seems to be a large degree of variation not accounted for by this

46
relationship, some of which may be due to exapted optimisation for other purposes, for
example nitric oxide production (Lundberg, 2008) or heat dumping during intense physical
activity (Dean, 1988; Irmak, 2004; Churchill, 2015). The greater area of highly vascularised
epithelium available in a more complex sinus could be beneficial in either scenario. It is
difficult to see why BH1 might require more nitric oxide or greater heat dumping capacity than
its probable conspecifics, however, and in this case the variation is perhaps most likely to be
stochastic.
BH1 shows a pattern of temporal bone pneumatisation that is frequently seen in the genus
Homo, with a well-pneumatised petromastoid area. Among fossil hominins, this
pneumatisation tends to be more reduced in specimens with larger brain size and with more
vertical orientation of the lateral walls of the vault, compared to others with the opposite
condition for these features. These latter features, together with an arched squamous temporal
(e.g., Rightmire, 2013), are said to be characteristics of middle Pleistocene hominins relative to
H. erectus. Several additional specimens (e.g., Dali and Jinniushian) would be valuable in
determining variation in temporal bone pneumatisation in mid-Pleistocene hominins, and its
interest for taxonomic attribution. Moreover, these additional analyses would also contribute to
the ongoing debate on the developmental and/or functional origin of this pneumatisation
(Witmer, 1997; Zollikofer and Weissmann, 2008), as well as regarding the integration of this
feature with the exocranial anatomy of the temporal bone.
Finally, the study of BH1 shows that this relatively large endocast is long and low. Globally,
the morphometric analyses further illustrate that its shape does not display the specific features
of either Neandertals or H. sapiens. Its pattern of endocast asymmetry is within the range of
variation observed amongst other fossil hominins (Balzeau et al., 2012, 2014), but individual
values for BH1 are small. However, endocranial features are well individualised. For example,

47
the encephalic rostrum is short and large, the foot of the second parietal convolution is circular
in shape and well individualised and the supramarginal gyrus is pronounced, meaning that the
endocast, seen in posterior view, has lateral walls that are weakly convergent toward the top.
These endocranial features are different from the condition observed in H. erectus but do not
reach the degree of expression observed in Neandertals or modern humans.
Perspectives in palaeoanthropology
Throughout this paper, we have given precise descriptions of many internal anatomical features
of Broken Hill 1, discovered nearly a century ago. Instead of doing separate analyses for each
feature on restricted and unsatisfactory samples, we decided to focus here on all these
anatomical aspects for the specimen. The information detailed here will be useful for future
research, by us and others, and we hope that this work will stimulate similar exhaustive
descriptions of other important fossil hominin specimens. Indeed, one dramatic limitation to
this study has been the non-availability of appropriate comparative samples, since the anatomy
for most of the features studied here has not yet been described for most of the other
emblematic specimens from the mid-Pleistocene. This raises important issues for
palaeoanthropology. The recent announcement of H. naledi has been a topic of much
discussion. However, one innovation of the scientists in charge of this collection has been to
offer unfettered access to virtual models of most of the important specimens discovered
(Berger et al., 2015).
In the future, we hope that this behaviour will appear as the rule for publication of significant
fossil hominins, instead of an exception. The palaeoanthropological literature is full of papers
describing fossils with few or no images in the classical orientations, with biplots obtained
from geometric morphometric analyses that are impossible to reproduce, and with few
meaningful measure or coordinates that permit inclusion of the specimens in future studies.
Scientific papers dealing with the anatomical description of hominin specimens, both in the

48
case of announcement of new discoveries or for important specimens found many decades
previously, should now always include qualitative and quantitative data that allow further
independent research on the material.
Conclusion
CT or microCT data are a useful tool to identify anatomical features, revealing internal and
hidden characteristics. Moreover, detailed descriptions of key fossil hominins are important for
potential interpretation of their anatomical features, as well as in the context of comparative
studies. In the case of Broken Hill 1 we have tried to complete two important objectives. We
give a detailed description of this specimen, including some anatomical aspects that had not
been addressed before, and compare these with all the available information published for
relevant fossil hominins.
Broken Hill 1 shows some unusual anatomical features, such as very extensive frontal
paranasal pneumatisation (in common with other potential H. heidelbergensis) and thick
cranial bone. For many of the features analysed, however, this fossil does not exhibit the
apomorphic conditions observed in either Neandertals or among H. sapiens. The global shape
of the brain and of the skull, including several features suggested to be diagnostic of the “mid-
Pleistocene assemblage” (Rightmire, 2001; 2004, 2013), may be partly explained by an
allometric relationship relative to the features observed in H. erectus s.l. Moreover, no unique
internal cranial features can be identified for this specimen.
These observations are important because a large part of the European hominin record – with
the most notable exception of Petralona- that is approximately contemporary with BH1 shows
some Neandertal affinities as conceptualised by the accretion model (e.g. Hublin, 2009). The
still unsettled question of the age of BH1 is important in this context. But complete description
of other key fossil hominins and of their internal cranial features will be necessary before being
able to discuss further the status, the definition and the geographic extension of H.

49
heidelbergensis and/or H. rhodesiensis. Of course, one factor that complicates the discussion of
this topic is that the holotype of H. heidelbergensis is a mandible and the available comparative
material is very scarce, particularly outside Europe. Another limiting factor is the lack of high
quality data available for many relevant fossils; it is hoped that such information will soon be
widely available for Petralona, Arago, Dali, Jinniushan, and the Sima de los Huesos sample,
amongst many others, to help clarify the alpha taxonomy and phyletic position of these
important mid-Pleistocene specimens.
Acknowledgments
We are grateful to Robert Kruszynski for access to the Broken Hill 1 fossil and to Dan Sykes,
Rebecca Summerfield and Farah Ahmed (all Natural History Museum, London) for access to
the microCT scanner and the BH1 fossil. LTB thanks Ann MacLarnon for supervision, help
and advice with her PhD, from which some of this paper is derived, and Gerhard Weber
(University of Vienna) and George Koufos (Aristotle University of Thessaloniki) for access to
Petralona CT data (Bodo CT data were purchased from the Digital Archives of Fossil
Hominoids, University of Vienna). CBS and LTB thank the Calleva Foundation and the
Human Origins Research Fund for funding. We thank the AST-RX platform (Accès
Scientifique à la Tomographie à Rayons X), UMS 2700 « Outils et méthodes de la
systématique intégrative », CNRS-MNHN, Paris, France, for the micro-CT scanning
procedures on the specimen housed in Paris. AB is grateful to Aurélie Fort, Véronique Laborde
and Miguel Garcia-Sanz for technic and scientific assistance during the realisation of the
research at the MNHN. This work benefited from discussion with G. Clément.

50
References
Adams, D.C., Otarola-Castillo E., 2013. geomorph: an R package for the collection and
analysis of geometric morphometric shape data. Methods in Ecology and Evolution 4, 393-399.
Albessard, L., Grimaud-Hervé, D., Balzeau A. 2016. Evolution of cranial and endocranial
profiles in Homo species. A study in 2D geometric morphometrics. BMSAP 28, 118-131.
Allam, A.F., 1969. Pneumatization of the temporal bone. Annls. Otol. Rhinol. Laryngol. 78,
49-64.
Antón, S.C., 1997. Developmental age and taxonomic affinity of the Mojokerto child, Java,
Indonesia. Am. J. phys. Anthropol. 102, 497-514.
Baba, H., Aziz, F., Kaifu, Y., Suwa, G., Kono, R.T., Jacob, T., 2003. Homo erectus calvarium
from the Pleistocene of Java. Science 299, 1384-1388.
Balzeau, A., 2005. Spécificités des caractères morphologiques internes du squelette céphalique
chez Homo erectus. Ph.D. Dissertation, Muséum national d’histoire naturelle, Paris.
Balzeau, A., 2006. Are thickened cranial bones and equal participation of the three structural
bone layers autapomorphic traits of Homo erectus? Bull Mém Soc Anthrop Paris 18, 145-163.
Balzeau A., Grimaud-Hervé D., 2006. Cranial base morphology and temporal bone
pneumatization in Asian Homo erectus. J. Hum. Evol. 51, 350-359.
Balzeau, A., 2007. Variation and characteristics of the cranial vault thickness in Krapina and
Western European Neandertals. Period. Biol. 109, 369-377.
Balzeau, A., Radovčić, J., 2008. Variation and modalities of growth and development of the
temporal bone pneumatization in Neandertals. J. Hum. Evol. 54, 546-567.
Balzeau, A., Crevecoeur, I., Rougier, H., Froment, A., Gilissen, E., Grimaud-Hervé, D.,
Mennecier, P., Semal, P., 2010. Applications of imaging methodologies to paleoanthropology:

51
beneficial results relating to the preservation, management and development of collections. CR
Palevol 9, 265-275.
Balzeau, A., Rougier, H., 2010. Is the suprainiac fossa a Neandertal autapomorphy? A
complementary external and internal investigation. J. Hum. Evol. 58, 1-22.
Balzeau A., Gilissen E., 2010. Endocranial shape asymmetries in Pan paniscus, Pan
troglodytes and Gorilla gorilla assessed via skull based landmark analysis. J. Hum. Evol. 59,
54-69.
Balzeau, A., Grimaud-Hervé, D., Gilissen, E., 2011. Where are inion and endinion? Variations
of the exo- and endocranial morphology of the occipital bone during hominin evolution. J.
Hum. Evol. 61, 488-502.
Balzeau, A., Holloway, R.L., Grimaud-Hervé, D. 2012. Variations and asymmetries in regional
brain surface in the genus Homo. J. Hum. Evol. 62, 696-706.
Balzeau, A., Grimaud-Hervé, D., Détroit, F., Holloway, R.L., Combès, B., Prima, S., 2013.
First description of the Cro-Magnon 1 endocast and study of brain variation and evolution in
anatomically modern Homo sapiens. Bull. Mém. Soc. Anthrop. Paris 25, 1-18.
Balzeau, A., 2013. Thickened cranial vault and parasagittal keeling, correlated traits and
autapomorphies of Homo erectus? J. Hum. Evol. 64, 631-644.
Balzeau, A., Gilissen, E., Holloway, R.L., Prima, S., Grimaud-Hervé, D., 2014. Variations in
size, shape and asymmetries of the third frontal convolution in hominids: paleoneurological
implications for hominin evolution and the origin of language. J. Hum. Evol. 76, 116-128.
Balzeau, A., 2015. Comparative aspects of temporal bone pneumatisation in some African
fossil hominins. BMSAP 27, 135-141.
Bartsiokas, A., Day, M.H., 1993. Lead poisoning and dental caries in the Broken Hill hominid.
J. Hum. Evol. 24: 243-249.

52
Balzeau, A. Charlier P. 2016. What do cranial bones of LB1 tell us about Homo floresiensis? J.
Hum. Evol. 93, 12-24.
Berger, L.R., Hawks, J., de Ruiter, D.J., Churchill, S.E., Schmid, P., Delezene, L.K., Kivell,
T.L., Garvin, H.M., Williams, S.A., DeSilva, J.M., Skinner, M.M., Musiba, C.M., Cameron,
N., Holliday, T.W., Harcourt-Smith, W., Ackermann, R.R., Bastir, M., Bogin, B., Bolter, D.,
Brophy, J., Cofran, Z.D., Congdon, K.A., Deane, A.S., Dembo, M., Drapeau, M., Elliott, M.C.,
Feuerriegel, E.M., Garcia-Martinez, D., Green, D.J., Gurtov, A., Irish, J.D., Kruger, A., Laird,
M.F., Marchi, D., Meyer, M.R., Nalla, S., Negash, E.W., Orr, C.M., Radovcic, D., Schroeder,
L., Scott, J.E., Throckmorton, Z., Tocheri, M.W., VanSickle, C., Walker, C.S., Wei, P., Zipfel,
B., 2015. Homo naledi, a new species of the genus Homo from the Dinaledi Chamber, South
Africa. eLife 2015;4:e09560.
Blake, C.C., 1864. On the alleged peculiar characters, and assumed antiquity of the human
cranium from the Neanderthal. J Anthropol Soc London 2, cxxxix-clvii.
Blaney, S.P.A., 1990. Why paranasal sinuses? J Laryngol Otol 104, 690-3.
Brace, C.L., 1962. Cultural factors in the evolution of the human dentition. In: Montagu,
M.F.A. (Ed.), Culture and the Evolution of Man. Oxford University Press, New York, pp. 343-
354.
Brace, C.L., 1975. Comment on ‘Did La Ferrassie I use his teeth as tools? Curr. Anthropol. 16,
396-397.
Bräuer, G., 1990. The occurrence of some controversial Homo erectus cranial features in the
Zhoukoudian and East African hominids. Acta Anthropol. Sinica 9, 350-358.
Bräuer, G., Mbua, E., 1992. Homo erectus features used in cladistics and their variability in
Asian and African hominids. J. Hum. Evol. 22, 79-108.

53
Bronoosh, P., Shakibafard, A., Mokhtare, M.R., Munesi Rad, T., 2014. Temporal bone
pneumatization: a computed tomography study of pneumatized articular tubercule. Clinical
radiology 69, 151-156.
Brothwell, D.R., Molleson, T., Metreweli, C., 1968. Radiological aspects of normal variation
in earlier skeletons: an exploratory study. In: Brothwell, D.R., (Ed.) The skeletal biology of
earlier populations. Pergammon Press: Oxford. pp. 149-72.
Brown, P., 1994. Cranial vault thickness in Asian Homo erectus and Homo sapiens. Cour.
Forsch.-Inst. Senckenberg 171, 33-46.
Bruner, E., Manzi, G., 2005. CT-based description and phyletic evaluation of the archic human
calvarium from Ceprano, Italy. Anat Rec 285A, 643-58.
Buck, L.T., Stringer, C.B., MacLarnon, A.M., Rae, T.C. 2012. Paranasal sinus shape in
Pleistocene hominins. Am J Phys Anthropol 147, 108.
Buck, L.T. 2014. Craniofacial morphology, adaptation and paranasal pneumatisation in Late
Pleistocene hominins. PhD Thesis, University of Roehampton, London.
Buck, L.T., Stringer, C.B. 2014. Homo heidelbergensis. Curr Biol 24, R214-5.
Buck, L.T., Stringer, C.B. 2015. A rich locality in South Kensington: The fossil hominin
collection of the Natural History Museum, London. Geol J 50, 321-37.
Buckland-Wright, J.C., 1970. A radiographic examination of frontal sinuses in early British
populations. Man 5, 512-7.
Busk, G., 1861. Translation with comments of “On the crania of the most ancient races of
man” by D. Schaafhausen. Nat Hist Rev April 1861, 155-75.

54
Butaric, L.N., McCarthy, R.C. and Broadfield, D.C. 2010. A preliminary 3D computed
tomography study of the human maxillary sinus and nasal cavity. Am J Phys Anthropol 143,
426-436.
Churchill, S.E., 1998. Cold adaptation, heterochrony and Neandertals. Evol Anthropol 7, 46-
60.
Churchill, S.E. 2015. Thin on the ground: Neandertal biology, archeology & ecology. Wiley
Blackwell: Hoboken, NJ.
Clark, J.D., de Heizelin, J., Schick, K., Hart, W.K., White, T.D., WoldeGabriel, G., Walter, R.
C., Suwa, W., Asfaw, B., Vrba, E. and Selassie, Y.H., 1994. African Homo erectus: old
radiometric ages and young Oldowan assemblages in the Middle Awash Valley, Ethiopia.
Science 264, 1907-10.
Copes, L. 2012. Comparative and experimental investigations of cranial robusticity in mid-
Pleistocene hominins. Ph.D. dissertation, Arizona State University, USA.
Crawford, J.R., Howell, D.C., 1998. Comparing an individual’s test score against norms
derived from small samples. The Clinical Neuropsychologist 12, 482-486.
Curnoe, D., Brink, J., 2010. Evidence of pathological conditions in the Florisbad cranium. J.
Hum. Evol. 59, 504-513.
Curnoe, D., Green, H., 2013. Vault thickness in two Pleistocene Australian crania. J. Archaeol.
Sci. 40, 1310-1318.
Dean, M.C., 1988. Another look at the nose and the functional significance of the face and
nasal mucous-membrane for cooling the brain in fossil hominids. J Hum Evol 17, 715-8.
Delson, E., Harvati, K., Reddy, D., Marcus, L.F., Mowbray, K., Sawyer, G.J., Jacob, T.,
Márquez, S., 2001. The Sambungmacan 3 calvaria: a comparative morphometric and
morphological analysis. Anat. Rec. 262, 380-397.

55
Dryden, I.L., 2013. Shapes: statistical shape analysis. R Package version 1.1-8.” http://cran.r-
project.org/package=shapes
Elliot Smith, G., 1928. Endocranial cast obtained from the Rhodesian skull. In: Pycraft, W.P.,
(Ed.) Rhodesian Man and associated remains, London, British Museum (Natural History).
Farke, A.A., 2010. Evolution and functional morphology of the frontal sinuses in Bovidae
(Mammalia: Artiodactyla), and implications for the evolution of cranial pneumaticity. Zool J
Linn Soc 159, 988-1014.
Fernandez, C.L., 2004a. Forensic ethnic identification of crania: the role of the maxillary
sinus—a new approach. Am J Forensic Med Pathol 25, 302-13.
Fernandez, C.L., 2004b. Volumetric analysis of maxillary sinuses of Zulu and European crania
by helical, multislice computed tomography. J Laryngol Otol 118, 877-881.
Galaburda A.M., LeMay M., Kemper T.L., Geschwind N. 1978. Right-left asymmetries in the
brain. Science 199, 852–856.
Gauld, S.C., 1996. Allometric patterns of cranial bone thickness in fossil hominids. Am. J.
phys. Anthropol. 100, 411-426.
Grimaud-Hervé, D., 1997. L’Évolution de l’Encéphale chez Homo erectus et Homo sapiens:
Exemples de l’Asie et de l’Europe. Cahiers de Paléoanthropologie. CNRS, Paris.
Grimaud-Hervé, D., Lordkipanidze, D., 2010. The fossil hominid’s brain of Dmanisi: D 2280
and D 2282. In Yuan, M.S., Broadfield, D.C., (Eds.) “The Human Brain Evolving: A
Symposium in Honor of Professor Ralph L. Holloway”, Indiana University, Bloomington, 60-
82.
Grimaud-Hervé, D., Widianto, H., Détroit, F., Sémah, F., 2012. Comparative morphological
and morphometric description of the hominin calvaria from Bukuran (Sangiran, central Java,
Indonesia). J. Hum. Evol. 63, 637-652.

56
Grün, R., 1996. A re-analysis of electron spin resonance dating results associated with the
Petralona hominid. J Hum Evol 30, 227-41.
Hammer, O., Harper, D.A.T., Ryan, P.D., 2001. PAST: Palaeontological Statistics software
package for education and data analysis. Palaeontologia Electronica 4 (1) 9 p.
Harvati, K., 2007. 100 years of Homo heidelbergensis - life and times of a controversial taxon.
Mitteilungen der Gesellschaft für Urgeschichte 16, 85-94.
Hill, C.A., 2008. Evolutionary and developmental history of temporal bone pneumatization in
hominids. Ph.D. Dissertation, Pennsylvania State University, USA.
Hill, C.A., Richtsmeier, J.T., 2008. A quantitative method for the evaluation of three-
dimensional structure of temporal bone pneumatization. J Hum Evol 55, 682-690.
Hill, C.A., 2011. Ontogenetic changes in temporal bone pneumatization in humans. Anat rec 7,
1103-1115.
Holloway, R.L., Broadfield, D.C., Yuan, M.S., 2004. The human fossil record. In: Holloway,
R., Broadfield, D.C., Yuan, M.S., Schwartz, J.H., Tattersall, I. (Eds.), The Human Fossil
Record. Brain Endocasts: The Paleoneurological Evidence, volume 3. Wiley-Liss, Hoboken,
315 pp
Holton, N., Yokley, T., Butaric, L., 2013. The morphological interaction between the nasal
cavity and maxillary sinuses in living humans. Anat Rec 296, 414-26.
Hublin, J.J., 1978. Le torus occipital transverse et les structures associées: évolution dans le
genre Homo. Ph.D. Dissertation, Université Paris VI, France.
Hublin, J.J., 2009. The origin of Neandertals. Proc. Natl. Acad. Sci. 106, 16022-16027.
Indriati, E., Antón, S.C., 2010. The calvaria of Sangiran 38, Sendangbusik, Sangiran Dome,
Java. Homo 61, 225-243.

57
Irmak, M.K., Korkmaz, A., Erogul, O., 2004. Selective brain cooling seems to be a mechanism
leading to human craniofacial diversity observed in different geographical regions. Med
Hypoth 63, 974-9.
Kappelman, J., Alçiçek, M.C., Kazanci, N., Schultz, M., Özkul, M., Şen, Ş., 2008. First Homo
erectus from Turkey and implications for migrations into temperate Eurasia. Am. J. phys.
Anthropol. 135, 110-116.
Kennedy, G.E., 1991. On the autapomorphic traits of Homo erectus. J. Hum. Evol. 20, 375-
412.
Kennedy, K.A.R., Sonakia, A., Chiment, J. Verma, K.K., 1991. Is the Narmada hominid an
Indian Homo erectus? Am. J. phys. Anthropol. 86, 475-496.
Kertesz A, Polk M, Black SE, Howell J 1990. Sex, handedness, and the morphometry of
cerebral asymmetries on magnetic resonance imaging. Brain Res 530, 40–48.
Klein, R.G. 1973. Geological Antiquity of Rhodesian Man. Nature, 244, 311-2.
Klein, R.G., 2009. The human career: human biological and cultural origins. Chicago:
University of Chicago Press.
Lacy, S.A., 2014. The oral pathological conditions of the Broken Hill (Kabwe) 1 cranium. Int.
J. Paleopathology 7, 57-63.
Koppe, T., Nagai, H., Rae, T.C., 1999a. Factors in the evolution of the primate paranasal
sinuses. In: T. Koppe, H. Nagai and K. W. Alt (Eds.). The paranasal sinuses of higher
primates: development, function and evolution. Quintessence: Chicago. pp. 151-175.
Koppe, T., Rae, T.C., Swindler, D.R., 1999b. Influence of craniofacial morphology on primate
paranasal pneumatization. Ann Anat 181, 77-80.

58
Le Cabec, A., Gunz, P., Kupczik, K., Braga, J. Hublin, J.J. (2013) Anterior Tooth Root
Morphology and Size in Neanderthals: Taxonomic and Functional Implications. J. Hum. Evol.
64, 169-193.
Le Gros Clark, W.E., 1964. The Fossil Evidence for Human Evolution: an Introduction to the
Study of Paleoanthropology. 2nd edition. University of Chicago Press, Chicago.
LeMay M., 1977. Asymmetries of the skull and handedness. J Neurol Sci 32, 243–253.
Lumley de, M.A., Gabounia, L, Vekua, A., Lordkipanidze, D., 2006. Les restes humains du
Pliocène final et du début du Pléistocène inférieur de Dmanissi, Géorgie (1991-2000). I – les
crânes, D 2280, D2282, D 2700. L’anthropologie 110, 1-110.
Lund, V.J., 1988. The maxillary sinus in the higher primates. Acta Oto-Laryngol 105: 163-171.
Lundberg, J.O., 2008. Nitric oxide and the paranasal sinuses. Anat Rec 291, 1479-84.
Manzi, G. 2016. Humans of the Middle Pleistocene: the controversial calvarium from Ceprano
(Italy) and its significance for the origin and variability of Homo heidelbergensis. Quat Int 411,
254-261.
Manzi, G., Bruner, E., Passarello, P., 2003. The one-million-year-old Homo cranium from
Bouri (Ethiopia): a reconsideration of its H. erectus affinities. J Hum Evol 44, 731-736.
Marsh, H.E., 2013. Beyond thick versus thin: mapping cranial vault thickness patterns in recent
Homo sapiens. Ph.D. dissertation, University of Iowa, USA.
Millard, A. R., 2008. A critique of the chronometric evidence for hominid fossils: I. Africa and
the Near East 500-50 ka. J Hum Evol 54, 848–874.
Moore, N.C., Skinner, M.M., Hublin, J.J., 2013. Premolar root morphology and metric
variation in Pan troglodytes verus. Am J Phys Anthropol 150, 632-646.

59
Moore, N.C., Hublin, J.J., Skinner, M.M., 2015. Premolar root and canal variation in extant
non-human hominoidea. Am J Phys Anthropol 158, 209-226.
Moss, M.L., Young, R.W., 1960. Functional approach to craniology. Am J Phys Anthropol 18,
281-92.
Montgomery, P.Q., Williams, H.O.L., Stringer, C.B., 1994. An Assessment of the Temporal
Bone Lesions of the Broken Hill Cranium. J Archaeol Sci 21, 331-337.
Mounier, A., 2009. The validity of the taxon Homo heidelbergensis Schoetensack, 1908. PhD
thesis, Université de la Mediterranée, Marseille.Mounier, A., Marchal, F., Condemi, S., 2009.
Is Homo heidelbergensis a distinct species? New insight on the Mauer mandible. J Hum Evol
56, 219-46
Oakley, K.P., Campbell, B.G., Molleson, T.I. 1977. Catalogue of fossil hominids. Part I:
Africa. Second edition. London, The Trustees of The British Museum (Natural History).
Palmer, A.R., 1994. Fluctuating asymmetry analyses: A primer. In: Markow, T.A. (Ed.),
Developmental Instability: Its Origins and Evolutionary Implications. Kluwer Academic
Publishers, Dordrecht, pp. 335e364.
Pope, G.G., 1992. Craniofacial evidence for the origin of modern humans in China. Yearb.
Phys. Anthropol. 35, 243-298.
Potts, R., Behrensmeyer, A.K., Deino, A., Ditchfield, P., Clark, J., 2004. Small mid-
Pleistocene hominin associated with East African Acheulean technology. Science 305, 75-78.
Prossinger, H., Seidler, H., Wicke, L., Weaver, D., Recheis, W., Stringer, C., Müller, G., 2003.
Electronic removal of encrustations inside the Steinheim cranium reveals paranasal sinus
features and deformations, and provides a revised endocranial volume estimate. Anat Rec
273B, 132-42.

60
Pycraft, W.P., 1928. Rhodesian Man and associated remains, London, British Museum
(Natural History).
Rae, T.C., 1999. The maxillary sinus in primate paleontology and systematics. In: T. Koppe, H.
Nagai, K.W. Alt (Eds.). The paranasal sinuses of higher primates. Quintessence: Chicago. pp.
177-89.
Rae, T.C., Koppe, T., 2000. Isometric scaling of maxillary sinus size in Hominoidea. J Hum
Evol 38: 411-423.
Rae, T.C., Koppe, T., Stringer, C.B., 2011. The Neanderthal face is not cold adapted. J Hum
Evol 60: 234-9.
Rightmire, G.P., 1996. The human cranium from Bodo, Ethiopia: Evidence for speciation in
the middle Pleistocene? J Hum Evol 31, 21-39.
Rightmire, G.P., 1998. Human evolution in the Middle Pleistocene: the role of Homo
heidelbergensis. Evol Anthropol 6, 218-27.
Rightmire, G.P., 2001. Patterns of hominid evolution and dispersal in the middle Pleistocene.
Quat. Internat. 75, 77-84.
Rightmire, G.P., 2004. Brain size and encephalization in early to mid-pleistocene Homo. Am.
J. Phys. Anthropol. 124, 109-123.
Rightmire, G.P., Lordkipanidze, D., Vekua, A., 2006. Anatomical descriptions, comparative
studies and evolutionary significance of the hominin skulls from Dmanisi, Republic of
Georgia. J. Hum. Evol. 50, 115-141.
Rightmire, G.P., 2008. Homo in the middle Pleistocene: hypodigms, variation, and species
recognition. Evol Anthropol 17, 8-21.

61
Rightmire, G.P. 2013. Homo erectus and Middle hominins: brain size, skull form, and species
recognition. J Hum Evol, 65, 223-52.
Rightmire, G.P. 2017. Middle Pleistocene Homo Crania from Broken Hill and Petralona:
Morphology, Metric Comparisons, and Evolutionary Relationships. In Human Paleontology
and Prehistory. Springer International Publishing, pp. 145-159.
Rohlf, F.J., TpsRelw v1.46. Department of ecology and evolution, State University of New
York. http://life.bio.sunysb.edu.morph/, 2008
Rohlf, F.J., 2009.TpsDig v2.14. Department of ecology and evolution, State University of New
York. http://life.bio.sunysb.edu.morph/.
Rosas, A., Peña, A., Garcia-Tabernero, A., Bastir, M., De la Rasilla, M., Fortea, J., 2008.
Endocranial occipito-temporal anatomy of the SD-1219 fossil from the El Sidrón Neandertals.
Anat. Rec. 291, 502–512.
Schwartz, G.T., Thackeray, J.F., Reid, C. Van Reenan, J.F., 1998. Enamel thickness and the
topography of the enamel-dentine junction in South Africa Plio-Pleistocene hominids with
special reference to the Carabelli trait. J. Hum. Evol. 35, 523-542.
Santa Luca, A.P., 1978. A re-examination of presumed Neandertal-like fossils. J. Hum. Evol.
7, 619-636.
Scheuer, L., Black, S., 2000. Developmental juvenile osteology. Academic Press, San Diego.
Schlager, S., Morpho: calculations and visualisations related to geometric morphometrics. R
Package version 0.25-1. http://cran.r-project.org/package=Morpho, 2013
Schulter, F.P., 1976. A comparative study of the temporal bone in three populations of man.
Am. J. Phys. Anthropol. 44, 453-468.
Schulter-Ellis, F.P., 1979. Population differences in cellularity of the mastoid process. Acta
Oto-laryngol. 87, 461-465.

62
Schwartz, J.H., Tattersall, I. 2002. The human fossil record. Volume Two. Craniodental
morphology of genus Homo (Africa and Asia), New York, John Wiley and Sons, Inc.,
Publications.
Schwartz, J.H., Tattersall, I., 2010. Fossil evidence for the origin of Homo sapiens. Yrbk. Phys.
Anthropol. 53, 94-121.
Seidler, H., Falk, D., Stringer, C., Wilfing, H., Muller, G.B., zur Nedden, D., Weber, G.W.,
Reicheis, W., Arsuaga, J.L., 1997. A comparative study of stereolithographically modelled
skulls of Petralona and Broken Hill: Implications for future studies of middle Pleistocene
hominid evolution. J Hum Evol 33, 691-703.
Shea, B.T., 1977. Eskimo craniofacial morphology, cold stress and maxillary sinus. Am J Phys
Anthropol 47, 289-300.
Smith, F.H., 1976. On anterior tooth wear at Krapina and Ochoz. Curr. Anthropol. 17,
167-168.
Smith, F.H., Paquette, S.P., 1989. The Adaptive Basis of Neandertal Facial Form, with Some
Thoughts on the Nature of Modern Human Origins. In: The Emergence of Modern Humans.
Cambridge University Press, Cambridge, pp. 181-210.
Smith, T.M., Olejniczak, A.J., Zermeno, J.P., Tafforeau, P., Skinner, M.M., Hoffmann, A.,
Radovčić, J., Toussaint, M., Kruszynski, R., Menter, C., Moggi-Cecchi, J. 2012. Variation in
enamel thickness within the genus Homo. J. Hum. Evol. 62, 395-411.
Sokal, R.R., Rohlf, J.F., 1995. Biometry. San Francisco, CA: W.H. Freeman.
Spoor, F., Zonneveld, F., 1993. The bony labyrinth in Homo erectus: a preliminary report.
Cour. Forsch.-Inst. Senckenberg 171: 251-256.

63
Spoor, F., Jeffery, N., Zonneveld, F., 2000. Using diagnostic radiology in human evolutionary
studies. J. Anat. 197: 61-76.
Stringer, C.B., 1983. Some further notes on the morphology and dating of the Petralona
hominid. J Hum Evol 12, 731-42.
Stringer, C., 1984. The definition of Homo erectus and the existence of the species in Africa
and Europe. Cour. Forsch.-Inst. Senckenberg 69, 131-44.
Stringer, C. 1985. Middle Pleistocene hominid variability and the origin of Late Pleistocene
humans. In: Delson, E. (Ed.) Ancestors: the hard evidence. New York: Alan R. Liss.
Stringer, C.B., 2002. Modern human origins: progress and prospects. Philos T Roy Soc B 357,
563-79.
Stringer, C. 2012a. The status of Homo heidelbergensis (Schoetensack 1908). Evol Anthropol,
21, 101-7.
Stringer, C., 2012b. Evolution: what makes a modern human. Nature 485, 33-35.
Stringer, C., 2013. Lone survivors, New York, Times Books.
Stringer, C.B., Buck, L.T., 2014. Diagnosing Homo sapiens in the fossil record. Ann Hum Biol
41, 312-322.
Tillier, A.M., 1975. Les sinus craniens chez les hommes actuels et fossiles: essai
d'interpretation. Doctorat de 3eme Cycle. Univerisite de Paris VI, Paris.
Tillier, A.M., 1977. La pneumatisation du massif cranio-facial chez les hommes actuels et
fossiles. Bull. Mém. Soc. Anthrop. Paris 4, XIII, 177-189.
Vinyard, C.J., Smith, F.H., 1997. Morphometric relationships between the supraorbital region
and frontal sinus in Melanesian crania. Homo 48, 1-21.

64
Virapongse, C., Sarwar, M., Bhimani, S., Sasaki, C., Shapiro, R., 1985. Computed tomography
of temporal bone pneumatization: 1. Normal pattern and morphology. Am. J. Roentgenol. 147,
473-481.
Weidenreich, F., 1943. The skull of Sinanthropus pekinensis: a comparative study of a
primitive hominid skull. Palaeont. Sinica D10, 1-484.
Witmer, L.M., 1997. The evolution of the antorbital cavity of archosaurs: a study in soft-tissue
reconstruction in the fossil record with an analysis of the function of pneumaticity. J Vert
Paleontol 17, 1-74.
Wolfowitz, B.L, 1974. Pneumatization of the skull of the South African negro. Ph.D.
Dissertation, University of the Witwatersrand, Johannesburg, South Africa.
Wood, B., 1984. The origin of Homo erectus Cour. Forsch-Inst. Senckenberg 69, 389-406.
Wood, B. (ed.) 2011. Wiley-Blackwell encyclopedia of human evolution, Oxford: Blackwell
Publishing Ltd.
Woodward, A.S., 1921. A New Cave Man from Rhodesia, South Africa. Nature 108, 371-2.
Zonneveld, F., 1987. Computed Tomography of the temporal bone and orbit. Urban &
Schwarzenberg, Munich.
Wu, X., Athreya, S. 2013. A description of the geological context, discrete traits, and linear
morphometrics of the Middle Pleistocene hominin from Dali, Shaanxi Province, China. Am. J.
Phys. Anthropol. 150, 141-157.
Zollikofer, C., Ponce de León, M., Schmitz, R. and Stringer, C., 2008. New insights into Mid-
Late Pleistocene fossil hominin paranasal sinus morphology. Anat Rec 291, 1506-16.
Zollikofer, C.P.E., Weissmann, J.D. 2008. A morphogenetic model of cranial pneumatization
based on the invasive tissue hypothesis. Anat Rec 11, 1446-54.

65
Figure 1. BH1 cranium. Left to right: norma frontalis, norma lateralis left, norma occipitalis.
© The Trustees of the Natural History Museum, London.
Figure 2. Illustration of the mid-sagittal plane for BH1 and variations in the thickness (in mm)
of the cranial vault along the mid-sagittal plane. The cranial thickness is quantified from the
glabella (G), through bregma (B), lambda (L) to the foramen magnum (opisthion: O), the

66
graphic representation of the data corresponds to the successive landmarks from left to right.
Values for the thickness of the internal table (below), diploic layer and external table (above)
are also given when measurable. The area labelled sinus corresponds to the extension of the
frontal sinus, the breakage of the occipital superstructures led to incomplete documentation of
the variation in bone thickness in this area.
Figure 3. 3D topographic mapping of the variation of total bone thickness rendered using a
colour chromatic scale (thickness increasing from white to yellow, corresponding to a variation
between 2 and 22 mm) in anterior, left lateral, posterior and superior views.

67
Figure 4. A. Three-dimensional reconstruction of the upper teeth of the Broken Hill 1
specimen. Scale: 1 cm. In yellow: the tooth; in red: the pulp cavity; UI1: upper central incisor;
UI2: upper lateral incisor; UC: upper canine; UP3: upper third premolar; UP4: upper fourth
premolar; UM1: upper first molar; UM2: upper second molar; UM3: upper third molar. B.
Virtual cutting protocol with two planes for the upper central incisor. Scale: 1 cm.
Figure 5. Extent measurements of BH’s sinuses as measured on 3D virtual reconstruction of
microCT data rendered transparent with sinuses represented as coloured solids (see Table 5).
Craniometric landmarks indicated as yellow circles, numbered as in Table 2 (landmarks not

68
visible in figured orientation are indicated with a dashed border). Frontal sinus (shown in
magenta, figured on left hand [norma frontalis] and middle [norma lateralis] diagrams): A:
extent from glabella towards right frontomalare temporale, B: extent from glabella towards
bregma, C: extent from glabella towards left frontomalare temporale, D: extent from glabella
towards nasion. Left maxillary sinus (shown in blue, figured on left hand [norma frontalis] and
middle [norma lateralis] diagrams): A: extent from left alare towards nasion, B: extent from
left alare towards left zygomaxillare, C: extent from left alare towards left C/P3, D: extent from
left alare towards left molars posterior. Sphenoidal sinus (shown in green, figured on right
hand [norma basilaris] diagram): A: extent from hormion towards right foramen ovale pos., B:
extent from hormion towards prosthion, C: extent from hormion towards left foramen ovale
pos., D: extent from hormion towards basion. Not to scale.
Figure 6. Virtual reconstruction of BH1 cut away to display sinuses sectioned out and shown as
coloured volumes (colours as in Figure 5). Not to scale.

69
Figure 7. MicroCT slices through BH1 exposing sectioned out sinuses, which are shown as
solid, coloured volumes. Top right: virtual reconstruction from CT data with coloured lines
showing slice locations. White: transverse slice showing frontal sinus, red: transverse slice
showing maxillary and sphenoidal sinuses, blue: sagittal slice showing frontal, maxillary and
sphenoidal sinuses from right (left hand slice) and left (right hand slice) slides. Not to scale.

70
Figure 8. The left temporal bone of BH1 and 3D reconstructions in left lateral and endocranial
views where the bones are shown in grey; pneumatisation is visible by transparency and is
shown in darker colour as well as the cochlea and semi-circular canals.

71
Figure 9. 3D models of the endocast of BH1 in superior and left lateral views. Representation
in antero-lateral views of the 3D reconstructions of the skull shown by transparency and of the
endocast.

72
Figure 10. 3D topographic mapping of the variation of total bone thickness rendered using a
chromatic scale (thickness increasing from white to black, corresponding to a variation
between 2 and 22 mm) in left and superior views in BH1, Petralona, Cro-Magnon 1, La
Ferrassie 1 and Sangiran 2.

73
Figure 11. All preserved sinuses in (left to right) Bodo and Petralona. Frontal: magenta, right
maxillary: red, left maxillary: blue, sphenoidal: green. Not to scale.
Figure 12. First and second principal components (representing respectively 47% and 22.8% of
the total variance) computed on the size-corrected variables maximum length of the endocast
(MLE), maximum width (MWE), maximum height above the maximal length (MHlE), frontal
chord (FalC), parietal chord (PalC) and occipital chord (OalC). The black circles correspond to
the recent modern humans, the dark grey circles to the fossil Homo sapiens and the light grey
circles to the fossil hominins. BH1 corresponds to the large grey square.

74
Figure 13. First and second principal components of the two-dimensional geometric
morphometrics analysis of the exo and endocranial vaults in the skull's mid-sagittal plane for
the complete sample of hominins and Homo sapiens (n=73). Visualisation of shape change
along axes 1 and 2: circles=minimum conformation, arrowtips= maximum conformation, red
points=fixed landmarks.
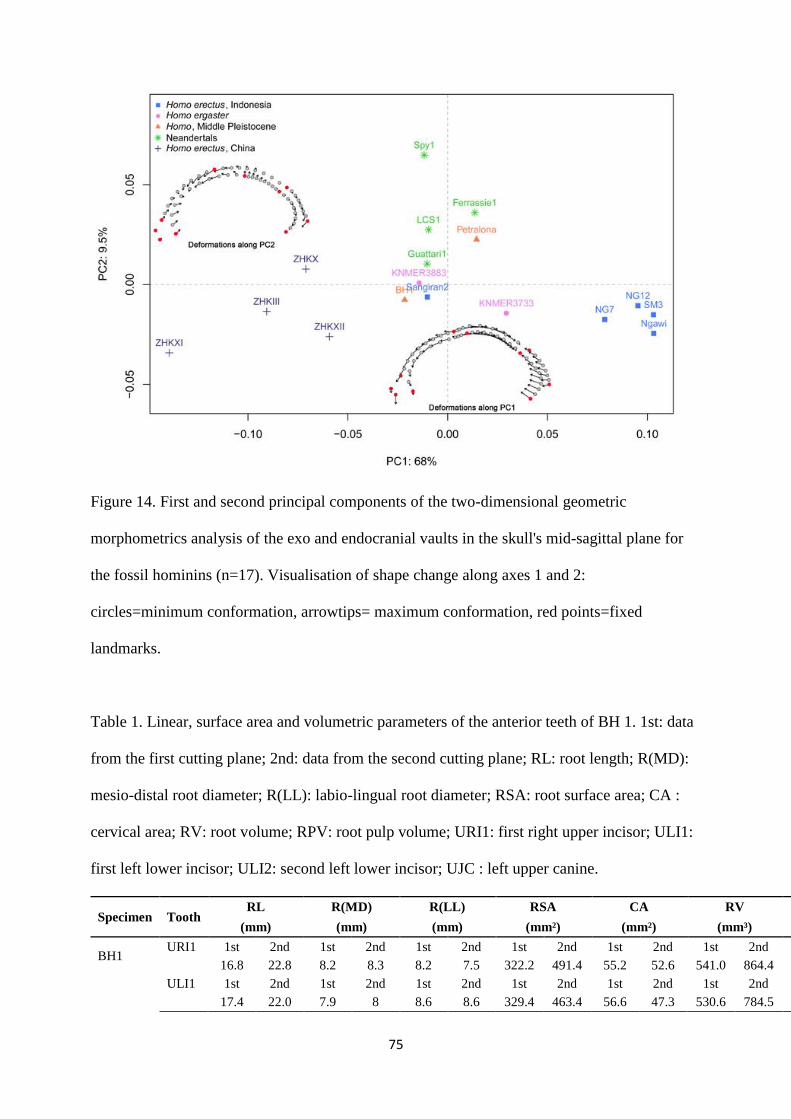
75
Figure 14. First and second principal components of the two-dimensional geometric
morphometrics analysis of the exo and endocranial vaults in the skull's mid-sagittal plane for
the fossil hominins (n=17). Visualisation of shape change along axes 1 and 2:
circles=minimum conformation, arrowtips= maximum conformation, red points=fixed
landmarks.
Table 1. Linear, surface area and volumetric parameters of the anterior teeth of BH 1. 1st: data
from the first cutting plane; 2nd: data from the second cutting plane; RL: root length; R(MD):
mesio-distal root diameter; R(LL): labio-lingual root diameter; RSA: root surface area; CA :
cervical area; RV: root volume; RPV: root pulp volume; URI1: first right upper incisor; ULI1:
first left lower incisor; ULI2: second left lower incisor; UJC : left upper canine.
Specimen Tooth RL R(MD) R(LL) RSA CA RV RPV R(MD)/R(LL)
(mm) (mm) (mm) (mm²) (mm²) (mm³) (mm³) -
BH1 URI1 1st 2nd 1st 2nd 1st 2nd 1st 2nd 1st 2nd 1st 2nd 1st 2nd 1st 2nd
16.8 22.8 8.2 8.3 8.2 7.5 322.2 491.4 55.2 52.6 541.0 864.4 0.3 8.2 1.0 0.9
ULI1 1st 2nd 1st 2nd 1st 2nd 1st 2nd 1st 2nd 1st 2nd 1st 2nd 1st 2nd
17.4 22.0 7.9 8 8.6 8.6 329.4 463.4 56.6 47.3 530.6 784.5 11.5 21.3 1.1 1.1

76
ULI2 19.1 6.2 8.0 369.0 43.2 567.3 13.8 1.3
ULC 24.6 7.4 10.0 540.1 59.9 914.2 31.2 1.4
Table 2. Landmarks used in sinus extent measurements (see Figure 5).
Landmark Number
Bregma 1
Glabella 2
Left frontomalare temporal 3
Right frontomalare temporal 4
Nasion 5
Left alare 6
Left zygomaxillare 7
Left C/P3 8
Left molars pos. 9
Prosthion 10
Hormion 11
Left foramen ovale pos. 12
Right foramen ovale pos. 13
Basion 14
Table 3. Definitions of endocranial measurements and values (in mm for all measurements
except the surface data, which are in mm2) for BH1 (see Grimaud-Hervé, 1997; Balzeau et al.,
2103, 2014 for complete definitions and illustrations).
Abbreviation Definition Measurement
MLE Maximum length (PCA) 172
MWE Maximum width (PCA) 137
WSE Maximum width measured at the supramarginal gyri 123
WPfE Maximum width measured at the foot of the 2nd parietal convolutions 125
WBcE Maximum width measured at Broca's cap 101
WOfE Maximum width measured at the orbital part of the 3rd frontal convolutions 78
WFfE Maximum width measured at the foot of the 3rd frontal convolutions 108
BBHE Endobasion-endobregma height 120

77
BVHE Endobasion-endovertex height 119
MHlE Maximum height above the maximal length (PCA) 51.5
BHlE Height of endobregma above the maximum length 49.5
FalC Frontal chord (between the base of encephalic rostrum and the intersection
between the central sulci and the interhemispheric fissure) 114.5
PalC
Parietal chord (between the intersection between the central sulci and the
interhemispheric fissure and the intersection between the perpendicular sulci
and the interhemispheric fissure)
63
OalC Occipital chord (between the intersection between the perpendicular sulci and
the interhemispheric fissure and the posterior interhemispheric point) 57
S Fal Surface of the frontal lobe (values for right and left sides) 73.5/69.8
S PTal Surface of the parieto-temporal lobes (left side) 94.6
S Oal Surface of the occipital lobe (left side) 32
Table 4. Cranial vault thickness (in mm) of BH1 at some specific points. Values are means of
several points near the landmark (see text). G: glabella, B: bregma, L: lambda.
Landmark CVT (in mm) Side
Bregma 9.4
Mid G/B 8.1
Lambda 11.7
Pterion 6.2 Left 6.1 Right
Asterion 12.7 Left
Stephanion 7.8 Left 7.9 Right
Parietal
eminence 11.2 Left
10 Right
Mid B/L 8.8

78
Table 5. Sinus metrics for BH1. Vol : volume (mm3), SA : surface area (mm2), S/V : surface area to volume ratio.
Sinus Frontal L. maxillary R. maxillary Sphenoidal
Measurement Vol SA S/V Vol SA S/V Vol SA S/V Vol SA S/V
38478.6 14604.1 0.4 38050.7 8142.3 0.21 39978 9079.2 0.2 16466 6847.7 0.4

79
Table 6. Measurements of sinus extents for BH 1 (mm) – see Figure 5.
Measurement Sinus
Frontal L.
Maxillary Sphenoidal
Glabella towards bregma 50.1 Glabella towards l. frontomalare temporale 51.5 Glabella towards r. frontomalare temporale 42.9
Glabella towards nasion 29.0
L. alare towards nasion 28.2 L. alare towards C/P3 28.1
L. alare towards l. zygomaxillare 47.3 L. alare towards l. molars posterior 52.7
Hormion towards l. foramen ovale 30.8
Hormion towards r. foramen ovale 39.3
Hormion towards basion 19.2
Hormion towards prosthion 19.9

80
Table 7. Linear, surface area and volumetric parameters of the comparison sample (from Le Cabec et al., 2013). RL: root length; R(MD): mesio-
distal root diameter; R(LL): labio-lingual root diameter; RSA: root surface area; CA: cervical area; RV: root volume; RPV: root pulp volume; UI:
upper incisor; UC: upper canine; BH: Broken Hill; EMH: early modern humans; NEA: Neandertals; UPEPIH: Upper Palaeolithic and
Epipaleolithic/Mesolithic humans; RMH: recent modern humans.
Tooth Taxa n RL R(MD) R(LL) RSA CA RV RPV R(MD)/R(LL)
(mm) (mm) (mm) (mm²) (mm²) (mm³) (mm³) -
UI1 African H. erectus 1 20.35 8.53 8.56 407.49 59.86 664.10 49.62 1.0
Asian H. erectus 1 15.40 7.23 6.62 269.06 36.37 364.75 18.70 0.92
EMH 3 16.61 7.03 7.14 265.76 36.75 346.74 18.21 1.03
NEA 17 17.23 7.04 7.58 315.31 41.88 452.00 37.25 1.09
UPEPIH 6 13.50 6.81 6.86 220.25 36.04 274.95 10.87 1.01
RMH 24 12.94 5.88 6.33 192.33 29.93 225.60 8.74 1.08
UI2 African H. erectus 1 18.84 5.01 8.33 425.32 36.61 464.92 27.32 1.66
EMH 3 15.08 7.03 7.14 230.04 36.75 266.53 21.66 1.38
NEA 18 17.62 6.11 7.96 343.08 39.59 487.24 31.36 1.31
UPEPIH 6 13.70 4.78 6.20 188.35 22.90 193.01 7.74 1.3
RMH 22 12.98 4.60 5.87 172.11 22.01 172.22 6.90 1.28
UC Asian H. erectus 2 21.60 7.20 11.09 501.16 63.55 811.87 67.02 1.54
EMH 3 18.19 6.26 8.74 315.30 42.53 426.43 28.79 1.39
NEA 12 22.51 6.18 9.35 454.30 46.18 650.57 36.65 1.51
UPEPIH 8 16.90 5.71 8.68 278.24 27.11 343.56 16.36 1.52
RMH 12 16.07 5.31 7.63 254.20 21.97 308.10 9.54 1.44

81
Table 8. Size-corrected sinus measurements using G-FMT (glabella to frontomalare
temporale). Measurements in mm3 for volumes and mm2 for areas. Broken Hill 1
measurements taken from microCT data as above, Bodo and Petralona measured on medical
CT scans with resolutions of 0.5 x 0.5 x 1mm and 1 x 1 x 1mm respectively, data from
institutions in the acknowledgements.
Frontal L. maxillary R. maxillary Sphenoidal
Specimen Vol SA Vol SA Vol SA Vol SA
BH1 84.0 245.7 83.0 137.0 87.2 152.7 35.9 115.2
Bodo 145.1 243.3 123.8 159.5
Petralona 208.73 378.94 141.23 177.36
Table 9. Size-corrected surface area to volume ratio for each preserved sinus for Broken Hill 1,
Bodo and Petralona.
Specimen Frontal L.
maxillary
R.
maxillary Sphenoidal
S/V S/V S/V S/V
BH1 2.93 1.65 1.75 3.21
Bodo 1.68 1.29
Petralona 1.82 1.26
Supplementary information: complete landmark description of the skull including definition of
the landmarks and their coordinates