Stages and Decision Nodes in the British Accounting Review ...

The influence of total nodes examined, number of positivenodes, and lymph node ratio on survival after surgical resectionand adjuvant chemoradiation for pancreatic cancer: Asecondary analysis of RTOG 9704
Timothy N. Showalter1, Kathryn A. Winter2, Adam C. Berger3, William F. Regine4, Ross A.Abrams5, Howard Safran6, John P. Hoffman7, Al B. Benson8, John S. MacDonald9, andChristopher G. Willett10
1Department of Radiation Oncology, Jefferson Medical College, Thomas Jefferson University,Philadelphia, PA2Radiation Therapy Oncology Group, RTOG Statistical Center, Philadelphia, PA3Department of Surgery, Jefferson Medical College, Thomas Jefferson University, Philadelphia,PA4Department of Radiation Oncology, University of Maryland Medical Center, Baltimore, MD5Department of Radiation Oncology, Rush University Medical Center, Chicago, IL6Department of Medicine, The Miriam Hospital, Brown University Oncology Group, Providence, RI7Department of Surgical Oncology, Fox Chase Cancer Center, Philadelphia, PA8Division of Hematology-Oncology, Northwestern University, Chicago, IL9St. Vincent’s Cancer Care Center, New York, NY10Department of Radiation Oncology, Duke University Medical Center, Durham, NC
AbstractPurpose—Lymph node status is an important predictor of survival in pancreatic cancer. Weperformed a secondary analysis of RTOG 9704, an adjuvant chemotherapy and chemoradiationtrial, to determine the influence of lymph node factors-number of positive nodes (NPN), totalnodes examined (TNE), and lymph node ratio (LNR-ratio of NPN to TNE)-on OS and disease-freesurvival (DFS).
Patient and Methods—Eligible patients from RTOG 9704 form the basis of this secondaryanalysis of lymph node parameters. Actuarial estimates for OS and DFS were calculated usingKaplan-Meier methods. Cox proportional hazards models were performed to evaluate associations
© 2010 Elsevier Inc. All rights reserved.Corresponding Author: Adam C. Berger, MD, Department of Surgery Thomas Jefferson University, 1100 Walnut Street, MOB, Suite500; Philadelphia, PA 19107; Phone: (215) 955-1622 ; Fax: (215) 923-8222 ; [email protected] in part at these meetings: 2008 Annual Meeting of the American Society for Radiation Oncology (ASTRO) in Boston,Massachusetts; 2007.American Society of Clinical Oncology GI Cancer Symposium in Orlando, Florida.Conflict of Interest Notification: The authors have no actual or potential conflicts of interest.Publisher's Disclaimer: This is a PDF file of an unedited manuscript that has been accepted for publication. As a service to ourcustomers we are providing this early version of the manuscript. The manuscript will undergo copyediting, typesetting, and review ofthe resulting proof before it is published in its final citable form. Please note that during the production process errors may bediscovered which could affect the content, and all legal disclaimers that apply to the journal pertain.
NIH Public AccessAuthor ManuscriptInt J Radiat Oncol Biol Phys. Author manuscript; available in PMC 2012 December 1.
Published in final edited form as:Int J Radiat Oncol Biol Phys. 2011 December 1; 81(5): 1328–1335. doi:10.1016/j.ijrobp.2010.07.1993.
NIH
-PA Author Manuscript
NIH
-PA Author Manuscript
NIH
-PA Author Manuscript

of NPN, TNE, and LNR with OS and DFS. Multivariate Cox proportional hazards models werealso performed.
Results—There were 538 patients enrolled in the RTOG 9704 trial. Of these, 445 patients wereeligible with lymph nodes removed. Overall median NPN was 1 (min-max, 0-18). Increased NPNwas associated with worse OS (HR=1.06, p=0.001) and DFS (HR=1.05, p=0.01). In multivariateanalyses, both NPN and TNE were associated with OS and DFS. TNE > 12, and >15, wereassociated with increased OS for all patients, but not for node-negative patients (n =142).Increased LNR was associated with worse OS (HR=1.01, p<0.0001) and DFS (HR=1.006,p=0.002).
Conclusion—In patients who undergo surgical resection followed by adjuvant chemoradiation,TNE, NPN, and LNR are associated with OS and DFS. This secondary analysis of a prospective,cooperative group trial supports the influence of these lymph node parameters on outcomes aftersurgery and adjuvant therapy using contemporary techniques.
Keywordslymph node; nodal ratio; pancreatic cancer; radiation therapy; pancreaticoduodenectomy
INTRODUCTIONDespite aggressive treatment, cancer mortality rates remain high for pancreatic cancer (PC)patients. In 2009, it was estimated that 42,470 people would be diagnosed with PC and that35,240 deaths would occur as a result of PC (1). In an effort to improve survival for patientswith resectable PC, adjuvant therapy is offered after definitive surgery. Postoperativechemotherapy (CT) and chemoradiotherapy (CRT) have improved survival in randomizedtrials, but trial results are conflicting, and there is controversy regarding the optimal adjuvantregimen (2-7). In the United States, CRT is commonly included in standard adjuvantapproaches after surgery for resectable PC. The use of CRT is supported by the frequencyand location of postoperative recurrence (8,9), and by results from single institutions andlarge databases (2,10-13). The Radiation Therapy Oncology Group (RTOG) conducted anintergroup trial, RTOG 9704, which enrolled PC patients after surgical resection andrandomized patients to one of two CT regimens, containing gemcitabine (Gem) versus 5-fluorouracil (5-FU), before and after CRT with 5-FU. The results were reported recently andsuggested a 3-year survival benefit for the addition of Gem CT, versus 5-FU CT, to 5-FUbased CRT (14).
Several factors have been associated with outcomes after adjuvant therapy for resected PC.These prognostic factors include tumor size, tumor stage, surgical margin status, CA 19-9levels, and lymph node status (13,15-17). The influence of postoperative CA 19-9 levels onoutcomes in RTOG 9704 has been reported (18). In the primary report of RTOG 9704,lymph node positivity was associated with worse overall survival (OS), with hazard ratio(HR) of 1.53 (p=0.001) (14). Number of positive nodes (NPN), total nodes examined (TNE),and lymph node ratio (LNR) are three lymph node parameters that have been associatedwith survival after surgery in pancreatic cancer, as well as in other gastrointestinalmalignancies. Increasing NPN has been associated with lower OS for patients with node-positive PC (19), and increasing TNE has been shown to predict for longer OS amongpatients with node-negative PC (20-22). LNR, the ratio of the NPN to the TNE, hasdemonstrated a prognostic relationship with OS for resected PC (19,23,24), as well as othergastrointestinal cancers (25-28).
Previous published reports of TNE, NPN, and LNR have examined data from singleinstitutions or large databases, including patients who received surgery alone or followed by
Showalter et al. Page 2
Int J Radiat Oncol Biol Phys. Author manuscript; available in PMC 2012 December 1.
NIH
-PA Author Manuscript
NIH
-PA Author Manuscript
NIH
-PA Author Manuscript

a variety and mixture of non-standardized adjuvant regimens. The current report is the firstanalysis of TNE, NPN, and LNR in PC for patients who received adjuvant CRT according toguidelines of a prospective trial, which included contemporary therapies and requiredprospective quality assurance of radiation therapy (29). The purpose of this secondaryanalysis is to examine the impact of NPN, TNE, and LNR on survival for a large cohort ofpatients treated with CRT on RTOG 9704, a randomized, phase III Intergroup trial.
METHODSRTOG 9704
The experimental design and primary results of the RTOG 9704 trial have been reported.(14) Patients with resectable pancreatic adenocarcinoma were entered onto the trial aftersurgery, and were stratified according to nodal status (involved vs. uninvolved), tumordiameter (< 3 cm vs. ≥ 3 cm), and surgical margins (negative vs. positive vs. unknown).Patients were randomly assigned to one of two adjuvant therapy arms, which consisted of 5-fluorouracil (5-FU) versus gemcitabine (Gem) CT delivered before and after CRT, andtreatment started between 3 and 8 weeks after surgery. All eligible patients from this studythat had lymph nodes removed are included in this secondary analysis of lymph nodeparameters, specifically NPN, TNE, and LNR (ratio of NPN to TNE).
Statistical MethodsOverall survival (OS) was measured from the date of randomization to the date of death orlast follow-up. The failure event for disease-free survival (DFS) was defined as diseaserelapse (either local or regional), distant disease (including ascites and peritoneal seeding),second primary, or death due to any cause. DFS was measured from the date ofrandomization to the date of first failure event occurrence. Reported median survival timesare the times (in years) at which the estimated survival rate reaches 50%. LNR wascalculated by dividing the number of positive lymph nodes in the surgical specimen by thenumber of lymph nodes examined. NPN, TNE and LNR were continuous variables in theanalyses. Separate analyses were performed for NPN (0 vs. 1-3 vs. >3) and TNE (0-12 vs.>12, and 0-15 vs. >15) in all patients, and for LNR in node positive patients (by thirds of thegroup: ≤15%, >15-33%, and >33%) as categorical variables. A 1-sided log-rank test for atrend in increased (decreased) OS and DFS was performed for the ordered NPN and LNRcategories.
Cox proportional hazards models were utilized to explore associations of NPN, TNE, andLNR with OS and DFS. In addition to the lymph node parameters, multivariate analysesincluded the following variables: treatment arm (Gem vs. 5-FU), age (≤ 62 vs. > 62 years),gender (female vs. male), primary tumor location (head vs. other locations), surgical T-stage(T1/T2 vs. T3/T4), tumor diameter (< 3 cm vs. ≥ 3 cm), KPS (90-100 vs. 60-80), andsurgical margin status (negative vs. positive vs. unknown). All variables were coded suchthat a hazard ratio (HR) greater than 1 indicates an increased risk for the second level of thevariable. For example, tumor diameter was coded such that a HR > 1 indicates an increasedrisk for tumors ≥ 3 cm. A backwards selection procedure was used to select variables forinclusion in the multivariate model.
RESULTSPatients
Among the 538 patients who enrolled on RTOG 9704 from 7/20/98 – 7/26/02, 451 wereeligible for the study, and of those, 445 patients had lymph nodes removed and wereincluded in these analyses. Of the 93 excluded cases, there were 85 patients deemed
Showalter et al. Page 3
Int J Radiat Oncol Biol Phys. Author manuscript; available in PMC 2012 December 1.
NIH
-PA Author Manuscript
NIH
-PA Author Manuscript
NIH
-PA Author Manuscript

ineligible for the clinical trial, 2 patients who withdrew study consent, and 6 patients whohad no lymph nodes removed. Among the 445 patients, 303 patients were node-positive and142 patients were node-negative. There were 382 patients with head-of-pancreas (HOP)tumors among the 445 patients included in this study. Patient characteristics are displayed inTable 1. T-stage was the only characteristic that showed a significant association withtreatment arm (p=0.041).
Total Nodes Examined (TNE)The median TNE was nine (min-max: 1-46) and 11 (min-max: 1-56) in the 5-FU and Gemtreatment arms, respectively. Increased TNE was not statistically significantly associatedwith improved OS (HR=0.99, 95% CI (0.97, 1.001), p=0.068) or DFS (HR=0.99, 95% CI(0.98, 1.002), p=0.113) on univariate analysis. The median OS times were 17.7 months and18.1 months for those patients with 0-12 nodes (n = 284) and > 12 nodes examined (n =161), respectively (log-rank p = 0.195). The median DFS was 10.3 months and 10.8 monthsfor patients with 0-12 nodes and > 12 nodes examined, respectively (log-rank p = 0.327).The median OS times were 16.9 months and 20.9 months for patients with 0-15 nodes (n =333) and > 15 nodes (n = 112) examined, respectively, representing a statistically significantdecrease in OS for patients with ≤15 examined nodes (log-rank p = 0.03) (Figure 1). Themedian DFS times were 10.1 months and 12.3 months for patients with ≤15 nodes and > 15nodes, respectively (log-rank p = 0.091). A separate analysis of TNE categories wasperformed for patients with negative lymph nodes (n = 142). There were no statisticallysignificant differences in OS and DFS in the 12 and 15 node cut-point groupings.
Number of Positive Nodes (NPN)Median NPN for all patients was one (min-max, 0-18). Increased NPN, as a continuousvariable, was associated with worse OS (HR=1.06, 95% CI (1.03, 1.10), p=0.001) and DFS(HR=1.05, 95% CI (1.01, 1.08), p=0.01). Two-year actuarial OS for 0, 1-3, and >3 NPN was47%, 35%, and 31%, respectively (log-rank p=0.0001) (Figure 2). Two-year actuarial DFSfor the NPN categories (0, 1-3, >3) was 33%, 22%, and 17%, respectively (log-rankp=0.003) (Figure 3).
Lymph Node Ratio (LNR)In the univariate analyses of LNR as a continuous variable, increased LNR was associatedwith decreased OS (HR=1.009, 95% CI (1.004, 1.013), p=0.0004) and DFS (HR=1.007,95% CI (1.002, 1.011), p=0.005). Analysis of LNR by categories (≤15%, 15-33%, and>33%) demonstrated a decreasing MST (16.3 months, 20.8 months, and 12.7 months) and 2-year OS with increasing LNR (39%, 38%, and 25%, respectively). The results show asignificant trend in decreased OS with increasing LNR category (p=0.0005, Figure 4), asevaluated by 1-sided log-rank test for trend. There was also a decrease in median DFS timeand 2-year DFS with increasing LNR by quartiles: 10.8 months, 10.1 months, and 8.8months , and 29%, 21%, and 12%, respectively. There was a statistically significantassociation of decreased DFS with increasing LNR (p=0.0019, Figure 5).
Multivariate AnalysesTNE and NPN as Continuous Variables—In multivariate Cox proportional hazardsmodels, after adjusting for the other variables in the models, the increase in TNE wasassociated with improved OS (HR=0.98, 95% CI (0.96, 0.99), p=0.001) and DFS (HR 0.98,95% CI (0.97, 0.996), p=0.013). On the other hand, the increase in NPN was associated withworse OS (HR=1.08, 95% CI (1.04, 1.12), p<0.0001) and DFS (HR=1.06, 95% CI (1.02,1.10), p=0.005, Table 2).
Showalter et al. Page 4
Int J Radiat Oncol Biol Phys. Author manuscript; available in PMC 2012 December 1.
NIH
-PA Author Manuscript
NIH
-PA Author Manuscript
NIH
-PA Author Manuscript

NPN as a Categorical Variable—In multivariate analyses, patients with 0 positive nodeshad better OS than patients with 1 to 3 positive nodes (HR=0.62, 95% CI (0.48, 0.81), p.0003, Table 3). There was no difference is OS, however, for patients with > 3 positive nodescompared to patients with 1 to 3 positive nodes. No association was found between NPNand DFS.
TNE as a Categorical Variable—Multivariate analyses were performed using TNE as acategorical variable. Greater than 12 nodes examined (vs. ≤12 nodes) was associated withimproved OS after adjusting for age, KPS, tumor diameter, and positive nodes (HR = 1.32,95% CI (1.05, 1.66), p = 0.019, Table 4). Greater than 12 nodes examined was notassociated with DFS (HR=1.17, 95% CI (0.95, 1.45), p=0.151) in the multivariate model(Table 3). Tumor diameter (< 3cm vs. ≥ 3 cm) (HR=1.32, 95% CI (1.07, 1.63), p=0.009)and T-stage (T1/T2 vs. T3/T4) (HR=1.39, 95% CI (1.09, 1.77), p=0.008), however, wereassociated with DFS (Table 3). Greater than 15 nodes examined (vs. ≤15 nodes) wasassociated with prolonged OS (HR=1.47, 95% CI (1.14, 1.89), p=0.003), but not DFS (HR =1.24, 95% CI (0.98, 1.58), p = 0.071, Table 5) after adjusting for all variables in the models.
In separate multivariate analyses of TNE as a categorical variable in node-negative patients(n = 142), >12 nodes examined (vs. 0-12 nodes) was not associated with OS (HR=1.26, 95%CI (0.76, 2.11, p=0.371) or DFS (HR=1.21, 95% CI (0.77, 1.92), p=0.413). Similarly, > 15nodes examined (vs. 0-15 nodes) was not associated with OS (HR=1.12, 95% CI (0.65,1.92), p=0.684) or DFS (HR=1.12, 95% CI (0.68, 1.82), p=0.660).
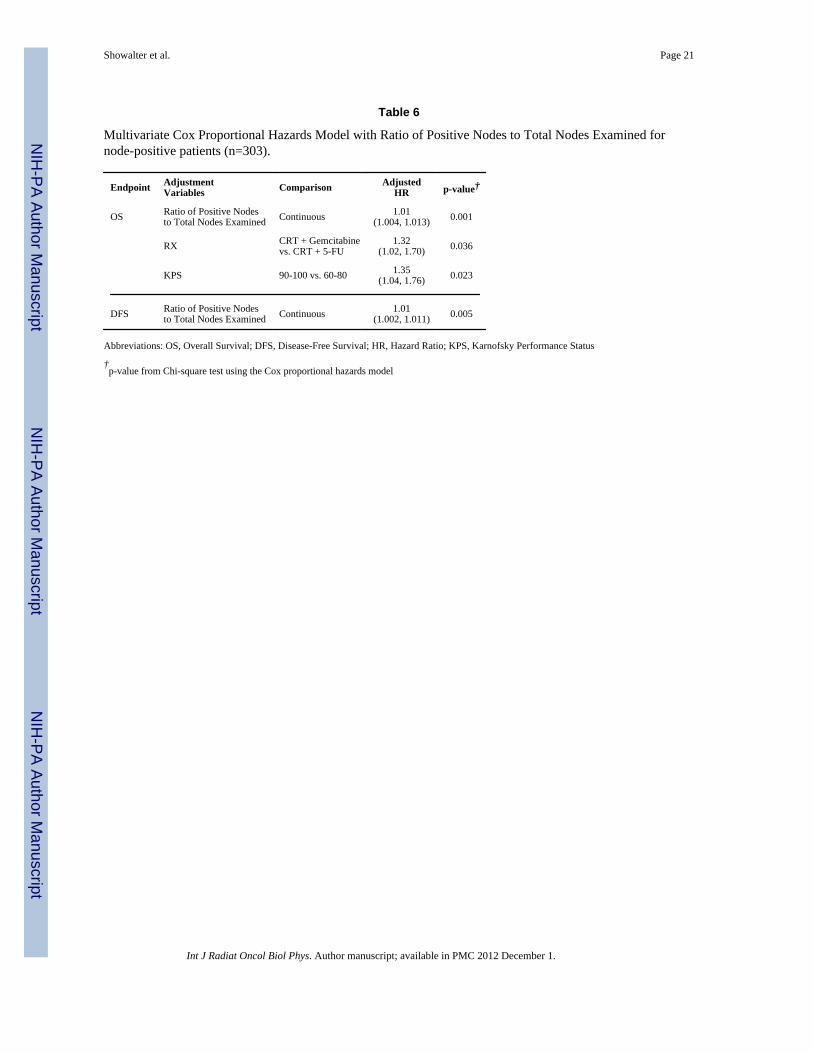
LNR as a Continuous and a Categorical Variable—In the multivariate analysis ofLNR as a continuous variable, increased LNR was associated with worse OS (HR=1.01,95% CI (1.004, 1.013), p=0.001) and DFS (HR=1.01, 95% CI (1.002, 1.011), p=0.005,Table 6). Multivariate analysis of LNR as a categorical variable demonstrated associationsof LNR >33% with worse OS and DFS (Table 7). In these models, there was an associationwith worse OS for patients on the CRT+5-FU arm when LNR was treated as eithercontinuous or categorical.
DISCUSSIONThis secondary analysis of the influence of lymph node parameters on survival for patientsenrolled on the RTOG 9704 trial confirms the associations of NPN, TNE, and LNR withsurvival in PC treated with surgery and contemporary adjuvant therapy. Previous reportsregarding the relationship of these lymph node factors with survival in PC have evaluateddata that included heterogeneous adjuvant treatments (19-22,30). The current studydemonstrates the significance of NPN, TNE, and LNR in PC patients who received protocol-based treatment with surgery followed by adjuvant CT (5-FU or Gem) and CRT.Prospective quality assurance of radiation therapy fields was required for patients enrolledon RTOG 9704. Central review of surgical and pathology reports were performed, butcentralized review of surgical specimens was not a component of the clinical trial (14). Inthe primary report of results from RTOG 9704, Gem CT improved 3-year overall survivalfor patients with head of pancreas tumors on multivariate analysis. Nodal status was alsoassociated with overall survival (HR 1.53, 95% CI (1.18, 1.97), p = 0.001) (14).
The current study provides added insight on the relationships of TNE, NPN and LNR withsurvival for patients with surgically-resected PC. This analysis is limited by the lack ofcentral pathology review and by the number of patients included, in comparison to largerdatabases, but it does add value through the evaluation of patients treated relativelyhomogeneously in the context of a prospective, clinical trial.
Showalter et al. Page 5
Int J Radiat Oncol Biol Phys. Author manuscript; available in PMC 2012 December 1.
NIH
-PA Author Manuscript
NIH
-PA Author Manuscript
NIH
-PA Author Manuscript

For PC patients treated with surgical resection followed by adjuvant chemotherapy and CRTon RTOG 9704, increased NPN was associated with worse OS and DFS, when consideredas either a continuous or a categorical variable. NPN >3, compared to 0 or 1-3 positivelymph nodes, was associated with inferior OS and DFS. Furthermore, the significantassociation of NPN with survival persisted in the multivariate analysis; patients with >3positive lymph nodes, compared to 0, were associated with inferior OS. These patients,however, were not statistically significantly different compared to patients with 1 to 3positive nodes in the multivariate analysis. Schwarz and Smith identified a similarrelationship between NPN and overall survival in their evaluation of the Surveillance,Epidemiology, and End Results (SEER) database (20). They did not report an NPN cut-pointthat could be used to define discrete prognostic groups. House et al. observed a lineardecrease in OS with increasing NPN from 1 to 8 nodes positive using a single-institutiondatabase; two positive nodes was their most effective cut-point for determining prognosisbased on NPN (19). Therefore, the present analysis of patients enrolled on RTOG 9704supports the association of increasing NPN with decreased survival after resection andadjuvant therapy.
Greater than 12 nodes and greater than 15 nodes examined were associated with improvedOS in analyses of all patients in the current study. Schwarz and Smith found a survivalbenefit for higher TNE in their analysis of PC patients in the SEER database. When onlynode-negative patients were considered, the greatest survival differences were identified forTNE greater than 10 or 15 (20). In a separate SEER database study of node-negative patientswho underwent surgery for PC, Tomlinson et al. found that OS was extended for patientswith 15 or more nodes examined, suggesting that staging was improved by the higher TNE(30). Twelve or more nodes was identified by Slidell et al. (21), and more than 10 nodes wasidentified by Hellan et al. (22), as the minimal number of nodes required for accuratestaging of node-negative PC. The significant OS improvement observed for > 15 TNE in theunivariate analsysis (Figure 1), which was not observed in the parallel analysis of > 12versus ≤ 12 TNE, suggests that the preferred TNE cut-point may be 15. However, inmultivariate analyses of TNE categories in the current study, both > 12 and >15 TNE wereindependent predictors of overall survival. These TNE cut-points, 12 and 15, were selectedfor the current analysis based upon the published literature with these numbers (20,21,30).When considering the explanation for improved OS, it seems unlikely that higher TNEprovided a therapeutic benefit for patients enrolled on RTOG 9704, since clinical trials ofextended lymphadenectomy for PC have failed to identify a clear survival benefit (31-35).Potential explanations for the influence of TNE on survival for PC patients likely relate toaccuracy of staging, which may be impacted by surgical quality (22,30) and extent ofpathologic assessment (36,37). In the previously published reports of TNE in PC (20-22,30),higher TNE was associated with prolonged DFS and OS in node-negative patients, whichsuggests that the influence of TNE on OS and DFS is related to more accurate pathologicstaging. A similar association between TNE and DFS or OS was not observed for the subsetof node-negative patients analyzed in the current study, which may be related to therelatively small number of node-negative patients in this analysis (n=142). Furthermore, thepopulation analyzed in the current study received rigorously controlled CT and CRT in acooperative group trial, which is different from the variable adjuvant regimens for subjectsin previously published reports that utilized institutional and SEER databases (20-22,30).Although the present analysis supports the association of higher TNE with improvedsurvival after surgical resection for PC, and though it may generate hypotheses regarding thesignificance of TNE, our study was not designed to elucidate the causes of this relationship.
Increased LNR, both as continuous variable and as categorical variable, was associated withdecreased OS and DFS in univariate and multivariate analyses. LNR has been described as apowerful predictor of survival for patients with positive lymph nodes in both institutional
Showalter et al. Page 6
Int J Radiat Oncol Biol Phys. Author manuscript; available in PMC 2012 December 1.
NIH
-PA Author Manuscript
NIH
-PA Author Manuscript
NIH
-PA Author Manuscript

reports and a SEER database analysis (21,23,24). LNR is particularly useful as a lymph nodeparameter for determining prognosis, as it includes information that is hypothesized toreflect surgical and/or pathological quality (TNE) and extent of disease (NPN) (21). LNRhas been reported to be prognostic for survival in a variety of cancers, including breast (38),esophageal (27,39,40), gastric (41), and colon (28). The results of the current study confirmthe association on LNR with survival after surgery and adjuvant therapy for resectable PC,and LNR greater than 33% was associated with inferior OS and DFS.
In conclusion, for patients who undergo surgical resection followed by adjuvant CRT forPC, the lymph node parameters TNE, NPN, and LNR are associated with OS and DFS. Thecurrent study represents the first analysis of TNE, NPN, and LNR for PC patients whoreceived relatively uniform treatment on a cooperative group trial of postoperative, adjuvanttherapy. Greater than 12 or 15 nodes examined were associated with prolonged survival, and15 TNE is recommended as the preferred target number for future study of TNE in PC. LNRgreater than 33% was associated with worse OS and DFS. These LN factors should beconsidered when estimating prognosis and, in the future, when designing clinical trials toincorporate experimental treatments. These findings also generate hypotheses for futureinvestigation regarding potential explanations for the influence of TNE on prognosis, whichmay include surgical quality, extent of pathologic examination, or other patient-relatedfactors.
AcknowledgmentsSupported by RTOG U10 CA21661, CCOP U10 CA37422, and Stat U10 CA32115 grants from the NationalCancer Institute (NCI). This manuscript’s contents are the sole responsibility of the authors and do not necessarilyrepresent the official views of the NCI.
REFERENCES1. Jemal A, Siegal R, Ward E, et al. Cancer statistics, 2009. CA Cancer J Clin. 2009; 59:225–249.
[PubMed: 19474385]2. Garofalo M, Flannery T, Regine W. The case for adjuvant chemoradiation for pancreatic cancer.
Best Pract Res Clin Gastroenterol. 2006; 20:403–416. [PubMed: 16549335]3. Garofalo MC, Regine WF, Tan MT. On statistical reanalysis, the EORTC trial is a positive trial for
adjuvant chemoradiation in pancreatic cancer. Ann Surg. 2006; 244:332–333. [PubMed: 16858208]4. Gastrointestinal Tumor Study Group. Further evidence of effective adjuvant combined radiation and
chemotherapy following curative resection for pancreatic cancer. Cancer. 1987; 59:2006–2010.[PubMed: 3567862]
5. Kalser MH, Ellenberg SS. Pancreatic cancer: adjuvant combined radiation and chemotherapyfollowing curative resection. Arch Surg. 1985; 120:899–903. [PubMed: 4015380]
6. Klinkenbijl JH, Jeekel H, Sahmoud T, et al. Adjuvant radiotherapy and 5-fluoruracil after curativeresection of cancer of the pancreas and periampullary region: Phase III trial of the EORTCGastrointestinal Tract Cancer Cooperative Group. Ann Surg. 1999; 230:776–784. [PubMed:10615932]
7. Neoptolemos JP, Stocken DD, Friess H, et al. A randomized trial of chemoradiotherapy andchemotherapy after resection of pancreatic cancer. N Engl J Med. 2004; 350:1200–1210. [PubMed:15028824]
8. Foo ML, Gunderson LL, Nagorney DM, et al. Patterns of failure in grossly resected pancreaticductal adenocarcinoma treated with adjuvant irradiation +/− 5 fluorouracil. Int J Radiat Oncol BiolPhys. 1993; 26:483–489. [PubMed: 8390422]
9. Hishinuma S, Ogata Y, Tomikawa M, et al. Patterns of recurrence after curative resection ofpancreatic cancer, based on autopsy findings. J Gastrointest Surg. 2006; 10:511–518. [PubMed:16627216]
Showalter et al. Page 7
Int J Radiat Oncol Biol Phys. Author manuscript; available in PMC 2012 December 1.
NIH
-PA Author Manuscript
NIH
-PA Author Manuscript
NIH
-PA Author Manuscript

10. Yeo CJ, Abrams RA, Grochow LB, et al. Pancreaticoduodenectomy for pancreaticadenocarcinoma: postoperative adjuvant chemoradiation improves survival. A prospective, single-institution experience. Ann Surg. 1997; 225:621–633. [PubMed: 9193189]
11. Herman JM, Swartz MJ, Hsu CC, et al. Analysis of fluorouracil-based adjuvant chemotherapy andradiation after pancreaticoduodenectomy for ductal adenocarcinoma of the pancreas: results of alarge, prospectively collected database at the Johns Hopkins Hospital. J Clin Oncol. 2008;26:3503–3510. [PubMed: 18640931]
12. Hazard L, Tward JD, Szabo A, et al. Radiation therapy is associated with improved survival inpatients with pancreatic adenocarcinoma: Results of a study from the Surveillance, Epidemiology,and End Results (SEER) Registry data. Cancer. 2007; 110:2191–2201. [PubMed: 17918259]
13. Lim JE, Chien MW, Earle CC. Prognostic factors following curative resection for pancreaticadenocarcinoma: a population-based, linked database analysis of 396 patients. Ann Surg. 2003;237:74–85. [PubMed: 12496533]
14. Regine WF, Winter K, Abrams RA, et al. Fluorouracil vs gemcitabine chemotherapy before andafter fluorouracil-based chemoradiation following resection of pancreatic adenocarcinoma: Arandomized controlled trial. JAMA. 2008; 299:1019–1026. [PubMed: 18319412]
15. Sohn TA, Yeo CJ, Cameron JL, et al. Resected adenocarcinoma of the pancreas - 616 patients:results, outcomes, and prognostic indicators. J Gastrointest Surg. 2000; 4:567–579. [PubMed:11307091]
16. Cleary SP, Gryfe R, Guindi M, et al. Prognostic factors in resected pancreatic adenocarcinoma:analysis of actual 5-year survivors. J Am Coll surg. 2004; 198:722–731. [PubMed: 15110805]
17. Smith RA, Bosonnet L, Ghaneh P, et al. Preoperative CA 19-9 levels and lymph node ratio areindependent predictors of survival in patients with resected pancreatic ductal adenocarcinoma. DigSurg. 2008; 25:226–232. [PubMed: 18577869]
18. Berger AC, Garcia M Jr. Hoffman JP, et al. Postresection CA 19-9 predicts overall survival inpatients with pancreatic cancer treated with adjuvant chemoradiation: a prospective validation byRTOG 9704. J Clin Oncol. 2008; 26:5918–5922. [PubMed: 19029412]
19. House MG, Gonen M, Jarnagin WR, et al. Prognostic significance of pathologic nodal status inpatients with resected pancreatic cancer. J Gastrointest Surg. 2007; 11:1549–1555. [PubMed:17786531]
20. Schwarz RE, Smith DD. Extent of lymph node retrieval and pancreatic cancer survival:information from a large US population fdatabase. Ann Surg Oncol. 2006; 13:1189–1200.[PubMed: 16955385]
21. Slidell MB, Chang DC, Cameron JL, et al. Impact of total lymph node count and lymph node ratioon staging and survival after pancreatectomy for pancreatic adenocarcinoma: a large, population-based analysis. Ann Surg Oncol. 2008; 15:165–174. [PubMed: 17896141]
22. Hellan M, Sun C-L, Artinyan A, et al. The impact of lymph node number on survival in patientswith lymph node-negative pancreatic cancer. Pancreas. 2008; 37:19–24. [PubMed: 18580439]
23. Pawlik TM, Gleisner AL, Cameron JL, et al. Prognostic relevance of lymph node ratio followingpancreaticoduodenectomy for pancreatic cancer. Surgery. 2007; 141:610–618. [PubMed:17462460]
24. Berger AC, Watson JC, Ross EA, et al. The metastatic/examined lymph node ratio is an importantprognostic factor after pancreaticoduodenectomy for pancreatic adenocarcinoma. Am Surg. 2004;70:235–240. [PubMed: 15055847]
25. Falconi M, Crippa S, Dominguez I, et al. Prognostic relevance of lymph node ratio and number ofresected nodes after curative resection of Ampulla of Vater carcinoma. Ann Surg Oncol. 2008;15:3178–3186. [PubMed: 18712568]
26. Hurtuk MG, Hughes C, Shoup M, et al. Does lymph node ratio impact survival in resectedperiampullary malignancies? Am J Surg. 2009; 197:348–352. [PubMed: 19245913]
27. Mariette C, Piessen G, Briez N, et al. The number of metastatic lymph nodes and the ratio betweenmetastatic and examined lymph nodes are independent prognostic factors in esophageal cancerregardless of neoadjuvant chemoradiation or lymphadenectomy extent. Ann Surg. 2008; 247:365–371. [PubMed: 18216546]
Showalter et al. Page 8
Int J Radiat Oncol Biol Phys. Author manuscript; available in PMC 2012 December 1.
NIH
-PA Author Manuscript
NIH
-PA Author Manuscript
NIH
-PA Author Manuscript

28. Berger AC, Sigurdson ER, LeVoyer T, et al. Colon cancer survival is associated with decreasingratio of metastatic to examined lymph nodes. J Clin Oncol. 2005; 23:8706–8712. [PubMed:16314630]
29. Abrams, RA.; Winter, KA.; Regine, WF., et al. RTOG 9704 - Radiotherapy Quality Assurance(QA) Review and Survival; American Society for Radiation Oncology Annual Meeting;Philadelphia, PA. 2006;
30. Tomlinson JS, Jain S, Bentrem DJ, et al. Accuracy of staging node-negative pancreas cancer: Apotential quality measure. Arch Surg. 2007; 142:767–774. [PubMed: 17709731]
31. Michalski CW, Kleeff J, Wente MN, et al. Systematic review and meta-analysis of standard andextended lymphadenectomy in pancreaticoduodenectomy for pancreatic cancer. Br J Surg. 2007;94:265–273. [PubMed: 17318801]
32. Pedrazzoli S, DiCarlo V, Dionigi R, et al. Standard versus extended lymphadenectomy associatedwith pancreatoduodenectomy in the surgical treatment of adenocarcinoma of the head of thepancreas: a multicenter, prospective, randomized study. Ann Surg. 1998; 228:508–517. [PubMed:9790340]
33. Reddy SK, Tyler DS, Pappas TN, et al. Extended resection for pancreatic adenocarcinoma.Oncologist. 2007; 12:654–663. [PubMed: 17602057]
34. Farnell MB, Aranha GV, Nimura Y, et al. The role of extended lymphadenectomy foradenocarcinoma of the head of the pancreas: strength of the evidence. J Gastrointest Surg. 2008;12:651–656. [PubMed: 18085343]
35. Glanemann M, Shi B, Liang F, et al. Surgical strategies for treatment of malignant pancreatictumors: extended, standard or local surgery? World J Surg Oncol. 2008; 6:123. [PubMed:19014474]
36. Staley CA, Cleary KR, Abbruzzese JL, et al. The need for standardized pathologic staging ofpancreaticoduodenectomy specimens. Pancreas. 2006; 12:373–380. [PubMed: 8740405]
37. Adsay NV, Basturk O, Altinel D, et al. The number of lymph nodes identified in a simplepancreatoduodenectomy specimen: comparison of conventional vs orange-peeling approach inpathologic assessment. Mod Pathol. 2009; 22:107–112. [PubMed: 18820663]
38. van der Wal BCH, Butzelaar RMJM, van der Meij S, et al. Axillary lymph node ratio and totalnumber of removed lymph nodes: predictors of survival in stage I and II breast cancer. EJSO.2002; 28:481. [PubMed: 12217299]
39. Altorki NK, Zhou XK, Stiles B, et al. Total number of resected lymph nodes predicts survival inesophageal cancer. Ann Surg. 2008; 248:221–226. [PubMed: 18650631]
40. Greenstein AJ, Litle VR, Swanson SJ, et al. Effect of the number of lymph nodes sampled onpostoperative survival of lymph node-negative esophageal cancer. Cancer. 2008; 112:1239–1246.[PubMed: 18224663]
41. Inoue K, Nakane Y, Iiyama H, et al. The superiority of ratio-based lymph node staging in gastriccarcinoma. Ann Surg Oncol. 2002; 9:27–34. [PubMed: 11829427]
Showalter et al. Page 9
Int J Radiat Oncol Biol Phys. Author manuscript; available in PMC 2012 December 1.
NIH
-PA Author Manuscript
NIH
-PA Author Manuscript
NIH
-PA Author Manuscript

Figure 1.OS by TNE category (0-15 vs. >15).
Showalter et al. Page 10
Int J Radiat Oncol Biol Phys. Author manuscript; available in PMC 2012 December 1.
NIH
-PA Author Manuscript
NIH
-PA Author Manuscript
NIH
-PA Author Manuscript

Figure 2.OS by NPN category (0 vs. 1-3 vs. >3).
Showalter et al. Page 11
Int J Radiat Oncol Biol Phys. Author manuscript; available in PMC 2012 December 1.
NIH
-PA Author Manuscript
NIH
-PA Author Manuscript
NIH
-PA Author Manuscript

Figure 3.DFS by NPN category (0 vs. 1-3 vs. >3).
Showalter et al. Page 12
Int J Radiat Oncol Biol Phys. Author manuscript; available in PMC 2012 December 1.
NIH
-PA Author Manuscript
NIH
-PA Author Manuscript
NIH
-PA Author Manuscript

Figure 4.OS by LNR category in node-positive patients (≤15% vs. >15%-33% vs. >33%).
Showalter et al. Page 13
Int J Radiat Oncol Biol Phys. Author manuscript; available in PMC 2012 December 1.
NIH
-PA Author Manuscript
NIH
-PA Author Manuscript
NIH
-PA Author Manuscript
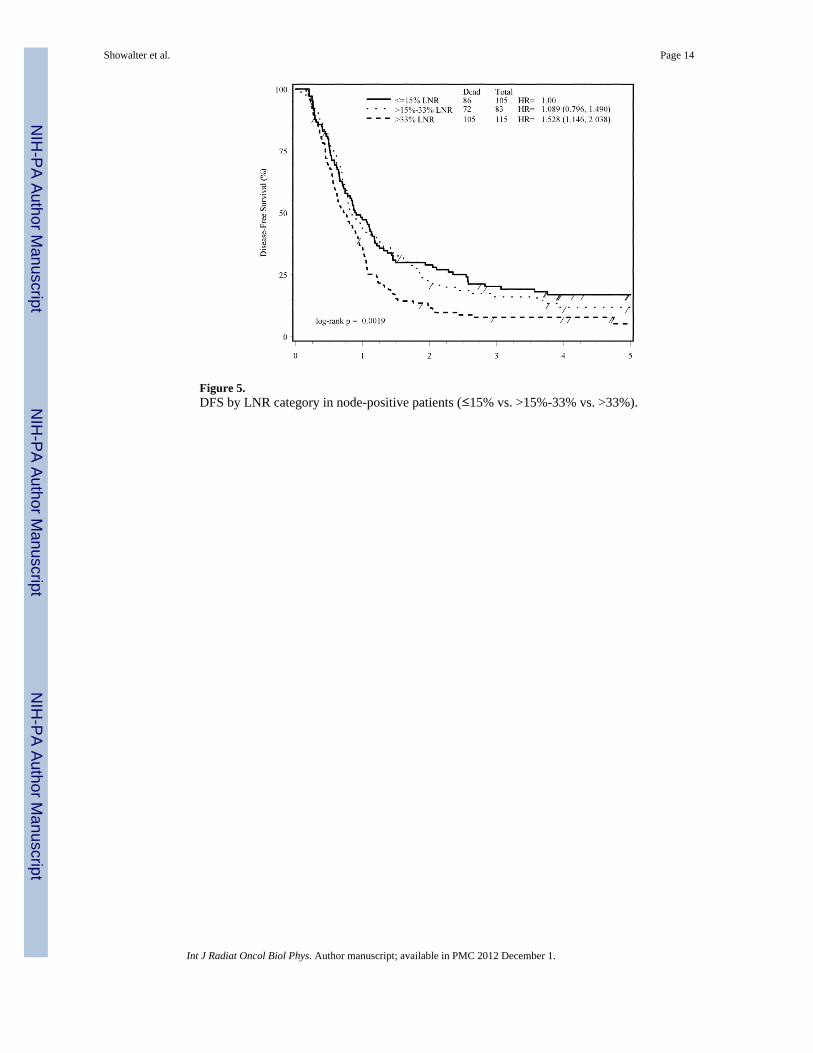
Figure 5.DFS by LNR category in node-positive patients (≤15% vs. >15%-33% vs. >33%).
Showalter et al. Page 14
Int J Radiat Oncol Biol Phys. Author manuscript; available in PMC 2012 December 1.
NIH
-PA Author Manuscript
NIH
-PA Author Manuscript
NIH
-PA Author Manuscript

NIH
-PA Author Manuscript
NIH
-PA Author Manuscript
NIH
-PA Author Manuscript
Showalter et al. Page 15
Tabl
e 1
Patie
nt c
hara
cter
istic
s for
pat
ient
s inc
lude
d in
the
anal
ysis
CR
T +
5-F
U(n
=226
)C
RT
+ G
emci
tabi
ne(n
=219
)
Age
M
edia
n62
61
M
in, M
ax36
-81
33-8
4
Gen
der
n%
n%
p-va
lue
M
ale
135
6011
753
0.17
9
Fe
mal
e91
4010
247
Prim
ary
Tum
or L
ocat
ion
in P
ancr
eas
0.41
5
H
ead
197
8718
585
B
ody/
Tail
2913
3415
KPS
0.72
6
90
-100
145
3613
737
60
-80
8164
8263
T-s
tage
(sur
gica
l)0.
041
T1
2612
115
T2
3917
3214
T3
138
6115
772
T4
2310
199
N-s
tage
(sur
gica
l)0.
162
N
079
3563
29
N
114
765
156
71
AJC
C S
tage
(5th
Edi
tion)
0.24
5
St
age
I35
1521
10
St
age
II38
1742
19
St
age
III
130
5813
763
St
age
IV A
2310
199
Tum
or D
iam
eter
0.32
7
<
3 cm
9743
8438
Int J Radiat Oncol Biol Phys. Author manuscript; available in PMC 2012 December 1.

NIH
-PA Author Manuscript
NIH
-PA Author Manuscript
NIH
-PA Author Manuscript
Showalter et al. Page 16G
ende
rn
%n
%p-
valu
e
≥
3 c
m12
957
135
62
Abb
revi
atio
ns: C
RT,
che
mor
adia
tion
Int J Radiat Oncol Biol Phys. Author manuscript; available in PMC 2012 December 1.

NIH
-PA Author Manuscript
NIH
-PA Author Manuscript
NIH
-PA Author Manuscript
Showalter et al. Page 17
Table 2
Multivariate Cox Proportional Hazards Model with Number of Positive Nodes and Total Nodes Examined(n=445).
Endpoint AdjustmentVariables
Comparison AdjustedHR
p-value†
OS Positive Nodes Continuous 1.08(1.04, 1.12)
<0.0001
Total Nodes Examined Continuous 0.98(0.96, 0.99)
0.001
Age (Median) ≤ 62 vs. > 62 0.78(0.63, 0.97)
0.022
KPS 90-100 vs. 60-80 1.31(1.06, 1.64)
0.015
T-stage (surgical) T1/T2 vs. T3/T4 1.31(1.02, 1.70)
0.037
DFS Positive Nodes Continuous 1.06(1.02, 1.10)
0.005
Total Nodes Examined Continuous 0.98(0.97, 0.996)
0.013
Tumor Diameter < 3 cm vs. ≥ 3 cm 1.26(1.02, 1.56)
0.031
T-stage (surgical) T1/T2 vs. T3/T4 1.38(1.09, 1.77)
0.009
Abbreviations: OS, Overall Survival; DFS, Disease-Free Survival; HR, Hazard Ratio; KPS, Karnofsky Performance Status
†p-value from Chi-square test using the Cox proportional hazards model
Int J Radiat Oncol Biol Phys. Author manuscript; available in PMC 2012 December 1.

NIH
-PA Author Manuscript
NIH
-PA Author Manuscript
NIH
-PA Author Manuscript
Showalter et al. Page 18
Table 3
Multivariate Cox Proportional Hazards Model with Total Nodes Examined (continuous) and Number ofPositive Nodes (0 vs. 1-3 Nodes vs. >3) (n=445).
Endpoint AdjustmentVariables
Comparison AdjustedHR
p-value†
OS Positive Nodes 1 to 3 Nodes vs. 0 Nodes 0.62(0.48, 0.81)
0.0003
1 to 3 Nodes vs. > 3 Nodes 1.20(0.91, 1.58)
0.208
Total Nodes Examined Continuous 0.98(0.96, 0.99)
0.001
Age (Median) ≤ 62 vs. >62 0.78(0.63, 0.97)
0.026
KPS 90-100 vs. 60-80 1.35(1.09 1.69
0.007
DFS Positive Nodes 1 to 3 Nodes vs. 0 Nodes 0.83(0.65, 1.06)
0.131
1 to 3 Nodes vs. > 3 Nodes 1.26(0.96, 1.66)
0.093
Total Nodes Examined Continuous 0.98(0.97, 0.99)
0.013
T-stage (surgical) T1/T2 vs. T3/T4 1.33(1.04, 1.71)
0.024
Tumor Dimension < 3 cm vs. ≥ 3cm 1.25(1.01, 1.55)
0.037
Abbreviations: OS, Overall Survival; DFS, Disease-Free Survival; HR, Hazard Ratio; KPS, Karnofsky Performance Status
†p-value from Chi-square test using the Cox proportional hazards model
Int J Radiat Oncol Biol Phys. Author manuscript; available in PMC 2012 December 1.

NIH
-PA Author Manuscript
NIH
-PA Author Manuscript
NIH
-PA Author Manuscript
Showalter et al. Page 19
Table 4
Multivariate Cox Proportional Hazards Model with Total Nodes Examined (0-12 vs. > 12) and Positive Nodes(Yes vs. No) as Categorical Variables (n=445).
Endpoint AdjustmentVariables
Comparison AdjustedHR
p-value†
OS Examined Nodes >12 vs. 0-12 1.32(1.05, 1.66)
0.019
Positive Nodes No vs. Yes 1.56(1.22, 1.99)
0.0004
Age (Median) ≤ 62 vs. > 62 0.79(0.63, 0.97)
0.027
KPS 90-100 vs. 60-80 1.33(1.07, 1.65)
0.012
Tumor Diameter < 3 cm vs. ≥ 3 cm 1.25(1.00, 1.56)
0.047
DFS Examined Nodes >12 vs. 0-12 1.17(0.95, 1.45)
0.151
Tumor Diameter < 3 cm vs. ≥ 3 cm 1.32(1.07, 1.63)
0.009
T-stage (surgical) T1/T2 vs. T3/T4 1.39(1.09, 1.77)
0.008
Abbreviations: OS, Overall Survival; DFS, Disease-Free Survival; HR, Hazard Ratio; KPS, Karnofsky Performance Status
†p-value from Chi-square test using the Cox proportional hazards model
Int J Radiat Oncol Biol Phys. Author manuscript; available in PMC 2012 December 1.

NIH
-PA Author Manuscript
NIH
-PA Author Manuscript
NIH
-PA Author Manuscript
Showalter et al. Page 20
Table 5
Multivariate Cox Proportional Hazards Model with Total Nodes Examined (0-15 vs. > 15) and Positive Nodes(Yes vs. No) as Categorical Variables (n=445).
Endpoint AdjustmentVariables
Comparison AdjustedHR
p-value†
OS Examined Nodes >15 vs. 0-15 1.47(1.14, 1.89)
0.003
Positive Nodes No vs. Yes 1.61(1.27, 2.04)
0.0001
Age (Median) ≤ 62 vs. > 62 0.79(0.64, 0.98)
0.028
KPS 90-100 vs. 60-80 1.36(1.09, 1.69)
0.006
DFS Examined Nodes >15 vs. 0-15 1.24(0.98, 1.58)
0.071
Tumor Diameter < 3 cm vs. ≥ 3 cm 1.31(1.06, 1.61)
0.012
T-stage (surgical) T1/T2 vs. T3/T4 1.38(1.08, 1.76)
0.010
Abbreviations: OS, Overall Survival; DFS, Disease-Free Survival; HR, Hazard Ratio; KPS, Karnofsky Performance Status
†p-value from Chi-square test using the Cox proportional hazards model
Int J Radiat Oncol Biol Phys. Author manuscript; available in PMC 2012 December 1.
NIH
-PA Author Manuscript
NIH
-PA Author Manuscript
NIH
-PA Author Manuscript
Showalter et al. Page 21
Table 6
Multivariate Cox Proportional Hazards Model with Ratio of Positive Nodes to Total Nodes Examined fornode-positive patients (n=303).
Endpoint AdjustmentVariables Comparison Adjusted
HR p-value†
OS Ratio of Positive Nodesto Total Nodes Examined Continuous 1.01
(1.004, 1.013) 0.001
RX CRT + Gemcitabinevs. CRT + 5-FU
1.32(1.02, 1.70) 0.036
KPS 90-100 vs. 60-80 1.35(1.04, 1.76) 0.023
DFS Ratio of Positive Nodesto Total Nodes Examined Continuous 1.01
(1.002, 1.011) 0.005
Abbreviations: OS, Overall Survival; DFS, Disease-Free Survival; HR, Hazard Ratio; KPS, Karnofsky Performance Status
†p-value from Chi-square test using the Cox proportional hazards model
Int J Radiat Oncol Biol Phys. Author manuscript; available in PMC 2012 December 1.

NIH
-PA Author Manuscript
NIH
-PA Author Manuscript
NIH
-PA Author Manuscript
Showalter et al. Page 22
Table 7
Multivariate Cox Proportional Hazards Model with Ratio of Positive Nodes to Total Nodes Examined as aCategorical Variable for node-positive patients Only (≤15% vs. >15%- 33% vs. >33%) (n=303).
Endpoint AdjustmentVariables Comparison Adjusted
HR p-value†
OS Ratio of Positive Nodesto Total Nodes Examined ≤15%vs. >15%- 33% 1.10
(0.79, 1.52) 0.576
≤15% vs. >33% 1.63(1.21, 2.20) 0.001
RX CRT + Gemcitabine vs.CRT + 5-FU
1.32(1.02, 1.70) 0.035
KPS 90-100 vs. 60-80 1.35(1.04, 1.76) 0.023
DFS Ratio of Positive Nodesto Total Nodes Examined ≤15%vs. >15%- 33% 1.09
(0.80 1.49) 0.594
≤15% vs. >33% 1.53(1.15, 2.04) 0.004
Abbreviations: OS, Overall Survival; DFS, Disease-Free Survival; HR, Hazard Ratio; KPS, Karnofsky Performance Status
†p-value from Chi-square test using the Cox proportional hazards model
Int J Radiat Oncol Biol Phys. Author manuscript; available in PMC 2012 December 1.
Copyright © 2022 FDOKUMEN