Defining nodes in complex brain networks
14
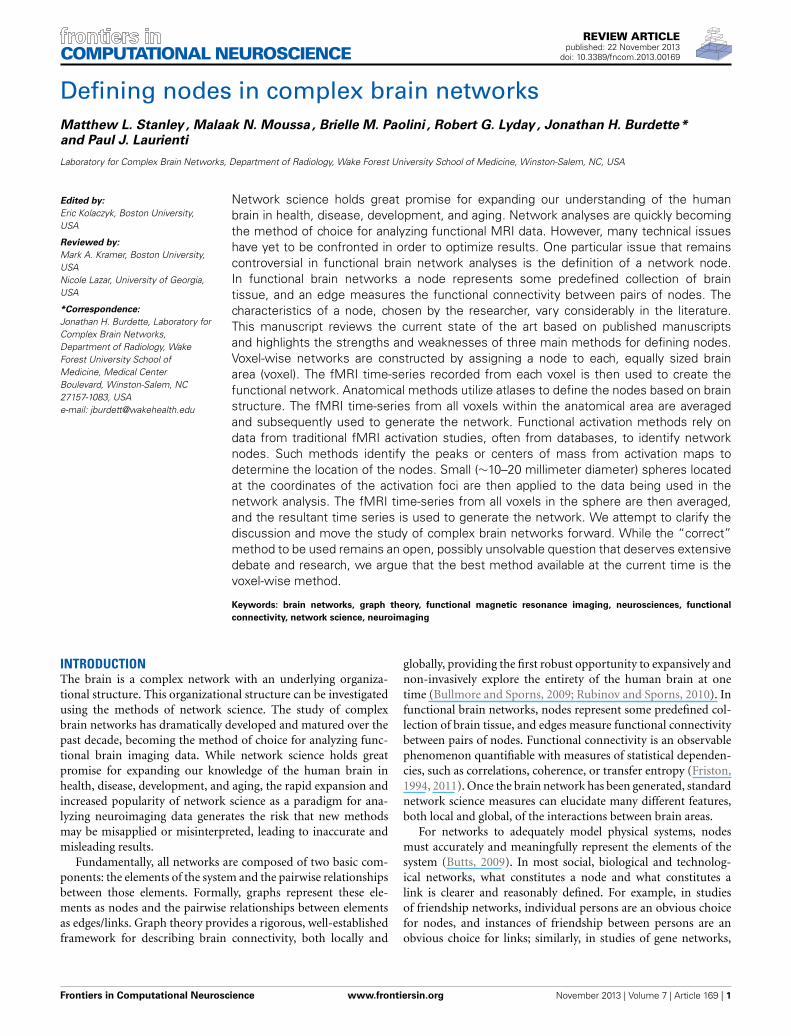
REVIEW ARTICLE published: 22 November 2013 doi: 10.3389/fncom.2013.00169 Defining nodes in complex brain networks Matthew L. Stanley , Malaak N. Moussa , Brielle M. Paolini , Robert G. Lyday , Jonathan H. Burdette* and Paul J. Laurienti Laboratory for Complex Brain Networks, Department of Radiology, Wake Forest University School of Medicine, Winston-Salem, NC, USA Edited by: Eric Kolaczyk, Boston University, USA Reviewed by: Mark A. Kramer, Boston University, USA Nicole Lazar, University of Georgia, USA *Correspondence: Jonathan H. Burdette, Laboratory for Complex Brain Networks, Department of Radiology, Wake Forest University School of Medicine, Medical Center Boulevard, Winston-Salem, NC 27157-1083, USA e-mail: [email protected] Network science holds great promise for expanding our understanding of the human brain in health, disease, development, and aging. Network analyses are quickly becoming the method of choice for analyzing functional MRI data. However, many technical issues have yet to be confronted in order to optimize results. One particular issue that remains controversial in functional brain network analyses is the definition of a network node. In functional brain networks a node represents some predefined collection of brain tissue, and an edge measures the functional connectivity between pairs of nodes. The characteristics of a node, chosen by the researcher, vary considerably in the literature. This manuscript reviews the current state of the art based on published manuscripts and highlights the strengths and weaknesses of three main methods for defining nodes. Voxel-wise networks are constructed by assigning a node to each, equally sized brain area (voxel). The fMRI time-series recorded from each voxel is then used to create the functional network. Anatomical methods utilize atlases to define the nodes based on brain structure. The fMRI time-series from all voxels within the anatomical area are averaged and subsequently used to generate the network. Functional activation methods rely on data from traditional fMRI activation studies, often from databases, to identify network nodes. Such methods identify the peaks or centers of mass from activation maps to determine the location of the nodes. Small (∼10–20 millimeter diameter) spheres located at the coordinates of the activation foci are then applied to the data being used in the network analysis. The fMRI time-series from all voxels in the sphere are then averaged, and the resultant time series is used to generate the network. We attempt to clarify the discussion and move the study of complex brain networks forward. While the “correct” method to be used remains an open, possibly unsolvable question that deserves extensive debate and research, we argue that the best method available at the current time is the voxel-wise method. Keywords: brain networks, graph theory, functional magnetic resonance imaging, neurosciences, functional connectivity, network science, neuroimaging INTRODUCTION The brain is a complex network with an underlying organiza- tional structure. This organizational structure can be investigated using the methods of network science. The study of complex brain networks has dramatically developed and matured over the past decade, becoming the method of choice for analyzing func- tional brain imaging data. While network science holds great promise for expanding our knowledge of the human brain in health, disease, development, and aging, the rapid expansion and increased popularity of network science as a paradigm for ana- lyzing neuroimaging data generates the risk that new methods may be misapplied or misinterpreted, leading to inaccurate and misleading results. Fundamentally, all networks are composed of two basic com- ponents: the elements of the system and the pairwise relationships between those elements. Formally, graphs represent these ele- ments as nodes and the pairwise relationships between elements as edges/links. Graph theory provides a rigorous, well-established framework for describing brain connectivity, both locally and globally, providing the first robust opportunity to expansively and non-invasively explore the entirety of the human brain at one time (Bullmore and Sporns, 2009; Rubinov and Sporns, 2010). In functional brain networks, nodes represent some predefined col- lection of brain tissue, and edges measure functional connectivity between pairs of nodes. Functional connectivity is an observable phenomenon quantifiable with measures of statistical dependen- cies, such as correlations, coherence, or transfer entropy (Friston, 1994, 2011). Once the brain network has been generated, standard network science measures can elucidate many different features, both local and global, of the interactions between brain areas. For networks to adequately model physical systems, nodes must accurately and meaningfully represent the elements of the system (Butts, 2009). In most social, biological and technolog- ical networks, what constitutes a node and what constitutes a link is clearer and reasonably defined. For example, in studies of friendship networks, individual persons are an obvious choice for nodes, and instances of friendship between persons are an obvious choice for links; similarly, in studies of gene networks, Frontiers in Computational Neuroscience www.frontiersin.org November 2013 | Volume 7 | Article 169 | 1 COMPUTATIONAL NEUROSCIENCE
-
Upload
independent -
Category
Documents
-
view
0 -
download
0
Transcript of Defining nodes in complex brain networks
REVIEW ARTICLEpublished: 22 November 2013
doi: 10.3389/fncom.2013.00169
Defining nodes in complex brain networksMatthew L. Stanley , Malaak N. Moussa , Brielle M. Paolini , Robert G. Lyday , Jonathan H. Burdette*and Paul J. Laurienti
Laboratory for Complex Brain Networks, Department of Radiology, Wake Forest University School of Medicine, Winston-Salem, NC, USA
Edited by:
Eric Kolaczyk, Boston University,USA
Reviewed by:
Mark A. Kramer, Boston University,USANicole Lazar, University of Georgia,USA
*Correspondence:
Jonathan H. Burdette, Laboratory forComplex Brain Networks,Department of Radiology, WakeForest University School ofMedicine, Medical CenterBoulevard, Winston-Salem, NC27157-1083, USAe-mail: [email protected]
Network science holds great promise for expanding our understanding of the humanbrain in health, disease, development, and aging. Network analyses are quickly becomingthe method of choice for analyzing functional MRI data. However, many technical issueshave yet to be confronted in order to optimize results. One particular issue that remainscontroversial in functional brain network analyses is the definition of a network node.In functional brain networks a node represents some predefined collection of braintissue, and an edge measures the functional connectivity between pairs of nodes. Thecharacteristics of a node, chosen by the researcher, vary considerably in the literature.This manuscript reviews the current state of the art based on published manuscriptsand highlights the strengths and weaknesses of three main methods for defining nodes.Voxel-wise networks are constructed by assigning a node to each, equally sized brainarea (voxel). The fMRI time-series recorded from each voxel is then used to create thefunctional network. Anatomical methods utilize atlases to define the nodes based on brainstructure. The fMRI time-series from all voxels within the anatomical area are averagedand subsequently used to generate the network. Functional activation methods rely ondata from traditional fMRI activation studies, often from databases, to identify networknodes. Such methods identify the peaks or centers of mass from activation maps todetermine the location of the nodes. Small (∼10–20 millimeter diameter) spheres locatedat the coordinates of the activation foci are then applied to the data being used in thenetwork analysis. The fMRI time-series from all voxels in the sphere are then averaged,and the resultant time series is used to generate the network. We attempt to clarify thediscussion and move the study of complex brain networks forward. While the “correct”method to be used remains an open, possibly unsolvable question that deserves extensivedebate and research, we argue that the best method available at the current time is thevoxel-wise method.
Keywords: brain networks, graph theory, functional magnetic resonance imaging, neurosciences, functional
connectivity, network science, neuroimaging
INTRODUCTIONThe brain is a complex network with an underlying organiza-tional structure. This organizational structure can be investigatedusing the methods of network science. The study of complexbrain networks has dramatically developed and matured over thepast decade, becoming the method of choice for analyzing func-tional brain imaging data. While network science holds greatpromise for expanding our knowledge of the human brain inhealth, disease, development, and aging, the rapid expansion andincreased popularity of network science as a paradigm for ana-lyzing neuroimaging data generates the risk that new methodsmay be misapplied or misinterpreted, leading to inaccurate andmisleading results.
Fundamentally, all networks are composed of two basic com-ponents: the elements of the system and the pairwise relationshipsbetween those elements. Formally, graphs represent these ele-ments as nodes and the pairwise relationships between elementsas edges/links. Graph theory provides a rigorous, well-establishedframework for describing brain connectivity, both locally and
globally, providing the first robust opportunity to expansively andnon-invasively explore the entirety of the human brain at onetime (Bullmore and Sporns, 2009; Rubinov and Sporns, 2010). Infunctional brain networks, nodes represent some predefined col-lection of brain tissue, and edges measure functional connectivitybetween pairs of nodes. Functional connectivity is an observablephenomenon quantifiable with measures of statistical dependen-cies, such as correlations, coherence, or transfer entropy (Friston,1994, 2011). Once the brain network has been generated, standardnetwork science measures can elucidate many different features,both local and global, of the interactions between brain areas.
For networks to adequately model physical systems, nodesmust accurately and meaningfully represent the elements of thesystem (Butts, 2009). In most social, biological and technolog-ical networks, what constitutes a node and what constitutes alink is clearer and reasonably defined. For example, in studiesof friendship networks, individual persons are an obvious choicefor nodes, and instances of friendship between persons are anobvious choice for links; similarly, in studies of gene networks,
Frontiers in Computational Neuroscience www.frontiersin.org November 2013 | Volume 7 | Article 169 | 1
COMPUTATIONAL NEUROSCIENCE
Stanley et al. Defining nodes in brain networks
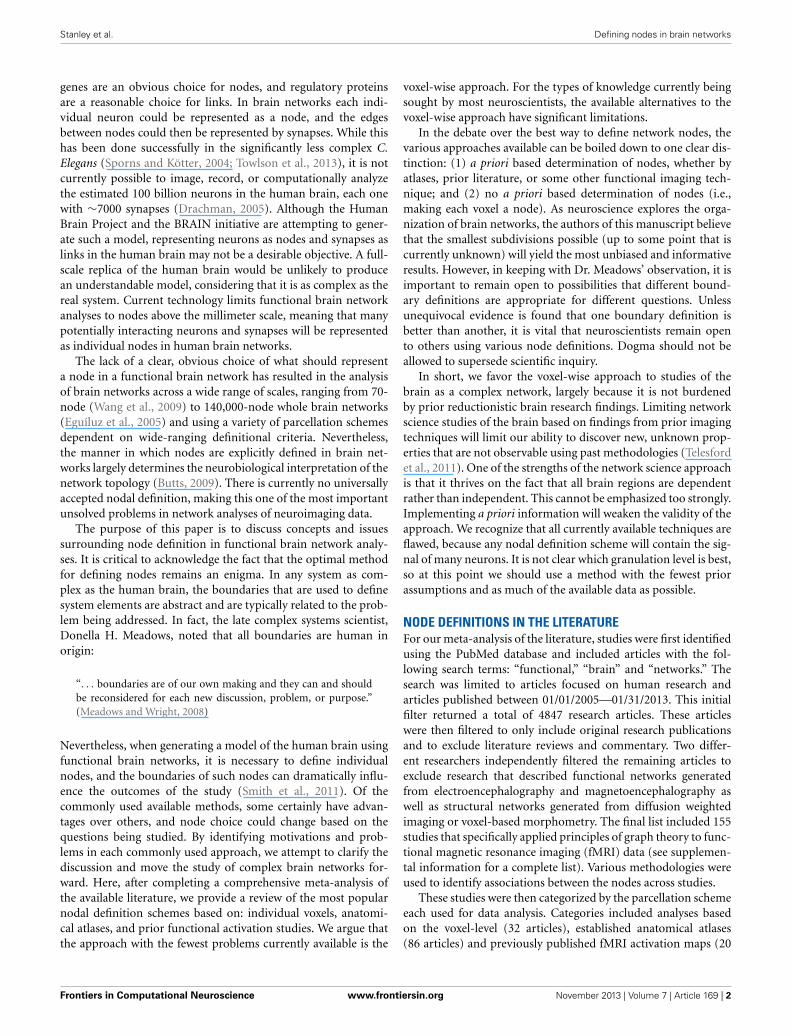
genes are an obvious choice for nodes, and regulatory proteinsare a reasonable choice for links. In brain networks each indi-vidual neuron could be represented as a node, and the edgesbetween nodes could then be represented by synapses. While thishas been done successfully in the significantly less complex C.Elegans (Sporns and Kötter, 2004; Towlson et al., 2013), it is notcurrently possible to image, record, or computationally analyzethe estimated 100 billion neurons in the human brain, each onewith ∼7000 synapses (Drachman, 2005). Although the HumanBrain Project and the BRAIN initiative are attempting to gener-ate such a model, representing neurons as nodes and synapses aslinks in the human brain may not be a desirable objective. A full-scale replica of the human brain would be unlikely to producean understandable model, considering that it is as complex as thereal system. Current technology limits functional brain networkanalyses to nodes above the millimeter scale, meaning that manypotentially interacting neurons and synapses will be representedas individual nodes in human brain networks.
The lack of a clear, obvious choice of what should representa node in a functional brain network has resulted in the analysisof brain networks across a wide range of scales, ranging from 70-node (Wang et al., 2009) to 140,000-node whole brain networks(Eguíluz et al., 2005) and using a variety of parcellation schemesdependent on wide-ranging definitional criteria. Nevertheless,the manner in which nodes are explicitly defined in brain net-works largely determines the neurobiological interpretation of thenetwork topology (Butts, 2009). There is currently no universallyaccepted nodal definition, making this one of the most importantunsolved problems in network analyses of neuroimaging data.
The purpose of this paper is to discuss concepts and issuessurrounding node definition in functional brain network analy-ses. It is critical to acknowledge the fact that the optimal methodfor defining nodes remains an enigma. In any system as com-plex as the human brain, the boundaries that are used to definesystem elements are abstract and are typically related to the prob-lem being addressed. In fact, the late complex systems scientist,Donella H. Meadows, noted that all boundaries are human inorigin:
“. . . boundaries are of our own making and they can and shouldbe reconsidered for each new discussion, problem, or purpose.”(Meadows and Wright, 2008)
Nevertheless, when generating a model of the human brain usingfunctional brain networks, it is necessary to define individualnodes, and the boundaries of such nodes can dramatically influ-ence the outcomes of the study (Smith et al., 2011). Of thecommonly used available methods, some certainly have advan-tages over others, and node choice could change based on thequestions being studied. By identifying motivations and prob-lems in each commonly used approach, we attempt to clarify thediscussion and move the study of complex brain networks for-ward. Here, after completing a comprehensive meta-analysis ofthe available literature, we provide a review of the most popularnodal definition schemes based on: individual voxels, anatomi-cal atlases, and prior functional activation studies. We argue thatthe approach with the fewest problems currently available is the
voxel-wise approach. For the types of knowledge currently beingsought by most neuroscientists, the available alternatives to thevoxel-wise approach have significant limitations.
In the debate over the best way to define network nodes, thevarious approaches available can be boiled down to one clear dis-tinction: (1) a priori based determination of nodes, whether byatlases, prior literature, or some other functional imaging tech-nique; and (2) no a priori based determination of nodes (i.e.,making each voxel a node). As neuroscience explores the orga-nization of brain networks, the authors of this manuscript believethat the smallest subdivisions possible (up to some point that iscurrently unknown) will yield the most unbiased and informativeresults. However, in keeping with Dr. Meadows’ observation, it isimportant to remain open to possibilities that different bound-ary definitions are appropriate for different questions. Unlessunequivocal evidence is found that one boundary definition isbetter than another, it is vital that neuroscientists remain opento others using various node definitions. Dogma should not beallowed to supersede scientific inquiry.
In short, we favor the voxel-wise approach to studies of thebrain as a complex network, largely because it is not burdenedby prior reductionistic brain research findings. Limiting networkscience studies of the brain based on findings from prior imagingtechniques will limit our ability to discover new, unknown prop-erties that are not observable using past methodologies (Telesfordet al., 2011). One of the strengths of the network science approachis that it thrives on the fact that all brain regions are dependentrather than independent. This cannot be emphasized too strongly.Implementing a priori information will weaken the validity of theapproach. We recognize that all currently available techniques areflawed, because any nodal definition scheme will contain the sig-nal of many neurons. It is not clear which granulation level is best,so at this point we should use a method with the fewest priorassumptions and as much of the available data as possible.
NODE DEFINITIONS IN THE LITERATUREFor our meta-analysis of the literature, studies were first identifiedusing the PubMed database and included articles with the fol-lowing search terms: “functional,” “brain” and “networks.” Thesearch was limited to articles focused on human research andarticles published between 01/01/2005—01/31/2013. This initialfilter returned a total of 4847 research articles. These articleswere then filtered to only include original research publicationsand to exclude literature reviews and commentary. Two differ-ent researchers independently filtered the remaining articles toexclude research that described functional networks generatedfrom electroencephalography and magnetoencephalography aswell as structural networks generated from diffusion weightedimaging or voxel-based morphometry. The final list included 155studies that specifically applied principles of graph theory to func-tional magnetic resonance imaging (fMRI) data (see supplemen-tal information for a complete list). Various methodologies wereused to identify associations between the nodes across studies.
These studies were then categorized by the parcellation schemeeach used for data analysis. Categories included analyses basedon the voxel-level (32 articles), established anatomical atlases(86 articles) and previously published fMRI activation maps (20
Frontiers in Computational Neuroscience www.frontiersin.org November 2013 | Volume 7 | Article 169 | 2
Stanley et al. Defining nodes in brain networks
articles). Several studies presented varied non-traditional parcel-lation schemes (23 articles), and a limited number implementedmultiple parcellation schemes (5 articles).
In studies using a voxel-wise approach, the number of nodesvaried greatly and ranged from under 5000 to as high as 140,000nodes. In 2005, Eguiluz and colleagues published what is nowknown to be the first study that applied graph theory analysisto fMRI brain data. It is worth noting that this seminal con-tribution to neuroimaging research was not only the first of itskind but also has been referenced over 450 times. In addition totraditional voxel-wise methods, our search revealed a new vari-ant to voxel-wise methodology. In this approach a voxel-wisebased correlation matrix was generated using resting-state func-tional connectivity MRI (rs-fcMRI) data. The voxels were thenclustered into groups using various methods to define the bound-aries rather than using anatomic-based atlases (Thirion et al.,2006; Cohen et al., 2008; Mumford et al., 2010; Vejmelka andPalus, 2010; Craddock et al., 2012; Blumensath et al., 2013). Theseboundaries were ultimately used to create putative functionalareas that are, in effect, made up of combinations of the origi-nal voxels. The purpose of this approach is to create a universalfunctional atlas of the human brain that can be standardized andused by researchers interested in both resting-state and task-basedfunctional neuroimaging.
Although the initial application of graph theory principlesto neuroimaging brain data was voxel-based, parcellation of thebrain for functional network analysis has moved toward the useof anatomical atlases. These atlases are strictly defined usinganatomical features of the brain, like locations of common gyriand do not rely on any functional information. Atlases are gener-ally standardized, readily available, and most often used for bothstructural and functional neuroimaging analyses. The total num-ber and size (i.e., voxels) of the regions that make up the entiretyof the brain differs across anatomic atlases. To generate networksusing an atlas-based approach, the blood-oxygen-level-dependent(BOLD) signal from all voxels is averaged within each ROI. Theaverage time-series for all the ROIs are used to generate the finalcorrelation matrix.
We found that the Automated Anatomical Labeling (AAL)atlas was the most commonly used, and the second most com-monly used atlas was the Harvard-Oxford probabilistic atlas witha threshold between 25 and 30%. It should be noted that manystudies did not use all the ROIs contained within a particularatlas. Instead, researchers picked regions that were of interest tothe authors or re-sampled data to create ROIs of uniform size.
The third most common approach to parcellation was basedon the findings of prior fMRI activation studies. Studies imple-menting this approach used significant clusters found withingroup activation maps that were previously published by theauthors themselves or by others who had published findings per-tinent to a paper’s topic. In addition to this, others performed ameta-analysis of several different resting-state or task-based fMRIactivation maps to define a parcellation. For all these studies, aGaussian kernel with a full-width-half maximum of 3–10 mmcentered on the peak coordinates was used to create ROIs, and inall instances this approach excluded much of the brain availablefor analysis.
VOXEL-WISE APPROACHThe approach we favor for defining nodes in functional brainnetworks treats each individual voxel as a node. Voxel-wise net-works are constructed by assigning a node to each, equally sizedbrain area (voxel), and then measuring the relatedness in activitycomputed from pairs of simultaneously recorded time series. Thevoxels are based on a grid placed on the brain during imaging andthen warped to MNI (Montreal Neurological Institute) standardspace during the image preprocessing. The placement is arbitrary,but voxels are approximately aligned across subjects during thewarping procedure. It is acknowledged that perfect alignment isnot achieved, but interpretations of the results really should nevercome down to a single voxel.
Among those who utilize a voxel-wise approach, the num-ber of nodes varies widely. Voxel-wise approaches range fromincorporating roughly 3400 nodes (Liu et al., 2011) to 140,000nodes (Eguíluz et al., 2005) in the brain network. This vari-ability is due to differences in acquisition resolution and toresearchers choosing to limit their analyses to the voxels inspecific regions. Such differences in network size will producedifferences in network metrics, as is the case for all threemajor approaches for defining nodes. This will make compar-ison between quantified variables from voxel-wise networks ofdifferent sizes difficult to interpret. However, if the entire brainis included and the density of the connections is controlled,then comparisons across studies with different-sized networks arepossible. The size of the network should not significantly inter-fere with comparisons of the location of key nodes within thebrain.
DiscussionA common criticism of the voxel-wise approach is that connectiv-ity between neighboring nodes is spurious and over-represented.This is because local spatial correlations due to many non-neuralfactors may manifest as edges even though there may not be directfunctional connectivity (Power et al., 2011). One possible causeof increased local correlations is the result of reslicing and blur-ring in data processing (Wig et al., 2011). Because reslicing andblurring are inevitable steps in standard data processing, it is onlypossible to partially alleviate the effects of voxels sharing non-biological signal. Another possible cause is that the fMRI signal isactually due to changes in blood flow, and local voxels share localblood flow. Thus, changes in regional blood flow could increaselocal correlations even if there are not strong associations in neu-ral activity. However, it is important to note that the neurobiologyis such that neurons are, in fact, mostly connected to nearby neu-rons. The probability of connection and the number of connectsfalls off following either a Gaussian or exponential process. Assuch, the probability of connection and number of contacts dropsdramatically beyond 0.5 mm from the neuron cell body (Lileyand Wright, 1994; Hellwig, 2000). Sporns and Zwi (2004) fur-ther demonstrated that a model containing predominantly localconnections with sparse distant connections best captures smallworld topology in an anatomical brain network. So, even thoughblood flow may be locally coupled, so are real neurons. Therefore,it is difficult to know how much is an artifact of fMRI and howmuch is real due to the fact that most connections are local.
Frontiers in Computational Neuroscience www.frontiersin.org November 2013 | Volume 7 | Article 169 | 3
Stanley et al. Defining nodes in brain networks
To examine potential effects of local correlations on networkmetrics, Hayasaka and Laurienti (2010) deleted local edges con-necting spatially neighboring voxels in the voxel-wise networkin subjects and then recalculated network metrics. They exam-ined network metrics on networks that were derived by applyingvarious thresholds to the correlation matrix that produced net-works of different edge densities. They found reduced clusteringand increased path length due to the deletion of local edges. Inbrief, clustering is a measure of the connections that exist betweenthe neighbors of a given node, whereas the path length is a mea-sure of the number of steps required to get from one node toanother node (for further detail, see Watts and Strogatz, 1998).The effect was minimal when the density of edges in the networkwas set such that greater than 98% of the voxels remained con-nected to the network. Large changes in clustering and path lengthdid occur when substantial portions of the network became frag-mented. The degree distribution did not change dramaticallydespite the deletion of local edges. In order to avoid adding spu-rious local correlations to the network as much as possible, datashould not be spatially smoothed. Smoothing introduces spuri-ously high correlations between adjacent voxels. Even if no spatialsmoothing is performed in the preprocessing protocol, fMRI datainherently contains some degree of spatial smoothing due to thedata acquisition process. For example, the spatial normalizationprocess itself could introduce local correlations, which could biasthe structure of the network. This incidental spatial smooth-ing can produce specious short-range connections that in turninflate the clustering metrics in high-resolution voxel-wise net-works (van den Heuvel et al., 2008). It should be noted thatthis is less of a concern for lower-resolution networks, becausethe size of each node greatly exceeds the spatial extent of thesmoothing range (Zalesky et al., 2012). Another criticism of thevoxel-wise approach is that relationships between short distancenodes are especially susceptible to spurious augmentation by sub-ject motion (Power et al., 2011). However, subject motion is notmerely restricted to local voxels, as the head moves as a rigidbody. As such, most motion artifacts are associated with the inter-face of different brain tissue types (e.g., gray matter/white matterinterface) (Field et al., 2000), and regions across hemispheres canbecome correlated because of motion (Bright and Murphy, 2013)rendering this a problem for any parcellation scheme.
Another criticism of the voxel-wise approach is that there areserious signal-to-noise (SNR) problems and spurious connec-tions due to the low signal in the small voxels. In particular, ithas been suggested that adopting an excessively high spatial res-olution may be associated with a disproportionate loss in SNR(Fornito et al., 2010). This will result in an increase in the ran-dom connections in the network. It essentially will be like addingrandom links to the true network. This would have the effect ofdecreasing the overall network path length, but it would likely notaffect the local clustering (Watts and Strogatz, 1998). The mainopponents of the voxel-wise approach argue that the problem isan increase in clustering, not a decrease in the path length (Poweret al., 2011). If the SNR of voxel-wise data were not of sufficientquality, all traditional functional connectivity studies (e.g., Biswalet al., 1995, 1997) that serve as the foundation for network anal-yses in the brain would be called into question. In addition, all
traditional fMRI activation studies are voxel-wise, and thus thoseworks would be called into question.
There is no doubt that averaging signal across local voxels, asis performed with the non-voxel-wise approaches, will decreasethe noise levels in each network node. In fact, we have evalu-ated the magnitude of the correlation values in a voxel-wise andatlas-based network averaged over 10 young, healthy subjects atrest using recently published data (Peiffer et al., 2009; Hayasakaand Laurienti, 2010). The positive correlation values were signif-icantly higher (p = 0.001, paired t-test) when the time courseswere averaged across anatomical ROIs (average r = 0.221, SD =0.017) than when individual voxels were used (average r = 0.159,SD = 0.011). While it is true that averaging voxels reduces noise,it is also true that real signals are lost if voxels with very differ-ent true signals are averaged. This is in fact what we found whenwe examined the correlation values of the strong associations thatare typically retained after thresholding functional networks. Thethresholds were set such that the density of connetions was com-parable across the types of networks. For the atlas-based networkthe retained edges had an average r-value of 0.421 (SD = 0.047).For the voxel-wise network, the retained edges were significantlyhigher (p < 0.001, paired t-test) with an average r-value of 0.55(SD = 0.039). Thus, the averaging procedure used when combin-ing many voxels into a single node did reduce overall noise, but italso reduced signal in the strongest of the network connections.
Despite some potential limitations, voxel-wise networks havestrengths that make them an ideal choice for making new discov-eries about human brain function. Representing nodes as equallysized voxels allows the voxel-wise approach to escape three seriousproblems facing other methods. First, voxel-wise networks are notconstrained by the assumption that voxels from the same anatom-ical regions or functional areas are sufficiently similar so that theycan be averaged to form a larger node. Second, because each nodein the voxel-wise network is of equal size, signal variance willnot scale with the number of voxels that contribute to its esti-mate, meaning that the quantification of pairwise relationshipswill not be disproportionately more reliable for larger brain areas(Hayasaka and Laurienti, 2010). Third, those ROIs comprised ofa greater quantity of voxels than other ROIs in region-based net-works may exhibit differential connectivity simply due to the factthat a greater variety of signals are included in the ROI itself(Hayasaka and Laurienti, 2010). Because each node is the samesize in voxel-wise networks, no correction mechanism need bedeveloped to account for differences in the spatial extent of ROIs.
The voxel-wise approach generates high-resolution (meso-scopic) brain networks, allowing researchers to acknowledge andaccount for (given current technological constraints) the het-erogeneity of areas present within the larger ROIs identified byother parcellation techniques. For instance, in a recent study ahighly interconnected hub in the posterior cingulate cortex (PCC)observed in a high-resolution voxel-wise network was centeredin the middle of three different ROIs (nodes) in a network withnodes defined with an AAL atlas (Hayasaka and Laurienti, 2010).Regardless of whether the three adjoining ROIs in the atlas-based network were kept separate or averaged together, it wouldnot have been possible to meaningfully capture the high degreearea in the middle of the three anatomical ROIs. Additionally,
Frontiers in Computational Neuroscience www.frontiersin.org November 2013 | Volume 7 | Article 169 | 4
Stanley et al. Defining nodes in brain networks
although both anatomical atlas-based and voxel-wise networkanalyses have consistently identified the PCC and the nearby pre-cuneus as highly connected nodes, or hubs (Hagmann et al., 2008;van den Heuvel et al., 2008; Buckner et al., 2009), only voxel-wise networks allow for the precise localization of hub nodeswithin these anatomical areas (Hayasaka and Laurienti, 2010). Itshould be noted that (Tohka et al., 2012) compared a voxel-wise(40,962 nodes) and an anatomical atlas-based (54 nodes) net-work with results corroborating those of Hayasaka and Laurienti(2010). This ability to more accurately identify the spatial loca-tions of hubs in functional brain networks allows researchers tomore accurately quantify the assortativity of the network, effi-ciency in the flow of information in the network, resiliency ofthe network to targeted and random attack, and the nature ofthe degree distribution of the network (whether the degree dis-tribution is truly scale-free or instead an exponentially truncatedpower law degree distribution). For overviews of these metrics,see Bullmore and Sporns (2009), Rubinov and Sporns (2010), andKaiser (2011). Additionally, a substantial amount of research hasindicated that hubs are radically reorganized in a variety of neu-rological disorders, including Alzheimer’s disease (Supekar et al.,2008), stroke (Desmurget et al., 2007), schizophrenia (Lynallet al., 2010) and abnormalities in consciousness (Achard et al.,2012). This suggests that the ability to accurately and effectivelydetect the location of hubs may serve an important purpose inclinical settings.
Several extensions of the voxel-wise approach have been devel-oped using rs-fcMRI correlations by attempting to group togethervoxels with similar properties. Each group of voxels, or functional“unit,” can potentially represent a node for further network analy-ses. The full set of fundamental units of interest can, in theory, bedescribed with a robust brain map akin to a map of the countriesof the world, wherein each country is analogous to a distinct func-tional unit (Wig et al., 2011). Methods used to identify functionalunits (nodes) using rs-fcMRI data can be classified into 3 cate-gories: detecting sharp transitions in rs-fcMRI patterns (Cohenet al., 2008; Barnes et al., 2010, 2012; Nelson et al., 2010), identi-fying functionally similar clusters (Thirion et al., 2006; Mumfordet al., 2010; Vejmelka and Palus, 2010; Craddock et al., 2012), andregion growing methods (Blumensath et al., 2013).
Some who have advocated for these rs-fcMRI approaches andagainst a voxel-wise approach argue that although interrogatingvoxels is suitable in the statistical analysis of neuroimaging datawhen the goal is to identify groups of voxels with similar prop-erties, treating a voxel as a node in a network explicitly impliesthat it is being modeled as a distinct unit of information process-ing (Wig et al., 2011). The implication here is that because voxelsare not distinct units of information processing, voxels shouldnot represent nodes for network analysis. We contend that suchan argument is circular. The techniques that have been devel-oped using rs-fcMRI data are built upon what is fundamentallya voxel-wise network analysis. In fact, (Barnes et al., 2010), whoimplement an algorithm to detect transitions in connectivity pat-terns to form boundaries between nodes, admit that each voxelis treated as a node and the similarity measure (i.e., η2) betweennodes is treated as an edge in order to then find sharp transitionsin connectivity. Similarly, clustering and region-growing methods
initially require the detection of correlations between adjacentvoxels in order to then determine whether those voxels shouldbe grouped together. Groups of voxels identified by each respec-tive approach are redefined as a single node, so that researcherscan go back to the original data and perform a new networkanalysis using node definitions that were based on a voxel-wisenetwork analysis. If one has problems with a voxel-wise analy-sis, then it is unreasonable to use a voxel-wise analysis to definea nodal set in an attempt to avoid a voxel-wise analysis. It is nec-essary to represent each voxel as a unit of information processingwhen identifying putative functional units, which then becomethe new units of information processing. Importantly, becauseeach approach is derived from a voxel-wise network analysis, theproblems previously presented for the voxel-wise approach areconferred upon those methods developed using rs-fcMRI data.
The optimal method for combining voxels into functional“units” remains an enigma. This is largely due to the inher-ent inability to access any form of ground truth indicating thata given method successfully parcellates functional units in thebrain (Craddock et al., 2012; Lohmann et al., 2013). A com-mon strategy has been to identify algorithms that yield resultscomparable to past methodologies. However, this strategy willbias results toward prior traditional fMRI research and hamperthe ability to make new discoveries. Others check for repro-ducibility of results generated by some new algorithm. However,the ability to accurately reproduce results does not entail thatan algorithm has successfully delineated the “true” set of func-tional units across the brain. The fact that some approachis reproducible does not mean than it is accurate; it merelymeans that it is reproducible. A better approach to validatingnew parcellation schemes would be to identify which methodsbest predict different behaviors or pathologies through extensiveresearch. Until there is evidence that unequivocally demonstratesthat a true whole-brain functional parcellation exists, we con-tend that the least a priori information that is included, thebetter.
STRUCTURAL ANATOMICAL ATLASESThe most widely used parcellation scheme defines nodes as indi-vidually segregated anatomical regions-of-interest (ROIs) fromone of the many readily available structural anatomical atlases.The mean time series is estimated for every subject by averag-ing the fMRI signal over all voxels in each anatomically definedROI. Of the many modern structural brain atlases readily avail-able, the number of ROIs (nodes) typically ranges from 70 to 250.The most widely used anatomical atlas in functional brain net-work studies is the standard AAL template, which parcellates thecortex and subcortical structures by identifying gyral and sulcalboundaries. The full AAL template comprises 116 ROIs (nodes)(Tzourio-Mazoyer et al., 2002), but the cerebellum is often omit-ted in network-based studies (Zalesky et al., 2010b) leaving thecerebral hemispheres divided into 45 anatomical regions each. Inour literature search the AAL atlas was used to define nodes in69 of the 86 total studies that used structural anatomical atlases.However, it should be noted that some studies have used at leasttwo different atlases in network analysis, one of which being theAAL atlas.
Frontiers in Computational Neuroscience www.frontiersin.org November 2013 | Volume 7 | Article 169 | 5
Stanley et al. Defining nodes in brain networks
In addition to the variability in choosing either the full 116node network or a partial set of 90 nodes, it is not uncommon forresearchers (1) to only select particular regions from the AAL atlasconsidered a priori to be of particular interest based on preexistingliterature (Çiftçi, 2011), (2) to exclude ROIs with less than somepredetermined percentage of brain coverage (Fornito et al., 2011),or (3) to subdivide the AAL atlas into a greater quantity of nodesof roughly homogenous size constrained to lie within the volumeencapsulated by its parent AAL ROI (Fornito et al., 2010; Zaleskyet al., 2010a; Zhang et al., 2011; Achard et al., 2012). Among thosewho use the AAL atlas, variability in the number of nodes rangesfrom a partial brain network of 32 nodes (Çiftçi, 2011) to a whole-brain downsampled network of 4320 nodes (Fornito et al., 2010).
Similar patterns of variability in parcellation occur when dif-ferent researchers use other structural anatomical atlases. Forinstance, among those who use the Harvard-Oxford probabilisticatlas, it is not uncommon (1) to use the full set of ROIs covering48 cortical and 21 subcortical structural areas corresponding toportions of cortical gyri and subcortical gray matter nuclei, (2)to select only particular ROIs from the atlas considered a priorito be of particular interest based on preexisting literature (Lordet al., 2011), (3) to entirely exclude data from certain ROIs dueto suboptimal registration (Davis et al., 2013), or (4) to sub-parcellate the atlas into a greater quantity of regions of roughlyuniform size entirely contained within a single parent ROI fromthe original atlas (Alexander-Bloch et al., 2012, 2013). Amongthose who use the Harvard-Oxford probabilistic atlas, variabil-ity in the number of nodes ranges from a partial network of 19nodes (Lord et al., 2011) to a whole-brain downsampled net-work of roughly 300 nodes before thresholding (Alexander-Blochet al., 2012). Our literature search revealed that 10 studies haveused the Harvard-Oxford Probabilistic Atlas to define networknodes.
DiscussionProponents of using anatomical atlases to define nodes fornetwork-based fMRI studies often argue that ROIs should repre-sent areas with clear anatomical boundaries in order to preservethe interpretability of results from functional connectivity stud-ies. Others argue that it is only possible to establish relationshipsbetween brain structures and their functions by defining nodesbased on anatomical features (Tzourio-Mazoyer et al., 2002).Despite the variability in the quantity of nodes and percentage ofbrain space used in the literature, the fact that the size and extentof each node remains fixed within a single atlas across subjectsand studies is an advantage for the approach. The lack of variabil-ity in this regard has the potential to neatly standardize studies,allowing for the meaningful comparison of results across studies.
However, the various anatomical brain atlases currently avail-able exhibit remarkable differences in the number, shape, andlocation of ROIs. Because the properties of ROIs are highlynon-linear, a slight change in the number, shape, or location ofROIs can dramatically alter connectivity profiles (Li et al., 2010),producing profound effects on network metrics. Low spatial res-olution anatomical templates are more likely to combine areasthat have distinct temporal signals (Fornito et al., 2010; Craddocket al., 2012). Averaging disparate temporal signals will decrease
the signal-to-noise because the signals of interest are actually aver-aged out, thus adding noise to the network analyses. In fact,significant differences in network metrics have been observedacross different anatomical templates. For instance, Wang et al.(2009) examined statistical differences in the topological prop-erties of functional brain networks between an AAL network(90 node) and an Automatic Non-linear Imaging Matching andAnatomical Labeling (ANIMAL) network (70 node). While bothnetworks exhibit robust small-world attributes and an exponen-tially truncated power law degree distribution, the majority ofother local and global topological parameters vary significantlyacross the two networks. Further, because of significant differ-ences in both the quantity of nodes and the percentage of brainspace incorporated in network analyses among researchers whouse variants of the same anatomical atlas, meaningfully com-paring results between any two studies is potentially difficult,impractical, and misleading (Honey et al., 2009; Kaiser, 2011).
Because of the coarse resolution of anatomical atlas-basedapproaches to defining nodes, these atlases are most likely tocollapse many different, interacting brain areas with differentfunctions into a single node. Consequently, representing manydifferent interacting groups of neurons (and synapses) with dif-ferent properties as single nodes may poorly represent reality,obscuring the differences between smaller units within the col-lapsed node. The regions defined by anatomical atlases shouldnot be expected to contain homogenous functional connectiv-ity for two distinct reasons. First, because ROIs derived frommost atlases are so large, it is more likely that they include sig-nals from several different functional sub-regions (Hayasaka andLaurienti, 2010). To overcome this problem, some researchers(e.g., Hagmann et al., 2008; Achard et al., 2012) have randomlysubdivided ROIs, mitigating the possibility of mixing BOLD timeseries. While randomly subdividing anatomical ROIs has beenshown to increase regional homogeneity (Craddock et al., 2012),there is no reason to assume that these randomly subdividedparcels accurately represent structural patterns in the underlyingneuroanatomy. Second, and more importantly, putative func-tional areas simply do not need to obey the divisions created byany parcellation scheme based on anatomical landmarks. Putativefunctional areas could extend across a morphological boundary,or multiple putative functional areas may be present within asingle morphologically defined parcel. Changes in state or condi-tion could also result in changes in the organization of putativefunctional areas, which need not map onto divisions based onanatomical features.
In fact, anatomical atlases have been shown to exhibit poorROI homogeneity, failing to accurately reproduce functional con-nectivity patterns present at the voxel scale (Craddock et al.,2012). To further demonstrate this point, we have randomlychosen one anatomical ROI (node) from the AAL atlas (leftprecuneus) and another from the Harvard-Oxford ProbabilisticAtlas (precuneus, as the atlas does not separate the precuneusinto two separate ROIs). Using recently published data (Rzucidloet al., 2013), we randomly selected a subject (25 year old, healthyfemale). Data were acquired at 4 mm × 4 mm × 5 mm voxel-size,and each voxel was represented as a node for network analy-sis. We employed Pearson’s correlation coefficient (a commonly
Frontiers in Computational Neuroscience www.frontiersin.org November 2013 | Volume 7 | Article 169 | 6

Stanley et al. Defining nodes in brain networks
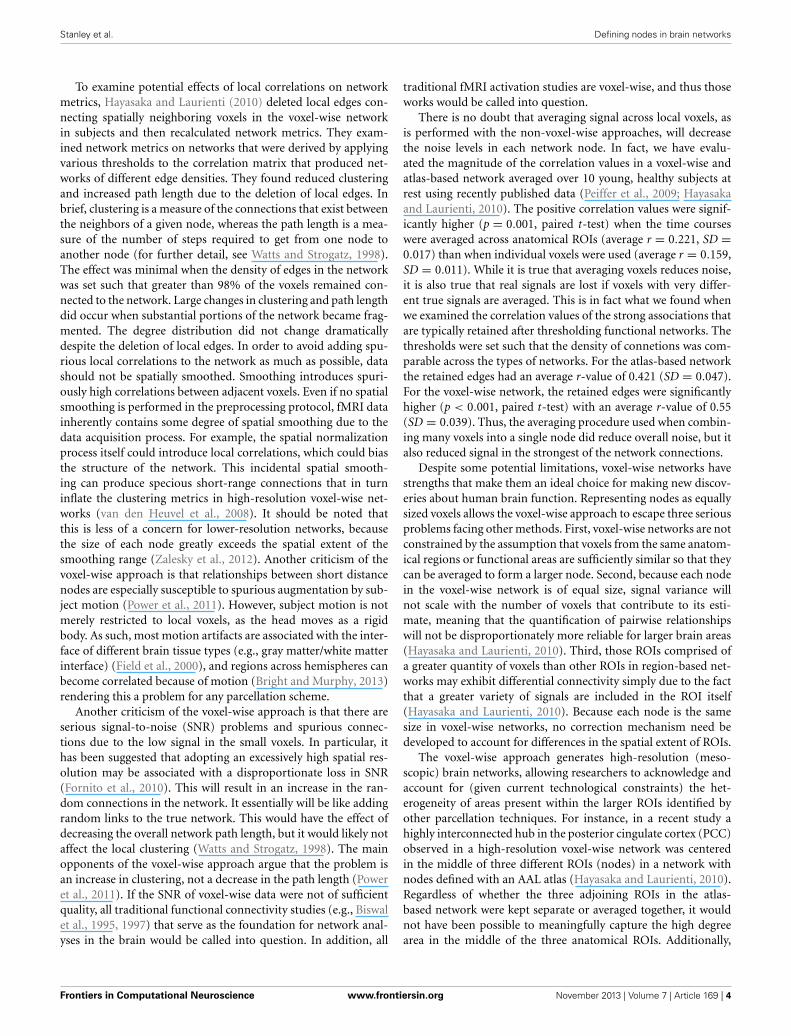
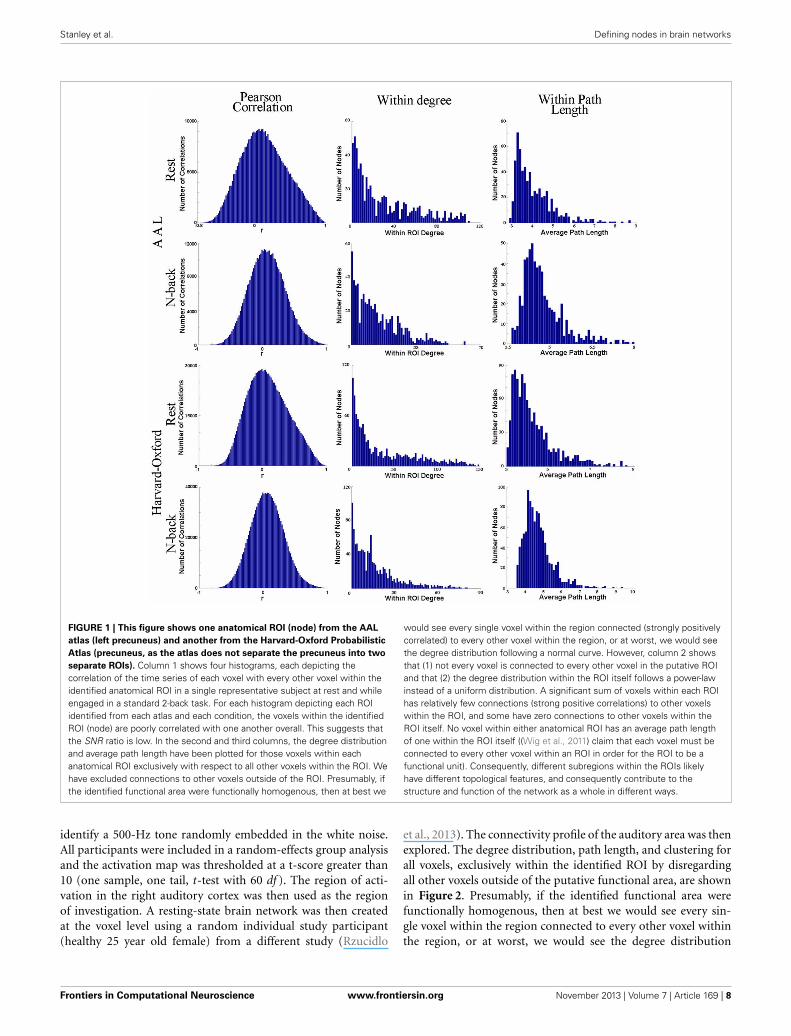
used correlation measure in the literature) to compare the timeseries of each voxel with every other voxel within the identifiedanatomical ROI in a single representative subject at rest and whileengaged in a standard 2-back task. To generate networks of com-parable edge density, the resting state data were thresholded at0.6996 and the 2-back data at 0.6520, in accordance with thethresholding strategy laid out in Hayasaka and Laurienti (2010).Figure 1 demonstrates that the voxels within the identified ROIare poorly correlated (the average r-value is close to 0) with oneanother within both the AAL atlas ROI or the Harvard-Oxfordprobabilistic atlas ROI. If these were homogeneous regions (i.e.,the voxels/brain regions are “behaving the same”), then the timeseries of the voxels within the ROI would be very similar, yieldinghigh r-values.
We have also plotted the degree distribution and average pathlength for those voxels within each anatomical ROI exclusivelywith respect to all other voxels within the ROI. Figure 1 demon-strates that the voxels within each anatomical ROI do not havea normal degree distribution, as one would expect should eachROI be functionally homogenous. Instead, a significant quantityof voxels within each ROI has a very small number of connectionsto other voxels within the ROI. Additionally, because no voxelwithin either anatomical ROI has an average path length of onewithin the ROI itself, different subregions within the ROIs havedifferent network properties.
FUNCTIONAL ACTIVATION META-ANALYTIC APPROACHESAnother approach to defining nodes in functional brain net-works utilizes results from preexisting traditional task-evokedfMRI studies to identify a set of fixed ROIs for all subsequent stud-ies. Some ROIs have been chosen from prior task-evoked fMRIstudies examining either an individual cognitive function or alimited set of cognitive functions, which are then implemented insubsequent network analyses (e.g., Fair et al., 2007; Nomura et al.,2010; Rish et al., 2013), while others have used data derived froma diverse set of studies and performed a meta-analysis to definea set of nodes to be used for any future network analysis (Poweret al., 2011; Wang et al., 2011). Among those who use preexistingdata from a diverse set of task-evoked fMRI studies, some furtherinclude resting-state functional connectivity MRI (rs-fcMRI) datato locate additional ROIs to include in the set of nodes (Poweret al., 2011).
Nodes defined using fMRI activation data are invariably,though not necessarily, modeled by spheres typically of 3–6 mmradii, fixed on either points of peak activity within a putativefunctional area (Power et al., 2011; Stevens et al., 2012) or cen-ter of mass coordinates of an putative functional area (Dosenbachet al., 2007). These differences in sphere radii across studies trans-late to dramatic differences in volumes ranging from roughly113–905 mm3. Incorporating spheres to define functional areasexcludes all voxels except those in the spheres. The spheres aremeant to represent all activity within putative functional areas.This is thought to minimize the likelihood of crossing the bound-aries of a functional area. Using spheres does invalidate concernsrelated to the problems of signal variance scaling and the dif-ferences in the number of ROI connections due differences inROI sizes that affect anatomical atlas-based networks (Wig et al.,
2011). In the available literature no study has utilized a set ofspherical ROIs covering more than 25% of the cerebral cortexand subcortical nuclei; many only cover a fraction of 1% of thecerebral cortex and subcortical nuclei (e.g., Nomura et al., 2010;Rish et al., 2013). The number of nodes in studies utilizing thisparcellation strategy range from roughly 10–264 nodes.
DiscussionOne of the primary motivations for limiting the functionalactivation-based method to spheres is predicated upon the ideathat the voxel-wise approach is hampered by a tendency fornearby voxels to share non-biological signal (causing increasedfunctional connectivity correlation) and that short-distance rela-tionships are especially susceptible to spurious augmentation bysubject motion (Power et al., 2011; Wig et al., 2011). However,these same concerns may be problematic for functional activa-tion approaches as well, because each sphere is composed of aset of neighboring voxels. If such artifacts are indeed predomi-nantly local, averaging signal from adjacent voxels will not averageout these signals because the spurious signals are located in theadjacent voxels that are being averaged.
Proponents of this approach often argue that by using anextensive meta-analytic procedure, it is possible to accuratelyidentify discrete functional macroscopic “units” of brain organi-zation, each of which representing a distinct unit of informationprocessing. These macroscopic “units” supposedly best representwell-formed nodes in network analyses. This contrasts with thevoxel-wise approach wherein voxels are not meant to correspondto macroscopic units of brain organization. Consequently, propo-nents of the meta-analytic approach argue that there is no reasonto believe that a voxel-wise approach incorporates well-formednodes (Power et al., 2011; ?). Operating under this presupposi-tion, proponents of the meta-analytic approach argue that thefailure of the voxel-wise approach to properly model macroscopicfunctional “units” has practical implications that will distortnetwork measures. The argument runs as follows:
“As all voxels existing within a functional area undoubtedly sharean edge with one another, graph measures that focus on specificproperties of nodes will be biased toward nodes (voxels) existingwithin areas (and possibly communities) that are larger than oth-ers, and measures describing global properties of the graph will bedistorted due to a misrepresentation of areas as a function of thenumber of voxels they contain” (Wig et al., 2011).
We contend that this criticism is unfounded, and it is simple todemonstrate that all voxels existing within functional areas do notshare an edge with one another, assuming that a reasonable net-work density is used (obviously, if no threshold is applied and allnodes are connected to all nodes, then the statement above wouldbe true).
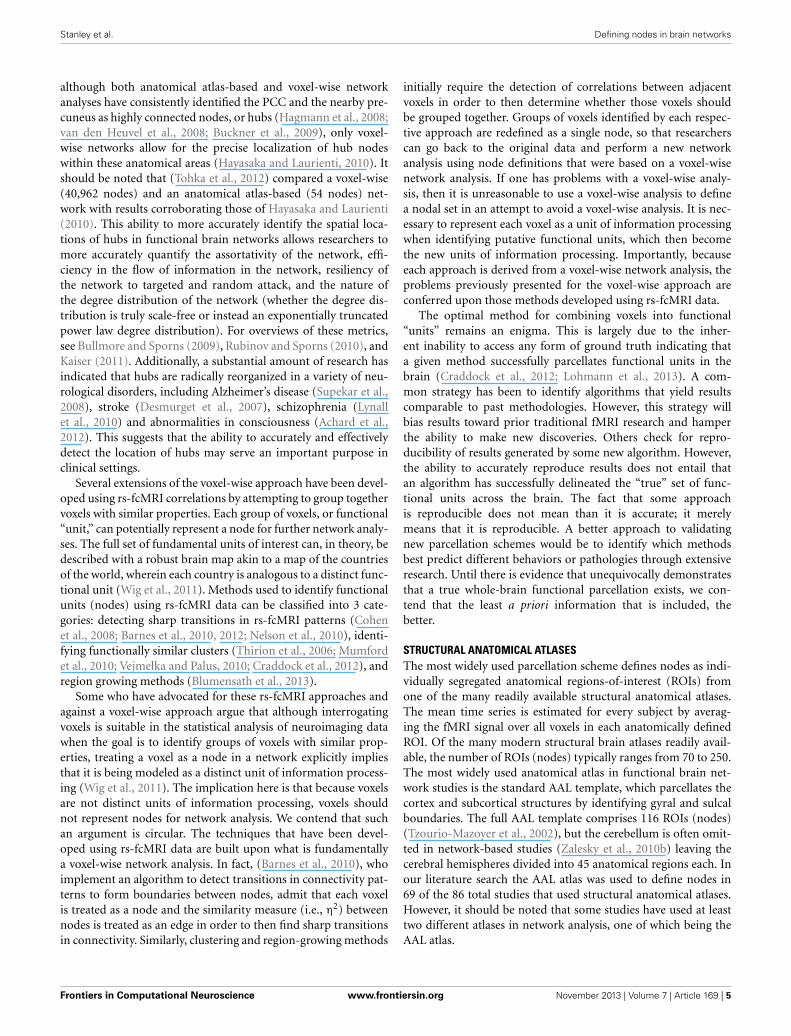
To illustrate this point, we attempted to reproduce a portion ofthis method by examining a spatially contiguous auditory ROI inthe right cerebral hemisphere identified in a previous task-evokedfMRI analysis (Peiffer et al., 2009) as used in Figure 2. A total of61 normal, healthy adults ranging in age from 18 to 80 years oldwere included. In the task portion of the auditory paradigm, 2-Hz bursts of white noise alternated with silence. Subjects had to
Frontiers in Computational Neuroscience www.frontiersin.org November 2013 | Volume 7 | Article 169 | 7
Stanley et al. Defining nodes in brain networks
FIGURE 1 | This figure shows one anatomical ROI (node) from the AAL
atlas (left precuneus) and another from the Harvard-Oxford Probabilistic
Atlas (precuneus, as the atlas does not separate the precuneus into two
separate ROIs). Column 1 shows four histograms, each depicting thecorrelation of the time series of each voxel with every other voxel within theidentified anatomical ROI in a single representative subject at rest and whileengaged in a standard 2-back task. For each histogram depicting each ROIidentified from each atlas and each condition, the voxels within the identifiedROI (node) are poorly correlated with one another overall. This suggests thatthe SNR ratio is low. In the second and third columns, the degree distributionand average path length have been plotted for those voxels within eachanatomical ROI exclusively with respect to all other voxels within the ROI. Wehave excluded connections to other voxels outside of the ROI. Presumably, ifthe identified functional area were functionally homogenous, then at best we
would see every single voxel within the region connected (strongly positivelycorrelated) to every other voxel within the region, or at worst, we would seethe degree distribution following a normal curve. However, column 2 showsthat (1) not every voxel is connected to every other voxel in the putative ROIand that (2) the degree distribution within the ROI itself follows a power-lawinstead of a uniform distribution. A significant sum of voxels within each ROIhas relatively few connections (strong positive correlations) to other voxelswithin the ROI, and some have zero connections to other voxels within theROI itself. No voxel within either anatomical ROI has an average path lengthof one within the ROI itself ((Wig et al., 2011) claim that each voxel must beconnected to every other voxel within an ROI in order for the ROI to be afunctional unit). Consequently, different subregions within the ROIs likelyhave different topological features, and consequently contribute to thestructure and function of the network as a whole in different ways.
identify a 500-Hz tone randomly embedded in the white noise.All participants were included in a random-effects group analysisand the activation map was thresholded at a t-score greater than10 (one sample, one tail, t-test with 60 df ). The region of acti-vation in the right auditory cortex was then used as the regionof investigation. A resting-state brain network was then createdat the voxel level using a random individual study participant(healthy 25 year old female) from a different study (Rzucidlo
et al., 2013). The connectivity profile of the auditory area was thenexplored. The degree distribution, path length, and clustering forall voxels, exclusively within the identified ROI by disregardingall other voxels outside of the putative functional area, are shownin Figure 2. Presumably, if the identified functional area werefunctionally homogenous, then at best we would see every sin-gle voxel within the region connected to every other voxel withinthe region, or at worst, we would see the degree distribution
Frontiers in Computational Neuroscience www.frontiersin.org November 2013 | Volume 7 | Article 169 | 8
Stanley et al. Defining nodes in brain networks
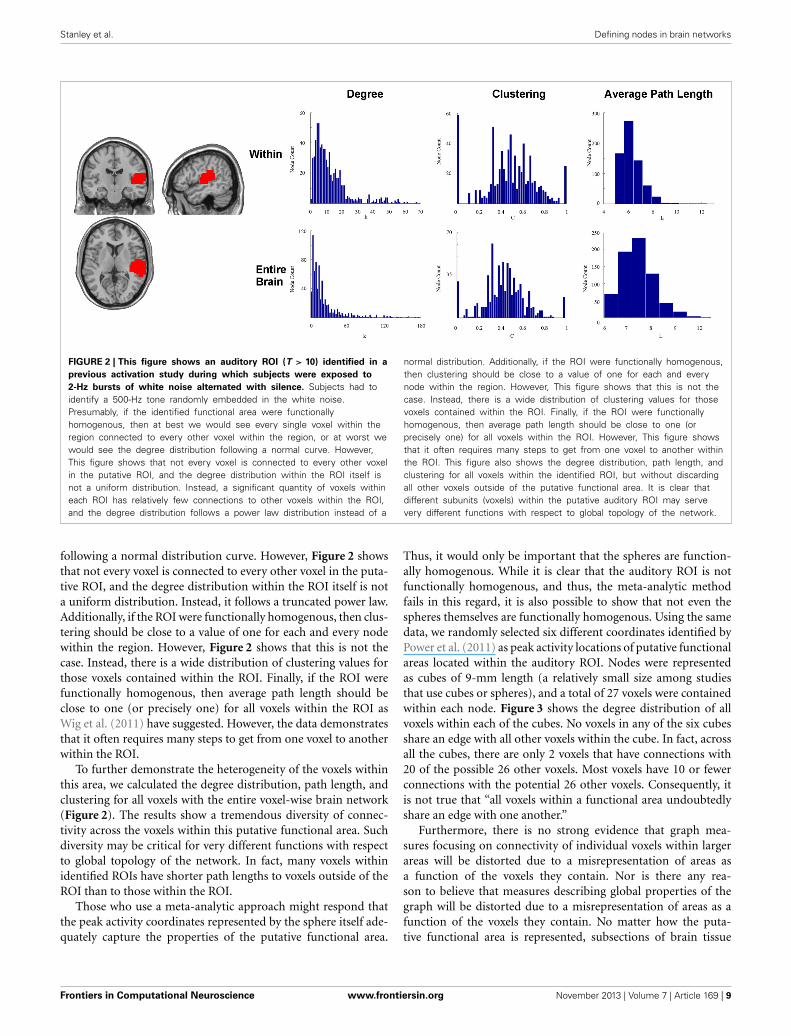
FIGURE 2 | This figure shows an auditory ROI (T > 10) identified in a
previous activation study during which subjects were exposed to
2-Hz bursts of white noise alternated with silence. Subjects had toidentify a 500-Hz tone randomly embedded in the white noise.Presumably, if the identified functional area were functionallyhomogenous, then at best we would see every single voxel within theregion connected to every other voxel within the region, or at worst wewould see the degree distribution following a normal curve. However,This figure shows that not every voxel is connected to every other voxelin the putative ROI, and the degree distribution within the ROI itself isnot a uniform distribution. Instead, a significant quantity of voxels withineach ROI has relatively few connections to other voxels within the ROI,and the degree distribution follows a power law distribution instead of a
normal distribution. Additionally, if the ROI were functionally homogenous,then clustering should be close to a value of one for each and everynode within the region. However, This figure shows that this is not thecase. Instead, there is a wide distribution of clustering values for thosevoxels contained within the ROI. Finally, if the ROI were functionallyhomogenous, then average path length should be close to one (orprecisely one) for all voxels within the ROI. However, This figure showsthat it often requires many steps to get from one voxel to another withinthe ROI. This figure also shows the degree distribution, path length, andclustering for all voxels within the identified ROI, but without discardingall other voxels outside of the putative functional area. It is clear thatdifferent subunits (voxels) within the putative auditory ROI may servevery different functions with respect to global topology of the network.
following a normal distribution curve. However, Figure 2 showsthat not every voxel is connected to every other voxel in the puta-tive ROI, and the degree distribution within the ROI itself is nota uniform distribution. Instead, it follows a truncated power law.Additionally, if the ROI were functionally homogenous, then clus-tering should be close to a value of one for each and every nodewithin the region. However, Figure 2 shows that this is not thecase. Instead, there is a wide distribution of clustering values forthose voxels contained within the ROI. Finally, if the ROI werefunctionally homogenous, then average path length should beclose to one (or precisely one) for all voxels within the ROI asWig et al. (2011) have suggested. However, the data demonstratesthat it often requires many steps to get from one voxel to anotherwithin the ROI.
To further demonstrate the heterogeneity of the voxels withinthis area, we calculated the degree distribution, path length, andclustering for all voxels with the entire voxel-wise brain network(Figure 2). The results show a tremendous diversity of connec-tivity across the voxels within this putative functional area. Suchdiversity may be critical for very different functions with respectto global topology of the network. In fact, many voxels withinidentified ROIs have shorter path lengths to voxels outside of theROI than to those within the ROI.
Those who use a meta-analytic approach might respond thatthe peak activity coordinates represented by the sphere itself ade-quately capture the properties of the putative functional area.
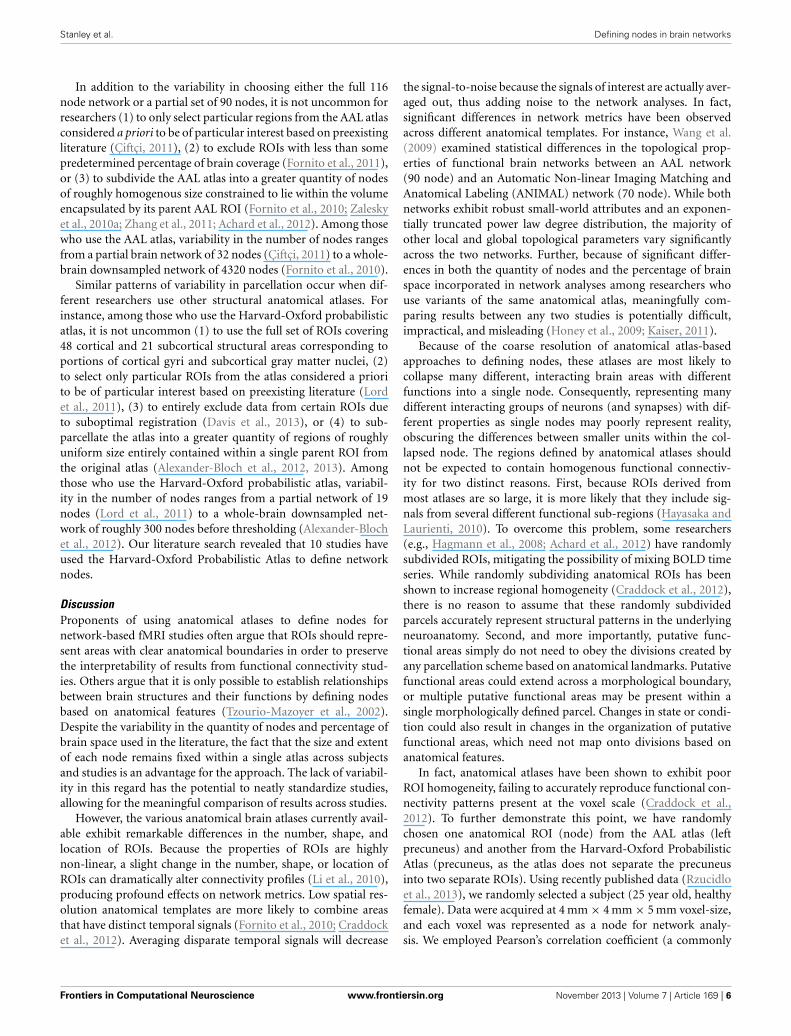
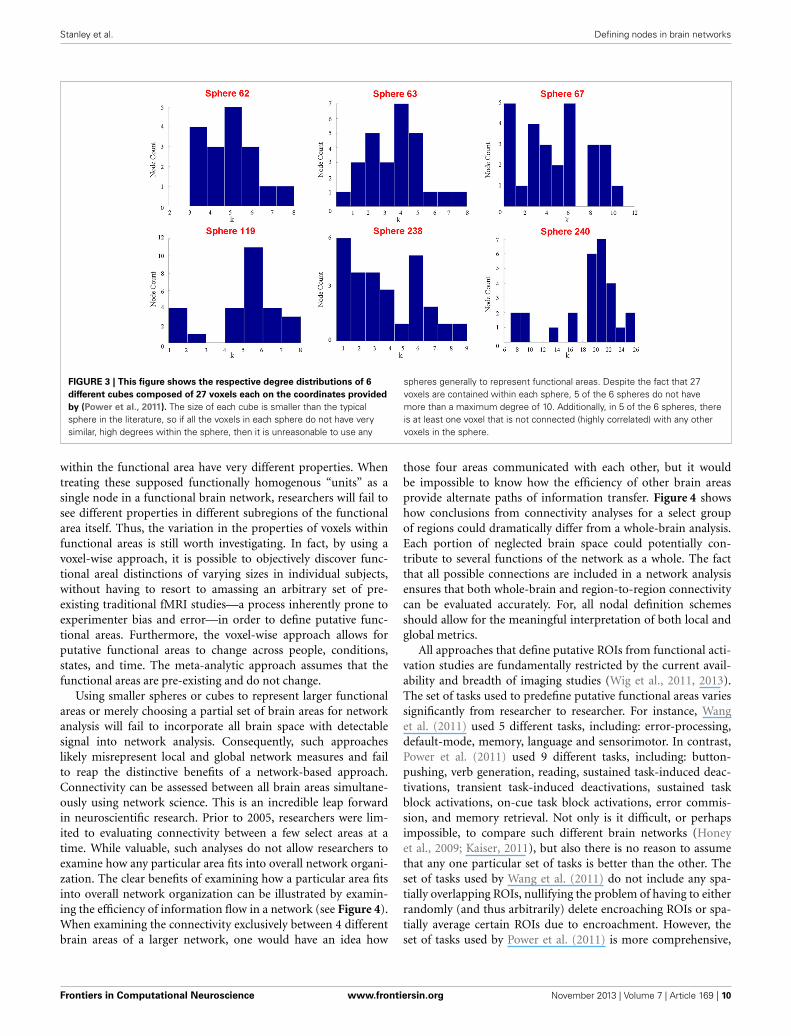
Thus, it would only be important that the spheres are function-ally homogenous. While it is clear that the auditory ROI is notfunctionally homogenous, and thus, the meta-analytic methodfails in this regard, it is also possible to show that not even thespheres themselves are functionally homogenous. Using the samedata, we randomly selected six different coordinates identified byPower et al. (2011) as peak activity locations of putative functionalareas located within the auditory ROI. Nodes were representedas cubes of 9-mm length (a relatively small size among studiesthat use cubes or spheres), and a total of 27 voxels were containedwithin each node. Figure 3 shows the degree distribution of allvoxels within each of the cubes. No voxels in any of the six cubesshare an edge with all other voxels within the cube. In fact, acrossall the cubes, there are only 2 voxels that have connections with20 of the possible 26 other voxels. Most voxels have 10 or fewerconnections with the potential 26 other voxels. Consequently, itis not true that “all voxels within a functional area undoubtedlyshare an edge with one another.”
Furthermore, there is no strong evidence that graph mea-sures focusing on connectivity of individual voxels within largerareas will be distorted due to a misrepresentation of areas asa function of the voxels they contain. Nor is there any rea-son to believe that measures describing global properties of thegraph will be distorted due to a misrepresentation of areas as afunction of the voxels they contain. No matter how the puta-tive functional area is represented, subsections of brain tissue
Frontiers in Computational Neuroscience www.frontiersin.org November 2013 | Volume 7 | Article 169 | 9
Stanley et al. Defining nodes in brain networks
FIGURE 3 | This figure shows the respective degree distributions of 6
different cubes composed of 27 voxels each on the coordinates provided
by (Power et al., 2011). The size of each cube is smaller than the typicalsphere in the literature, so if all the voxels in each sphere do not have verysimilar, high degrees within the sphere, then it is unreasonable to use any
spheres generally to represent functional areas. Despite the fact that 27voxels are contained within each sphere, 5 of the 6 spheres do not havemore than a maximum degree of 10. Additionally, in 5 of the 6 spheres, thereis at least one voxel that is not connected (highly correlated) with any othervoxels in the sphere.
within the functional area have very different properties. Whentreating these supposed functionally homogenous “units” as asingle node in a functional brain network, researchers will fail tosee different properties in different subregions of the functionalarea itself. Thus, the variation in the properties of voxels withinfunctional areas is still worth investigating. In fact, by using avoxel-wise approach, it is possible to objectively discover func-tional areal distinctions of varying sizes in individual subjects,without having to resort to amassing an arbitrary set of pre-existing traditional fMRI studies—a process inherently prone toexperimenter bias and error—in order to define putative func-tional areas. Furthermore, the voxel-wise approach allows forputative functional areas to change across people, conditions,states, and time. The meta-analytic approach assumes that thefunctional areas are pre-existing and do not change.
Using smaller spheres or cubes to represent larger functionalareas or merely choosing a partial set of brain areas for networkanalysis will fail to incorporate all brain space with detectablesignal into network analysis. Consequently, such approacheslikely misrepresent local and global network measures and failto reap the distinctive benefits of a network-based approach.Connectivity can be assessed between all brain areas simultane-ously using network science. This is an incredible leap forwardin neuroscientific research. Prior to 2005, researchers were lim-ited to evaluating connectivity between a few select areas at atime. While valuable, such analyses do not allow researchers toexamine how any particular area fits into overall network organi-zation. The clear benefits of examining how a particular area fitsinto overall network organization can be illustrated by examin-ing the efficiency of information flow in a network (see Figure 4).When examining the connectivity exclusively between 4 differentbrain areas of a larger network, one would have an idea how
those four areas communicated with each other, but it wouldbe impossible to know how the efficiency of other brain areasprovide alternate paths of information transfer. Figure 4 showshow conclusions from connectivity analyses for a select groupof regions could dramatically differ from a whole-brain analysis.Each portion of neglected brain space could potentially con-tribute to several functions of the network as a whole. The factthat all possible connections are included in a network analysisensures that both whole-brain and region-to-region connectivitycan be evaluated accurately. For, all nodal definition schemesshould allow for the meaningful interpretation of both local andglobal metrics.
All approaches that define putative ROIs from functional acti-vation studies are fundamentally restricted by the current avail-ability and breadth of imaging studies (Wig et al., 2011, 2013).The set of tasks used to predefine putative functional areas variessignificantly from researcher to researcher. For instance, Wanget al. (2011) used 5 different tasks, including: error-processing,default-mode, memory, language and sensorimotor. In contrast,Power et al. (2011) used 9 different tasks, including: button-pushing, verb generation, reading, sustained task-induced deac-tivations, transient task-induced deactivations, sustained taskblock activations, on-cue task block activations, error commis-sion, and memory retrieval. Not only is it difficult, or perhapsimpossible, to compare such different brain networks (Honeyet al., 2009; Kaiser, 2011), but also there is no reason to assumethat any one particular set of tasks is better than the other. Theset of tasks used by Wang et al. (2011) do not include any spa-tially overlapping ROIs, nullifying the problem of having to eitherrandomly (and thus arbitrarily) delete encroaching ROIs or spa-tially average certain ROIs due to encroachment. However, theset of tasks used by Power et al. (2011) is more comprehensive,
Frontiers in Computational Neuroscience www.frontiersin.org November 2013 | Volume 7 | Article 169 | 10

Stanley et al. Defining nodes in brain networks
FIGURE 4 | Network analysis from a single subject at rest based on a 90
node AAL parcellation. The 90 node network was chosen, because it iseasily amenable to being visually represented as a whole. The figure showshow conclusions from network analyses that do not use all brain nodes coulddramatically differ from a whole-brain analysis. (A) When only considering theblue nodes (neglecting the rest of the network), there is limited connectivity
between the four nodes (black lines). To get from Node 1 to Node 4 itrequires three steps. (B) However, when the entire network is included,other nodes (green nodes) that connect to two or more blue nodes can beseen. Through the green nodes, new pathways between the blue nodes areevident. There are now three different pathways through a green node (eachone is circled in light blue) such that Node 1 can reach Node 4 in two steps.
likely producing a slightly fuller depiction of brain activation foci.Still, only incorporating 9 different tasks to define all functionalareas in the brain can only produce an incomplete description ofthe location and extent of all putative functional areas, especiallysince so many identified ROIs were either randomly deleted orspatially averaged together. There is no neuroscientific reason toassume that the peaks of activation ascertained by analyzing datafrom 9 kinds of tasks will be applicable to all types of tasks. No setof tasks should be considered complete or comprehensive.
Importantly, as more tasks are incorporated into the meta-analysis, it becomes more and more likely that putative functionalareas overlap. For instance, by only incorporating 9 differenttasks in a meta-analysis to define nodes, Power et al. (2011) hadto spatially average 171 putative ROIs (represented as sphereson peak activity coordinates), because they were encroachingupon one another. Presumably, a larger, more complete corpusof task-evoked fMRI data will contain many more overlappingnodes. And, as one progresses toward including a more “com-plete” set of task-evoked fMRI data to identify putative functionalareas, then all areas of the brain will collectively become acti-vation foci. As more task-evoked data is compiled, more andmore spheres will be spatially encroaching on one another, requir-ing researchers to randomly delete encroaching ROIs or spatiallyaverage encroaching ROIs. Both options will fail to accuratelyrepresent the network.
In addition to the issues of individual variability, we con-tend that the functional activation approach cannot be appliedto interventional studies, longitudinal observational studies, orstudies that examine the brain networks of populations with dis-tinct brain physiology. Patterns of neural activity in responseto various task demands change considerably across the lifes-pan (Stiles, 2008; Power et al., 2010; Vogel et al., 2010), and theliterature is full of studies showing different brain activation pat-terns across patient populations. The peak activity coordinates ofputative functional areas identified by this approach in subjectswithin a certain age group or diagnostic category may not betransferrable to subjects in a different age group or diagnosticcategory.
In contrast to functional activation approaches, using avoxel-wise approach allows for a model-free, unbiased exam-ination of both inter-regional and intra-regional connectivity.Consequently, the voxel-wise method has the potential to revealnew information about network organization, without relying onan arbitrary set of preexisting traditional task-related fMRI stud-ies. Network science has tremendous promise to tell us somethingnew about the functional nature of the brain. However, tradi-tional fMRI studies identify a linear association between task andbrain activity. If network science studies of the brain are limitedby findings from traditional fMRI, then will be able to provide lit-tle insight beyond what has already been discovered. The networkscience approach holds tremendous promise for identifying newrelationships in the brain, but this is not possible if we are lim-ited to what previous non-network fMRI analyses have alreadydemonstrated (Telesford et al., 2011).
CONCLUSIONThis manuscript has examined the predominate schemes thatare currently used for defining nodes in functional brain net-works: voxel-wise, anatomical atlas-based, and functional acti-vation meta-analytic. We argue that voxel-wise networks are themost likely to result in new discoveries of unknown brain prop-erties. The other methods are limited by a priori knowledge, andtherefore, limit our ability to make new discoveries. Voxel-wisenetworks have the resolution to allow for the identification ofkey network nodes that are encompassed within larger anatom-ical regions. Voxel-wise networks also allow for the discovery ofkey nodes that are not located within a putative functional unit.Overall, the voxel-wise method is data-driven and allows for dis-coveries that cannot be achieved by other methods. Undoubtedlythere are limitations to the voxel-wise approach, but we believethat the evidence for these potential limitations is currently poorand that the strengths of the voxel-wise approach outweigh thepotential weaknesses.
There is a fundamental difference in the underlying acceptedpresuppositions among those who do brain network analy-ses (complexity theory) and those who do functional brain
Frontiers in Computational Neuroscience www.frontiersin.org November 2013 | Volume 7 | Article 169 | 11
Stanley et al. Defining nodes in brain networks
mapping (reductionism). Applying a priori information fromprior research based on anatomy or brain activation research lim-its brain network analyses to the discoveries made in these fields.Such methods will surely provide support for the past studies oflocalization of function as the nodes are based on such research.If the goal is simply to replicate past findings using a new method,then much less effort should be directed toward this goal. Ifthe intent is to discover new principles and organization of thehuman brain, then researchers should not be tethered to the out-comes of past work. If network science studies do not replicatepast fMRI findings or do not corroborate structure-function rela-tionships that have been tied to brain anatomy, then either weare discovering new things about how the brain works or we arewrong. We should explore these two possibilities and recognizethat all or our models are wrong and that the new ideas com-ing from network science are moving us closer to truth aboutthe brain. The litmus test is going to be whether brain networkresearch enables us to better understand human behavior, braindiseases, clinical treatments, and the mind. The test should not bewhether brain networks reinforce what we already believe aboutthe brain, because at this stage, our understanding of the humanbrain is rather trivial.
Why not use an approach that does not include a prioriassumptions about functional subunits of the brain? We haveheard the argument that without a priori assumptions, we cannotunderstand and interpret findings. Many ask what the findingsmean in relation to all the previous neuroscience studies. Wewould suggest responding that one should not bias his/her resultswith concepts that may hold back the field. Why not see if net-work science can fundamentally alter our view of the brain andbrain function, because it is a fundamentally new way of thinking.It does not assume certain tissues in the brain are static func-tional units. Rather, it allows for a dynamic brain, able to performcomplex functions, which are emergent network features of thesystem. We hold that the “static functional unit” view is morewrong than the non-biased dynamic view. We acknowledge thatthe latter view (i.e., a voxel-wise approach) is also flawed, but let’snot handcuff these new techniques with past methodologies.
We contend that no nodal parcellation scheme has been devel-oped that is capable of providing valuable information beyondwhat the voxel-wise approach has already shown. Additionally,because the voxel-wise approach does not require implementingany a priori assumptions regarding what constitutes the “right”node, the approach is fundamentally unbiased. Therefore, theapproach allows the data to speak for itself. Though we haveargued that the voxel-wise method for defining nodes in func-tional brain networks is a better method than the other availableoptions, the “best” method to be used remains an open questiondeserving debate and additional research. However, rather thanbeing debated, it is more common for peer reviewers to rejectmanuscripts that do not use the method that they deem appro-priate. This review was meant to be a step forward in fosteringdiscussion. It is critical that we acknowledge the fact that the abso-lutely correct parcellation scheme remains an enigma, and it ispossible that multiple different parcellation schemes developed inthe future will be valuable and meaningful in elucidating differentnetwork properties.
ACKNOWLEDGMENTSThe work was partially supported by The National Institutes ofAlcohol Abuse and Alcoholism (AA021639), the TranslationalScience Center at Wake Forest University, Wake Forest OlderAmericans independence Center (P30 21332), National Instituteon Alcohol Abuse and Alcoholism (T32-AA007565), and theSticht Center on Aging.
SUPPLEMENTARY MATERIALThe Supplementary Material for this article can be found onlineat: http://www.frontiersin.org/journal/10.3389/fncom.2013.00169/abstract
REFERENCESAchard, S., Delon-Martin, C., Vértes, P. E., Renard, F., Schenck, M., Schneider,
F., et al. (2012). Hubs of brain functional networks are radically reorganizedin comatose patients. Proc. Natl. Acad. Sci. U.S.A. 109, 20608–20613. doi:10.1073/pnas.1208933109
Alexander-Bloch, A. F., Vértes, P. E., Stidd, R., Lalonde, F., Clasen, L., Rapoport, J.,et al. (2013). The anatomical distance of functional connections predicts brainnetwork topology in health and schizophrenia. Cereb. Cortex 23, 127–138. doi:10.1093/cercor/bhr388
Alexander-Bloch, A., Lambiotte, R., Roberts, B., Giedd, J., Gogtay, N., andBullmore, E. (2012). The discovery of population differences in net-work community structure: new methods and applications to brainfunctional networks in schizophrenia. Neuroimage 59, 3889–3900. doi:10.1016/j.neuroimage.2011.11.035
Barnes, K. A., Cohen, A. L., Power, J. D., Nelson, S. M., Dosenbach, Y. B. L.,Miezin, F. M., et al. (2010). Identifying basal ganglia divisions in individualsusing resting-state functional connectivity, M. R. I. Front. Syst. Neurosci. 4:18.doi: 10.3389/fnsys.2010.00018
Barnes, K. A., Nelson, S. M., Cohen, A. L., Power, J. D., Coalson, R. S.,Miezin, F. M., et al. (2012). Parcellation in left lateral parietal cortex issimilar in adults and children. Cereb. Cortex 22, 1148–1158. doi: 10.1093/cercor/bhr189
Biswal, B., Zerrin Yetkin, F., Haughton, V. M., and Hyde, J. S. (1995). Functionalconnectivity in the motor cortex of resting human brain using echo-planar mri.Magn. Reson. Med. 34, 537–541. doi: 10.1002/mrm.1910340409
Blumensath, T., Jbabdi, S., Glasser, M. F., Van Essen, D. C., Ugurbil, K.,Behrens, T. E. J., et al. (2013). Spatially constrained hierarchical parcella-tion of the brain with resting-state fMRI. Neuroimage 76, 313–324. doi:10.1016/j.neuroimage.2013.03.024
Bright, M. G., and Murphy, K. (2013). Removing motion and physiological arti-facts from intrinsic BOLD fluctuations using short echo data. Neuroimage 64,526–537. doi: 10.1016/j.neuroimage.2012.09.043
Buckner, R. L., Sepulcre, J., Talukdar, T., Krienen, F. M., Liu, H., Hedden, T.,et al. (2009). Cortical hubs revealed by intrinsic functional connectivity: map-ping, assessment of stability, and relation to Alzheimer’s disease. J. Neurosci. 29,1860–1873. doi: 10.1523/JNEUROSCI.5062-08.2009
Bullmore, E., and Sporns, O. (2009). Complex brain networks: graph theoreticalanalysis of structural and functional systems. Nat. Rev. Neurosci. 10, 186–198.doi: 10.1038/nrn2575
Butts, C. T. (2009). Revisiting the foundations of network analysis. Science 325,414–416. doi: 10.1126/science.1171022
Çiftçi, K. (2011). Minimum spanning tree reflects the alterations of the defaultmode network during Alzheimer’s disease. Ann. Biomed. Eng. 39, 1493–1504.doi: 10.1007/s10439-011-0258-9
Cohen, A. L., Fair, D. A., Dosenbach, N. U. F., Miezin, F. M., Dierker, D., VanEssen, D. C., et al. (2008). Defining functional areas in individual humanbrains using resting functional connectivity MRI. Neuroimage 41, 45–57. doi:10.1016/j.neuroimage.2008.01.066
Frontiers in Computational Neuroscience www.frontiersin.org November 2013 | Volume 7 | Article 169 | 12
Biswal, B. B., Kylen, J. V., and Hyde, J. S. (1997). Simultaneous assessment offlow and BOLD signals in resting-state functional connectivity maps. NMRBiomed. 10, 165–170. doi: 10.1002/(SICI)1099-1492(199706/08)10:4/5<165::AID-NBM454>3.0.CO;2-7

Stanley et al. Defining nodes in brain networks
Craddock, R. C., James, G. A., Holtzheimer, P. E., Hu, X. P., and Mayberg, H. S.(2012). A whole brain fMRI atlas generated via spatially constrained spectralclustering. Hum. Brain Mapp. 33, 1914–1928. doi: 10.1002/hbm.21333
Davis, F. C., Knodt, A. R., Sporns, O., Lahey, B. B., Zald, D. H., Brigidi, B. D.,et al. (2013). Impulsivity and the modular organization of resting-state neuralnetworks. Cereb. Cortex 23, 1444–1452. doi: 10.1093/cercor/bhs126
Desmurget, M., Bonnetblanc, F., and Duffau, H. (2007). Contrasting acute andslow-growing lesions: a new door to brain plasticity. Brain 130(Pt 4), 898–914.doi: 10.1093/brain/awl300
Dosenbach, N. U. F., Fair, D. A., Miezin, F. M., Cohen, A. L., Wenger, K. K.,Dosenbach, R. A., et al. (2007). Distinct brain networks for adaptive and sta-ble task control in humans. Proc. Natl. Acad. Sci. U.S.A. 104, 11073–11078. doi:10.1073/pnas.0704320104
Drachman, D. A. (2005). Do we have brain to spare. Neurology 64, 2004–2005. doi:10.1212/01.WNL.0000166914.38327.BB
Eguíluz, V. M., Chialvo, D. R., Cecchi, G. A., Baliki, M., and Apkarian, A. V.(2005). Scale-free brain functional networks. Phys. Rev. Lett. 94:018102. doi:10.1103/PhysRevLett.94.018102
Fair, D. A., Dosenbach, N. U. F., Church, J. A., Cohen, A. L., Brahmbhatt, S., Miezin,F. M., et al. (2007). Development of distinct control networks through seg-regation and integration. Proc. Natl. Acad. Sci. U.S.A. 104, 13507–13512. doi:10.1073/pnas.0705843104
Field, A. S., Yen, Y.-F., Burdette, J. H., and Elster, A. D. (2000). False cerebral acti-vation on BOLD functional MR images: study of low-amplitude motion weaklycorrelated to stimulus. Am. J. Neuroradiol. 21, 1388–1396.
Fornito, A., Yoon, J., Zalesky, A., Bullmore, E. T., and Carter, C. S. (2011).General and specific functional connectivity disturbances in first-episodeschizophrenia during cognitive control performance. Biol. Psychiatry 70, 64–72.doi:10.1016/j.biopsych.2011.02.019
Fornito, A., Zalesky, A., and Bullmore, E. T. (2010). Network scaling effects in graphanalytic studies of human resting-state FMRI data. Front. Syst. Neurosci. 4:22.doi: 10.3389/fnsys.2010.00022
Friston, K. J. (1994). Functional and effective connectivity in neuroimaging: asynthesis. Hum. Brain Mapp. 2, 56–78. doi: 10.1002/hbm.460020107
Friston, K. J. (2011). Functional and effective connectivity: a review. Brain Connect.1, 13–36. doi: 10.1089/brain.2011.0008
Hagmann, P., Cammoun, L., Gigandet, X., Meuli, R., Honey, C. J., Wedeen, V.J., et al. (2008). Mapping the structural core of human cerebral cortex. PLoSBiol.6:e159. doi: 10.1371/journal.pbio.0060159
Hayasaka, S., and Laurienti, P. J. (2010). Comparison of characteristicsbetween region-and voxel-based network analyses in resting-state fMRI data.Neuroimage 50, 499–508. doi: 10.1016/j.neuroimage.2009.12.051
Hellwig, B. (2000). A quantitative analysis of the local connectivity between pyra-midal neurons in layers 2/3 of the rat visual cortex. Biol. Cybern. 82, 111–121.doi: 10.1007/PL00007964
Honey, C. J., Sporns, O., Cammoun, L., Gigandet, X., Thiran, J. P., Meuli, R.,et al. (2009). Predicting human resting-state functional connectivity fromstructural connectivity. Proc. Natl. Acad. Sci. U.S.A. 106, 2035–2040. doi:10.1073/pnas.0811168106
Kaiser, M. (2011). A tutorial in connectome analysis: topologicaland spatial features of brain networks. Neuroimage 57, 892–907.doi:10.1016/j.neuroimage.2011.05.025
Liley, D. T. J., and Wright, J. J. (1994). Intracortical connectivity of pyramidal andstellate cells: estimates of synaptic densities and coupling symmetry. Network 5,175–189. doi: 10.1088/0954-898X/5/2/004
Li, X., Marrelec, G., Hess, R. F., and Benali, H. (2010). A nonlinear identificationmethod to study effective connectivity in functional MRI. Med. Image Anal. 14,30–38. doi:10.1016/j.media.2009.09.005
Liu, J., Qin, W., Yuan, K., Li, J., Wang, W., Li, Q., et al. (2011). Interaction betweendysfunctional connectivity at rest and heroin cues-induced brain responsesin male abstinent heroin-dependent individuals. PLoS ONE 6:e23098. doi:10.1371/journal.pone.0023098
Lohmann, G., Stelzer, J., Neumann, J., Ay, N., and Turner, R. (2013). “More is differ-ent” in functional magnetic resonance imaging: a review of recent data analysistechniques. Brain Connect. 3, 223–239. doi: 10.1089/brain.2012.0133
Lord, L.-D., Allen, P., Expert, P., Howes, O., Lambiotte, R., McGuire, P.,et al. (2011). Characterization of the anterior cingulate’s role in the at-risk mental state using graph theory. Neuroimage 56, 1531–1539. doi:10.1016/j.neuroimage.2011.02.012
Lynall, M.-E., Bassett, D. S., Kerwin, R., McKenna, P. J., Kitzbichler, M., Muller,U., et al. (2010). Functional connectivity and brain networks in schizophrenia.J. Neurosci. 30, 9477–9487. doi: 10.1523/JNEUROSCI.0333-10.2010
Meadows, D. H., and Wright, D. (2008). Thinking in Systems: a Primer. White RiverJunction, VT: Chelsea Green Pub.
Mumford, J. A., Horvath, S., Oldham, M. C., Langfelder, P., Geschwind, D.H., and Poldrack, R. A. (2010). Detecting network modules in fMRI timeseries: a weighted network analysis approach. Neuroimage 52, 1465–1476. doi:10.1016/j.neuroimage.2010.05.047
Nelson, S. M., Cohen, A. L., Power, J. D., Wig, G. S., Miezin, F. M., Wheeler, M.E., et al. (2010). A parcellation scheme for human left lateral parietal cortex.Neuron 67, 156–170. doi: 10.1016/j.neuron.2010.05.025
Nomura, E. M., Gratton, C., Visser, R. M., Kayser, A., Perez, F., and D’Esposito,M. (2010). Double dissociation of two cognitive control networks in patientswith focal brain lesions. Proc. Natl. Acad. Sci. U.S.A. 107, 12017–12022. doi:10.1073/pnas.1002431107
Peiffer, A. M., Hugenschmidt, C. E., Maldjian, J. A., Casanova, R., Srikanth, R.,Hayasaka, S., et al. (2009). Aging and the interaction of sensory cortical functionand structure. Hum. Brain Mapp. 30, 228–240. doi: 10.1002/hbm.20497
Power, J. D., Cohen, A. L., Nelson, S. M., Wig, G. S., Barnes, K. A., Church, J. A.,et al. (2011). Functional network organization of the human brain. Neuron 72,665–678. doi: 10.1016/j.neuron.2011.09.006
Power, J. D., Fair, D. A., Schlaggar, B. L., and Petersen, S. E. (2010). Thedevelopment of human functional brain networks. Neuron 67, 735–748. doi:10.1016/j.neuron.2010.08.017
Rish, I., Cecchi, G., Thyreau, B., Thirion, B., Plaze, M., Paillere-Martinot, M. L.,et al. (2013). Schizophrenia as a network disease: disruption of emergent brainfunction in patients with auditory hallucinations. PLoS ONE 8:e50625. doi:10.1371/journal.pone.0050625
Rubinov, M., and Sporns, O. (2010). Complex network measures of brainconnectivity: uses and interpretations. Neuroimage 52, 1059–1069. doi:10.1016/j.neuroimage.2009.10.003
Rzucidlo, J. K., Roseman, P. L., Laurienti, P. J., Dagenbach, D. (2013). Stabilityof whole brain and regional network topology within and between rest-ing and cognitive states. PLoS ONE 8:e70275. doi: 10.1371/journal.pone.0070275
Smith, S. M., Miller, K. L., Salimi-Khorshidi, G., Webster, M., Beckmann, C. F.,Nichols, T. E., et al. (2011). Network modelling methods for FMRI. Neuroimage54, 875–891. doi: 10.1016/j.neuroimage.2010.08.063
Sporns, O., and J. D. Zwi, (2004). The small world of the cerebral cortex.Neuroinformatics 2, 145–162. doi: 10.1385/NI:2:2:145
Sporns, O., and Kötter, R. (2004). Motifs in brain networks. PLoS Biol. 2:e369. doi:10.1371/journal.pbio.0020369
Stevens, A. A., Tappon, S. C., Garg, A., and Fair, D. A. (2012). Functional brainnetwork modularity captures inter- and intra-individual variation in workingmemory capacity. PLoS ONE 7:e30468. doi: 10.1371/journal.pone.0030468
Stiles, J. (2008). The Fundamentals of Brain Development: Integrating Nature andNurture. Cambridge, MA: Harvard University Press.
Supekar, K., Menon, V., Rubin, D., Musen, M., and Greicius, M. D. (2008). Networkanalysis of intrinsic functional brain connectivity in Alzheimer’s disease. PLoSComput. Biol. 4:e1000100. doi: 10.1371/journal.pcbi.1000100
Telesford, Q. K., Simpson, S. L., Burdette, J. H., Hayasaka, S., and Laurienti,P. J. (2011). The brain as a complex system: using network scienceas a tool for understanding the brain. Brain Connect. 1, 295–308. doi:10.1089/brain.2011.0055
Thirion, B., Dodel, S., and Poline, J.-B. (2006). Detection of signal syn-chronizations in resting-state fMRI datasets. Neuroimage 29, 321–327. doi:10.1016/j.neuroimage.2005.06.054
Tohka, J., He, Y., and Evans, A. C. (2012). The impact of sampling density uponcortical network analysis: regions or points. Magn. Reson. Imaging 30, 978–992.doi: 10.1016/j.mri.2012.02.029
Towlson, E. K., Vértes, P. E., Ahnert, S. E., Schafer, W. R., and Bullmore, E. T. (2013).The rich club of the C. elegans neuronal connectome. J. Neurosci. 33, 6380–6387.doi: 10.1523/JNEUROSCI.3784-12.2013
Tzourio-Mazoyer, N., Landeau, B., Papathanassiou, D., Crivello, F., Etard,O., Delcroix, N., et al. (2002). Automated anatomical labeling of activa-tions in SPM using a macroscopic anatomical parcellation of the MNIMRI single-subject brain. Neuroimage 15, 273–289. doi: 10.1006/nimg.2001.0978
Frontiers in Computational Neuroscience www.frontiersin.org November 2013 | Volume 7 | Article 169 | 13

Stanley et al. Defining nodes in brain networks
van den Heuvel, M. P., Stam, C. J., Boersma, M., and Hulshoff Pol, H. E.(2008). Small-world and scale-free organization of voxel-based resting-statefunctional connectivity in the human brain. Neuroimage 43, 528–539. doi:10.1016/j.neuroimage.2008.08.010
Vejmelka, M., and Palus, M. (2010). Partitioning networks into clusters andresiduals with average association. Chaos 20:033103. doi: 10.1063/1.3460360
Vogel, A. C., Power, J. D., Petersen, S. E., and Schlaggar, B. L. (2010). Developmentof the brain’s functional network architecture. Neuropsychol. Rev. 20, 362–375.doi: 10.1007/s11065-010-9145-7
Wang, J., Wang, L., Zang, Y., Yang, H., Tang, H., Gong, Q., et al. (2009).Parcellation-dependent small-world brain functional networks: a resting-statefMRI study. Hum. Brain Mapp. 30, 1511–1523. doi: 10.1002/hbm.20623
Wang, J., Zuo, X.-N., Gohel, S., Milham, M. P., Biswal, B. B., and He, Y. (2011).Graph theoretical analysis of functional brain networks: test-retest evaluationon short- and long-term resting-state functional MRI data. PLoS ONE 6:e21976.doi:10.1371/journal.pone.0021976
Watts, D. J., and Strogatz, S. H. (1998). Collective dynamics of ‘small-world’networks. Nature 393, 440–442. doi: 10.1038/30918
Wig, G. S., Laumann, T. O., Cohen, A. L., Power, J. D., Nelson, S. M., Glasser, M. F.,et al. (2013). Parcellating an individual subject’s cortical and subcortical brainstructures using snowball sampling of resting-state correlations. Cereb. Cortexdoi: 10.1093/cercor/bht056. [Epub ahead of print].
Wig, G. S., Schlaggar, B. L., and Petersen, S. E. (2011). Concepts and principlesin the analysis of brain networks. Ann. N.Y. Acad. Sci. 1224, 126–146. doi:10.1111/j.1749-6632.2010.05947.x
Zalesky, A., Fornito, A., and Bullmore, E. (2012). On the use of correla-tion as a measure of network connectivity. Neuroimage 60, 2096–2106. doi:10.1016/j.neuroimage.2012.02.001
Zalesky, A., Fornito, A., and Bullmore, E. T. (2010a). Network-based statistic:Identifying differences in brain networks. Neuroimage 53, 1197–1207. doi:10.1016/j.neuroimage.2010.06.041
Zalesky, A., Fornito, A., Harding, I. H., Cocchi, L., Yücel, M., Pantelis, C., et al.(2010b). Whole-brain anatomical networks: Does the choice of nodes matter.Neuroimage 50, 970–983. doi: 10.1016/j.neuroimage.2009.12.027
Zhang, Z., Liao, W., Chen, H., Mantini, D., Ding, J.-R., Xu, Q., et al. (2011).Altered functional–structural coupling of large-scale brain networks inidiopathic generalized epilepsy. Brain 134, 2912–2928. doi: 10.1093/brain/awr223
Conflict of Interest Statement: The authors declare that the research was con-ducted in the absence of any commercial or financial relationships that could beconstrued as a potential conflict of interest.
Received: 04 October 2013; accepted: 03 November 2013; published online: 22November 2013.Citation: Stanley ML, Moussa MN, Paolini BM, Lyday RG, Burdette JH and LaurientiPJ (2013) Defining nodes in complex brain networks. Front. Comput. Neurosci. 7:169.doi: 10.3389/fncom.2013.00169This article was submitted to the journal Frontiers in Computational Neuroscience.Copyright © 2013 Stanley, Moussa, Paolini, Lyday, Burdette and Laurienti. This is anopen-access article distributed under the terms of the Creative Commons AttributionLicense (CC BY). The use, distribution or reproduction in other forums is permit-ted, provided the original author(s) or licensor are credited and that the originalpublication in this journal is cited, in accordance with accepted academic prac-tice. No use, distribution or reproduction is permitted which does not comply withthese terms.
Frontiers in Computational Neuroscience www.frontiersin.org November 2013 | Volume 7 | Article 169 | 14