Stages and Decision Nodes in the British Accounting Review ...
15
Beattie, V. and Emmanuel, C. (2008) The British Accounting Review review process: evidence from 1997 to 2006. British Accounting Review 40(3):pp. 199-206. http://eprints.gla.ac.uk/4633/ 14 th October 2008 Glasgow ePrints Service https://eprints.gla.ac.uk
-
Upload
khangminh22 -
Category
Documents
-
view
2 -
download
0
Transcript of Stages and Decision Nodes in the British Accounting Review ...

Beattie, V. and Emmanuel, C. (2008) The British Accounting Review review process: evidence from 1997 to 2006. British Accounting Review 40(3):pp. 199-206.
http://eprints.gla.ac.uk/4633/ 14th October 2008
Glasgow ePrints Service https://eprints.gla.ac.uk

.0Editorial
Vivien Beattie and Clive Emmanuel
The British Accounting Review Review Process – Evidence from 1997-20061
This is the first part of a two-part analysis of submissions to The British Accounting Review (BAR) over the decade spanning 1997 to 2006. In this part, we outline the journal review process, report on selected characteristics (country of origin, number of authors) of 657 submitted papers and report on the review process outcomes of these papers (including turnaround times). In part two of this analysis, we will investigate the characteristics of these papers that give insights into the way in which accounting and finance knowledge has developed over the decade (in particular, the topic area and methods of analysis used). The last ten years have seen significant changes in the environment within which accounting and finance scholars research and seek to publish the results of their research. Government exercises to evaluate research quality have become established in several countries (for example, a periodic Research Assessment Exercise has occurred since 1986 in the UK, with the current exercise being the sixth review) (see, for example, Otley, 2002, RAE, 2001 and RAE, 2008). There has been a proliferation of accounting journals (Zeff, 1996), and the pressures to ‘publish or perish’ are growing. Some individual universities are inclined to guide researchers towards journals of the perceived highest quality. Within this environment, journals compete to attract the submission of high quality papers. Review turnaround time is one of several dimensions of interest to potential submitting authors and journal editors have increasingly seen this as a key performance indicator.2 The BAR, the journal of the British Accounting Association, is a broad-based, general, international journal. As stated in the editorial policy, it is an eclectic and pluralistic journal, with contributions being welcomed across a wide range of research methodologies and topics. Papers based on UK and non-UK data and settings are equally welcome. During the ten year period, over seven hundred papers were submitted to BAR. Details regarding each paper are held on the editorial software database RTMS. However, for the purposes of this analysis, it was necessary to scrutinise the hard copy file for each paper to establish/confirm key events and key event dates in the review process. This information was transferred to Excel for further analysis. Of the original 711 papers, 33 were still under review at the end of November 2007 and 21 were excluded for various reasons3, leaving 657 papers for analysis. Of these, 141 were accepted and 516 were rejected, giving an overall acceptance rate of 21%.
1 We would like to thank Ruth Harkin, the British Accounting Review Editorial Assistant, who has helped greatly with the preparation of this editorial. 2 Other dimensions include the perceived quality of papers published in the journal; the perceived quality of the editorial board; the visibility of the journal (including where it is indexed); and the time from acceptance to publication. 3 The excluded papers comprised, in the main, plenary papers and papers withdrawn by the authors (often before the review process had started).

Submission and acceptance profile by region/country A breakdown of the region of affiliation of the lead author is given in Table 1. It can be seen that, over the full ten year period, only 53% of submissions came from the UK & Ireland, with 17% from Australia & New Zealand, 8% from continental Europe, 6% from North America and 15% from the rest of the world. This demographic has changed slightly over the period. During the later five year period, the proportions of submissions from Australia & New Zealand and from Europe increased, while the UK & Ireland and from North America decreased.
[Insert Table 1 here] A more detailed breakdown of submissions by country within regions and of acceptance rates is given in Table 2. It can be seen that, over the ten year period, the acceptance rate has fallen by 6.5 percentage points, to 18.4% during 2002-2006. The highest acceptance rates are for papers from Australia & New Zealand, followed by the UK& Ireland. However, in the later five year period the acceptance rate for papers from Australia & New Zealand has fallen significantly, bringing it more into line with the overall journal acceptance rate.
[Insert Table 2 here] The BAR review process For many years, BAR has operated with two joint editors, appointed by the British Accounting Association. As a matter of policy, the joint editorship rotates every 3-4 years. The review process is similar to that adopted by many other journals. Papers coming into the editorial office are screened for suitability by one of the joint editors (JEd). Papers may be rejected outright at this stage of the review process if they do not satisfy one or more of the basic criteria for consideration. For example, the subject matter of the paper may fall outside the scope of BAR (although this is rare); the paper may merely give a textbook type exposition of an accounting or finance issue, generating no new knowledge; it may not engage with the relevant literature on the topic addressed; or it may fail to meet basic standards of exposition, such that effective communication of the intended message is not possible. The joint editors work with a team of Associate Editors (ASE) who are specialists in a given area. Papers which pass initial scrutiny are assigned to a specialist ASE who also screens the paper for suitability, based on their expert knowledge of the area. The ASE either rejects papers at this stage in the process or recommends two reviewers (plus two ‘reserve’ reviewers). The joint editors then send out requests for review (where a first choice reviewer declines to act, a ‘reserve’ is selected). When both reviews are received, these are passed on to the ASE who makes a recommendation (with supporting justification) to the JEds. This recommendation, along with the two review reports, forms the basis of the JEd’s decision letter to the author(s). The decision alternatives are: reject; revise and resubmit; or accept. Three versions of the ‘revise and resubmit’ decision can be distinguished: full (i.e. a complete re-working of the paper); partial (i.e. major revisions required) and minor. This completes round 1 of the review process. Resubmitted papers are normally sent out to both of the original reviewers again, commencing round 2 in the review process. However, where a reviewer has raised
2

only minor points, the reviewer is not normally contacted again and the points are checked off at editorial level. Another situation where the paper is not sent out again to a reviewer is where there is a fundamental split view regarding the merits of the paper. It is not unusual for one reviewer to view a paper favourably while the other does not see that it can be salvaged as a publishable paper. Where the ASE and JEd share the view of the former reviewer, it is not productive to continue with the dissenting reviewer. Round 2 continues as for round 1 and subsequent rounds occur until a final decision (accept or reject) is made. Since 2005, BAR has shortened the timescales given to reviewers, who are now asked to complete their review within four weeks, with an email reminder being sent three days before the review due date. Review overdue reminders go out from the editorial office one week after the due date and again one week later. If no response is received three weeks after the due date, one of the JEds chases up the reviewer. If no response is received within a week, a ‘deadline’ email is sent stating that if no response is received within a week, it will be assumed that no review will be submitted. In this situation, a decision is made by the JEds to either approach an alternative reviewer (this is most usual in the first round) or proceed to a decision based on one review plus the view of the ASE and JEd. A further change in procedures has been the move to electronic communication between the editorial office, ASEs, reviewers and authors. This eliminates postal delays. The BAR review process is set out diagrammatically in Figure 1. Stages 1 and 2 (S1 & S2) occur once only, in round 1 (R1), at the start of the process. Stages 3 to 6 (S3 – S6) reoccur in each review round and comprise subsequent rounds of review. Stages 1-5 represent time when the paper is ‘with’ the journal, while stage 6 represents time when the paper is ‘with’ the author for revision. Conceptually, it is interesting and informative to distinguish these two situations. Thus,
total days to final decision = total days with journal + total days with author where
total days with journal = , where n = number of rounds jstagen
i j∑∑= =1
5
1
and
total days with author = ∑=
n
istage
26
[Insert Figure 1 here]
Review turnaround Descriptive statistics relating to various stages of the review process and each round are shown in Table 3. Figures are given for the entire ten year period and for the three sub-periods 1997-2000 (4 years); 2001-2004 (4 years); and 2005-2006 (2 years). This split is chosen because, as discussed, below, a number of changes were made to editorial procedures in early 2005. The following observations can be made from inspection of this table. First, virtually all mean values are in excess (in some cases by a large margin) of the median values. This is due to the presence of a small
3

number of outliers with high values which inflate the mean. Second, during the ten year period review timescales have fallen significantly – in recent times the mean (median) number of days to final decision has been 104 (68) days compared to 252 (156) days for the period as a whole (see row 1, Table 3). Figure 2 shows this graphically. It is likely that this is due to a combination of factors: the use of electronic communication between the various parties involved; shorter deadlines given to reviewers; a rigorous schedule for the follow-up of late reviewers; and a greater proportion of papers rejected outright at either stage 1 or stage 2 of the review process. Third, the mean number of days to make a first decision (including both outright rejections and papers sent out for review) for the latest period 2005-2006 was 68 days (see row 9, Table 3), showing a considerable improvement over time. This figure is slightly longer than the 57 days reported for the Journal of Management Studies for the period 2003-2005 (Clark et al. 2006, p.658). The statistic excluding outright rejections is 94 days, slightly longer than the 77 days reported for the European Accounting Review for 2007 (Editorial, 2008, p.3).
[Insert Table 3 here] [Insert Figure 2 here]
The use, when required, of alternative reviewers and third reviewers in stage three obviously adds to review times. It was necessary to resort to alternative reviewers in 140 cases. This includes cases where reviewers declined to act as soon as they were approached, as well as cases where they agreed to undertake the review but ultimately did not deliver. Third reviewers were used nine times in round 1, six times in round 2 and twice in round 3. An interesting way to analyse the total number of days to final decision is to separate the time during which the paper is ‘with’ the journal from the time that the paper is back ‘with’ the author(s) for revision. Figures 3 and 4 provide analyses of these times by time period and review round. Figure 3 shows not only that time with the journal has been declining over time but also that it declines with each round, as might be expected. Time with the author for revision shows a similar, although less consistent pattern. For the last six years, authors have been taking, on average, nearly six months to make a first set of revisions, 2-2.5 months to make a second set of revisions and 1.5-2.5 months to make a third and final set of revisions. These time scales have dropped significantly from the first four year period, but have not declined much further in the last two year period.
[Insert Figures 3 and 4 here] The frequency of outright rejection by region is shown in Table 4. The highest rates of outright rejection arise for South America and South East Asia & India. Research scholarship is not universally well developed in these countries. Consequently, many papers submitted do not satisfy one or more of the basic criteria for consideration set out above. As the proportion of papers submitted from these regions rises, therefore, so does the overall outright rejection rate. It is noticeable, however, that the rate of outright rejection is also rising for papers from certain regions where scholarship is thought to be well established – the UK & Ireland and Australia & New Zealand.
[Insert Table 4 here]
4
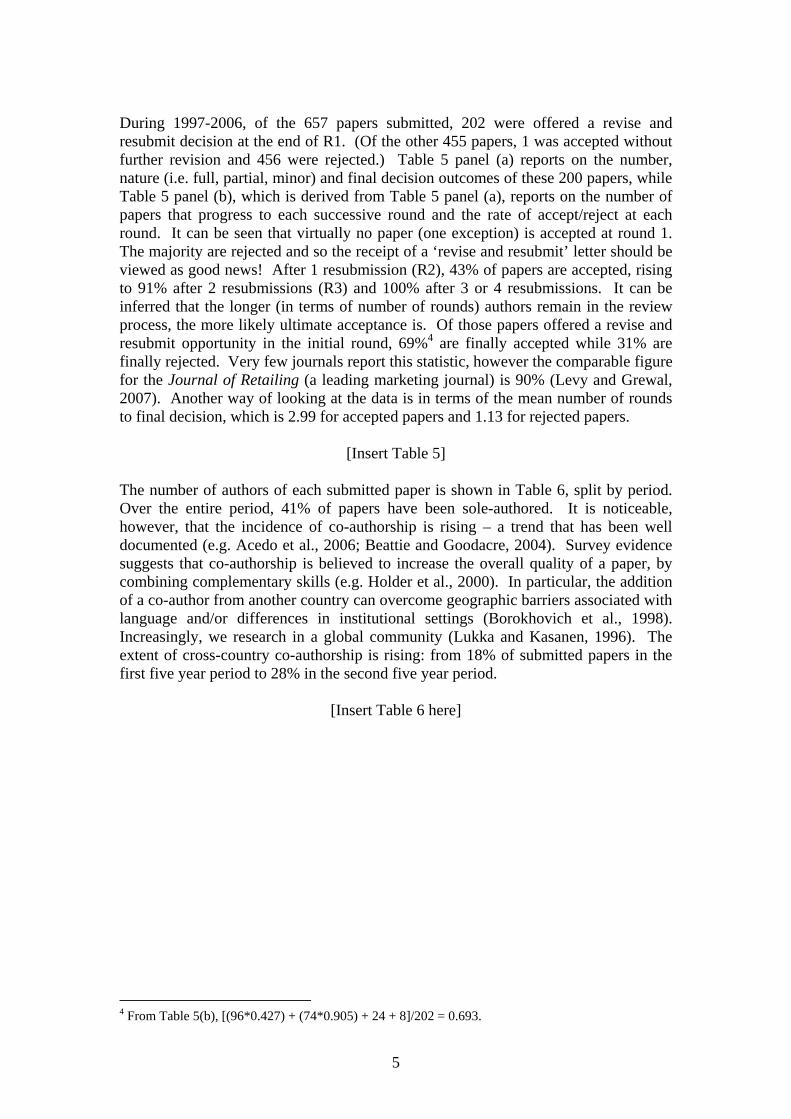
During 1997-2006, of the 657 papers submitted, 202 were offered a revise and resubmit decision at the end of R1. (Of the other 455 papers, 1 was accepted without further revision and 456 were rejected.) Table 5 panel (a) reports on the number, nature (i.e. full, partial, minor) and final decision outcomes of these 200 papers, while Table 5 panel (b), which is derived from Table 5 panel (a), reports on the number of papers that progress to each successive round and the rate of accept/reject at each round. It can be seen that virtually no paper (one exception) is accepted at round 1. The majority are rejected and so the receipt of a ‘revise and resubmit’ letter should be viewed as good news! After 1 resubmission (R2), 43% of papers are accepted, rising to 91% after 2 resubmissions (R3) and 100% after 3 or 4 resubmissions. It can be inferred that the longer (in terms of number of rounds) authors remain in the review process, the more likely ultimate acceptance is. Of those papers offered a revise and resubmit opportunity in the initial round, 69%4 are finally accepted while 31% are finally rejected. Very few journals report this statistic, however the comparable figure for the Journal of Retailing (a leading marketing journal) is 90% (Levy and Grewal, 2007). Another way of looking at the data is in terms of the mean number of rounds to final decision, which is 2.99 for accepted papers and 1.13 for rejected papers.
[Insert Table 5] The number of authors of each submitted paper is shown in Table 6, split by period. Over the entire period, 41% of papers have been sole-authored. It is noticeable, however, that the incidence of co-authorship is rising – a trend that has been well documented (e.g. Acedo et al., 2006; Beattie and Goodacre, 2004). Survey evidence suggests that co-authorship is believed to increase the overall quality of a paper, by combining complementary skills (e.g. Holder et al., 2000). In particular, the addition of a co-author from another country can overcome geographic barriers associated with language and/or differences in institutional settings (Borokhovich et al., 1998). Increasingly, we research in a global community (Lukka and Kasanen, 1996). The extent of cross-country co-authorship is rising: from 18% of submitted papers in the first five year period to 28% in the second five year period.
[Insert Table 6 here]
4 From Table 5(b), [(96*0.427) + (74*0.905) + 24 + 8]/202 = 0.693.
5

References
Acedo, F.J., Barroso, C., Casanueva, C. and Galan, J.L. 2006. Co-authorship in management and organisational studies: an empirical and network analysis. Journal of Management Studies 43(5), 957-983.
Beattie, V. and Goodacre, A. 2004. Publishing patterns within the UK accounting and finance academic community. British Accounting Review 36(1), 7-44.
Borokhovich, K.A., Bricker, R.J., Brunarski, K.R. and Simkins, B.J. 1998. The
institutional and geographical distribution of authorship in finance research. Financial Practice and Education 8(1), 41-50.
Clark, T., Floyd, S.W. and Wright, M. 2006. On the review process and journal
development. Journal of Management Studies 43(3), 655-664. Editorial. 2008. European Accounting Review 17(1), 1-4. Holder, M.E., Langrehr, F.W. and Schroeder, D.M. 2000. Finance journal
coauthorship: how do coauthors in very select journals evaluate the experience? Financial Practice and Education 10(1), 142-152.
Levy, M. and Grewal, D. 2007. Publishing perspectives from the editors. Journal of Retailing 83(3), 247-252.
Lukka, K. and Kasanen, E. 1996. Is accounting a global or a local discipline? Evidence from major research journals. Accounting, Organizations and Society 21(7/8), 755-773.
Otley, D. & The Accounting and Finance RAE 2001 Panel 2002. British research in accounting and finance (1996-2000): the 2001 research assessment exercise. British Accounting Review 34(4), 387-417.
RAE 2001. http://www.hero.ac.uk/rae/
RAE 2008. http://www.rae.ac.uk
Zeff, S.A. 1996. A study of academic research journals in accounting. Accounting Horizons 10(3), 158-177.
6

Figure 1: Stages and Decision Nodes in the British Accounting Review Review Process
Paper submittedt0 [Stage 1]
t1
[Stage 2] t2 [Stage 3] t3 [Stage 4]
t4 [Stage 5] t5 [Stage 6] t6
JEd outright reject ASE assigned
ASE recommend outright reject
2 Reviewers assigned & paper sent out
ASE recommends to JEds
Reject Revise & resubmit: Full ; Partial; Minor
JEd decision to Au
Reviews received
Accept
Author resubmits
Subsequent rounds
7

Figure 2: Mean Days to Final Decision
Mean Days to Final Decision
0
50
100
150
200
250
300
350
1997-2000 2001-2004 2005-2006
Period
Day
s
Days to Final Decision
Figure 3: Mean Days with Journal
Mean Days with Journal
0
50
100
150
200
250
1997-2000 2001-2004 2005-2006
Period
Day
s
Days with Journal - All RoundsDays with Journal - R1
Days with Journal - R2Days with Journal - R3
Days with Journal - R4Days with Journal - R5
8

Figure 4: Mean Days with Author for Revision
Mean Days with Author for Revision
0
50
100
150
200
250
1997-2000 2001-2004 2005-2006
Period
Day
s Days with Author R1-R2
Days with Author R2-R3
Days with Author R3-R4
Table 1: Submissions by Region
Region
% of submissions:1997-2006
% of submissions:1997-2001
% of submissions:2002-2006
UK & Ireland 53.3 56.3 50.6Australia & NZ 17.4 15.5 18.9Europe 8.2 5.2 10.9North America 6.4 7.8 5.2Rest of world 14.7 15.2 14.4Total 100.0 100.0 100.0
9

Table 2: Country of Lead Author
1997-2006 1997-2001 2002-2006
Country/Region No.of
submissionsNo.
acceptedAcceptance
rate % No.of
submissions Acceptance
rate % No.of
submissionsAcceptance
rate % UK & Ireland: 350 89 25.4 174 28.7 176 22.2
UK 331 80 24.2 162 27.8 169 20.7Ireland 19 9 47.4 12 41.7 7 57.1
Australia & NZ: 114 36 31.6 48 41.7 66 24.2Australia 89 28 31.5 39 41.0 50 24.0New Zealand 25 8 32.0 9 44.4 16 25.0
Europe 54 9 16.7 16 25.0 38 13.2Spain 9 1 11.0 2 0.0 7 14.3Greece 8 2 0.25 3 33.0 5 20.0Germany 5 0 0.00 1 0.0 4 0.0Portugal 5 0 0.00 0 - 5 0.0Others* 27 6 22.2 10 30.0 17 17.6
North America: 42 4 9.5 24 8.3 18 11.1US 31 3 9.7 20 5.0 11 18.2Canada 11 1 9.1 4 25.0 7 0.0
SE Asia & India 34 1 2.9 11 9.1 23 0.0China 33 1 3.0 20 0.0 13 7.7Middle East 17 1 5.9 10 0.0 8 12.5South America 7 0 0.00 3 0.0 4 0.0Africa 6 0 0.00 3 0.0 2 0.0Total 657 141 21.5 309 24.9 348 18.4
* 4 submissions from each of Belgium, France, the Netherlands and Sweden; 3 from Denmark; 2 from each of Cyprus, Finland and Italy; and 1 from Belarus and Norway.
10

Table 3: Descriptive Statistics for Stages and Rounds of Review Process
1997-2006
1997-2000
2001-2004
2005-2006
Row Elapse time between events1 No.of paper
s
Mean (days)
Median (days)
No.of papers
Mean (days)
Median (days)
No.of papers
Mean (days)
Median (days)
No.of papers
Mean (days)
Median (days)
1 Total days to final decision 657 252 156 261 328 211 251 258 168 145 104 682 Total days to final decision
(exc. outright rejections) 550 295 189 242 351 226 214 298 206 96 148 98
3 Total days with journal (all rounds)
657 171 145 261 220 187 251 174 159 145 77 68
Round 14 S1R1: JEd selects ASE 639 8 4 256 12 7 247 5 1 136 4 25 S2R1: ASE suggests reviewers 541 21 13 236 22 14 212 23 14 95 11 86 S3R1: Reviews received 536 99 86 231 115 97 211 96 88 94 68 567 S4R1: ASE recommend to JEd 636 18 12 254 22 14 247 18 14 135 10 78 S5R1: JEd decision to Author 656 4 1 260 5 0 251 4 2 145 4 19 Total days with journal R1 657 127 120 261 160 151 251 127 125 145 68 6410 Days with author R1 202 203 144 95 237 153 90 173 139 17 171 152 Round 2 11 S3R2: Reviews received 180 100 86 80 126 111 85 84 84 15 58 6212 S4R2: ASE recommend to JEd 195 15 10 92 16 12 87 15 10 16 7 513 S5R2: JEd decision to Author 201 4 0 95 5 0 89 4 1 17 1 114 Total days with journal R2 201 109 96 95 127 122 89 99 94 17 59 5615 Days with author R2 107 87 53 44 107 62 50 75 47 13 63 54 Round 3 16 S3R3: Reviews received 52 72 65 21 97 79 26 60 60 5 29 1717 S4R3: ASE recommend to JEd 76 20 11 38 24 12 32 17 13 6 8 618 S5R3: JEd decision to Author 107 5 1 44 7 0 50 3 1 13 4 119 Total days with journal R3 107 54 34 44 74 39 50 45 35 13 19 720 Days with author R3 34 93 43 11 145 76 21 71 27 2 39 39 Round 4 21 Total days with journal R4 34 32 13 11 33 13 21 32 8 2 25 2522 Days with author R4 7 34 15 1 15 15 5 39 11 1 27 27 Round 5 23 Total days with journal R5 7 1 0 1 2 2 5 1 0 1 2 2
Note to table: S = stage and R = round of review process.
11

Table 4: Outright Reject by Country
1997-2006 1997-2001 2002-2006
Region
No. Outright
reject rate %Outright
reject rate %Outright
reject rate % UK & Ireland 33 9.4 6.3 12.5 Australia & NZ 17 14.9 2.1 24.2 Europe 16 29.6 12.5 36.8 North America 6 14.3 0.0 33.3 SE Asia & India 19 55.9 27.3 69.6 China 8 24.2 15.0 38.5 Middle East 3 17.6 20.0 12.5 South America 4 57.1 33.3 75.0 Africa 1 16.7 33.3 0.0 Total 107 16.3 7.8 23.9
12

Table 5: Revise and Resubmit Decisions
Panel (a): Revision Combinations Revision combination Total
papers Accept Reject
Full Partial Minor No. % No. % of acceptances
No. % of rejections
1 round 0 0 455 69.3 1 0.7 454 88.02 rounds:
0 0 1 17 2.9 16 11.3 1 0.20 1 0 8 1.2 6 4.3 2 0.41 0 0 71 10.8 19 13.5 52 10.1
3 rounds: 0 0 2 2 0.3 2 1.4 0 0.00 1 1 5 0.8 5 3.5 0 0.00 2 0 2 0.3 1 0.7 1 0.21 0 1 40 6.1 40 28.4 0 0.01 1 0 6 0.9 6 4.3 0 0.02 0 0 18 2.7 12 8.5 6 1.2
4 rounds: 0 1 2 1 0.2 1 0.7 0 0.01 0 2 5 0.8 5 3.5 0 0.01 1 1 9 1.4 9 6.4 0 0.02 0 1 7 1.1 7 5.0 0 0.02 1 0 3 0.5 3 2.1 0 0.0
5 rounds: 0 3 1 1 0.2 1 0.7 0 0.00 2 2 1 0.2 1 0.7 0 0.01 2 1 2 0.3 2 1.4 0 0.02 0 2 3 0.5 3 2.1 0 0.03 0 1 1 0.2 1 0.7 0 0.0
Total 657 100.0 141 100.0 516 100.0
Panel (b): Rate of Accept/Reject Decisions at Each Round
Round No. of papers
% Accept % Reject
1 455 0.2 99.8 2 96 42.7 57.3 3 74 90.5 9.5 4 24 100.0 0.0 5 8 100.0 0.0
Total 657
13

Table 6: No. of Authors
No. of authors
% of submissions:
1997-2006
% of submissions:
1997-2001
% of submissions:
2002-2006 1 41.1 47.6 35.3 2 38.5 35.6 41.1 3 17.7 14.9 20.1 4 2.6 1.9 3.2 5 0.2 0.0 0.3
Total 100.0 100.0 100.0
14