Performance Evaluation of AODV Routing Protocol in MANET ...
Upload
independentCategory
view
1download
0
Australian Journal of Engineering Research SCIE Journals
Australian Society for Commerce Industry & Engineering www.scie.org.au
Simulation Analysis of AODV-Assort Mobile Nodes
Reema Gupta1,Pardeep Maan2,Pooja N.C.College Of Engineering
[email protected],[email protected],[email protected]
Abstract
Ad-hoc networks are wireless networks where nodes communicate with each other using multi-hop links. There is no stationary infrastructure or base station for communication. In the infrastructure network base stations are fixed. Mobile unit communicate to its base station but when mobile unit goes out of range of one base station it connects with another base station either loosing connection or without losing connection(hard handoff/soft handoff). Adhoc network is infrastructure less network , Such networks can be deployed anywhere and at any time or the fly. Each node itself acts as a router for forwarding and receiving packets to/from other nodes. Routing in adhoc-networks has been a challenging task ever since the wireless networks came into existence. The major reason for this is the constant change in network topology because of high degree of node mobility. A number of protocols have been developed for accomplish this task. The objective of the proposed work is to study the AODV[1,7] protocol performance on the basis of Throughput of generating packets at current node vs. simulation time, Packet size Vs. Maximum throughput of sending packet, Packet Size vs. Maximal Simulation End-to –End-Delay, Throughput of sending packets vs. Simulation time when the number of mobile nodes vary. Output results are compared using network simulator-2(NS2). Keywords:-AODV,RREQ, RREP, proactive, Reactive, Throughput, Simulation End to End delay I .INTRODUCTION
Based on the routing information update mechanism routing protocols can be classified into three
major categories:-
1. Proactive or table-driven protocols:- In table driven routing protocol every node contains /maintains
table that tells the network topology information so that whenever the path is required to transfer data from
source node to destination node path finding algorithm can be applied on the tables maintained to retrieve
the path. [3]It focuses on maintaining the consistency between the nodes.
2. Reactive or On-demand protocols:- In this protocol no table is maintained , path is obtained by using a
connection establishment process. No network topology information is maintained in advance in the form of
tables. Routes are created whenever the required. When a source wants to send a destination, it invokes the
route discovery mechanisms to find the path to the destination.
3. Hybrid Routing Protocols:-This protocol combined the feature of both the protocols described above.

Australian Journal of Engineering Research SCIE Journals
Australian Society for Commerce Industry & Engineering www.scie.org.au
YES NO
YES
Fig 1.1 Description Of Hybrid Routing Protocol II .Aodv Protocol
AODV is a reactive protocol [8], i.e. it creates route on-demand, as requires. When a source node needs a route to some destination node, it broadcasts a route request message to its neighbours including the last known sequence number for that destination. Each node that forwards the route request creates a reverse route for itself back to the source node. [4,7]When the route request reaches a node with a route to destination node that node generates a route reply that contains the number of hops necessary to reach destination and the sequence number for destination most recently seen by the node generating the REPLY. The state created in each node along the path from source to the destination is hop-by-hop state that is each node remembers only the next hop and not the entire route, as would be done in source routing. Even though reactive protocols overcome increased overhead problem, but they exhibit end-to-end delay since routes are created on demand. AODV is designed for use in networks where the nodes can all trust each other, either by use of preconfigured keys. Route Requests (RREQs), Route Replies (RREPs), and Route Errors (RERRs) are the message types defined by AODV. The process broadcasts a ROUTE REQUEST packet, which is flooded across the network. In addition to the source node address and target node address, the request packet contains a route record, which records the sequence of hops taken by the request packet as it propagates through the network. RREQ packets use sequence numbers to prevent duplication. The request is answered by a ROUTE REPLY packet either from the destination node or an intermediate node that has a cached route to the destination. Route table entries are created by following the procedure When a node receives an AODV control packet from a neighbor, or creates or updates a route for a particular destination or subnet, it checks its route table for an entry for the destination. In the event that there is no corresponding entry for that destination, an entry is created. The sequence number is either determined from the information contained in the control packet, or else the valid sequence number field is set to false. The route is only updated if the new sequence number is either (i) higher than the destination sequence number in the route table, or (ii) the sequence numbers are equal, but the hop count (of the new information) plus one, is smaller than the existing hop count in the routing table, or (iii) the sequence number is unknown.
Node Enter For the communication
Is this node is
with the
zone?
On-Demand Approach
Table-Driven Approach

Australian Journal of Engineering Research SCIE Journals
Australian Society for Commerce Industry & Engineering www.scie.org.au
III. Results
Metrics considered for performance evaluation of AODV [5]when mobile nodes vary.
1. Throughput of generating packets at current node vs. simulation time
2. Packet size Vs. Maximum throughput of sending packet
3. Packet Size vs. Maximal Simulation End-to –End-Delay
4. Throughput of sending packets vs. Simulation time The number of mobile nodes varied in the network as 3, 6, 12, 16, 24, 35, 50. GRAPH-1 for 3 mobile nodes
1. Throughput of generating packets at current node vs. simulation time
Fig 3.1 Throughput of generating packets at current node vs. simulation time of 3 nodes
This graph concludes that throughput of generatisng packets at node number 0 varies with the simulation time initially it increases with the simulation time then decreases upto 80 second of simulation time where it achieve least throughput,thereafter as the time increases thoughput increases with the time and achieve maximal value.
2. Packet size Vs. Maximum throughput of sending packet
Fig 3.2 Packet size Vs. Maximum throughput of sending packet of 3 nodes

Australian Journal of Engineering Research SCIE Journals
Australian Society for Commerce Industry & Engineering www.scie.org.au
Maximum throughput of sending packet varies proportionally with the packet size after touching x-axis of graph .
3. Packet Size vs. Maximal Simulation End-to –End-Delay
Fig 3.3 Packet Size vs. Maximal Simulation End-to –End-Delay of 3 nodes
Maximal End To End delay varies proportionally with the packet size after touching x-axis of graph .
4 .Throughput of sending packets vs. Simulation time
Fig 3.4 Throughput of sending packets vs. Simulation time of 3 nodes
Throughput of sending packets achieves maximal value at the starting stage thereafter value decreases and varies slightly with time and at time 82 second it increases then varies slightly with the time. GRAPH-2 for 12 mobile nodes
1. Throughput of generating packets at current node vs. simulation time

Australian Journal of Engineering Research SCIE Journals
Australian Society for Commerce Industry & Engineering www.scie.org.au
Fig 3.5 Throughput of generating packets at current node vs. simulation time of 12 nodes
From this graph12] throughput of generating packets at current nodes varies with the simulation time and throughput is maximum at 25 second and least at 45 second.
2. Packet size Vs. Maximum throughput of sending packet
Fig 3.6 Packet size Vs. Maximum throughput of sending packet of 12 nodes
This graph concludes that as the packet size in bytes increases its maximum throughput of sending packet also increases. When the packet size below 100 bytes it shows dynamic behaviour (increase ,decrease then again increase proportionality). 3. Packet Size vs. Maximal Simulation End-to –End-Delay

Australian Journal of Engineering Research SCIE Journals
Australian Society for Commerce Industry & Engineering www.scie.org.au
Fig 3.7 Packet Size vs. Maximal Simulation End-to –End-Delay of 12 nodes
This graph[10] concludes that as the packet size in bytes increases its maximal End to End delay also increases. When the packet size below 100 bytes it shows dynamic behavior (increase, decrease reaches to zero then again increase proportionality). This factor tells the delay a packet suffers between leaving the application and arriving at the receiver application.
4. Throughput of sending packets vs. Simulation time
Fig 3.8 Throughput of sending packets vs. Simulation time of 12 nodes
This graph concludes that throughput of sending packets decreases with the simulation time. GRAPH-3 for 24 mobile nodes
1. Throughput of generating packets at current node vs. simulation time

Australian Journal of Engineering Research SCIE Journals
Australian Society for Commerce Industry & Engineering www.scie.org.au
Fig 3.9 Throughput of generating packets at current node vs. simulation time of 24 nodes
From this graph throughput of generating packets at current node varies positive with the simulation time and achieve maximum value when simulation time is 100 second. After this time throughput of generating packets at current node decreases with the simulation time.
2. Packet size Vs. Maximum throughput of sending packets
Fig 3.10 Packet size Vs. Maximum throughput of sending packet of 24 nodes
This graph[10,11] concludes that as the packet size in bytes increases its maximum throughput of sending packet also increases. When the packet size below 100 bytes it shows dynamic behavior(increase ,decrease then again increase proportionality). 3. Packet Size vs. Maximal Simulation End-to –End-Delay

Australian Journal of Engineering Research SCIE Journals
Australian Society for Commerce Industry & Engineering www.scie.org.au
Fig 3.11 Packet Size vs. Maximal Simulation End-to –End-Delay of 24 nodes
Maximal End To End delay varies proportionally with the packet size after touching x-axis of graph .
4.Throughput of sending packets vs. Simulation time
Fig 3.12 Throughput of sending packets vs. Simulation time of 24 nodes From this graph throughput[12] of sending packets varies with simulation time Initially the throughput achieves highest value thereafter value decreases with the time and at a instant again achieve highest value and thereafter value varies at its highest value then again decreases with the time.
GRAPH-4 for 50 mobile nodes 1. Throughput of generating packets at current node vs. simulation time

Australian Journal of Engineering Research SCIE Journals
Australian Society for Commerce Industry & Engineering www.scie.org.au
Fig 3.13 Throughput of generating packets at current node vs. simulation time of 50 nodes
Throughput of generating packets at current node 0 varies in its behaviour with simulation time .
2. Packet size Vs. Maximum throughput of sending packets
Fig 3.14 Packet size Vs. Maximum throughput of sending packet of 50 nodes This graph concludes that as the packet size in bytes increases its maximum throughput of sending packet also increases. When the packet size below 100 bytes it shows dynamic behavior(increase ,decrease then again increase proportionality). 3. Packet Size vs. Maximal Simulation End-to –End-Delay

Australian Journal of Engineering Research SCIE Journals
Australian Society for Commerce Industry & Engineering www.scie.org.au
Fig 3.15 Packet Size vs. Maximal Simulation End-to –End-Delay of 50 nodes
Maximal End To End delay varies proportionally with the packet size after touching x-axis of graph .
4.Throughput of sending packets vs. Simulation time
Fig 3.16 Throughput of sending packets vs. Simulation time of 50 nodes
From this graph throughput of sending packets varies with simulation time initially the throughput achieves highest value thereafter value changes slightly with time.
Australian Journal of Engineering Research SCIE Journals
Australian Society for Commerce Industry & Engineering www.scie.org.au
Analysis Of AODV Protocol After Varying Mobile Nodes
Parameters 3 6 12 16 24 35 50
Simulation Time 140 138.0122 140 140 140 140 140
No. Of packets Generated
20288 14717 24739 39125 55210 75564 98334
No. Of Sent Packets 20240 14645 24610 39016 55032 75275 97843
Packet Dropping Nodes 0,1,2 0,2,4,5 0,1,2,4,5,6 8,10,11
0,1,2,4,7 8,10
0,1,2,4,6,7,8 10,13,15,20,23
0,1,2,4,6,7,8, 9,10,11,12,13,15
0,1,2,3,4,6,7, 8,9,10,11,12,13
No. Of Generated Packets at Current Node
8424 3499 6654 13381 17979 23452 25901
No. Of Sending Nodes 3 6 12 16 24 35 50
No. Of Receiving Nodes
3 3 4 5 5 5 9
Table 1 Analysis Of AODV Protocol After Varying Mobile Nodes
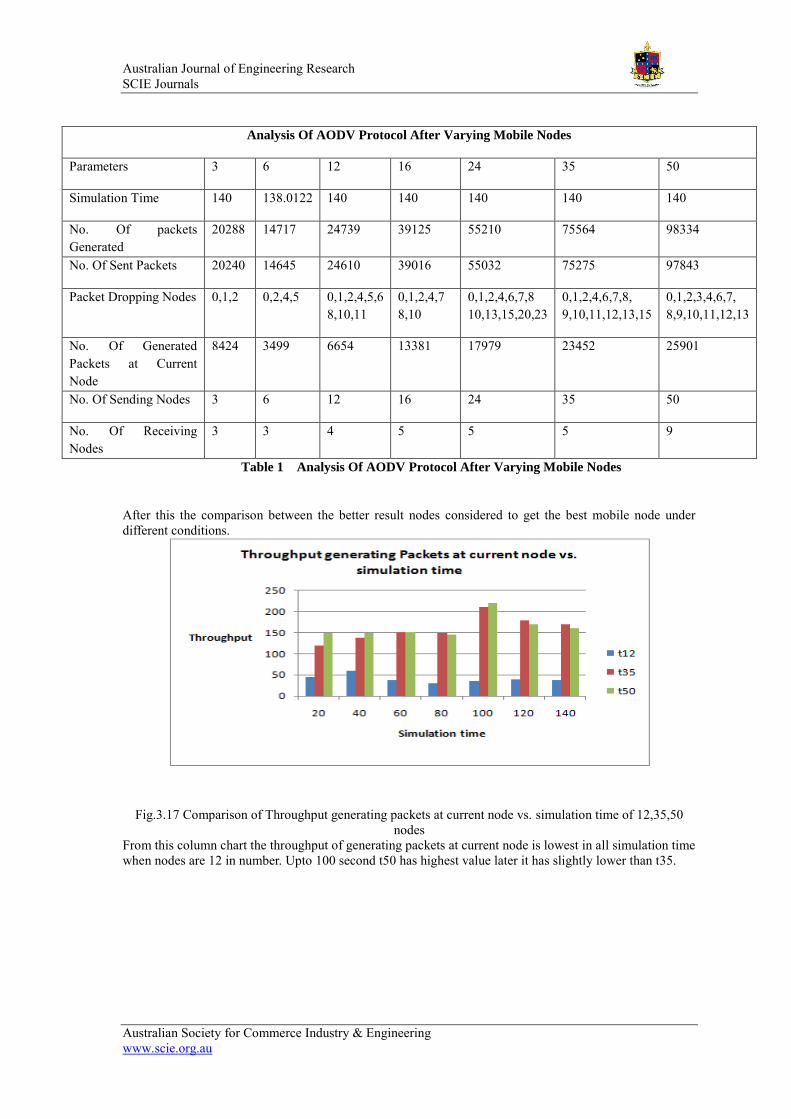
After this the comparison between the better result nodes considered to get the best mobile node under different conditions.
Fig.3.17 Comparison of Throughput generating packets at current node vs. simulation time of 12,35,50
nodes From this column chart the throughput of generating packets at current node is lowest in all simulation time when nodes are 12 in number. Upto 100 second t50 has highest value later it has slightly lower than t35.

Australian Journal of Engineering Research SCIE Journals
Australian Society for Commerce Industry & Engineering www.scie.org.au
Fig.3.18 Comparison of Throughput of sending packets vs. simulation time of 12,35,50 nodes Throughput of sending packets is highest in the network when the mobile nodes are 50 ,next highest gained when mobile nodes are 35 then 12. tt50>tt35>tt12
Fig.3.19 Comparison of packet size vs. Max. throughput of sending packets of 12,35,50 nodes Maximum Throughput of sending packets is highest in case of network when mobile nodes are 12 in number and it is lowest when the number is 35. Conclusion
The objective was to study the AODV protocol after varying the mobile nodes in the network that want to communicate to each other. The mobile nodes taken in the number was 3,6,12,16, 24,35, 50 and performance variation is detected on the basis of metrics Throughput of generating packets at current node vs. simulation time, Packet size Vs. Maximum throughput of sending packets, Packet Size vs. Maximal Simulation End-to –End-Delay, Throughput of sending packets vs. Simulation time. From the graphs it has been concluded that Throughput of generating packets at current node increases with the number of mobile nodes increases with the simulation time. Maximum throughput of sending packets is calculated as the packet size increases in bytes and it has been found that Throughput varies and it is maximum in case when

Australian Journal of Engineering Research SCIE Journals
Australian Society for Commerce Industry & Engineering www.scie.org.au
mobile nodes are 12 and then second maxima when mobile nodes are 50 and then 35.Throughput increases when the mobile nodes changed from 3 to 6 and 16 to 24 .Maximal Simulation End To End delay is found more when the mobile nodes are 12, 35, 50 as compared to 3,6,24 mobile nodes. Delay is least in case when mobile nodes are 16 in the network. Throughput of sending packets increases as the no. of mobile nodes increases in the network. Throughput is maximum in case when number of mobile nodes is 50 and least when number of mobile nodes is 3 at the initial simulation time. At the end of simulation Throughput is maximum when no of mobile nodes is 50 and least when it is 6. Among taken 7 set of mobile nodes {3,6,12,16,24,35,50) 3 node set work best as compared to other 4 node set i.e. {12,35,50) node set work best than {3,6,16,24}.Among the nodes in the selected set throughput of generating packets at current node is t50 >=t35>>>t12 it means the result is almost same when nodes are 50,35 but has much larger value as compared to network having 12 nodes. Throughput of sending packets is highest in the network when the mobile nodes are 50 ,next highest gained when mobile nodes are 35 then 12.tt50>tt35>tt12. Maximum Throughput of sending packets is highest in case of network when mobile nodes are 12 in number and it is lowest when the number is 35.ts12>ts50>ts35. References
[1] Prashant Kumar Maurya ,Gaurav Sharma ,Vaishali Sahu , ‖An Overview Of AODV Routing Protocol‖ International Journal of Modern Engineering Research (IJMER) Vol.2, Issue.3, pp-728-732 May-June 2012 [2] Samir R. Das, Charles E. Perkins, Elizabeth M. Royer ―Performance Comparison of Two On-demand Routing Protocols for Ad Hoc Networks‖ Communications SystemsLaboratory Nokia Research Center [3]Anurag Porwal1, B.L.Pal2, Rohit Maheshwari3, Gaurav Kakhani4 ―Study and Design of New Reactive Routing Protocol Advance AODV for Mobile Ad hoc Networks‖ Vol. 2, Issue 3, May-Jun 2012, pp.3195-3204 International Journal of Engineering Research and Applications (IJERA). [4] Sheng Liu, Yang Yang, Weixing Wang ―Research of AODV Routing Protocol for Ad Hoc Networks‖ 2013 AASRI Conference on Parallel and Distributed Computing and Systems [5] Josh Broch David A. Maltz David B. Johnson Yih-Chun Hu Jorjeta Jetcheva ―A Performance Comparison of Multi-HopWireless Ad Hoc Network Routing Protocols‖ [6] C. K. Toh, “Ad Hoc Mobile Wireless Networks: Protocol and System,” Prentice Hall PTR 2002 [7] Reema Gupta,Dr. Sukhvir Singh,Pardeep Maan ― Secure and Effective Reactive Protocol for Mobile Adhoc Network-AODV‖ in IJEDR | Volume 2, Issue 2 2014 [8] Humayun Bakht, Madjid Merabti, and Robert Askwith. ― A routing protocol for Mobile ad hoc networks‖. in 1st International Computer Engineering Conference. 27-30 December. Cairo , Egypt. [9] C.Siva Ram Murthy ,B.S.Manoj ―Adhoc Wireless Networks Architecture and protocols‖ pearson [10] Marc Greis’s tutorial http://www.isi.edu/nsnam/ns/tutorial/index.html [11] Jae Chung and Mark Claypool tutorial http://nile.wpi.edu/NS/ [12] The ns Manual The VINT Project A Collaboration between researchers at UC Berkeley, LBL, USC/ISI, and Xerox PARC
Copyright © 2022 FDOKUMEN