
The Influence of Technical Illustrations on Students - UNSWorks
330
The Influence of Technical Illustrations on Students' Comprehension in Geography by Kenneth Norman Purnell Thesis submitted in partial fulfilment of the Degree of Doctor of Philosophy in Education at the University of New South Wales, 1990
-
Upload
khangminh22 -
Category
Documents
-
view
0 -
download
0
Transcript of The Influence of Technical Illustrations on Students - UNSWorks

The Influence of Technical Illustrations on Students'
Comprehension in Geography
by
Kenneth Norman Purnell
Thesis submitted in partial fulfilment of the
Degree of Doctor of Philosophy
in Education at the
University of New South Wales,
1990

11
Contents
Certificate of originality ........................................................................... vii
Declaration relating to disposition of project report/thesis ................................... viii
Acknowledgements ................................................................................ ix
Abs'tta.Ct ......................................................................... .................... xii
OVERVIEW OF EXPERIMENTS ............................................................... 1
SECTION 1 ......................................................................................... 3
Introduction ......................................................................................... 4
Review of empirical literature ..................................................................... 6
The picture and word problem ........................................................... 6
illustrations and text comprehension .................................................... 9
Cognitive Theory .................................................................................. 19 '
Experiment 1 ....................................................................................... 29
Method .................................................................................... . 29
Subjects ........................................................................... 29
Design ............................................................................. 30
Materials ........................................................................... 30
Procedure ......................................................................... 32
Results ..................................................................................... 33
Discussion ................................................................................. 37
Experiment 2 ....................................................................................... 39
Method ..................................................................................... 39
Subjects ........................................................................... 39
Design ............................................................................. 40
Materials ........................................................................... 44
Proced.ure ........................................................................ . 45
Results ..................................................................................... 49

iii
Discussion ................................................................................. 57
Exi;,erittlent 3 ...•...........................•..........•...•.•...•........•......................... 6()
Method .............. ....................................................................... 61
Subjec:ts ...........•......•.••...••....•...•••......•.............................. 61
Design ............................................................................. 61
Materials ........................................................................... 63
Pt-oced.llre . . . . . . . . . . • . . . . . . . • . . . • . . . . . • . . . . . . . . . . . . . • . . . . . . . . . . . . . . . . . . . . . . . . . . . . . . 64
Results and discussion ................................................................... 66
Experiment 4 ....................................................................................... 7 0
Method ..................................................................................... 71
Subjects ........................................................................... 71
Design ............................................................................. 71
Materials ........................................................................... 73
Pt-oced.ure .••......••......................•....................................... 7 4
Results ..................................................................................... 77
Discussion ................................................................................. 82
Exi;,erittlent 5 ....................................................................................... 86
Metltod •.....................................•.....•....•................................... 86
Subjects ........................................................................... 86
Design ............................................................................. 86
Materials ........................................................................... 89
Pt-oced.llre . . . . . . . . . . . . . . . . . . . . . • . . . . . . . . . . . • . . . . . . . . • . . . . . . . . . . . . . . . . . . . . . . . . . . . . . . 90
Results and discussion ................................................................... 92
General Discussion Experiments 1 to 5 ......................................................... 97
SECTION 2 ...................................................................................... 102
Introduction ...................................................................................... 103
Review of empirical literature .................................................................. 105

iv
Cognitive Theory . .. . . . . . . . . . . . . . .. . .. . . .. . .. . . . . . . . . . . . . . . . . . . . . . . . .. . . .. . .. . . . . . .. . . . . . . . . . .. . . 110
Ex:l)Criment 6 . . . . . . . . . . . . . . . . . . . . . . . . . . . . . . . . . . . . . . . . . . . . . . . . . . . . . . . . . . . . . . . . . . . . . . . . . . . . . . . . . . . . . 114
Method ................................................................................... 114
Subjects ................................ · ......................................... 114
l)esign . . . .. . .. . . .. . .. . . . . . . .. . . . . . .. . . . . . . . . . . . . .. . . .. . . . . . .. . . .. . .. . . .. . . . . . .. . . 114
Materials ......................................................................... 115
Procedure .. . . . .. . . .. . .. . . .. . . .. . .. . . . . . . .. . .. . . . . . . . . . .. . . . . . .. . . .. . . . . . . . . . . . . . 116
Results and discussion ................................................................. 118
Ex:l)Criment 7 . . . . . . . . . . . .. . . . . . .. . . . . . . . . .. . . . . . .. . . .. . . . . . . . . .. . . .. . . . . . . . . . .. . . . . . . . . . . . . .. . . . . . 121
Method ................................................................................... 121
Subjects ......................................................................... 121
l)esigii ........................................................................... 122
Materials ......................................................................... 123
Procedure ....................................................................... 123
Results and discussion ................................................................. 126
Experiment 8 ..................................................................................... 132 ,,
Method ................................................................................... 132
Subjects ......................................................................... 132
l)esign ........................................................................... 132
Materials ......................................................................... 134
Procedure ....................................................................... 135
Results and discussion ................................................................. 137
Experiment 9 ..................................................................................... 141
Method ................................................................................... 141
Subjects ......................................................................... 141
l)esign. ........................................................................... 142
Materials ......................................................................... 143
Procedure ....................................................................... 143

V
Results and discussion ................................................................. 145
General Discussion Experiments 6 to 9 ....................................................... 150
GENERAL CONCLUSION ................................................................... 153
REFERENCES .................................................................................. 161
APPENDICES ................................................................................... 182
Appendix 1
Reading materials and multiple choice items for Experiment 1 ........... 183
Appendix2
Proportions correct data for students in Experiment 1 ..................... 198
Appendix3
Reading materials and multiple choice items for Experiment 2 ........... 201
Appendix4
Proportions correct data for students in Experiment 2 ..................... 222
Appendix5
Reading materials and multiple choice items for Experiment 3 ........... 230
Appendix6
Proportions correct data for students in Experiment 3 ..................... 259
Appendix?
Reading materials and multiple choice items for condition TI in
Experiment 4 .................................................................... 260
Appendix 8
Proportions correct data for students in Experiment 4 ..................... 267
Appendix 9
Reading materials and multiple choice items for Experiment 5 ........... 270
Appendix 10

vi
Proportions correct data for students in Experiment 5 ..................... 280
Appendix 11
Reading materials for Experiment 6 .......................................... 281
Appendix 12
Proportions correct data for students in Experiment 6 ..................... 285
Appendix 13
Reading materials and test items for Experiments 7, 8 and 9 ............. 287
Appendix 14
Proportions correct data for students in Experiment 7 ..................... 307
Appendix 15
Proportions correct data for students in Experiment 8 ..................... 311
Appendix 16
Proportions correct data for students in Experiment 9 ..................... 315

vii
Certificate of originality
I hereby declare that this submission is my own work and that, to the best of my
knowledge and belief, it contains no material previously published or written by
another person nor material which to a substantial extent has been accepted for the
award of any other degree or diploma of a university or other institute of higher
learning, except where due acknowledgement is made in the text.
(Sig

THE UNIVERSITY OF NEW SOUTH WALES
Declaration relating to disposition of project report/thesis
viii
SRPTOl
Forml
Waiver
This is to certify that I, Kenneth Norman Purnell, being a candidate for the degree
of Doctor of Philosophy, am fully aware of the policy of the University relating to
the retention and use of higher degree project reports and theses, namely that the
University retains the copies submitted for examination and is free to allow them to
be consulted or borrowed. Subject to the provisions of the Copyright Act, 1968,
the University may issue a project report or thesis in whole or part, in photstat or
microfilm or other copying medium.
In light of these provisions I grant the University Librarian permission to publish,
or to authorize the publication of my project report/thesis, in whole or part.
I also authorize the publication by University Microfilms of a 350 word abstract in
Dissertation Abstracts International (applicable to doctorates only).
Signa
Witness ....
Date- ..

ix
Acknowledgements
Acknowledgement is made for the support and advice given by my academic
supervisor, Professor Robert Solman, at the University of New South Wales in the
conducting and reporting of this research. The friendly and professional guidance
of Robert in the planning and conducting of all aspects of the research and the
presentation of this thesis is deeply appreciated. Robert has had many articles
published in high criterion journals and his untiring work in co-authoring two
papers with me based upon my doctoral research has been invaluable. The first,
based on the Experiments 1 to 5 reported in this thesis and entitled "The influence
of technical illustrations on students' comprehension in geography", will appear in
Reading Research Quarterly, 26 (July-August, 1991). The second paper based on
the Experiments 6 to 9 reported in this thesis and co-authored also with Professor
John Sweller is under review with Instructional Science. Robert has devoted a
great deal of his time and energy to me throughout both my doctoral research and
the two papers for publication in higher criterion journals based upon my research.
The accomplishment of having these two papers published internationally and
presenting various seminars to educators on my research and its findings would not
have been possible without Robert's professional support and insightful guidance.
I am deeply indebted to Robert for his expert advice and help in all facets of
conducting and reporting my research.
I should also like to acknowledge the work done by Professor John Sweller from
the School of Education at the University of New South Wales in co-authoring the
paper entitled "The effects of technical illustrations on cognitive load". This paper
is based upon the research and findings of Experiments 6 to 9 reported in this
thesis. John has done much work in the area of cognitive science and as a result of
his extensive studies he has developed cognitive load theory. Like Robert, John

X
has had many papers, both empirical and theoretical, published in a number of
leading psychology and technical journals. His work with Robert and me in the
writing of the second paper from my doctoral research has been most helpful.
Appreciation is expressed to the staff and students at St. Andrew's Cathedral
School, Sydney. In particular, the expertise of the staff in the Economics and
Geography Department in assessing reading materials and test items used in my
research is acknowledged as is their assistance with the running of our Department
throughout my studies. The granting of my long service leave and study leave to
finish my university studies for this thesis by the Headmaster, Allan Beavis, the
work of Rick Collins in my place as Acting Head of Department and Bob
VanHouten's attending various school meetings on my behalf is very much
appreciated.
I would also like to express my deep thanks to my dear friend David Jenkins
(deceased) for his expertise and assistance in assessing the reading materials and
test items for many of the experiments I conducted in my doctoral research. David
and I grew up together and also held common interests as Geography and
Economics teachers. David had a keen interest in my doctoral research and his
proof reading of early drafts of this thesis and the paper based upon the first five
experiments reported here led him to make a number of helpful suggestions.
David's love for Geography and teaching, especially after he became a quadriplegic
in 1981, was an inspiration to me and many others with whom he came in contact
I deeply appreciated his keen interest in my studies and the encouragement he
offered to me.
Finally, I would like to express my deep appreciation to my wife Sandra for being
so supportive throughout my doctoral studies. Sandra's kindness, love and

xi
patience set a framework in which I could work effectively at all times on my
research, and in writing the two papers and this thesis. The extra work Sandra did
at home, particularly in the final stages of writing this thesis, and her loyalty and
. encouragement throughout my research contributed a great deal to getting me
through all aspects of my studies.

xii
Abstract
The use of illustrations in the comprehension of technical material was examined
for students of good to very good reading ability in nine experiments. Experiment
1 looked at the effects of using illustrations upon the comprehension of expository
text and found that the presence of different but related content in an illustration did
not improve the comprehension of the content presented in the text. These data
suggested that these illustrations could be treated as presenting information in their
own right and not simply as aids to the comprehension of content presented in text
In Experiments 2, 4 and 5 when content was presented as text and illustration
comprehension was superior. In Experiments 2, 3, 4 and 5 content presented in
an illustration was comprehended better than the same content presented in text.
These data suggested that where technical content lends itself to being presented as
either text or illustration, the comprehension of important content can be improved
by presenting it as text and illustration, and that illustrations of spatial information
are superior to the presentation of this content in text.
The effects on cognitive resources of splitting attention between illustrations and
their descriptors were examined in Experiments 6 to 9. Experiment 6 looked at the
effect of having descriptors incorporated within illustrations and found that there
was an observable advantage for combined formats over split formats. In
Experiments 7, 8 and 9 the combined form of presenting an illustration was
superior to having the descriptors for the illustration in an adjacent key. The data
suggested that the format of illustrations which requires students to mentally
integrate disparate sources of information imposes a heavy cognitive load. It was
concluded that the format of illustrations was superior when descriptors were
contained within the diagram as cognitive resources were not used in efforts to
integrate multiple sources of information.

xiii
The results of these experiments have implications which could lead to
improvement in the design of textbooks and instructional procedures.
Considerable advantages could accrue to both students and teachers by radical
recasting of cUITent instructional formats as suggested in this thesis.

1
OVERVIEW. OF EXfERIMENTS
There are two sections in this thesis which detail nine experiments on the use of
illustrations in high school geography in New South Wales 1• The first section
reports on five experiments which examine the use of illustrations and text.
Experiment 1 was concerned with the influence of a related illustration on the
comprehension of text. In this study it was observed that superior comprehension
resulted when content was presented in two forms, i.e. text and an illustration
repeated the same content. Based upon the theoretical discussion developed using
Paivio's (1971 & 1986) dual coding theory and supported by Craik and Lockhart's
( 1972) depth of processing analysis of memory and Baddeley and his colleagues
theory of working memory (Baddeley & Hitch, 1974, 1977; Baddeley, 1988,
1989), the effects of repeating content in text and illustration were examined in
Experiments 2, 4 and 5. The first five experiments were also concerned with
comparing student comprehension and recall2 of the same content3 depicting spatial
information in technical illustrations or in text
1 The studies reported in this thesis employed high school students in a private
school for boys in Sydney. Therefore, the examination of sex and socio
economic differences on performance in the various experimental tasks is
beyond the scope of this thesis. As is noted in the section on further research,
these may be interesting variables to examine in the future.
2 When referring to comprehension and recall in this thesis, it should be noted that
comprehension is usually considered to include cognitive manipulation of
information whereas recall may or may not involve such cognitive manipulation.
The test items used in the experiments range from measuring straight factual
recall with the potential for little or no cognitive manipulation to requiring the
making of inferences where fairly extensive cognitive processing is required.

2
The best way of presenting technical illustrations which depict spatial information
was examined in the second section of this thesis based upon Sweller's (1988,
1989) cognitive load theory. This theory suggests that better comprehension results
when descriptors for an illustration appear on that illustration rather than separate to
it. Experiments 6, 7, 8 and 9 examined the predicted advantage for combined
descriptors with the illustration over situations where these are split
3 When the same content was presented as both text and illustration, the two forms
were as close as possible in their content. As the illustration was drawn first on
each occasion, great care was taken to transcribe the content of the illustration
into text to ensure that the content of the text was as close as possible to the
content of the illustration. The end results in each case were judged by experts
to be very similar. However, it is acknowledged that text attempting to depict
the same information as an illustration cannot be literally described as having
exactly the same content For efficiency the phrase "the same content" has been
used throughout this thesis when referring to information presented in text, the
content of which very closely approximates the same infomiation presented as an
illustration.

3

lntrodaction to Section 1 4
Introduction
What are the effects upon learning of having written text supplemented by technical
illustrations? Textbooks often utilize a variety of technical illustrations such as
diagrams, graphs, maps and photographs of various kinds. Most of these technical
illustrations are directly related to the written text with which they appear and are
presumably included to enhance reader comprehension of the subject under
discussion. Ferguson (1981) comments "many problems can be reduced to visual
form, and such reduction often facilitates their understanding and solution. Graphs
have become a part of our everyday activity. Newspapers, popular magazines,
trade publications, business reports, and scientific periodicals use graphic
representation extensively." (p. 25). Ward (1989) is of a similar opinion: "Since
an estimated one-third of the human brain is devoted to vision and visual memory,
engaging that sense can help scientists and nonscientists alike better understand
natural phenomena. Reduced to visual imagery, vast amounts of abstract data can
be conveyed in concise and dramatic form." (p. 737). Five medical practitioners in
their textbook apologize for the complexity of parts of the text and comment that "it
is hoped that the illustrations will help in understanding this section" (Beale,
Bradbury, Chilton, Climie & Cope, 1982, p. 18). Technical illustrations are
usually designed to augment the written text for readers either with additional
information or with the intent of clarifying the text content. The impression is that
authors, teachers and students consider that the written text is better remembered,
comprehended and recalled with the use of appropriate technical illustrations than
without such illustrations.
Considerable research has been devoted to examining the effects of using
illustrations to facilitate reader comprehension of written text. These investigations
range from an examination of using pictures as aids in learning single words,

Introduction to Section 1 5
where the weight of evidence indicates that pictures inhibit the acquisition of the
word naming response (Concannon, 1975; Harzem, Lee & Miles, 1976; Lang &
Solman, 1979; Samuels, 1967, 1970; Saunders & Solman, 1984; Singh & Solman,
in press), through to an examination of the influence of illustrations upon the
comprehension of text. The results of the latter studies have been to an extent
ambiguous. Some have demonstrated little or no improvements in comprehension
of text when an illustration accompanies it (Bieger & Glock, 1986; Concannon,
1975; Koenke, 1968; Miller, 1938; O'Keefe & Solman, 1987; Peeck, 1974;
Samuels, 1970; Vernon, 1950, 1953, 1954; Weintraub, 1960; Willows, 1978).
Other studies have demonstrated reliable advantages for the comprehension of
illustrated text (e.g. Donald, 1983; Hayes & Readence, 1982, 1983; Lesgold, De
Good & Levin, 1977; Lesgold, Levin, Shimron & Guttmann, 1975; Reid, Briggs
& Beveridge, 1983; Reinking, Hayes & McEneaney, 1988). Rigney and Lutz
(1976) suggested that learning is facilitated by illustrations because they induce
readers to form mental images of the material. The formation of mental imagery has
been shown to improve recall of both illustrated and non-illustrated text (Gambrell
& Bales, 1986; Long, Winograd & Bridge, 1989; Sadoski, 1983, 1985; Sadoski,
Goetz & Kangiser, 1988). Whilst mental imagery generated by readers is not the
same as illustrations they both may depict spatial information (Peterson, 1975) and
therefore it is likely that mental images and illustrations serve similar roles in the
processing of text (Schallert, 1980). Illustrations which depict the main ideas
(Koenke & Otto, 1969), or are high up in the hierarchy of the ideas of text (Haring
& Fry, 1979) or provide an organizing context for information (Hayes & Readence,
1983) have been found to aid comprehension of non-technical text. Several
researchers have also shown that pictures arouse the interest of readers and motivate
them to read (Gombrich, 1972; Kennedy, 1974; Samuels, 1970; Vernon, 1954).
In the first section of this thesis the effects of technical illustrations upon the
comprehension of text and the efficacy of illustrations in general is examined using

Introduction to Section 1 6
materials from a school geography curriculum.
Review of empirical literature
The study of the use of illustrations in reading falls generally into two categories.
Firstly, those studies involving young children which examine the effects of
illustrations upon the learning of words, and secondly, those studies which
examine the efficacy of illustrations upon the comprehension of text The latter of
these can be divided further into those studies which have found little or no benefits
of having illustrations accompany text, and those where a significant advantage for
the comprehension of text was obtained when illustrations were present
The picture and word problem
A number of investigations have examined the use of pictures as aids in learning
single words with young children (e.g. Braun, 1969; Concannon, 1975; Harris,
1967; Harzem et al., 1976; Lang & Solman, 1979; Samuels, 1967, 1970; Saunders
& Solman, 1984; Singer, Samuels & Spiroff, 1973-1974; Singh & Solman, in
press). In general these studies have reported no benefit or negative effects for the
use of pictures. Although it is not universally accepted that pictures are not
beneficial (Denburg, 1976-1977; Read & Barnsley, 1977) the weight of empirical
evidence strongly suggests that they inhibit the rate at which words are acquired
(e.g. Lang & Solman, 1979; Saunders & Solman, 1984). By way of example
several of the studies which fail to show any advantage of illustrations in word
acquisition will be reviewed.

Introduction to Section 1 7
The earliest reported studies in this area (Miller, 1937, 1939; Weintraub, 1960)
failed to show value in using pictures to teach sight words. This work was taken
up again by Samuels (1967, 1970). In 1967 he reported a number of studies in
which children viewed words with illustrations, sentences or both and in conditions
where the children learnt the words without illustrations and/or sentences. He
found that illustrations interfered with the acquisition of sight vocabulary and this
result has been replicated by other researchers using similar materials and
procedures (Braun, 1969; Harris, 1967; Harzem et al., 1976; Singer et al., 1973-
1974). Samuels (1970) suggested that the picture distracted the child's attention
from the word as it was more familiar and salient and this interfered with their
ability to concentrate on and properly discriminate the printed word (they processed
the picture and ignored the word). He proposed what has become known as the
focal attention hypothesis to explain this phenomenon and a number of empirical
studies have supported this hypothesis that pictures distract attention away from the
words being learnt (e.g. Braun, 1969; Duell, 1968; Harzem, Lee & Mills, 1976).
Solman and colleagues set out to examine Samuels' (1970) focal attention
hypothesis (Lang & Solman, 1979; Saunders & Solman, 1984). Lang and Solman
(1979) extended the hypothesis from an information processing viewpoint. Using
Kahneman's (1973) capacity-limitation hypothesis they presented some children
with word and picture at the same time, others where word presentation preceded
the presentation of the picture and others with no picture. Lang and Solman tested
the hypothesis that the simultaneous presentation of the word with the picture may
inhibit word acquisition by temporarily overloading a child's information
processing system. There was no difference between the conditions which had the
word accompanied by pictures and the word alone condition. As it was possible
that the word and picture were perceived as unrelated a third investigation examined

Introduction to Section 1 8
the effect of drawing children's attention to the link between the two. Conditions of
explicit association were compared to conditions where the child's attention was not
drawn to the association between the picture and the word. Instructions to associate
the picture and the word resulted in superior performance to conditions in which no
such instructions were given. The association question was addressed again by
Saunders and Solman (1984) in two studies replicating the association conditions
and in addition having a control condition with no picture. They also examined the
semantic priming hypothesis (see, for example, Posner & Synder, 1985; Wheldall
& Mittler, 1977) by presenting the picture before the word and comparing this with
the condition where the word was shown prior to the picture. The results showed
no advantage for spaced over simultaneous presentation conditions, performance
was not improved by drawing some children's attention to the association between
the word and the picture, and there was no advantage for showing the picture prior
to the word. They also found that children who learnt words without pictures
recognized more of the words being taught than children in the pictorial groups.
Saunders and Solman hypothesized that the children had not yet developed
sufficient cognitive skill to form a network in which they can integrate the picture
and the word.
Various manipulations had failed to produce an advantage for having pictures
accompany words when young children learnt words. All explanations to this point
suggested cognitive reasons for this failure from Samuels (1970) focal attention
hypothesis to aspects of limited capacity and semantic priming. However, these
theories have not satisfactorily explicated this phenomenon. As a consequence
there is some incentive to look elsewhere and Solman (1986) observed that the
transfer of the verbal response from the picture, which the child could already
name, to the word appeared to be an example of blocking of serial compound
learning (Kamin 1968, 1969). The blocking effect occurs when, for example, the

Introduction to Section 1 9
picture of a giraffe and the verbal response "giraffe" have already been associated,
and it is this prior association which blocks the new association with the printed
word "giraffe". The picture-word problem was viewed as a problem in compound
conditioning by Singh and Solman (in press) and Solman, Singh and Kehoe (under
review). Studies conducted within the framework of this account by Singh &
Solman with retarded children and by Solman, Singh and Kehoe with normal
children, have demonstrated large advantages for the no picture conditions over the
picture conditions which is consistent with the blocking theory. However,
whatever the final mechanisms may be the evidence is fairly compelling for the
failure of pictures to facilitate word acquisition.
Illustrations and text comprehension
There is a general perception that readers benefit from illustrations accompanying
text and that both illustrations and text have information which can be derived from
them. Research has indicated that information gained from text is the result of
interaction of the prior knowledge of the reader and the text (Anderson, Reynolds,
Schallert & Goetz, 1977; Bransford & Johnson, 1972; Brown, 1976; Dean &
Enemoh, 1983; Pichert & Anderson, 1977; Schallert, 1976). Existing knowledge
of readers has also been found to play a part in the interpretation and recall of
illustrations (Baggett, 1975; Franks & Bransford, 1971). Authors and publishers
select particular words and illustrations to convey their intended meaning and in so
doing there is a deliberate attempt to constrain the interpretive and constructive
processes of readers (Schallert 1980). Often illustrations are selected to accompany
text in the belief that they have some facilitative effect upon the comprehension of
text by perhaps making the text content clearer. However, when this suggestion
was looked at closely by Samuels (1970) he reported no such benefit and a further

Introduction to Section 1 10
review of the literature by Concannon (1975) came to the same conclusion. While
there are a number of studies which clearly show little or no benefit for the
comprehension of text by having accompanying related illustrations, there has been
a growing body of empirical evidence to suggest that the presence of illustrations
can improve text comprehension. The following discussion reviews the literature
on the efficacy of illustrations as aids to text comprehension. For convenience
studies have been grouped into those which found little or no benefit of having
illustrations accompany text on the comprehension of the text and those which
found some positive effects.
No benefit from illustrations
Early studies in the area of the contribution of illustrations to text comprehension
were undertaken by Miller (1938), Vernon (1950, 1953, 1954), Weintraub (1960)
and Koenke (1968). Both Miller and Weintraub used published basal readers for
materials (with simple narrative prose) and removed the illustrations for the no
picture condition. Miller found no advantage for the group with the illustrations
accompanying the text - a result replicated by Weintraub. Interestingly, Weintraub
found that with poor readers the no picture group comprehended the text better than
the group with related illustrations accompanying the text. Vernon ( 1953)
conducted two experiments in which she examined the effects of using pictorial
illustrations upon the remembering of written texts with boys and girls aged from
15 to 19. The reading materials were from health and history. Vernon found that
written material was remembered no better when accompanied by an illustration
than one not having an illustration. This finding was consistent with her earlier
work in 1950 when she found that the ability to understand and remember written
text was not always facilitated when the text was accompanied by a graph or chart

Introduction to Section 1 11
(Vernon, 1950). However, Vernon (1950) found a localized effect when some
specific key points made in the text were remembered better when graphs or
pictures were related to them, but overall she found no benefit for the
comprehension of text with accompanying related illustrations. Vernon (1953)
suggested that readers' attention may be distracted from text by illustrations not
closely related to it and so reduced comprehension of the text. However, Vernon
speculated that a positive benefit of illustrations may be to arouse reader interest in
text and motivating them to read. This suggestion is supported by the work of
Gombrich, 1972, Kennedy, 1974, and Samuels, 1970. Further work by Vernon
(1954) using children aged 11 and 12 in two experiments replicated her earlier
findings of no benefit for the comprehension of text of having accompanying
relevant illustrations. Koenke (1968) presented students in third and fourth grade
with illustrated and non-illustrated text about the places in which birds build their
nests. He found that children reading the illustrated versions of the stories did not
comprehend the text better than those without the illustrations.
Using an adapted cartoon strip with nine and ten year old children Peeck (1974)
provided evidence that illustrations do not facilitate comprehension of certain
information in text One group of children received the stories with illustrations and
another without. Questions on these materials tested recall and comprehension of
content in either the text alone, the illustrations alone or both the text and
illustrations. On tests immediately after reading the material, a day later and a week
later without re-reading the materials Peeck found comprehension by the group with
illustrations outperformed the text only group - but this benefit was largely
attributed to performance on the information presented in picture. There was no
difference between the illustration with text and text only conditions on questions
based on the text alone. That is, the presence of the illustrations did not improve
the comprehension of the text

Introduction to Section 1 12
Donald (1983) examined the effects of illustrations as providers of contextual
information for text with primary aged children at different progress and
developmental levels. He examined the contextual hypothesis which considers that
illustrations facilitate text comprehension by increasing the reader's access to
semantic information. Overall, Donald found that illustrations did not constitute a
significant source of information for readers and failed to improve comprehension
of text. He suggested that as readers develop their ability to utilize the linguistic
constraints of the text itself they may become more independent of an illustration
finding the text a more reliable basis for contextual prediction and confirmation.
O'Keefe and Solman (1987) conducted three experiments in which the effects of
illustrations on children's comprehension of written stories were examined. Five
illustration conditions were used in the experiments: one in which there was no
illustration accompanying the text and four conditions in which illustrations related
to the text were presented before or after it. The first two studies indicated that the
presence of related illustrations did not improve comprehension of text and that their
placement before or after the text did not affect recall. In their third experiment
O'Keefe and Solman presented the illustration groups with more illustrations
positioned adjacent to the text. They noted that the combined effect of these
illustrations was to provide more information and they found that recall for both
illustrated and non-illustrated paragraphs for the picture groups was improved.
O'Keefe and Solman suggested that this improved performance on text
comprehension was largely due to the motivational effects of the illustrations. A
localized advantage for the immediate placement and association of pictures with
text was found, but overall O'Keefe and Solman reported little advantage for the
comprehension of text by having a related illustration present.

Introduction to Section 1 13
Positive effects from illustrations
The literature on the use of illustrations to facilitate the comprehension of text was
reviewed by Schallert (1980). After deciding in general that the evidence came
down on the side of illustrations improving text comprehension she speculated on
the mechanisms involved. Schallert suggested that illustrations were likely to help
comprehension if they represented spatial information or information that was
important to the total message of the text. She also considered the question of
presenting content in both text and illustration. If much content overlaps between
an illustration and text then it is likely to be processed twice and it might be
expected to lead to better comprehension. It is possible that variation in the amount
of content presented in these two forms has contributed to the differences reported
in the literature on the effects of illustrations upon the comprehension of text (i.e.
the greater the overlap the more likely that the presence of an illustration will
improve the comprehension of text). However, as Schallert has noted the
improvement in comprehension may not be due to the content simply being
repeated but may be a consequence of the provision of dual access routes to
comprehension.
Read and Barnsley (1977) conducted an experiment using basal reading materials
with adults which were modified from what their subjects had viewed some 20 to
30 years earlier. They had three conditions of text alone, text and illustrations and
illustrations alone and found that the illustrations condition was superior to text and
that the best performance was on illustrations and text together. These researchers
concluded that the interaction of both verbal and pictorial components improved the
processing and storage of early reading materials. However, from their report it
appears that there was a limited amount of overlap of the content presented in text·

Introduction to Section 1 14
and the content presented in illustration and further, subjects needed both the text
and the illustration to answer all the questions. The overall level of performance
was judged on a combination of material presented as text and as illustration and
therefore it is not clear from the results what improved performances could be
attributed to.
In an experiment with fourth grade children Rohwer and Harris (1975) used
materials on different kinds of monkeys under seven conditions: text only,
illustration only, oral only, text plus illustration, text plus oral, illustration plus
oral, and print plus picture plus oral. The illustration plus oral condition was found
to be superior to the text plus oral condition replicating the findings of Rohwer and
Matz (1975). However, the text only condition was superior to the illustration only
condition. This was possibly due to the differences in the information content
between the text and illustration with some questions for subjects not being able to
be answered from the content of the illustration alone. Further analysis by Schallert
(1980) of their data led her to suggest that if text can be easily decoded then
illustrations can improve comprehension if they provide a different access route to
the content of the text. That is, contrasting with simple repetition of content in in
which either text is repeated or illustration repeated, repetition of content in two
forms (text and illustration) may be superior. Levin, Bender and Lesgold (1976)
found that orally repeating a sentence was not as good as providing an illustration
with first grade children and Schallert cited their work as providing further evidence
that illustrations had a significant facilitative effect upon comprehension beyond
simple repetition.
A series of experiments with first grade children lead Lesgold, Levin, Shimron and
Guttman (1975) to conclude that illustrated stories were superior to non-illustrated
ones. Further work by Lesgold et al. ( 1977) on the effects of illustrations upon

Introduction to Section 1 15
young children's prose learning with first grade students again found that
illustrations were helpful in improving text comprehension under certain
conditions. After listening to a story a child in the illustration condition was given
the background scene for the story in the form of an illustration and the needed
cutouts and was told to illustrate the story by placing the cutouts on the
background. The results showed that the illustration subjects outperformed those
who did not use the illustration. Illustrations which specifically represent the
information in text with the more salient aspects emphasized at the expense of
irrelevant or potentially interfering components were found to facilitate young
children's learning from prose.
A number of studies have investigated the effects of having pictures presented
before text (Arnold & Brooks, 1976; Bransford & Johnson, 1972; Dean &
Enemoh, 1983, Dean & Kulhavy, 1981; Tajika, Taniguchi, Yamamoto & Mayer,
1988). Generally these have shown positive effects upon the comprehension and
recall of text. For example, Bransford and Johnson found that concrete drawings
presented before reading an ambiguous prose passage · improved text
comprehension. Dean and Enemoh found that a photograph of a meandering river
presented prior to reading related text resulted in superior performance than when
the text was presented alone. Tajika et al. also found that integrated advance
pictorial organizers improved text comprehension whereas abstract ones did not.
These researchers have generally suggested that the positive effects obtained for
using illustrations as advance organizers is due to the provision of an integrated
organizational context for the text (Arnold & Brooks, 1976; Tajika et al., 1988).
However, from the reports of these studies it is not clear what the relationship
between the text and the illustration is and it may be the case that where positive
effects are reported there is some overlap between the two.

Introduction to Section 1 16
Reid et. al. (1983) following on from earlier work which indicated that illustrations
can improve the comprehension of text (Goldstein & Underwood, 1981; Holliday
1973; Reese 1970), used illustrations related to texts on the heart with 14-year-old
science students. Reid et al. tested long-term memory store, or what they described
as the cognitively integrated network of propositions (Anderson, 1980), by
administering the post test 15 minutes after reading. The illustrated conditions were
found to be superior to the text only conditions. Reid et al. hypothesized that the
two modes of input (text and illustration) may lead to more effective storage
networks being developed as a consequence of attempts to reconcile the two inputs.
They further suggested that illustrations may induce a deeper level of processing of
text and thereby improve comprehension and recall of text.
Bieger and Glock ( 1986) examined the effect on performance of presenting selected
categories of information in text and picture with undergraduate students. Their
hypotheses were that pictorial depiction of spatial information would allow subjects
to do an assembly tasks faster than subjects who had written instructions only, and
that textual depiction of that same spatial information would result in fewer
assembly errors by subjects. The results showed that when operational and spatial
information were in picture, subjects performed the assemblies in significantly less
time, but made significantly more errors than when the information was in text form
only. That is, performance on some tasks was superior when content relevant to
the tasks was presented in illustrations rather than text and on other tasks the text
was superior. From the report of the study it appears that at least some of the
information content of the text and illustrations differed and also there was no
presentation of text and illustration together to see if this condition was superior to
either of the single form presentations.

Introduction to Section 1 17
A study done by Reinking et al. (1988) examined the effects of explicitly cuing
graphic aids in accompanying text with good and poor readers in years 7 and 8.
The students read passages under five conditions. Four conditions had illustrations
accompanying text. The other condition had text alone. Of the first four
conditions, there was no cuing of the illustrations in one condition and in the other
three different cuing conditions were presented. Each of the four conditions which
had graphic aids had one which was redundant and one which was non-redundant
to the text. Reinking et al. found that the cuing conditions were superior to the no r
illustration condition for both redundant and non-redundant information in the
illustrations. Cued illustrations were superior to text of the same content but
illustrations with no cues were recalled no better than non-illustrated text Subjects
in the cuing conditions outperformed those who had illustrations which were not
cued. They also found that performance on redundant illustrations was superior to
non-redundant illustrations but they failed to plausibly explain this result suggesting
only that "better recall might have been the result of better comprehension of the
text" (p. 240). Also, as Reinking et al. admit, they did not control for the degree to
which comprehension of the text was dependent upon the ~nformation in the
illustrations. Therefore it is not clear to what extent any beneficial results obtained
for the comprehension of text were due to the overlap of text with accompanying
illustrations or to cuing. From the results obtained Reinking et al. hypothesized that
cues may have stimulated more intensive processing of the text and that improved
recall for redundant illustrations was due to cuing. For poor readers Reinking et al.
found that text comprehension was improved with the presence of related
illustrations which were cued in the text

Introduction to Section 1 18
Comments upon related literature:
In the studies reported there have been a number of issues that need to be
commented upon. Within the studies reviewed there have been a variety of
approaches which can be divided into those which were ecologically valid and
those which were not. Amongst those studies which were ecologically valid and
used materials normally studied in classrooms, only a few used expository text
with technical illustrations in subjects such as science (e.g. Reinking et al., 1988),
and most used prose and non-technical illustrations. When benefits for the
comprehension of text by having a relevant illustration present have been reported it
is often not clear whether the results are reporting a benefit for the combined text
and illustration or text alone or illustration alone or to some other effect. From
these investigations three areas stand out as particularly interesting for further
empirical work. Firstly, the effects of technical illustrations which have content
related to but additional to expository text needs to be studied. Secondly,
examination needs to be made of situations where it is possible to present content as
either expository text or illustration. Thirdly, the question of the benefits of
overlapping content between text and technical illustrations needs to be
systematically examined.
The studies reported in this thesis all use ecologically valid materials in a technical
area - geography. The principal empirical questions examined in this first section
are whether content presented as a technical illustration is comprehended better than
the same content presented as expository text, and whether repeating technical
content in illustration and text improves comprehension .. However, before
progressing to the first study it is appropriate to discuss some of the cognitive
theory which relates to these questions.

Introduction to Section 1 19
Cognitive Theory
There are a great number of psychological theories from which predictions can be
made concerning the primary empirical questions examined in the first section of
this thesis. For example, it may be possible to draw some from Parallel Distributed
Processing models (Hinton & Anderson, 1989), from various theories of
processing of visible language such as Kolers, Wrolstad & Bouma, 1979, from
perspectives in behavioural neuroscience offered by McGaugh, 1989 and
Thompson, 1989, and from cognitive psychology (e.g. Mandler, 1989; Morton,
1979; Neisser, 1989; Tulving, 1983, 1985a, 1985b). To a greater or lesser extent
all these theories ~an be used to make predictions of the cognitive consequences of
presenting text with illustrations. However, there is one model of memory which
gives comprehensive predictions relevant to the first section of this thesis. Paivio's
(1971, 1986) dual coding theory of memory can be used to make predictions in
both the case of comprehension and recall of illustrations as well as the likely
effects of presenting the same content in text and illustration. The relevant aspects
of dual coding theory will be detailed along with the support provided by the
cognitive theories of memory of Baddeley and his colleagues (Baddeley & Hitch,
1974, 1977; Baddeley, 1988, 1989) and Craik and Lockhart (1972).
Paivio's (1971, 1986) dual coding theory allows for predictions of the cognitive
consequences of both the efficacy of illustrations and the effects of repetition of
content. In the context of the first section of this thesis there are two aspects
relevant to dual coding theory worth considering. The first is the relationship of the
content in the illustration and the content in the text, particularly in the case of
repetition or overlap. The second is the illustrations themselves. In both cases dual
coding theory predicts improved comprehension and recall due to information being
represented and processed in a verbal store and in a nonverbal store in memory.

Introduction to Section 1 20
According to Paivio (1986) these codes are functionally independent and one can be
active without the other or they may operate in parallel. At the same time he
considers that the two systems can be interconnected and activity in one can initiate
activity in the other. The verbal code specializes in dealing with the representation
and processing of language (e.g. the text and any word labels in illustrations), and
the nonverbal (imaginal) code with the analysis of scenes (including pictorial
information and visual images of the word labels in illustrations) and the generation
of mental images. Paivio (1986) contends that activation of both codes "can have
additive effects on recall. Moreover, the evidence suggests that imaginal and verbal
codes are unequal in mnemonic value, perhaps by a 2: 1 ratio favoring the image
code." (p. 77). This suggests that illustrations may improve comprehension of text
in those cases where the content is sufficiently closely related to facilitate the
operation of interconnections between codes. When an illustration repeats much of
the content present in text this facilitation of interconnections is almost certainly
going to occur with, for example, words referring to images and images to words
(Paivio & Lambert, 1981). Therefore, the same content presented in both text and
illustration is likely to be recalled as a conglomerate of verbal and nonverbal
information, and is likely to result in superior memory and comprehension to the
direct repetition of content in either text or illustration only.
In the case of the illustrations used in these studies which have pictorial content
combined with verbal labels, dual coding is likely to be initiated even in the absence
of any separately presented text. The pictorial content would be encoded in the
nonverbal store whilst the verbal labels are likely to be encoded in both the verbal
store and images of the labels in the nonverbal store. This should facilitate
interconnections between the two subsystems as described above and thus improve
comprehension and recall. Paivio and Casapo (1973) and Paivio (1975) contend
that illustrations are more likely to be dually coded than words. Further, Paivio

Introduction to Section I 21
argues that the imaginal subsystem is superior to the verbal subsystem and as a
consequence one would expect that illustrations would be recalled better than text of
the same content (Paivio, 1971, 1975, 1983, 1986; Paivio & Casapo, 1973).
Therefore, technical illustrations such as the ones used in these studies may well be
a superior method of presentation. In the case of these particular illustrations which
portray spatial information it would also be predicted by the work of Kolers (1973)
that such illustrations would be superior to texts, and Nelson and his colleagues
(Nelson, Reed & McEvoy, 1977; Nelson, Reed & Walling, 1976) also predict that
illustrations are superior to words due to the more elaborate sensory codes of
pictures compared to words.
Paivio's theory has not been without its challenges - both theoretical and empirical.
While some of these challenges may not be trivial within the context of psychology,
their detail is beyond the scope of the discussion in this thesis where a theoretically
coherent and consistent explanation of empirical findings under ecologically valid
conditions is the primary aim. Therefore Paivio's response to the primary critics of
his theory will only be dealt with briefly and the reader is referred to Paivio's
(1986) own detailed responses (see especially pages 33 to 52). There are a number
theorists who are sceptical of representational theories of memory such as Paivio.
Skinner (e.g. 1953, 1963, 1975) argues against models of the mind and suggests
that behaviour results from the experiential history of the individual and that "mental
life" has no causal role in behaviour. Paivio (1986) dismisses these arguments
based upon Skinner's premise of causality and Skinner's (1953) own work which
encourages the use of mental representations. Gibson (1966, 1979) rejects
representational concepts on the basis of his own theory that perception is the result
of information pickup and that the stimulus situation contains the necessary
organizational information so that images, ideas and memory stores are not needed
in the brain. As Paivio (1986) suggests, Gibson's theory "simply rephrases the

Introduction to Section 1 22
problem of representation in such terms as 'registering of invariants,' or 'tuning of
a perceptual system to the invariants"' (p. 40). Kolers and his colleagues (Kolers,
1978; Kolers & Roediger, 1984; Kolers & Smythe, 1979, 1984) hold a similar
view to Gibson in that they emphasize the means by which knowledge is acquired
rather than on the storage or representation of that information. Like Gibson,
Kolers' ideas do not completely reject mental representations.
In addition to these sceptics of mental representations there are a number of theories
of memory and other cognitive tasks which are based upon the notion of mental
processes primarily being performed in a single verbal or linguistic mode (e.g.
Bower, 1972; Kieras, 1978; Osgood, 1973; Pylyshyn, 1973, 1984). Paivio's
(1971, 1986) model reacts against this singular view and emphasises the
importance of nonverbal imagery as a mode of thought which is distinct from,
though coordinated with, verbal processes. A simple representation of the
differences between those theorists proposing a common coding model and
Paivio's dual coding model is given in Figure 1. Whilst there have been challenges
to Paivio's ideas, the supporting evidence for his dual coding theory has been
compelling and a number of propositional theorists have adopted similar structures
in their models (e.g. Anderson, 1978, 1983; Anderson & Bower, 1973; Brainerd,
1983; Hebb, 1980; Johnson-Laird, 1983; Olson & Bialystok, 1983). Powerful
effects which have been attributed to imagery have been reported by Bower, 1972,
Bugelski, 1970, Cornoldi, 1976, Denis, 1979, Gambrell and Bales, 1986, Katz,
1983, Long, Winograd and Bridge, 1989, Paivio, 1969, 1971, 1975, 1978, 1979,
1986, Resse, 1970, Richardson, 1980, Rohwer, 1970, Sadoski, 1983, 1985,
Sadoski, Goetz and Kangiser, 1988 and Yuille, 1983. Paivio (1983) cites some 60
reliable empirical findings which provide positive evidence for dual coding (see
especially pages 310-323), and in his 1986 textbook detailing the developments in
his theory since its first publication in 1971, Paivio reviews the empirical evidence

Introduction to Section I 23
supporting his dual coding approach to memory (see especially pages 148-176).
Yuille (1983, p. X) comments that Paivio "has evaluated his model against all of the
relevant evidence. His review of the variety of paradigms in which dual-coding
theory has been tested provides impressive evidence of the viability of his theory.
He demonstrates that dual-coding theory has no rivals in predicting and explaining
research outcomes." The balance of evidence supports Paivio's dual coding
approach to memory.

Introduction to Section 1
A. Common coding model showing
picture and word access to a
single conceptual store:
Se.man.tic me.m.ory
Conce.pt
Picture. Word re.cognition re.cognition
Picture. Word
24
B. Dual coding model showing
picture and word access to the
nonverbal and verbal stores:
Nonve.rbal Ve.rbal me.m.ory me.m.ory t t
-! le -! le ·= ., ·=-2 ""' iJ ""' iJ 0 .. 0 .. ... _ ... _ "".., "" .., ~" ~" ... R.«f«Hntbl ... I C once.pt i: I~ C once.pt I
ubtions
Picture. Word
Figure 1: Schematic representations of single coding and dual
coding models of memory
After: Pictures and words in semantic decisions by J. Te Linde, in Ima~ery.
memm:.v and co~ition; Essays in honor of Allan Paivio (pp. 118 and 120)
by J. C. Yuille (Ed.), 1983, Hillsdale, New Jersey: Erlbaum.
There are two important theories of cognition which add support to Paivio's notions
- working memory developed by Baddeley and his colleagues (Baddeley, 1988,
1989; Baddeley & Hitch, 1974, 1977; Logie, Baddeley, Mane, Donchin &
Sheptak, 1988) and depth of processing in memory (Craik & Lockhart, 1972).
Both these theories have generated considerable research (see, for example,

Introduction to Section 1 25
Baddeley, 1989; Masson & Miller, 1983; Schallen, 1976) but they are quite
different in their concepts of memory. Baddeley conceives memory as being
composed of various interrelated storages and emphasises the importance of
working memory, whereas Craik and Lockhart provide a non-structural view of
memory which reacts against the concept of short term and long term memory and
emphasises that coding has a more important effect upon memory trace. However,
in the present context the interesting thing is that both of these theories have ideas
which are consistent with Paivio (1971, 1986) and in the case of Baddeley (1989)
this is acknowledged (pp. 112-113).
Baddeley's notions of working memory are consistent with and add some support
to Paivio's (1971, 1986) dual coding theory. Work by Baddeley and Hitch (1974,
1977) on short term memory led them to abandon previous notions of a single
unitary system for short term memory and propose an alternate theory of working
memory. Their model of memory assumes that there is a controlling central
executive of limited capacity which has a number of subsidiary slave systems.
They explored two such subsystems in detail and suggested that one, the
visuospatial scratch pad, temporarily stores and manipulates visuospatial
information and that the other, the articulatory loop, temporarily holds speech
based material. Further work by Logie and Baddeley (1987) in situations where,
for example, a person is asked to count the number of windows in their home,
found that most people form mental images of their house and then count the
windows. They suggested that the visual images formed of the windows were held
in the visuospatial sketchpad and the counting (verbal material) in the articulatory
loop. That is, there are two stores of such information in memory. This supports
Baddeley's (1981) earlier work in which he suggested that information presented
visually is stored in the visuospatial scratchpad and if a person sub-articulates the
material this may then be registered also in the articulatory loop. It is interesting to

Introduction to Section 1 26
note that for individual words Baddeley (1989) considers that those which lend
themselves to the creation of mental images are recalled better as a result of being
encoded in both verbal memory and in temporary visuospatial images. That is,
under certain conditions Baddeley would expect some information to be dually
coded. Baddeley (1989) suggests that further research in the area of using text
needs to be done and notes: "one area that would clearly (be) worth exploring
further is the role of the (visuospatial) system in reading and comprehension." (p.
114). This suggestion is directly relevant to the studies the first section of this
thesis which examine the effects of illustrations upon comprehension and recall of
text.
Baddeley and his colleagues' work supports the predictions of Paivio ( 1971, 1986)
that technical illustrations are likely to be superior to text of the same content and
that repetition in two forms (text and illustration) will be superior to single form
repetition (either text repeated or illustration repeated). They suggest that
illustrations will be encoded in both the visuospatial scratch pad and the articulatory
loop and one would expect that this would be very similar in effects to Paivio's idea
that illustrations are likely to be encoded both verbally and nonverbally. For the
repetition of the same content in various forms (text repeated, illustration repeated
and text and illustration), the research on working memory would suggest that
illustrations are likely to be stored in both the visuospatial scratch pad and the
articulatory loop and that at least some text in both these slave systems. This lends
support to the prediction based upon Paivio's dual coding theory that in repetition
in two forms (text and illustration) will be superior to single form repetition (either
text repeated or illustration repeated).
Craik and Lockhart (1972) formulated an approach to memory which did not rely
upon the model of structurally separate short term and long term memory systems.

Introduction to Section 1 27
Their "levels of processing" approach to memory was based upon the concept that
coding itself was the main factor in determining the durability of memory trace.
They suggested that information which is more deeply processed will have a
stronger memory trace and be remembered longer. Deeper processing occurs when
information is processed through a hierarchy of stages from preliminary ones in
which physical features are identified to latter stages in which meaning is extracted.
Craik and Tulving (1975) built upon this work suggesting that greater breadth of
processing also improved memory trace. The depth of processing concept of
memory has been used by a number of researchers to explain various aspects of the
comprehension and recall of illustrations and text (e.g. Schallert, 1976). However,
the theory has come in for some criticism as it is difficult to specify what constitutes
greater depth and breadth of processing (see, for example, Baddeley, 1978, 1989;
Neisser, 1989). Even so, it is interesting to note that if you consider notions of
dual coding theory (Paivio 1971, 1986) with verbal codes, nonverbal codes, dual
access, images referring to words and words to images, then there is the suggestion
that greater depth of processing (Craik & Lockhart, 1972) and certainly greater
breadth of processing (Craik & Tulving, 1975) will occur. Presentation of the
same content as text and illustration will give greater breadth of content and efforts
to integrate the two sources of the same information in memory are likely to result
in greater depth of processing (Reid et al., 1983).
The concepts of depth (Craik & Lockhart, 1972) and breadth (Craik & Tulving,
197 5) of processing suggest that content repeated in two forms will be superior to
single form repetition. They suggest further that illustrations which require the
integration of the pictorial content with word labels will be comprehended and
recalled better than text of the same content as greater depth of processing is likely
than perhaps is the case for the same content in text. However, even if illustrations
of the kind used here do not result in truly deeper processing, it is almost inevitable

Introduction to Section 1 28
that greater breadth or more processing will result due to the two interconnecting
stores of information in memory as predicted by Paivio. Under these
circumstances Craik and Lockhart and Craik and Tulving give the same predictions
as Paivio.

Experiment 1 29
Experiment 1
The effects of illustrations were examined under three conditions in this study.
There were two illustration with text conditions and one which presented text only.
In the first condition text with a related illustration with content largely additional to
the text was presented. In the second condition the text was modified to include
the content of the illustration. In the third condition this modified text and the
illustration were presented. The same content information was presented in all
three conditions which allowed for an examination of the following predictions:
Firstly, if there is sufficient interaction activity between the verbal and nonverbal
stores in memory, then the presence of an illustration which is related to but largely
additional to the content of text (i.e there is little or no repetition) is likely to result
in better comprehension of the text. Secondly, as discussed above, it would be
expected that repetition of content in two forms (text and illustration) would lead
improved comprehension. Thirdly, technical illustrations conveying spatial
information are likely to be comprehended and recalled better than the same content
presented as text.
Method
Subjects
Seventy-five boys who study geography in Years 10 and 11 at a high school in
Sydney took part in this study. Three groups of twenty-five students each were
selected on the basis of their geography test results from the end of the previous
school year (i.e. each group was of equal ability in geography). The resulting
mean scores on the geography test were 63.2, 63.0 and 65.5 and not surprisingly
an analysis of variance indicated these small differences were not significant
[F(2,72)=0.33, p>.05). There were ten Year 11 students and fifteen Year 10

Experiment 1 30
students in each group. The students ranged in age from 14.8 years to 16.8 years
(mean age 15.7 years).
Desim
The same geographical content was presented in three ways:
Group 1 had text with an accompanying illustration with related but largely new
content.
Group 2 had the same text as the first group, and the content of the illustration
presented in additional text (i.e. there was no illustration).
Group 3 had the same text as the second group and the illustration (i.e. the
content of the illustration appeared in two forms).
This design resulted in the same text being presented to all three groups and the
content of the illustration being presented to Group 1 as illustration, Group 2 as text
and Group 3 as both text and illustration. Post learning performance was measured
on a set of multiple choice items based on the content in text alone and a separate set
of items based on the content in the illustration alone. The following comparisons
between the methods of presentation were planned for the analysis of the data: In
the case of the content in the text, the performance on the text with accompanying
illustration (i.e. Groups 1 and 3) was compared with performance on the text in the
absence of the illustration (i.e. Group 2). In the case of the content in the
illustration, the single presentation was compared with its repetition (i.e. Group 1
which had this content as an illustration [I] and Group 2 which had this content as
text [T] with Group 3 which had this content as both text and illustration [TI]), and
the content of the illustration was compared with the same content presented as text
(i.e. Group 1 [I] with Group 2 [T]).
Materials
A passage of expository text with a technical illustration on the water cycle was

Experiment 1 31
chosen from a senior geography textbook by Bonnor (1988, p. 94). The
accompanying illustration showed the relationships between various aspects of the
water cycle, most of which were not dealt with in the text. This text was 366
words in length. Group 1 read this text with the illustration. Group 2 had the text
rewritten so that it contained the same content as the illustration but had no
illustration. This increased the text length to 527 words. Group 3 had the rewritten
text from Group 2 and the illustration - the content of the illustration was repeated in
text and illustration. The reading materials used in this Experiment are shown in
Appendix 1. While there was no obvious way to ensure that the content of the
illustration could be exactly represented in text, care was taken to do this as
precisely as possible and the final product was judged to be of very similar content
by two authorities in geography and the dux of Year 12 at the high school where the
Experiment was conducted.
Each of the reading materials consisted of three quarto pages stapled together. The
content was preceded by the instructions followed by a blank page (to prevent
students from viewing the content through the instructions page). The content
which included the illustration in the case of Groups 1 and 3 was presented on a
single page and the illustration was generally cued in the text. The test of
comprehension and recall was presented separately on six quarto pages. It
consisted of instructions, a blank page and twenty multiple choice items. The first
ten items referred to the text given to all three groups and the second were based
upon the content of the illustration. All groups did the same multiple choice items.
The same experts who judged the reading materials judged the test items to be of
equivalent difficulty and to be measuring the same objectives. Using Bloom,
Engelhart, Furst, Hill, and Krathwohl's (1956) taxonomy to classify each question
the experts found that with both sets of ten items, eight tested knowledge, one
comprehension and one application. The text was prepared using Apple Macintosh

Experiment 1 32
"Times" 12 point typestyle.
Procedure
The Experiment was conducted in one teaching period of 50 minutes for each class.
Upon entering the geography room the students were instructed to sit in one of
three rows appropriate to the group to which they had been assigned. Once all
students were seated they were told: "We will be doing a geography comprehension
exercise today and there will be a 20 item multiple choice test to do based upon the
reading material. The material in Part A will be read and the test done under exam
conditions with no interaction with other students. You are to follow all
instructions. The reading material will be placed flat on the desk in front of you -
you are not to move it until instructed to do so. You will be given five minutes
reading time and at the end of this time the reading material will be taken up from
you and the test (Part B) distributed." Appropriate reading materials were then
distributed to each member of each group and the instructions on the first page were
read aloud by the experimenter:
" 1. When instructed to do so, turn the first page and the blank page to page 3 of
Part A. Carefully read the material in Part A. You will be given five minutes
reading time.
2. You should re-read the material if you have any spare time.
3. You may not mark this material.
4. At the end of the reading time you will be doing a multiple choice test based
upon the material you have read."
The students were then told "commence reading". The students were given five
minutes to read the content page (preliminary investigation of the time required to
read this material indicated that five minutes was more than sufficient). At the end
of this time the students were told to cease reading and close the reading material up

Experiment 1 33
so that it was left flat on the desk with page one at the front ready to be collected.
The reading material was collected and the twenty item multiple choice test and
associated answer sheet distributed with the direction to leave these test flat on the
desk. The instructions on the first page of the test were read aloud by the
experimenter:
"1. On the Answer Sheet write your name in the space provided and then put your
pen down.
2. Read the directions on the Answer Sheet carefully.
3. When instructed to do so turn the first page and the blank page to page 3 of Part
B and answer the questions in the multiple choice test. These items are based
upon the material which you have just read in Part A. You are to attempt all
twenty multiple choice items in Part B."
The experimenter then informed students that :
"You will have approximately twelve minutes in which to do the test but if anyone
has not finished all items more time will be allowed so that everyone has sufficient
time to complete all the questions." (Preliminary investigation had also indicated
that twelve minutes was sufficient time to answer all these questions.) Once all
students had completed all twenty items in the multiple choice test the experimenter
instructed them, "put your pens down".
Results
Observation of the percentage correct scores in Figure 2 suggests that the
performances on the test items covering the content of the original text were very
similar (the means and standard deviations of the proportions correct data are
shown in Table 1). That is, there was no suggestion that Groups 1 and 3 who had
the advantage of the illustration in conjunction with the text outperformed Group 2

Experiment 1 34
without the illustration. The planned orthogonal comparison of the average
performance of Groups 1 and 3 with Group 2 did not reach significance
[F(l,72)=0.02, p>.05]. Also there was no statistically significant difference in
performance between the two groups that did have the illustration presented
(Groups 1 and 3) [F(l,72)=0.43, p>.05].
Figure 2: Percentage correct for each of three groups of subjects on
questions referring to the information in the text
70
60
% 50
correct
"10
30
0 Text with
illustration Rew'ritten
text Rew'ritten text & ill ust ration

Experiment 1 35
Table 1: Proportions correct group means and standard deviations
for questions referring to the text in Experiment 1
Group 1
(text with illustration)
Group 2
(rewritten text only)
Group 3
(rewritten text & illustration)
Average
Mean
% correct
70.8
70.0
69.2
70.0
Standard
Deviation
19.8
15.8
13.8
The percentage correct scores on the content in the illustration as shown in Figure 3
( the means and standard deviations of the proportions correct data are shown in
Table 2), indicate that the group that received the repeated content (TI)
outperformed the two groups that received the single presentation either as text (T)
or as illustration (I). The planned comparison between Group 3 and the average
perlonnance of Groups 1 and 2 showed that this difference reached significance
[F(l,72)=7.95, p<.01]. Figure 3 also indicates that there is a small advantage for
the illustrated presentation over the text presentation but the comparison of Group 1
(I) with Group 2 (T) was not significant [F(l,72)=0.80, p>.05].

Experiment 1 36
Figure 3: Percentage correct for each of three groups of subjects on
questions referring to the information in the illustration
70
60
% 50
correct
'10
30
0
Illustration Text Illustration &text
Table 2: Proportions correct group means and standard deviations
for questions referring to the illustration in Experiment 1
Mean Standard
% correct Deviation
Group 1 42.8 17.4
(text with illustration)
Group 2 38.4 18.0
(rewritten text only)
Group 3 55.4 18.5
(rewritten text & illustration)
Average 45.3

Experiment 1 37
The proportions correct data are tabled in Appendix 2.
Discussion
The results showed in the two conditions where an illustration accompanied text
recall performance on the content of the text did not differ from the condition in
which there was no illustration. The content of the illustration was relevant to the
content of the text but almost entirely additional to it It has been argued by several
researches that the motivating effect of illustrations enhances the comprehension of
text (Gombrich, 1972; Kennedy, 1974; Samuels, 1970). Vernon (1953) suggested
that illustrations might stimulate the reader to examine the text more closely and
encourage a more active and thoughtful interest in the topic presented. One might
expect under these circumstances that text with an accompanying relevant
illustration would be comprehended better. Some previous studies have suggested
that this is the case (Donald, 1983; Hayes & Readence, 1982, 1983; Reid et al.,
1983; Reinking et al., 1988). However, the results in this study do not support
this conclusion and Peeck ( 197 4) has shown that improved performance in the
presence of an illustration can be largely attributed to correct responses to questions
which refer directly to the content of the illustration. Any interconnections which
may have formed between the verbal and nonverbal stores in memory were not
sufficient for the content of the illustration to have a positive effect upon the
comprehension and recall of the text. There appear to be circumstances under
which certain types of illustrations do result in improved comprehension of text
(see Schallert, 1980), but perhaps the most pragmatic approach is one which
considers them as providing information in their own right rather than as adjuncts
to the content of associated text.

Experiment 1 38
A comparison of performance on those items which referred specifically to content
presented in illustration, showed better performance for students who received it
both in the illustration and in the rewritten text. This result might be expected
simply due to double processing of the material. That is, the superior condition
received the same content twice whereas the students in the other two groups were
presented with the content only once. However, when discussing a similar result
by Rohwer and Harris (1975), Schallert (1980) suggested that it was more likely
that better comprehension and recall resulted from the provision of two access
routes to comprehension (i.e. text and illustration). This notion is consistent with
the interpretations of Paivio's (1971, 1986) dual coding theory and Craik and
Tulving's (1975) idea of breadth of processing of memory discussed in the
introduction, but the question of mere repetition versus dual access routes remains
to be examined in detail.
The results did not detect an advantage for content presented only in an illustration
over the same content presented in text. Dual coding theory and depth of
processing formulation of memory would predict a difference of this kind and it has
been reported in studies such as Donald, 1983; Lesgold et al., 1977; Lesgold et al.,
1975; Rasco, Tennyson & Boutwell, 1975; Reid et al., 1983; and Reinking et al.,
1988. The obtained difference was in the direction of the hypothesis and it will be
examined further in the studies that follow.

Experiment 2 39
Experiment 2
In the first experiment content presented in both text and illustration resulted in
superior performance. This is an interesting result and it raises the question of
whether the improvement was due to simple repetition of the content or to more
elaborate cognitive operations initiated by providing two different access routes to
the comprehension of the information (Schallert, 1980). Both dual coding theory
(Paivio, 1971, 1986) and depth and breadth of processing formulation of memory
(Craik & Lockhart, 1972, Craik & Tulving, 1975) would suggest that the same
content presented both as text and as illustration should be recalled and
comprehended better than if repeated in one form only and this proposition is the
main focus of this study. Presenting content as text or as illustration will be
investigated further as it was predicted from the theoretical discussion on dual
coding theory that technical illustrations· are likely to be comprehended better than
text of the same content. It is also of interest to see if any differences found on
immediate comprehension and recall change over time and so performances on
immediate and delayed comprehension and recall will be examined to see if any
differences obtained hold up over time.
Method
Subjects.
One hundred and thirty boys who study geography in Years 10, 11 and 12 at a
high school in Sydney took part in this study. Five groups with twenty-six
students in each were selected on the basis of their geography test results from
the mid year assessment for the Year 10 students and their progressive HSC
geography Assessment for the Year 11 and 12 students. They were assigned to
the groups so that each group was of equal ability in geography. At the end of

Experiment 2
this assignment process the resulting mean scores for Groups 1, 2, 3, 4 and 5 on
their geography assessments were 58.7, 57.3, 58.4, 60.9 and 60.1 respectively.
Not surprisingly an analysis of variance indicated these small differences did not
approach significance [F(4,125)=0.21, p>.05], that is, the groups did not differ
at the commencement of this study. The numbers of students in each group
from Year 12, Year 11 and Year 10 were respectively for Group 1 six, eleven
and nine; for Groups 2 and 5 these student numbers were seven, seven and
twelve respectively; for Group 3 six, nine and eleven; and for Group 4 these
student numbers were five, eleven and ten. The students ranged in age from
15.0 years to 19.3 years (mean age 16.6 years).
Desiw
40
Comprehension of information was examined under five presentation conditions.
In three of these conditions some of the content was repeated as can be observed in
Figure 4. In the case of the illustrations this meant that the content repeated was an
exact repetition. This was also the case for the repeated text - the content repeated
was an exact repetition. With the content repeated in two forms the content was
presented as text and illustration. Care was taken to ensure that the content of this
material was as close as possible when translated from illustration to text. Three
geography teachers and the dux student of Year 12 at the high school where the
Experiment was conducted judged the content of each text to be very similar to the
illustration it represented. Peripheral to the main design concerned with the
repeated material there was unique material appearing both prior to and after the
repeated material as can be seen in Figure 4. There were five groups of subjects
with one to each condition.

Experiment 2 41
Figure 4: The five presentation conditions in Experiment 2
Group 1
Group 2
Group 3
Group 4
Group S
Illustration 1 Illustration 2 ,,,,,,,, ,,,,,,,, ··--···· ,,,,,,,, ,,,,,,,, --------,,,,,,,,
Repeated ,,,,,,,, --------,,,,,,,, ,,,,,,,, ··-····· ,,,,,,,, content ,,,,,,,, --------,,,,,,,, ,,,,,,,, --------,,,,,,,,
I I ,,,,,,,, --------,,,,,,,, ,,,,,,,, --------
Te.xt1 Te.xt2 ,,,,,,,, --------,,,,,,,, ,,,,,,,, ........ ,,,,,,,, ,,,,,,,,
Repeated --------,,,,,,,, ,,,,,,,, --------,,,,,,,, ,,,,,,,, content --------,,,,,,,, --------,,,,,,,, ,,,,,,,,
T T ,,,,,,,, --------,,,,,,,, ,,,,,,,, ........ ,,,,,,,,
Illustration 1 Te.xt2 ,,,,,,,, ,,,,,,,, ,,,,,,,, ,,,,,,,, ,,,,,,,, ,,,,,,,, ,,,,,,,, ,,,,,,,, ,,,,,,,, ,,,,,,,, ,,,,,,,, ,,,,,,,, ,,,,,,,, ,,,,,,,, ,,,,,,,, ,,,,,,,,
Repeated content
I T
Illustration
Repeated content
pre.s ented once.
I
Text
Repeated content
presented once.
T
----···-----------------........ ----------------........ --------------------·-·· -------· ------------···-------------------------
Key:
mJ Unique. prior
f-:-:-J Unique. after

Experiment 2 42
Group 1 viewed two illustrations (II) in which 50% of each illustration was a
direct repeat of the content of half of the other illustration
Group 2 read two texts (TI) in which 50% of the content was repeated. The
actual content of the texts was the information in the two illustrations
used with Group 1 rewritten.
Group 3 was given the first illustration presented to Group 1 and the second text
presented to Group 2. As can be seen in Figure 4 this resulted in the
repeated material being presented in two forms - illustration and text
(TI).
Group 4 was given the illustrated material which was repeated with Group 1 as
one illustration (I).
Group 5 was given the repeated content only presented as text (T). This text was
identical with the repeated portion_ of the texts Group 2 read.
Re.peated material:
The main design of the study refers to the repeated material which Groups 1, 2 and
3 had repeated and which was produced only once for Groups 4 and 5. The same
content was presented to all groups. Comparisons between groups on the
comprehension of this material were made on immediate recall, then after a week
and then a month after reading the material. With the repeated materials for the first
three groups the effects of presenting the same information in different ways could
be examined. With these groups a comparison could be made on the type of
duplication of the material - Group 1 with the information duplicated in illustrative
form (II), Group 2 with the information duplicated in written form (TT) and Group
3 with the duplicated information in illustrative and written form (TI). The effects
of having the duplicated material in the illustration only once (I) and the text only
once (T), that is, the content was not repeated, were examined by having Groups 4
and 5. In line with the introductory discussion comparisons were made with

Experiment2 43
repeated text and repeated illustrations as well as a combination of content repeated
as text and illustration. In view of the discussion and consistent with the results
obtained in the first study the following comparisons were planned for the
iDlJTIMiate and delayed recall scores:
1. Repetition in two forms (TI) with repetition in single form (1T and II);
2. Repetition (II and TI') with single presentation (I and T);
3. Presentation in text (1T and T) with presentation in illustration (II and I).
These comparisons were carried out as planned comparisons on firstly immediate
recall and secondly for delayed recall. The same multiple choice tests were
administered again a week later to see if there was any presentation condition which
resulted in superior longer term comprehension. This procedure was also repeated
a month after reading the materials.
UniQ.ue material:
In addition to the overall design with repeated material there was material presented
which was not duplicated for Groups 1, 2 and 3. This allowed for further
comparisons of differences in presentation for the non-repeated material of text and
illustration and a comparison of any spinoff from the presence an illustration upon
the comprehension of text (a replication of the comparison which promoted
Experiment 1, i.e. the implicit assumption that illustrations improve the
comprehension of associated text). The advantage for illustrations was examined
by comparing Groups 1 (I) and 3 (I) with Group 2 (T). The advantage for an
illustration on an illustrated text would be noted on the unique material after the
repeated material by comparing Group 3 with Group 2 and so the performance of
these groups was contrasted. These two comparisons were designed to apply to
immediate recall and the delayed condition one week later.

Experiment 2
Materials
Group 1 was given two cross sections (II) drawn by the author which had a
50% overlap with each other (i.e. the second half of the first cross
section was repeated in the first half of the second cross section).
Group 2 was given two texts (TT) which were written by the author
containing information as close as possible to being the same as the
illustrations. The first text was 272 words in length and the
second 282 words in length.
Group 3 had the first illustration which Group 1 had and the second text of
Group 2. In other words, for Group 3 the information
overlapping in the illustration and text appeared in two forms - text
and illustration (TI).
Group 4 was given only the portion of the two illustrations which
overlapped once (I).
Group 5 had only the portion of the text which overlapped once (T).
44
For the repeated material great care was taken to translate the illustrations into text
so that the text was as close as possible in content to the illustration from which it
was translated. The same care was taken with the unique material appearing before
and after the repeated content where illustrations had to be translated into text. As
previously noted the end results for the repeated material (TT, Il, and TI) were
judged to be equivalent by three experts as was the unique material prior to the
repeated material (I, T, and I) and the unique material after the repeated material (I,
T and T).
The reading materials for all groups consisted of three quarto pages. Page 1 had
instructions on it, page 2 was blank and page 3 had the material to be read on it.
Page 2 was blank to ensure that students were not able to see through the first page

Experiment 2 45
and view any material they were to read on the last page - either text or illustration.
The reading material for each group was on one page. All text was prepared using
Apple Macintosh "Times" 12 point typestyle.
Thirty-five multiple choice items were constructed to measure students'
comprehension of information for Groups 1, 2 and 3. The test of comprehension
and recall was presented separately on eight quarto pages. It consisted of
instructions, a blank page and the multiple choice items. Students recorded their
responses on an answer sheet Twenty items were based upon the unique material
in the illustrations or their equivalent texts with ten of those items for the material
that preceded the duplicated material and ten items for the material that followed the
duplicated material. There were fifteen items based on the repeated material
common to both illustrations or their equivalent texts. These items were
randomized. Groups 4 and 5 were presented with and did the fifteen questions
based upon the repeated material only. Five experienced geography teachers
judged the content of the questions to be valid and using Bloom et al's. (1956)
taxonomy of the cognitive domain to classify each question the experts found that
with both sets of ten items on the two lots of unique materials nine tested
knowledge and one comprehension. For the fifteen items on the repeated material
fourteen were judged to test knowledge and one comprehension. A copy of the
reading materials and multiple choice items used in this Experiment is in Appendix
3.
Procedure
The Experiment was conducted in one teaching period of 50 minutes for each of the
six classes that participated. Upon entering the geography room the students were
instructed to sit at the desks which had been separated. Once all students were
seated they were told: "We will be doing a geography reading comprehension

Experiment 2 46
exercise today and there will be a multiple choice test to do at the end of the reading
time based upon the material you are about to read. During this period you will be
reading some material and doing a test under exam conditions with no interaction
with other students. You are to follow all instructions. The reading material will
be placed flat on the desk in front of you - you are not to move it. You will be
given either five or two minutes reading time depending upon the group you are in
and at the end of this time the reading material will be taken up from you and you
will then do the test." Each student was then given the material for the group to
which he had been assigned. The reading materials consisted of three quarto
pages. Page 1 had instructions on it, page 2 was blank and page 3 had the material
to be read on it. Page 2 was blank to ensure that students were not able to see
through the first page and view any material they were to read on the last page.
Once the appropriate reading material was distributed to each student in the class the
instructions on the front were read aloud by the investigator:
" 1. When instructed to do so, turn the first page and the blank page to page 3 of
this paper. Carefully read the material. You will be given five minutes reading
time for Groups 1, 2 and 3 and two minutes reading time for Groups 4 and 5.
2. You should re-read the material if you have any spare time.
3. You are only to read this material and you are not permitted to have any writing
or other implement (ruler, calculator, etc.) in your hand during the reading
time.
4. You may not ask questions about the reading material once the reading time
has commenced.
5. At the end of the reading time you will be doing a multiple choice test based
upon the material you have read."
The students in Groups 1, 2 and 3 were then told "commence reading". After three

Experiment 2 47
minutes had passed Groups 4 and 5 were told to "commence reading". At the end
of the five minutes reading time for Groups 1, 2 and 3 and two minutes for Groups
4 and 5 (previous experience had indicated that this was sufficient), the students
were told to cease reading and close the reading material up so that it was left flat on
the desk with page one at the front ready to be collected. The reading material was
then collected and the multiple choice items and associated answer sheet distributed.
Students were instructed to leave this test flat on the desk. For Groups 1, 2 and 3
the test consisted of six quarto pages. Page 1 had instructions on it, page 2 was
blank and page 3 on had the thirty-five multiple choice items. Page 2 was blank to
ensure that students were not able to see through the first page and view any of the
multiple choice items. Groups 4 and 5 had a test paper with a similar format but
with only the fifteen items based upon the repeated material. The instructions on
page 1 of the multiple choice tests were read aloud:
"1. On the Answer Sheet write your name, class and age in the spaces provided
and then put your pen down.
2. Read the directions on the Answer Sheet carefully.
3. When instructed to do so turn the first page and the blank page to page 3 of
this test and answer the questions in the multiple choice test. These items are
based upon the material which you have just read. You will be given sufficient
time to complete all questions (approximately 20 minutes for Groups 1, 2 and
3 and 10 minutes for Groups 4 and 5)."
The experimenter then infonned students that :
"I will ensure that everyone has sufficient time to complete all the questions. You
may start the test now." Once all students in Groups 4 and 5 had completed all
fifteen items in their multiple choice test the investigator instructed them, "Students
in Groups 4 and 5 put your pens down and close up the test. It will be collected
when the other groups have finished their test". Once all students in Groups 1, 2

Experiment2 48
and 3 had completed all thirty-five items in their multiple choice test the investigator
instructed them, "put your pens down and close up the test. All tests and Answer
Sheets will now be collected".
One week later each of the five groups were required to redo the same multiple
choice test as they had done at the end of the reading time. This time the students
did not have the reading materials to read first as the purpose of redoing the delayed
test was to see what effects if any there were of the different types of reading
materials upon longer term comprehension. Each student was given a copy of the
test appropriate to their group and required to complete their answers on the same
type of answer sheet they had used the previous week. The same instructions on
page 1 of the multiple choice tests were read aloud and the experimenter then
informed students that everyone would have sufficient time to complete all the
questions. The students then answered the multiple choice items and the test papers
and answer sheets were collected from all students at the end of the test
One month after reading the materials each of the five groups were required to redo
the fifteen items on the repeated material on the multiple choice test on the reading
material they had read a month earlier. The students did not have the reading
materials to read as the purpose of redoing the test a month later was to see what
effects if any there were of the different types of reading materials upon longer term
comprehension. Each student was given a copy of the fifteen item test and required
to complete their answers on the same type of answer sheet they had used for the
two earlier tests. The same instructions on page 1 of the multiple choice tests were
read aloud and the experimenter then informed students that everyone would have
sufficient time to complete all the questions. The students then answered the
multiple choice items and the test papers and answer sheets were collected from all
students at the end of the test.

Experiment 2 49
Results
The results of this experiment are reported in two separate sections. The first deals
with the reading material which was common to all groups and is designated as
"repeated material" for the presentation of the results and the discussion of these.
The second section reports the results of student performances on the material
appearing before and after the repeated material which Groups 1, 2 and 3 had and is
designated as "unique material" for the presentation of the results and the discussion
of these.
Repeated Material:
Performance on the fifteen items based on the information repeated in the reading
material for the three tests (one immediately after reading the material, a repeat of
that test one week later without reading the material and another repeat of the test
one month later without reading the material), can· be seen in Figures 5, 6 and 7
(Table 3 shows the means and standard deviations of those results). The most
obvious results from viewing the three figures are that Group 4 appears to have
consistently outperformed the other groups and there is an expected decline over
time in performance. However, there were other differences.

Experiment 2 50
Figure 5: Percentage correct for each of five groups of subjects on
questions referring to the repeated information on
immediate recall
70
60
% 50 correct
LIO
30
0 Text Text
Text Illustration Illustration
Illustration Text Illustration
Figure 6: Percentage correct for each of five groups of subjects on
questions referring to the repeated information on delayed
recall of one week
70
60
% 50 correct
40
30
0 Text Text
Text Illustration Illustration Illustration
Text Illustration

Experiment 2 51
Figure 7: Percentage correct for each of five groups of subjects on
questions ref erring to the repeated information on delayed
recall of one month
70
60
% so correct
40
30
0 Text Text Text
Illustration Illustration
Illustration Text Illustration

Experiment 2 52
Table 3: Proportions correct group means and standard deviations
for repeated information in illustrations in Experiment 2
Group 1
(Il)
Group2
('IT)
Group 3
(11)
Group4
(I)
Groups
(I)
immediately after
reading material a week later a month later
Avemge
Mean Standard Mean Standard Mean Standard of Mean
% correct Deviation % correct Deviation % comlCl Deviation % correct
43.3 17.6 40.5 18.1 37.2 15.2 40.3
34.6 17.0 36.4 16.9 32.3 14.4 34.4
47.7 18.4 40.8 19.3 36.9 20.8 41.8
65.1 14.8 55.9 16.6 52.1 14.4 57.7
47.2 16.2 39.2 18.7 31.8 13.9 39.4
47.6 42.6 38.1 42.7
For the immediate recall data the comparisons on proportions correct scores gave
the following results:
The comparison of the content presented in two forms (TI) with the two repeats in
the same form (TT and II) showed significantly better performance for repetition in

Experiment 2 53
two forms [F(l,125)=4.74, p<.05]. The comparison between the groups with the
content appearing twice (Groups 1 [II] and 2 [TI]) and the groups with the single
presentation of the same content (Groups 4 [I] and 5 [T]) reached significance
favouring the single presentations [F(l,125)=27.47, p<.01]. Observation of
Figure 5 suggests that the superiority of the single presentations over duplicated
presentations was primarily a result of a superior performance by the group in the
single illustration condition. Putting it another way, the single text condition was
not clearly superior to the repeated text condition. The comparison between the
groups with the content in text (Groups 2 [TI] and 5 [T]) with the groups with the
same content in illustration (Groups 1 [II] and 4 [I]) detected a significant
advantage for the illustrations [F(l,125)=16.43, p<.01].
One week later the two significant differences involving Group 4 detected on
immediate recall remained significant but the advantage for the mixed presentation
had not lasted over the week. The comparison between the groups with duplicated
information appearing twice (Groups 1 cm and 2 [TI]) and the groups with the
single presentation of the same information (Groups 4 [I] and 5 [T]) was significant
favouring the groups with the single presentation of information [F(l,125)=6.73,
p<.05] (as can be again seen in Figure 6 this is mainly due to the exceptional
performance of Group 4). With the comparison between the groups with the
information in text (Groups 2 [TI] and 5 [T]) with the groups with the same
information in illustration (Groups 1 [m and 4 [I]) a significant difference was
found favouring the groups with illustrations [F(l,125)=8.79, p<.01] (Figure 6
again indicates that this is mainly due to the superior performance of Group 4).
The comparison of the form of repetition comparing the average of Groups 1 (II)
and 2 (TT) with Group 3 (TI) was not significant [F(l,125)=0.30, p>.05].
The results obtained one month after reading the materials were the same as those

Experiment 2 54
obtained after a week. That is, the differences involving Group 4 were the only
ones remaining. The comparison between the groups with duplicated information
appearing twice (Groups 1 [II] and 2 [TI]) and the groups with the single
presentation of the same information (Groups 4 [I] and 5 [T]) was significant
favouring the groups with the single presentation of information [F(l,125)=5.39,
p<.05] (as can be seen in Figure 7 this is mainly due to the exceptional performance
of Group 4 ). With the comparison between the groups with the duplicated
information in text (Groups 2 [TI] and 5 [T]) with the groups with the same
information in illustration (Groups 1 [II] and 4 [I]) a highly significant difference
was found favouring the groups with illustrations [F(l,125)=16.51, p<.01]
(Figure 7 again indicates that this is mainly due to the superior performance of
Group 4). Neither of the other comparisons were significant. The comparison of
the form of repetition comparing the average of Groups 1 (II) and 2 (TI) with
Group 3 (TI) was not significant [F(l,125)=0.10, p>.05]. The only differences
that did hold up on delayed recall were those that have a comparison with the single
illustration condition and these may be due to some unique combination of material
and subjects. Delayed recall is examined further in Experiment 4.
UniQ.ue Material:
As noted in the design in addition to the repeated material in Groups 1 (II), 2 (TI)
and 3 (TI) there was material which appeared both before and after the repeated
material. With the unique information appearing prior to the repeated information
Group 1 had an illustration, Group 2 had similar information in text and Group 3
had the same illustration as Group 1. With the unique information appearing after
the repeated information Group 1 had an illustration, Group 2 had similar
information in text and Group 3 had the same text as Group 2. Group 3 therefore
had unique information in illustration then the repeated information then unique

Experiment 2 SS
information in text. Student comprehension of this material was measured
immediately after reading the material and again one week later. As previously
noted the analysis of the unique material is not central to the design of the study and
will be briefly reported on and discussed here as the main discussion will refer to
only the repeated material.
Previous research has suggested that illustrations may be more easily remembered
than text and that they may assist the comprehension of text. The two hypotheses
to be tested with the unique material were: That illustrations are remembered better
than texts; and that text with an illustration is remembered better than text without
an illustration (the first study did not support this hypothesis). The first hypothesis
can be tested by comparing the average Groups 1 (I) and 3 (I) with Group 2 (T) on
the unique information appearing prior to the repeated information. Observation of
Table 4 suggests that there is no significant difference between content presented as
text and the same content presented as illustration. This observation is supported
by statistical tests carried out on either tests of immediate recall or delayed recall one
week later which did not reach significance (respectively, [F(l,7S)=0.16, p>.0S]
and [F(l,7S)=0.32, p>.0S]). It is not clear why an advantage for illustrations was
not found. The absence of a difference favouring the illustrations appears aberrant
as it would be predicted from the theoretical argument and was found on the
analysis of the data on the repeated content. In the studies that follow the
comparison between illustrations and text will be examined further.
The second hypothesis was tested by comparing Group 2 (T) with Group 3 (T) on
the material appearing after the repeated information. Table 5 shows the means and
standard deviations of those results. This comparison did not reach significance for
immediate recall nor delayed recall one week later (respectively [F(l,75)=2.18,
p>.0S] and [F(l,7S)=2.88, p>.0S]). This result is consistent with the null finding

Experiment 2 56
in Experiment 1. It has been mentioned already that there are likely to be
circumstances under which illustrations do lead to improved comprehension of text.
The results of this study and Experiment 1 suggest that there is a strong possibility
that this improvement is due to overlap of content. Whilst the question of what
circumstances result in improved comprehension of text due to the presence of
illustrations could be examined further, this study and the ones that follow in this
section are primarily concerned with different types of repetition of content and
illustrations versus text of the same content.
Table 4: Proportions correct group means and standard deviations for
unique information prior to the repeated material in
Experiment 2
Group 1
(I)
Group2
(I)
Group3
(I)
Avmge
Immediate recall
Mean
% correct
42.3
40.4
35.0
39.2
Standard
Deviation
20.3
18.9
15.0
One week later
Avenge
Mean Standard of Mean
% correct Deviation % correct
42.7 18.0 42.5
35.4 15.0 37.9
32.3 13.1 33.7
36.8

Experiment2 57
Table S: Proportions correct group means and standard deviations
for unique information appearing after the repeated
material in Experiment 2
Immediate recall One weclc later
Average
Mean Standard Mean Standard of Mean
% correct Deviation % correct Deviation % correct
Group 1 37.3 22.2 35.0 21.6 36.2
(I)
Group2 32.7 17.3 31.2 12.8 32.0
(I)
Group3 41.2 22.3 40.0 20.8 40.1
(I)
Average 37.0 35.4
The proportions correct data for Experiment 2 are tabled in Appendix 4.
Discussion
A comparison of the form of repetition in the repeated material showed that the
combined form of illustration and text was superior to the single-forms of text and
text, and illustration and illustration. This superiority for the representation of the
same content in text and illustration over simple repetition in either of these forms

Experiment 2 58
suggests that the advantage for representations in two forms is the result of access
to content via separate routes and not simply due to direct repetition. Also, direct
repetition in the same form may be recognized as such and not processed in full
whereas the combined form of repetition is more likely to have both forms (text and
illustration) processed fully. As detailed in the introduction, Paivio's (1971, 1986)
dual coding theory suggests that content encoded in both the imaginal store and the
verbal store with resultant interactions between the two is likely to be
comprehended and recalled better than information encoded in one store only.
Therefore one could expect superior performance for mixed repetition. It is a result
predicted by Schallert (1980) and is consistent with notions of depth and breadth of
processing in memory (Craik & Lockhart, 1972; Craik & Tulving, 1975) and dual
coding theory.
The overall comparison of the illustrative conditions (repeated illustration and single
illustration) with the two textual conditions (repeated text and single text)
demonstrated an advantage for the illustrations. As discussed in the introduction to
the experiments, the superiority of illustrations of the type used here over text
would be predicted by dual coding theory of memory (Paivio 1971, 1986) and
supported by both Baddeley's theory of working memory (Baddeley & Hitch,
1974, 1977; Baddeley, 1989) and depth of processing analysis of memory (Craik
& Lockhart, 1972). Specifically, dual coding theory argues that interacting verbal
and nonverbal stores increase comprehension and recall. The illustrations used in
the first section of this thesis had verbal labels on the drawings. While it is likely
that the pictorial content was predominantly stored in the nonverbal code, it is
probable that the labels were stored in both the verbal code and images of the labels
in the nonverbal code. That is, the labels were likely to have been stored in both
memory codes. In the case of the illustrations used in these studies when verbal
and nonverbal information is encoded interaction is probably facilitated, whereas

Experiment 2 59
for the text this is unlikely to be as strong as the predominant store in memory of
the text is likely to be verbal. The greater interaction of the two stores facilitated by
the illustrations can be conceived as causing greater depth or breadth of processing
of memory which also predicts superior performance.
The counter intuitive result in which single presentations were superior to double
presentations of content in this Experiment may be a consequence of either a unique
combination of subjects and material for the single illustration condition or due to
fewer cognitive resources being devoted to the double presentations. The
comparison between the single and double presentation of content carried out on the
repeated material did ignore the fact that the subjects in the three conditions with
repeats had in total more content to process (see Figure 4). That is, they had to
process the unique material as well, whereas the single conditions had no additional
content to process. The additional material for the double presentation conditions
may well have resulted in fewer cognitive resources being devoted to the repeated
material (Sweller, 1988, 1989) and as a consequence the subjects in these three
conditions were at disadvantage compared to the single conditions. Thus the
counter intuitive difference favouring the single presentations may not be due to the
advantage of presenting the material once only but rather as a consequence of
having three times as much original content as the conditions with single
presentations. The comprehension and recall of repeated content versus single
presentations will be examined further.

Experiment 3 60
Experiment 3
Although both dual coding theory (Paivio 1971, 1986) and the depth of processing
analysis of memory (Craik & Lockhart, 1972) implied that content presented in an
illustrated form may be comprehended better than the same content in text, the two
tests of this prediction conducted so far have produced contrasting results. That is,
the small advantage obtained for the illustration in the first experiment failed to
reach statistical significance but the second experiment on the repeated material did
support the prediction. In view of this contrast between the two studies the
comparison between content presented as an illustration and as text is replicated
here.
A counter-intuitive difference favouring conditions in which content was presented
only once over conditions which had that same content either as a repeated text or
as a repeated illustration was obtained in the second study. Observation of the data
showed the main contributor to this significant result was the high level of
performance of the group of students who viewed only the single illustration. As
previously suggested this is possibly a consequence of either a unique combination
of subjects and material or the amount of additional original content to be processed
by the conditions of repeated content interfering with the comprehension and recall
of the repeated material. Superior performance for a single presentation of content
over a repeated presentation in the same form was not predicted on the basis of the
cognitive theories discussed and this suggests that it may be a result of a random
difference between the groups. However, before concluding that this is the case
attempts will be made to replicate it with single and repeated presentations having
the same quantity of original content.
In comparing illustrations and text and single and repeated presentations the

Experiment 3 61
experimental procedure used in this study represents a break with the earlier studies
and in general with other similar work. Previous studies have usually varied the
learning conditions between groups of subjects. This method of presentation does
not take advantage of the fact that each individual usually performs in a similar
fashion relative to other individuals across similar cognitive tasks. That is, a
student who is better or worse than other students under one learning condition is
likely to be better or worse under other similar learning conditions (Bassett, Watts
& Nurcombe, 1978; Tyler, 1965). A procedure which presents each student with
all experimental treatments takes advantage of this consistency and in statistical
terms reduces the size of the error term used for testing differences between
treatments. This increases the sensitivity or power of the test (see Winer, 1971,
especially pages 261 and 262). Each student in this study was presented with
material under the four conditions examined.
Method
Subjects
Twenty-four boys in one class from Year 11 who study geography at a high school
in Sydney took part in this study. The students ranged in age from 16.4 years to
18.0 years (mean age 16.9 years) and were of mixed ability in geography (i.e. the
class was not streamed with more able or less able students based upon their past
performances in geography).
Desiw
Four lots of materials (Ml, M2, M3 and M4) judged to be of similar difficulty by
three experienced geography teachers were used with each one presented under one
of the experimental conditions (IT, T, Il and I). Condition TT used Ml, condition
T used M2, condition II used M3 and condition I used M4. The order of

Experiment 3 62
presentation of the four conditions was fully counterbalanced. There were twenty
four possible orderings of the four conditions and each student received one of the
possible twenty-four orderings. This experimental design was a repeated measures
design with the four types of presentation varied within subjects. Post learning
performance for conditions IT, T, II and I were tested on a set of multiple choice
items based on the content appearing in each material. The dependent measure was
performance on the eighty multiple-choice items in which twenty items each
referred to the content presented under each of the four conditions. The following
comparisons between the methods of presentation were planned for the analysis:
1. Repetition (IT and II) with single presentation (T and n; 2. Presentation in text (IT and T) with presentation in illustration (II and n.
The 24 possible orderings of the 24 unique combinations of conditions by material
were presented one to each subject. For each subject the same material appeared
only once under each condition. Each type of presentation appeared six times in
each order position and each type of material appeared each time in each condition.
This controlled for differences in difficulty among the four material types, e.g. if
Material 1 were in fact easier than Material 3 then its effect would be expected to be
similar under all four learning conditions and therefore the differences in difficulty
were counterbalanced over the conditions. This is illustrated in Table 6. For
example, student one received the conditions in the order of Ml (TT), M2 (T), M3
(II) then M4 (I), whereas student twenty-two received the conditions in the order of
M4 (I), M2 (T), Ml (TT), then M3 (II). The experimental design was a repeated
measures design with the four types of presentation varied within subjects. Post
learning performance for conditions IT, T, II and I were tested on a set of multiple
choice items based on the information appearing in each material.

Experiment 3 63
Table 6: Order of presentation of learning conditions
Student Order of Presentation
1 TI T n I
2 T n TI I
3 n I TI T
4 I TI T n 5 TI II I T
6 TI I T n 7 TI n T I
8 TI T I n 9 TI I n T
10 T TI n I
11 T n I TI
12 T I TI n 13 T I II TI
14 T TI I n 15 n TI T I
16 n TI I T
17 n T TI I
18 n T I TI
19 n I T TI
20 I n T TI
21 I n TI T
22 I T TI II
23 I T n TI
24 I TI n T
Materials
Considerable care was taken to make the four lots of material very similar as each
of the four conditions (1T, T, Il and I) had a different piece of content As noted
previously, the end result was assessed by three experts in geography who judged
the four materials to be very similar in geographical subject matter and difficulty.
One text and one illustration was presented once only (T and I) and the other text

Experiment 3 64
and illustration were repeated (TI and II). Both texts were 178 words in length.
Each of the four reading materials and associated tests consisted of eight quarto
pages stapled together (i.e. there were four lots of eight pages stapled together).
The content presented to students was preceded by the instructions followed by a
blank page (to prevent students from viewing the content through the instructions
page). The instructions for the test items followed and there was a blank page prior
to the test items. The blank pages ensured that students could not preview material.
All text was prepared using Apple Macintosh "Times" 12 point typestyle.
Twenty multiple choice items were constructed to measure students' comprehension
of information for each condition (text repeated, text once only, illustration repeated
and illustration once only). The eighty items within the four sets of twenty items
were randomized in the final format for the items. Three experienced geography
teachers assessed the reading materials and the items for each to be similar
respectively in content and difficulty. Using Bloom et al's. taxonomy (1956) to
classify each question the experts found that the twenty items for each of the four
lots of materials eighteen tested knowledge and two comprehension. A copy of the
reading materials and multiple choice items used in this Experiment is in Appendix
5.
Procedure
A Year 11 geography class was selected to conduct this Experiment within one
teaching period of 50 minutes. Upon entering the geography room the students
were instructed to move the desks apart and to be seated with no materials on the
desk except a pen or pencil with which to write. Once all students were seated they
were told: "You will be doing some geography reading comprehension exen::ises
today. You will all have four lots of material to read and then the multiple choice
items to do on each of the reading materials immediately after you have read the

Experiment 3 65
material. There will be no interaction with other students and you are to carefully
follow all instructions. When the four materials are placed on your desk leave them
there in the order they are placed. You are to read them in that exact order."
Reading materials for each student were then distributed in different order for each
student.
Once each student in the class had the four lots of reading materials and associated
tests in the different orders the instructions on page 1 were read aloud by the
experimenter:
11 1. When instructed to do so, tum the first page and the blank page to page 3 of
this paper. Carefully read the material. You will be given two minutes reading
time.
2. You should re-read the material if you have any spare time.
3. You are only to read this material and you are not permitted to have any writing
or other implement (ruler, calculator, etc.) in your hand during the reading
time.
4. At the end of the reading time you will be doing a multiple choice test based
upon the material you have read. 11
The students were then told "commence reading the material on the top of the four
lots of materials you have". At the end of the two minutes reading time (previous
experience had indicated that this was sufficient), the students were told to cease
reading and tum to page 4. The instructions on page 4 relating to the multiple
choice tests were read aloud:
"1. When instructed to do so tum the first page and the blank page to page 6. to
questions for this test and answer the 20 questions in the multiple choice test
These items are based upon the material which you have just read. You will be
given sufficient time to complete all questions (approximately 5 minutes).

Experiment 3 66
2. Circle the letter corresponding to the most correct alternative."
The experimenter then infonned students that :
"I will ensure that everyone has sufficient time to complete all the questions. You
may tum to page 6 and start the test now." Once all students had completed their
first test they were instructed to: "Put your pens down and put the first reading
material and test face down on the desk. We will now read the second lot of
material. Read the instructions on page one - these are exactly the same as for the
first lot of reading materials (the students were given about 20 seconds to do this).
You may tum to page three and commence reading the material now." At the end
of the two minutes reading time the students were told to: "Cease reading and tum
to page 4 and read the instructions on page 4 relating to the multiple choice test.
These are the same as for the first test (the students were given about 15 seconds to
do this). You may turn to page six and commence the test now." The same
procedure was followed for the remaining two reading material and associated
tests.
Results and discussion
The performance on the twenty items can be seen in Figure 8 (Table 7 shows the
means and standard deviations of those results). The comparison between the
illustrations (II and I) and the text (TI and T) showed that the advantage which can
be seen for the former was significant [F(l,69)=14.60, p<.01]. This replicates the
finding in Experiment 2. It is consistent with the predictions based on dual coding
theory (Paivio 1971, 1986) and it suggests that the failure in the first study of the
observed advantage of illustrations to reach statistical significance was probably an
instance of accepting the null hypothesis when it is false.

Experiment 3 67
Figure 8: Percentage correct for the four presentation conditions
70
60
% 50 correct
40
30
0 Text Text Text
Illustration Illustration
Illustration

Experiment3 68
Table 7: Proportions correct means and standard deviations for the
four materials in Experiment 3
Material 1
(IT)
Material2
(T)
Material 3
(II)
Material4
(I)
Average
Mean
% correct
54.0
63.7
69.0
70.2
64.2
Standard
Deviation
18.1
18.0
14.1
16.5
The proportions correct data for Experiment 3 are tabled in Appendix 6.
Observation of the differences in Figure 8 suggests that the single text is better than
the duplicated text and that there is also a very small observed difference for the
single illustration over the duplicated illustration. Any significant difference of this
kind will be detected either in the comparison between the single presentations (T
and I) and the double presentations (TT and II) or as an interaction between this
comparison and the text versus illustration comparison. Both these comparisons
failed to reach significance (respectively [F(l,69)=3.75, p>.05] and
[F(l,69)=2.28, p>.05]). Given the significant advantage for the single over double
presentations in the second experiment, one is not yet in the position to confidently
accept the hypothesis of no difference between the conditions. The difference

Experiment 3 69
between single and repeated presentations in the same form will be examined
further.

Experiment 4 70
Experiment 4
Based on Paivio's (1971, 1986) dual coding theory of memory two principal
hypotheses were tested. The first of these was that technical illustrations should be
superior to text of the same content. The second was that repetition of content in
two forms (illustration and text) should be superior to single form repetition (either
illustration repeated or text repeated). In Experiments 2 and 3 the results showed
that the illustrations used were superior to text. The comparison in Experiment 2
between repetition of content in two forms (text and illustration) over single form
repetition (text repeated or illustration repeated) showed that repeating content in
two forms resulted in better comprehension and recall than single for repetition.
There was also a non-predicted result in Experiment 2 when single presentations
(text once or illustration once) were found to be superior to double presentations
(text repeated and illustration repeated).
There are no obvious theoretical arguments for predicting the advantage for single
presentations over repeated presentations in one form. The robustness of this
difference is examined further in this study, especially as the observed differences
were in the same direction in Experiment 3. As the advantage for the presentation
of content repeated in two forms compared to content repeated as text or as
illustration has only been directly tested in one study, this comparison is replicated
here. Also, for completeness further evidence is gained on the comparison between
illustration and text of the same content.
In educational research a question which is important but difficult to examine in
detail involves time: Does student performance improve if a particular strategy used
over a long period of instruction? It is usually assumed that small experimental
differences will translate into large effects in the classroom over a long period of

Experiment 4 71
time. While it is beyond the scope of this thesis to do longitudinal studies some
work was done in this area in Experiment 2 and this will be pursued further here.
In Experiment 2 the delayed recall trials were designed to see if any difference on
immediate recall held over time. However, in that study the only difference which
held up over time was with the group in the single illustration condition and this
may have been due to a non-systematic effect. As a consequence of this, delayed
recall will be examined in this study to see if the differences hold up. The design of
the study is again within subjects with the five different treatment conditions
presented to all subjects.
Method
Subjects
Twenty-five Year 10 geography boys in one class at a high school in Sydney took
part in this study. The students ranged in age from 1S.2S years to 17.0 years
(mean age 16.0 years) and were of mixed ability in geography (i.e. the class was
not streamed with more able or less able students based upon their past
petformances in geography).
Pesim
Five lots of materials (Ml, M2, M3, M4 and MS) judged to be of similar difficulty
by three experienced geography teachers were used with each one presented under
one of the experimental conditions (TT, T, II, I and TI). Condition TT used Ml,
condition T used M2, condition Il used M3, condition I used M4 and condition TI
used MS. The experimental design was a repeated measures design with the five
types of presentation varied within subjects. As before, the order of presentation of
the conditions was counterbalanced. This is illustrated in Table 8. For example,
student one receiveq the conditions in the order of Ml (TT), M3 (II), M4 (I), M2

Ex.periment4 72
(T) then M5 (TI), whereas student twenty-two received the conditions in the order
of M2 (T), M3 (II), M5 (TI), Ml (TI) then M4 (I). Post learning performance for
the conditions was tested on a set of multiple choice items based on the content
appearing in each material. The dependent measure was performance on the one
hundred multiple-choice items in which twenty items each referred to the content
presented under each of the five conditions. The same planned comparisons were
examined as in Experiment 2. That is,
1. Repetition in two forms (TI) with repetition in single form (TI and II);
2. Repetition (II and TI) with single presentation (I and T);
3. Presentation in text (TT and T) with presentation in illustration (II and I).

Experiment 4 73
Table 8: Order of presentation of learning conditions
Student Order of presentation
1 TI II I T TI
2 T TI TI I II
3 II TI TI I T
4 I II T TI TI
5 TI I II T TI
6 TI TI I II T
7 T I TI TI II
8 II TI T TI I
9 I II T TI TI
10 TI T I II TI
11 TI I T TI II
12 T I TI II TI
13 II T TI I TI
14 I TI II TI T
15 TI TI II T I
16 TI T TI I II
17 T TI II TI I
18 II I TI T TI
19 I T TI II TI
20 TI II I TI T
21 TI TI T I II
22 T II TI TI I
23 n T TI TI I
24 I TI n T TI
25 TI TI I II T
Materials
The same four materials were used in this study as in Experiment 3 and an
additional set of material for the condition TI carefully prepared so that it would be

Experiment 4 74
very similar to the other four materials4• The content of the illustration in this fifth
condition (TI) was carefully translated into text. The resultant text was 176 words
in length (the other text conditions in the reading materials were 178 words in
length), and it was judged by the three experts to be very similar in content to the
illustration. The format of the reading material and associated items was the same
as the other four materials. As noted previously the materials for each of the five
conditions (TI, T, II, I and TI) were judged to be similar in content and complexity
by three experienced geography teachers.
The same 20 multiple choice items used for each of the materials in Experiment 3
were used in this study to measure students' comprehension of information for each
of the conditions TI, T, II and I. Another twenty multiple-choice items were
constructed for the material in the combined illustration and text condition (TI).
Three experienced geography teachers analysed the multiple choice items to check
their content validity and that the questions in each set of items matched the
questions in the other four in terms of their difficulty of wording and that the
material being tested was very similar in all five sets of items. The items within
each twenty item test were not presented in sequence with the material, i.e. the
items were randomized. The major difference in treatments of the subjects was the
order of presentation of the reading materials. Using Bloom et al's. (1956)
taxonomy of the cognitive domain to classify each question in condition TI the
experts judged that eighteen tested knowledge and two comprehension. As
previously detailed this compared with eighteen items testing knowledge and two
comprehension for the other four materials. A copy of the reading materials and
4 Care was taken where reading materials were used in more than one experiment
to ensure that each student viewed materials not seen before by them in a
previous experiment

Experiment 4 75
multiple choice items used in Experiment 3 and this Experiment for conditions TI,
T, IT and I is in Appendix 5 and for condition TI is in Appendix 7.
Procedure
One Year 10 geography class was used to conduct this Experiment in one teaching
period of 50 minutes. Upon entering the geography room the students were
directed to sit at the desks which had been separated. Once all students were seated
they were informed: "We will be doing some geography reading comprehension
exercises today. You will all have five lots of material to read and a test to do on
each of the reading materials immediately after you have read that material. This is
to be done under exam conditions with no interaction with other students. You are
to follow all instructions. The reading materials will be collected by you from me
and you are to place them flat on the desk in front of you - you are not to open them
until instructed to do so and do ensure that you keep them in the order in which you
receive them. You will be given two minutes reading time and at the end of this
time you will then do a twenty item multiple choice test. Once everyone has
completed that test and you are instructed to do so, we will then start reading the
second lot of materials and do the test for that when instructed to do so and so on
for the remaining three lots of reading materials and tests " Reading materials for
each student were then distributed in a different order for each student.
Once each student in the class had the five lots of reading materials and associated
tests the instructions on the front were read aloud by the experimenter:
"1. When instructed to do so, turn the first page and the blank page to page 3 of
this paper. Carefully read the material. You will be given two minutes reading
time.
2. You should re-read the material if you have any spare time.

Experiment 4 76
3. You are only to read this material and you are not permitted to have any writing
or other implement (ruler, calculator, etc.) in your hand during the reading
time.
4. At the end of the reading time you will be doing a multiple choice test based
upon the material you have read. 11
The students were then told "commence reading the material on the top of the five
lots of materials you have". At the end of the two minutes reading time (previous
experience had indicated that this was sufficient), the students were told to cease
reading and to tum to page 4. The instructions on page 4 relating to the multiple
choice tests were read aloud:
11 1. When instructed to do so tum the first page and the blank page to page 6 to
questions for this test and answer the 20 questions in the multiple choice test.
These items are based upon the material which you have just read. You will be
given sufficient time to complete all questions (approximately 5 minutes).
2. On the Answer Sheet provided fill in the circle around the letter corresponding
to the most correct alternative.
3. You may nm refer back to the reading material when you are doing the test
4. Do not mark the pages in this question sheet in any way."
The experimenter then informed students:
"I will ensure that everyone has sufficient time to complete all the questions. You
may tum to page 6 and start the test now." Once all students had completed their
first test they were instructed to: "Put your pens down and put the first reading
material and test face down on the desk. We will now read the second lot of
material. Read the instructions on page one - these are exactly the same as for the
first lot of reading materials (the students were given about 20 seconds to do this).
You may tum to page 3 and commence reading the material now." At the end of the

Experiment 4 77
two minutes reading time the students were told to: "C.ease reading and tmn to page
4 and read the instructions on page 4 relating to the multiple choice test. These are
the same as for the first test and you may re-read them now if you wish (the
students were given about 15 seconds to do this). You may tmn to page six and
commence the test now." The same procedure was followed for the remaining
three lots of reading materials and associated tests.
A week later the students were given the multiple choice items without the reading
material. Once all students were seated the experimenter informed the students that
they were redoing the tests to see what they may recall of the material they had read
a week earlier. The multiple choice items and answer sheet were then distributed
and the instructions on the first set of items read aloud. Students were then asked
to do the five sets of multiple choice items (this took approximately 20 minutes).
The same procedure was used a month after the students had read the materials.
Results
The percentage correct recall scores for each of the treatment conditions for the three
tests (one immediately after reading the material, a repeat of that test one week later
without reading the material and another repeat of the test one month later without
reading the material), can be seen in Figures 9, 10 and 11 (Table 9 shows the
means and standard deviations of those results). While there are other differences
detected by the analysis, the obvious difference from viewing the three figures is
that there is an expected decline over time in performance.

Experiment 4 78
Figure 9: Percentage correct for the fi ve presentation conditions for
the tests done immediately after viewing materials
70
60
% so correct
~o
30
0 Text Text Text
Illustration Illustration Illustration
Text Illustration

Experiment 4 79
Figure 10: Percentage correct for the five presentation conditions for
the tests done one week after viewing materials
70
60
% 50 correct
t::10
30
0 Text Text Text
Illustration Illustration Illustration
Text Illustration
Figure 11: Percentage correct for the five presentation conditions
for the tests done one month after viewing materials
70
60
% 50 correct
40
30
0 Text Text Text
Illustration Illustration Illustration
Text Illustration

Experiment 4 80
Table 9: Proportions correct means and standard deviations for the
five presentation conditions in Experiment 4 for test done
immediately after reading the material, one week later and
one month later
Material 1
(TT)
Material 2
(I)
Material 3
(Il)
Material4
(I)
Material 5
{TI)
immediarely aftez
reading material a week later a month later
Average
Mean Standard Mean Standard Mean Standmd of Mean
% correct Deviation % correct Deviation % correct Deviation % correct
60.2 20.4 38.2 16.6 37.8 13.5 45.4
64.8 18.1 35.8 18.5 35.0 14.2 45.2
68.2 19.7 32.8 13.5 36.4 13.8 45.8
68.8 21.0 35.0 15.7 32.0 10.7 45.3
75.8 17.0 34.2 15.7 33.6 11.9 47.9
For immediate recall the following comparisons were made on proportions correct
scores:
The comparison between the texts (IT and T) and illustrations (II and I) showed

Experiment 4 81
that the advantage for the illustrations was significant [F(l,96)=4.29, p<.05]. This
result replicates the findings reported in Experiments 2 and 3 and it is predicted by
the theoretical argument in the general introduction. It appears to be the case that
when technical content lends itself to being presented both in illustration and in text
the former results in better comprehension and recall. The replication of content in
text and illustration (TI) gave superior performance to direct replication in text (TI)
or direct replication in illustration (II) [F(l,96)=10.68, p<.01]. This result is
consistent with the good performance of this condition observed in Experiment 1
and it replicates the finding obtained in Experiment 2. There was no significant
difference between the single presentation conditions and repeated conditions in the
same fonn [F(l,96)=0.80, p>.05]. This result is consistent with the same
comparison made in the last study and in the absence of any straight forward
theoretical argument predicting an advantage for single presentations it suggests that
the significant advantage obtained in Experiment 2 was an instance of rejecting the
null hypothesis when it was in fact true.
One week later none of the significant differences detected on imm~ate recall
remained significant That is:
The comparison of texts (TT and T) with illustrations (II and I) was not
significant [F(l,96)=1.85, p>.05].
The comparison of the form of repetition (TI with TT and m was not significant
[F(l,96)=0.22, p>.05].
The comparison between the double presentations in the same form (TT and m and the the single presentations (T and I) was not significant
[F(l,96)=0.002, p>.05].

Experiment 4 82
One month later the results remained unchanged from those of a week - there were
no significant differences remaining. That is:
The comparison of texts (TT and T) with illustrations (II and I) was not
significant [F(l,96)=1.34, p>.05].
The comparison of the form of repetition (TI with TT and II) was not significant
[F(l,96)=2.27, p>.05].
The comparison between the double presentations in the same form (TT and II)
and the the single presentations (T and I) was not significant
[F(l,96)=3.60, p>.05].
The proportions correct data for Experiment 4 are tabled in Appendix 8.
Discussion
Illustrations were again found to be superior to text of the same content. As
previously noted this result is predicted by Paivio's (1971, 1986) dual coding
theory of memory and is consistent with Craik and Lockhart's (1972) depth of
processing analysis of memory. The result is also consistent with Baddeley and his
colleagues (Baddeley & Hitch, 1974, 1977; Baddeley, 1988, 1989) concept of
working memory. It is a reliable and replicable finding and suggests that when
technical content lends itself to being presented either in the form of illustration or
as text the former presentation results in better comprehension and recall.
The combined form of duplication (text and illustration) was superior to duplication
in the same form (either text repeated or illustration repeated). This replicated the
result obtained in Experiment 2 and is consistent with the good performance
observed under this condition in Experiment 1. It is again a result predicted by
both dual coding theory (Paivio 1971, 1986) and is consistent with depth of

Experiment 4 83
processing theory of memory (Craik: & Lockhart, 1972) and the concept of
working memory (Baddeley & Hitch, 1974, 1977; Baddeley, 1988, 1989).
Schallert ( 1980) observed that improved comprehension under these conditions
was probably a result of the dual access to content (text and illustration) for any
overlapping content. She suggested that simple repetition in either text or
illustration of the content was unlikely to lead to substantial improvements in
comprehension and these results indicate that this is indeed the case.
There was no significant difference between the single presentation conditions (text
once and illustration once) and repeated conditions in the same form ( text repeated
and illustration repeated). This comparison was made in the study because of the
significant result obtained in Experiment 2. There were no obvious theoretical
reasons for the significant difference in that study and the absence of a reliable
difference here indicates that the result in Experiment 2 was perhaps due to the
nature of the single illustration condition, the students in that condition or a unique
combination of material and students. It is reasonable to now suspect that in
Experiment 2 we have an instance of rejecting the null hypothesis when it was in
fact true. This lends support to the notion that, where it is possible, experimental
results should be replicated in a series of studies before reporting the findings.
Certainly the persistence here in examining further a result in one study which has
no obvious theoretical base and is counter-intuitive has proven worthwhile.
In this study the differences found on immediate recall did not bold up over time. It
should be recognized that this does not necessarily mean that adopting presentation
formats which have positive effects on immediate recall will not have longer term
effects. Indeed it is quite possible that the advantage would be maintained and
increased if learning ·occurred over a long period of time. That is, the adoption of
the advantageous presentation of repeating important content in two forms (text and

Experiment 4 84
illustration) may lead to a substantial improvement in performance over a lengthy
period of instruction such as a year. However, what these results do suggest is that
immediate gains are not maintained at a reliable level without further reinforcement.
In this study the students viewed the materials once and later did delayed trials
without further learning. It is perhaps not surprising that the differences were too
small to be statistically significant when one considers the cognitive activity and
amount of material students would learn over a week and a month between reading
the material and the memory trials. The results also indicate that performance on
the delayed trials may be at floor level. Although it is beyond the scope of this
thesis, these arguments suggest that a question as important and as complex as this
needs to be tested with a longitudinal teaching programme.
On the face of it the results of the first four studies would suggest that the
presentation of content in two forms (text and illustration) is superior to simple
repetition in one form (either text presented twice or illustration presented twice),
and that technical illustrations are better than text in depicting spatial information
which can be expressed in either form. However, in this experiment and
Experiment 3 the materials used were presented under only one experimental
condition. That is, for example, while there were five different contents used in
this study the first content appeared under condition illustration illustration, the
second under text text, the third illustration, the fourth text and the fifth content
appeared under condition text illustration. This method of presentation allowed for
the possibility that the differences obtained were due to differences in the difficulty
of content and not due to differences in its form of presentation. This was unlikely
to be the case as the materials were judged by experts to be equivalent and the same
experts judged the test items to be of equivalent difficulty and to be measuring the
same objectives. Confidence in this regard is also supported by the results obtained
in Experiment 2 where illustrations were superior to text and repetition in two

Experiment 4 85
forms was superior to single form repetition. In that study the same content was
used under all conditions and variation was between groups of students. Materials
in Experiments 3 and 4 were closely monitored to ensure that they were equivalent
within each experiment. However, for prudential reasons and experimental
thoroughness, given the possibility of a confounding of presentation format and
content differences these two variables were fully counterbalanced for presentation
in the next study.

Experiment 5 86
Experiment 5
The results of Experiments 3 and 4 were consistent with the findings in Experiment
2 and suggested that illustrations were superior to text in depicting spatial content
and that presenting the same content in two forms (text and illustration) was
superior to simple repetition in one form (text repeated or illustration repeated). As
has been pointed out considerable care was taken to make levels of difficulty similar
across content in each of these experiments and experts judged the end results to be
very similar. However, as discussed, there was a possibility of confounding
presentation format and content difficulty in the third and fourth studies and as a
consequence this question is examined directly here. In this experiment the five
materials are each presented in all five formats (text repeated, text once, illustration
repeated, illustration once and text/illustration) in a fully counterbalanced repeated
measures design.
Method
Subjects
Twenty-five boys in one class from Year 9 who study geography at a high school
in Sydney took part in this study. The students ranged in age from 14.0 years to
15.6 years (mean age 14.9 years) and were of mixed ability in geography (i.e. the
class was not streamed with more able or less able students based upon their passed
performances in geography).
Desim-
As in Experiment 4, the effects of the form of presentation of content on
comprehension were examined under five conditions using five different materials.
However, all twenty-five combinations of materials by conditions were used. That

Experiment 5 87
is, each material was presented as TI, T, II, I and TI and each material was
presented the same number of times in each of these conditions. The order of
presentation of the combinations of treatments by materials was counterbalanced
using a Latin Square design (Ferguson, 1981, p. 343). The treatments by
materials combinations and their order for each of the twenty-five students is
shown in Table 10. For example, student one read Material A under the first
condition (TI) first, Material B under the second condition (T), Material C under
the third condition (m, Material D under the fourth condition (I), and Material E
under the fifth condition (TI), whereas student twenty-two read Material B under
the fifth condition (TI) first, Material C under the first condition (TT), Material D
under the second condition (T), Material E under the third condition (II) and
Material A under the fourth condition (I). This allowed the examination of the
effects of presenting similar information in five different ways - TI, T, II, I and
TI.

Experimem5 88
Table 10: Order of presentation of learning conditions
Student Order of Presentation
1 TIA TB IIC ID TIE
2 TIB TC IID IE TIA
3 TIC 1D IIE IA TIB
4 TID 1E 11A m TIC
5 TIE TA 11B IC 11D
6 TA 11B IC 11D TIE
7 TB IIC ID TIE TIA
8 TC IID IE TIA TIB
9 1D IIE IA TIB TIC
10 1E 11A m TIC TID
11 11A m TIC TID 1E
12 11B IC 11D TIE TA
13 IIC ID TIE TIA TB
14 IID IE TIA TIB TC
15 IIE IA TIB TIC 1D
16 IA TIB TIC 1D IIE
17 m TIC TID 1E 11A
18 IC 11D TIE TA 11B
19 ID TIE TIA TB IIC
20 IE TIA TIB TC IID
21 TIA TIB TC IID IE
22 TIB TIC 1D IIE IA
23 TIC TID 1E 11A m 24 11D TIE TA 11B IC
25 TIE TIA TB nc ID
Table note: A, B, C, D and E refer to the five materials and TT, T, II, I and TI to
the five conditions - respectively text repeated, text once, illustration
repeated, illustration once and text and illustration.

Experiment 5 89
The experimental design was a repeated measures design with the five types of
presentation varied within subjects. Post learning performance for conditions was
tested on a set of multiple choice items based on the content appearing in each
material. The dependent measure was the proportion correct responses for each
condition on a twenty item multiple choice test. The same planned comparisons
were examined as in Experiments 2 and 4. That is,
1. Repetition in two forms (TI) with repetition in single form (IT and II);
2. Repetition (II and TT) with single presentation (I and T);
3. Presentation in text (IT and T) with presentation in illustration (II and I).
Materials
Selected materials from the previous studies were adapted and used. Material A
was adapted from the water cycle content presented in Experiment 1, Material B
was adapted from a cross section presented in Experiment 2 and Materials C, D and
E were all used in Experiment 4 (Materials C and D had been previously used in
Experiment 3 as well). As all materials appeared an equal number of times under
each condition it was possible to assess whether or not the experts' judgements of
equivalence in difficulty for Materials C, D and E were accurate. It should be
pointed out, however, that should there be any differences in difficulty among these
three materials or any of the five materials, that this would have no impact upon the
interpretation of th~ results of this study.
Each of the five lots of reading materials had five presentation formats - TI, T, II,
I and TI. The same twenty multiple choice items which were used with each of
these materials in the earlier studies to measure comprehension of the content
presented were again used here. The content presented to students was preceded
by the instructions followed by a blank page (to prevent students from viewing the
content through the instructions page). The instructions for the test items followed

Experiment 5 90
and there was a blank page prior to the test items. The blank pages ensured that
students could not preview material. A copy of the reading materials and associated
multiple choice items may be found in Appendix 9.
Procedure
This Experiment was conducted in sixty minutes. Once all students were seated in
the room they were told: "Today we will be doing five geography reading
comprehension exercises. There will be a multiple choice test to do at the end of
the reading time for each material based upon that material. You will all have five
lots of material bundled together with a clip on them. You will be given a bundle
and five answer sheets on which to record your answers. Ensure that you read the
materials in the order you receive them in that bundle starting with the top lot of
material. During this period you will be reading some material and doing a test
under exam conditions with no interaction with other students. You are to follow
all instructions. You will be given two minutes reading time and at the end of this
time you will then do a twenty item multiple choice test based upon what you have
just read. Once everyone has completed that test and you are instructed to do so,
we will then start reading the second lot of materials and do the test for that when
instructed to do so and so on for the remaining three lots of reading materials and
tests. 11 Reading materials for each student were then distributed in different order
for each student.
Once each student in the class had the five lots of reading materials and associated
tests in the different orders the instructions on page 1 were read aloud by the
experimenter:
11 1. When instructed to do so, turn the first page and the blank page to page 3 of
this paper. Carefully read the material. You will be given two minutes reading
time.

Experiment 5 91
2. You should re-read the material if you have any spare time.
3. You are only to read this material and you are not permitted to have any writing
or other implement (ruler, calculator, etc.) in your hand during the reading
time.
4. At the end of the reading time you will be doing a multiple choice test based
upon the material you have read."
The students were then told "commence reading the material on the top of the five
lots of materials you have". At the end of the two minutes reading time (previQus
experience had indicated that this was sufficient), the students were told to cease
reading and turn to page 4. The instructions on page 4 relating to the multiple
choice tests were read aloud:
"1. When instructed to do so turn the first page and the blank page to page 6 to
questions for this test and answer the 20 questions in the multiple choice test.
These items are based upon the material which you have just read. You will be
given sufficient time to complete all questions (approximately 5 minutes).
2. Circle the letter cOITCsponding to the most cOITCCt alternative."
The experimenter then infonned students that :
"I will ensure that everyone has sufficient time to complete all the questions. You
may tum to page 6 and start the test now." Once all students had completed their
first test they were instructed to: "Put your pens down and put the first reading
material and test face down on the desk. We will now read the second lot of
material. Read the instructions on page one - these are exactly the same as for the
first lot of reading materials (the students were given about 20 seconds to do this).
You may tum to page three and commence reading the material now." At the end
of the two minutes reading time the students were told to: "Cease reading and tum
to page 4 and read the instructions on page 4 relating to the multiple choice test.

Experiment 5 92
These are the same as for the first test (the students were given about 15 seconds to
do this). You may tum to page six and commence the test now." The same
procedure was followed for the remaining three lots of reading materials and
associated tests.
Results and discussion
Each subject read and responded to all five materials. The fully counterbalanced
repeated measures design of this study overcame any possible confounding of
materials and conditions. Therefore it is possible to ignore the treatment variable of
presentation format and analyse the data as though the treatment variable was only
materials. So prior to the main comparison of presentation formats, a comparison
of performances on materials is of interest as it allows for a retrospective validation
of the equivalence of materials used in Experiments 3 and 4 made by experts.
Specifically, Materials labelled C and D used in this study had previously been
judged to be equivalent by experts in Experiment 3, and in Experiment 4 Material E
was judged to be of equivalent difficulty to Materials C and D. The materials
labelled A and B were new to this study and because of the fully counterbalanced
design there was no need to assess their difficulty and comparisons reported on
these have no bearing on these or earlier reported results.
ColJlParison of materials
The proportional correct data are shown in Figure 12 (the proportions correct
means and standard deviations for the five materials are shown in Table 11). These
data suggest that there was no difference in performances on the three materials
previously judged to be equivalent in difficulty - Materials C, D and E. Student
performance on Material C was compared with Material D and there was no
significant difference [F(l,99)==0.00, p>.05]. The average performance on

Experiment 5 93
Materials C and D was compared with Material E and this was not significant
[F(l,99)=0.00, p>.05]. Little difference in performance on Materials A and B can
be observed in Figure 12 and the comparison between these two materials did not
reach significance [F(l,99)=0.13, p>.05]. Observation of Figure 12 does suggest
that there is a difference in average performance on Materials A and B compared
with the average performance on Materials C, D and E. This comparison reached
statistical significance [F(l,99)=5.31, p<.05]. Independent of the actual results of
this study in the main comparison of presentation formats, the finding that Materials
C, D and E were similar in difficulty in retrospect is particularly gratifying and adds
confidence to the results reported in Experiments 3 and 4.
Figure 12: Percentage correct for the five materials
70
60
% 50 correct
40
30
0 A B C D E
Maierial

Experiment 5 94
Table 11: Proportions correct means and standard deviations for
the five materials in Experiment 5
Material 1
Material2
Material 3
Material4
Materials
Average
Mean
%correct
41.4
37.0
57.6
57.4
57.6
50.2
Comparison of presentation fonnats
Standard
Deviation
15.4
19.3
22.2
20.1
20.8
The percentage correct recall scores for each of the five methods of presentation are
shown in Figure 13 (Table 12 shows the means and standard deviations of those
results). Observation of Figure 13 suggests that material is recalled better in
illustration than text, and that the combined form of repetition is superior to single
form repetition. The planned comparison between the texts (TT and T) and
illustrations (II and I) was significant favouring the illustrations [F(l,25)=11.59,
p<.05], and the planned comparison between the mixed repetition (TI) with the two
repeats in the same form (TI and II) was highly significant favouring the mixed
material [F(l,25)=13.81, p<.01]. There was no significant difference between the
single and repeated presentations in the same form [F(l,25)=0.33, p>.05].

Experiment 5 95
Figure 13: Percentage correct for subjects on the five presentation
conditions
70
60
% 50 correct
~o
30
0 Text Text Text
Illustration Illustration Illustration
Text Illustration
Table 12: Proportions correct means and standard deviations for the
five formats in Experiment 5
Text repeated
Text once
illustration repeated
illustration once
Text and illustration
Average
Mean
% correct
41.6
44.6
53.0
53.4
60.8
50.7
Standard
Deviation
21.5
20.7
22.5
16.3
20.5

Experiment 5 96
The proportions correct data for Experiment 5 are tabled in Appendix 10.
These results replicate the findings reported in Experiments 3 and 4 for student
performance on the different presentation formats of text and illustration. They also
replicate the findings of Experiments 1, 2 and 4 for student performance on the
combined form of presenting the same content compared to repetition in one form
only. It can now confidently concluded that for immediate comprehension and
recall when technical content of spatial information can be presented as either
illustration or text then the former is superior, and that a combined form of
duplication (text and illustration) is superior to duplication in the same form (either
text repeated or illustration repeated).

General discussion/or Experiments 1 to 5 97
General Discussion Experiments 1 to 5
There are three findings of particular interest reported in these studies. Firstly, in
studies one and two comprehension of text was not improved by the presence of a
technical illustration which was related to but not a repetition of the text.
Secondly, in studies two, four and five presentation of the same spatial content in
an illustration and in text resulted in superior comprehension than either repetition
in text or repetition in illustration. Thirdly, in the second, third, fourth and fifth
studies when it was possible to present essentially the same content in an
illustration or as text comprehension was superior in the case of the illustration.
The first study controlled for the repetition of the content of an illustration and text
by having the illustration's content related to, but additional to the text. Under
these conditions the presence or absence of the illustration had no effect on the
comprehension of text. This finding was supported with a similar result in
Experiment 2 in which the comprehension of text was not aided by the presence of
a related illustration. The failure to find an improvement in the comprehension of
text accompanied by an illustration is consistent with similar insignificant results
reported by Concannon, 1975, Koenke, 1968, Miller, 1938, Samuels, 1970,
Vernon, 1950, 1953, 1954, and Weintraub, 1960 but contrasts with a number of
robust effects recorded by Hayes and Readence, 1982, 1983, Lesgold et al., 1977,
Reid et al., 1983, and Reinking et al., 1988. However, it is not always clear from
the reports of studies in this area what the relationship was between the content of
the text and the content of the illustration. It is possible that there was very little
overlap of the content of the text and illustration in those studies which failed to
report significant improvement in the comprehension of text Schallert (1980) after
reviewing this literature came to the conclusion that there was a case for arguing
that certain illustrations improved the comprehension of related text, but she also

General discussion for Experiments 1 to 5 98
noted that overlapping content of text and illustration was probably an important
factor contributing to this improvement. The present findings are consistent with
this suggestion. When specific attempts were made to prevent the content of the
illustration repeating the content of the text, the comprehension of the text was not
improved by the presence of the illustration.
In her discussion of the potential importance of overlapping content of text and
illustration Schallert (1980) suggested that the improvement which was likely to
result should not simply be considered a consequence of repetition, but rather that it
probably resulted from the cognitive consequence of providing two different access
routes to comprehension of the content. The question of alternative access routes
versus simple repetition was examined in the second, fourth and fifth studies.
Presentation of the same conceptual and spatial content in an illustration and in text
resulted in superior comprehension than repetition in either text or repetition in
illustration. These findings support the importance of providing different access
routes to the comprehension of content, and the cognitive consequences of this can
be characterized in terms.of Paivio's ( 1971, 1986) dual coding theory. Dual coding
theory argues that there are two stores for material - verbal and nonverbal. Text is
primarily stored in the verbal store and illustrations in the nonverbal store and
interconnections between the two stores may occur. In the present context
comprehension might be expected to improve both because of the number of
memory codes available and the interconnections formed between verbal and
nonverbal stores. When the same content is presented in both text and illustration it
would be reasonable to expect a facilitation of interconnections between both stores.
Also, the nature of the illustrations used for this technical material with both
drawings and verbal labels might be expected to add even further to the cognitive
activity or processing involved, particularly in developing interconneptions between
verbal and nonverbal stores. When interactions between verbal and nonverbal

General discussion for Experiments 1 to 5 99
stores are characterised as cognitive activity or processing, the finding of superior
performance with the provision of a dual access route to comprehension is
consistent with the depth of processing theory of memory proposed by Craik and
Lockhart (1 '172). The facilitation of interconnections can be interpreted directly as a
greater breadth of cognitive processing in memory and Craik and Tulving (1975)
have argued that this leads to better recall of the content.
In the second, third, fourth and fifth studies where spatial information was used
which could be presented in either illustration or text, comprehension of content
presented as an illustration was superior to the comprehension of the same content
in text. This finding appears to be consistent with the results reported by Rigney
and Lutz (1976) who found that illustrations were superior to words in the
presentation of certain content. Rigney and Lutz argued that the superior
performance of illustrations was due to their facilitating effect on the development
of mental imagery. The importance of mental imagery for comprehension is well
documented. For example, Paivio (1986) found that mental images are especially
efficient for assimilating spatial information and Long, Winograd and Bridge
(1989) suggest that imagery improves comprehension because it is an
organizational tool for coding and storing meaning. However, it has been noted
that both text and illustrations can give rise to mental imagery (Schallert, 1980),
and in some cases the images are more vividly aroused by the text (Sadoski,
1983). The illustrations used in these studies depicted spatial information and
consistent with Paivio's (1986) argument they are likely to be superior facilitators
of images than the text. However, even if this were not the case, since illustrations
and images perform similar functions in improving the processing of information
(Schallert, 1980), the overall increase in cognitive processing prompted by the
illustrations might be expected to lead to better comprehension than is the case with
the text. In other words it might be expected that illustrations give greater depth

General discussion/or Experiments 1 to 5 100
(Craik and Lockhart, 1972) and breadth (Craik and Tulving, 1975; Rasco,
Tennyson & Boutwell, 197 5) of processing of content. The superiority of
illustrations over the same content presented as text is also consistent with the
working memory model of Baddeley and his colleagues (e.g. Logie & Baddeley,
1987; Baddeley, 1988, 1989). It might also be important to note that in the present
studies the verbal labels and the pictorial material in the illustrations would be
stored in verbal and nonverbal interacting cognitive codes (Paivio, 1971, 1986)
and that Paivio and Casapo (1973) argue that pictures are more likely than text to
be dually coded. Under these circumstances it may well be the case that verbal
labels in illustrations may actually provide some form of dual access to the content
The results have some implications for the presentation of technical material such as
Geographical content. They suggest that firstly, technical illustrations present
information in their own right and are not simply adjuncts to content presented in
text Secondly, when spatial content lends itself to be presented as an illustration or
text the former is superior. Thirdly, in the case of important information presented
in text if it is possible to present this content in an illustration as well
comprehension is improved. Overall the results strongly suggest that in the
preparation texts and materials of technical content that at least as much care should
be taken in the drawing of illustrations as is taken with the writing of the text. At
this stage it is difficult to completely specify the requirements for the care needed in
presenting illustrations. Schallert (1980) noted a number of characteristics which
she considered would give positive effects for illustrations upon the comprehension
of text. They were that illustrations should represent spatial information or
information relevant to the total message of the text and she suggested further that if
the text provides a framework for certain information to be derived from the
illustrations then such illustrations may also have a beneficial effect. The beneficial
effects on comprehension due to the presentation of spatial information in

General discussion/or Experiments 1 to 5 101
illustrations and in imagery have also been discussed (Kolers, 1973; Paivio, 1986),
and the importance of repetition of text content in illustrations has been
demonstrated here. However, it would be of interest to further delineate the sorts
of content which best lends itself to illustration and to ascertain how publishers and
authors decide on what is to be illustrated. Also, it might be useful to investigate
the opinions of the reading audience.

102

Introduction to Section 2 103
Introductron
The first five studies examined ways of presenting technical geographical material
which improved reader comprehension. A combination of text and illustration to
repeat important information resulted in better comprehension of that material by
students than when the content was repeated in the same form (either text repeated
or illustration repeated). This suggests that where important information is to be
repeated for emphasis that the best way to do this is in two forms. In the first five
studies it was also found that where technical information can be presented as
illustration or expository text, the former is superior. In some cases there are
aspects of geographical material which are virtually impossible to present in textual
form, and illustrations with explanatory text or short keys are far more appropriate
as text by itself would result in lengthy and complex exposition. For example,
attempting to describe contours on a topographic map is far better done by using a
map with a key than attempting to cover the content in text alone. This leads to the
question of when illustrations are used, what is the best way to present illustrations
with explanatory text? Is it best to put explanatory material on the illustration itself.
or is such written information best located in a key adjacent to the illustration?
Presentation techniques for illustrations have rarely been guided by cognitive theory
but more by common sense and tradition. The layout of materials is more usually
the result of some combination of visual elegance, tradition and random factors
(Sweller, Chandler, Tierney & Cooper, in press). Our knowledge of cognition has
now progressed and is supported by empirical findings so that traditional
techniques of presenting illustrations are becoming obsolete. Cognitive load theory
(Sweller 1988, 1989) suggests that the manner in which cognitive resources are
used in performing a task or set of tasks is critical to learning and problem solving.
Sweller, Chandler, Tierney and Cooper (in press) observed that a heavy,

Introduction to Section 2 104
extraneous cognitive load is imposed by many learning and problem solving
activities and that some presentation formats require considerable, initial mental
reorganisation and processing of elements prior to attending to learning new
information. Research undertaken in this area in mathematics, physics and
technology has shown that heavy cognitive load interferes with performance and
that to facilitate problem solving in these subjects the presentation and format of
instructional materials needs to take this into account (Sweller, 1988; Tarmizi &
Sweller, 1988; Ward & Sweller, 1990; Sweller et al., in press). In particular,
cognitive load is increased under conditions where mutually referring material is
split. A number of these studies have shown that when unnecessarily separated
sources of information are integrated problems are solved more readily than if the
material is split (e.g. Tarmizi & Sweller, 1988; Ward & Sweller, 1990).
In discussing empirical results on cognitive load in mathematics and science,
Sweller (1988) concludes that traditional procedures of instruction need to be
revised in order to reduce cognitive load and facilitate learning. From the studies he
reviewed Sweller suggested that appropriately reorganised materials which had a
unified source of information were superior to traditional split source presentations.
Whilst the research in cognitive load theory (Sweller 1988, 1989) has been in the
area of human problem solving, the format of materials of which the researchers are
critical is similar to materials used in other technical areas such as geography.
Obseivation of the way in which geographical materials are presented suggests that
the same sort of separation is occurring with many illustrations. Presentations of
this kind are likely to be making learning more difficult
The experimental studies in this section of this thesis are concerned with the
splitting of information in technical illustrations. That is, they address the question
of whether mutually referring, disparate sources of information that cannot be

Introduction to Section 2 105
understood in isolation should be integrated into a unitary entity to facilitate
learning. Before discussing the first of these studies the related empirical literature
will be reviewed and two theories of cognition which underpin this area of research
will be discussed.
Review of empirical literature
A number of studies have been reported which have examined the effects of
increased cognitive load upon learning (e.g. Baddeley, 1981; Baddeley & Hitch,
1974; Carroll & Carrithers, 1984; Cooper & Sweller, 1987; Sweller, Chandler,
Tierney & Cooper, in press; Tarmizi & Sweller, 1988; Ward and Sweller, 1990;
Zhu & Simon, 1987). In general these investigations have found that instructional
techniques that require students to split their attention between different sources of
information and then mentally integrate these result in fewer cognitive resources
being available to perform a reasoning or learning task. By way of example several
studies which have examined the effects of splitting attention between mutually
referring but disparate sources of information on cognitive load will be reviewed.
Cooper and Sweller (1987) examined the relationship between schema acquisition
and rule automation using algebra transfer problems. Schema acquisition and rule
automation are considered by Sweller (1989) to be the basic components of skilled
problem solving. In problem solving, a schema is considered to be a generalised
cognitive construct that enables problem solvers to recognize problems as
belonging to a particular category and requiring particular mental actions
appropriate to solving the problem (see Chi, Glaser & Rees, 1982; Schoenfeld &
Herrmann, 1982). Schemas generate moves and require little effort to determine

Introduction to Section 2 106
solutions as they facilitate performance on problems which are sttucturally similar
to problems seen previously (Sweller 1989; Ward & Sweller, 1990). As a result
schemas are favoured over alternative problem solving strategies even when it may
be inappropriate (Sweller, Mawer & Ward, 1983). Rule automation involves using
rules with little or no conscious processing and allows solutions to problems
including those which are different to previously encountered ones (see Kotovsky,
Hayes & Simon, 1985). For example, if the rule v = u + at is automated, a student
would not have to work out whether v referred to average or final velocity or what
the other symbols represented. Cooper and Sweller suggested that to achieve rule
automation much practice using the rule is needed and that schema acquisition
develops more rapidly and improves performance on problems similar to those
seen previously. A person not possessing relevant schemas or attempting to use a
non-automated rule is unlikely to have sufficient cognitive resources to, for
example, simultaneously search for the rule and solve the problem. Experts were
found to solve algebraic problems using schemas and automated rules whereas
novices used means-ends analysis which has been found to interfere with learning
(see Owen & Sweller, 1985; Sweller, Mawer & Howe, 1982; Sweller, Mawer &
Ward, 1983). Attention directed to differences in problem states results in a heavy
cognitive load as there is the need to consider the current problem state, past ones,
differences between these two states and the goal state (Ward & Sweller, 1990).
Cooper and Sweller concluded that using schemas and automated rules facilitates
the solution of problems and that reduced cognitive load assists in both the
acquisition of schemas and rule automation.
Zhu and Simon (1987) substituted the use of worked examples for lectures and
other conventional classroom activities in a longitudinal study in mathematics. The
use of worked examples has been found to reduce cognitive load and focus
attention on problem states and their associated moves (Cooper & Sweller, 1987;

Introduction to Section 2 107
Sweller & Cooper, 1985). Zhu and Simon used worked examples in algebra and
found strong advantages over direct instruction and that a conventional three year
mathematics course was completed in two years. There was a slightly higher level
of performance by those students who completed the course in two years using
worked examples compared to those who had done the same course over three years
using conventional techniques.
The use of mathematical problems has been examined in the context of human
attention by Tarmizi and Sweller (1988). Using circle geometry problems, these
researchers investigated the hypothesis that students studying worked examples
would have superior performance compared to more usual active problem solving
instructional techniques used in geometry. They conducted five experiments using
worked examples or subgoals as guidance which are commonly used in mathematics
to aid schema acquisition and improve problem solving abilities. Tarmizi and
Sweller found that students' performance did not improve when guidance was
provided by worked examples or subgoals. They observed that conventionally
formatted worked examples required students to split their attention between two
sources of information - a diagram and related equations and theorems that referred
to elements in the diagram. Presenting information in a unified source which did not
require mental integration of the diagram and text was found by these researchers to
result in worked examples being superior to conventional problems. Tarmizi and
Sweller suggested that holding material in working memory (Baddeley, 1981; 1989;
Baddeley & Hitch, 197 4) and processing it in order to effect integration was
detrimental to learning as cognitive activity not related to schema acquisition
exhausted mental resources. While the studies of Tarmizi and Sweller used problem
solving material which is different from the acquisition of information in
geographical illustrations, the conclusion of these authors that formats of presenting
information which did not split attention resulted in superior

Introduction to Section 2 108
performance as cognitive load was reduced is of interest in the present studies.
Using cognitive load theory (Swelter 1988, 1989) Ward and Swelter (1990)
conducted five experiments comparing worked geometric optics and kinematics in
physics under classroom conditions. According to cognitive load theory, the use of
worked examples to improve problem solving is not the most important factor but
rather whether the techniques used appropriately direct attention and impose a
relatively light cognitive load. Ward and Swelter found that the use of worked
examples in the classroom can facilitate learning as they can appropriately direct
attention and reduce cognitive load. They found further that the format of worked
examples is critical to their usefulness. For example, traditional practices of
presenting information in a kinematics worked example requires the problem
statement and sets of equations to be mentally integrated in order to make sense of
the example. A heavier cognitive load is imposed as equations need to be mapped
onto a statement. This is an irrelevant activity to schema acquisition and rule
automation and Ward and Sweller observed that this makes learning more difficult.
Worked examples which were formatted to reduce the need for mental integration
of several sources of information were superior to formats which caused attention
to be split between for example, the text and equations or text and diagrams.
In their fifth and final experiment, Ward and Sweller (1990) examined the counter
intuitive hypothesis that more explanatory material given in a worked example will
cause it be less effective. They found that this was the case and observed that
"excessive explanatory material associated with worked examples may be not
merely redundant, but detrimental as well. The temptation to provide unnecessary,
additional explanations needs to be resisted, especially if these explanations result
in split-source format. The best worked examples have all information integrated
into a single unit." (p. 38). Providing information in addition to the core material

Jntrodslction to Section 2 109
which also needed to be mentally integrated impeded learning. Ward and Sweller's
empirical data indicated that reduced cognitive load facilitates schema acquisition
and improves performance on similar problems which a particular schema can
incorporate. Rule automation was found to be facilitated and performance on
problems not covered by a previously acquired schema was improved.
Six experiments were conducted by Sweller, Chandler, Tierney and Cooper (in
press) using mathematics and engineering materials testing the suggestion that ·
instructional presentations can impose a heavy cognitive load prior to learning
commencing. Their experiments were generated by cognitive load theory (Sweller
1988, 1989) which is concerned with the manner in which cognitive resources are
distributed during learning and problem solving. Sweller et al. used a variety of
instructional materials such as text and text, illustration and illustration, geometric
and technological illustrations and text. Where presentation formats required
students to simultaneously attend to several related sources of information, as is
often the case with technical material, considerable mental reorganization and
processing of the elements was required. They found that combining related
information into a unitary source which does not split attention resulted in superior
performance compared with split attention formats. The results of their
experiments led them to suggest that instructional texts should (a) commence with
explanatory information integrated into as limited a number of units as is possible
which avoid separating out material for reasons of aesthetics, (b) have several
integrated worked examples to demonstrate the previously explained principles, and
(c) finish with several integrated worked examples mixed with conventional
problems for students to solve. Sweller et al. concluded that a heavy cognitive load
is imposed where the design of instructional material requires students to mentally
integrate disparate sources of mutually referring information and recommended a
radical recasting of instructional formats in most technical areas.

Introduction to Section 2 110
While problem solving is not the same as the acquisition of information from
geographical text it is sufficiently similar on occasion in terms of having attention
split between two or more sources of information. A straight forward expectation
of splitting attention in geography would be that cognitive load is increased and
performance impaired. The studies which follow are an extension of the work of
Tarmizi and Sweller (1988), Ward and Sweller (1990) and Sweller et al. (in press)
from the problem solving mode which is more peculiar to mathematics and similar
subjects to the cognitive integration schema development as is typical in geography.
Cognitive Theory
Cognitive science has made substantial progress in the last decade. Theories and
findings that are now available have clear implications for instructional design.
Schema theory and cognitive load theory will be outlined and used to generate
hypotheses. These hypotheses will be tested using secondary school, geography,
curriculum materials.
Schema theory
The first modem schema theorists such as Mandler and Johnson, 1977 and
Rumelhart, 1975 were concerned with mental representations of stories as had
Bartlett (1932) who first used the term "schema" in the context of cognitive theory.
Schema theory has an important role in cognitive science. A schema is a
generalised cognitive construct that allows us to classify categories of tasks
according to the mental actions appropriate to the task. For example, in a problem
solving context, schemas allow us to categorise problems according to the moves
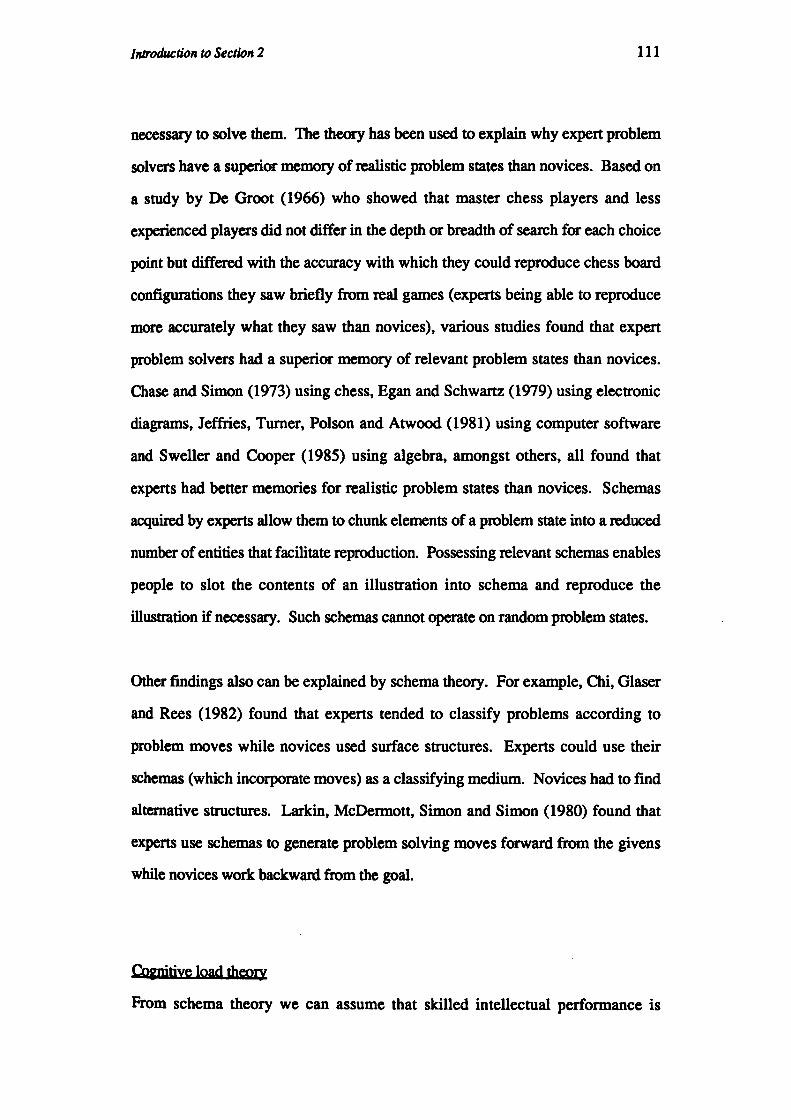
Introduction to Section 2 111
necessary to solve them. The theory has been used to explain why expert problem
solvers have a superior memory of realistic problem states than novices. Based on
a study by De Groot ( 1966) who showed that master chess players and less
experienced players did not differ in the depth or breadth of search for each choice
point but differed with the accuracy with which they could reproduce chess board
configurations they saw briefly from real games (experts being able to reproduce
more accurately what they saw than novices), various studies found that expert
problem solvers had a superior memory of relevant problem states than novices.
Chase and Simon (1973) using chess, Egan and Schwartz (1979) using electronic
diagrams, Jeffries, Turner, Polson and Atwood (1981) using computer software
and Sweller and Cooper (1985) using algebra, amongst others, all found that
experts had better memories for realistic problem states than novices. Schemas
acquired by experts allow them to chunk elements of a problem state into a reduced
number of entities that facilitate reproduction. Possessing relevant schemas enables
people to slot the contents of an illustration into schema and reproduce the
illustration if necessary. Such schemas cannot operate on random problem states.
Other findings also can be explained by schema theory. For example, Chi, Glaser
and Rees (1982) found that experts tended to classify problems according to
problem moves while novices used surface structures. Experts could use their
schemas (which incorporate moves) as a classifying medium. Novices had to find
alternative structures. Larkin, McDermott, Simon and Simon (1980) found that
experts use schemas to generate problem solving moves forward from the givens
while novices work backward from the goal.
CQ&Jlitive load theozy
From schema theory we can assume that skilled intellectual performance is

Introduction to Section 2 112
dependent on the acquisition of a very large number of schemas. How should
instruction be designed to ensure that it maximally facilitates schema acquisition?
Cognitive load theory (Sweller 1988, 1989) has been used to suggest that many
traditional instructional techniques require students to engage in cognitive activities
that both impose a heavy cognitive load and are irrelevant to acquiring schemas.
For example, Tarmizi and Sweller (1988) using Euclidian geometry and Ward and
Sweller (1990) using physics found that traditionally formatted worked examples
were relatively ineffective. Similarly, Sweller, Chandler, Tierney and Cooper (in
press) found that conventionally structured instruction in coordinate geometry and
numerical control programming (a form of programming designed to control
industrial machinery) also was ineffective in assisting students to acquire schemas.
In most of these cases instruction consisted of a diagram and its related text,
equations or theorems. Neither the diagram nor the associated material was
intelligible in isolation. In order to understand the information, students first had to
mentally integrate the diagram and its related material. Once integration had
occurred, schema acquisition could commence. Mentally integrating disparate but
mutually referring sources of information is an essential precursor to schema
acquisition but irrelevant to learning itself. It requires cognitive resources and
distracts attention from essential aspects of the task. The obvious alternative is to
circumvent the need for students to mentally integrate material by physically
integrating it. For example, equations can be placed directly on relevant sections of
a diagram rather than adjacent to it. In the experiments conducted by Tannizi and
Sweller (1988), Ward and Sweller (1990) and Sweller et al. (in press), such a
format resulted in substantial benefits to learning.
Instruction in geography frequently consists of diagrams and text or tables that
require students to split their attention between and mentally integrate these
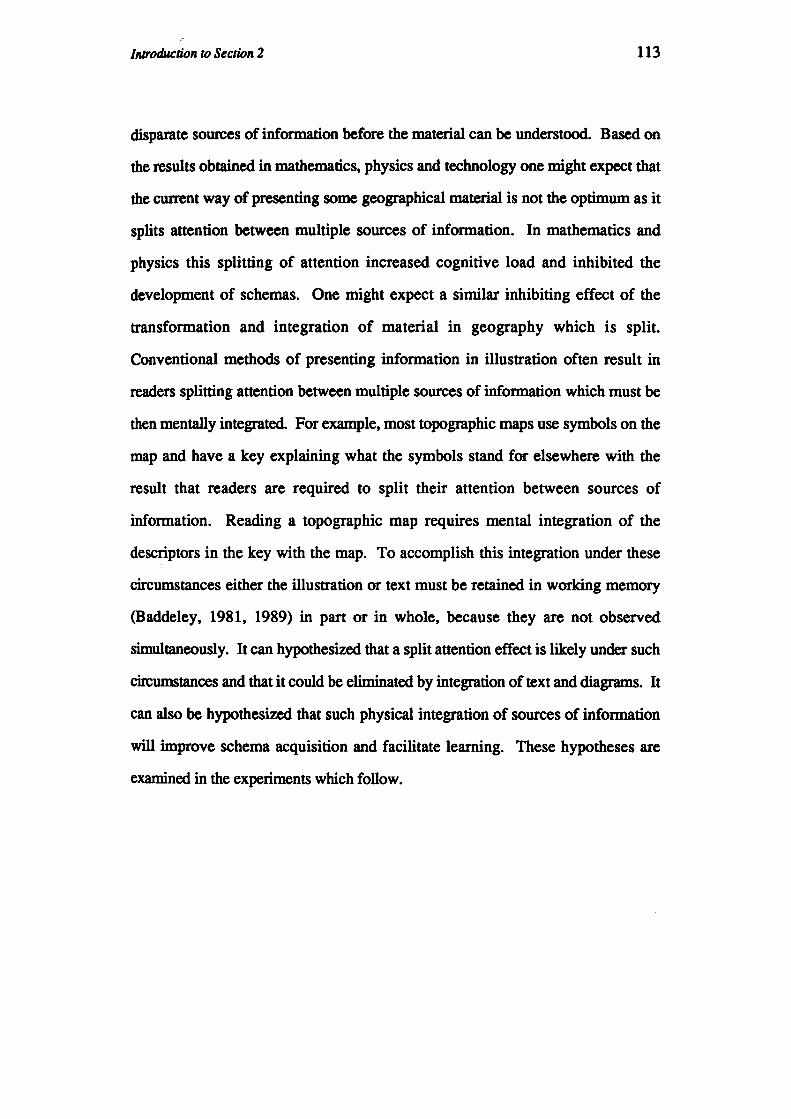
,, Introduction to Section 2 113
disparate sources of information before the material can be understood. Based on
the results obtained in mathematics, physics and technology one might expect that
the cUITent way of presenting some geographical material is not the optimum as it
splits attention between multiple sources of information. In mathematics and
physics this splitting of attention increased cognitive load and inhibited the
development of schemas. One might expect a similar inhibiting effect of the
transformation and integration of material in geography which is split.
Conventional methods of presenting information in illustration often result in
readers splitting attention between multiple sources of information which must be
then mentally integrated. For example, most topographic maps use symbols on the
map and have a key explaining what the symbols stand for elsewhere with the
result that readers are required to split their attention between sources of
information. Reading a topographic map requires mental integration of the
descriptors in the key with the map. To accomplish this integration under these
circumstances either the illustration or text must be retained in working memory
(Baddeley, 1981, 1989) in part or in whole, because they are not observed
simultaneously. It can hypothesized that a split attention effect is likely under such
circumstances and that it could be eliminated by integration of text and diagrams. It
can also be hypothesized that such physical integration of sources of information
will improve schema acquisition and facilitate learning. These hypotheses are
examined in the experiments which follow.

Experiment 6 114
Experiment 6
Geographic instructional materials frequently include a diagram consisting of
symbols and an adjacent key in which the name of each feature is associated with
its appropriate symbol. Meaning can be derived neither from the diagram nor the
key until after they have been mentally integrated. From the theories discussed, it
can be hypothesized that instruction will be more effective if the key is eliminated
and the feature names or descriptions are placed directly on the diagram. Physical
integration, by eliminating the need for mental integration, should in tum eliminate
the split attention effect. This hypothesis is tested in the present experiment.
Method
Subjects
Forty-four boys from Years 9, 10 and 11 who study geography at a high school in
Sydney took part in this study. The range in reading ability amongst these students
is in the good performance level. The students ranged in age from 14.1 years to
17.7 years (mean age 16.2 years) and were of mixed ability in geography (i.e. the
classes they were in were not streamed with more able or less able students in them
based upon their past performances in geography).
Desip
Two lots of material of similar difficulty were constructed for use in this
experiment. The combinations of these two materials with the two attention
conditions were fully counterbalanced across subjects. That is, twenty-two
subjects received Materials 1 under the split attention condition and Materials 2
under the combined attention condition and the other twenty-two subjects received
Materials 2 under the split attention condition and Materials 1 under the combined

Experiment 6 115
attention condition. Within these two groupings, eleven subjects read split
attention material followed by combined attention material and vice versa for the
other eleven. The result of this counterbalancing was that eleven students received
Material 1 split followed by Material 2 combined, another eleven received Material
2 combined followed by Material 1 split, another eleven Material 1 combined
followed by Material 2 split and the final eleven Material 2 split followed by
Material 1 combined.
The design was a repeated measures design which allowed the comparison of split
and combined conditions within subjects. The dependent measure was
performance on forty multiple-choice items in which twenty items each referred to
the content presented by each of the two materials. There were two learning and
test sessions one week apart and then a delayed test session one week after the
second learning and test session. That is, the subjects read the material and did the
associated multiple choice items, repeated this procedure one week later and then
did the multiple-choice items without reading the material a week after that.
Materials
The two cross sections used in the combined conditions in this study were used in
Experiments 3 and 4 and these were redrawn for the two split conditions. The split
condition had the diagram and associated descriptors separated while the combined
version of each of the illustrations had all the descriptors within the illustrations.
The cross sections in combined and split forms can be found in Appendix 11. The
multiple choice items for the two cross sections were the same as those used for
those materials in Experiments 3 and 4 and can be found in Appendix 5. Each of
the four reading materials (Material 1 combined and split, and Material 2 combined
and split) and associated tests consisted of eight quarto pages stapled together (i.e.
there were four lots of eight pages stapled together). The content presented to

Experiment 6 116
students was preceded by the instructions followed by a blank page. The
instructions for the test items followed and there was a blank page prior to the test
items. The blank pages ensured that students could not preview material. The split
condition had the diagram and associated descriptors separated while the combined
version of each of the illustrations had all the descriptors within the illustrations.
Text in the illustrations was prepared using Apple Macintosh "Times" 10 point
typestyle and text in the tests was Apple Macintosh "Times" 12 point typestyle.
Procedure
There was one geography class in Years 9 and 10 and one from the three classes in
Year 11 selected. There were three phases of this experiment each of which was
conducted in one teaching period of 50 minutes. On entering the classroom the
students were instructed to be seated with no materials on the desk except a pen or
pencil with which to write. Once all students were seated they were told: "We will
be doing two geography reading comprehension exercises today. You will all have
two lots of material to read and a test to do on each of the reading materials
immediately after you have read the material. During this period there will be no
interaction with other students. All instructions are to be followed. You may not
refer back to the reading materials once we start a test. The two reading materials
will be collected by you from me in the order that you are to read them in and you
are to place them flat on the desk in front of you - you are not to open them until
instructed to do so and do ensure that you keep them in the order in which you
receive them. You will be given three minutes reading time and at the end of this
time you will then do the test. Once everyone has completed that test and you are
instructed to do so, we will then start reading the second lot of materials and do the
test for that when instructed to do so." Reading materials for each student were
then distributed.

Experiment 6 117
Once each student in the class had their two lots of reading materials and associated
tests in the different orders the instructions on page 1 were read aloud by the
experimenter:
"1. When instructed to do so, turn the first page and the blank page to page 3 of
this paper. Carefully read the material. You will be given three minutes
reading time.
2. You should re-read the material if you have any spare time.
3. You are only to read this material and you are not permitted to have any writing
or other implement (ruler, calculator, etc.) in your hand during the reading
time.
4. At the end of the reading time you will be doing a multiple choice test based
upon the material you have read."
The students were then told "commence reading". At the end of the three minutes
reading time (previous experience had indicated that this was sufficient), the
students were told to cease reading and to turn to page 4 and the instructions on that
page were read aloud:
"1. When instructed to do so tum this page and the blank page to page 6 to
questions for this test and answer the 20 questions in the multiple choice test
These items are based upon the material which you have just read. You will be
given sufficient time to complete all questions (approximately 10 minutes).
2. On the Answer Sheet provided fill in the circle around the letter corresponding
to the most correct alternative for the multiple choice test
3. You may nm refer back to the reading material when you are doing the test
4. Do not mark the pages in this question sheet in any way."
The experimenter then infonned students that:
"I will ensure that everyone has sufficient time to complete all the questions. You
may start the test now."

Experiment 6 118
Once all students had completed their first test they were instructed to: "Put your
pens down and put the first reading material and test face down on the desk. We
will now read the second lot of material. Read the instructions on page one - these
are exactly the same as for the first lot of reading materials (the students were given
about twenty seconds to do this). You may turn to page three and commence
reading the material now." At the end of the three minutes reading time the students
were told to: "Cease reading and turn to page 4 and read the instructions on page 4
relating to the multiple choice test. These are the same as for the first test (the
students were given about twenty seconds to do this). You may turn to page six
and commence the test now." The same procedure was followed for the other
learning and delayed test sessions.
Results and discussion
The main result of interest is the comparison between the split and combined
conditions. The average percentage correct recall scores for the three tests for the
split material was 58.8% and for the combined material this percentage was 64.2%
(data for the three tests are indicated in Table 13). Overall, the comparison between
combined and split attention approached but failed to reach statistical significance
[F(l,43)= 3.49, .05<p<.1]. However, one of the interactions between attention
and trials did reach significance [F(l,43)=58.29, p<.01]. This suggests that the
difference in performance by students between the combined and split conditions
was statistically significant for one or more of the trials. Observation of the data
shows bigger differences in student performance between the split and combined
conditions on the first trial and recall trial than the second learning trial. Tests of
simple effects (Winer, 1971) showed that the difference in the recall trial reached
statistical significance and the first learning trial approached significance

E,cperiment6 119
[F(l,128)=6.42, p<.05 and F(l,128)=3.36, .05<p<.l respectively]. The
difference between the split and combined conditions did not reach significance in
the second learning trial [F(l,128)=0.93, p>.05].
Table 13: Proportions correct means and standard deviations for
three tests in Experiment 6
First test with
reading material
(Fll'St week)
Mean Standard
% correct Deviation
Combined 66.6
Split 61.1
% diffenn:e 5.1
16.1
15.2
Second test with
reading material
(Second week)
Third test without
reading material
(Third week)
Average
Mean Standard Mean Standard of Mean
% correct Deviation % correct Deviation % correct
71.9
69.0
2.9
20.1
20.5
54.0
46.4
7.6
22.0
19.6
64.2
58.8
5.4
The proportions correct data for Experiment 6 are tabled in Appendix 12.
The results give limited support for the split attention hypothesis. Presenting
information in illustration which did not split attention between the illustration and a
key led to observably superior performance on all three trials and this difference
reached statistical significance on the third trial. These results suggest that splitting
attention between an illustration and its key does inhibit integration of the two

Experiment 6 120
sources of information. Failure to reach statistical significance on all three trials is
probably due to asymptotic effects. Looking at the data it appears that the test on
the reading material may have been too easy and one possibility is that ceiling
effects may have occurred whereby a number of students scored full marks on tests
or close to full marks ( 41 % of students scored 80% or more of the test items correct
in the second trial). This possible ceiling effect may have restricted the opportunity
for the combined condition to reliably demonstrate superior performance over the
split condition across the three trials.
Other results showed that there was no interaction between attention and the
comparison on the first and second learning trials [F(l,43)=0.21, p>.05]; student
performance improved significantly from Trial 1 to Trial 2 [F(l,43)=49.40, p<.01];
and performance in the learning sessions was superior to the delayed session with
no further learning [F(l,43)=10.16, p<.01]. The changes in performance over
trials is expected. That is, one might expect improvement in performance from
Trial 1 to Trial 2 and performance to drop off for the delayed trial without learning.
The intention of giving two learning and one post session in this study was to see
whether the advantage of the combined condition improved with the second
learning trial and post learning trial after feedback had stopped. From the data there
was no evidence of this happening. However, it was not possible to determine this
from the data obtained due to possible ceiling effects. There was very little room
for improvement in performance from Trial 1 to Trial 2 as performance levels were
on average quite high. If the difficulty of material is increased so that the group
achieves a mean of around 50% on the first trial it is possible that this will provide
an opportunity to see whether or not a the advantage of the combined format
improves over time. This question is examined further in Experiments 7 and 8.

Experiment 7 121
Experiment 7
The significant result in Experiment 6 indicated an advantage for the combined form
of presenting a technical illustration over a situation in which the labelling for the
illustration is separated from the actual diagram. However, there appeared to be
possible ceiling effects for the delayed learning and test session which reduced the
difference between the two conditions of combined and split material. In light of
the introductory comments to this section and the discussion in Experiment 6, it is
desirable to examine the split attention hypothesis using materials which are more
difficult to comprehend and thus reduce possible ceiling effects over several
learning and tests sessions. This study has three learning and test sessions one
week apart followed by three test sessions one week apart (i.e there are six trials -
the first three of which subjects read the materials and then did the test and three in
which they only did the test and did not read the materials). From the introductory
comments and the results of the previous study it is expected that the combined
conditions should be superior to the split conditions. Also it could be expected that
as the learning trials go on that the difference in performance by subjects in the
combined and split conditions should become greater and that this will carry on into
the tests where subjects do not read the materials. That is, the superior
performances on the combined materials should become more pronounced over
time.
Method
Subjects
Twenty-nine boys from Year 9 who study geography at a high school in Sydney
took part in this study. The range in reading ability amongst these students is in the
good performance level. The students ranged in age from 14.1 years to 15.3 years

Experiment 7 122
(mean age 14.7 years) and were of mixed ability in geography.
Desi&n
As for Experiment 6 there were two lots of material both with split and combined
formats which were fully counterbalanced across subjects. There were three
learning and test sessions one week apart and then three delayed test sessions one
week apart starting one week after the third learning and test session (i.e there were
six trials in all). That is, the subjects read the material and did the associated
multiple choice and true/false items, repeated this procedure one week later and
then a week after that, and then did the multiple-choice and true/false items without
reading the material a week after that and repeated this on two further trials also
held one week apart. Each subject viewed a split attention condition in which the
labels for the illustration were presented in a legend below the illustration and a
compound attention condition in which the labels were given in the illustration.
Two lots of material of similar difficulty were used and the combinations of these
two materials with the two attention conditions were fully counterbalanced across
subjects. That is, fifteen subjects received Materials 1 under the split attention
condition and Materials 2 under the combined attention condition and the other
fourteen subjects received Materials 2 under the split attention condition and
Materials 1 under the combined attention condition. Within these two groupings
seven subjects viewed combined Material 1 then split Material 2, seven others
viewed split Material 2 then combined Material 1, another eight viewed split
Material 1 then combined Material 2 and eight subjects viewed combined Material 2
then split Material 1.
The design was a repeated measures design which allowed the comparison of split
and combined conditions within subjects. The dependent measure was
performance on forty multiple-choice items and twenty true/false items in which

Experiment 7 123
twenty multiple choice items and ten true/false items each referred to the content
presented by each of the two materials.
Mat;erials
One technical illustration used was modified from a geography textbook ,by
Underwood (1988, p. 60) and the other constructed by the author. The split
condition illustrations were designed so that the diagram itself had little meaning
without referring to the associated descriptors below it whilst the combined version
of each of the illustrations had all the descriptors within the illustration. The
illustrations and multiple choice and true/false items based on these reading
materials can be found in Appendix 13. Three experts in geography judged the
multiple choice and true/false items to be valid for the material to which they
referred. Each of the four reading materials and associated tests consisted of eight
quarto pages stapled together (i.e. there were four lots of eight pages stapled
together). The content presented to students was preceded by the instructions
followed by a blank page. The instructions for the test items followed and there
was a blank page prior to the test items. The blank pages ensured that students
could not preview material. Text in the illustrations was prepared using Apple
Macintosh "Times" 10 point typestyle and text in the tests was Apple Macintosh
"Times" 12 point typestyle.
Proce<inre.
There was one geography class in Year 9 at the school. The Experiment was
conducted over six weeks with each trial one week apart. Approximately half of
one teaching period of 50 minutes was used for each trial.· On entering the
geography room and being seated the students were told for the first learning and
test session by the experimenter: "We will be doing two geography reading
comprehension exercises today and there will be a test to do at the end of the

Experiment 7 124
reading time for each of the two materials based upon that material. During this
period don't talk or look at other people's materials. Follow all instructions. You
will now receive two answer sheets which require you to print your name on them.
There is also a space to fill in the number of the material you are answering on that
sheet. You will learn that number when you receive the reading materials. You are
to record your answers to the twenty multiple choice items and ten true/false items
for each reading material on these sheets." The answer sheets were then
distributed. Students were then told: "As your name is called come and collect the
two reading materials and return to your desk. Leave the materials flat on the desk
in the order that you receive them. You may read the instructions on the first page
whilst the materials are being distributed. Those instructions will then be read
aloud and everyone will have three minutes to study the material on page three.
After that we will all tum to page four for the instructions for the test to be read and
then turn to page 6 to start the test when told to do so. We will follow the same
procedure for the second reading material and test II Appropriate reading materials
for each student were distributed.
Once the appropriate materials were distributed to each student in the class the
instructions on the front were read aloud by the experimenter:
"1. When instructed to do so, tum the first page and the blank page to page 3 of
this paper. Carefully read the material. You will be given three minutes
reading time.
2. You should re-read the material if you have any spare time.
3. You are only to read this material and you are not permitted to have any writing
or other implement (ruler, calculator, etc.) in your hand during the reading
time.
4. At the end of the reading time you will be doing a multiple choice test and a
true/false test based upon the material you have read. 11

Experiment 7 125
The students were then told "commence reading". At the end of the three minutes
reading time (previous experience had indicated that this was sufficient), the
students were told to cease reading and to turn to page 4 and the instructions on that
page were read aloud:
" 1. When instructed to do so turn this page and the blank page to page 6 to
questions for this test and answer the 20 questions in the multiple choice test
and the 10 true/false items These items are based upon the material which you
have just read. You will be given sufficient time to complete all questions
(approximately 10 minutes).
2. On the Answer Sheet provided fill in the circle around the letter corresponding
to the most correct alternative for the multiple choice test and write true or false
in the space provided on the Answer sheet for the true/false items.
3. You may nm refer back to the reading material when you are doing the test.
4. Do not mark the pages in this question sheet in any way."
The experimenter then informed students that :
"I will ensure that everyone has sufficient time to complete all the questions. You
may start the test now." Once all students had completed all twenty multiple choice
items and the ten true/false items the experimenter instructed them, "Put your pens
down and close up the test. All tests and Answer Sheets will now be collected".
For the second and third learning and test sessions the students were told "We will
be redoing the reading test from the other day reading the same materials and doing
the same tests to see how much more you may now remember." A similar
procedure was followed to distribute the answer sheets and reading and test
materials as was used in the first trial. For the fourth, fifth and sixth trials where
the subjects did not read the materials but did the tests they were told: "You will be

Experiment 7 126
doing the same tests as the other day, only this time you will not be reading the
materials first. Do your best from memory." Answer sheets and tests for the two
materials were then distributed in each of these memory trials and the instructions
for the tests read aloud in a similar manner to the test done in the first three learning
and test sessions.
Results and discussion
Performance on the thirty items based on the information in the reading materials
can be seen in Figure 14. Table 14 shows the means and standard deviations of
those results (the proportions correct data for students can be found in Appendix
14). The data show clearly an advantage of combined over split presentation
formats with the difference being highly significant [F(l,28)= 21.68, p<.01].
Observation of the means in Table 14 suggests that there was an increase in
advantage for the combined condition as learning continued with decreased
advantage over the delayed or memory trials. A reliable test of this kind would be
detected by a significant quadratic or linear trend. The linear trend analysis
approached but did not reach significance [F(l,28)= 2.24, p>.05]. The quadratic
trend in the data was highly significant [F(l,28)= 11.80, p<.01]. Observation of
the data also suggests that for the combined format improvement in performance
was more dramatic and the decline in performance, once the learning trials cease,
was more rapid. With the split condition the learning sessions do not show as great
an improvement and once the learning trials cease, the drop off in performance is
slower. Therefore one might expect an interaction with the quadratic trend with
attention and this approached but did not reach statistical significance [F(l,28)=
2.99, .1> p >.05].

Experiment7 127
Figure 14: Percentage correct for each of the six trials for subjects
on questions referring to combined and split conditions
70
60 ~ C...,1,ille4 ------0
0 ~ 50 0
0
96 .-------- -.- ...A comet ~lit -·-•
40
30
o Trial 1 Trial2 Trial3 Trial4 Trials Trial6
Table 14: Proportions correct means and standard deviations for six
trials in Experiment 7
Learning trials Memory trials
1 2 3 4 5 6
Mean S.D. Mean S.D. Mean S.D. Mean S.D. Mean S.D. Mean S.D.
Combined 50.2 15.4 52.5 173 59.5 14.2 56.1 15.9 51.7 15.8 53.3 16.0
Split 42.8 10.6 443 103 48.4 13.3 47.0 12.5 44.9 11.2 47.4 13.7
- - - - - -%difference 7.4 8.2 10.9 9.1 6.8 5.9

Experiment 7 128
The comparison of the combined and the split formats supports the suggested
advantage for the former obtained in the previous experiment. The data suggest
that there is a slight improvement over learning trials but that any improvement is
wiped out faster over memory trials. The advantage for the combined condition did
not reliably increase over the three learning trials although there was a trend in this
direction. The compounding of the advantage of combined conditions over
learning trials remains unresolved and this suggests that further examination is
needed.
Before leaving this study an examination of the multiple choice items given to
students suggested that the items could be classified as either factual or inferential.
This classification indicated that it might be possible to examine the effects of split
attention on different types of items.
Split attention and tme of item
The multiple choice items were divided by four experts into those which could be
answered directly from the content (factual items) and those items which required
students to make some inference from the content to be able to correctly answer the
question (inferential items). For example, a factual item would require students to
recall the height of the mountain shown in Material 1 in Appendix 13, whereas an
inferential item would require students to classify human activities shown in the
diagram and to then determine which ones were or were not present from the
categories provided (such as primary industry, secondary industry, tertiary
industry, transport activities, urban activities and recreational activities). Overall,
28 items were classified as factual and 12 as inferential. The proportions correct
score for each student was calculated and then an analysis carried out on these
proportions. Performance under the split and combined conditions for each type of
item over trials can be observed in Figure 15 and excluding the trials factor in

Experiment 7 129
Figure 16.
Figure 15: Performances of students on factual versus inferential
questions over trials
60
50
40
X COD'e.ct 30
20
10
0 Trial 1 Trial 2
L e.anung trials Trial 3 Trial 4 Trial 5
Memory trials Trial 6

Experiment 7 130
Figure 16: Performances of students on factual versus inferential
questions
60
50
40
% correct 30
20
10
0 Combined
factual Split factual Combined
inferential Split inferential
Observation of Figures 15 and 16 shows the already reported advantage of the
combined presentation format over split format. There is a significant difference in
performance between factual and inferential items with higher levels of performance
on the factual items [F(l,28)=77.80, p<.05]. There is a suggestion in Figure 16
that the advantage for the combined format is greater on factual items than it is on
inferential items. However, analysis of the data failed to provide statistical support
in so far as the interaction of attention (combined and split) with types of items
(factual and inferential) failed to reach significance [F(l,28)=1.55, p>.05]. Neither
was there a threeway interaction involving attention by types of items by quadratic
trend [F(l ,28)=0.45, p>.05]. These results suggest that the advantage of the
combined presentation format over the split format may be independent of the
cognitive level of questions set. Based on the examination in this study there is no

Experiment 7 131
reason to suggest that splitting attention is more or less harmful when the material
to be learned is factual or needs more elaborate cognitive processing as the
inferential items required.

Experiment 8 132 •
Experiment 8
At this point in the studies there has been an observed advantage for the combined
presentation format over the split format in Experiment 6 and a reliable difference
favouring the combined format in the Experiment 7. The effect of splitting attention
was robust across factual and inferential questions in Experiment 7. There has also
been an indication in Experiment 7 that the advantage of the combined presentation
format may increase with further learning. This experiment was designed to
examine the effects of repeated learning trials on the advantage of combined over
split presentation formats for illustrations. There are in total six learning trials in
each of the combined and split conditions. Given the trend in Experiment 7 it is
anticipated that the combined format should show a significantly increasing
advantage with further learning.
Method
Suqjects
Fifty-two boys from Year 8 who study geography at a high school in Sydney took
part in this study. The range in reading ability amongst these students is in the
good performance level. The students ranged in age from 12.3 years to 15.1 years
(mean age 13.6 years) and were of mixed ability in geography.
Pesim
The combined and split attention conditions were varied between subjects with 26
students receiving a combined condition and the other 26 students a split condition.
Three lots of material of similar difficulty were used. The six trials were paired so
that one lot of material was learnt and responded to in the first two trials, a second
lot of material learnt and responded to in the third and fourth trials and a third lot of

Experiment 8 133
material learnt and responded to in the fifth and sixth trials. The three lots of
materials were fully counterbalanced across the three pairs of trials. The order in
which students received these materials is shown in Table 15.
A two way factorial design was used with attention conditions varied between
subjects and learning trials varied within subjects. The dependent measure was
performance on sixty multiple-choice items and thirty true/false items in which
twenty multiple choice items and ten true/false items each referred to the content
presented by each of the three materials each subject was given over the trials.

Experiment8 134
Table 15: Order of condition by material given to subjects
Numberof
students
5
5
4
4
4
4
5
5
4
4
4
4
Materials
Weeks 1 and2
Combined 1
Combined 1
Combined2
Combined2
Combined3
Combined3
Split 1
Split 1
Split 2
Split 2
Split 3
Split 3
Weeks3 and4 Weeks5 and6
Combined2 Combined3
Combined3 Combined2
Combined3 Combined 1
Combined 1 Combined3
Combined2 Combined 1
Combined 1 Combined2
Split2 Split 3
Split 3 Split 2
Split 3 Split 1
Split 1 Split 3
Split 1 Split 2
Split2 Split 1
The two lots of reading materials and associated multiple choice and true/false items
used in Experiment 7 were used in this study and a third lot of material and
associated multiple choice and true/false items of similar difficulty constructed. The
reading materials and associated multiple choice items and true false items used in
this Experiment can be viewed in Appendix 13. As with previous experiments, the
content presented to students was preceded by the instructions followed by a blank
page. The instructions for the test items followed and there was a blank page prior

Experiment 8 135
to the test items. The blank pages ensured that students could not preview material.
Procedure.
There were two geography classes in Year 8 at the school. The Experiment was
conducted over six weeks with each trial one week apart. Approximately half of
one teaching period of 50 minutes was used for each trial. Upon entering the
geography room and being seated the students were told for the first learning and
test session: 'We will be doing a geography reading comprehension exercise today
and there will be some multiple choice and true/false items to do at the end of the
reading time based upon the material. There is to be no interaction with other
students and you are to follow all instructions. You will now receive an answer
sheet to record all of your answers to the items on. Please print your name clearly
in the space provided on the answer sheet. There is also a space to fill in the
number of the material you are answering on that sheet. You will learn that number
when you receive the reading materials. 11 The answer sheets were then distributed.
Students were then told: "As your name is called come and collect the reading
material and return to your desk. Leave the material flat on the desk. You may
read the instructions on the first page whilst the materials are being distributed.
Those instructions will then be read aloud and everyone will have two minutes to
study the material on page three. After that we will all turn to page four for the
instructions for the test to be read and then turn to page six to start the test when
told to do so." Appropriate reading material for each student were distributed.
Once the appropriate tests were distributed to each student in the class the
instructions on the front were read aloud by the experimenter:
11 1. When instructed to do so, turn the first page and the blank page to page 3 of
this paper. Carefully read the material. You will be given three minutes
reading time.
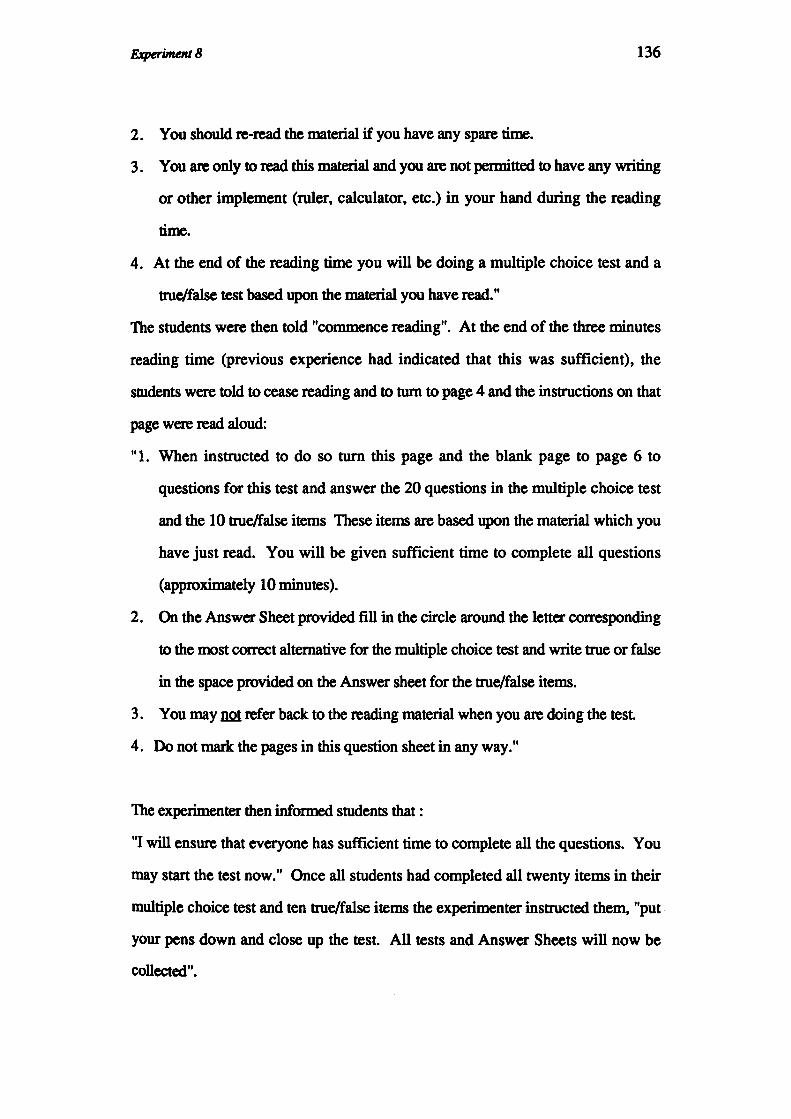
Experiment 8 136
2. You should re-read the material if you have any spare time.
3. You are only to read this material and you are not permitted to have any writing
or other implement (ruler, calculator, etc.) in your hand during the reading
time.
4. At the end of the reading time you will be doing a multiple choice test and a
true/false test based upon the material you have read."
The students were then told "commence reading". At the end of the three minutes
reading time (previous experience had indicated that this was sufficient), the
students were told to cease reading and to turn to page 4 and the instructions on that
page were read aloud:
"1. When instructed to do so tum this page and the blank page to page 6 to
questions for this test and answer the 20 questions in the multiple choice test
and the 10 true/false items These items are based upon the material which you
have just read. You will be given sufficient time to complete all questions
(approximately 10 minutes).
2. On the Answer Sheet provided fill in the circle around the letter corresponding
to the most correct alternative for the multiple choice test and write true or false
in the space provided on the Answer sheet for the true/false items.
3. You may DQ1 refer back to the reading material when you are doing the test
4. Do not mark the pages in this question sheet in any way."
The experimenter then infotmed students that :
"I will ensure that everyone has sufficient time to complete all the questions. You
may start the test now." Once all students had completed all twenty items in their
multiple choice test and ten true/false items the experimenter instructed them, "put
your pens down and close up the test. All tests and Answer Sheets will now be
collected".

Experiment 8 137
A similar procedure was followed in the subsequent trials to distribute the materials
and do the multiple choice and true/false items as was used in the first trial.
Results and discussion
There was again a substantial and reliable advantage for the illustrations drawn in
the combined format over those presented in a split format [F(l,50)= 8.01, p<.01].
The advantage for the combined over split conditions is shown in Figure 17. The
means and standard deviations for the two conditions by six trials is shown in
Table 16 and the proportions correct data for students can be found in Appendix
15. The data in this table do not demonstrate either an overall consistent
improvement in trials (this is not completely surprising as three different materials
were used with each subject), and there is no indication of the advantage for the
combined condition increasing over trials. A test of linear trend over trials failed to
reach significance [F(l,50)= 0.48, p>.05] and there was no interaction of this
trend with the format [F(l,50)= 0.00, p>.05]. The results failed to offer any
support for the trend observed in the Experiment 7 of an advantage for the
combined condition increasing with further learning.

Experiment 8 138
Figure 17: Percentage correct for each of the six trials for subjects
on questions referring to combined and split conditions
70
60 .~ 96 50 o_____..-0
comet
40
30
0 Trtal 1 TrtaJ.2 Trlal3 Trlal4 TrtaJ.5 Trlal6
Table 16: Proportions correct means and standard deviations for the
six trials in Experiment 8
Trial
1 2 3 4 5 6
Mean S.D. Meat S.D. Mean S.D. Meat S.D. Meat S.D. Mean S.D.
Combined 56.0 15.2 61.8 15.0 59.9 12.9 67.2 13.7 56.0 13.3 60.5 15.1
Split 49.9 13.7 53.S 13.1 50.6 15.9 57.8 15.2 48.1 13.7 53.9 16.3
% Difference 6.1 8.3 .9.3 9.4 7.9 6.6

Experiment 8 139
Split attention and type of item
As previously detailed Materials 1 and 2 were the same as those used in Experiment
7 and 28 multiple choice items were classified as factual and 12 as inferential.
Material 3 had insufficient inferential items to permit this division and so the
proportions correct score for each student was calculated for Materials 1 and 2 and
then an analysis carried out on these proportions. Performance under the split and
combined conditions for each type of item can be seen in Figure 18.
Figure 18: Performances of students on factual versus inferential
questions
50
40
% correct 30
20
10
0
Combined factual
Split factual Combined inferential
Split inferential
Observation of Figure 18 replicates the already reported advantage for the combined
presentation format over the split format and suggests that performance on the
factual items is superior to performance on the inferential items. The comparison

Experiment 8 140
between factual and inferential items was highly significant favouring the factual
items [F(l,50)=9.03, p<.01]. In this study the observed advantage for the
combined format being greater on factual items than it is on inferential items is
supported by the analysis with a significant interaction between attention and type
of item [F(l,50)=4.43, p<.05]. This result suggests that the effect of split attention
increasing cognitive load was more pronounced on factual items than inferential
items. Given that there was an trend in the same direction in Experiment 7 and a
robust difference was detected here, this effect will be examined further in the next
study.

Experiment 9 141
Experiment 9
In Experiments 6, 7 and 8 as with Experiments 3, 4 and 5, a procedure was used
which presents each student with all conditions. This took advantage of the fact
that each individual's level of performance is fairly consistent. That is, a student
who is better or worse than other students under one learning condition is likely to
be better or worse under other similar learning conditions (Bassett, Watts &
Nurcombe, 1978; Tyler, 1965). For this reason, each student in these studies read
material, with appropriate controls, under each of the experimental conditions.
Different materials were fully counterbalanced so that conclusions could be drawn
for different treatments. Materials and conditions were intentionally confounded in
the designs as it was possible that, for example, the effects of one material under
one condition may have differed from the effects of another material under that
condition. With the repeated measures designs used it was not possible to discern
this. There are no a priori reasons to expect that any one combination of material
and conditions will give rise to unique performance. However, for completeness
any presence of a unique combination effect was examined in this Experiment by
varying the materials by conditions between subjects. Indeed Poulton (1975)
cautions against interpreting repeated measures designs without data from between
subjects designs. In response to this cautionary note and by way of completeness
the four combinations of two materials by combined and split attention conditions
were all varied between subjects. If the results of this Experiment replicate the
advantage for combined over the split presentations obtained in Experiments 6, 7
and 8 then one can conclude with some confidence that the combined condition is
superior to the split

Experiment 9
Method
Subjects
142
One hundred boys from Years 10, 11 and 12 who study geography at a high school
in Sydney took part in this study. The range in reading ability amongst these
students is in the good performance level. The students ranged in age from 15.1
years to 19.5 years (mean age 16.9 years) and were of mixed ability in geography
(i.e. the classes they were in were not streamed with more able or less able students
in them based upon their past performances in geography). Four groups of twenty
five students each were selected on the basis of their geography test results from the
mid year assessment and assigned so that each group was of equal ability. The
resulting mean scores for each group were 63.4, 66.8, 67 .1 and 64.2 and not
surprisingly an analysis of variance indicated these small differences were not
significant [F(3,96)=0.40, p>.05]. There were ten Year 12 students, eight Year 11
and seven Year 10 students in Groups 1, 2 and 3 and in Group 4 there were eleven
Year 12 students, eight Year 11 and six Year 10 students.
Desip
One of each of the four groups of subjects viewed one of the four combinations of
materials by conditions. The design was a two way classification which allowed
the comparison of split and combined conditions between groups and the
comparison between materials. The materials were the same as those used in
Experiment 7 - the main difference in experimental design being that conditions are
now varied between four groups, not within subjects as was done in Experiments
3, 4, 5, 6, 7 and 8. Again two viewing conditions used the combined and split
presentations with two sets of materials. This allowed the examination of the
effects of presenting the same information in a technical illustration two different
ways - combined and split. As two different materials were used for each
condition (combined and split) any differences in the difficulty of the reading

Experiment 9 143
materials could also be examined. Post learning performance was measured on
two sets of multiple choice and true/false items based on the two materials.
Materials
Comprehension of information was examined under four presentation conditions:
Group 1 had an illustration with the labelling within the diagram.
Group 2 had the same illustration as Group 1 but the labelling was in a key
beneath the diagram.
Group 3 had a similar illustration to Group 1 and the labelling was also within the
diagram.
Group 4 had the same illustration as Group 3 but the labelling was in a key
beneath the diagram.
The two illustrations and associated multiple choice and true/false items used in the
conditions were used in Experiment 7 and can be found in Appendix 13. The
reading materials and associated tests consisted of eight quarto pages stapled
together. The content presented to students was preceded by the instructions
followed by a blank page. The instructions for the test items followed and there
was a blank page prior to the test items. The blank pages ensured that students
could not preview material. Text in the illustrations was prepared using Apple
Macintosh "Times" 10 point typestyle and text in the tests was Apple Macintosh
"Times" 12 point typestyle.
Procedure
The Experiment was conducted with each of the classes in Years 10, 11 and 12.
Approximately half of one teaching period of 50 minutes was used. On entering
the geography room and being seated the students were told: "We will be doing a
geography reading comprehension exercise today and there will be multiple choice

Experiment 9 144
and true/false items to do at the end of the reading time based upon the material you
are about to read. During this period don't talk or look at other people's materials.
Follow all instructions. The reading material will be placed flat on the desk in front
of you. Leave it in that position until you are told to open it up. You may read the
instructions on the first page whilst the materials are being distributed."
Appropriate reading materials for each student were then distributed along with an
answer sheet for students to record their answers to the twenty multiple choice
items and ten true/false items.
Once the appropriate reading material was distributed to each student in the class the
instructions on the front were read aloud by the experimenter:
"1. When instructed to do so, turn the first page and the blank page to page 3 of
this paper. Carefully read the material. You will be given three minutes
reading time.
2. You should re-read the material if you have any spare time.
3. You are only to read this material and you are not permitted to have any
writing or other implement (ruler, calculator, etc.) in your hand during the
reading time.
4. At the end of the reading time you will be doing a multiple choice test and a
true/false test based upon the material you have read."
The students were then told "commence reading". At the end of the three minutes
reading time (previous experience had indicated that this was sufficient), the
students were told to cease reading and to turn to page 4 and the instructions on that
page were read aloud:
"l. When instructed to do so tum this page and the blank page to page 6 to
questions for this test and answer the 20 questions in the multiple choice test
and the 10 true/false items These items are based upon the material which you
have just read. You will be given sufficient time to complete all questions

Experiment 9 145
(approximately 10 minutes).
2. On the Answer Sheet provided till in the circle around the letter corresponding
to the most correct alternative for the multiple choice test and write true or false
in the space provided on the Answer sheet for the true/false items.
3. You may DQt refer back to the reading material when you are doing the test
4. Do not mark the pages in this question sheet in any way."
The experimenter then infonned students that :
"I will ensure that everyone has sufficient time to complete all the questions. You
may start the test now." Once all students had completed all twenty items in their
multiple choice test and ten true/false items the experimenter instructed them, "put
your pens down and close up the test. All tests and Answer Sheets will now be
collected II•
Results and discussion
Performance on the thirty items based on the information in the reading materials
can be seen in Figure 19 (Table 17 shows the means and standard deviations of
those results). The proportions correct data for students may be found in Appendix
16. The most obvious result from viewing the data is that performance was
superior when attention is not split between multiple sources of information. The
comparison between the combined attention condition and split attention condition
was highly significant [F(l,96)=19.88, p<.01] and supported the observation that
the former was superior. This result confirmed the presence of an advantage for
the combining of descriptors and illustration. There was no interaction between
materials and conditions [F(l,96)=0.04, p>.05] which argued against any possible
effects of confounding these two in the previous studies. There was a significant
difference between the materials indicating that Material A was more difficult than

Experiment 9 146
Material B [F(l,96)=11.04, p<.01]. However, this is only of passing interest as in
this and all previous designs the materials were fully counterbalanced.
Figure 19: Percentage correct for each of the four groups of
subjects on questions referring to combined and split
conditions for the two materials
70
60
% 50 correct
40
30
0 Group 1
Material A Combined
Group 2 Material A
Split
Group 3 Material B Combined
Group 4 Material B
Split

Experiment 9 147
Table 17: Proportions correct means and standard deviations for
multiple choice and true/false items in Experiment 9
Combined Split
Mean Standard Mean Standard
Material Deviation Deviation Average
A 64.7 10.9 53.7 9.7 59.2
B 56.4 15.7 46.4 9.6 51.4
Average 60.6 50.1
Split attention and tme of item
As previously noted the materials had 28 multiple choice items classified as factual
and 12 as inferential. The proportions correct score for each student was calculated
and then an analysis carried out on these proportions. Performance under the split
and combined conditions for each type of item over trials can be seen in Figure 20.

Experiment 9 148
Figure 20: Comparison of student performances factual and
inferential questions on materials
60
50
40
% correct 30
20
10
0
Combined factual
Split factual Combined inferential
Split inferential
Observation of Figure 20 shows a clear advantage between the combined
presentation format over the split format which has already been reported. The
superior performance on the factual questions over the inferential questions
observed in the figure reached statistical significance [F(l,98)=5.75, p<.05]. This
advantage for the factual items has been reliable in all three studies examining item
type. There is a suggestion in Figure 20 that the advantage for the combined format
is greater on factual items than it is on inferential items but the interaction of
attention (combined and split) with types of items (factual and inferential) did not
approach significance in this case [F(l,98)=0.65, p>.05]. In all three studies
examining item type there has been an observed trend for the difference in
performance on the factual items to be greater than on the inferential items and in
the case of Experiment 8 this interaction was statistically significant. This result

Experiment 9 149
might suggest that in future research a more controlled a priori examination of this
question is in order.

Geural Discussion of Experiments 6 to 9 150
General Discussion Experiments 6 to 9
The results of these experiments confirm that technical material consisting of
mutually referring, disparate sources of information that cannot be understood in
isolation should be integrated into a unitary entity. Splitting attention between an
illustration and its key appears to have inhibited integration due to the increased
cognitive load. To make sense of the descriptors adjacent to an illustration a
heavier cognitive load is imposed as a series of continuous mental integrations need
to be made leaving fewer cognitive resources available for learning. Using a
single, integrated source of information, it was found both memory of individual
elements and the ability to make inferences beyond those elements to be facilitated
compared to the frequently used structures that incorporate distinct sources of
information. The reduced cognitive load imposed by having unified source of
information freed cognitive resources and facilitated performance. This was
demonstrated in experiments of both within and between subjects designs. These
results were obtained despite the fact that both the split-source and integrated
materials were identical in information content. Only the format varied and other
than from the theoretical perspective, that variation was trivial.
The attempts to obtain increases in the advantage for the combined format with
reinforcement failed to demonstrate any reliable result. This does not rule out the
possibility that using the combined presentation format leads to increases over a
lengthy period of learning but it does indicate that more than six learning trials are
needed. A further examination of this would require a teaching programme for at
least a full term or perhaps a year in which materials were used with two different
groups where one group received technical illustrations presented as a unified entity
and the other presented with illustrations in the more conventional split format.
However, even with such efforts to rewrite materials and modify teaching strategies

General Discussion of Experiments 6 to 9 151
in the light of the findings reported here, it appears unlikely that such an increasing
advantage for the combined over the split presentation format would be found.
Conventional formats used to present many technical illustrations are not based
upon theoretical considerations and until recently theories made no predictions
concerning ideal formats. Descriptors are commonly used in technical illustrations
with the intended function of aiding comprehension of the illustration. However,
these studies provide evidence that infonnation·presented in this split way may have
unintended consequences whereby cognitive resources are tied up in integrating
multiple sources of information. This suggests that where possible descriptors for
an illustration should be contained within the illustration itself and not presented
adjacent to it as is often done in textbooks and in other situations. As a result of
providing a unified source of information more attention should be given to
comprehending the illustration instead of firstly attending to mentally integrating
multiple sources of information and then attempting to comprehend the content of
this information.
The findings buttress the cognitive theories used to generate the experiments in this
section of the thesis. It was suggested that students learning new material must
acquire schemas. A split-source format requires students to engage in mentally
integrating the disparate sources of information which is an activity that is
irrelevant to schema acquisition and imposes a heavy cognitive load. The finding
that students perform at a higher level when presented with integrated materials
provides a degree of validation to the relevant theories.
The findings also indicate the extent to which cognitive theories can be used to
throw light on instructional procedures. Most procedures used today were
designed before suitable cognitive theories became available. The advent of new

General Discussion of Experiments 6 to 9 152
theories may make some current practices obsolescent. The results indicate one
such set of circumstances.
All four experiments in this section of the thesis were designed as part of normal
classroom procedures. As a consequence, direct implications for instructional
procedures flow clearly from the results. Wherever possible, diagrams and text
should be physically integrated. While integration may not always be possible,
based on the results, it normally should be beneficial. Modification to instructional
procedures and texts in accordance with the cognitive theory outlined and empirical
findings reported could dramatically facilitate learning and increase levels of
competence. Considerable advantages could accrue to both students and teachers
by the use of integrated materials.

General conclusion 153
GENERAL CONCLUSION
The influence of technical illustrations upon student comprehension in geography
has been examined under a number of conditions in the nine experiments. The first
section of this thesis commenced with a study of the effects of technical illustrations
upon the comprehension and recall of expository text. This question was
addressed further in Experiment 2. Previous research on the effects of illustrations
upon the comprehension of text has produced conflicting findings. A number of
studies had found no benefit to the comprehension of text by having accompanying
illustrations (e.g. Donald, 1983; Koenke, 1968, Peeck, 1974; Vernon 1950, 1953,
1954), while other studies have reported benefits (e.g. Hayes & Readence, 1982,
1983; Reid et. al., 1983; Reinking et al., 1988; Tajika et al., 1988). However, as
previously noted, the relationship between the illustrations and text has not been
described in detail in these studies and as a consequence it is not clear as to whether
or not the presence of illustrations improved the comprehension of text. The first
two experiments reported here systematically examined conditions in which text
was presented with a related illustration where there was either no repetition of the
content of the illustration in the text or the same content was presented in text and
illustration. Where there was no repetition of content between the text and an
illustration, the presence of an illustration did not improve the comprehension and
recall of text.
Content presented in both text and illustration in the first study resulted in superior
performance to presentation in text only or illustration only. This was an
interesting result and raised the question of whether repetition of content in two
forms (text and illustration) would be superior to single form repetition as either
text repeated or illustration repeated. In her review of the literature on the use of
illustrations to facilitate the comprehension of text, Schallert ( 1980) suggested that

General conclusion 154
illustrations may have positive effects when they provide a second access route to
the comprehension of content. That is, the provision of two access routes is likely
to be superior to simple repetition of information in one form such as text repeated.
This suggestion is consistent with Paivio's (1971, 1986) dual coding theory as
discussed in the introduction to the first section of this thesis. Specifically, dual
coding theory argues that memory and cognition are served by two independent but
interconnected codes - one specialized in dealing with nonverbal information and
the other with verbal information. The codes are activated directly by pictures and
words or indirectly by imagery and verbal encoding tasks. Representations in one
code can activate representations in the other. Paivio (1971, 1983, 1986) and
Paivio and Lambert (1981) have suggested that the interdependence of the codes
has additive effects on recall. That is, dual coding theory predicts superior
performance when information is presented in both illustration and text. Reliable
differences favouring the combined form of repetition (text and illustration) over
single form repetition (text repeated or illustration repeated) were found in all
studies testing for this (Experiments 2, 4 and 5). This is a robust and replicable
finding and it provides empirical evidence in support of Paivio's dual coding theory
within the very important paradigm of expository text and technical illustrations.
Technical illustrations were found to be superior to expository text in Experiments
2, 3, 4 and 5. Dual coding theory (Paivio 1971, 1986) predicts that this would be
the case as illustrations are likely to be encoded in the imaginal code and this is
superior in mnemonic value to the verbal code. Further, illustrations of spatial
information are more likely dually encoded in the imaginal and verbal stores in
memory (Paivio, 1986). This is especially the case with the illustrations used in
these studies which had word labels on the drawings. The word labels would be
encoded in the verbal code and images of those labels would most probably also be
encoded in the nonverbal store. The graphic parts of the illustrations would be

General conclusion 155
predominantly stored in the nonverbal code and could also initiate encoding in the
verbal store (Paivio, 1986; Paivio & Casapo, 1973; Paivio & Lambert, 1981). As
Paivio (1971, 1983, 1986) and Paivio and Lambert (1981) argue, coding in both
stores has additive effects and therefore one would expect that illustrations of the
type used in the studies reported in this thesis would be superior to text of the same
content. This is especially the case as interactions between the two stores with the
type of illustrations used in these studies could be expected. Such interactions
between the two codes improves comprehension and recall (Paivio 1971_, 1986).
Logie and Baddeley (1987) also argue that illustrations would be encoded in the
visuospatial scratchpad (a nonverbal store) and that sub-vocalization of the content
of the illustration may well be encoded in the articulatory loop (a verbal store).
Further theoretical support for illustrations of the kind used in these studies being
superior to text is given when one conceives of interacting verbal and nonverbal
codes causing greater depth of processing (Craik & Lockhart, 1972) and greater
breadth of processing (Craik & Tulving, 1975). The empirical finding that
technical illustrations of spatial content are superior to expository text of the same
content in this thesis provides further evidence for the viability of Paivio's (1971,
1986) dual coding theory.
The second section of this thesis reported the investigations undertaken on
cognitive load theory (Sweller, 1988, 1989). The results of those four studies
clearly indicated that presenting information in an illustration which did not split
attention between the illustration and its descriptors led to superior performance
compared to the situation where attention was split between the two sources of
information. Splitting attention between mutually referring disparate sources of
information appears to inhibit integration of the information as cognitive load is
increased (Sweller 1988, 1989). A series of continuous mental integrations need to
be made to comprehend the information and this process leaves fewer cognitive

General conclusion 156
resources available for learning. Conversely, when descriptors for illustrations
were contained within the diagram mental integration of the information was more
complete and a lighter cognitive load was imposed. Performance was improved as
cognitive resources were freed up by the unified presentation format. This finding
was demonstrated in experiments of both within and between subjects designs and
suggests that cognitive load is reduced and schema acquisition consequently
improved when information is presented as a unified entity and attention is not split
between sources of mutually referring information.
Implications for instruction
The three main findings of the first section of this thesis extend our knowledge of
conditions under which technical illustrations can have positive effects upon
comprehension. Firstly, where there is no overlap in the content of text and a
related illustration, no benefit to the comprehension of the text can be expected.
That is, technical illustrations present information in their own right and are not
mere adjuncts to text. This suggests that at least as much care should be taken in
the preparation of illustrations as is taken with text. The importance of this care
becomes even clearer in light of the second finding that technical illustrations
depicting spatial information were superior to text of the same content. illustrations
were found to have superior mnemonic value to text of the same content. In
technical subjects like geography where information is often conveyed in
illustration, this suggests that greater use of technical illustrations will improve
learning. It is recognimi that there are practical limits to the amount of information
which can be presented in illustrations as much information is more easily
presented in text than illustration. However, where there is a choice between
presenting technical spatial content as text or as illustration then the latter should be
used.

General conclusion 157
The third major finding of the first section of this thesis that, where possible,
important content should be repeated in two forms (text and illustration) has a
number of significant instructional implications. It suggests that authors and
educators need to identify what key information is to be conveyed and determine if
this information lends itself to be presented in both text and illustration. Again,
while there are practical limits to the amount of information that can be presented in
this way (for example, the size of some textbooks may almost double), the benefits
to comprehension and recall clearly warrant using this dual presentation format
selectively. Where it is possible to present important information as both text and
illustration this will result in superior comprehension and recall.
The main finding of the second section of this thesis was that technical material
which consists of two or more sources of information which need to be mentally
integrated prior to learning should, where possible, be presented as a unified entity.
In particular, technical illustrations with descriptors contained within the diagram
were found to be superior to information presented in a split format as cognitive
load appears to have been reduced and more cognitive resources freed up for
learning. This suggests that where possible instructional formats should be revised
to reduce cognitive load and facilitate learning.
Further research
A number of areas for future research are indicated. Schallert ( 1980) suggested
some of the characteristics of illustrations which would lead to better
comprehension of text. These were that illustrations should represent spatial
information or information relevant to the total message of the text, and/or they
should provide a framework for certain information to be derived from the

General conclusion 158
illustrations as well as the text. The present studies have indicated that more
research in this area is needed. In particular, replication of superiority of technical
illustrations in a variety of subject areas such as science, history and economics is
desirable. Certainly, the types of materials which best lend themselves to be
presented as illustration rather than as text needs to be delineated. The way in
which authors, publishers and educators use illustrations and the process by which
it is decided what to illustrate are interesting areas for future investigations. The
effects upon comprehension and recall of other types of illustrations such as flow
charts, graphs and photographs warrant future research. Examining views of the
reading audience on presentation formats could also prove to be an interesting area
for further research.
The importance of repetition of text content in illustrations has been demonstrated
in the studies reported in this thesis. The studies reported in this thesis have
examined the two extremes of overlap and have clearly indicated that a 0% overlap
does not improve comprehension whereas there is a robust and reliable
improvement when the degree of overlap is 100% (that is, the illustration and text
have the same content). The question of what degree of overlap between text and
illustration leads to superior comprehension and recall needs to be addressed.
Perhaps an even more important question is what type of content is best
overlapped? In the studies reported in this thesis spatial information was found to
be recalled and comprehended better when repeated in two forms. Other types of
content which do not depict spatial information and can be repeated in text and
illustration need to be investigated.
Repetition of content in printed media only has been examined in this thesis. While
much instruction relies on printed media, very important questions arise as to what
other types of media lend themselves to repetition, and if any particular
combinations of these superior to repetition in the printed media. For example, is

General conclusion 159
repetition of the content on a computer screen in audio form superior to repetition in
one form (such as viewing the screen twice), and is there any particular form of
repetition superior to others (for example, is repetition of content in a video and text
superior to repetition of content in slides and an oral presentation). Further to this,
if superior forms of repetition for important content are found, questions arise such
as is repetition in three forms (or more) such as printed illustration, text and video
superior to repetition in two forms? In an even broade~ field, questions arise as to
which forms of repetition may be best for people of various backgrounds. For
example, are printed media superior for say professional people who are used to
reading more than perhaps other groups, and a combination of visual and auditory
media superior for some other groups? Are there particular biases in this regard as
a result of variables such as culture, educational background and socio-economic
status? While the main area of interest of the findings reported in this thesis has
been in education, it seems likely that other areas such as the advertising and
entertainment industries may find these results and those of future research in this
area of considerable interest
While repetition of content in expository text and technical illustrations improved
comprehension and recall, it is clear from the empirical research reported in this
thesis that information presented in a unified source is superior to presenting it
where attention was split between disparate sources of information. In terms of
textbook design and other teaching materials it is desirable to present content,
where possible, so that mental integration of several sources of information is
avoided. This has significant implications in terms of repetition of content in
different forms. For example, when important content was repeated as text and
illustration in the first section of this thesis it was presented on one page with one
fonn under the other. Given the findings of the section of this thesis dealing with

General conclusion 160
schema theory and cognitive load theory, it appears that an even better method of
presenting information in two forms may be to present an illustration with related
text on it ( that is, the two forms of presenting the information are a unified entity
rather than provided as two separate sources of information). Examining how
different instructional materials could be presented as a unified entity could prove to
be very profitable direction of future research in this area.
Possible differences between sexes and different socio-economic groups should
also be examined, but perhaps one of the most important areas of future research
involves the important educational question of longitudinal studies. While any
detailed longitudinal work is beyond the scope of this thesis, the long term
educational consequences of the various advantages reported are of great interest to
educators. Over the short term there were no robust increases. However, it is quite
possible that the advantages reported would be maintained and increased if the
procedures were used in the classroom over a long period of time. That is, the
adoption, where possible, of the advantageous presentations of (i) using technical
illustrations of spatial content instead of expository text, (ii) repeating important
content in two forms (text and illustration), and (iii) presenting technical material in
a combined format only which does not split attention between multiple sources of
information, may all lead to a substantial improvement in performance if used over
a lengthy period of instruction such as a year. This could be tested, for example,
with the split attention material where over a year's instruction one group of
students received all illustrations as a unified entity and another group following the
same course received conventionally formatted technical material. There is the
potential for longitudinal studies to be a most productive area of future research
with very significant benefits for educators and students.

References 161
REFERENCES
Anderson, J. R. (1978). Arguments concerning representations for mental
imagery. Psycholopcal Review,~ 249-277.
Anderson, J. R. (1980). Coanitive psycholo~ and its implications. San
Francisco: W. H. Freeman.
Anderson, J. R. (1983). The architecture of co&nition. Cambridge, MA: Harvard
University Press.
Anderson, J. R., & Bower, G. H. (1973). Human associative memory.
Washington, DC: Winston.
Anderson, R. C., Reynolds, R. E., Schallert, D. L., & Goetz, E. T. (1977).
Frameworks for comprehending discourse. American Educational Research
Joumal. li, 367-382.
Arnold, D. E., & Brooks, P. H. (1976). Influences of contextual organizing
material on children's listening comprehension. Journal of Educational
Psycholo~ . .68,. 711-716.
Baddeley, A. D. (1978). The trouble with levels: A reexamination of Craik and
Lockhart's framework for memory research. Psycholoaical Review, .ll,
139-152.
Baddeley, A. D. (1981). The concept of working memory: A view of its current
state and probable future development. Cognition, .lil, 17-23.

References 162
Baddeley, A. D. (1988). Imagery and working memory. In M. Denis, J.
Engelcamp & J. T. E. Richardson (Eds.), Copitiye and neuro,psycholo&ical
ap,proaches to mental imam)' (pp. 169-180). Boston: Martinus Nijhof.
Baddeley, A. D. (1989). The uses of working memory. In P.R. Solomon, G.
R. Goethals, C. M. Kelley & B. R. Stephens (Eds.), Memory;
interdisciplinaty &Rproaches <pp. 107-123). New York: Springer-Verlag.
Baddeley, A. D., & Hitch, G. J. (1974). Working memory. In G. H. Bower
(Ed.). The psycholo&Y of Iearnin& and motivation (Vol. 8, pp. 47-89).
London: Academic Press.
Baddeley, A. D., & Hitch, G. J. (1977). Recency re-examined. In S. Dornic
(Ed.)~ Attention and performance (Vol. 6, pp. 647-667). Hillsdale, New
Jersey: Erlbaum.
Baggett, P. (1975). Memory for explicit and implicit information in picture
stories. Journal of Verbal Leamin& and Verbal Behayior. ,li, 538-548.
Bartlett, F. C. (1932). Rememberin&. Cambridge, England: Cambridge
University Press.
Bassett, G. W., Watts, B., Nurcombe, B. (1978). Individual differences;
Guidelines for educational practice. Sydney: George Allen & Unwin.
Beale, M., Bradbury, C., Chilton, H., Climie, D., & Cope, I. (1982). ~
prepancy book. Sydney: Bay Books.

References 163
Bieger, G. R., & Glock, M. D. (1986). Comprehending spatial and contextual
information in picture-text instructions. Journal of £3perimental Education.
,& 181-188.
Bloom, B. S., Engelhart, M. D., Furst, F. J., Hill, W. H., & Krathwohl, D. R.
(1956). Taxonomy of educational objectives; Cowi,tive domain. New York:
David McKay.
Bonnor, C. (1988). Australia in focus. Sydney: Jacaranda Press.
Bower, G. H. (1972). Mental imagery and associative learning. In L.W. Gregg
(Ed.), Comi,tion in leamin& and memory (pp. 51-88). New York: Wiley.
Brainerd, C. J. (1983). Working memory systems and cognitive development. In
c. J. Brainerd (Ed.), Recent advances in cowitive-developmental theory;
Pmmss in comi,tive development research. New York: Springer-Verlag.
Bransford, J. D., & Johnson, M. K. (1972). Contextual perquisites for
understanding: Some investigations of comprehension and recall. Journal of
Verbal Leamin& and Verbal Behavior. ll, 717-726.
Braun, C. (1969). Interest loading and modality effects on textual response
acquisition. Read.in& Research Ouarterly. ~. 428-444.
Brown, A. L. (1976). Semantic integration in children's reconstruction of
narrative sequences. Copitiye Psycholou . .B., 247-262.

References 164
Bugelski, B. R. (1970). Words and things and images. American Psycholo~st.
~. 1002-1012.
Carroll, J., & Carrithers, C. (1984). Blocking learner error states in a training
wheels system. Human Factors, 26, 377-389.
Chi, M., Glaser, R., & Rees, E. (1982). Expertise in problem solving. In R.
Sternberg (Ed.), Advances in the psycholo~ of human intelli&ence (pp. 7-
75). Hillsdale, New Jersey: Erlbaum.
Concannon, S. J. (1975). Illustrations in books for children: Review of research.
The Readin& Teacher, 22. 254-256.
Cooper, G., & Sweller, J. (1987). The effects of schema acquisition and rule
automation on mathematical problem-solving transfer. Journal of Educational
Psycholo~- 7.!l, 347-362.
Comoldi, C. (1976). Memoria e imma~nazione. Bologna: Patron.
Craik, F. I. M., & Lockhart, R. S. (1972). Levels of processing: A framework for
memory research. Journal of Verbal Learnin& and Verbal Behayior.11, 671-
684.
Craik, F. I. M., & Tulving, E. (1975). Depth of processing and the retention of
words in episodic memory. Journal of Experimental Psycholo~; General,
10!, 268-293.

References 165
Dean, R. S., & Enemoh, P. A. C. (1983). Pictorial organization in prose
learning. Contemponuy Educational Psycholo&Y . .8.. '11>-27.
Dean, R. S., & Kulhavy, R. W. (1981). The influence of spatial organization in
prose learning. Journal of Educational Psycholo&Y, ll, 57-64.
De Groot, A. (1966). Perception and memory versus thought: Some old ideas
and recent findings. In B. Kleinmuntz (Ed.), Problem solyin& (pp. 19-50).
New York: Wiley.
Denburg, S. D. (1976-77). The interaction of picture and print in reading
production (abstracted report). Read.in& Research Ouarterly. 12., 176-189.
Denis, M. (1979). Les imaees mentales [Mental images]. Paris: Presses
Universitaires de France.
Donald, D.R. (1983). The use and value of illustrations as contextual information
for readers at different progress and developmental levels. British Journal of
Educational Psycholo&Y, il, 175-185.
Duell, O.K. (1968). An analysis of prompting procedures for teaching a sight
vocabulary. American Educational Research Journal, .S.. 678-687.
Egan, D. E., & Schwartz, B. J. (1979). Chunking in recall of symbolic
drawings. Memory & Co&Qition.1, 149-158.
Ferguson, G. A. (1981). Statistical analysis in psycholo&Y and education (5th
ed.). Sydney: McGraw-Hill.

References 166
Franks, J. J., & Bransford, J. D. (1971). Abstraction of visual patterns. Journal
of Emeri,mental Psycholo&Y, 9.il. 65-74.
Gambrell, L.B., & Bales, R.J. (1986). Mental imagery and the comprehension
monitoring performance of fourth and fifth grade poor readers. Readin&
Research Ouarterly. 21, 454-464
Gibson, J. J. (1966). The senses considered as perceptual systems. Boston:
Houghton-Mifflin.
Gibson, J. J. (1979). The ecolo&ical iijlproach to visual perception. Boston:
Houghton-Mifflin.
Goldstein, R., & Underwood, G. (1981). The influence of pictures on the
derivation of meaning from children's reading materials. Journal of Research
in Readio&-~ 6-16.
Gombrich, E. (1972). The visual image. Scientific American. 221, 82-96.
Haring, M. J., & Fry, M. A. (1979). Effect of pictures on children's
comprehension of written text. Educational Communication and Technoloa
Journa,J,. 27., 185-190.
Harris, L. A. (1967). A study of the rate of acQPisition and retention of interest
loaded words by low socio-economic kinder&arten children. Unpublished
doctoral dissertation, University of Minnesota.

References 167
Harzem, P., Lee, I., & Miles, T. R. (1976). The effects of pictures on learning to
read. British Journal of Educational Psycholoey, ~ 318-322.
Hayes, D. A., & Readence, J.E. (1982). Effects of cued attention to illustrations
in texts. In J. A. Niles & L. A. Harris (Eds.), New ingyiries in readin&
research and instruction. New York: Rochester.
Hayes, D. A., & Readence, J.E. (1983). Transfer of learning from illustration
dependent text. Jomnal of Edycational Research. ~' 245-248.
Hebb, D. 0. (1980). Essay on mind. Hillsdale, New Jersey: Erlbaum.
Hinton, G. E., & Anderson, J. A. (Eds.) (1989). Parallel models of associative
memory. Hillsdale, New Jersey: Erlbaum.
Holliday, W. G. (1973). Critical analysis of pictorial research related to science
education. Science Edycation. SL 201-214.
Jeffries, R., Turner, A., Polson, P. G., & Atwood, M. E. (1981). The processes
involved in designing software. In J. R. Anderson (Ed.). Co&Qi,tiye skills and
their 3.CQYisition (pp. 255-283). Hillsdale, New Jersey: Erlbaum.
Johnson-Laird, P. N. (1983). Mental models. Cambridge, MA: Harvard
University Press.
Kahneman, D. (1973). Attention and effort. Englewood Cliffs, NJ: Prentice
Hall.

References 168
Kamin, L. J. (1968). Attention-like processes in classical conditioning. In M. R.
Jones (Ed.), Miami symposium on the prediction of behavior; Avenive
simulation (pp. 9-33). Miami: University of Miami Press.
Kamin, L. J. (1969). Selective association and conditioning. In N. J. Mackintosh
& F. w. K. Honig (Eds.), Fundamental issues in associative Iearnin&.
Halifax, Nova Scotia: Dalhousie University Press.
Katz, A. N. (1983). What does it mean to be a high imager? In J. C. Yuille
(Ed.), Ima&ery, memory and cowition; Essays in honor of Allan Paivio (pp.
39-63). Hillsdale, New Jersey: Erlbaum.
Kennedy, J. M. (1974). A psycholo&y of picture perception. Washington, D.C.:
Jossey-Bass.
Kieras, D. (1978). Beyond pictures and words: Alternative-information
processing models for imagery effects in verbal memory. Psycholo&ical
Bulletin, .8.5., 532-554.
Koenke, K. R. (1968). The roles of pictures \\and readability in comprehension of
the main idea of a parawu,h. Paper presented at the annual general meeting of
the American Educational Research Association, Chicago.
Koenke, K., & Otto, W. (1969). Contribution of pictures to children's
comprehension of the main idea in reading. Psycholo&y in the Schools . .6,
298-302.

References 169
Kolers, P.A. (1973). Some modes of representation. In P. Pliner, L. Krames &
T. Alloway (Eds.). Communication and affect; Lanwia&e and thou'1)t. New
York: Academic Press.
Kolers, P. A. (1978). On the representation of experience. In D. Gerver & W.
Sinaiko (Eds.), Lan&na&e interpretation and communication (pp. 245-258).
New York: Plenum Press.
Kolers, P.A., & Roediger, H. L. (1984). Procedures of mind. Journal of Verbal
Learnin& and Verbal Behavior. 23,, 425-449.
Kolers, P.A., & Smythe, W. E. (1979). Images, symbols, and skills. Canadian
Journal of Psycholo&Y, .ll, 158-184.
" Kolers, P.A., & Smythe, W. E. (1984). Symbol manipulation: Alternatives to
the computational view of mind. Journal of Verbal Learnin& and Verbal
Behavior. 23., 289-314.
Kolers, P. A., Wrolstad, M. E., & Bouma, H. (Eds.). (1979). Processin& of
visible lanwia&e. New York: Plenum Press.
Kotovsky, K., Hayes, J. R., & Simon, H. A. (1985). Why are some problems
hard? Evidence from Tower of Hanoi. Comitiye Psycholo&Y, 11, 248-294.
Lang, R. J., & Solman, R. T. (1979). Effect of pictures on learning to read
common nouns. British Journal of Educational Psycholoc. ~ 138-149.

References 170
Larkin, J., McDermott, J., Simon, D., & Simon, H. (1980). Models of
competence in solving physics problems. Copitiye Science.~. 317-348.
Lesgold, A. M., De Good, H., & Levin, J. R. (1977). Pictures and young
children's prose - learning: A supplementary report. Journal of Readin&
Behavior, 2. 353-360.
Lesgold, A. M., Levin, J. R., Shimron, J., & Guttmann, J. (1975). Pictures and
young children's learning from oral prose. Journal of Educational
Psycholo&Y· 61, 636-642.
Levin, J. R., Bender, B. G., & Lesgold, A. M. (1976). Pictures, repetition and
young children's oral prose learning, AV Communications Review.~ 367-
380.
Logie, R. H., & Baddeley, A. D. (1987). Cognitive processes in counting.
Journal of E,u,erimental Psycholo&1; Learnin&, Memory and Co&nition, .U.
310-326
Logie, R.H., Baddeley, A. D., Mane, A., Donchin, E., & Sheptak, R. (1988).
Visual working memory in the acquisition of complex cognitive skills. In M.
Denis, J. Engelcamp & J. T. E. Richardson (Eds.), Co&nitiye and
neuro,psycholo~cal ill}proaches to mental ima&er.y (pp. 191-202). Boston:
Martinus Nijhof.
Long, S. A., Winograd, P. N., & Bridge, C. A. (1989). The effects of reader
and text characteristics on imagery reported during and after reading. Readio&
Research Quarterly, ~. 353-372.
References 171
Mandler, G. (1989). Memory: Conscious and unconscious. In P.R. Solomon,
G. R. Goethals, C. M. Kelley & B. R. Stephens (Eds.), Memory;
interdiscjplinazy a,p,proaches (pp. 84-106). New York: Springer-Verlag.
Mandler, J. M., & Johnson, M. S. (1977). Remembrances of things parsed:
Story structure and recall. Comitiye Psycholo~. 2, 111-151.
Masson, M. E. J., & Miller, J. 0. (1983). Working memory and individual
differences in comprehension and memory of text. Journal of Educational
Psycholoe;y. ll, 314-318.
McGaugh, J. L. (1989). Modulation of memory storage processes. In P. R.
Solomon, G. R. Goethals, C. M. Kelley & B. R. Stephens (Eds.), Memory; ;
interdisciplinazy iWPJ:Oaches <pp. 33-64). New York: Springer-Verlag.
Miller, W. (1937). The picture crutch in reading. Elementary Ene;lish Review.
li, 263-264.
Miller, W. (1938). Reading with and without pictures. Elementazy School
JoumaI. lS,, 67 6-682.
Miller, W. (1939). What children see in pictures. Elementazy School Journal, 32,
280-288.
Morton, J. (1979). Facilitation in word recognition: Experiments causing change
in the logogen model. In P.A. Kolers, M. E. Wrolstad & H. Bouma (Eds.),
Processin& of visible lan&Qa&e (pp. 259-268). New York: Plenum Press.
References 172
Neisser, U. (1989). Domains of memory. In P. R. Solomon, G. R. Goethals, C.
M. Kelley & B. R. Stephens (Eds.), Memory; interdisciplinary approaches
(pp. 67-83). New York: Springer-Verlag.
Nelson, D. L., Reed, V. S., & McEvoy, C. L. (1977). Learning to order pictures
and words: A model of sensory and semantic encoding. Journal of
Experimental Psycholo&y, Human Learnin& and Memory . .3., 485-497.
Nelson, D. L., Reed, V. S., & Walling, J. R.. (1976). Pictorial superiority
effect. Journal of Experimental Psycholo&y, Human Learnin& and Memory •
.2, 523-528.
O'Keefe, E. J., & Solman, R. T. (1987). The influence of illustrations on /
children's comprehension of written stories. Journal of Readin& Behavior,
.12, 353-378
Olson, D. R., & Bialystok, E. (1983). Spatial co&nition; The structure and
development of mental representations of spatial relations. Hillsdale, New
Jersey: Erlbaum.
Osgood, C. E. (1973). The discussion of Dr. Paivio's paper. In F. J. McGuigan
& R. A. Schoonover (Eds.), The psychophysiolo&y of think:in&; Studies of
coven processes (pp. 285-298). New York: Academic Press.
Owen, E., & Sweller, J. (1985). What do students learn while solving
mathematics problems'? Journal of Educational Psycholo&Y, Il, 272-284.

References 173
Paivio, A. (1969). Mental imagery in associative learning and memory.
Psycholo&;ical Review.~ 241-263.
Paivio, A. (1971). Ima&m and verbal processes. New York: Holt, Rinehart &
Winston.
Paivio, A. (1975). Coding distinctions and repetition effects in memory. In G.
H. Bower (Ed.), The psycholoc of leamin& and motivation (Vol. 9). New
York: Academic Press.
Paivio, A. (1978). Dual coding: Theoretical issues and empirical evidence. In J.
M. Scandura & C. J. Brainerd (Eds.), StructuraVprocess models of complex
human behayior (pp. 527-550). Leiden, The Netherlands: Nordhoff.
/
Paivio, A. (1979). Psychological processes in the comprehension of metaphor.
In A. Ortony (Ed.), Metaphor and thou&ht (pp. 150-171). New York:
Cambridge University Press.
Paivio, A. (1983). The empirical case for dual coding. In J. C. Yuille (Ed.),
Ima&ery, memory and co&nition; Essays in honor of Allan Paivio (pp. 307-
332). Hillsdale, New Jersey: Erlbaum.
Paivio, A. (1986). Mental re.presentations; A dual codin& approach. New York:
Oxford University Press.
Paivio, A., & Casapo, K. (1973). Picture superiority in free recall: Imagery or
dual coding? Copitive Psycholoc • .5., 176-206.

References 174
Paivio, A., & Lambert, W. (1981). Dual coding and bilingual memory. Journal
of Verbal Leamin& and Verbal Behavior,20, 532-539.
Peeck, J. (1974). Retention of pictorial and verbal content of a text with
illustrations. Journal of Educational Psycholou. 66, 880-888.
Peterson, M. J. (1975). The retention of imagined and seen spatial matrices.
Copitive Psycholou.1, 181-193.
Pichert, J. P., & Anderson, R. C. (1977). Taking different perspectives on a
story. Joornal of Educational Psycholou. 62. 309-315.
Posner, M. I., & Synder, C.R. (1975). Attention and cognitive control. In R. L.
Solso (ed.), Infonnation processin& and comition; The Loyola Symposium ,
(pp. 55-86). Pontamac: Erlbaum Associates.
Poulton, E. C. (1975). Range effects in experiments on people. American
Joomal of Psycboiou, .88., 3-32.
Pylyshyn, Z. W. (1973). What the mind's eye tells the mind's brain: A critique
of mental imagery. Psycholo&i,cal Bulletin. fill, 1-24.
Pylyshyn, z. W. (1984). Computation and co1mition. Cambridge, MA: MIT
Press.
Rasco, R. W., Tennyson, R. D., & Boutwell, R. C. (1975). Imagery instructions
and drawings in learning prose. Journal of Educational Psycholo&,Y. fil.., 188-
192.

References 175
Read, J. D., & Barnsley, R.H. (1977). Remember Dick and Jane? Memory for
elementary readers. Canadian Journal of Behayioral Science. 2, 361-370.
Reese, H. W. (1970). Imagery in children's learning: A symposium. Psycholoo
Bulletin. ll, 383-421.
Reid, D. J., Briggs, N., & Beveridge, M. (1983). The effect of picture upon
readability of a school science topic. British Journal of Educational
Psycholo&Y· ll. 327-335.
Reinking, D., Hayes, D. A., & McEneaney, J. E. (1988). Good ·and poor
readers' use of explicitly cued graphic aids. Journal of Readin& Behavior, 20,
229-247
Rigney, J. W., & Lutz, K. A. (1976). Effect of graphic analogies of concepts in
chemistry on learning and attitude. Journal of Educational Psycholoo, .6R..
305-311.
Rohwer, W. D., Jr., & Harris, W. J. (1975). Media effects on prose learning in
two populations of children. Journal of Educational Psycholo&Y· fil, 651-
657.
Rohwer, W. D., Jr., & Matz, R. D. (1975). Improving aural comprehension in
white and black children: Pictures versus print. Journal of Experimental Child
Psycholo&y, 12. 23-36.

References 176
Rumelhart, D. E. (1975). Notes on a schema for stories. In D. G. Bobrow & A.
M. Collins (Eds.)~ Representations and understandin&; Studies in comitive
science. New York: Academic Press.
Sadoski, M. (1983). An exploratory study of the relationships between reported
imagery and the comprehension and recall of a story. Readin& Research
Quarterl,y.12., 110-123.
Sadoski, M. (1985). The natural use of imagery in story comprehension and
recall: Replication and extension. Readin& Research Quarterly. 20, 658-667.
Sadoski, M., Goetz, E. T., & Kangiser, S. (1988). Imagination in story
response: Relationships between imagery, affect, and structural importance.
Readin& Research Ouarterly. ll, 320-336.
Samuels, S. J. (1967). Attentional process in reading: The effect of pictures on
the acquisition of reading responses. Journal of Educational PsycholQ&Y, ~
337-342.
Samuels, S. J. (1970). Effects of pictures on learning to read, comprehension and
attitudes. Review of Educatiooal Research, 1ll, 397-407.
Saunders, R. J., & Solman, R. T. (1984). The effect of pictures on the
acquisition of a small vocabulary of similar sight-words. British JQlll]lal <>f
Educational Psych<>1,o&Y, ~, 265-275.

References 177
Schallert, D. L. (1976). Improving memory for prose: The relationship between
depth of processing and context. Journal of Verbal Readin& and Verbal
Behavior, U, 621-632.
Schallert, D. L. (1980). The role of illustrations in reading comprehension. In
R.J. Spiro, B.C. Bruce & W.F. Brewer (Eds.). Theoretical issues in readine
comprehension lpp. 503-524). Hillsdale, New Jersey: Erlbaum.
Schoenfeld, A. H., & Herrmann, D. J. (1982). Problem perception and
knowledge structure in expert and novice mathematical problem solvers.
Journal of Experimental Psycholoey: Learnin&, Memory and Comition . .8.,
484-494.
Singer, H., Samuels, S. J., & Spiroff, J. (1973-1974). The effects of pictures /
and contextual conditions on learning responses to printed words. Readine
Research Ouarterly. 2, 555-567.
Singh, N. N., & Solman, R. T. (in press). A stimulus control analysis of the
picture-word problem: The blocking effect. Journal of Readine Behayior
Analysis.
Skinner, B. F. (1953). Science and human behavior. New York: Macmillan.
Skinner, B. F. (1963). Behaviorism at fifty. Science, .1.4il, 951-958.
Skinner, B. F. (1975). The steep and thorny way to a science of behavior.
American Psycholo&ist. Jil, 42-49.

References 178
Solman, R. T. (1976). The use of pictures in reading: A particular negative
outcome. Orana, 22, 185-190.
Solman, R., Singh, N., & Kehoe, E. (under review). Pictures block the learning
of sight words.
Solomon, P. R., Goethals, G. R., Kelley, C. M., & Stephens, B. R. (Eds.)
(1989). Memmy; interdisciplinazy approaches. New York: Springer-V erlag.
Sweller, J. (1988). Cognitive load during problem solving: Effects on learning.
CQmitive Science. 12, 257-285.
Sweller, J. (1989). Cognitive technology: Some procedures for facilitating
learning and problem solving in mathematics and science. Journal of /
Educational Psychoioc, .81, 457-466.
Sweller, J., & Cooper, G. A. (1985). The use of worked examples as a substitute
for problem solving in learning algebra. CQwition and Instruction. 2.. 59-89.
Sweller, J., Chandler, P., Tierney, P., & Cooper, M. (in press). Cognitive load
as a factor in the structuring of technical material. Journal of Ex;perimental
Psycholoc: General.
Sweller, J., Mawer, R., & Howe, W. (1982). Consequences of history-cued and
means-ends strategies in problem solving. American Journal of Psycholoc,
25., 455-483.

References 179
Sweller, I., Mawer, R., & Ward, M. (1983). Development of expertise in
mathematical problem solving. Journal of Exm:iroental Psycholou; General.
ill, 634-656.
Tajika, H., Taniguchi, A., Yamamoto, K., & Mayer, R. E. (1988). Effects of
pictorial advance organizers on passage retention. Contemporary Educational
Psycholo~y. ll, 133-139.
Tannizi, R. A., & Sweller, I. (1988). Guidance during mathematical problem
solving. Journal of Educational Psycholou. fill, 424-436.
Te Linde, I. (1983). Pictures and words in semantic decisions. In I. C. Yuille
(Ed.)t Imam:y. memory and comition; Essays in honor of Allan Paivio (pp.
117-129). Hillsdale, New Jersey: Erlbaum.
Thompson, R. F. (1989). A model system approach to memory. In P. R.
Solomon, G. R. Goethals, C. M. Kelley & B. R. Stephens (Eds.), Memory;
interd,isciplinm apJ)IOaches (pp. 17-32). New York: Springer-Verlag.
Tulving, E. (1983). Elements of episodic memory. New York: Oxford
University Press.
Tulving, E. (1985a). How many memory systems are there? American
Psycholo~ist, ~. 385-398.
Tulving, E. (1985b). Memory and consciousness. Canadian Psycholou. 26, 1-
12.

References 180
Tyler, L. E. (1965). The psycholQc of human differences (3rd ed.). New York:
Appleton-Century-Crofts.
Underwood, G. (1988). Middle Geomasters. Melbourne: Brooks Waterloo.
Vernon, M. D. (1950). The visual presentation of factual data. British Journal of
Educational Psycholqc, 2ll, 174-175.
Vernon, M. D. (1953). The value of pictorial illustration. British Journal qf
Educatiqnal PsychQIQc, .2l, 180-187.
Vernon, M. D. (1954). The instruction of children by pictorial illustration. British
Joornal qf Educatiooal Psych<>loc. ~ 171-179.
/
Ward, F. (1989). Images for the computer age. Natiooal Goo&m>hic, 1ll, 718-
751
Ward, M., & Sweller, J. (1990). Structuring effective worked examples.
CQpitioo and Instructiqn, 1, 1-39.
Weintraub, s. (1960). The effect qf pictures on the comprehension Qf a second
a:ade basal reader. Unpublished doctoral dissertation, University of lliinois.
Wheldall, K., & Mittler, P. (1977). On presenting pictures and sentences: The
effect of presentation order on sentence comprehension in normal and mentally
handicapped children, British Journal of Educational Psycholoe;y. il, 322-
326.

References 181
Willows, D. M. (1978). A picture is not always worth a thousand words: Pictures
as distractors in reading. Journal of Educational Psycholoey, :m, 255-262.
Winer, B. I. (1971). Statistical Principles in Ex.perimental Desi&n (2nd ed.).
New York: McGraw-Hill.
Yuille, I. c. (Ed.). (1983) Ima&ezy, memozy and copition; Essays in honor of
Allan Paiyio. Hillsdale, New Jersey: Erlbaum.
Zhu, X., & Simon, H. (1987). Learning mathematics from examples and by
doing. Copition and Instruction . .4. 137-166.
182

Appendkes for Experiment 1
Appendix 1: Reading materials and multiple choice items for
Experiment 1
Rr-adiuu: roarerial for Group 1:
WHAT IS THE HYDROSPHERE?
183
The hydrosphere is the "water-sphere". It includes all the water of the earth,
whether it be frozen, in liquid form, or as a vapour. The hydrosphere includes the
oceans, ice caps, lakes, rivers, swamps, creeks, and water under the ground
(groundwater) and in the air (water vapour). Water is constantly moving from
place to place. It is also changing from state to state (for example, from a liquid
into a gas).
/
The water in the hydrosphere is unevenly distributed. Most of it (97 per cent) is in
the liquid state in the oceans. These cover over 70 per cent of the surface of the
earth. About 2 per cent is in solid form in the ice caps. Less than 1 per cent is in
the form of "fresh" water either on the ground or below the surface.
The movement of water is best illustrated by the diagram below (Figure 1 ). The
water cycle is driven by the radiant energy of the sun and has no beginning or end.
There are a number of processes that are important. Precipitation refers to the
falling of water in the form of rain, snow, hail or dew. Precipitation can only occur
after condensation has taken place. This is the transfer of moisture from a vapour
to a liquid. When water reaches the ground it may run over the surface or be
absorbed (infiltrate) into the soil. Water may evaporate (tum into a vapour) from
any water surface on the earth. It is also transpired from plants and animals into the
atmosphere.

Appendices f or Experiment 1 184
The water cycle shows some of the links that exist between the four main
components of the biophysical environment. The movement of air in the
atmosphere decides where and when precipitation will occur. The layers of rock in
the lithosphere will influence the amount and flow of groundwater. The extent of
plant cover in the biosphere will affect runoff and transpiration.
Once again people have altered this part of the biophysical environment. Runoff
can be reduced or increased by certain uses of the land. The water itself can be
polluted, even in its vapour state. "Acid rain" is formed from industrial air
pollution. This rain has killed forests and water life in many lakes in the northern
hemisphere.

Appendices for Experiment 1 185
Readior materia,l for Group 2:
WHAT IS THE HYDROSPHERE?
The hydrosphere is the "water-sphere". It includes all the water of the earth,
whether it be frozen, in liquid fonn, or as a vapour. The hydrosphere includes the
oceans, ice caps, lakes, rivers, swamps, creeks, and water under the ground
(groundwater) and in the air (water vapour). Water is constantly moving from
place to place. It is also changing from state to state (for example, from a liquid
into a gas).
The water in the hydrosphere is unevenly distributed. Most of it (97 per cent) is in
the liquid state in the oceans. These cover over 70 per cent of the surface of the
earth. About 2 per cent is in solid fonn in the ice caps. Less than 1 per cent is in /
the form of "fresh" water either on the ground or below the surface.
The water cycle is driven by the radiant energy of the sun and has no beginning or
end. There are a number of processes that are important. Precipitation refers to the
falling of water in the form of rain, snow, hail or dew. Precipitation can only occur
after condensation has taken place. This is the transfer of moisture from a vapour
to a liquid. Clouds are the visible result of the process of condensation.
Precipitation may occur after clouds have fonned and it results in water returning to
the earth. When water reaches the ground it may run over the surface (overland
flow) or be absorbed (infiltrate) into the soil. Water may be stored on the ground
surface in a depression storage. Water infiltrating into the soil may pass through
the unsaturated zone in the ground and into the saturated zone. The water table is
the dividing line between the unsaturated zone and the saturated zone. The
downward movement of water in the saturated zone is called percolation. Water

Appendices for Experiment 1 186
stored under the ground surface is called groundwater. Some of the groundwater
may move laterally to return to a water body such as a stream. The flow of water in
the unsaturated zone which moves laterally towards a water body such as a stream
is called interflow. Some of the water stored in depression storages on the ground
surf ace evaporates whilst some of this water may infiltrate into the ground.
Interception of some precipitation by vegetation may stop some of the precipitation
from reaching the ground. Water may evaporate (tum into a vapour) from any
water surface on the earth. It is also transpired from plants and animals into the
atmosphere.
The water cycle shows some of the links that exist between the four main
components of the biophysical environment. The movement of air in the
atmosphere decides where and when precipitation will occur. The layers of rock in
the lithosphere will influence the amount and flow of groundwater. The extent of /
plant cover in the biosphere will affect runoff and transpiration.
Once again people have altered this part of the biophysical environment. Runoff
can be reduced or increased by certain uses of the land. The water itself can be
polluted, even in its vapour state. "Acid rain" is formed from industrial air
pollution. This rain has killed forests and water life in many lakes in the northern
hemisphere.

Appendices for Experiment 1 187
Reading material for Group 3:
WHAT IS TIIB HYDROSPHERE?
The hydrosphere is the "water-sphere". It includes all the water of the earth,
whether it be frozen, in liquid form, or as a vapour. The hydrosphere includes the
oceans, ice caps, lakes, rivers, swamps, creeks, and water under the ground
(groundwater) and in the air (water vapour). Water is constantly moving from
place to place. It is also changing from state to state (for example, from a liquid
into a gas).
The water in the hydrosphere is unevenly distributed. Most of it (97 per cent) is in
the liquid state in the oceans. These cover over 70 per cent of the surface of the
earth. About 2 per cent is in solid form in the ice caps. Less than 1 per cent is in /
the form of "fresh" water either on the ground or below the surface.
The movement of water is best illustrated by the diagram below (Figure 1 ). The
water cycle is driven by the radiant energy of the sun and has no beginning or end
There are a number of processes that are important. Precipitation refers to the
falling of water in the form of rain, snow, hail or dew. Precipitation can only occur
after condensation has taken place. This is the transfer of moisture from a vapour
to a liquid. Clouds are the visible result of the process of condensation.
Precipitation may occur after clouds have formed and it results in water returning to
the earth. When water reaches the ground it may run over the surface (overland
flow) or be absorbed (infiltrate) into the soil. Water may be stored on the ground
surface in a depression storage. Water infiltrating into the soil may pass through
the unsaturated zone in the ground and into the saturated zone. The water table is
the dividing line between the unsaturated zone and the saturated zone. The

Appendices for Experiment 1 188
downward movement of water in the saturated zone is called percolation. Water
stored under the ground surface is called groundwater. Some of the groundwater
may move laterally to return to a water body such as a stream. The flow of water in
the unsaturated mne which moves laterally towards a water body such as a stream
is called interflow. Some of the water stored in depression storages on the ground
surf ace evaporates whilst some of this water may infiltrate into the ground.
Interception of some precipitation by vegetation may stop some of the precipitation
from reaching the ground. Water may evaporate (tum into a vapour) from any
water surface on the earth. It is also transpired from plants and animals into the
atmosphere.
The water cycle shows some of the links that exist between the four main
components of the biophysical environment. The movement of air in the
atmosphere decides where and when precipitation will occur. The layers of rock in /
the lithosphere will influence the amount and flow of groundwater. The extent of
plant cover in the biosphere will affect runoff and transpiration.
Once again people have altered this part of the biophysical environment. Runoff
can be reduced or increased by certain uses of the land. The water itself can be
polluted, even in its vapour state. "Acid rain" is formed from industrial air
pollution. This rain has killed forests and water life in many lakes in the northern
hemisphere.

Appendices for Experiment 1 189

Appendices for Experiment 1
Multiple choice items for reading materials used in Experiment 1
1. Water in the hydrosphere is
(a) mainly made up of groundwater
(b) constantly moving
(c) mainly in liquid form
(d) not polluted
2. The amount of water either on or below the ground is approximately
(a) 1 % of all water
(b) 2% of all water
(c) 10% of all water
(d) 70% of all water
3. The source of energy driving the water cycle is
(a) precipitation
(b) the sun
(c) gravity
(d) air mass movement
190

Appendices for Experiment 1
4. The process of condensation is the result of
(a) water vapour turning to liquid
(b) moisture vaporizing
(c) the process of transpiration
(d) the process of evaporation
5. The layers of rock in the lithosphere influence the rate of
(a) infiltration
(b) groundwater flow
(c) evaporation
(d) runoff
6. Acid rain results from
(a) acidic water
(b) groundwater pollution
(c) sulphur dioxide
(d) industrial air pollution
7. How many states of water are there in the hydrosphere?
(a) one
(b) two
(c) three
(d) four
191

Appendices for Experiment 1
8. Movements of air in the atmosphere primarily influence
(a) transpiration
(b) precipitation
(c) infiltration
(d) evaporation
192
9. In which hemisphere has acid rain killed more forests and water life in lakes?
(a) northern
(b) southern
(c) eastern
(d) western
10. In the biosphere, what will affect runoff and transpiration?
(a) plant cover
(b) clouds
(c) precipitation
(d) groundwater
11. The unsaturated zone is
(a) below the saturated zone
(b) above the saturated zone
(c) below the biosphere
(d) above the biosphere

Appendices for Experiment I
12. The water cycle derives its name from
(a) the lateral and vertical movements of water
(b) the movement of water along and under the ground back to the oceans
(c) the physical and chemical cycles it causes to operate
(d) the cycle of water in the atmosphere
193
13. The process of water moving downwards through the saturated zone is called
(a) interception
(b) percolation
( C) infiltration
(d) interflow
14. The water table is the dividing line between
(a) the atmosphere and the biosphere
(b) the ground surface and the lithosphere
(c) the saturated zone and the unsaturated mne
(d) water bodies and land

Appendices for Experimenl 1
15. The process of water moving downwards through the unsaturated zone is
called
(a) interception
(b) percolation
( C) infiltration
(d) interflow
16. Water in a depression storage may be lost by
(a) evaporation and transpiration
(b) evaporation and precipitation
(c) evaporation and infiltration
(d) evaporation only
17. lnterflow may result in
(a) water being lost to streams
(b) water becoming groundwater
( c) infiltration
(d) percolation
18. Water running over the surface of the ground is known as
(a) interflow
(b) sub-surface flow
(c) overland flow
(d) astream
194

Appendices for ExperuMnt 1
19. Depression storages are
(a) streams
(b) on the ground surface
(c) underground water
(d) craters
195
20. The diagram which most accurately reflects the processes in the water cycle is
(b)
Evapon1t ion & transpiration
Ground storo es
Evaporation & tnmspi ration
Ground storo es
Candensat ion 1------,• Precipitation
Interception
lnfi 1 tret ion
Candensat ion 1------ Preci pi tat ion
Intercept ion
lnfil tret ion

Appendices for Experiment 1
(c)
(d)
Evaporat 1 on &. transpiration
Ground store es
Eveporet ion &. transpiret ion
Ground store es
196
Candenset ion ~---1•Precipitation
Intercept ion
lnfil tret ion
Candenset ion ~---1•Precipitation
Interception
lnfi 1 tret ion

Appendices for Experiment 1 197

Appendices for Experiment 1 198
Appendix 2: Proportions correct data for students in Experiment 1
Qroup 1:
Questions 1 to 10 Questions 11 to 20 on the
Student ml the mi&inal teit iofonnaJimi iD tb, illustratiQD
1 .6 .2
2 .7 .4
3 .5 .6 4 .3 .4
5 .9 .6 6 .8 .6 7 .8 .5 8 .8 .2
9 .8 .6 10 .7 .4
11 .7 .5 12 .5 .5 13 .6 .3 14 1 .6 15 .4 .3 16 .9 .5 17 .4 .1 18 .8 .4 19 .7 .5 20 .8 .6 21 .8 .1 22 .9 .3 23 .4 .2 24 1 .7 25 .9 .6

Appendices for Experiment 1 199
Proportions correct data for each student:
Grogp2:
Questions 1 to 10 Questions 11 to 20 on the
Student m the Q[i&iJlal tcit informatiml in the ill11stmti2n 1 .7 .5 2 .5 .2 3 .7 .1 4 .6 .3 5 .9 .2 6 .9 .5 7 .5 .2 8 .8 .7 9 .6 .2
10 .7 .6 11 .8 .3 12 .7 .4 13 .8 .5 14 .8 .2 15 .5 .3 16 1 .6 17 .8 .6 18 .5 .4 19 .8 .3 20 .5 .4 21 .6 .2 22 .6 .4 23 .7 .7 24 .5 .2 25 1 .6

Appendices for Experiment 1 200
Proportions correct data for each student:
Group 3:
Questions 1 to 10 Questions 11 to 20 on the
Student QD the ori&inal tcxt infmmatiQD in the illustratiQn 1 .7 .7 2 .8 .6 3 .5 .3 4 .5 .2 5 .9 .6 6 .6 .3 7 .9 .7 8 .7 .6 9 .5 .4
10 .5 .6 11 .6 .7 12 .9 .7 13 .7 .9 14 .7 .5 15 .7 .4 16 .8 .5 17 .8 .7 18 .5 .2 19 .8 .6 20 .8 .5 21 .6 .4 22 .6 .9 23 .6 .6 24 .7 .5 25 .9 .6

Appendices for Experiment 2
Appendix 3: Reading materials and multiple choice items for
Experiment 2
Rr:adin~ material for Group 1:
A cross section from A to C Height
in metres
A 60 Jogger
50
40
30
20
10
riwn
lf--Floodplai n { 4.Slcm)---.!
0 2.5 5 7.5 Distance in lcilome1res
Vertical exaggeration = 1 00
Average gradient from A to B = 1 :21 5
Average gradient from B to C = 1 :750
10 12.5
201
Catti Mesa
l4-2km overall
15

Appendices for Experiment 2
Height A cross section from B to D
in metres
60
50
40
30
20
10 River terrace Floodplain ...-i (4.5km overall)
0 2.5
Catti
5 7.5 Distance in kilome1res
Vertical exaggeration = 100
Average gradient from B to C = 1 :750
Average gradient from C to D = 1 :270
10
Market gardens
Det\ .:.I
12.5
202
15

Appendices for Experiment 2 203
Readior material for Group 2:
A cross section from A to C
The horizontal distance covered by this cross section is 15km. The vertical scale
goes from Oto 60 metres. The vertical exaggeration is 100. The average gradient
from point A to point B, a distance of 7.5km is 1:215. The average gradient from
point B to point C, a distance of7.5.km is 1:750.
Point A and Jogger Town are atop Christies Bluff which rises 27m above the river
terrace below. About half of the river terrace is covered with medium scrub and an
orchard occupies the remainder. There is then a slope down to the flood plain.
Dense scrub covers this slope. Adam Town is found on the left hand side of this
floodplain adjacent to Burke River. On the right hand side of Burke River is a
slope covered in medium scrub. This gives way to a river terrace.
Point B is on the left hand side of the river terrace on which wheat is grown. The
overall width of the floodplain is 4.5 km. On the right hand side of the floodplain
Dawson Butte rises to a height of 16m above the river terrace. A remnant rainforest
is found atop the butte and scattered scrub on its left hand slope and no vegetation
on its right hand slope. At the base of the right hand slope is Angel Cavern. There
is then an area of medium scrub before King Lake. This lake's right hand side
gives way to Catti Mesa. The left hand slope of the mesa is covered with medium
scrub. Corn is grown atop the mesa which measures 2km in width overall. Point
C is halfway across the mesa.

Appendices for Experiment 2 204
A cross section from B to D
The horizontal distance covered by this cross section is 15km. The vertical scale
goes from O to 60 metres. The vertical exaggeration is 100. The average gradient
from point B to point C, a distance of 7 .5km is 1:750. The average gradient from
point C to point D, a distance of 7 .5km is 1 :270.
Point B is on the left hand side of the river terrace on which wheat is grown. The
overall width of the floodplain is 4.5 km. On the right hand side of the floodplain
Dawson Butte rises to a height of 16m above the river terrace. A remnant rainforest
is found atop the butte and scattered scrub on its left hand slope and no vegetation
on its right hand slope. At the base of the right hand slope is Angel Cavern. There
is then an area of medium scrub before King Lake. This lake's right hand side
gives way to Catti Mesa. The left hand slope of the mesa is covered with medium
scrub. Com is grown atop the mesa which measures 2km in width overall. Point
C is halfway across the mesa.
From Point C across the remainder of the mesa and down its right hand slope corn
is grown. There is then a short flat area on which Tomlin's farmhouse is located,
overlooking Bryce Canyon. The canyon has no plants in it. On the other side of
the canyon on a plain of the same elevation as the farmhouse is the township of
Denton. Market gardening is then found on the remainder of this plain. Sector Hill
rises 53m from this plain. On its left hand side is Kugar State Forest. Point D is
atop this hill.

Appendices for Experiment 2
Ret!dine roarecW for Group 3:
Height
60
40
30
20
10
A cross section from A to C
Remnant
205
Catti Mesa
lf-Floodplai n ( 4.Skm)---.i lf..2km overall
0 2.5 5 7.5 Di sta nee i n kilo me1 res
Vertical exaggeration = 1 00
Average gradient from A to B = 1 :215
Average gradient from B to C = 1 :750
A cross section from B to D
10 12.5
The horizontal distance covered by this cross section is 15km. The vertical scale
goes from Oto 60 metres. The vertical exaggeration is 100. The average gradient
from point B to point C, a distance of 7 .5km is 1 :750. The average gradient from
point C to point D, a distance of 7 .5km is 1 :270.
Point B is on the left hand side of the river terrace on which wheat is grown. The
15

Appendices for Experiment 2 206
overall width of the floodplain is 4.5 km. On the right hand side of the floodplain
Dawson Butte rises to a height of 16m above the river terrace. A remnant rainforest
is found atop the butte and scattered scrub on its left hand slope and no vegetation
on its right hand slope. At the base of the right hand slope is Angel Cavern. There
is then an area of medium scrub before King Lake. This lake's right hand side
gives way to Catti Mesa. The left hand slope of the mesa is covered with medium
scrub. Corn is grown atop the mesa which measures 2km in width overall. Point
C is halfway across the mesa.
From Point C across the remainder of the mesa and down its right hand slope corn
is grown. There is then a short flat area on which Tomlin's farmhouse is located,
overlooking Bryce Canyon. The canyon has no plants in it. On the other side of
the canyon on a plain of the same elevation as the farmhouse is the township of
Denton. Market gardening is then found on the remainder of this plain. Sector Hill
rises 53m from this plain. On its left hand side is Kugar State Forest. Point Dis
atop this hill.

Appendices for Experiment 2
Bradinr material for Group 4:
A cross section from B to C
60
50
Height 40 in
metres 30
20
10 River terrace
0
Floodplai n41 ( 4 .Skm overa 11)
2.5 5
Distance in kilometres
Vertical exaggeration = 1 00
l4-2km (overall)
7.5
207

Appendices for Experiment 2 208
Readine: material for Group 5:
A cross section from B to D
The horizontal distance covered by this cross section is 15km. The vertical scale
goes from Oto 60 metres. The vertical exaggeration is 100. The average gradient
from point B to point C, a distance of 7 .5km is 1:750. The average gradient from
point C to point D, a distance of 7 .5km is 1 :270.
Point B is on the left hand side of the river terrace on which wheat is grown. The
overall width of the floodplain is 4.5 km. On the right hand side of the floodplain
Dawson Butte rises to a height of 16m above· the river terrace. A remnant rainforest
is found atop the butte and scattered scrub on its left hand slope and no vegetation
on its right hand slope. At the base of the right hand slope is Angel Cavern. There
is then an area of medium scrub before King Lake. This lake's right hand side
gives way to Catti Mesa. The left hand slope of the mesa is covered with medium
scrub. Com is grown atop the mesa which measures 2km in width overall. Point
C is halfway across the mesa.

Appendices for Experinumt 2
Multiple choice items for Experiment 2
Multiple choice items forGroqps 1. 2 and 3:
1. The width of the mesa is
(a) 2.0km
(b) 4.5km
(c) 5.0km
(d) 7.5km
2. The number of towns in the cross section from B to C is
(a) 0
(b) 1
(c) 2
(d) 3
3. The name of the town near the cavern is
(a) Jogger
(b) Adam
(c) Denton
(d) not given

Appendices for Experiment 2
4. The type of natural vegetation between Christies Bluff and the river is
(a) scattered scrub
(b) scattered and medium scrub
(c) medium and dense scrub
(d) dense scrub
5. The height of the butte is
(a) 16m
(b) 27m
(c) 53m
(d) not stated
6. The number of towns in the cross section from A to C is
(a) 0
(b) 1
(c) 2
(d) 3
7. The average gradient from B to C is
(a) 1:270
(b) 1:750
(c) 1:1500
(d) not stated
210
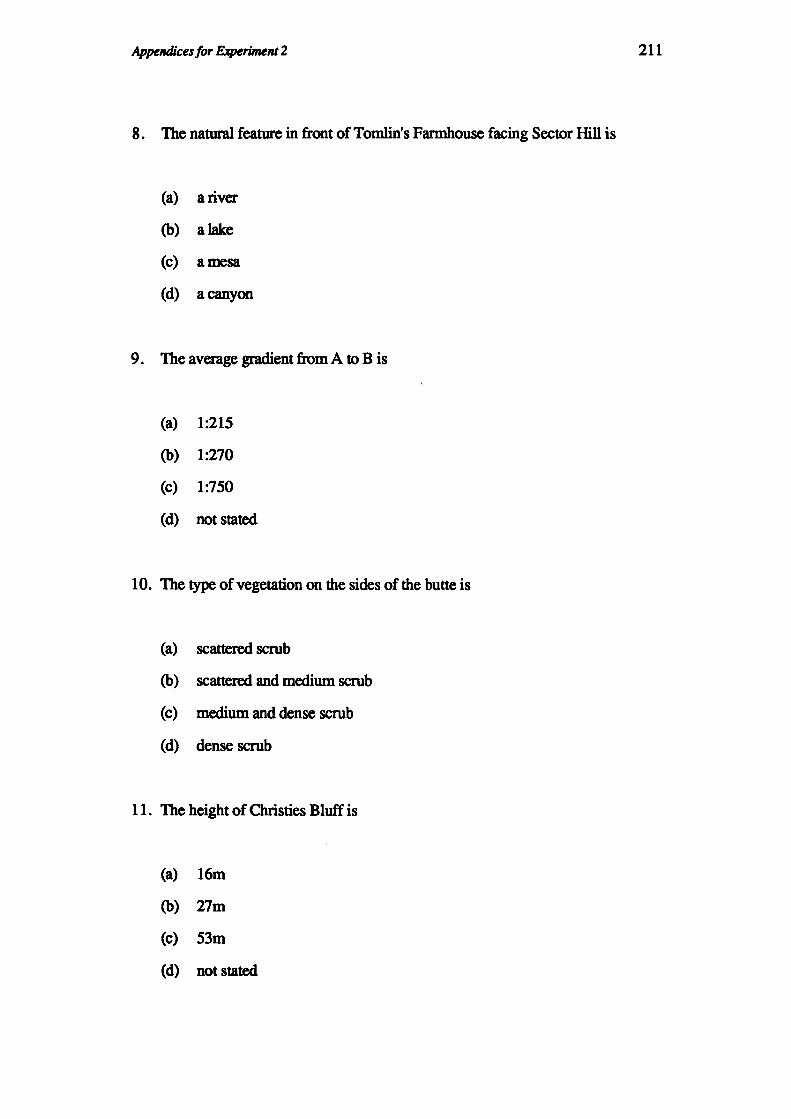
Appendices for Experiment 2
8. The natural feature in front of Tomlin's Farmhouse facing Sector Hill is
(a) ariver
(b) alake
(c) amesa
(d) acanyon
9. The average gradient from A to B is
(a) 1:215
(b) 1:270
(c) 1:750
(d) not stated
10. The type of vegetation on the sides of the butte is
(a) scattered scrub
(b) scattered and medium scrub
(c) medium and dense scrub
(d) dense scrub
11. The height of Christies Bluff is
(a) 16m
(b) 27m
(c) 53m
(d) not stated
211

Appendices for Experiment 2
12. The type of natural vegetation between B and the butte is
(a) scattered scrub
(b) scattered and medium scrub
(c) medium and dense scrub
(d) dense scrub
13. The type of vegetation atop the butte is
(a) scattered scrub
(b) medium scrub
(c) dense scrub
(d) rainforest
212
14. The types of activities of people likely to be affected by floods from the river
are
(a) agriculture only
(b) urban only
(c) both agriculture and urban
(d) none
15. The number of towns in the cross section from C to D is
(a) 0
(b) 1
(c) 2
(d) 3

Appendices for Experinuml 2
16. The width of the floodplain is
(a) 2.0km
(b) 4.5km
(c) 5.0km
(d) 7.5km
17. The name of the canyon is
(a) Catti
(b) Denton
(c) Kugar
(d) Bryce
18. The type of agricultural activity between Christies Bluff and the river is
(a) wheat
(b) corn
(c) maize
(d) orchard
19. The type of vegetation immediately beside the lake is
(a) scattered scrub
(b) medium scrub
(c) dense scrub
(d) rainforest
213

Appendices for Experiment 2
20. The average gradient from C to D is
(a) 1:270
(b) 1:750
(c) 1:1500
(d) not stated
21. The natural features either side of the butte at its base are
(a) a river terrace and a cavern
(b) a talus slope and a river terrace
(c) a cavern and a cliff
(d) a lake and a talus slope
22. The type of agricultural activity between B and the butte is
(a) wheat
(b) corn
(c) maize
(d) orchard
23. The name of the State Forest is
(a) Catti
(b) Denton
(c) Kugar
(d) Bryce
214

Appenmces for Experiment 2
24. The type of agricultural activity between the canyon and the hill is
(a) wheat
(b) corn
(c) mai7.e
(d) market gardens
25. The type of agriculture at the foot of Sector Hill is
(a) scattered scrub
(b) medium scrub
(c) dense scrub
(d) rainforest
26. The type of crop grown between on the mesa is
(a) wheat
(b) corn
(c) mai7.e
(d) market gardens
27. The name of the river is
(a) Adam
(b) Jogger
(c) Burke
(d) Dawson
215

Appendices for Experiment 2
28. The name of the lake is
(a) Angel
(b) Dawson
(c) Catti.
(d) King
29. The natural feature at the base of Christies Bluff is
(a) a river terrace
(b) a talus slope
(c) acavern
(d) alake
30. The name of the cavern is
(a) Angel
(b) Dawson
(c) Catti.
(d) King
31. The name of the town atop Christies Bluff is
(a) Adam
(b) Jogger
(c) Burke
(d) Dawson
216

Appendices for Experiment 2
32. The height of Sector Hill is
(a) 16m
(b) 27m
(c) 53m
(d) not stated
3 3. The type of vegetation immediately beside the river is
(a) scattered scrub
(b) medium scrub
(c) dense scrub
(d) rainforest
217
34. The types of activities of people likely to be affected by rockfall from the butte
are
(a) agriculture only
(b) urban only
(c) both agriculture and urban
(d) none
35. The name of the butte is
(a) Adam
(b) Jogger
(c) Burlce
(d) Dawson

Appendices for Expe~nt 2
Multiple choice items for Groyps 4 and 5:
1. The number of towns in the cross section from B to C is
(a) 0
(b) 1
(c) 2
(d) 3
2. The height of the butte is
(a) 16m
(b) 27m
(c) 53m
(d) not stated
3. The average gradient from B to C is
(a) 1:270
(b) 1:750
(c) 1:1500
(d) not stated
218

Appendices for Experiment 2
4. The type of vegetation on the sides of the butte is
(a) scattered scrub
(b) scattered and medium scrub
(c) medium and dense scrub
(d) dense scrub
5. The type of natural vegetation between B and the butte is
(a) scattered scrub
(b) scattered and medium scrub
(c) medium and dense scrub
(d) dense scrub
6. The type of vegetation atop the butte is
(a) scattered scrub
(b) medium scrub
(c) dense scrub
(d) rainforest
7. The width of the floodplain is
(a) 2.0km
(b) 4.5km
(c) 5.0km
(d) 7.5km
219

Appendkes for Experiment 2
8. The type of vegetation immediately beside the lake is
(a) scattered scrub
(b) medium scrub
(c) dense scrub
(d) rainforest
9. The natural features either side of the butte at its base are
(a) a river terrace and a cavern
(b) a talus slope and a river terrace
(c) a cavern and a cliff
(d) a lake and a talus slope
10. The type of agricultural activity between B and the butte is
(a) wheat
(b) corn
(c) maize
(d) orchard
11. The name of the lake is
(a) Angel
(b) Dawson
(c) Catti
(d) King
220

Appendices for Experiment 2
12. The name of the cavern is
(a) Angel
(b) Dawson
(c) Catti
(d) King
13. The width of the mesa is
(a) 2.0km
(b) 4.5km
(c) 5.0km
(d) 7.5km
14. The types of activities of people likely to be affected by rockfall from the
butte are
(a) agriculture only
(b) urban only
( c) both agriculture and urban
(d) none
15. The name of the butte is
(a) Adam
(b) Jogger
(c) Burke
(d) Dawson
221

Appendices for Experiment 2 222
Appendix 4: Proportions correct data for students in Experiment 2
Pro.portions correct data for overlap.pin~ material for Groqp 1:
Time of trial after reading material:
Smdcot ImmediiU~ A~"klater A month later 1 .733 .533 .333
2 .333 .267 .2
3 .467 .6 .2
4 .6 .533 .533
5 .067 .2 .2
6 .2 .4 .4
7 .267 .133 .267
8 .133 .067 .2
9 .4 .133 .467
10 .4 .4 .467
11 .2 .467 .6
12 .4 .333 .333
13 .333 .333 .333
14 .867 .733 .733
15 .4 .2 .333
16 .6 .6 .333 17 .467 .533 .2
18 .4 .533 .4
19 .533 .533 .533
20 .533 .533 .6
21 .467 .333 .2
22 .533 .267 .333 23 .4 .267 .267 24 .533 .4 .267 25 .533 .467 .333 26 .467 .733 .6

AppentHces for Experiment 2 223
Pmportions correct data for overlappin& material for Group 2:
Time of trial after reading material:
S1W1S311 Immedi31' A week later Amnthlatei:
1 .267 .4 .2
2 .267 .067 .133
3 .533 .4 .467
4 0 0 .2
5 .267 .533 .4
6 .533 .533 .467
7 .4 .333 .533
8 .333 .2 .2
9 .2 .4 .267
10 .4 .267 .4
11 .733 .667 .467
12 .2 .4 .2
13 .667 .6 .6
14 .533 .533 .4
15 .2 .333 .333
16 .2 .4 .2
17 .267 .267 .333 18 .267 .333 .267
19 .467 .4 .4
20 .467 .133 .333
21 .333 .533 .067
22 .267 .267 .4
23 .2 .2 .333
24 .467 .533 .533 25 .4 .533 .2 26 .133 .2 .067

Appendices for Experiment 2 224
Proportions correct data for overlam,in& material for Group 3:
Time of trial after reading material:
Smdcot Immediil~ A~~klil~ ADJ.Qmbliltci: 1 .267 .333 .133
2 .4 .2 .267
3 .333 .267 .333
4 .4 :2 .267
5 .6 .467 .133
6 .467 .4 .267
7 .267 .533 .267
8 .867 .333 .733
9 .667 .467 .533
10 .467 .4 .2
11 .2 .133 .2
12 .667 .733 .8
13 .533 .533 .667
14 .333 .267 .333
15 .8 .867 .8
16 .467 .333 .533
17 .6 .533 .267
18 .733 .8 .6
19 .4 .133 .133
20 .333 .267 .333
21 .4 .333 .4
22 .2 .267 .333
23 .6 .6 .2
24 .667 ·.467 .267 25 .267 .467 .467
26 .467 .267 .133

Appendices for Experiment 2 225
Proportions correct data for overlappin& material for Oroyp 4:
Time of trial after reading material:
Student Immedi= A~eeklater A month la=: 1 .267 .267 .267
2 .8 .467 .6
3 .667 .8 .667
4 .533 .267 .6
5 .6 .6 .533
6 .8 .667 .4
7 .8 .733 .6
8 .867 .8 .6
9 .8 .667 .467
10 .533 .333 .6
11 .667 .467 .6
12 .6 .467 .4
13 .867 .667 .467
14 .533 .533 .333
15 .6 .6 .667
16 .667 .667 .667
17 .733 .667 .6
18 .6 .533 .6
19 .733 .667 .8
20 .533 .6 .133
21 .333 .267 .4
22 .733 .267 .467
23 .6 .533 .6
24 .667 .667 .4
25 .8 .6 .533
26 .6 .733 .533

Appendices for ExperbMnt 2 226
Pmportions correct data for overlappin& mareria1 for Groyp 5:
Time of trial after reading material:
Student Immediille A»:eekla~ A month latsa: 1 .667 .533 .4
2 .4 .533 .267
3 .733 .667 .467
4 .467 .467 .267
5 .333 .133 .133
6 .467 .4 .333
7 .2 .267 .133
8 .6 .4 .333
9 .467 .133 .067
10 .333 .133 .333
11 .667 .933 .4
12 .6 .6 .267
13 .4 .267 .133
14 .4 .2 .467
15 .467 .267 .533
16 .6 .467 .467
17 .4 .133 .133
18 .733 .533 .533
19 .533 .533 .333
20 .467 .4 .533
21 .133 .267 .2
22 .267 .4 .267
23 .4 .4 .267
24 .6 .333 .333 25 .267 .4 .2
26 .667 .4 .467

Appendices for Experiment 2 227
Unigpe material
Prqportions correct data for unigpe material for Groyp 1:
Trial jmmediatelY after readinK material Trial one week later
Student Wustration 1 Wusttation 2 lliustration 1 mustration 2 1 .4 .6 .7 .3
2 .6 .2 .5 .9
3 .3 .3 .4 .1
4 .7 .7 .6 .5
5 .7 .2 .6 .1
6 .8 .7 .4 .4
7 .1 .2 .2 .2
8 .6 .7 .5 .8
9 .5 .2 .6 .4
10 .2 0 .6 .3
11 .2 .1 .1 .1
12 .7 .2 .3 .2
13 .3 .6 .4 .2
14 .3 .5 .3 .3
15 .5 .3 .5 .5
16 .2 .4 .5 .4
17 .5 .4 .4 .3
18 .2 0 .5 .2
19 .3 .7 .3 .6
20 .7 .6 .6 .3
21 .3 .1 .2 .3
22 .4 .5 .5 .5
23 .1 .4 .1 .2
24 .5 .3 .7 .7
25 .5 .5 .1 .1
26 .4 .3 .5 .2

Appendices for Experiment 2 228
PrQportions cmxecr data for unigpe material for Groqp 2:
Trial immediatelY after readin& material Trial one week later
Student W:usimtioo 1 illustration 2 llwsimtioo l lliustmtion 2 1 .4 .2 .5 .5 2 .3 .2 .3 .3 3 .6 .7 .6 .5 4 .4 0 .3 .2 5 .2 .6 .1 .2 6 .6 .2 .2 .3 7 .3 .2 .2 .4
8 .6 .3 .3 .3 9 .6 .2 .4 .2
10 .6 .3 .5 .4
11 .2 .5 .4 .3 12 .2 .3 .5 .2 13 .1 .4 .5 .4
14 .4 .1 .2 .2 15 .4 .4 .4 .5 16 .6 .3 .5 .2 17 .3 .6 .5 .3 18 .8 .2 .2 .1 19 .3 .3 .4 .2 20 .5 .4 .5 .2 21 .5 .6 .2 .3 22 .2 .3 .3 .4
23 .5 .3 0 .4
24 0 .5 .4 .5 25 .4 .3 .5 .5 26 .5 .1 .3 .1

Appendices for Experiment 2 229
PrQportions correct data for unique material for Group 3:
Trial immed,iatel,v after reudin& material Trial one week later
Student Wustration l m:ustration 2 Dl:ustration 1 Ill:ustration 2 1 .4 .7 .2 .4
2 .4 .9 .2 .9
3 .5 .7 .3 .2
4 .6 .5 .1 .4
5 .5 .2 .3 .5
6 .2 .6 .5 .8
7 .3 .5 .4 .3
8 .4 .4 .6 .5
9 .4 .4 .4 .3
10 .1 .4 .1 .3
11 .4 .5 .4 .4
12 .3 .6 .2 .5 13 .2 .6 .4 .6 14 .6 .3 .5 .3 15 .3 .4 .2 .5
16 .6 .2 .4 .3 17 .3 .5 .2 .7 18 .4 .2 .3 0 19 .2 0 .4 .4
20 .4 .1 .2 .4 21 .1 .2 .4 .3 22 .1 .1 .3 .1 23 .5 .2 .5 .1 24 .3 .3 .3 .2 25 .2 .7 .2 .5 26 .4 .5 .4 .5

Appendices for Experiment 3 230
Appendix 5: Reading materials and multiple choice items for
Experiment 3
ILeadin& materials and multiple choice items for condition II:
60
50 H•ight
in m•tns 40
30
20
10
0
60
50 Height
in m•tres 40
30
20
10
0
A cross section from Lake Reed to Destown
Spinifex &
Morgan's Beach Reed
Lake \SLSC Reed +
100
... ~ - Destown C:::, Cirrus clouds .---~ .........
Shrubs &
Averag• gradient = 1 :10.5
200 300 400 Distance in metres
Hammond Cliff__. (41 m high)
'\Lake Carter
(29m wide)
500
A cross section from Lake Reed to Destown
C) Cum~s clou~s ... ~ - Destown C:::, Cirrus clouds .---~ .........
(- -) Shrubs & Hammond - - Cliff__. (41m high)
Morgan's Beach Reed
'\Lake 1.a1<o \ Sl.sc Rted Carter
+ Avtrag• gradi•nt • 1 :10.5 (29m wide)
100 200 300 400 500 Distance in metres

Appendkes for Experiment 3
Multiple choice items for condition II
1. The name of the SLSC
(a) Hammond
(b) Carter
(c) Reed
(d) Gottom
2. The name of the bridge is
(a) Hammond
(b) Carter
(c) Reed
(d) Gottom
3. The types of activities of people found in this area are
(a) primary industry, recreation and urban
(b) secondary industry, mining and urban
( c) secondary industry, transport and tertiary industry
(d) not stated
231

Appendices for Expe~nl 3
4. The type of vegetation atop the foredune is
(a) spinifex and marram grasses
(b) shrubs and woodlands
(c) pampas grass
( d) non existent
5. The name of the town atop the cliff is
(a) Ridley
(b) Morgan
(c) Hammond
(d) Destown
6. The name of the cliff is
(a) Ridley
(b) Morgan
(c) Hammond
(d) Destown
7. The type of clouds seen in this cross section are
(a) cimis and cumulus
(b) cumulus and stratus
(c) cumulo-nimbus
(d) not given
232

Appendices for Experil'Mnt 3
8. The horiwntal distance covered by the cross section is
(a) 200m
(b) 250m
(c) 500m
(d) 550m
9. The width of the hind dunes is
(a) 60m
(b) 80m
(c) 100m
(d) not stated
10. The vertical scale of the cross section goes to a maximum of
(a) 40m
(b) 60m
(c) 100m
(d) 180m
11. The type of natural vegetation on the right side of the hind dunes is
(a) scattered scrub
(b) spinifex and merram grasses
(c) shrubs and woodlands
(d) pampas grass
233

Appendices for Experiment 3
12. The height of the foredune is
(a) 16m
(b) 29m
(c) 38m
(d) 41m
13. The average gradient is
(a) 1:10.5
(b) 1:15.5
(c) 1:165
(d) not stated
14. The type of vegetation on the beach side of the foredune is
(a) scattered scrub
(b) spinifex and merram grasses
(c) shrubs and woodlands
(d) pampas grass
15. The number of lakes in the cross section is
(a) 1
(b) 2
(c) 3
(d) 4
234

Appendices for Experiment 3
16. The type of agriculture next to a lake is
(a) wheat
(b) corn
(c) maize
(d) orchard
17. The natural feature on the left hand side of the foredune is
(a) a hind dune
(b) ahill
(c) aplain
(d) abeach
18. The type of vegetation on the beach is
(a) spinifex and merram grasses
(b) shrubs and woodlands
(c) pampas grass
(d) non existent
19. The width of the Lake Carter is
(a) 16m
(b) 29m
(c) 38m
(d) not stated
235

Appendices for Experiment 3
20. The height of the cliff is
(a) 16m
(b) 29m
(c) 38m
(d) 41m
236

Appendices for ExperbMnt 3 237
Reudin~ materials and multiple choice items for condition I:
A cross section from Macadamia nut plantation to Kola Resort
180
160 Height
in metns 140
120
100
Average gradient= 1 :160
1.5 2 2.5 3 Distance in kilometres

Appendices for Experiment 3
Multiple choice items for condition I
1. The name of the lake is
(a) Castle
(b) Stellar
(c) Kola
(d) Pierce
2. The type of vegetation on the walls of the canyon is
(a) scattered scrub
(b) medium scrub
(c) dense scrub
(d) non existent
3. The average gradient is
(a) 1:10
(b) 1:120
(c) 1:160
(d) not stated
238

Appendices for Experiment 3
4. The type of agricultural immediately beside the mountain is
(a) wheat
(b) corn
(c) maize
(d) lucerne
5. The type of crops grown include
(a) maize and wheat
(b) wheat and corn
(c) Macadamia nuts and lucerne
(d) oats and potatoes
6. The number of towns in the cross section is
(a) 0
(b) 1
(c) 2
(d) 3
7. The type of vegetation on the side of the cliff is
(a) scattered scrub
(b) medium scrub
(c) dense scrub
(d) non existent
239
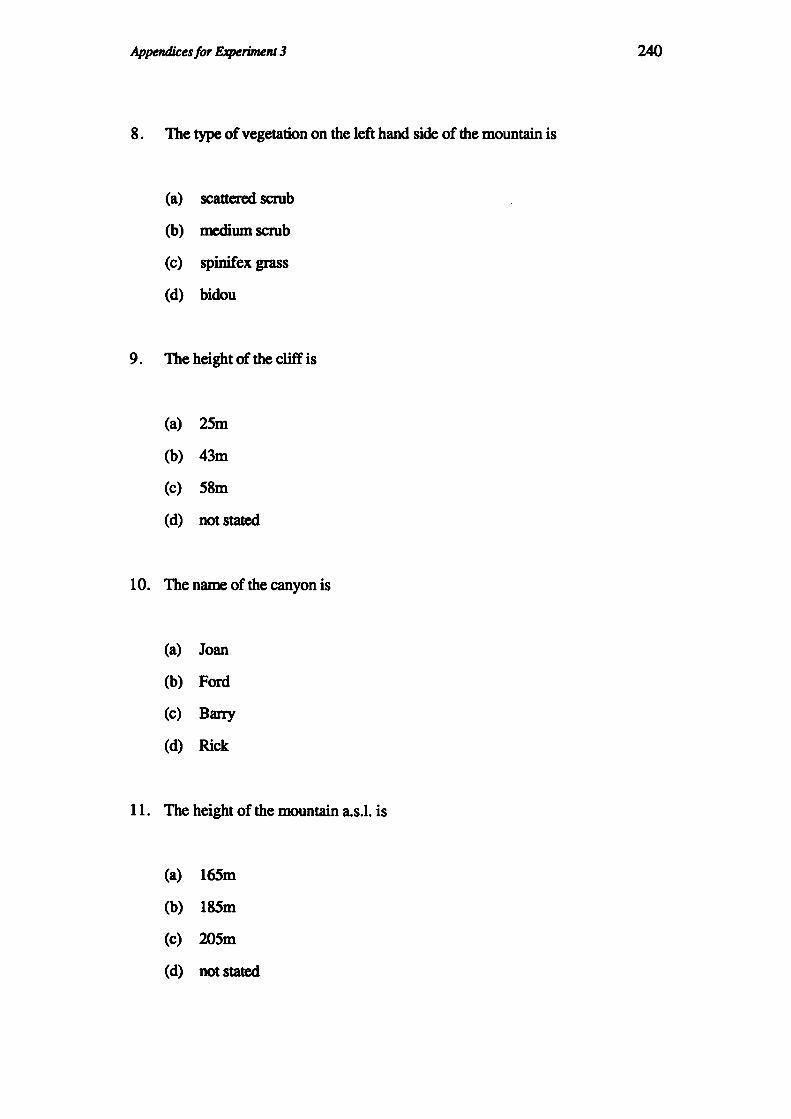
Appendices for Expe~nt 3
8. The type of vegetation on the left hand side of the mountain is
(a) scattered scrub
(b) medium scrub
(c) spinifex grass
(d) bidou
9. The height of the cliff is
(a) 25m
(b) 43m
(c) 58m
(d) not stated
10. The name of the canyon is
(a) Joan
(b) Ford
(c) Barry
(d) Rick
11. The height of the mountain a.s.l. is
(a) 165m
(b) 185m
(c) 205m
(d) not stated
240

Appendices for ExperbMnt 3
12. The position of the river in bottom of the canyon is
(a) on the right hand side
(b) on the left hand side
(c) in the centre
(d) not stated
13. The types of activities of people found in this area are
(a) primary industry and urban
(b) primary industry only
(c) secondary industry and tertiary industry
(d) not stated
14. The type of clouds seen in this cross section are
(a) cirrus
(b) cumulus
(c) nimbus
(d) not stated
15. The type of natural vegetation between the mountain and the the canyon is
(a) scattered scrub
(b) medium scrub
(c) dense scrub
(d) woodland
241

Appendices for Experiment 3
16. The name of the resort is
(a) Rick
(b) Kola
(c) Ford
(d) not stated
17. The vertical scale of the cross section goes to a maximum of
(a) 40m
(b) 60m
(c) 100m
(d) 180m
18. The name of the road adjacent to the town is
(a) Joan
(b) Ford
(c) Barry
(d) Rick
19. The type of material being emitted from the mountain is
(a) ash
(b) smoke
(c) ash and smoke
(d) ash smoke and lava
242

Appendices for Experiment 3
20. The horizontal distance covered by the cross section is
(a) 2.3km
(b) 3.5km
(c) 4.6km
(d) 5.5km
243

Appendices for Experiment 3 244
Rradinr materia,ls and multiple choice items for corutition TI:
A cross section from Josh Town to Clifton Plains
The horizontal distance covered by this cross section is 550 metres. The vertical
scale goes from Oto tiO metres. The average gradient is 1:15.5.
Josh Town is on the left hand side of the cross section. As one moves across the
cross section there is an area of corn then Janice's farmhouse. This is adjacent to
Sefter Quarry which is 10m wide and in which there is no vegetation. To the right
of the quarry is Jamison Hill which is 120 metres high. On the left hand side of
this hill there is scattered scrub and on the right hand side there is dense scrub. The
hill gives way to a plain on which woodlands are found. On the edge of this plain
is Frog Punt which crosses Colader River. To the right of the river is Clifton
Plains which are 200m wide. On these plains oats are grown and there is a
windmill which is 15m high. Stratus clouds can be seen in this cross section.
A cross section from Josh Town to Clifton Plains
The horizontal distance covered by this cross section is 550 metres. The vertical
scale goes from Oto tiO metres. The average gradient is 1:15.5.
Josh Town is on the left hand side of the cross section. As one moves across the
cross section there is an area of corn then Janice's farmhouse. This is adjacent to
Sefter Quarry which is 10m wide and in which there is no vegetation. To the right
of the quarry is Jamison Hill which is 120 metres high. On the left hand side of
this hill there is scattered scrub and on the right hand side there is dense scrub. The

Appendices for Experiment 3 245
hill gives way to a plain on which woodlands are found. On the edge of this plain
is Frog Punt which crosses Colader River. To the right of the river is Clifton
Plains which arc 200m wide. On these plains oats are grown and there is a
windmill which is 15m high. Stratus clouds can be seen in this cross section.

Appelldices for Experiment 3
Multiple choice items for condition TT
1. The type of natural vegetation between the hill and the punt is
(a) scattered scrub
(b) medium scrub
(c) rainforest
(d) woodland
2. The height of the hill is
(a) 10m
(b) 120m
(c) 200m
(d) not stated
3. The average gradient is
(a) 1:10.5
(b) 1:15.5
(c) 1:165
(d) not stated
246

Appendices for Experiment 3
4. The type of vegetation on the sides of the hill is
(a) scattered scrub
(b) scattered and dense scrub
(c) medium and dense scrub
(d) scattered and medium scrub
5. The number of towns in the cross section is
(a) 0
(b) 1
(c) 2
(d) 3
6. The type of agricultural activity on the plains is
(a) wheat
(b) corn
(c) maize
(d) oats
7. The natural feature either side of the river is
(a) a river terrace
(b) a hill
(c) aplain
(d) not stated
247
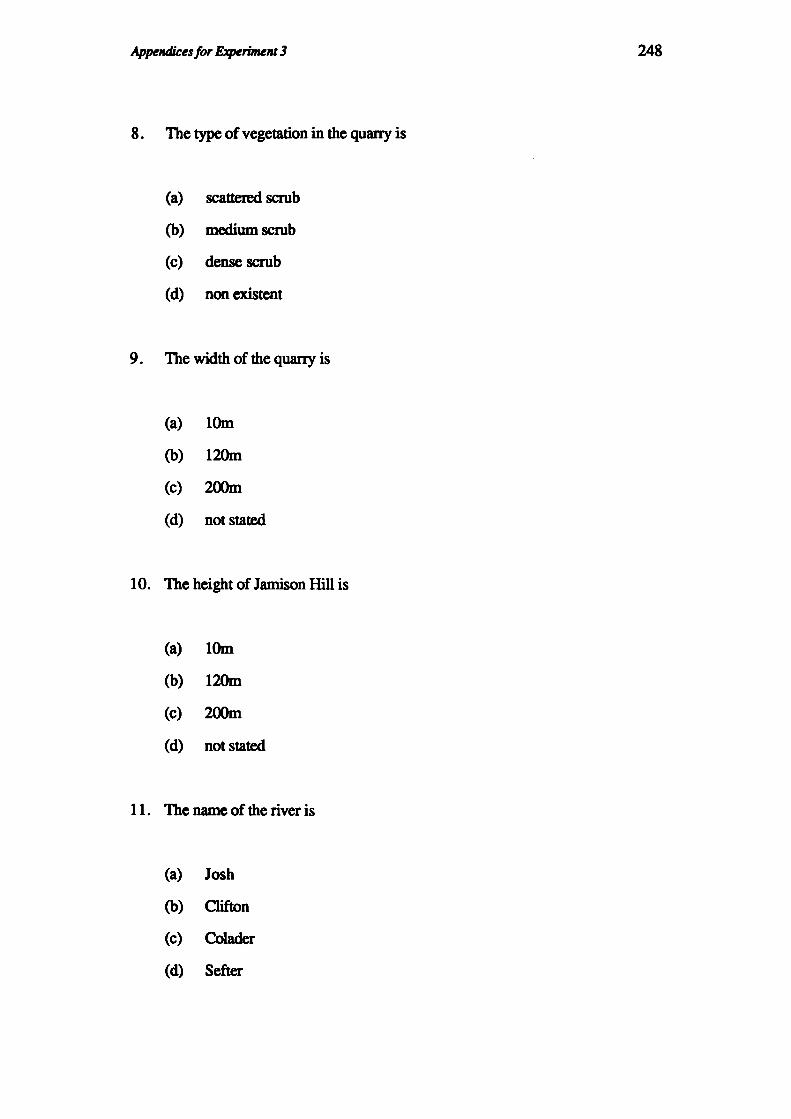
Appendices for Experiment 3
8. The type of vegetation in the quarry is
(a) scattered scrub
(b) medium scrub
(c) dense scrub
(d) non existent
9. The width of the quarry is
(a) 10m
(b) 120m
(c) 200m
(d) not stated
10. The height of Jamison Hill is
(a) 10m
(b) 120m
(c) 200m
(d) not stated
11. The name of the river is
(a) Josh
(b) Clifton
(c) Colader
(d) Sefter
248

Appendices for Experiment 3 249
12. The name of the quany is
(a) Josh
(b) Clifton
(c) Colader
(d) Sefter
13. The types of activities of people found in this area are
(a) primary industry and urban
(b) secondary industry only
( c) secondary industry and tertiary industry
(d) not stated
14. The type of vegetation atop the hill is
(a) scattered scrub
(b) medium scrub
(c) dense scrub
(d) not stated
15. The name of the fannhouse is
(a) Frog
(b) Janice
(c) Clifton
(d) not stated

Appendices for Experiment 3
16. The name of the plains where the windmill is found are
(a) Frog
(b) Janice
(c) Oifton
(d) not stated
17. The vertical scale of the cross section goes to a maximum of
(a) 40m
(b) (,()m
(c) 100m
(d) 180m
18. The horizontal distance covered by the cross section is
(a) 200m
(b) 250m
(c) 500m
(d) ·550m
19. The height of the windmill is
(a) 10m
(b) 15m
(c) 20m
(d) not stated
250

Appendices for Experiment 3
20. The type of clouds seen in this cross section are
(a) cirrus
(b) cumulus
(c) nimbus
(d) stratus
251

Appendices for Experiment 3 252
Readior materials and multiple choice items for condition T:
A cross section from Tekay Farm to sand dune
The horizontal distance covered by this cross section is 4.2km. The vertical scale
goes from Oto 180 metres. The average gradient is 1:145.
Tekay Fann grows luceme and is on the left hand side of the cross section on top
of Mt. Kaze (256m a.s.l.). As one moves across the cross section there is an area
of woodland on the side of the hill which gives way to a sugar cane field then a
pineapple plantation. This is adjacent to Barry Canyon which is 100m wide and
has dense scrub on its walls. Gwyder River is at the base of the canyon on its left
hand side. On the right hand rim of the canyon is Diamond Town which has
Massey Road to the right of it. Adjacent to the road on its right is an area of
scattered scrub which has recently experienced a mud flow. To the right of this is
George's Billabong which has a sand dune 85m high on its right covered with
bidou plant.

Appendices for Experiment 3
Multiple choice items for condition T
1. The position of the river in the canyon is
(a) on the right hand side
(b) on the left hand side
(c) in the centre
(d) not stated
2. The type of clouds seen in this cross section are
(a) cirrus
(b) cumulus
(c) nimbus
( d) not stated
3. The average gradient is
(a) 1:10.5
(b) 1:145
(c) 1:165
(d) not stated
253

Appendices for Experiment 3
4. The horimntal distance covered by the cross section is
(a) 2.3km
(b) 3.8km
(c) 4.2km
(d) 5.5km
5. The type of natural vegetation between the farm and the canyon is
(a) scattered scrub
(b) medium scrub
(c) dense scrub
(d) woodland
6. The height of the mountain a.s.l. is
(a) 145m
(b) 256m
(c) 312m
(d) not stated
7. The vertical scale of the cross section goes to a maximum of
(a) 40m
(b) rom (c) 100m
(d) 180m
254

Appendices for Experiment 3
8. The type of mass movement recently experienced near the road is
(a) soil creep
(b) mudflow
(c) land slide
(d) rock fall
9. The type of vegetation on the walls of the canyon is
(a) scattered scrub
(b) medium scrub
(c) dense scrub
(d) non existent
10. The name of the billabong is
(a) Diamond
(b) George
(c) Barry
(d) Massey
11. The height of the sand dune is
(a) 65m
(b) 85m
(c) 105m
(d) 125m
255

Appendices for Experiment 3
12. The name of the road adjacent to the town is
(a) Diamom
(b) George
(c) Bmy
(d) Massey
13. The types of activities of people found in this area are
(a) primary industry and urban
(b) secondary industry only
( c) secondary industry and tertiary industry
( d) not stated
14. The type of vegetation on the side of the hill next to the farm is
(a) scattered scrub
(b) medium scrub
(c) dense scrub
(d) woodland
15. The number of towns in the cross section is
(a) 0
(b) 1
(c) 2
(d) 3
256

Appendices for Experiment 3
16. The type of agricultural activity on the Tekay Farm is
(a) wheat
(b) corn
(c) mai2:e
(d) luceme
17. The type of crops grown include
(a) pineapples and sugarcane
(b) wheat and corn
(c) maize and luceme
(d) oats and potatoes
18. The type of vegetation on the sand dune is
(a) scattered scrub
(b) medium scrub
( c) spinifex grass
(d) bidou
19. The width of the canyon is
(a) 100m
(b) 120m
(c) 200m
(d) not stated
257

Appendices for Experiment 3
20. The name of the river in the canyon is
(a) Gwyder
(b) Bmy
(c) Kaze
(d) not stated
258

Appendices for ExperbMnt 3 259
Appendix 6: Proportions correct data for students in Experiment 3
Proportions correct data for each student
Student Text Text Illustration Illustration
B.epeat~ Qn~ R~at~ On~
1 .5 .85 .7 .85
2 .5 .45 .6 .8 3 .45 .65 .35 .55 4 .8 .6 .7 .65
5 .2 .35 .7 .75
6 .7 .55 .9 .75
7 .4 .4 .7 .65
8 .6 .85 .6 .7
9 .7 .8 .7 .45
10 .75 .3 .65 .35 11 .7 .9 .8 .8 12 .35 .45 .7 .3 13 .4 .5 .5 .65 14 .45 .8 .95 .85 15 .25 .65 .7 .7 16 .5 .8 .8 .65 17 .3 .4 .65 .65 18 .6 .7 .75 .85 19 .7 .8 .85 .85 20 .55 .7 .85 .95 21 .75 .85 .75 .95 22 .85 .75 .7 .7 23 .6 .55 .5 .75 24 .35 .65 .45 .7

Appendices for Experiment 4 260
Appendix 7: Reading materials and multiple choice items for
condition TI in Experiment 4
120
100 Htight
in mttrts 80
60
40
20
A cross section from Mt. Gerard to Tass Ocean
0
Cum. ul:us Clow
~ ~.Genrl ..I,. ICe:iwdy Hill
Ra:worest 1 Cym:hit.'s
200
Scatterel slln) Bl'llff ( 16m. q-h) ----~--.,. , Com
Lake Gtol"(ll (80m. wiae)
Avef'181 ~:at= 1:650
400 600 Distance 1n mttrts
800
A cross section from Mt. Gerard to Tass Ocean
1000
The horizontal distance covered by this cross section is 1100 metres. The vertical
scale goes from Oto 120 metres. The average gradient is 1:650.
Mt. Gerard is on the left hand side of the cross section and is covered with
rainforest. Kennedy Hill is approximately 60m high and is next to Mt. Gerard.
This hill is covered with scattered shrub. Cynthia's bluff has no vegetation on it
and is 16m high and is on the right hand side of Kennedy Hill. At the foot of the
bluff is Lake George which is 80m wide and there is a dam on right hand side of
the lake. To the right of the lake is a corn field on a gentle slope which gives way
to Grodd River. Next to the river is the town of Smithston. The town runs down
to Palm Beach which is on the shore of Tass Ocean. Cumulus clouds can be seen
over the hills and there is a cumulo-nimbus cloud over the town and the coast in
this cross section.

Appendices for Experiment 4
Multiple choice items for condition TI in Experiment 4:
1. The average gradient is
(a) 1:110
(b) 1:250
(c) 1:650
(d) not stated
2. The name of the lake is
(a) Cynthia
(b) George
(c) Kennedy
(d) Gerard
3. The height of the bluff is
(a) 10m
(b) 16m
(c) 80m
(d) not stated
261

Appendices for ExpeTUMnt 4
4. The type of vegetation on the hill is
(a) scattered scrub
(b) medium scrub
(c) dense scrub
( d) rainforest
5. The name of the bluff is
(a) Cynthia
(b) George
(c) Kennedy
(d) Gerard
6. The type of natural vegetation between the mountain and the the canyon is
(a) scattered scrub
(b) medium scrub
(c) dense scrub
(d) woodland
7. The number of towns in the cross section is
(a) 0
(b) 1
(c) 2
(d) 3
262

Appendices for Experiment 4
8. The name of the beach is
(a) Cynthia
(b) Tass
(c) George
(d) Palm
9. The vertical scale of the cross section goes to a maximum of
(a) 60m
(b) 120m
(c) 180m
(d) 200m
10. The name of the ocean
(a) Cynthia
(b) Tass
(c) George
(d) Palm
11. The main types of activities of people found in this area are
(a) farming and urban
(b) secondary industry and service industries
(c) mining and recreation
(d) not stated
263

Appendices for Experiment 4
12. The type of cloud over the coast is
(a) cumulus
(b) cumulo-nimbus
(c) stratus
(d) nimbo-stratus
13. The river is between
(a) a corn field and a town
(b) two hills
(c) a plain and a hill
(d) none of the above
14. The type of agricultural on the slope is
(a) wheat
(b) corn
(c) maize
(d) luceme
15. The horizontal distance covered by the cross section is
(a) 550m
(b) 1100m
(c) 2200m
(d) not stated
264

Appendices for Experiment 4
16. The name of the mountain is
(a) Cynthia
(b) George
(c) Kennedy
(d) Gerard
17. The type of vegetation on the bluff is
(a) scattered scrub
(b) medium scrub
(c) dense scrub
(d) non existent
18. The width of the lake is
(a) 10m
(b) 16m
(c) 80m
(d) not stated
19. The type of cloud above the hills are
(a) cumulus
(b) cumulo-nimbus
(c) stratus
(d) nimbo-stratus
265

Appendices for Experiment 4
20. The type of crops grown include
(a) mai7.e and wheat
(b) wheat and corn
(c) corn only
(d) wheat only
266

Appendices for Experiment 4 267
Appendix 8: Proportions correct data for students in Experiment 4
Proportions COITeCt data for trial done immediately after reading materials in
Experiment 4:
Student: Text Text illustration illustration illustration
Rsa,eated Once Rca,eated Once &Text 1 .15 .8 .75 .75 .6
2 .75 .85 .8 .85 .9
3 .45 .4 .65 .75 .8
4 .6 .6 .65 .3 .25
5 .25 .6 .5 .5 .65
6 .65 .9 .95 .95 .95
7 .7 .55 .95 .9 .85
8 .95 .85 .9 .8 .9
9 .35 .7 .55 .55 .65
10 .75 .9 .8 .9 .95
11 .6 .8 .7 .8 1
12 .75 .75 .55 .25 .7
13 .65 .65 .7 .75 .6
14 .55 .5 .45 .5 .6
15 .5 .25 .5 .7 .65
16 .7 .55 .4 .8 .9
17 .55 .65 .9 .65 .85
18 .9 .7 .75 .9 .9
19 .4 .7 .4 .25 .55
20 .6 .45 .65 .9 .8 21 .3 .25 .2 .6 .7 22 .9 .55 .85 .55 .85 23 .8 .75 .9 .95 .9 24 .55 .7 .8 .6 .8 25 .7 .8 .8 .75 .65

Appendices for ExperbMnt 4 268
Proportions COll'CCt data for trial done one week after reading materials in
Experiment 4:
Student: Text Text illustration illustration illustration
R~ Once Rca,eated Once &Text 1 .35 .25 .35 .35 .3
2 .3 .3 .3 .15 .2
3 .2 .25 .25 .2 .15
4 .3 .15 .2 .35 .25
5 .3 .2 .3 .2 .25
6 .65 .55 .3 .55 .8
7 .45 .15 .45 .45 .25
8 .7 .5 .25 .2 .25
9 .1 .45 .45 .55 .25
10 .5 .7 .6 .55 .55
11 .4 .5 .4 .4 .4
12 .5 .3 .3 .4 .4
13 .35 .7 .45 .35 .45
14 .25 .3 .3 .05 .3
15 .35 .05 .25 .2 .2
16 .3 .5 .5 .35 .5
17 .55 .45 .35 .6 .5
18 .35 .05 .15 .35 .45
19 .4 .35 .2 .35 .35
20 .2 .5 .3 .35 .3
21 .25 .15 .2 .1 .2
22 .55 .5 .35 .55 .45
23 .7 .55 .65 .6 .5
24 .45 .3 .05 .3 .2
25 .1 .25 .3 .25 .1

Appendices for Experiment 4 269
Proportions correct data for trial done one month after reading materials in
Experiment 4:
Student: Text Text illustration illustration illustration
Rca,eated Once Re,peated Once &Text 1 .5 .5 .4 .4 .25
2 .3 .25 .4 .25 .3
3 .25 .25 .15 .2 .45
4 .2 .1 .15 .2 .3
5 .45 .4 .3 .3 .3
6 .3 .35 .25 .2 .2
7 .45 .25 .45 .35 .4
8 .8 .6 .55 .3 .25
9 .3 .35 .5 .25 .25
10 .5 .45 .4 .6 .35
11 .3 .25 .3 .3 .3
12 .35 .35 .45 .4 .35
13 .5 .4 .55 .4 .35
14 .4 .25 .35 .3 .1
15 .2 .35 .45 .3 .3
16 .45 .35 .45 .35 .4
17 .35 .4 .6 .4 .65
18 .45 .45 .35 .4 .45
19 .4 .15 .15 .2 .35
20 .3 .35 .25 .2 .15
21 .25 .15 .15 .3 .25
22 .4 .55 .4 .4 .35
23 .55 .65 .55 .55 .55
24 .2 .15 .35 .25 .35
25 .3 .45 .2 .2 .45

Appendices for Experiment 5 270
Appendix 9: Reading materials and multiple choice items for
Experiment 5
Material A used in &periment 5:
Students were given either the text below twice (TT) or once (T) or the illustration
twice (II) or once (I) or the combined format shown {TI)
WHAT IS THE HYDROSPHERE?
As can be seen in Figure 1 the water cycle is driven by the radiant energy of the sun
and has no beginning or end. There are a number of processes that are important.
Precipitation refers to the falling of water in the form of rain, snow, hail or dew.
Precipitation can only occur after condensation has taken place. This is the transfer
of moisture from a vapour to a liquid. Clouds are the visible result of the process
of condensation. Precipitation may occur after clouds have formed and it results in
water returning to the earth and is influenced by movements of air in the
atmosphere. Water can be intercepted before it reaches the ground by vegetation.
When water reaches the ground it may run over the surface (overland flow) or be
absorbed (infiltrate) into the soil. Water may be stored on the ground surface in a
depression storage. Water infiltrating into the soil may pass through the
unsaturated zone in the ground and into the saturated zone. The water table is the
dividing line between the unsaturated zone and the saturated zone. The downward
movement of water in the saturated zone is called percolation. Water stored under
the ground surface is called groundwater. Some of the groundwater may move
laterally to return to a water body such as a stream. The flow of water in the
unsaturated zone which moves laterally towards a water body such as a stream is
called interflow. The layers of rock in the lithosphere will influence the amount and

271 Appendices for Experiment 5
flow of groundwater. Some of the water stored in depression storages on the ground surface evaporates whilst some of this water may infiltrate into the ground. Interception of some precipitation by vegetation may stop some of the precipitation from reaching the ground. Water may evaporate (turn into a vapour) from any water surf ace on the earth. It is also transpired from plants and animals into the atmosphere. Less than 1 per cent of water is either on the ground or below the
surface.
in1en:e0aon
9Ya00ra:!IOn
F19u,. 1: The ·.ano cnase at the wa• cyc:le
Please note: The multiple choice items for Material A may be found in Appendix 1

Appendices for Experiment 5 272
Material B used in &periment 5
Students were given either the text below twice (TI') or once (T) or the illustration
twice (II) or once (I) or the combined format shown (TI)
A cross section from A to C
The horizontal distance covered by this cross section is 15km. The vertical scale
goes from O to 60 metres. The vertical exaggeration is 100. The average gradient
from point A to point B, a distance of 7.5km is 1:215. The average gradient from
point B to point C, a distance of 7 .5km is 1:750.
Point A and Jogger Town are atop Christies Bluff which rises 27m above the river
terrace below. About half of the river terrace is covered with medium scrub and an
orchard occupies the remainder. There is then a slope down to the flood plain.
Dense scrub covers this slope. Adam Town is found on the left hand side of this
floodplain adjacent to Burke River. On the right hand side of Burke River is a
slope covered in medium scrub. This gives way to a river terrace.
Point B is on the left hand side of the river terrace on which wheat is grown. The
overall width of the floodplain is 4.5 km. Dawson Butte rises to a height of 16m
above the river terrace. A remnant rainforest is found atop the butte and scattered
scrub on its left hand slope and no vegetation on its right hand slope. At the base
of the right hand slope is Angel Cavern. There is then an area of medium scrub
before King Lake. This lake's right hand side gives way to Catti Mesa. The left
hand slope of the mesa is covered with medium scrub. Com is grown atop the
mesa which measures 2km in width overall. Point C is halfway across the mesa.

Appendices for ExperilMnt 5
Height in
metres A
60 Jogger
40
30
20
10
o
1;...,n
Christies Bluff (27m)
3
A cross section from A to C
lf-Floodplai n ( 4.5km) ~
6 9 Di3tance in kilome1res
Vert;cal exaggeration = 1 00
12
273
Catti
"-2km overall
15
Average gradient from B to C = 1 :750 Average gradient from A to B = 1 :21 5
Please note: The multiple choice items for Material B may be found in Appendix 3

Appendices for Experiment 5 274
Material C used in &periment 5
A cross section from Mt. Gerard to Tass Ocean
The horizontal distance covered by this cross section is 1100 metres. The vertical
scale goes from Oto 120 metres. The average gradient is 1:650.
Mt. Gerard is on the left hand side of the cross section and is covered with
rainforest. Kennedy Hill is next to Mt. Gerard and is covered with scattered shrub.
Cynthia's bluff is 16m high with no vegetation on it and is on the right hand side of
Kennedy Hill. At the foot of the bluff is Lake George which is 80m wide and there
is a dam on the lake. To the right of the lake is a corn field on a gentle slope which
gives way to Grodci River. Next to the river is the town of Smithston which runs
down to Palm Beach which is on the shore of Tass Ocean. Cumulus clouds can be
seen over the hills and cumulo-nimbus cloud is over the coast in this cross section.

Appendkes for Experiment 5
120
100 H•;9ht
in m•tns 80
60
40
20
A cross section from Mt. Gerard to Tau Ocean
0
i,.Gmrt .S, ICe:iway Hill
Ramfor1st 1 CYJlllm's
200
Sc1tter1a s:bn) Bl'llff ( 16a Jua'h)
-.· ~ .. .,. " Cori
Like Geo,ve (80a -we)
Awnge IJ"Amlll = 1:650
400 600 D;sbnc• ,n m•tres
800
275
1000
Please note: The multiple choice items for Material C may be found in Appendix 7

Appendices for Experiment 5 276
Material D used in Ea,eriment 5
A cross section from Lake Reed to Destown
The horizontal distance covered by this cross section is 550 metres. The vertical
scale goes from Oto ro metres. The average gradient is 1:10.5.
Lake Reed is on the left hand side of the cross section next to Morgan's Beach on
which Reed SLSC is built. A foredune 38m high is adjacent to this and on its
seaward side has spinifex and merram grass and on top and on its landward side
has shrubs and woodland. Hind dunes 100m in width are on the right hand side of
the foredune and these are covered with pampas grass. Gottom Bridge is to the
right of these and it is over Lake Carter which is 28m wide. On the other side of
the lake is Wide Highway which has to its right wheat growing. This gives way to
Ridley Town which is situated at the base of Hammond Cliff which is 41m high.
Atop the cliff on the right hand side of the cross section is Destown. Cumulus and
cirrus clouds can be seen in the cross section.

Appendices for Experiment 5 277
A cross section from Lake Reed to Destown
(::) Cumu~us cl~s .. =-- - Desto'W'n C:::::, Cirrus clouds
60 ,,,,.,.-----(- -) Slv-ubs & Hammond
50 - - Cliff-4 H.ight (41 m high)
in metns 40
30
20 Morgan's Beach Reed
'\Lake '-*•\SI.SC 10 Reed Carter
+ Average gradient = 1 :10.5 (29m 'Wide)
0 100 200 300 400 500 Distance in metres
Please note: The multiple choice items for Material D may be found in Appendix 5

Appendices for Experiment 5 278
Material E used in &periment 5
A cross section from Macadamia nut plantation to Kola Resort
The horimntal distance covered by this cross section is 3.5 kilometres. The vertical
scale goes from Oto 180 metres. The average gradient is 1:160.
Macadamia nut plantation is atop a hill on the left hand side of the cross section.
The hill has dense scrub on its slope. To the right of this is a maze crop followed
by a wheat crop which gives way to scattered scrub on the side of Mt Stellar which
is 165m a.s.l. and 200m wide. Smoke and ash are issuing from the top of this
mountain. On the right hand slope is a woodland which falls away to Ford Canyon
which has scattered scrub on its walls. Castle River is in the base of the canyon on
its right hand side. Adjacent to the canyon is Cess Town and to the right of this is
Rick Hwy. Lake Pierce is the next feature to the right and this is at the base of
Joan's Cliff which is 43m high. Atop the cliff is Kola Resort on the right hand side
of the cross section.

Appendices for Experiment 5
A cross section from Macadamia nut plantation to Kola Resort
Height in
180
metres 140
120
100
Average gradient= 1 :160
1.5 2 2.5 3 o;stance ;n knometns
279
Please note: The multiple choice items for Material A may be found in Appendix 5

Appenmces for Experiment 5 280
Appendix to: Proportions correct data for students in Experiment 5
Format
Student ll I ll I TI
1 .5 .75 .8 .6 .75
2 .15 .35 .25 .25 .35
3 .3 .55 .35 .7 .75 4 .45 .6 .75 .75 .7
5 .75 .35 .65 .4 .5
6 .6 .75 .85 .75 .55
7 .75 .8 .75 .6 .95
8 .45 .3 .4 .6 .55
9 .35 .35 .45 .5 .6
10 .2 .55 .6 .35 .45
11 .4 .25 .25 .3 .45 12 .35 .3 .6 .7 .75
13 .25 .5 .25 .25 .2
14 .15 .55 .35 .5 .65
15 .5 .35 .5 .45 .6 16 .6 .3 .7 .6 .85 17 .2 .35 .3 .65 .45 18 .6 .55 .45 .55 .5
19 .5 .7 .65 .7 .85 20 .15 .35 .5 .7 .65 21 1 .15 1 .6 .95 22 .4 .8 .5 .7 .8 23 .3 .4 .85 .45 .75 24 .25 .1 .3 .45 .3 25 .25 .15 .2 .25 .3

Appendices for Experiment 6 281
Appendix 11: Reading materials for Experiment 6
Brading materials for Experiment 6: Combined 1
A cross section from Lake Reed to Destown
C:) Cumu:.,us cl~s .. =-- - Destown c=::, Cirrus clouds
60 ,-----""-
(- -) Shrubs & Hammond 50 - - Cliff--4
H•ight (41m high) in
metres 40
30
20 Morgan's BHch RHd
'\Lake u1co \Suic 10 RHd Carter
+ Averag• gradient = 1 :1 0.5 (29m wide)
0 100 200 300 400 500 Distance in metres

Appendices for ExperimJ!nt 6 282
Reodin& materials for E,weriment 6; Split 1
60
50
40
30
20
10
0
A cross section from Lake Reed to Destown
C) 6 c:-_----:,
<-- -) -
1
100 200
Key:
1. LakeReed
2. Morgan's Beach
3. ReedSLSC
4. Spinifex & marram grasses
S. Foredune (38m high)
6. Cumulus clouds
7. Shrubs & woodland
8. Pampas grass
9. Gottom Bridge
10. Hind dunes (100m wide)
11. Lake Carter (29m wide)
12. Wide Highway
13. Wheat
14. Ridley Town
15. Hammond Cliff (41m high)
16. Destown
17. Cirrus clouds
=--- 16 c=:::, 17 .--- --- .........
15
12 14--10 ~ 11
300 400 500
Vertical scale: Height in metres
Horizontal scale: Distance in kilometres
Average gradient= 1:10.S

Appendices for Experiment 6 283
Readin& materials for EXPC{iment 6; Combined 2
A cross section from Macadamia nut plantation to Kola Resort
180
160 H•ight
in metr•s 140
120
100 scrub
"-Castle Riv•r
1.5 2 2.5 Distanc• in kilometres
Kola R.sort
Joan's '. Cliff---+ (43m high)

Appendices for Experiment 6 284
Readin& materials for E2ijleriment 6; Split 2
A cross section from Macadamia nut plantation to Kola Resort
180
160
140
120
100
16
15
12
10
9 "-11
1 1.5 2 2.5
Key:
1. Macadamia nut plantation 12. Cess Town
2. Dense scrub 13. RickHwy
3. Maize 14. Lake Pierce
4. Wheat 15. loan's Cliff (43m high)
5. Scattered scrub 16. Koala Resort
6. Smoke & ash
7. Mt. Stellar (165m a.s.l. & 200m wide)
8. Woodland
9. Scattered scrub
10. Ford Canyon
11. Castle River
Vertical scale: Height in metres
Horizontal scale: Distance in kilometres
Average gradient = 1: 1 (i()
Please note: The multiple choice items for the reading materials used in
Experiment 6 may be found in Appendix 5 conditions II and I.

Appendices for Experbru!nt 6 285
Appendix 12: Proportions correct data for students in
Experiment 6
Proportions correct data on all questions for each student in each of the three trials:
Student Onlerrl. Trial 1 Trial 2 Trial 3
Presenfadgn* Camhio,d S12lh Camhio,d S:12lil Camhin~ S:12lil 1 S1 C2 .8 .6 .85 .75 .95 .6
2 S1 C2 .75 .85 .85 .9 .75 .45
3 S1 C2 .45 .3 .4 .35 .15 .15
4 S1 C2 .95 .55 1 .9 .8 .6
5 S1 C2 .45 .5 .25 .15 .25 .25
6 S1 C2 .55 .5 .5 .55 .5 .2
7 S1 C2 .75 .8 .8 .8 .65 .55
8 S1 C2 .8 .75 .75 .8 .85 .65
9 S1 C2 .4 .45 .35 .45 .4 .3
10 S1 C2 .3 .5 .5 .45 .25 .3
11 S1 C2 .7 .65 .75 .8 .55 .45
12 C2 S1 .75 .45 .75 .6 .65 .2
13 C2 S1 .75 .45 .75 .8 .6 .65
14 C2 S1 .8 .45 .85 .8 .7 .35 15 C2 S1 .85 .75 .9 .85 .55 .6 16 C2 S1 .85 .55 .9 .65 .6 .25
17 C2 S1 .4 .5 .95 .65 .4 .3 18 C2 S1 .6 .55 .2 .2 .2 .3 19 C2 S1 .6 .45 .65 .55 .55 .75 20 C2 S1 .7 .85 .7 .85 .65 .6 21 C2 S1 .75 .65 .7 .35 .4 .35 22 C2 S1 .7 .55 .9 .75 .65 .85
• Sl, S2, Cl and C2 refer to Material 1 split, Material 2 split, Material 1 combined
and Material 2 combined respectively.

Appendices for Experiment 6 286
Proportions correct data on all questions for each student in each of the three trials
in Experiment 6 continued:
Student Onb'd Trial 1 Trial 2 Trial 3
Presenla&ion* Cgmbiocd SPlil Cgmbiocd Split C!Jmbincd Split
23 Cl S2 .8 .7 .65 .7 .65 .5
24 Cl S2 .55 .6 .5 .85 .3 .2
25 Cl S2 .65 .75 .95 .95 .5 .65
26 Cl S2 .35 .6 .6 .4 .15 .75
27 Cl S2 .85 .85 .95 .95 .9 .75
28 Cl S2 .85 .8 .85 .8 .65 .55
29 Cl S2 .55 .65 .85 .85 .75 .3
30 Cl S2 .5 .75 .7 .55 .35 .45
31 Cl S2 .9 .65 .95 .9 .9 .15
32 Cl S2 .45 .5 .6 .65 .2 .55
33 Cl S2 .75 .8 .95 .8 .75 .6
34 S2 Cl .45 .35 .35 .5 .35 .2
35 S2 Cl .85 .8 .75 .95 .55 .2
36 S2 Cl .7 .45 .6 .7 .6 .55
37 S2 Cl .75 .8 .7 .9 .35 .75
38 S2 Cl .65 .5 .7 .65 .35 .6
39 S2 Cl .8 .8 .95 .95 .85 .65
40 S2 Cl .6 .7 .55 .8 .55 .45 41 S2 Cl .65 .3 .7 .6 .2 .55
42 S2 Cl .6 .65 .85 .45 .8 .55
43 S2 Cl .6 .65 .8 .8 .45 .2 44 S2 Cl .8 .6 .9 .7 .55 .55
* Sl, S2, Cl and C2 refer to Material 1 split, Material 2 split, Material 1 combined
and Material 2 combined respectively.

• ..:_,_ &: tut it~ms for &penmenu 1• 8 &: 9 R~ading mtJll!rlUIJ 287
Appendix 13: . I nd test items for Experiments 7' Reading mater1a s a .
8 and 9
Material 1 combined wesematlon usr,d in Experiments 7, 8 and 2:
Tabll
. . -. - . .. - .• -cli:lllal IY jca ,r .
A,,. ,.,, F
Jatm's pier 111d ~
, ,
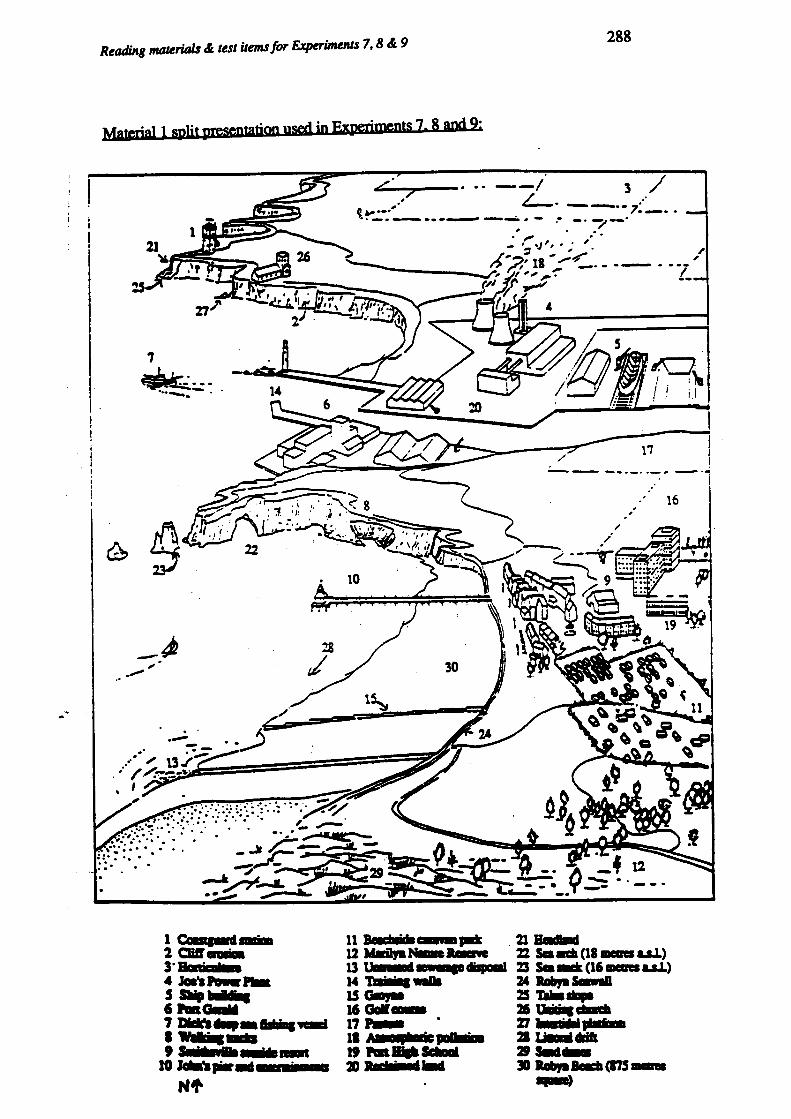
I . ! ! i I i
. I
Readi.ng materials &: test items for Experiments 7, 8 &: 9 288
Matqial 1 m)it izresentation used in Experiments 7, 8 and 9=
7
~-·--------.._ ..
/ li
------·--,,,.-----~
__ JJ ,,, _.,,
..
--
1 c.omsa11 ..... 2Clilflllllila 3"Baniaalla ,_._,__,_ S Sllipblf I , ... ....
/
71*k'a ........ ... ......... '' ........... ... lOJala'lpilrad · ,..
' .
11 I :hi+..,.,- 21 B...,,, 12 MailJIINlla-1 we 22 S.lft:ll(ll-u.L) 13 Uall I f •• ....... 23 S.8-*(16-uJ.) 14 1l•a . I~ 24 ..,_ Slawlll 150.,. %STmllapa 16 Galf-- 26 Ulilils dlln:la 17 ,_ 27 J ·,: pi I a 11 A q• i:,C ·22 21 UaaldJifl 19 ..... Sdlaal 2' ..... 20 le I . dlllld 30 ...,.lacla(l75--....

Reading materials cl test items for Experiments 7, 8 cl 9
Muhjple choice items for EXl}Criments 7, 8 and 2; Material 1
1. The church building belongs to which denomination?
(a) Anglican
(b) Catholic
(c) Presbyterian
(d) Uniting
2. The name of the pier is
(a) Robyn's
(b) George's
(c) John's
(d) Clair's
3. A type of human activity nQ1 shown in the diagram is
(a) mining
(b) fishing
(c) fanning
( d) processing
289

Reading materials & test items for Experiments 7, 8 & 9
4. The exact type of vegetation on the sand dunes is
(a) spinifex and merram grasses
(b) shrubs and woodlands
(c) grasses and trees
(d) not named
5. The cultural feature above the talus slope is
(a) a factory
(b) achurch
(c) a coast guard station
( d) a lighthouse
6. The main purpose of the training walls is to
(a) reduce the effects of wave activity
(b) reduce siltation due to longshore drift
(c) provide good fishing spots
(d) extend port facilities
7. Erosional coastal features shown in the diagram include
(a) a beach, sand dunes and a talus slope
(b) a sea arch, a sea stack and a rock platform
(c) a cave, a blowhole and cliffs
(d) an offshore bar, bays and a mudflat
290

Reading materials &: test ilems for Experiments 7, 8 &: 9
8. The approximate number of people living in the area shown in the diagram
would be:
(a) 50
(b) 500
(c) 5000
(d) 50000
9. The name of the caravan park is
(a) Beachside
(b) Oair
(c) Smithsville
( d) not stated
10. The sewage outlet
(a) is located towards the northern end of the beach
(b) is located towards the southern end of the beach
(c) is located in the middle of the beach
(d) disposes effluent in deep sea
11. Littoral drift is moving sand
(a) north-west
(b) north-east
(c) south-west
(d) south-east
291

Reading materials & test items for Experiments 7, 8 & 9
12. The height of the sea stack is
(a) 16m
(b) 18m
(c) 25m
(d) not stated
13. The horticulture is located in the
(a) north-west quarter of the diagram
(b) north-east quarter of the diagram
(c) south-west quarter of the diagram
(d) south-east quarter of the diagram
14. The name of the nature reserve is
(a) Joe
(b) Jim
(c) Robyn
(d) Marilyn
15. The main land use on the reclaimed land is
(a) port facilities
(b) factories
(c) housing
(d) recreation
292

Reading materials cl test items for Experiments 7, 8 cl 9
16. Atmospheric pollution in the diagram is mainly the result of the
(a) lighthouse
(b) port facilities
(c) shipyards
(d) powerplant
17. The features on the beach made by people are
(a) a pier and a sewage outlet
(b) a pier, a groyne and a sewage outlet
(c) a pier, a groyne, a seawall and a sewage outlet
(d) a pier, a groyne, a seawall, a lighthouse and a sewage outlet
18. The area of the beach is
(a) 550 metres square
(b) 675 metres square
(c) 750 metres square
( d) 87 5 metres square
19. The buildings in the town are mainly shops and
(a) detached houses
(b) detached houses and home units
(c) terraces
(d) terraces and home units
293

Reading materials &: test items for Experiments 7, 8 &: 9
20. The coast guard station is
(a) on a headland
(b) the most seaward cultural feature on land
(c) located at the entrance to Port Gerald
(d) adjacent to the lighthouse
True/False:
294
On the Answer sheet provided write True or False in the space provided for each
statement indicating whether you believe the statement is true or false
21. The sea arch is seaward of the stack
22. The nature reserve is north of the golf course
23. The difference in height between the sea stack and the sea arch is 4 metres
24. The name of the high school is Port
25. The fishing vessel is heading back into port
26. The land use around the port is mainly industrial
27. The caravan park is closer to the beach than the town
28. Shipbuilding is the only secondary industry shown in the diagram
29. The person after whom the beach is named is the same as the seawall
30. The rock platform is between the low tide mark and the high tide mark

Coaslal Zone
- -- ' I I I I
,-· - ·-- ---- Shmcli11c 1trog1mh11io11 . ·- .. ----···---- ------\ ,~,_..,.; I I I
14- Inshore ion• ~ 4-Fcnlhoro...,,l:Bacb'ue ¥ Uunc sys1,·111
I - I ....
..... I .
I I
Power's SLSC
I I lnclpcnaro.mune ...
Cukmiling 1,la111s -l'-lti11ifoll & mcmun grasses
F'oretlunc
U1c beach 1ys1cm consis1s of lhc longsliorc bar, lhc beach & lhc fore.dune
I >uncs rcprc.~n& previous berms which have been Slabilil.cd a11d built Ul'IIHI bj addi1ional windblown sand
I I A-§
1· ~ ,
f :-a 0o A'O
!i
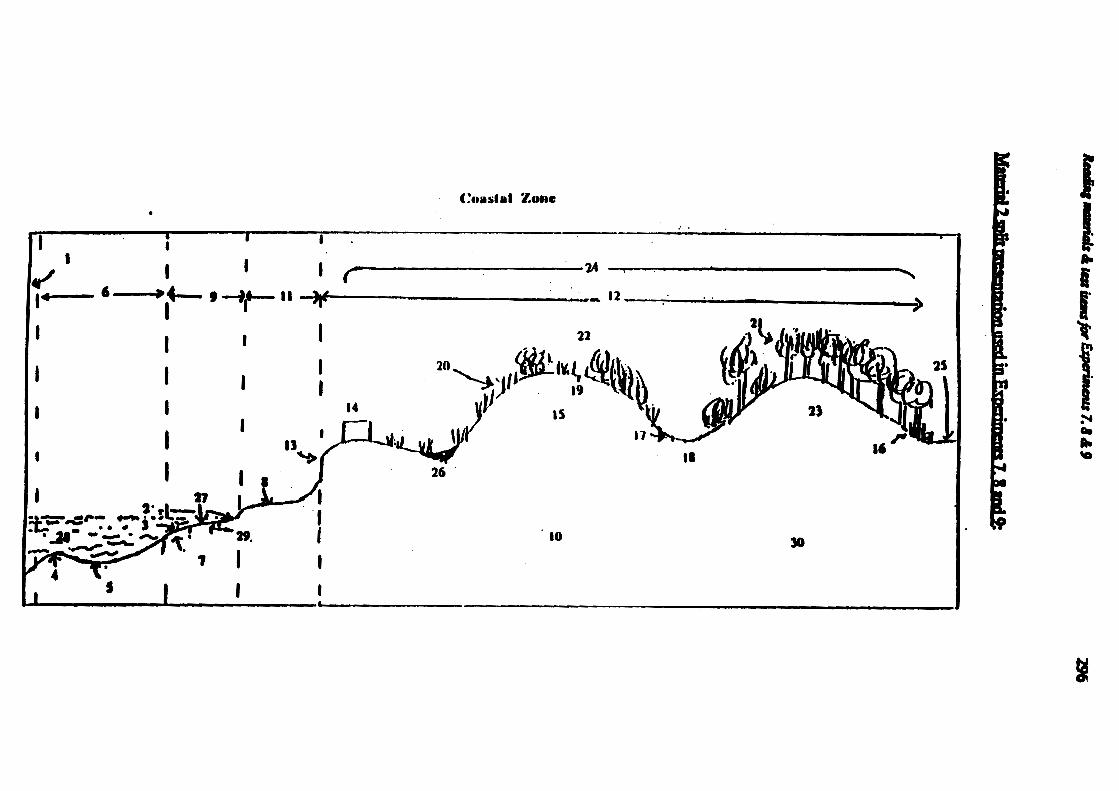
Mm
W 1 m
ltmsn'ldm
mt ia Em
mrn:,ns ta
al 9;
-i s -• - ;,t ~ =
. ' w
..
N
-
--
---t -
-..
-_
j_ -
--
--
l •
--.._l _ -
-
--

Reading materials & test items for Experiments 7, 8 & 9
Key:
l Offshore zone 11 Backshore zone
2 Average high tide level 12 Dune system
3 Average low tide level 13 Incipent (<redone
4 Longshore bar 14 Power's SLSC
5 Longshore trough 15 Foredune
6 Inshore zone 16 Rick's Caravan Park
7 Low tide terrace 17 Bidou plants
8 Berm 18 Swale
9 Foreshore rone 19 Trail
10 The beach system consists 20 Colonizing plants -
of the longshore bar, the spinifex & merram
beach & the foredune grasses
w.-
297
21 Banksia & eucalyptus trees
22 Tea tree & grevillea shru~
23 Samoa Dune (30 metres high)
24 Shoreline progradation
25 George's Highway
26 Carolyn Swamp
27 Palm Beach
28 Kim's Sea
29 Cut & fill as a result of
destructive & constructive waves
30 Dunesrepresentprevious
berms which have been
stabilized and built upon by
additional windblown sand

Reading materials & test items for Experiments 7, 8 & 9
Mnltjple choice items for Experiments 7, 8 and 9: Material 2
1. The feature shown in the backshore zone is the
(a) beach
(b) berm
(c) foredune
(d) sand dunes
2. The name of the sea is
(a) Rick's
(b) Samoa's
(c) George's
(d) Kim's
3. Human activities found in this area include recreation and
(a) sand mining
(b) transport
(c) houses
(d) manufacturing
298

Reading materials &: test items for Experiments 7, 8 &: 9
4. The type of vegetation on the incipent foredune is
(a) spinifex and merram grasses
(b) shrubs and woodlands
(c) grasses and trees
(d) not indicated
5. The natural feature landward of the beach is a
(a) low tide terrace
(b) sand dune
(c) swamp
(d) berm
6. The diagram shows the dune system to be an area of
(a) denundation
(b) progradation
(c) erosion
(d) weathering
7. A feature beside the swamp is a
(a) hind dune
(b) incipent foredune
(c) beach
(d) low tide terrace
299

Reading materials cl test items for Ezperiments 7, 8 cl 9
8. The name of the beach is
(a) Power
(b) Rick
(c) Fred
(d) Palm
9. The colonizing plants are
(a) spinifex and merram grasses
(b) bidou
(c) banksia and eucalyptus trees
(d) tea trees and grevillea shrubs
10. The SLSC is built
(a) on the beach
(b) on the benn
(c) on the incipent foredune
(d) on the foredune
11. The type of vegetation in the swale is
(a) spinif ex and merram grasses
(b) bidou
(c) banksia and eucalyptus trees
(d) tea trees and grevillea shrubs
300

Reading materials &: test items for Experiments 7, 8 &: 9
12. The height of the foredune is
(a) 15m
(b) 25m
(c) 30m
(d) not stated
13. Constructive and destructive waves cause
(a) weathering
(b) erosion
(c) aggradation
(d) cut and fill
14. The name of the road is
(a) Power's
(b) Palm's
(c) Fred's
(d) George's
15. A feature immediately adjacent to the beach is a
(a) longshore bar
(b) low tide terrace
(c) incipent foredune
(d) SLSC
301

Reading materials &: test items for Experiments 7, 8 &: 9
16. The inshore zone consists of
(a) a longshore bar and longshore trough
(b) a longshore bar, longshore trough and a low tide terrace
(c) alongshore bar, longshore trough, a low tide terrace and a beach
(d) alongshore bar, longshore trough, a low tide terrace, a beach and
abenn
17. The areas sand moves between in the beach system are
(a) the foredune, the beach and the longshore bar
(b) the beach, the benn and the foredune
(c) the longshore bar, the beach and the dune system
(d) the beach, the incipent foredune and the offshore zone
18. The vegetation on the sand dune next to the road is
(a) spinifex and merram grasses
(b) bidou
(c) banksia and eucalyptus trees
(d) tea trees and grevillea shrubs
19. The backshore mne is adjacent to
(a) the inshore mne
(b) the dune system
(c) the low tide terrace
(d) offshore zone
302

Readi.ng materials &: test items for Experiments 7, 8 &: 9
20. The average high tide level occurs on
(a) the beach
(b) the berm
(c) the low tide terrace
(d) the incipent foredune
True/False:
303
On the Answer sheet provided write True or False in the space provided for each
statement indicating whether you believe the statement is true or false
21. The foredune has a mostly vertical face facing the sea
22. The SLSC may be lost in a severe storm
23. The sand dunes were at one stage berms
24. The name of the swamp is Samoa
25. The beach has grasses on it
26. Industrial land use is shown on the diagram
27. The caravan park is beside the road
28. Vegetation increases in height towards the sea
29. The person after whom the highway is named is Carolyn
30. The trail is located on the seaward side of the foredune

Reading materials &: ~st items for Experiments 7, 8 &: 9
Material 3 combined m;esentation used in &periment 8:
A cross section from Lake Reed to Destown
60
50 Ht;9ht
;n mttrts 40
30
20
10
0 100 200 300 400 Distance in metres
'\Lake Carter
(29m wide)
500
304
e

Readbig materials cl test items for Experiments 7, 8 cl 9 305
Materia,1 3 split presentation used in Experiment 8:
60
50
40
30
20
10
0
A cross section from Lake Reed to Destown
16
6 c_-:,
,.~-c:::, 17 ,,,,......----22""- 0 25
15
1
100 200 300 400 500
Key:
1. LakeReed 18. Hang glider
2. Morgan's Beach 19. Dune protection programme 3. ReedSLSC 20. Old rubbish dump
4. Spinifex & marram grasses 21. Jet
5. Foredune (38m high) 22. Seagulls
6. Cumulus clouds 23. Burrow
7. Shrubs & woodland 24. Moon
8. Pampas grass 25. Shale
9. Gottom Bridge
10. Hind dunes (100m wide)
11. Lake Carter (29m wide)
12. Wide Highway
13. Wheat
14. Ridley Town
15. Hammond Cliff (41m high) Average gradient= 1:10.5
16. Destown Vertical scale: Height in metres
17. Cirrus clouds Horiz.ontal scale: Distance in kilometres

Readmg materials & test items for Experiments 7, 8 & 9 306
Please note: The multiple choice items for Material 3 used in Experiment 8 may
be found in Appendix 5
True/False:
On the Answer sheet provided write True or False in the space provided for each
statement indicating whether you believe the statement is true or false
21. The park is named Ridley
22. The hang glider is over the lake
23. The old rubbish dump is beneath a hind dune
24. The sand dunes have a protection programme
25. The highway is situated immediately beside a town
26. The hind dunes are wider than the lake
27. The hang glider is more landward than the jet
28. The cliff is made of shale
29. The moon is at an elevation below the height of the cliff
30. The burrow is on the lakeside of the foredune

Proportions correct data/or Experiment 7 307
Auueodi1 1~: Proportions correct data for students in Experiment 7
Experiment 7 trials with learning materials
Trial 1 Trial2 Trial 3
Student Combined Smil Qlmbin~ S;glil Combined Smit 1 .3 .233 .567 .367 .433 .467
2 .5 .5 .533 .433 .433 .4
3 .5 .433 .333 .367 .667 .533
4 .8 .467 .633 .333 .6 .433
5 .633 .367 .7 .567 .733 .667
6 .533 .4 .767 .3 .767 .433
7 .733 .467 .7 .533 .833 .5
8 .633 .467 .7 .567 .667 .6
9 .733 .367 .633 .5 .567 .233
10 .333 .4 .4 .233 .433 .367
11 .5 .5 .467 .467 .6 .6
12 .367 .4 .4 .4 .633 .4
13 .367 .6 .533 .467 .633 .533
14 .7 .4 .867 .433 .867 .633
15 .3 .233 .3 .433 .4 .5
16 .333 .267 .333 .467 .4 .467
17 .5 .333 .3 .367 .633 .4 18 .467 .467 .533 .467 .667 .667
19 .633 .533 .533 .5 .767 .567
20 .267 .267 .4 .367 .367 .333
21 .533 .5 .367 .4 .567 .5
22 .467 .5 .467 .567 .633 .667
23 .633 .633 .833 .667 .667 .7
24 .3 .367 .4 .433 .333 .4
25 .7 .633 .8 .567 .767 .533
26 .433 .4 .567 .267 .6 .3 27 .333 .4 .3 .4 .467 .2 28 .433 .367 .3 .367 .5 .367 29 .6 .5 .567 .6 .633 .633

Proportions correct do/a/or Experiment 7 308
Experiment 7 trials without learning materials
Tria14 Trial5 Trial 6
Student Combined S12lit CQmhined S12li1 Combined S;glit 1 .533 .533 .233 .3 .467 .3
2 .733 .467 .6 .467 .567 .533
3 .533 .367 .433 .433 .433 .467
4 .6 .433 .6 .433 .667 .433
5 .7 .6 .533 .533 .767 .6
6 .8 .4 .733 .433 .633 .467
7 .633 .5 .6 .6 .7 .633
8 .7 .5 .8 .467 .7 .367
9 .367 .4 .333 .4 .3 .4
10 .4 .367 .433 .467 .4 .3
11 .6 .433 .5 .567 .567 .533
12 .633 .5 .567 .267 .633 .367
13 .6 .567 .5 .3 .633 .533
14 .867 .567 .833 .567 .833 .667
15 .367 .4 .433 .367 .367 .333
16 .5 .267 .2 .4 .233 .3
17 .567 .467 .467 .5 .433 .633
18 .633 .567 .533 .567 .6 .633
19 .5 .667 .533 .6 .5 .6
20 .3 .433 .367 .333 .433 .467
21 .333 .3 .467 .5 .533 .533
22 .533 .6 .567 .533 .6 .6
23 .8 .733 .767 .467 .8 .6
24 .333 .433 .533 .467 .4 .433
25 .8 .633 .7 .633 .7 .667
26 .367 .233 .467 .367 .5 .267
27 .5 .4 .467 .3 .333 .2
28 .4 .267 .233 .2 .267 .3
29 .633 .6 .567 .567 .467 .567

Proportions correct data/or Experiment 7 309
Proportions COITCCt data for factual and inferential questions for each student in
Trials 1 to 3 in Experiment 7:
Trial 1 Trial2 Trial 3
Combined Split Combined Split Combined Split
Stud~Dl Ew.t lofei: ~, lofei: Em:t lofei: Ew.t lofei: Ew.l lofei: Ea~l lofec 1 .333 .364 .111 .182 .667 .364 .333 .176 .444 .273 .333 .353
2 .111 .727 .111 .545 .111 .727 .667 .647 .444 .818 .333 .412
3 .556 .273 .111 .545 .444 .273 0 .235 .667 .455 .667 .588
4 .667 .909 0 .727 .556 .727 .333 .235 .667 .727 0 .412
5 .444 .636 0 .636 .667 .636 .333 .471 .778 .545 0 .647
6 .556 .364 0 ASS .556 .818 .333 .118 .444 .909 .333 .294
7 .556 .818 .111 .818 .556 .727 .333 .471 .556 .909 .333 .412
8 .556 .727 .111 .636 .667 .727 .333 .471 .778 .636 .667 .412
9 .667 .727 0 .545 .556 .727 .667 .412 .667 .636 .333 .294
10 .444 .273 .111 .545 .333 .273 0 .176 .444 .364 .333 .412
11 .444 .455 .111 .455 .222 .455 0 .294 .444 .636 .667 .412
12 0 .545 .111 .727 .333 .455 0 .294 .556 .636 .333 .471
13 .333 .364 .111 1 .556 .636 0 .412 .667 .727 .333 .412
14 .667 .636 .111 .636 .556 1 0 .765 .667 .909 .333 .588
15 0 .182 .111 .182 .333 .294 .222 .364 0 .294 .444 .364
16 0 .364 .222 .091 .333 .294 .333 .455 0 .353 .556 .455
17 0 .909 0 .455 .333 .294 .222 .273 .333 .588 .333 .818
18 .111 .545 .222 .727 0 .529 .333 .273 0 .765 .778 .636
19 .111 .818 .333 .636 0 .529 .444 .636 .667 .647 .444 .545
20 .333 .364 .222 .273 .333 .412 .444 .364 .667 .294 .111 .727
21 .111 .727 .333 .636 .667 .412 .333 .455 .333 .588 .556 .455
22 .222 .909 .667 .636 .667 .824 .778 .727 .333 .647 .889 .727
23 0 .545 .556 .455 0 .353 .444 .636 .667 .647 .444 .818
24 0 .455 .333 .273 .333 .294 .111 .727 .333 .294 .333 .455
25 .222 .909 .333 .727 .667 .765 .222 .727 .667 .765 .222 .545
26 .111 .545 .333 .364 .333 .588 .222 .182 .333 .588 .111 .455
27 0 1 .333 .455 .333 .412 .556 .273 .333 .647 .333 .818
28 .111 .364 .333 .273 .333 .294 .222 .364 .333 .412 .222 .091
29 0 .636 .222 .364 .333 .294 .222 .273 0 .647 .222 .273

Proportions correct data/or Experiment 7 310
Proportions correct data for factual and inferential questions for each student in
Trials 4 to 6 in Experiment 7:
Trial 1 Trial2 Trial 3
Combined Split Combined Split Combined Split
Studeot Ea&l lofec Ea&l lo(« Ea,t lo(« Ea,1 lofec Ea&l lo(« Ea&t Infa:
1 .S56 .45S .111 .412 .222 .273 0 .176 .222 .364 0 .118
2 .444 .909 .111 .471 .444 .636 .667 .23S .333 .636 1 .3S3
3 .222 .45S .222 .471 .S56 .273 0 .412 .222 .364 0 .471
4 .667 .54S .111 .3S3 .S56 .818 .667 .3S3 .667 .727 .333 .471
s .667 .727 0 .S29 .444 .54S 0 .412 .667 .727 0 .S29
6 .667 .909 0 .3S3 .667 .818 .333 .294 .667 .S4S .333 .412
7 .444 .727 .111 .412 .111 .727 .667 .471 .444 .727 .667 .471
8 .667 .636 .111 .294 .667 .818 .667 .294 .667 .636 .667 .118
9 .444 .364 .111 .294 .111 .818 .333 .23S .111 .364 .667 .176
10 .111 .54S .111 .294 .S56 .182 .667 .3S3 .222 .45S 0 .294
11 .S56 .45S 0 .294 .333 .45S .333 .471 .444 .S4S .333 .471
12 .444 .727 .111 .471 .333 .636 .333 .118 .444 .818 .333 .23S
13 .S56 .727 .111 .S29 .444 .636 0 .176 .S56 .727 .333 .S29
14 .667 .909 .222 .412 .667 .909 .667 .412 .778 1 .333 .647
1S · .111 .23S .333 .364 .333 .412 .333 .273 0 .176 .222 .182
16 .333 .294 .333 .091 .333 .118 .222 .45S .333 .176 .222 .273
17 0 .471 .333 .S4S 0 .471 .444 .45S .333 .412 .S56 .54S
18 0 .706 .444 .S4S 0 .S29 .444 .54S 0 .S88 .333 .636
19 .222 .412 .778 .636 0 .S88 .S56 .636 .333 .471 .222 .727
20 0 .S29 .222 .364 0 .23S .444 .182 .667 .3S3 .333 .182
21 0 .412 .444 .273 0 .412 .333 .54S .333 .S88 .444 .S4S
22 .222 .824 .778 .727 .667 .76S .778 .727 0 .882 .667 .818
23 .111 .412 .222 .727 .667 .471 .222 .636 .667 .S29 .222 .727
24 .111 .23S .222 .S4S .333 .412 .444 .54S .667 .23S .333 .45S
2S .222 .76S .444 .S4S .333 .647 .333 .727 0 .706 .444 .818
26 .222 .3S3 .111 .364 .667 .412 .333 .45S .333 .471 .222 .45S
27 .111 .706 .444 .45S .333 .647 .333 .636 .667 .3S3 .333 .636
28 .111 .471 .333 .273 .333 .471 .222 .182 0 .23S .111 0
29 0 .S29 .222 .182 0 .176 .111 .091 0 .0S9 .222 .182

Proportions co"ect data/or Experiment 8 311
Appendix 15: Proportions correct data for students in Experiment 8
Student Fonnat Trial 1 Trial 2 Trial 3 Trial4 Trial 5 Trial6
gfmatmw. 1 Combined .367 .4 .6 .533 .6 .533
2 Combined .367 .633 .367 .4 .367 .533
3 Combined .667 .8 .767 .867 .733 .733
4 Combined .667 .567 .533 .567 .467 .533
5 Combined .7 .567 .6 .733 .533 .733
6 Combined .667 .8 .633 .667 .633 .6
7 Combined .267 .433 .7 .9 .567 .7
8 Combined .867 .767 .7 .867 .8 .733
9 Combined .333 .533 .533 .633 .467 .467
10 Combined .667 .733 .633 .567 .367 .4
11 Combined .6 .6 .467 .667 .433 .5
12 Combined .533 .433 .4 .5 .467 .4
13 Combined .467 .467 .467 .433 .267 .567
14 Combined .433 .533 .8 .8 .567 .633
15 Combined .533 .633 .7 .9 .6 .667
16 Combined .467 .333 .433 .667 .4 .433 17 Combined .767 .833 .7 .767 .633 .6
18 Combined .633 .667 .7 .767 .633 .4 19 Combined .433 .433 .533 .667 .7 .767 20 Combined .7 .8 .667 .7 .633 .8 21 Combined .6 .633 .567 .667 .7 .933 22 Combined .467 .467 .767 .667 .533 .467 23 Combined .733 .833 .633 .8 .7 .833 24 Combined .367 .733 .433 .567 .567 .433 25 Combined .633 .7 .667 .633 .733 .767 26 Combined .633 .733 .567 .533 .467 .567

Proportions correct data/or Experiment 8 312
Proportions correct data for students in Experiment 8 continued:
Student Format Trial 1 Trial 2 Trial 3 Trial 4 Trial 5 Trial6
Qfatmill 27 Split .467 .533 .467 .7 .6 .633
28 Split .367 .4 .5 .433 .567 .5 29 Split .6 .567 .4 .533 .533 .6
30 Split .5 .433 .567 .667 .733 .867
31 Split .367 .367 .5 .4 .3 .433
32 Split .633 .733 .467 .633 .567 .733
33 Split .5 .433 .233 .333 .367 .533
34 Split .567 .7 .667 .6 .467 .567
35 Split .6 .5 .667 .867 .633 .733
36 Split .5 .433 .2 .533 .267 .5 37 Split .7 .633 .633 .733 .5 .533
38 Split .667 .7 .567 .567 .667 .7
39 Split .433 .5 .7 .733 .433 .5 40 Split .467 .367 .4 .5 .267 .467
41 Split .267 .333 .367 .2 .333 .3
42 Split .433 .6 .5 .533 .567 .433
43 Split .6 .567 .467 .4 .567 .667
44 Split .433 .533 .7 .7 .2 .167
45 Split .367 .5 .633 .667 .667 .833
46 Split .5 .533 .633 .7 .533 .5 47 Split .8 .733 .367 .6 .467 .4 48 Split .5 .567 .2 .633 .367 .633
49 Split .267 .433 .733 .8 .467 .5 50 Split .7 .733 .733 .633 .433 .567
51 Split .4 .333 .5 .467 .567 .3
52 Split .333 .733 .367 .467 .433 .4
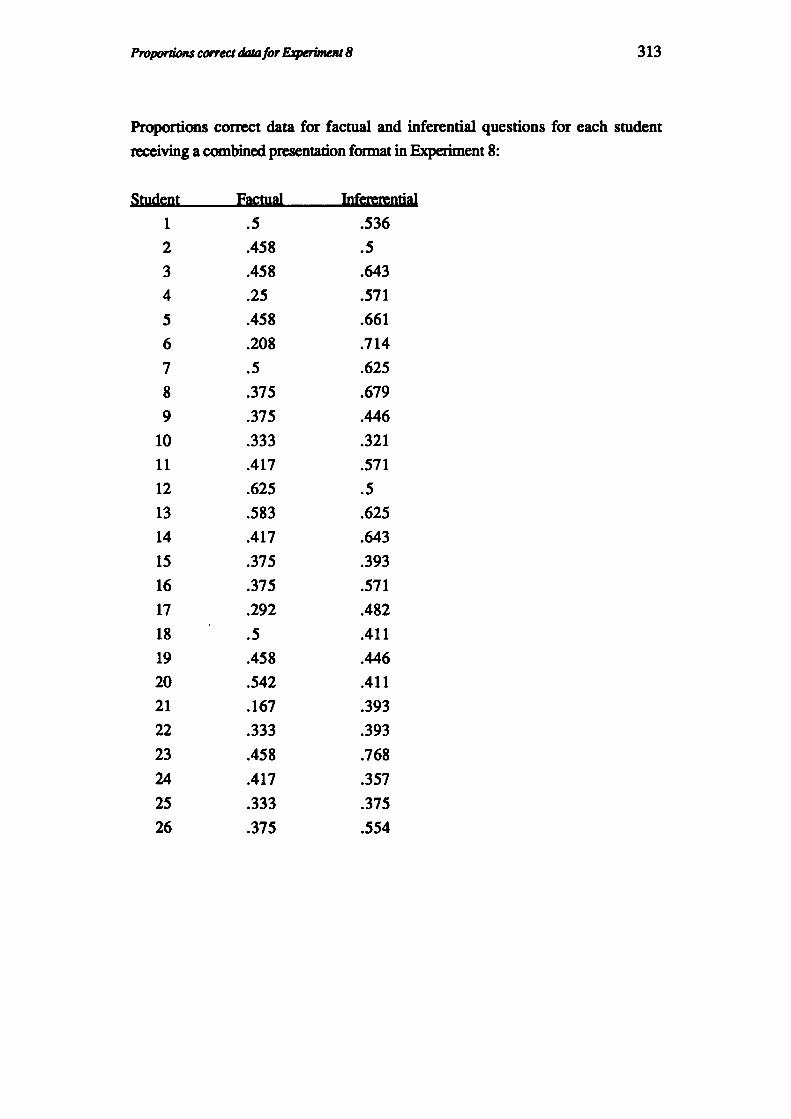
Proportions correct dalafor Experiment 8 313
Proportions correct data for factual and inferential questions for each student
receiving a combined presentation format in Experiment 8:
Student Eactuill lDfererential
1 .5 .536
2 .458 .5
3 .458 .643
4 .25 .571
5 .458 .661
6 .208 .714
7 .5 .625
8 .375 .679
9 .375 .446
10 .333 .321
11 .417 .571
12 .625 .5
13 .583 .625
14 .417 .643
15 .375 .393
16 .375 .571
17 .292 .482
18 .5 .411
19 .458 .446
20 .542 .411
21 .167 .393
22 .333 .393
23 .458 .768
24 .417 .357
25 .333 .375
26 .375 .554

Proportions correct dalafor Experiment 8 314
Proportions correct data for factual and inferential questions for each student
receiving a split presentation fonnat in Experiment 8:
Studen1 Ea~wal lnfererenlial
27 .292 .339
28 .458 .5
29 .292 .143
30 .292 .357
31 .333 .196
32 .542 .464
33 .583 .393
34 .458 .339
35 .5 .643
36 .333 .464
37 .333 .464
38 .292 .339
39 .375 .304
40 .458 .554
41 .208 .232
42 .417 .339
43 .333 .393
44 .375 .357
45 .417 .554
46 .125 .304
47 .375 .589
48 .542 .536
49 .25 .429
50 .375 .339
51 .292 .375
52 .333 .571

Proportions correct data/or Experi,Mnl 9 315
Appepdix 16: Proportions correct data for students in Experiment
9
Group 1 Group2 Group 3 Group 4
(Material 1 (Material 1 (Material2 (Material2
Combined split) combined) split)
Student Score Swdcnt s,w:c Swdcnt s,w:c Swdcnt Score 1 .733 26 .5 51 .733 76 .533
2 .733 27 .567 52 .6 77 .333
3 .833 28 .567 53 .567 78 .4
4 .533 29 .467 54 .7 79 .. 5
5 .8 30 .467 55 .4 80 .5
6 .633 31 .767 56 .267 81 .4
7 .567 32 .433 57 .667 82 .467
8 .767 33 .467 58 .767 83 .6
9 .767 34 .467 59 .733 84 .467
10 .6 35 .6 60 .433 85 .4
11 .633 36 .6 61 .767 86 .467
12 .5 37 .667 62 .667 87 .567
13 .633 38 .667 63 .5 88 .567
14 .433 39 .367 64 .567 89 .3
15 .7 40 .567 65 .333 90 .7
16 .667 41 .6 66 .7 91 .533
17 .633 42 .5 67 .333 92 .37
18 .733 43 .467 68 .533 93 .467
19 .667 44 .6 69 .4 94 .467
20 .633 45 .533 70 .663 95 .4
21 .767 46 .367 71 .8 96 .6
22 .567 47 .433 72 .367 97 .367
23 .4 48 .633 73 .433 98 .4
24 .6332 49 .6 74 .633 99 .433
25 .6 50 .533 75 .567 100 .367

Proportions correct data/or Experiment 9 316
Proportions correct data on factual and inferential questions for materials presented
in the combined format in Experiment 9:
Smdcn1 Eactual IDferenJiw Smdent Ea~aI Inf~miw 1 .727 .333 26 .353 .667
2 .471 .333 27 .727 .556
3 .727 .556 28 .636 .333
4 .636 .333 29 .294 .333
5 .765 1 30 .353 .333
6 .588 0 31 .353 0
7 .545 .556 32 .176 1
8 .818 .667 33 .647 .667
9 .909 .444 34 .765 .333
10 .818 .667 35 .588 .667
11 .818 .556 36 .353 0
12 .455 .556 37 .727 .556
13 .545 .556 38 .909 .667
14 .588 0 39 .636 .556
15 .364 .667 40 .636 .556
16 .353 0 41 .647 0
17 .909 .667 42 .706 .667
18 .455 .222 43 .647 .333
19 .529 0 44 .294 .333
20 .235 0 45 .824 .333
21 .364 .444 46 .273 .333
22 .455 .889 47 .636 .444
23 .818 .444 48 .765 0
24 .529 .333 49 .545 .444
25 .471 0 50 .588 .667

Proportions com!ct data/or ExperuMnt 9 317
Proportions correct data on factual and inferential questions for materials presented
in the split format in Experiment 9:
Smdsmt factual Inf~ntial Stu~nt factual Inferential
51 .727 .444 76 .529 .333
52 .529 0 77 .636 .222
52 .545 .556 78 .364 .444
54 .455 .556 79 .636 .556
55 .647 .667 80 .636 .556
56 .588 .333 81 .471 0
57 .818 .556 82 .364 .444
58 .647 0 83 .273 .444
59 .412 0 84 .412 .333
60 .818 .444 85 .118 0
61 .471 0 86 .364 .667
62 .294 .333 87 .455 .222
63 .588 .333 88 .294 .667
64 .636 .444 89 .353 .333
65 .235 0 90 .545 .444
66 .412 .333 91 .412 .333
67 .176 0 92 .364 .556
68 .545 .667 93 .353 .333
69 .471 .667 94 .727 0
70 .176 .667 95 .412 .333
71 .471 .333 96 .455 .333
72 .545 .444 97 .727 .556
73 .273 .444 98 .455 .778
74 .647 .333 99 .364 .111
75 .545 .556 100 .471 0