the influence of primary and secondary nitrogen donor atoms ...
361
Durban 1987 THE INFLUENCE OF PRIMARY AND SECONDARY NITROGEN DONOR ATOMS ON THE THERMODYNAMICS OF COMPLEX FORMATION IN AQUEOUS SOLUTION by Bice Susan Martincigh Submitted in partial fulfilment of the requirements for the degree of Doctor of Philosophy in the Department of Chemistry and Applied Chemistry, University of Natal
-
Upload
khangminh22 -
Category
Documents
-
view
1 -
download
0
Transcript of the influence of primary and secondary nitrogen donor atoms ...
Durban 1987
THE INFLUENCE OF PRIMARY AND SECONDARY NITROGEN DONOR ATOMS
ON THE THERMODYNAMICS OF COMPLEX FORMATION IN AQUEOUS SOLUTION
by
Bice Susan Martincigh
Submitted in partial fulfilment of the requirements for the degree of
Doctor of Philosophy in the
Department of Chemistry and Applied Chemistry, University of Natal

ai mie genitors

ABSTRACT
The experimental work described in this thesis is aimed at testing the as
sertion that, in the absence of ring strain effects, the formation of metal
ion-secondary nitrogen bonds is enthalpy-stabilized in comparison with
metal ion-primary nitrogen bonds. To this end the stability constants of
the ligand 2-(2-aminoethyl)aminoethanol (etolen) with the ions H+, Ni2 +,
C02 + .and Zn2 +, and those of the ligand 2,2'-oxybisethanamine (oden) with
the ions H+, Ni2 + and C02 +, have been determined by glass electrode pot en
tiometry at 25°C in 0.5 mol dm- 3 KN03 • In addition, the enthalpies of
reaction have been determined by titration calorimetry under the same con
ditions. The results obtained for these various systems, together with
some available from the literature, are compared and discussed.
The differences between the thermodynamic parameters of the etolen complexes
and those of oden give a measure Of the relative bonding capacities of
secondary and primary nitrogen donors. From these differences the fol
lowing general observations are made:
1. The six metal ions considered turn out to split into two distinct
groups: one in which CFSE is expected and the etolen complexes are
more stable, and one in which CFSE is not expected and the oden
complexes are more stable.
2. The ~(log KOll) values for each group show at least approximately
a linear relationship with the hardness parameter of the metal ion,
and with the radius of the metal ion.
iii
3. For all metal ions considered, the addition of a second ligand
molecule to the ML complex leads to enhancement of secondary over
primary nitrogen bonding.
~ 4. The 6(6Holl) values for those metal ions where CFSE is expected
show at least approximately a linear relationship with both the
hardness and the radius of the metal ion.
It is therefore tentatively concluded that metal ion - secondary nitrogen
bonds are not in general stronger than those involving primary nitrogen.
They are stronger only in those cases where crystal field stabilization
energy is present and the metal ion is small. This enhanced stability
appears to decrease as the size or the hardness of the metal ion increases.
PREFACE
The experimental work de_scribed in this thesis was carried out in the
Department of Chemistry and Applied Chemistry, University of Natal, Durban,
under the supervision of Professor F. Marsicano.
These studies represent original work by the author and have not been
submitted in any form to another University. Where use was made of the
work of others it has been duly acknowledged in the text.

ACKNOWLEDGEMENTS
I am indebted to many people and organizations for their assistance during
the course of this work.
Firstly, I must thank my supervisor, Prof. F. Marsicano, for his advice
and encouragement, and his painstaking comments on all parts of the thesis.
I must also thank Prof. J.W . Bayles for his interest and support, and for
occasionally waving the big stick.
I am grateful to Siva Moodley, for recording the infrared spectra, and
Dan Pienaar, for recording the n.m.r. and mass spectra. The technical
staff of the Department, especially Dave Balson, helped me in many
respects, and were always cheerful and cooperative. Bernice Liguori did
a marvellous job of accurate and speedy typing. My laboratory colleagues
Faizel Mulla and Chris Monberg provided a convivial working environment,
and stimulating (and at times robust) discussion of technical matters.
Various friends, including Leo Salter and Rodney Hansen, provided
encouragement and assistance.
lowe much to my parents and my sister, for all their support and sacrifices
over many years. Their encouragement has meant much to me.
I also owe much to lain MacDonald for his indefatigable help and extreme
patience. His encouragement and support made the task much easier and
for this I am extremely grateful.
Finally, I wish to acknowledge, with gratitude, the financial support of
several bodies: AECl and the CSlR, both of whom generously supported
my work for several years; the University of Natal, who awarded me a
graduate assistantship for one year; and the Natal Technikon, who granted
me two months' leave from my lecturing duties to work on my thesis.
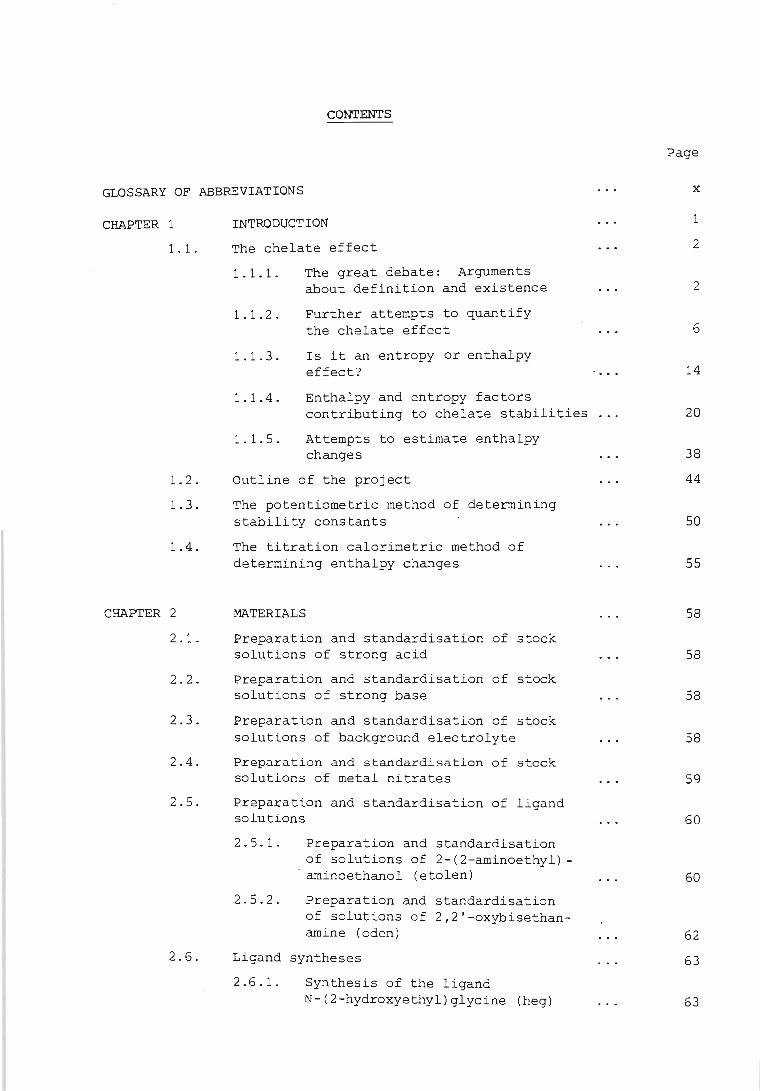
CONTENTS
GLOSSARY OF ABBREVIATIONS
CHAPTER 1
1.1.
1.2.
1. 3.
1.4.
CHAPTER 2
2.1.
2.2.
2.3.
2.4.
2.5.
2.6.
INTRODUCTION
The chelate effect
1.1.1.
1.1.2.
1.1.3.
1.1.4.
1.1.5.
The great debate: Arguments about definition and existence
Further attempts to quantify the chelate effect
Is it an entropy or enthalpy effect?
Enthalpy and entropy factors contributing to chelate stabilities
Attempts to estimate enthalpy changes
Outline of the project
The potentiometric method of determining stability constants
The titration calorimetric method of determining enthalpy changes
MATERIALS
Preparation and standardisation of stock solutions of strong acid
Preparation and standardisation of stock solutions of strong base
Preparation and standardisation of stock solutions of background electrolyte
Preparation and standardisation of stock solutions of metal nitrates
Preparation and standardisation of ligand solutions
2.5.1. Preparation and standardisation of solutions of 2-(2-aminoethyl)
- aminoethanol (etolen)
2.5.2. Preparation and standardisation of solutions of 2,2'-oxybisethanamine (oden )
Ligand syntheses
2.6.1. Synthesis of the ligand N- (2-hydroxyethyl)glycine (heg)
....
Page
x
1
2
2
6
14
20
38
44
50
55
58
58
58
58
59
60
60
62
63
63
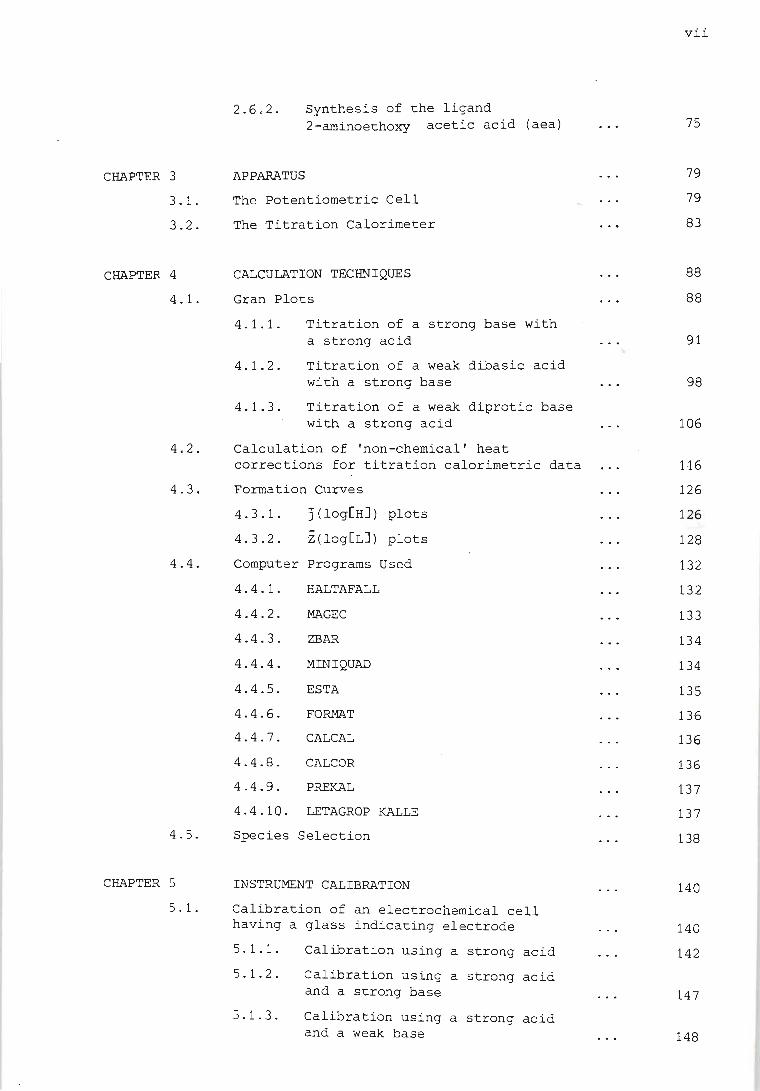
CHAPTER 3
3.1.
3.2.
CHAPTER 4
4.1.
2.6 . 2.
APPARATUS
Synthesis of the ligand 2-aminoethoxy acetic acid (aea)
The Potentiometric Cell
The Titration Calorimeter
CALCULATION TECHNIQUES
Gran Plots
4.1.1.
4.1. 2.
4.1.3.
Titration of a strong base with a strong acid
Titration of a weak dibasic acid with a strong base
Titration of a weak diprotic base with a strong acid
4.2. Calculation of 'non-chemical' heat
4.3.
4.4.
4.5.
CHAPTER 5
5.1.
corrections for titration calorimetric data
Formation Curves
4.3.1.
4.3.2.
J(log[HJ) plots
Z(log[LJ) plots
Computer Programs Used
4.4.1. HALTAFALL
4 . 4 . 2 . MAGEC
4.4.3. ZBAR
4.4.4. MINIQUAD
4.4.5. ESTA
4.4.6. FORMAT
4.4.7. CALCAL
4.4.8. CALC OR
4.4.9. PREKAL
4.4.10. LETAGROP KALLE
Species Selection
INSTRUMENT CALIBRATION
Calibration of an electrochemical cell having a glass indicating electrode
5.1.1.
5.1. 2.
5.1. 3.
Calibration using a strong acid
Calibration using a strong acid and a strong base
Calibration using a strong acid and a weak base
vii
75
79
79
83
88
88
91
98
106
116
126
126
128
132
132
133
134
134
135
136
136
136
137
137
138
140
140
142
147
148
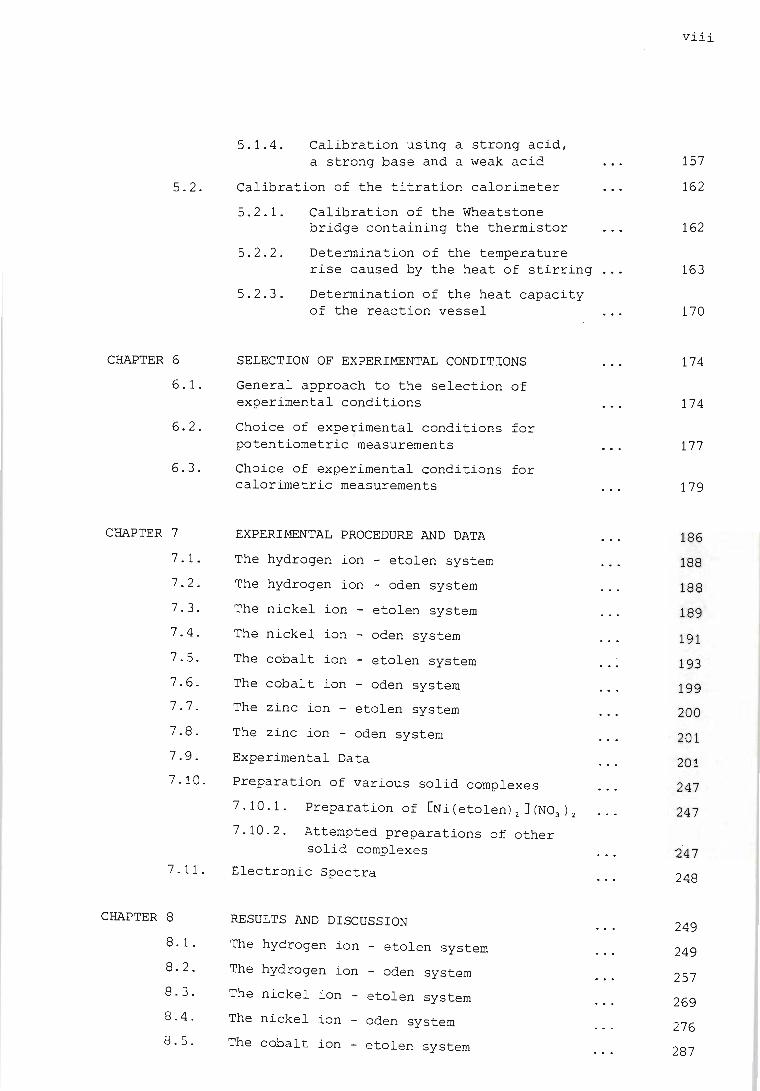
5.2.
CHAPTER 6
6.1.
5.1.4. Calibration using a strong acid, a strong base and a weak acid
Calibration of the titration calorimeter
5.2.1.
5.2.2.
5.2.3.
Calibration of the Wheatstone bridge containing the thermistor
Determination of the temperature rise caused by the heat of stirring
Determination of the heat capacity of the reaction vessel
SELECTION OF EXPERIMENTAL CONDITIONS
General approach to the selection of experimental conditions
6.2. Choice of experimental conditions for potentiometric measurements
6.3. Choice of experimental conditions for calorimetric measurements
CHAPTER 7
7.l.
7.2.
7.3.
7.4.
7.5.
7.6.
7.7.
7.8.
7.9.
7.10.
7.11.
CHAPTER 8
8.l.
8.2.
8.3.
8.4.
8.5.
EXPERIMENTAL PROCEDURE AND DATA
The hydrogen ion - etolen system
The hydrogen ion - oden system
The nickel ion - etolen system
The nickel ion - oden system
The cobalt ion - etolen system
The cobalt ion - oden system
The zinc ion - etolen system
The zinc ion - oden system
Experimental Data
Preparation of various solid complexes
7.10.1. Preparation of [Ni(etolen)2 J (N03
)2
7.10.2. Attempted preparations of other solid complexes
Electronic Spectra
RESULTS AND DISCUSSION
The hydrogen ion - etolen system
The hydrogen ion - oden system
The nickel ion - etolen system
The nickel ion - oden system
The cobalt ion - etolen system
.. ' .
viii
157
162
162
163
170
174
174
177
179
186
188
188
189
191
193
199
200
201
201
247
247
247
248
249
249
257
269
276
287
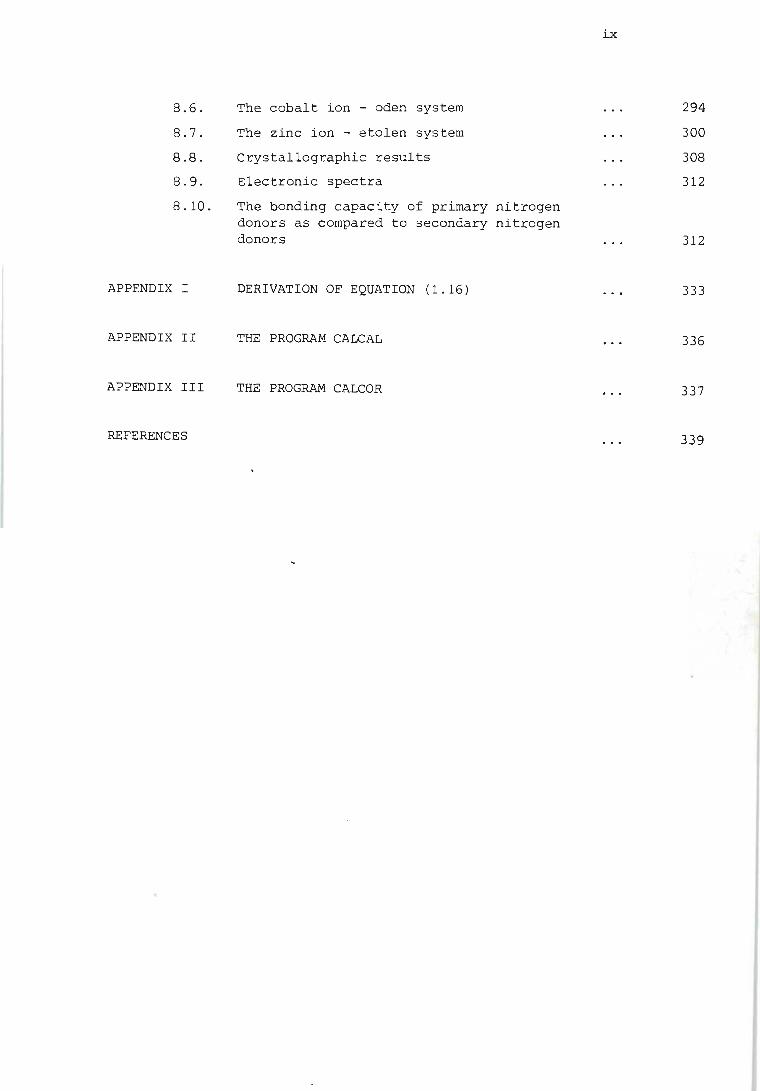
8.6.
8.7.
8.8.
8.9.
8.10.
APPENDIX I
APPENDIX II
APPEND IX II I
REFERENCES
The cobalt ion - oden system
The zinc ion - etolen system
Crystallographic results
Electronic spectra
The bonding capacity of primary donors as compared to secondary donors
DERIVATION OF EQUATION (1.16)
THE PROGRAM CALCAL
THE PROGRAM CALCOR
ix
294
300
308
312
nitrogen nitrogen
312
333
336
337
339
Abbreviation
bdta
bimp
bipy
cyclam
dien
dpt
edta
eimp
en
eten
etolen
etolen-
heg'-
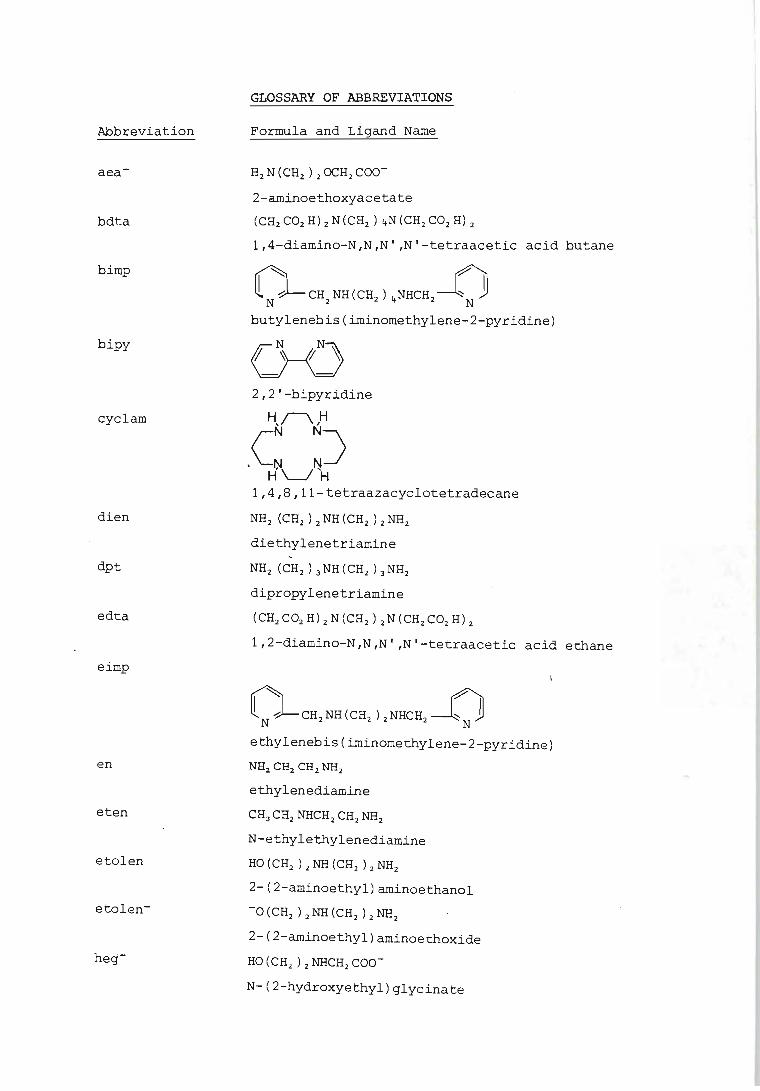
GLOSSARY OF ABBREVIATIONS
Formula and Ligand Name
H2N(CH2)2OCH2COO-
2-aminoethoxyacetate
(CH2C02H)2N(CH2)4N(CH2C02H)2
1,4-diamino-N,N,N' ,N'-tetraacetic acid butane
~ ~ ~ N .J- CH2 NH (CH2 ) 4NHCH2 ~ N JJ butylenebis(iminomethylene-2-pyridine)
2,2'-bipyridine
H,I\,H
eN N) . N N
H'--I 'H 1,4,8,ll-tetraazacyclotetradecane
NH2 (CH2 ) 2 NH (CH2) 2 NH2
diethylenetriamine
NH2 (CH2 ) 3NH (CH2 ) 3NH2
dipropylenetriamine
(CH2C02H)2N(CH2)2N(CH2C02H)2
1,2-diamino-N,N,N' ,N'-tetraacetic acid ethane
~CH'NH(CH'}'NHCH'~ ethylenebis(iminomethylene-2-pyridine)
NH2 CH2 CH2 NH2
ethylenediamine
CH3CH2NHCH2CH2NH2
N-ethylethylenediamine
HO (CH2 ) 2 NH (CH2 ) Z NH2
2-(2-aminoethyl}aminoethanol
-0 (CH2 ) 2 NH (CH2 ) 2 NHz
2-(2-aminoethyl)aminoethoxide
HO(CH2)2NHCH2COO
N-(2-hydroxyethyl)glycinate
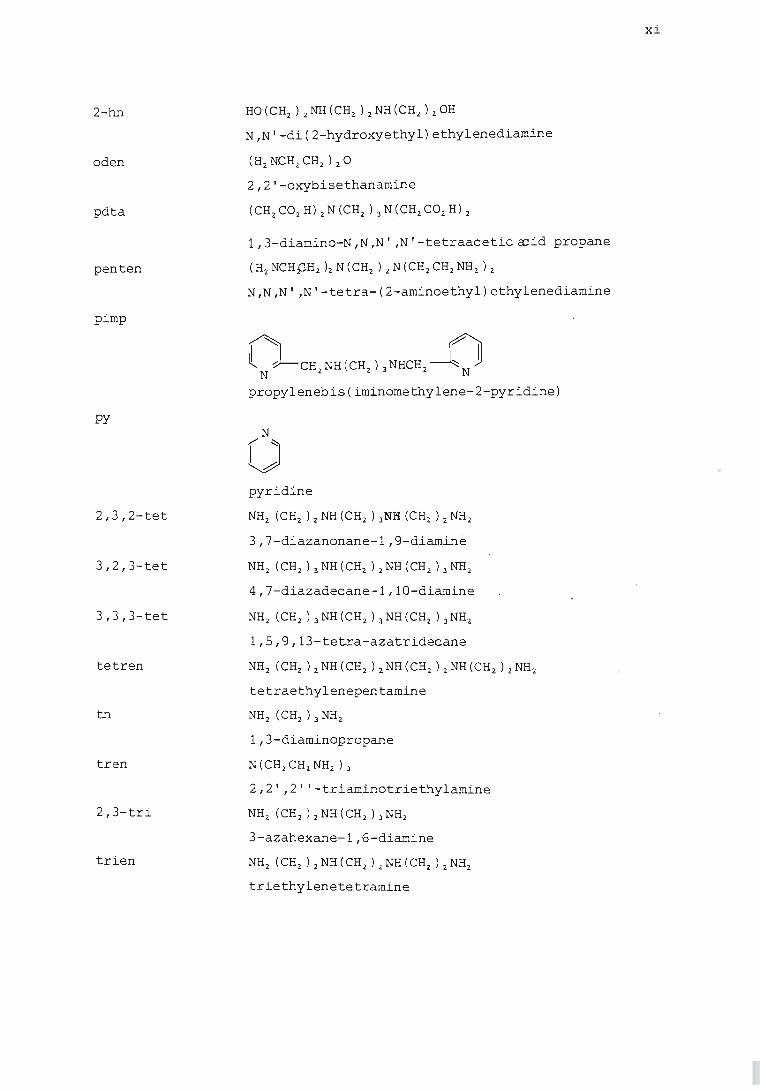
2-hn
oden
pdta
penten
pimp
py
2,3,2-tet
3,2,3-tet
3,3,3-tet
tetren
tn
tren
2,3-tri
trien
HO(CHz)zNH(CHz)zNH(CHz)zOH
N,N'-di(2-hydroxyethyl) ethylenediamine
(Hz NCHz CHz ) z ° 2,2'-oxybisethanamine
(CHzCOzH)zN(CHz)3N(CHzCOzH)z
1, 3-diamino-N ,N,N' ,N' -tetraacetic ccid propane
(Hz NCHpHz )z N (CHz ) z N (CHz CHz NH z ) z
N,N,N' ,N'-tetra-(2-aminoethyl) ethylenediamine
~ ~ ~ N J-CHz NH (CHz ) 3 NHCHz -l:: N jJ
propylenebis(iminomethylene-2-pyridine)
N o pyridine
NHz (CHz ) z NH (CHz ) 3NH (CHz ) z NHz
3,7-diazanonane-l,9-diamine
NHz (CHz ) 3 NH (CHz ) z NH (CH z ) 3 NH z
4,7-diazadecane-l,10-diamine
1,5,9,13-tetra-azatridecane
NHz (CHz ) z NH (CHz ) z NH (CHz ) z NH (CHz ) z NH z
tetraethylenepentamine
NH z (CHz ) 3 NH z
1,3-diaminopropane
N(CH1 CH 1 NH1 )3
2,2' ,2' '-triaminotriethylamine
NHz (CHz ) zNH (CHz ) 3 NH z
3-azahexane-l,6-diamine
NH z (CHz ) z NH (CHz ) z NH (CHz ) z NHz
triethylenetetramine
xi
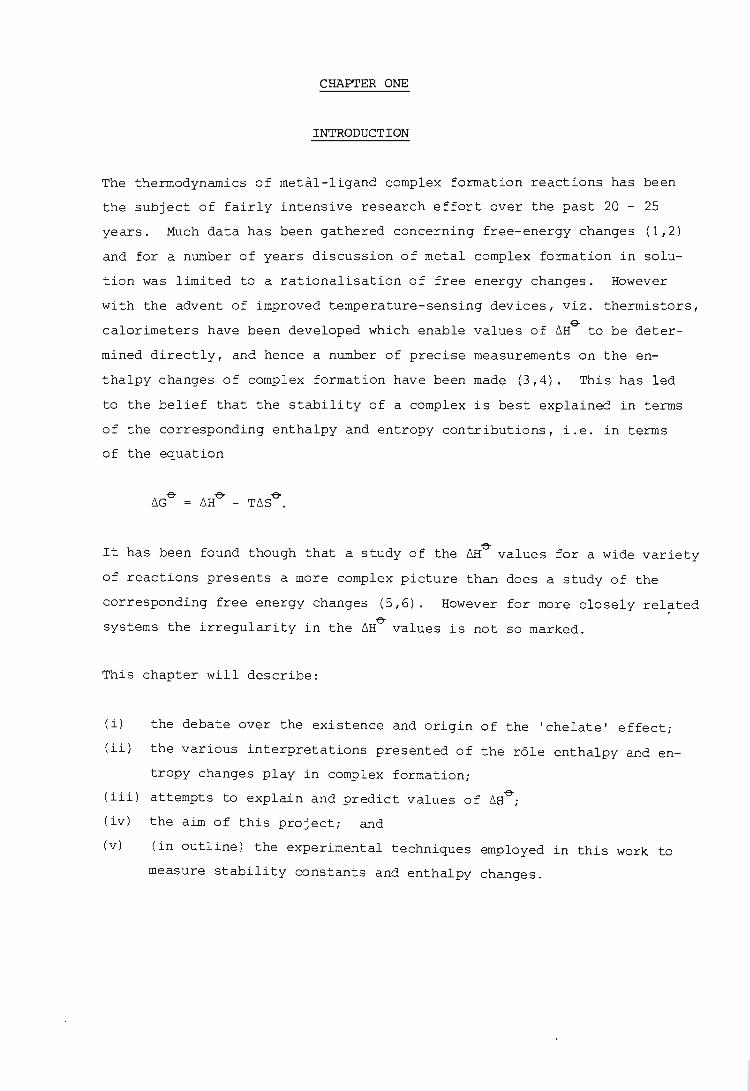
CHAPTER ONE
INTRODUCTION
The thermodynamics of metal-ligand complex formation reactions has been
the subject of fairly intensive research effort over the past 20 - 25
years. Much data has been gathered concerning free-energy changes (1,2)
and for a number of years discussion of metal complex formation in solu
tion was limited to a rationalisation of free energy changes. However
with the advent of improved temperature-sensing devices, viz. thermistors, 6-
calorimeters have been developed which enable values of ~H to be deter-
mined directly, and hence a number of precise measurements on the en
thalpy changes of complex formation have been made (3,4). This has led
to the belief that the stability of a complex is best explained in terms
of the corresponding enthalpy and entropy contributions, i.e. in terms
of the equation
It has been found though that a study of the me- values for a wide variety
of reactions presents a more complex picture than does a study of the
corresponding free energy changes (5,6). However for more closely related
systems the irregularity in the ~He- values is not so marked.
This chapter will describe:
(i) the debate over the existence and origin of the 'chelate' effect;
(ii) the various interpretations presented of the role enthalpy and en-
tropy changes play in complex formation;
(iii) attempts to explain and predict values of ~He-;
(iv) the aim of this project; and
(v) (in outline) the experimental techniques employed in this work to
measure stability constants and enthalpy changes.
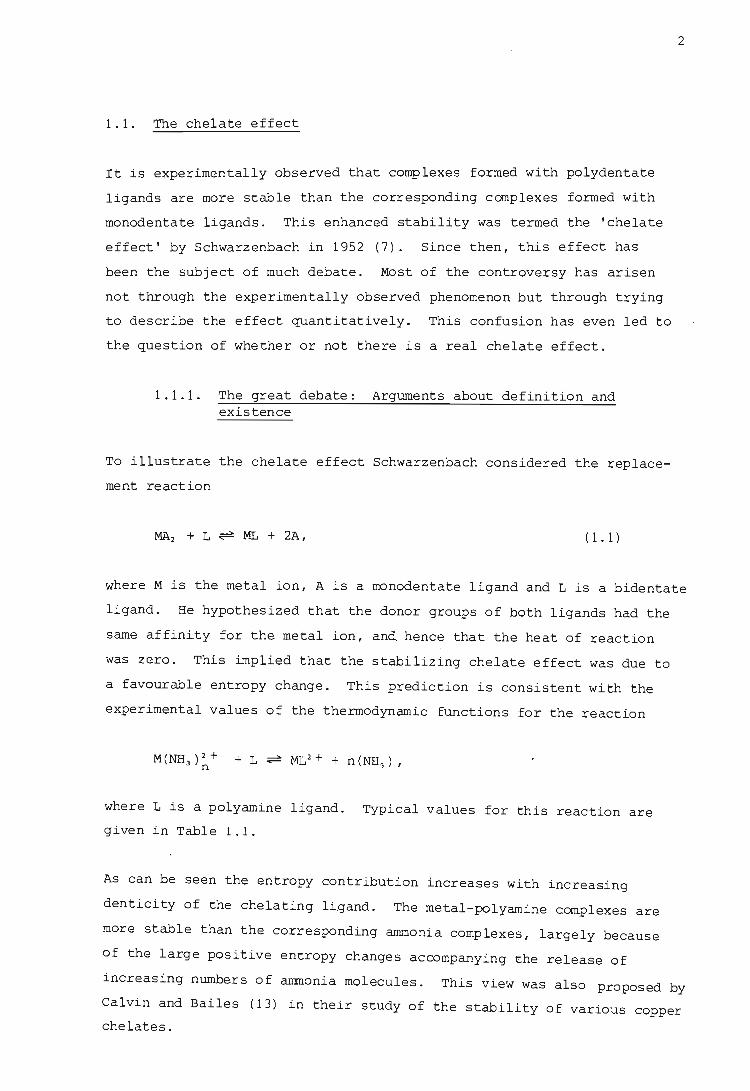
1.1. The chelate effect
It is experimentally observed that complexes formed with polydentate
ligands are more stable than the corresponding canplexes formed with
monodentate ligands. This enhanced stability was termed the 'chelate
effect' by Schwarzenbach in 1952 (7). Since then, this effect has
been the subject of much debate. Most of the controversy has arisen
not through the experimentally observed phenomenon but through trying
to describe the effect quantitatively. This confusion has even led to
the question of whether or not there is a real chelate effect.
1.1.1. The great debate: Arguments about definition and existence
To illustrate the chelate effect Schwarzenbach considered the replace-
ment reaction
MA2 + L ML + 2A, (1.1 )
2
where M is the metal ion, A is a monodentate ligand and L is a bidentate
ligand. He hypothesized that the donor groups of both ligands had the
same affini.ty for the metal ion ,and hence that the heat of reaction
was zero. This implied that the stabilizing chelate effect was due to
a favourable entropy change. This prediction is consistent with the
experimental values of the thermodynamic functions for the reaction
where L is a polyamine ligand. Typical values for this reaction are
given in Table 1.1.
As can be seen the entropy contribution increases with increasing
denticity of the chelating ligand. The metal-polyamine complexes are
more stable than the corresponding anunoni.a complexes, largely because
of the large positive entropy changes accompanying the release of
increasing numbers of ammonia molecules. This view was also proposed by
Calvin and Bailes (13) in their study of the stability of various copper
chelates.
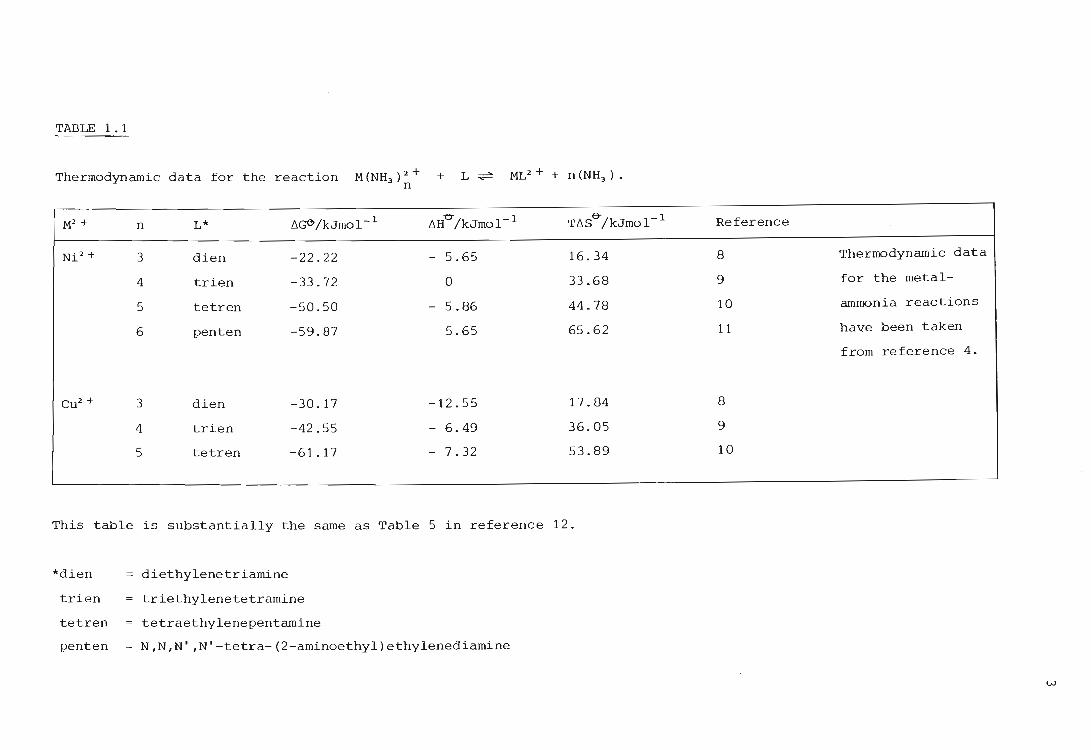
TABLE 1.1
Thermodynamic data for the reaction M (NH ) 2 + 3 n + L~ ML2 + + n (NH3 ) .
M2 + n L* f'lG6"/kJmol- 1 f'lH"O"/kJmol- 1 Tf'lS"O"/kJmol- 1
Ni 2+ 3 dien -22.22 - 5.65 16.34
4 trien -33.72 0 33.68
S tetren -50.50 - 5.86 44.78
6 penten -59.87 5.65 65.62
Cu2 + 3 dien -30.17 -12.55 17.84
4 trien -42.55 - 6.49 36.05
5 tetren -61. 17 - 7.32 53.89
This table is substantially the same as Table 5 in reference 12.
*dien
trien
tetren
penten
diethylenetriamine
triethylenetetramine
tetraethylenepentamine
N,N,N' ,N'-tetra-(2-aminoethyl)ethylenediamine
Reference
8 Thermodynamic data
9 for the metal-
10 ammonia reactions
11 have been taken
from reference 4.
8
9
10
w
Schwarzenbach (7,14) tried to describe the chelate effect in terms of a
model where in the first step one of the donor atoms of the bidentate
ligand attaches itself to. the metal ion. He assumed this intermediate
4
to have the same stability as the complex MA with the corresponding mono
dentate ligand. Hence the second donor atom may move only in a reduced
volume dictated by the length of the chain joining the two donor atoms.
In the second step the second donor atom. of the chelating ligand attaches
itself to the metal ion and the ring is formed, whereas for the formation
of MA2 a second freely mobile ligand must be obtained from the solution.
Thus the second donor atom of the chelating ligand has a higher activity
with respect to attachment to the metal ion and this activity can be
calculated from the reduced volume. Thus this model provides an explana
tion for the decrease in stability of the chelate complex with increasing
distance between the two donor groups of the ligand. Cotton and Harris
(15) calculated the entropy changes accompanying ring closures on the
basis of this model. However these applications failed to give agreement
with experiment.
Schwarzenbach (7) defined the chelate effect quantitatively by
Chelate Effect = log K(ML) - log 82 (MA2 ), (1. 2)
where the constants K and 82. refer to the equilibria:
M + L ML K (1. 3)
M + 2A ~ MA2 (1. 4)
Thus this quantity is in fact the logarithm of the stability constant of
the replacement reaction (1.1). Since (in this case) the 'chelate
effect' is the logarithm of a concentration, it will depend on the units
chosen to express concentration.
Equilibrium constants are however actually defined in terms of activities
rather than concentrations (as done here), and the standard states usually
chosen for the components in solution are different. For solvents the
standard state is taken to be the pure liquid, whereas for solutes the
5
standard state is defined in ' terms of a hypothetical ideally dilute
1 mol kg- 1 solution. This led Adamson (16) to point out that the magni
tude of the chelate effect depends on the standard state chosen for the
solutes. He interpreted the chelate effect as being an increase in the
translational entropy for the replacement reaction (1.1) resulting from
an increase in the number of species present in solution, as did
Schwarzenbach. Adamson showed that if the unit mole fraction standard
state is used for the solutes instead of the commonly used one molal
standard state the extra stability of the chelate complex more or less
disappears. He chose the hypothetical unit mole fraction standard state
because this state 'is one of minimum translational entropy for a solute
retaining the properties it possesses in dilute solution' (16). This
choice removes the influence of cratic effects.
Adamson is therefore often quoted for his statement that 'the chelate
effect is largely a consequence of the arbitrary asymmetry in the usual
choice of standard states'. Jones and Harrop (17) explain how this
asymmetry arises. In the expressions for K and S2 we have neglected the
loss of coordinated water molecules from the hydration sphere of the
metal ion upon complex formation, since it is generally assumed that the
activity of water is one. In dilute aqueous solution the concentration
of water is unit mole fraction. Thus the standard state for water is
unit mole fraction whereas the standard states for the solutes are unit
molal (molar) concentrations. This asynm,etry is thus inherent in the
expression for the chelate effect . In using the unit mole fraction
standard state throughout Adamson remov:ed this asymmetry.
Calculations of the type performed by Adamson led to the conclusions that
'the chelate effect ceases to be of any special importance' (18) and
'the apparent extra stability of chelate complexes disappears' (16), and to
claims of 'the non-existence of the chelate effect' (18).
Alternatively if a standard state of O.QOl molal (mol kg- 1 ) is used for
the solutes the chelate effect becomes much larger. Notwithstanding the
asymmetry of the standard state, one must not lose sight of the fact that
the chelate effect is still experimentally observed, as has been pointed
out by Martell (19) and Munro (2 0).
6
Jones and Harrop (17) have shown that the removal of the asymmetry of
the standard states need not necessarily lead to the conclusion that the
chelate effect does not exist. They showed that, if the asymmetry of
standard states is removed by using unit molar standard states throughout,
the chelate effect is important. They concluded that for dilute standard
states a real chelate effect is obtained (as reflected by a significant
and negative value for the free energy change), whereas for concentrated
standard states the effect is diminished. This conclusion is in keeping
with Adamson's findings.
In practice stability constants are often given in terms of concentrations
instead of activities. This has led to another source of confusion which
arises from the definition of the chelate effect as given by equation
(1.2). Agterdenbos (21) stated that it was incorrect to compare the sta
bility constants of complexes involving polydentate ligands with those of
complexes involving monodentate ligands. The error lies in the fact
that the two stability constants have different units and this can lead
to erroneous conclusions about the relative stabilities of the complexes.
Jones and Harrop (17) emphasize that a change of concentration units repre
sents a corresponding change in standard states and hence that the choice
of concentration units fixes the standard states of the solutes. They re
mind the reader that provided identical standard states are chosen the
comparison of stability constants of complexes involving polydentate and
monodentate ligands is valid for concentrati.on conditions in the vicinity
of those chosen for the standard state.
It is generally agreed that since the choice of concentration units implies
a choice of standard state the latter should be close to the concentrations
used in practice. Hence the use of the molar scale is generally accepted
(17,20,22), whereas use of a mole fraction of one is not, since the latter
is physically impossible during a reaction (20,22).
1.1.2. Further attempts to quantify the chelate effect
Since the quantitative definition of the chelate effect given by equation
(1.2) various authors have tried to define this quantity in different ways.
At times this was done in an attempt to obtain a definition which avoids
the problems that arose from Schwarzenbach's definition.

7
Prue (23) tried to show the relationship between various non-identical
equations in the literature relating the stability constants of com
plexes to· the sizes of the ions and the dielectric constant of the solvent.
From his model he illustrated the role enthalpy and entropy play in com
plex formation and the chelate effect.
~n his model he showed that if two molecules are closer to one another
than a distance a + da where a is the mean collision diameter, and have
an interaction energy w, then an expression for their association constant
is given by
K 4 rr a 2 (da) N e-w/ kT . (1. 5)
In this equation 4 rr a2 (da) is (approximately) the volume of a spherical
shell of thickness da, e-w/ kT is the Boltzmann factor and N is Avogadro's
constant. In this treatment the solvent is a structureless dielectric
continuum of dielectric constant E. From this expression for K the equa
tions for ion association derived by various authors can be simply deduced.
If the two molecules are oppositely charged non-polarizable ions w is
given by Coulomb's Law and on integration through the abovementioned shell
from r = a to r = a + da one obtains the Bjerrum (24) expression for ionic
association:
K (1.6)
(The cation and anion carry charges z+e and z_e respectively.)
If da in (1.5) is set to ~a and w is again determined by Coulomb's Law,
we obtain Fuoss's equation (25) for the association constant
K (1.7)
Also the expression of Eigen (26), which he derived from a kinetic argument,
can be obtained:
K ( 1.8)
where V is the shell volume.
For this model ion pair formation occurs essentially because of the
coulombic forces between oppositely charged ions. Prue showed that if
one treats ~~ as a consequence of changes in ~~ and T~S& the latter
terms depend on the temperature coefficient of the dielectric constant.
If the solvent is water this model gives an endothermic ~ff9 value and
hence an unfavourable contribution to association. However, if one
8
assumes covalent bonding instead of coulombic attraction between the mole
cules, exothermic values of M~ are obtained. Charge-solvent interactions
exert the major influence on ~~ for ion association reactions, irrespec
tive of the nature of the bonding.
From his model Prue showed that if one assumes the chelate effect is an
entropy effect then the association constant for the replacement reaction
(1.1) is given by~
= V- 1 = (! 1T Na3 ) -1 • 3 (1.9)
In obtaining this expression he assumed the interaction energy of the cen
tral ion with a bidentate ligand was twice the interaction energy between
the central ion and the analogous monodentate ligand. (Of course,
assumption is an idealisation.) Taking a = 2.75 A he obtained! 62
19 mol drn- 3 ,which is roughly of the correct order of magnitude.
this
=
Rosseinsky (27) established, using a continuum treatment of chelation, that
the contrasting models of Prue (23) and Schwarzenbach (7,14) refer to
short and long chelates respectively, depending on whether the ligand is
shorter or longer than about 8 A.
In Prue's model it is assumed that both ends of the bidentate ligand enter
the shell volume about the central ion, occupancy of which denotes bonding.
Rosseinsky assumed that this was the case for a short ligand, that is, a
ligand whose length is comparable
diamine. He calculated the value
diamine and methylamine and found
to the contact distance a, e.g. ethyleneK
of 82 for various complexes of ethylene-
that they bracketed Prue's value of
19 mol drn-3
• Hence he concluded that ethylenediamine is the ideal short
chelate. In this case he assumed that the interaction energy of the cen
tral ion with two molecules of methylamine (the monodentate ligand) is
equal to that of the central ion with one molecule of ethylenediamine

(the bidentate ligand). Hence
K (ideal) (32
(1.10)
When he compared the complexes of bipyridyl (also a short chelate) with K '
those of pyridine he found that the value of 62 greatly exceeded the
9
calculated value of V-I. He called this enhancement of chelation
'non-ideality' and ascribed it to differences in the interaction energies.
Hence
K (non-ideal) 82
(1.11)
where 2um is the sum of the interaction energies for the attachment of
two monodentate ligands and 2uchel is the interaction energy for the
coordination of the bidentate ligand.
For long chelates, that is, ligands whose length £ greatly exceeds the
contact distance a, Rosseinsky made use of the Schwarzenbach model of
chelation. If one end of the ligand is bonded and the other end is free,
the unattached end occupy ' any position in a volume equal 4 £3 can to - 7T 3
centred on the point of attachment. Hence for ideal long chelates
K -1 -82 (ideal) = Vs (1.12)
which is analogous to the expression for ideal short chelates. Butane
1,4-diamine was deemed the ideal long chelate. Again Rosseinsky ascribed
non-ideality to differences in the interaction energies. Hence the rele
vant expression is
K 82 (non-ideal) (1.13)
(In his model Schwarzenbach termed Vs an activity.)
The same arguments as stated before apply in the work of Rosseinsky if
different concentration units are used (i. e. different values for the che
late effect are obtained). He claimed that the ideal long chelate model
can be used to infer chelation and hence the chelate effect.

10
If the chelate-length is known from independent sources such as spatial
models or diffraction data on the solid, then chelation is unambiguous if
K 4 3)-1 S2 ~ (3 TI N t expt . (1. 14)
Both sides of this inequality have dimensions of concentration and hence
it is immaterial what units are used. This thus removes previous con
tentions regarding the choice of concentration scale. The equality sign
indicates ideality whereas the reverse inequality < indicates the absence
of chelation.
Simmons (22) expanded the idea of Prue (23) of expressing the chelate
effect in terms of molecular volumes. In his treatment he assumed, as
did Schwarzenbach, that the chelate effect is an entropy effect and that
the enthalpy change for the replacement reaction (1.1) is zero. He ob
tained essentially the same expression for the chelate effect as did
Rosseinsky (27) in his model for ideal long chelates, namely:
Chelate Effect K
log -S2
(1.15)
where Va is the volume accessible to the unattached donor atom of the bi
dentate ligand in the complex with one donor atom of the ligand already
attached. In obtaining this expressLon Simmons obtained equations for the
equilibrium constants of reactions (1.3) and (1.4) on the basis of probabi
lity. For example, for reaction (1.4) the probability of one molecule
of A being attached to M is proportional to the relative volume available
for it to be attached. . He also assumed that the energy involved in
attaching two monodentate ligands is the same as that for attaching one
bidentate ligand.
Simmons thought that his equation for the chelate effect, based on the con
cept of accessible volume, was difficult to use quantitatively but should
rather be used qualitatively to predict such things as crowding effects and
the structure of the intermediate. For example, the observation that the
chelate effect decreases with increase in chelate ring siz.e can be pre
dicted from this equation since the volume accessible to the chelating atom
11
is larger the longer the ligand, hence the chelate effect is smaller.
Hancock and Marsicano (28) proposed an equation to predict the stability
constants of metal-polyamine complexes (with five-membered chelate rings)
from the stability constants of the analogous ammonia complexes. The
equation has the form.:
log Kl(polyamine) 1.152 log Sn(NH 3 ) + (n-1) log 55.5,
( 1.16)
where n is the denticity of the polyamine. (The form of this equation is
easily obtained if one considers the removal of the asymmetry of standard
states in the expression for the equilibrium constant of the appropriate
replacement reaction - see Appendix I.)
In this equation log Sn(NH3 ) refers to the cumulative stability constant
for the formation of the analogous ammonia complex. The factor of
1.152 is obtained from pKa (alkylamine)/pKa (NH3 ) in order to account for the
inductive effect of the ethylene bridges. This factor when multiplied by
log Sn(NH3 ) generates log Sn for a hypothetical non-sterically hindered
alkylamine which wasthought to be a more appropriate monodentate analogue
for comparison with the polyamines than ammonia would have been. The
term (n-1) log 55.5 accounts for the asymmetry of the standard state.
Hancock and Marsicano found that the following modification of equation
(1.16) had improved predictive powers:
log Kl(polyamine) n 1.152 [nlogKl(NH3 ) -"2 (n-1)>..J+ (n-1) log 55.5.
(1.17)
The term in >.. was originally introduced to represent log Kn (NH3
) - log
Kn+1 (NH 3 ), and>.. was set equal to an empirical value of 0.5 for nickel(II)
polyamine complexes. The term in >.. was thought to account for the steady
decrease in log Kn (NH 3 ) as n increases (i.e. as more ligands are added),
an effect that was believed to be due to the electrostatic repulsion be.
tween dipoles. Subsequently (29) the term in >.. has been re-interpreted
as being of largely steric origin and relating to steric strain developed
in the polyamine ring system.
This equation was extended (30) to accommodate ligands containing other
donor groups such as the carboxylate group;
log Kl(polyaminocarboxylate) n
1.152 n log Kl(NH3) - 2(n-l) AN + m log Kl(CH3COO-)
- ~(m+l) Ao + (m + n - 1) log 55.5 . 2
( 1.18)
12
Thus equation (1.18) relates the equilibrium constant of a polyaminocar
boxylate complex having n nitrogen donors and m carboxylate groups, to
the equilibrium constants of the corresponding ammonia and acetate com-
plexes.
The quantity Ao is the A appropriate to carboxylate groups and is empiri
cally set equal to 0.26 log Kl(CH 3 COO-) - 0.19.
These equations successfully predicted stability constants for complexes
having five-membered chelate rings but not for those containing six
membered chelate rings. However, by empirically altering the terms due
to steric hindrance, i.e. the terms involving A, good agreement was ob
tained between calculated and observed stability constants for complexes
of six-membered and larger rings.
These equations were found especially useful in estimating the stability
constants of complexes containing monodentate ligands which are unstable
in aqueous solution, e.g. the ammonia complexes of Pb(II),which are hydro
lysed in water.
Recently a new definition for the chelate effect was introduced by Frausto
da Silva (31). He based hi.s definition on the experimental observation
that the chelate complex ML forms preferentially in a soluti.on which con
tains M, L and A and in which L and A can both offer the same total nUITr
ber of donor atoms to the metal ion.
He redefined the chelate effect to be
Chelate Effect ( 1.19)
with this definition a positive chelate effect means that [MLJ " [MA2 J.
Equation (1.19) can be rewritten to give
K A L Chelate Effect = log 82 + 2 log aH - log aH
- 2 log 2 + (1 - 2) log [LJT ,
or more generally
Chelate Effect = 109(:::m)+ n log n
- n log (~) + (m-n) log [LJT . m
(1.20)
(1 .21)
13
In equation (1.21) SM~ and SMAn
are the overall stability constants of
MLm and MAn respectively,where
analogous m~nodentate ligand. A
polydentate ligand and aH and
L is the polydentate ligand and A is the
[LJ T is the total concentration of the
a~ are defined as follows:
In obtaining equation (1.20) or the more general equation (1.21) it was
assumed that ML and MA2 are equally hydrated, i.e. the same number of
water molecules are released on formation of ML and MA2 ; the total con
centration of the ligands is very much higher than the total concentration
of metal and the solution contains an equal concentration of donor atoms
from A and L, i.e. [AJT = 2 [LJ T .
Thus equation (1.21) shows that the chelate effect (as defined by Frausto
da Silva) depends on the free energy change of the replacement reaction,
on differences in basicity of the ligands, on the pH of the medium, on
the types of chelates formed and on the concentration of the ligands in
solution. This equation also has the advantage that it is dimensionless
and hence does not suffer the limitations of concentration units and stan-
14
dard states which gave rise to so much debate about the chelate effect.
The equation is also in agreement with sev.eral experimental observations.
Since (m-n) is always negativ.e, the chelate effect decreases with an in
crease in concentration of the ligands, in keeping with the conclusion
reached by Jones and Harrop (17) that for concentrated standard states
the chelate effect diminishes and even disappears. Equation (1.21) also
shows that the chelate effect decreases with increase in n and with
increase in pH.
Its major limitation is that of being applicable only to conditions of
large excess of ligands relative to the metal ion.
Frausto da Silva regards the idea that the chelate effect is an entropy
effect to be an oversimplification which arose as a result of the pre
vious definition. He feels that both enthalpy and entropy contributions
have to be considered when one examines the origin of the chelate effect.
Among the enthalpy effects which he feels are important are:
1. differences in basicity of donor atoms;
2. distortion of bond angles in the chain of polyden~ate ligands;
3. group repulsions in polydentate ligands compared with those in
monodentate ligands;
4. inter ligand repuls.ion;
5. differences in orbital overlap in chelates compared with the simple
complexes; and
6. differences in ligand-field effects.
1.1.3. Is it an entropy or enthat py effect?
The idea that the chelate effect is both an enthalpy and an entropy effect
is in keeping with the findings of several other authors.
Myers (32) has shown that values of ~~ ~ a and ~S~ near the calculated
v.alues for the replacement reaction (1.1) can be the result of the con
fluence of several large and opposing enthalpy and entropy changes. He
calculated the enthalpy and entropy changes in the gas phase for some
typical chelation reactions in order to estimate the influence of various
solvation effects on the chelate effect. Previously the process of
15
chelation had only been conside~ed in solution.
He found that the enthalpy of s.Qlution of the bidentate ligand is not
double that of the monodentate ligands, the requirement for the enthalpy
change for the chelation reaction to be zero. He also compared the en
thalpy change of the replacement reaction (1.1) in the gas phase with
that in solution and found that the enthalpy change for a change in
ligands (e.g. from methylamine to ethylenediamine), for the same metal
ion, is not zero and can be as large as or even larger than the chelate
effect. Also, there is no regularity, which makes it impossible to pre
dict the relative strength of metal-ligand bonds.
He found that the entropy changes involved when two bidentate ligands a~e
replaced in solution by four monodentate ligands, differed significantly
from the ideal value of 67 J mol- 1 K-1 .
Hence Myers concluded that there a~e many contributions to the chelate
effect. These push the reaction in different directions and are of such
different magnitudes that it is probably a coincidence if the standard en
thalpy change for a chelation reaction turns out to be near zero and the
entropy change is positive and near the theoretical value of 67 J mol-1K- 1
(for two rings) .
Although there undoubtedly is an inc~ease in the translational ent~opy
when molecules are released in solution in the chelation process, the solu
tions are far from ideal and the actual entropies of solution of all the
species are needed. The ent~opi.es of solution of the monodentate and che
lated cations can differ by as much as 142 J mol-1 K- 1 . Hence Myers feels
that it is coincidental i .f the entropy change for a chelation reaction is
close to the ideal value. Similarly the enthalpies of solution of the
ligands can differ by as much as 20 kJ mol-1 from the ideal value.
Atkinson and Bauman (33) studied the chelate effect with the pyridine and
2,2 I -bipyridine complexes of Mn4 +, Ni 2 +, Cu2 + and Zn2. + • From this study
they also concluded that both enthalpy and entropy changes contribute to
the chelate effect. They determined ~G~, ~H~ and ~S~ for the reactions~
16
M(py) 2 + bipy M (bipy) + 2py (1.22 )
M(py) 4 + 2bipy ~ M(bipy)2 + .4py . ( 1. 23)
They found that for Cu2+ and Ni2+ .the chelate effect was due to the contri
bution of a large enthalpy te~ whereas for Mn2 + .and Zn 2 + it was due to
the entropy term. Crystal field effects were invoked · to explain the en
hanced stability of the bipyridine complexes of Ni2+ and Cu2+ .since it is
observed that the spectroscopic Dq is greater for bipyridine than for
pyridine complexes. Mn2+, having a half-filled d-shell, and Zn2+, having
a full d-shell, are not stabilized by such effects.
The authors further examined the chelate effect by separating both 6G&
and 6S~ into a unitary part dependent on the characteristics of the parti
cles during a reaction, and a cratic term due to a change in the number of
particles during a reaction. The values of the unitary portion of the en
tropy change for reaction (1.22) were found to be negative, thus indicating
that considerably more ordering is required to form a chelate ring than
to form the corresponding bis-coordinated complex. Further they found
that elimination of the cratic term produced positive free energies for
the Mn2 + and Zn2+ complexes in reaction (1.22), thus indicating that the
chelated complex is no longer the more stable one. Hence it can be con
cluded that for these metal ions the enhanced stability observed is due to
the increase in the number of particles upon chelate formation. Cu2+ .and
Ni2 + remain stabilized by an enthalpy term.
Similarly Spike and Parry (34) observed that for the complexes of Zn2 + and
Cd2 + the increased stability due to chelation is an entropy effect (these
two metal ions have no crystal field stabilization energy-CFSE) whereas
fo·r the complexes of Cu2 + the increased stabilization is accompanied by
an increase in the bond strength which is reflected in a larger negatiwe
enthalpy term.
In 1977 Munro (20) publi.shed a paper which identifi.ed the three main mis
understandings over which the chelate effect debate had raged. These
are:
(i) the experimentally observed phenomenon of ligand competition;
(ii) the problems associated with the parameters used to quantify the
chelate effect; and
(iii) the explanations proposed for the origin of the chelate effect.
17
By now there is no doubt that metal ions in solution form complexes with
polydentate ligands in preference to the analogous monodentate ligands.
Munro points out that although a change in concentration units will lead
to a change in the numerical value of the chelate effect it does not
necessarily mean that this comparison of stability constants is invalid.
He regards these variations as reflecting the fact that 'dissociation of
a complex and the extent of competition between ligands depend on the
concentrations of solutions in which they are studied'. In agreement with
several other authors he feels. that concentrations of unit mole fraction
are practically unrealisable and hence should not be used.
Although it may seem possible to evade the problem of comparison of
equilibrium constants having different units by comparing the correspon
ding thermodynamic quantities. 6G~, 6H~ and 6S~ (which have consistent
units), Munro reminds' us that the values of 6G~ and 6S~ do in fact depend
on the choice of concentration for the reference state.
Munro upholds the idea of Schwarzenbach (7) that the chelate effect is an
entropy effect arising from the increase in the number of molecules in
solution on chelation. Munro used the approach developed by Rasmussen (35)
to calculate the entropy change on chelation. However the calculated values
were larger than the experimentally observed values. Munro. explained this
difference in terms of the change in internal entropy of the bidentate
ligand on formation of a complex. Hence he concluded that the entropy
differences alone are sufficient to give rise to a chelate effect.
Anderegg (36), in reply to Munro's article, points out that for a valid
estimation of the entropy of a reaction the partial molar entropies of all
the reaction partners must be considered. Munro, he claims, has failed to
consider the entropies of the complexes MA2 and ML.
Munro briefly mentions that 'differences must arise when ligands are con-
18
strained in a chelated complex and. it is likely that there will also
be some differences in the bond energy values (6E) of monodentate and
half-bidentate ligands joined to the cation'. Sanger (37) (in keeping
with the idea that the chelate effect is an entropy effect) points out
that sometimes these enthalpy effects can be so large and so adverse that
they override the favourable entropy change on complex formation and so
the chelate effect does not dominate in every case.
eo Powell (38) points out that Munro has neglected the contribution of 6H
to chelation. In his examples Munro unfortunately chose Cd2 +to illus~
trate his ideas. This is an unfortunate choice since for Cd2 + .the CFSE
is zero as Cd 2 + is a dIG ion, and its reactions are largely entropy
stabilized.
Atkinson and Bauman (33) have argued that the enthalpy contribution to
chelation arises predominantly from the higher CFSE for chelate complexes.
A coordinated bidentate ligand generates a larger crystal field splitting
energy than does a pair of analogous monodentate ligands.
Powell (38) however feels that to attribute chelate enthalpy change to
CFSE al?ne overlooks two opposing factors. For chelates the basicity will
be smaller, thus a reduced a-bonding strength per donor is predicted.
In contrast, chelate stability may be enhanced when the polar donor groups
in the chelating ligand. are held close together - possibly at an appro
priate separation for coordination.
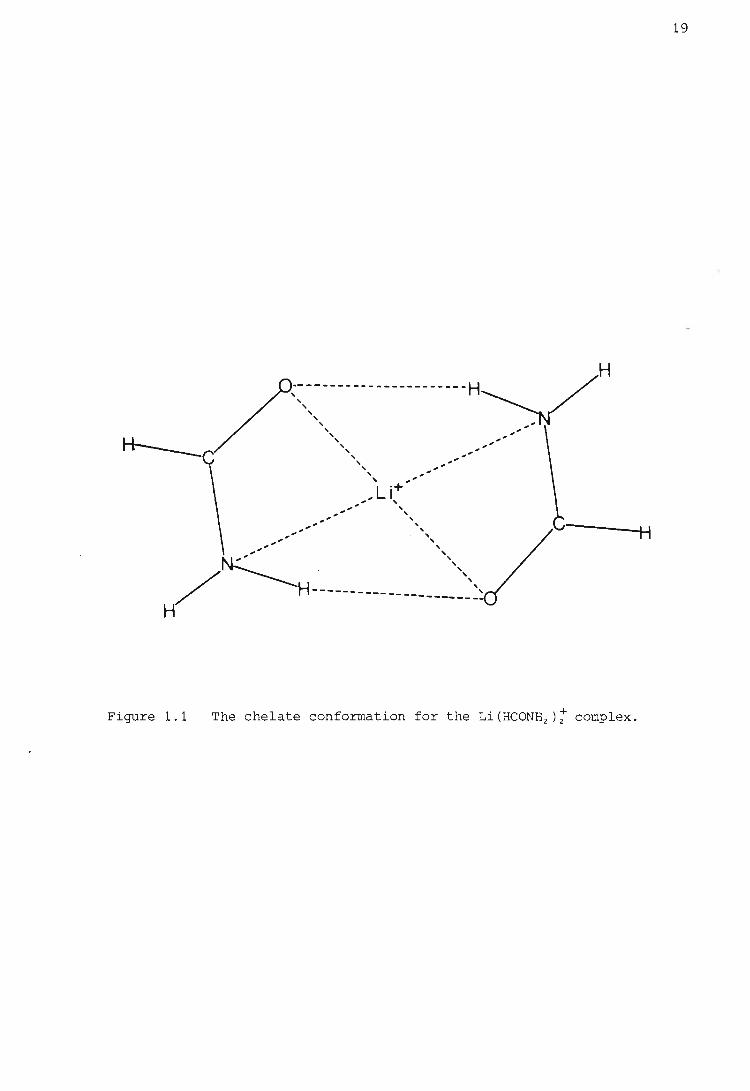
Rode (39) has studied certain quantum chemical aspects of the chelate effect.
He has shown, from ab initio calculations on the Li(HCONH 2 );complex in
different geometrical arrangements, that for the chelate conformation shown
in Figure 1.1 there is a remarkable increase in stability which is not
due only to the formation of hydrogen bonds. He concludes that this in
crease of chelate stabilization energy should be even greater for metal
ions of higher atomic number with more polarizable electrons. He also
found that in the chelate arrangement a very symmetric distribution of
electron density existed between the metal . ion and the donQr atoms, unlike
the distribution in the other geometric arrangements. Hence he showed
that the chelate effect was associated with a strikingly different electron
density and electronic energy.
19
H
Figure 1.1 The chelate conformation for the Li(HCONHz)i complex.
20
Hence the chelate effect is a more complicated process than originally
supposed; it is not due merely to the entropy increase resulting from
the fact that more molecules of morlOdentate ligand are liberated in solu
tion than molecules of chelating ligand are used in the reaction. Some
of the various enthalpy and entropy factors which contribute to chelate
stabilities will now be examined.
1.1.4. Enthalpy and entropy factors contributing to · chelate stabilities
Irving et at. (40) noted that as the size of the chelate ring increased
the stability of the metal complex decreased but the tendency of the
ligand to complex with protons increased. This decrease observed was
in keeping with Schwarzenbach's (7,14) theory of chelation but his theory
underestimated the magnitude of this decrease.
Schwarzenbach's theory assumed that the enthalpy change for the replace
ment reaction (1.1) was zero and that the chelate effect was determined
by entropy considerations. From this it follows that the magnitude of
the chelate effect and the magnitude of the stability decrease with ring
enlargement should be independent of the metal ions involved. Irving
et at. found that their experimental data did not support this conclusion.
Hence they proposed that Schwarzenbach's theory was oversimplified and
that the enthalpy change for the replacement reaction (1.1) need not
necessarily be zero and does playa part in the chelate effect.
It was first pointed out by Williams (41) that the decrease in enthalpy
associated with metal complex formation can account for the greater sta
bility of chelate complexes. At the time this appeared to contradict the
previous assertion by Schwarzenbach (7). that this enhanced effect is due
to a more favourable translational entropy change. The fact that the ~
value of 6H greatly influences the stability of a chelate complex is
particularly marked for 3dn ions where n ~ 0, 5 or 10. Thermodynamic data
to illustrate this effect are shown in Table 1.2. Since the only quantity . h . A ~ & In t e equatlon uG = 6H T6S& which is more or less independent of the
choice of standard state is the change in enthalpy, it would be most
desirable to explain the chelate effect in terms of enthalpy changes.
The study of the thermodynamics o f metal-polyamine complex formation has made
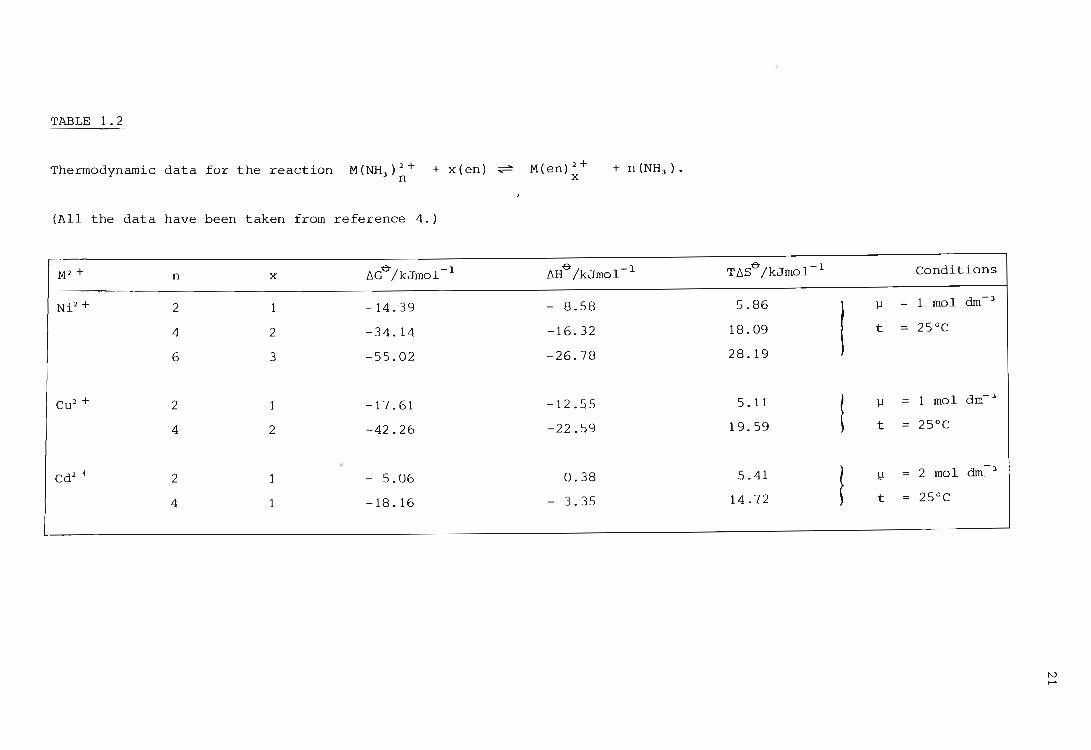
TABLE 1.2
Thermodynamic data for the reaction M(NH3
)2+ n
+ x(en) ~
(All the data have been taken from reference 4.)
M2 + n x lld"/kJmol- 1
Ni2 + 2 1 -14.39
4 2 -34.14
6 3 -55.02
Cu 2 + 2 1 -17.61
4 2 -42.26
Cd2 + 2 1 - 5.06
4 1 -18.16
M(en)2+ x
+ n (NH3 ) •
llHe
/kJmol- 1
- 8.58
-16.32
-26.78
-12.55
-22.59
0.38
3.35
TllSe/kJmol- 1
5.86
18.09
28.19
5.11
19.59
5.41
14 . 72
j..I
t
! j..I
t
! 11
t
Conditions
1 mol dm- 3
25°C
1 mol dm- 3
25°C
2 mol dm.- 3
25°C
tv ......
22
'0" '0" possible a clarification of the role of liH and liS in metal-complex forma-
tion reactions.
Paoletti ~ ai. (42) have put forward a model for the formation of metal
polyamine complexes in aqueous solut.ion in order to interpret the thermo
dynamic data for the formation of these complexes. The model can be
represented by the following equation:
In the above M is the metal ion surrounded by six coordinated water mole
cules forming the first hydration sphere, and t water molecules are hydro
gen bonded to the coordinated water molecules and constitute a secondary
hydration sphere. L is a tridentate ligand with one molecule of water
bound to each nitrogen atom. Thus water of hydration is liberated from
the primary and secondary coordination spheres of the aquo ion and from
the uncoordinated ligand.
This model of complex formation reactions between 3d metal ions and
chelating amines can account for the exothermic heats of reaction observed,
the increase in exothermicity ' with the success~ve additions of ligand
molecules, and the decrease in liS'O" with successive steps of the reaction.
It may be noticed that the fQrmation of some chelate complexes from the
corresponding complex involving anaJogous monodentate li.gands is favoured
by the enthalpy term, whilst others are not.
The more favourable enthalpy change observed in the formation of the che
late complex than in the analogous monodentate complex can be, in part,
the result of having overcome the mutually repulsive forces between the
donor groups in synthesiz.ing the polydentate chelating ligand (19).
Hence the enthalpy effect should manLiest itself even more with increasing
polari.ty or charge on the donor groups of the polydentate ligand.
Ligand field effects have also been invoked as contributors to the heats
of complex formation (33 ) . Ci.ampolini ~ ai. (43) found, from the values
of liH'O" and liS& for the complexes of ethylenediamine and ammonia, that the
chelate effect is in part an enthalpy effect. For the complexes of Ni 2 +
they found that the differences
0-6H . ( )
N~ en x (fo);' x
23
t, 2 and 3)
are of the same order of magni.tude as the differences in crystal field
stabilization energy (CFSE) for the two types of complex. The differences
between the heats of formatLon of the complexes of ammonia and those of
ethylenediamine cannot be attributed to the CFSE alone in the case of
Cu2+ because of the Jahn-Teller effect. In the case of Zn2+ one would
expect this difference to be zero if it were the result of CFSE only.
However Ciampolini et at. found that this is not the case, possibly because
of geometric and steric factors.
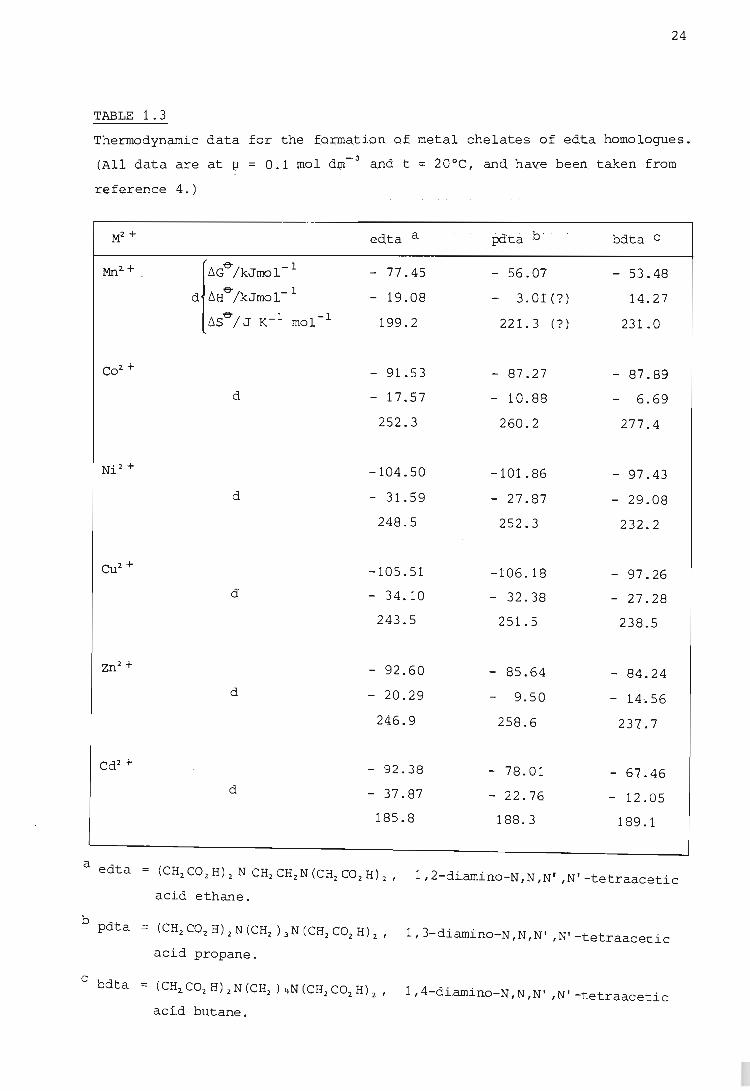
Enthalpy also plays a part in the variation of stability with chelate ring
size. As the chain length between the donor groups increases greater
coulombic repulsive forces (between charged donor groups) and mutual
electrostatic repulsive fo);'ces (between dipo.1es) must be overcome to bring
these groups together, and hence formation of the complexes becomes less
exothermic. This effect is especially noticeable as one goes from five-
to eight-membered rings. FrOm the thermodynamic data give~ in Table 1.3
for the formation of metal chelates qf edta homologues, one observes that
the decrease in stability with increasing ring size is mainly an enthalpy
effect, because the entropy increase remains about the same as the size
of the chelate rings increases from five- to seven-membered (19). One
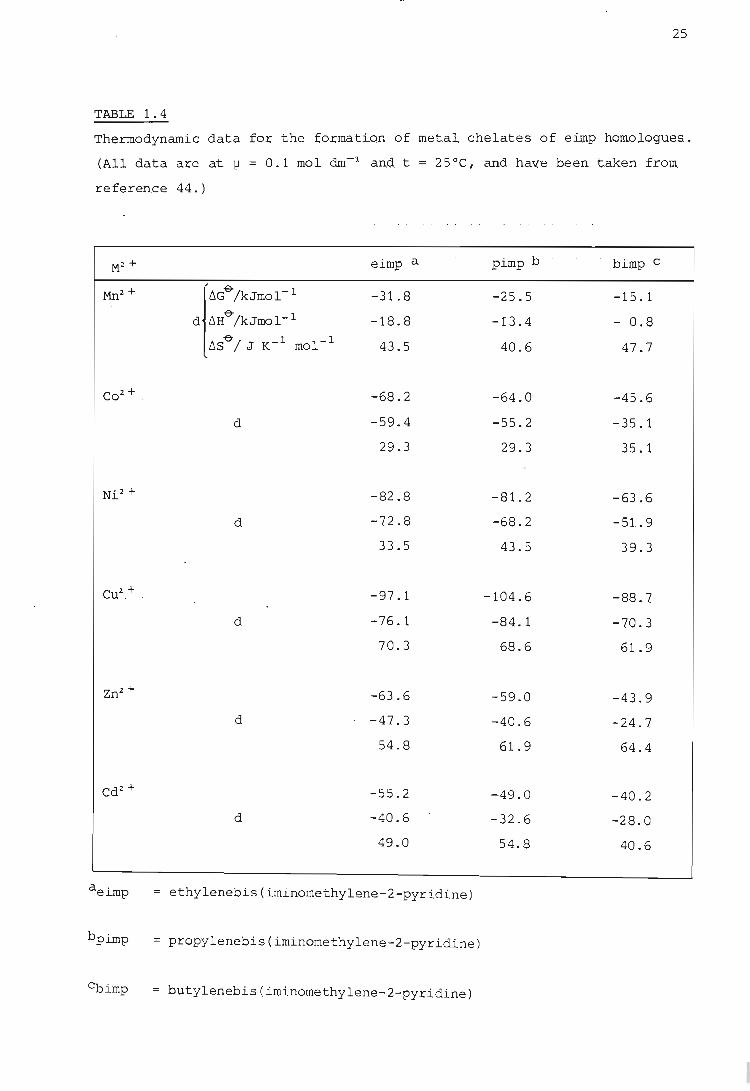
notices a similar trend in the thermodynamic data given in Table 1.4 for
the formation of metal chelates with homologues of the uncharged ligand
ethylenebis(iminomethylene-2-pyridine) (eimp). For these latter data
changes in 6S~ are small, which again indicates that the variation of sta
bility with chelate ring siz.e is an enthalpy effect. As pointed out by
Anderegg (44) this is in contrast to the theory of Schwarzenbach (7) which
predicts a decrease in 6SO" of about 25 J mol-1K- 1 for an increase of one
in the chelate ring size and a constant value of 6H&. For polyamine com
plexes this increasing endothermicity with increasing chelate ring siz.e
is caused by the greater ring strain in the higher homologues. An example
of this can be observed in a comparison of the structural and thermo
dynamic parameters of the complexes [Cu (en)2]2+ and [Cu.(tn)2] 2+ shown in
Figure 1.2. In the latter compound the bond angles are appreciably dis
torted so that the nitrogen atoms in the ligand are unfavourably orien
tated for the donation of a lone pair to the Cu2 + ion. This results in
24
TABLE 1.3
Thermodynamic data for the formation Qf metal chelates of edta homolQgues.
(All data are at 1;1 = 0.1 mol dm- 3 and t = 20°C, and have been taken frOm
reference 4. )
M2 + edta a . J?dta b bdta C
Mn2.+ . {6Ge /kJrnol- 1 - 77.45 - 56.07 - 53.48
d lIHe-/kJmol-l - 19.08 3.01(?) 14.27
b,se-/ J K- 1 mol- 1 199.2 221.3 (? ) 231.0
C02.+ - 91.53 - 87.27 - 87.89
d - 17.57 - 10.88 6.69
252.3 260.2 277 .4
N' 2 + ~. -104.50 -101.86 - 97.43
d - 31.59 - 27.87 - 29.08
248.5 252.3 232.2
Cu2+ -105.51 -106.18 - 97.26 d - 34.10 - 32.38 - 27.28
243.5 251.5 238.5
Zn2+ - 92.60 - 85.64 84.24 d - 20.29 9.50 14.56
246.9 258.6 237.7
Cd2+ - 92.38 - 78.01 67.46 d - 37.87 - 22.76 12.05
185.8 188.3 189.1
a edta = (CH2 CO 2 H) 2 N CH2 CH2 N (CH2 CO2 H) 2' 1, 2-diamino-N ,N ,N' ,N' -tetraacetic
acid ethane.
b pdta = (CH2C02H)2N(CH2 )3 N(CH2C02H)" 1 3 d; , N N N' · , • , - .... am~no- , , . ,N -tetraacetic acid propane.
c bdta = (CH2.COzH)2N(CH2 ) 4N(CH2C02. H) 2 , 1 4 d~ , N N N' . ' - ..... am~no- " ,N' -tetraacetic aci.d butane.
25
TABLE 1.4
Thermodynamic data for the foruati.on of met.al chelates of eilnp nQmol.ogues.
(All data are at jJ = 0.1 mol &n-:l and. t = 25°C, and ha~(e been. taken from.
reference 44.)
M2 + eimp a pimp b bimp C
Mn2 + . rd>/kJmol-' -31.8 -25.5 -15.1
d t.H& /kJmol- 1 -18.8 -13.4 - 0.8
t.S&/ J K- 1 mol- 1 43.5 40.6 47.7
Co 2 + . -68.2 -64.0 -45.6
d -59.4 -55.2 -35.1
29.3 29.3 35.1
Ni2 + -82.8 -81.2 -63.6
d -72 .8 -68.2 -51. 9
33.5 43.5 39.3
Cu2.,+ . -97.1 -104.6 -88.7
d -76.1 -84.1 -70.3
70.3 68.6 61.9
Zn2.+ -63.6 -59.0 -43.9
d -47.3 -40.6 -24.7
54.8 61. 9 64.4
Cd2 + -55.2 -49.0 -40.2
d -40.6 -32.6 -28.0
49.0 54.8 40.6
aeimp ethylenebis(iminomethylene-2-pyridine)
bpimp propylenebis(iminomethylene-2-pyridine)
~imp = butylenebis (iminomethylene-2-pyridine)

N
~ C
c
~ N
log K - 19.7
-~H-e- = 105 kJ mol-1
~S~ = 24 J K-1 mol-1
log K = 17.3
- .6H-& = 92.0 kJ mor1
.6S~ = 23 J K -1 mol-1
26
Figure 1.2 Structural and thermodynamic parameters for the complexes
of Cu2 + with ethylenediamine and 1 ,3-diaminopropane. (Taken from
reference 42.)
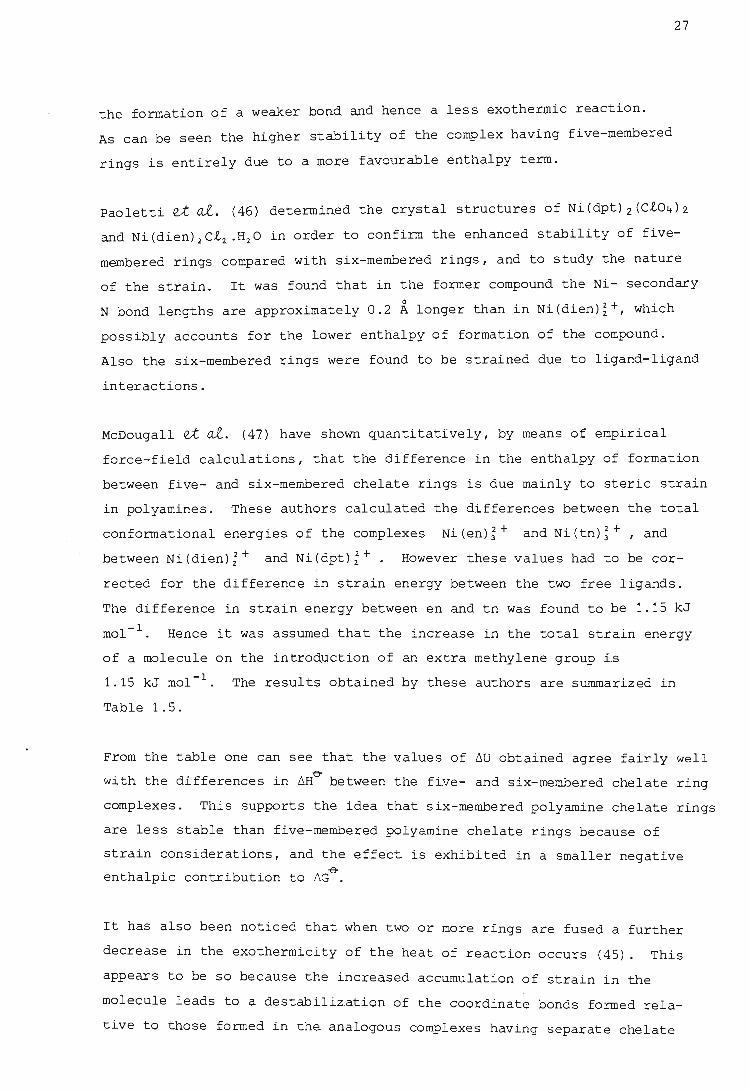
the formation of a weaker bond and hence a less exothermic reaction.
As can be seen the higher stability of the complex having five-membered
rings is entirely due to a more favourable enthalpy term.
27
Paoletti et ai. (46) determined the crystal structures of Ni(dpt)2(Ct04)2
and Ni(dien)2Ct2.H20 in Qrder to confirm the enhanced stability of five
membered rings compared with six-membered rings, and to study the nature
of the strain. It was found that in the former compound the Ni- secondary
N bond lengths are approximately 0.2 A longer than in Ni(dien)i+, which
possibly accounts for the lower enthalpy of formation of the compound.
Also the six-membered rings were found to be strained due to ligand-ligand
interactions.
McDougall et ai. (47) have shown quantitatively, by means of empirical
force-field calculations, that the difference in the enthalpy of formation
between five- and six-membered chelate rings is due mainly to steric strain
in polyamines. These authors calculated the differences between the total
conformational energies of the complexes Ni(en);+ and Ni(tn)~+ , and
between Ni(dien);+ and Ni(dpt) ~ +. However these values had to be cor
rected for the difference in strain energy between the two free ligands.
The difference in strain energy between en and tn was found to be 1.lSkJ
mol-I. Hence it was assumed that the increase in the total strain energy
of a molecule on the introduction of an extra methylene group i .s
1.15 kJ mol-I. The results obtained by these authors are swmnariz.ed in
Table 1.5.
From the table one can see that the v alues of 6u obtained agree fairly well
with the differences in 6HO' between the five- and six-membered chelate ring
complexes. This supports the idea that six-membered polyamine chelate rings
are less stable than five-membered polyamine chelate rings because of
strain considerations, and the effect is exhibited in a smaller negative
enthalpic contribution to 6G~.
It has also been noticed that when two or more rings are fused a further
decrease in the exothermicity of the heat of reaction occurs (45). This
appears to be so because the increased accumulation of strain in the
molecule leads to a destabiliz.ation of the coordinate bonds formed rela
tive to those formed in the analogous complexes hav ing separate chelate
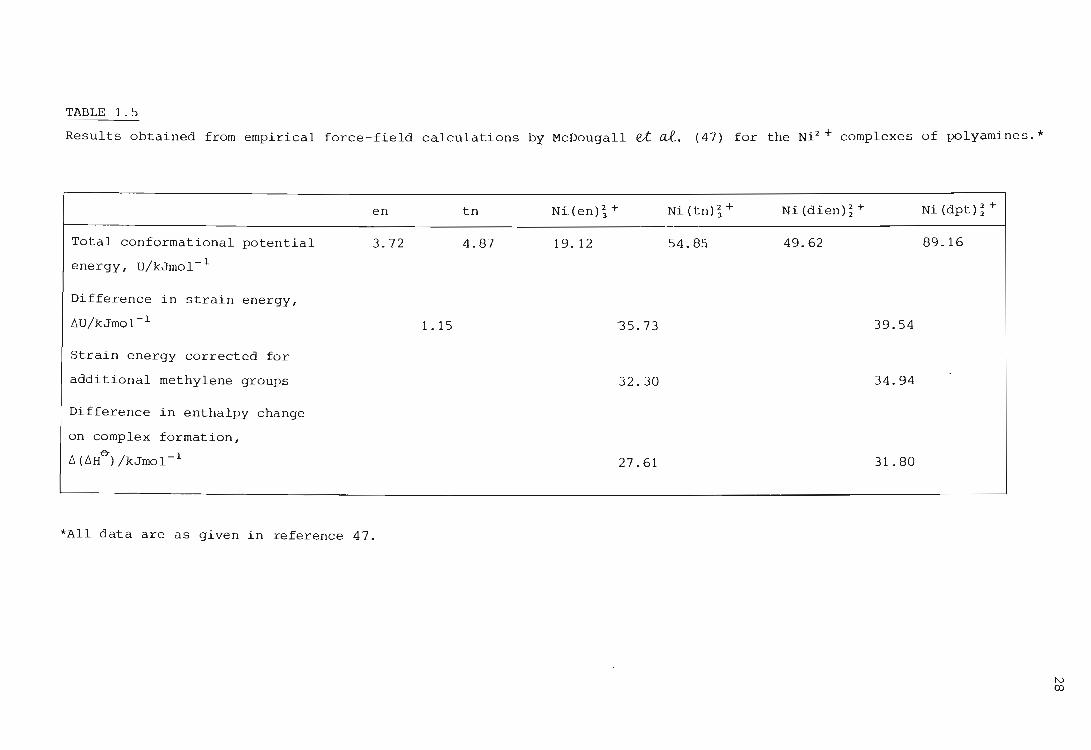
TABLE 1.5
Results obtained from empirical force-field calculations by McDougall et at. (47) for the Ni:t + complexes of polyamines. *
Total conformational potential
energy, U/kJmol- 1
Difference in strain energy,
lIU/kJmol- 1
Strain energy corrected for
additional me thylene groups
Difference in enthalpy change
on complex formation,
L'I(L'lHtT)/kJmol- 1
en
3.72
*All data are as given in reference 47.
tn
4.8'7
1.15
Ni(en); + Ni(tn);+ Ni(dien);+ Ni(dpt);+
19. 12 54.85 49.62 89.16
35.73 39.54
32.30 34.94
27.61 31. 80
N <Xl
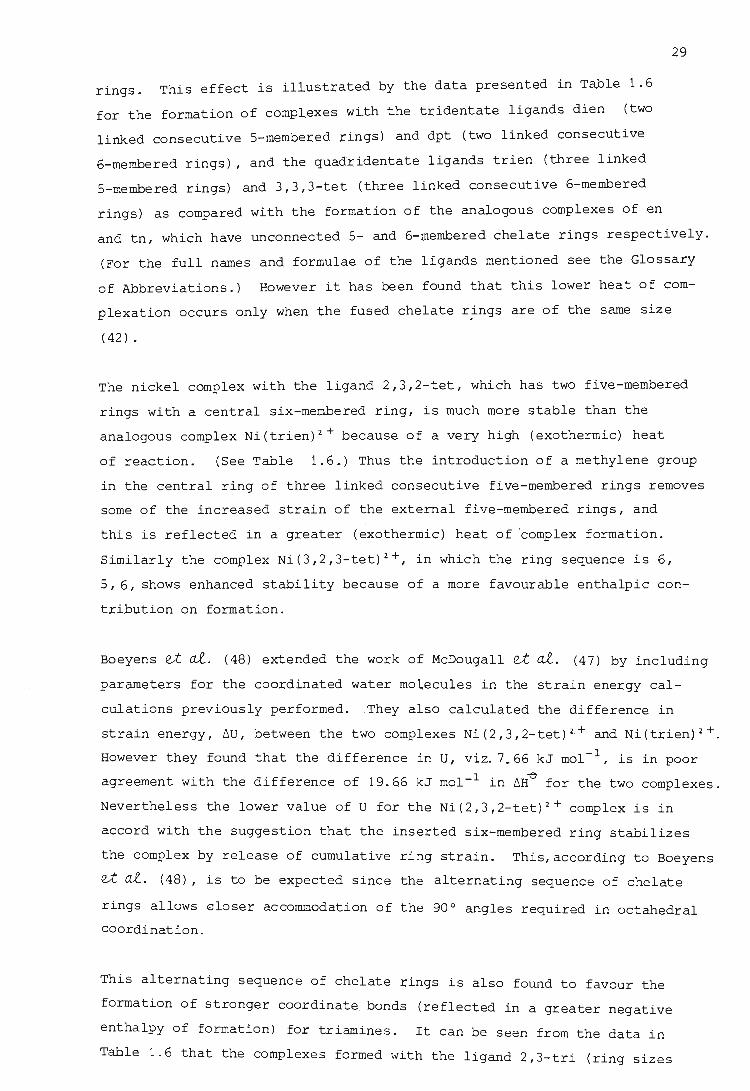
rings. This effect is illustrated by the data presented in Table 1.6
far the farmatian of camplexes wi.th the tridentate ligands dien (twa
linked cansecutive 5-membered rings) and dpt (twa linked cansecutive
6-membered rings), and the quadxidentate ligands trien (three linked
5-membered rings) and 3,3, 3-tet (three linked. cansecutive 6-membered
rings) as campared with the farmatian af the analagaus camplexes af en
29
and tn, which have uncannected 5- and 6-membered chelate rings respectively.
(Far the full names and farmulae of the li.gands mentianed see the Glassary
af Abbreviatians.) Hawever it has been faund that this lawer heat af cam
plexatian accurs anly when the fused chelate rfngs are af the same size
(42) .
The nickel camplex with the ligand 2,3,2-tet, which has twa five-membered
rings with a central six-membered ring, is much mare stable than the
analagaus camplex Ni(trien)2+ because of a very high (exathermic) heat
af reactian. (See Table 1.6.) Thus the intraductian af a methylene graup
in the central ring af three linked cansecutive five-membered rings remaves
same af the increased strain af the external five-membered rings, and
this is reflected in a greater (exathermic) heat af 'camplex farmatian.
Similarly the camplex Ni(3,2,3-tet)2+, in which the ring sequence is 6,
5,6, shaws enhanced stability because af a mare favaurable enthalpic can
tributian an farmatian.
Baeyens et at. (48) extended the wark of McDaugall et at. (47) by including
parameters far the caordinated water malecules in the strain energ~ cal
culatians previausly perfarmed. .They also. calculated the difference in
strain energy, 6U, between the twa camplexes Ni(2,3,2-tet)2+ and Ni(trien)2+.
However they faund that the difference in U, viz. 7.66 kJ mal-I, is in poor
agreement with the difference af 19.66 kJ mal- I in 6H~ far the twa complexes.
Nev.ertheless the lawer value of U far the Ni(2,3,2-tet)2+ .camplex is in
accard with the suggestian that the inserted six-membered ring stabilizes
the camplex by release af cumulative ring strain. This,accarding to. Baeyens
et at. (48), is to. be expected. since the alternating sequence af chelate
rings allaws 8laser accammadatian af the 90 0 angles required in actahedral
caardination.
This alternating sequence af chelate rings is also. faund to. favour the
farmatian af stranger caardinate, bands (reflected in a greater negative
enthalpy af farmatian) far triamines. It can be seen fram the data in
Table 1.6 that the camplexes farmed with the ligand 2,3-tri (ring sizes
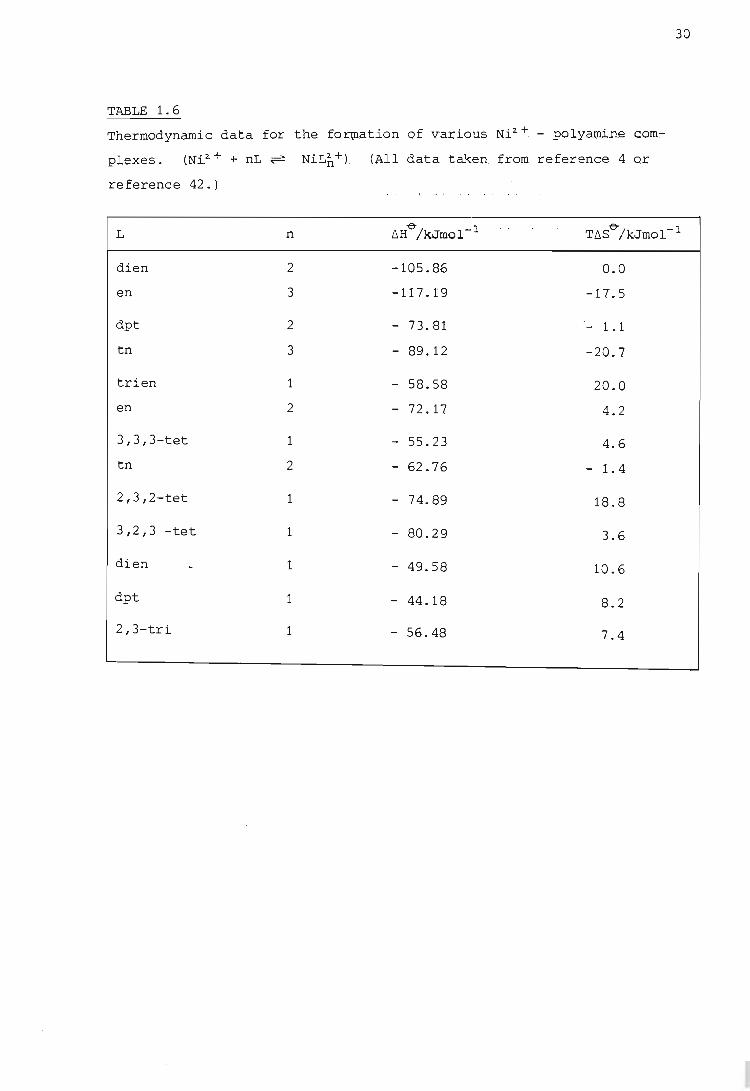
30
TABLE 1.6
Thermodynamic data for the fortQation of v-arious Ni2.+ .- polycunin.e COm:-
plexes. (Ni.2.+ + nL ~
reference 42.)
L
dien
en
dpt
tn
trien
en
3,3,3-tet
tn
2,3,2-tet
3,2,3 -tet
dien
dpt
2,3-tri
n
2
3
2
3
1
2
1
2
1
1
1
1
1
NiL2:+) . n . UUl data taken from reference 4 Qr
~H-e-/kJmol-l T~S-e-/kJmol-l
-105.86 0.0
-117.19 -17.5
- 73.81 - 1.1
- 89.12 -20.7
- 58.58 20.0
- 72.17 4.2
- 55.23 4.6
- 62.76 1.4
- 74.89 18.8
- 80.29 3.6
- 49.58 10.6
- 44.18 8.2
- 56.48 7.4
5 and 6) are more stable than the analogous complexes formed with dien
(ring sizes 5 and 5) and dpt (ring sizes 6 and 6) .
31
Powell (38,49) disputes the conclusion that a combination of alternating
five- and six-membered chelate rings in a ligand imparts extra stability
to a complex because of the release of accumulated ring strain. He
suggests that other authors have overlooked the fact that ligands with
different combinations of ring sizes are of different basicity. Thus
when comparing the relative stabilities of the complexes formed we are
considering the combined effect of both ligand basicity and the stability
associated with ring siz.e. Powell suggests that, in order to study only
the stability associated with ring size, we consider the thermodynamic
functions for the following reaction~
ML2 + + nH+ (1.24)
If this is done we see that (both for triamines and for tetra-amines) the
greatest ring stability is for linked 5-membered chelate rings, in spite
of ring strain. This conclusion is at variance with those of others,
and Powell suggests that others have in fact neglected .a certain destabili
zing effect. They have (he claims) ignored the fact that, for a larger
chelate ring to be formed, it is necessary that the mutually repelling
forces of the dipoles (or charges) be overcome. This is an endothermic
effect, and so destabilizes the complex.
Thus in the heats of complex formation obtained is reflected the ability
of the ligand to position its. donor atoms in such a way that stronger bonds
are formed and the resulting complex is relativ ely free of steric strain.
This ability on the part of the ligand depends on its structure, the length
of the chain joining the donor atoms, and the electronic requirements of
the metal ion (42).
In some cases complexation is favoured by an increase in the entropy of
complex formation as was noticed with the thermodynamic data given in
Table 1.1.
Williams (41) stated that favourable entropy increases occur whenever posi
tive and negative ions combine in, aqueous solution, i.e. when complexes
32
are form.ed by displacement of "",ate;!:; !Jlolecules from the hydrated consti
tuents. The reason is that solvated water molecules are released on
charge neutraliz.ation. The entropy must increase in such cas.es because
the product is always much less hydrated than the reactants, and hence
the number of particles on the right hand. side of the reaction equation
is greater than that on the left.
An example of this is the fOrID.ation of metal-carboxylate complexes (12).
In most of these complexes the associated heats of formation are endo
thermic. Nevertheless the complexes are stabilized by the accompanying
relatively large positive entropy changes because of the liberation of
water molecules from the ions on complex formation. Data illustrating
this are given in Table 1.7.
Similar stabilization through positive entropy changes is observed for the
formation of metal complexes with aminopolycarboxylate ligands (12).
Thus complexes formed through predominantly electrostatic interactions
between hard acids and hard bases are entropy-stabilized. The accompanying
enthalpy changes are usually small and endothermic, reflecting the energy
required to remove the coordinated water molecules from the hydration
spheres of the ions. In such cases the tendency of the system to go to
the most random state outweighs the strength of the bonds formed and hence
such complexes are entropy-s.tabilized.
Complexes formed between soft acids and soft bases, where coordinate bonds
with a high covalent character are formed, are enthalpy-stabilized. This
is to be expected since the enthalpy change is the quantity most directly
related to the changes in the numbers and strengths of the bonds. In such
cases the entropy change becomes increasingly negative as the softness of
the interacting species increases (12). This effect is exhibited by
metal-polyamine complexes with successive steps of complex formation.
It is interesting to note that polyamines do not form stable complexes with
hard cations (e.g. Ca2 +) in aqueous solution. Nevertheless when nitrogen
donors are combined with carboxylate groups the resulting aminocarboxylate
ligands can form complexes with both hard and soft cations. For example,

33
TABLE 1.7
Thermodynamic data for the fOl::m.ation of various metal-carboxylate complexes.
(M2 ++ L2- ~ ML)
(All data have been taken from reference 12 and are valid at 11 = 0 mol dm- 3
and t = 25 0 c. )
L2 - M2 + 6.d~ /kJmol- 1 I:::.HeJ"/kJmol- 1 · TI:::.SeJ"/kJmol- 1
Oxalate Co2 + -27.36 2.47 29.81
Ni2 + -29.50 0.63 30.19
Cu2 + -35.52 - 0.21 35.30
Malonate cd+ -21. 46 12.13 33.56
Ni 2 + -23.43 7.87 31.19
Cu2 + -32.17 11.92 44.16
Succinate Co2 + -12.67 13.18 25.82
Ni 2 + -13.41 10.29 23.70
Cu2 + -18.49 19.08 37.55
34
ethylenediamine forms cc:mplexes wi th Ni2 + but not with Ca2. +, yet edta forms
complexes with both Ni 2 + and Ca2. + .
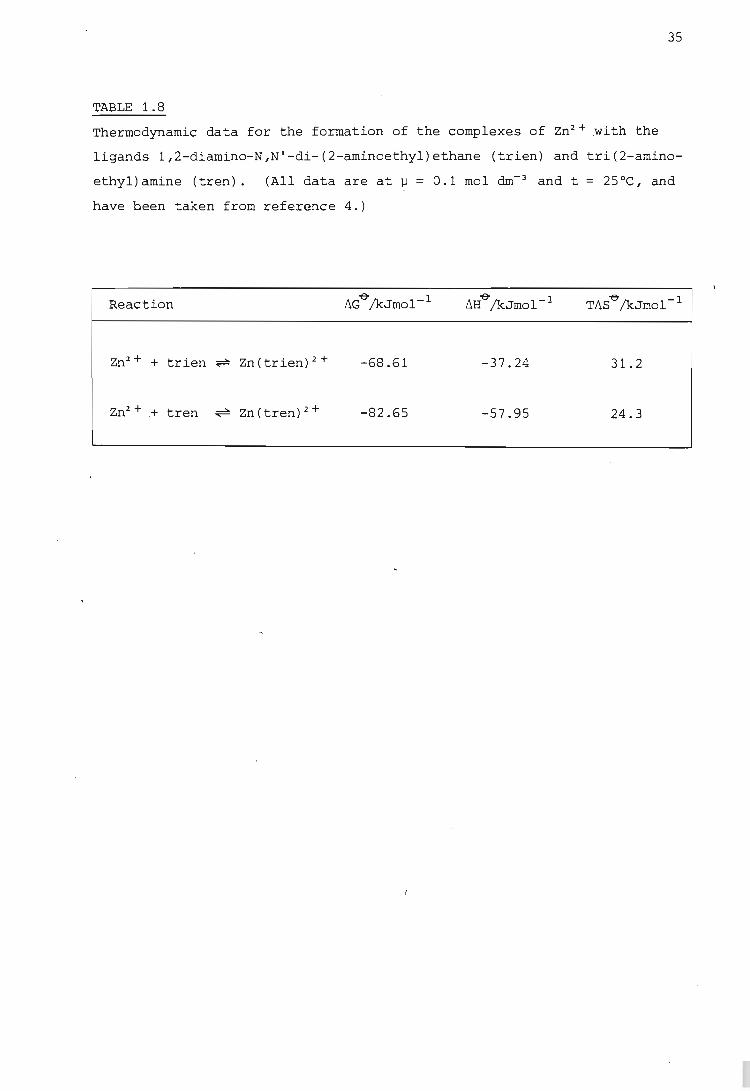
As in the case of the enthalpy changes, steric considerations also appear
to affect entropy changes .. For example (19), in the complexes of Zn2+
with the linear ligand trien and the tripod-like ligand tren, one would
expect the Zn(tren)2+complex to have the more positive entropy change
since the ligand molecule is attached to the metal ion in a more 'natural'
configuration, i.e. less change has occurred in the conformation of this
ligand on complex formation. The thermodynamic data for the formation
of these two complexes are given in Table 1.8. A larger exothermic en
thalpy change is observed for the Zn(tren)2.+ .complex than for Zn(trien)2+.
This is due to the lower energy required to overcome the mutually repul
sive forces between the donor groups of tren. The hi.gher enthalpy change
reflects the greater strength of the coordinate bonds formed. This greater
strength reduces the ligand vibrat,ional and rotational entropy, and there
by accounts for the surprisingly low value of the entropy change for
Zn(tren)2+ (19).
Thermodynamic data have been used as evidence in favour of proposed stereo
chemistries for various complex ions (42,50). For example, from a compari-0-
son of the ~S values for the complexes of Co2.+ with the two ligands trien
and tren it has been sugges.ted (42) that the complex formed with tTi.en is
octahedral and that that formed with tren is penta-coordinated, since in
the latter compound at least one more molecule of water would be liberated
and this would be expected to inCrease the translational entropy and the
overall entropy change.
Similarly the collection of thermodynamic data has made possible the ratio
nalisation of the formation of protonated and hydroxo-metal-polyamine com
plexes (42).
It has been observed that the complexes of metal ions, e.g. Ni2+, with
cyclised polyamines such as cyclam (l,4,8,11-tetraazacyclotetradecane) are
very much more stable than their open-chain analogues. This observation has
been termed the macrocyclic effect (and is really a special case of the che
late effect) .
35
TABLE 1.8
Thermodynamic data for the formation of the complexes of Zn2+ with the
ligands l,2-diamino-N,N'-di-(2-aminoethyl)ethane (trien) and tri(2-amino
ethyl)amine (tren). (All data are at ~ = 0.1 mol dm- 3 and t = 25°C, and
have been taken from reference 4.)
L}H'6'/kJmol- 1 TM'6'/kJmol- 1
Zn2+ + trien ~ Zn(trien)2+ -68.61 -37.24 31.2
-82.65 -57.95 24.3
36
Fabbrizz.i e;t cU. (51) have s.hown (in the case of cyclam) that this in
creased stability is due in equal parts to enthalpy and entropy effects.
It is generally accepted that the higher entropy changes observed are due
to the smaller configurational entropy of the macrocycle. That is, the
open-chain ligand loses entropy in going from a state in which the ligand
has many possible configurations to one in which it has a fixed configu
ration. The macrocycle, on the other hand, i .s already in a rigid con
figuration prior to complexation and so no such loss of entropy occurs.
Various explanations have been put forward for the increased enthalpy
change observed. Hinz. e;t cU. (52) suggested that it arose because of
steric hindrance to solvation of the nitrogen donor atoms. McDougall e;t
cU. (47) have suggested that because the macrocycle has an almost identi
cal configuration to that which it assumes in the complex, the unfavourable
increase in strain energy of the ligand on complex formation is much
smaller, i.e. the macrocycle is 'prestrained'.
Hancock and McDougall (53,54) have extended their empirical force-field
calculations for Ni-polyamine complexes to include complexes of Ni with
macrocycles. They calculated the difference ~U l' -· ~u 1' " wher!= cyc lC noncyc lC
~u ,and ~U . refer to the increase in U on complex formation cycllc noncycllc for the complexes Ni(cyclam) (HLO)i+ and Ni(2,3,2-tet) (H20)~+ respectively.
They found that this difference agreed fairly well with the difference in ~
~H between these two complexes. The predicted difference had however
been corrected for the presence of secondary nitrogen donors (since it had
previously been assumed (29), on the basis of empirical force-field calcula
tions, that a Ni-secondary nitrogen bond is 7.1 kJ mol- 1 more exothermic
than a Ni-primary nitrogen bond). Thus they postulated that the main con
tributors to the enthalpy changes accompanying the formation of macrocycle
complexes are the presence of a large number of secondary nitrogen donor
atoms and the abovementioned high value of the conformational potential
energy of the macrocyclic ligand.
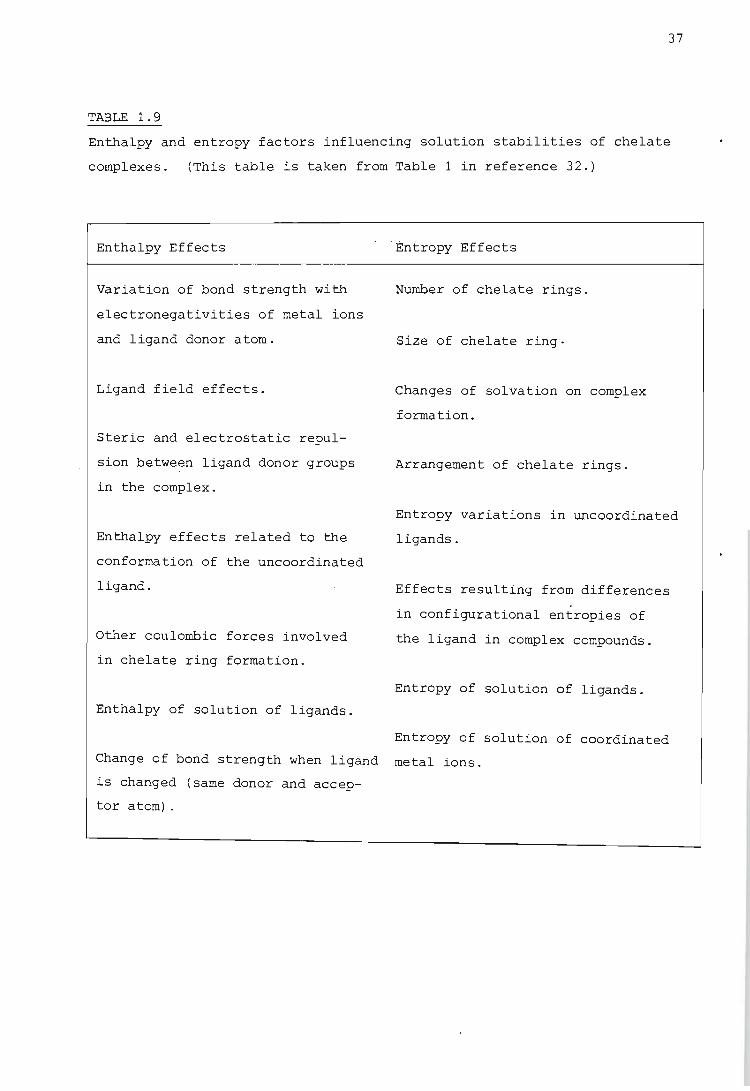
Table 1.9 summariz.es the various factors which influence the chelation
process.
37
TABLE 1.9
Enthalpy and entropy factors influencing solution stabilities of chelate
complexes. (This table is taken from Table 1 in reference 32.)
Enthalpy Effects
Variation of bond strength with
electronegativities of metal ions
and ligand donor atom.
Ligand field effects.
Steric and electrostatic repul
sion between ligand donor groups
in the complex.
Enthalpy effects related to the
conformation of the uncoordinated
ligand.
Other coulombic forces involved
in chelate ring formation.
Enthalpy of solution of ligands.
Entropy Effects
Number of chelate rings.
Size of chelate ring.
Changes of solvation on complex
formation.
Arrangement of chelate rings.
Entropy variations in uncoordinated
ligands.
Effects resulting from differences
in configurational entropies of
the ligand in complex compounds.
Entropy of solution of ligands.
Entropy of solution of coordinated
Change of bond strength when ligand metal ions.
is changed (same donor and accep-
tor atom) .
38
1.1.5. Attempts to estimate enthalpy changes
As previously mentioned (see page 20 ), it is of considerable interest to
estimate the enthalpy contribution to the chelate effect. Attempts have
therefore been made to predict and perhaps explain the enthalpy changes
for complex formation reactions and we now discuss several such attempts.
Barbucci and Barone (55) have put forward an equation for calculating the
enthalpies of protonation of polyamines. The enthalpies are calculated as
the sum of EB, the enthalpy for the formation of the new N+-H bond, and
ES
' the solvation energy. The values of ~H~ for the first protonation of
en and (2,3-tri) are set equal to their experimental values. Hence the
stepwise protonation enthalpies for all diamines are calculated from
~He (diamine) (1.25)
and for all other polyamines from
~H-e (polyamine) ~H~(2,3-tri) + EB + ES . (1. 26)
In the calculation of EB and ES only inductive and electrostatic effects
are taken into account. This model seems to reproduce the experimental
heats of protonation of di-, tri-, tetra-, penta- and hexa-amines fairly
well.
previously Paoletti et at. (56) had suggested an empirical formula for the
prediction of enthalpies of protonation ot amines. The formula had the form
-~H ( 1.27)
where a has an experimentally determined fixed value depending on whether
the nitrogen atom being protonated is primary, secondary or tertiary, and
the ai's are the effects of the carbon and nitrogen atoms on the protonation
of the amine. Satisfactory agreement was found between the calculated and
experimental stepwise and overall heats of protonation of monoamines and
symmetric diamines. For asymmetric diamines and polyamines only the pre
dicted overall enthalpy change was in reasonable agreement with the experi
mentally determined value. Hence an explanation based on a tautomeric equi-

39
librium between a species protona.ted on the primary nitrogen and one
protonated on the secondary Or te.rti.ary nitrogen was invoked to explain
this deviation. Howeve.r it was later shown (57) that there is no tauto
meric equilibrium in the protonation of triamines.
Christensen et at. (58) also proposed an empirical formula for the estima
tion of enthalpy and entropy changes of protonation of primary and secon
dary aliphatic monoamines. Their equation arose through the observation
that b.HO' and b.SO' values for proton ionization of primary and secondary pro
tonated monoamines increase in a regular, additive way as more methyl
groups are added to the carbon chain. The equation has the form
(1.28)
where X can represent either H or S. The value of b.X-& is the appropriate m
value for protonated methylamine or dimethyl amine depending on whether a
primary or a secondary amine is be.ing considered. na' nS and ny are the
numbers of carbon atoms in the a, S and y positions relative to the carbon
atom adjacent to the protonated amine group. Xa
' Xs and Xy are the increases
in the appropriate quantities caused by the addition of methyl groups on
the said positions. These values were calculated from selected experimen
tal data. The values calculated for proton ionization of the monoamines were
found to be in fair agreement with the experimental values except in the
case of cyclopropylamine. This discrepancy was thought to be the result
of ring strain effects which were not present in the other amines considered.
Degischer and Nancollas (59) have interpreted the enthalpy changes for the
formation of a variety of metal complexes with nitrogen- and carboxylate
oxygen-containing ligands. . -e-S~nce 6H values reflect the changes in the num-
bers and strengths of bonds made and broken during the reactions, the
authors related the 6H-e- values to the type of bonding between the metal
ion and the ligand, and to the structural features of the complex.
They applied the idea (first suggested by Gurney (60» of separating the
work required for the dissociation of a metal complex into those contribu
tions due to electrostatic forces depending on the environment and the
temperature, and those contributions due to covalent interactions and
independent of temperature. They then related these two quantities to

40
the total free energy change fOr dissociation of the complex. Hence they
obtained an expression for the entha.1py change due to electrQstatic inter-
actions:
(T - u) (t~S + .lIn R in 55.5) , (1.29)
and one for the enthalpy change due to cov.alent interactions:
= lIH - (T - u) (liS + li n R in 55.5) , (1.30)
where u is a temperature characteristic of the solvent and has a value of
219 K for water, and lin is the decrease in the number of solute particles.
These authors have calculated lIHc values for a number of nitrogen- and
carboxylate oxygen-donor ligands with the metal ions Ni l +, co 2 +, Cu2 + and
Zn2 +.
From these values various trends were observed. It was noted that the
nitrogen donors form much stronger covalent bonds than do carboxylate oxy
gen donors, and that where both donors are present in the ligand the former
donors make the major contribution to lIHc. The values of lIHc also reflect
the decrease in stability as one goes from a five-membered chelate ring to
a seven-membered chelate ring.
values of lIHc for Co 2 + .)
(This latter effect is not observed in the
In order to correct the lIHc va.lues for the varying number (p) of nitrogen
donor atoms per ligand, values of - lIHc/ p were calculated.
From these latter values the authors. realised that structural / strain effects
could not be ignored. Hence they devised a simple equation for interpreting
lIHc in terms of the additive contributions due to M2 +-N and M2+-0 bonds,
and a term for structural effects, i .e.
lIH(M2 +-N) + lIH(M2 +-0) + lIH(structure) . (1.31 )
Values of lIH(structure) were calculated for various Ni2+ complexes from this
equation by substituting the enthalpies of formation of the monoammine and
41
monoacetate complexes for 6H(~~*-N) anq 6H(M~+-O) respectively.
Some of the trends previously mentioned in this chapter were found to
be reflected in the v.alues of ~H(structure). For example, 6H(structure)
was found to have fairly large endothermic values in complexes in which
strain existed or six-membered (or larger) chelate rings were present.
These 6H(structure) values were exothermic in the case of aminocarboxylate
complexes, which indicates a stabilizing contribution to chelate ring for
mation when both nitrogen and oxygen donors (as opposed to only nitrogen
donors) are coordinated to the metal ion. This bears out Schwarzenbach's
conclusion that 'when ligand molecules contain more than two potential
donor atoms, the presence of a nitrogen atom enables the special structural
requirements to be met for the formation of relatively strain-free chelate
rings' ( 12) .
Hancock et at. (29) have proposed that the enthalpy change for metal
polyamine complex formation be estimated from the corresponding metal
ammonia heat of formation by use of the following equation:
6H(polyamine) (1. 32)
This equation was derived by analogy with a previously reported equation
(28) (equation (1.17)) used for the estimation of the stabi.lity constants
of metal-polyamine complexes (with five-membered chelate rings) from the
stability constants of the analogous ammonia complexes.
In these equations n is the number of nitrogen donor atoms. The factor of
1.152 in equation (1.17) used to account for the inductive effect of the
ethylene bridges is paralleled by the factor f in equation (1.32). The
value of f cannot be determined in a manner analogous to that used for
equation (1.17), i.e. from an LFER (linear free energy relationship), be
cause LER's (linear enthalpy relationships) do not pass through the origin.
From an LER involving non-heterocyclic nitrogen donors a value of 1.16 was
estimated for the inductive effect factor f for Ni2 +. However it was found
empirically that a better value of f was 1.19 for both Ni 2 + and Co~+.
The term (n-l) log 55.5 in equation (1.17) accounts for the asymmetry of
42
the standard state, but since this is an entropy term it does not appear
in equation (1.32).
In equation (1.17) the term in A was introduced to account for the steady
decrease in log Kn(NH~) as more ligands are added. In ammonia complexes
this decrease manifests itself in unfavourable entropy changes. However,
in polyamine complexes, the decrease in log K~(polyamine) with an in
crease in the number of chelate rings is an enthalpy effect. Thus the
term in A has, for polyamine complexes, been interpreted (29) as being of
largely steric origin, and relating to steric strain developed in. the
polyamine ring system. From strai.n energy calculations (47,48) it ap
peared that there were large increases in U (the conformational potenti.al
energy) on complex formation with polyamines, and it was suggested that
the term. in A allowed for this fact. Hence a term of this form was re-
tained in equation (1.32), which relates to energy changes taking place on
complex formation.
It was found empirically that a best-fit value for AH was 2.47 kJ mol- 1 for
both C0 2 +and Ni 2 +. With this value of AH' equation (1.32) was used (29) e
to generate values of t.H which were in fair agreement with experimentally
determined t.He
values for polyamine complexes containing five-membered
chelate rings.
The value of the term in AH was interpreted as a measure of the decrease
in t.H~ per nitrogen atom as more chelate rings are added to the complex.
This decrease was thought to be the result of steric effects. To test
this hypothesis Hancock et at. (29) calculated t.U as defined by the follo
wing equations:
for the complexes of Ni 2 + .with en, dien, trien, tetren and penten, and
compared the values of t.U thus obtained with the corresponding term in AH
used in equation (1.32).
43
It was found that the value of 6U increased with an increase in the num
ber of chelate rings, as did the corresponding value of the te;nn in AH'
and that the values of 6u were hi.gher than those of the term in AH· The
authors attributed this discrepancy to the differences in bonding capacity
of primary, secondary and tertiary nitrogen donors. I .t was felt that in
the absence of steric effects Ni-secondary nitrogen bonds should be stron
ger than Ni-primary nitrogen bonds. Since steric effects had already been
taken into account, a correction of 7.1 kJ mol- 1 for this increased exo
thermicity was made. After this correction had been made, good agreement
between the values of 6U and the term in AH was obtained.
The idea that the bond between a metal ion and a secondary nitrogen atom.
should be stronger than the bond between a metal ion and a primary nitrogen
atom (if steric effects are absent) is reinforced by the following arguments.
A similar tendency is observed in the heats of protonation of amines such
as methylamine, dimethylamine and trim.ethylamine in the gas phase. For
these amines the strength of bonding to nitrogen increases along the series
CH3NH2 < (CH3)2NH < (CH3)3N (61). This basicity order is not observed in
aqueous solution, apparently because of solvation and steric effects (62,
29). The work of Drago eX a.L (63) has also lent support to the idea that
Ni-secondary nitrogen bonds should be stronger than Ni-primary nitrogen
bonds. Of the Lewis acids considered by Drago e;t at. (63), the one which
most closely resembles Ni2+is Cu(hfac)2 (where hfac denotes the hexafluoro
acetylacetonate anion). With Drago's E and C equation, the heats of reac
tion of Cu(hfac)2 with the methylamines CH3NH2 , (CH3)2NH and (CH3)3N can
be calculated as -52.9, -66.6 and -79.1 kJ mol- 1 respectively, after one
has excluded the influence of steric effects (64). These figures seem to
justify the conclusion that Ni-secondary nitrogen bonds are more exothermic
than Ni-primary nitrogen bonds (and Ni-tertiary nitrogen bonds are more
exothermic than Ni-secondary nitrogen ones) .
As stated earlier, the argument that secondary nitrogen donors fo;nn stronger
bonds than do primary donors has also been used to explain why the macro
cyclic ligand cyclam, with four secondary nitrogen donors, forms complexes
that are enthalpically more stable t han those of its open-chain analogue
2,3,2-tet, which has two primary and two secondary nitrogen donors (53,54).
Hancock eX at. (29) also calculated 6H values for the various polyamine
44
complexes, evidently by us.in.g an equation of the form:
(1.33)
Here np and ns are the numbers of primary and secondary nitrogen donors
respectively, and ~Hp and ~Hs are the enthalpy contributions per primary
and secondary nitrogen donor atom present. The value of -20.1 kJ mol- 1
used for ~Hp was obtained as follows. For [Ni(en)(H2 0)4]2+, ~H is
-37.7 kJ mol- 1 and ~U is 2.55 kJ mo.l- 1 . A "strain-free" ~H can therefore
be expected to equal -40.2 kJ mol- 1, and ~Hp half this value. (The ~H
value for the ammonia complex was not used as it lacks the inductive ef
fect of the ethylene bridges.) The value used for ~Hs was -27.2 kJ mol- 1
i.e. 7.1 kJ mol- 1 less than ~Hp. The ~U value for each complex was cal
culated as described previously. The agreement between the observed ~H
values and the values calculated in this fashion was good.
The fact that the same form of term in A works for predicting free energy
changes and enthalpy changes was not thought to be significant. In equa
tion (1.17) the term in A was introduced to account for the statistical
(and hence entropy) effect involved in the addition of an increasing num
ber of monodentate ligands to the complex. In equation (1.32) the term in
A represents an unfavourable enthalpy contribution composed of two oppo
sing terms:
1. the cumulative ring strain obtained on adding successively more
rings to the complex as the polyamine ligand becomes larger (pro
ducing a decrease in exothermicity); and
2. the increase in exothermicity produced by increasing the number
of secondary nitrogen donors as the number of rings is increased.
1.2. Outline of the project
The aim of this project is to test experimentally the assertion that, in
the absence of ring strain effects, the formation of Ni-secondary nitrogen
bonds in aqueous solution is enthalpy-stabiliz.ed, compared with Ni-primary
nitrogen bonds, by some 7.1 kJ mol- 1 (29). To this end, ~G~ , ~H~ and ~S~
were determined for the. formation of the complexes of Ni'+ with the fol-
45
lowing two ligands: 2,2'-oxy~isethanamine Coden = (H2NCH2CH2 )20J and
2-(2-aminoethyl)aminoethanol [etolen = HO(CH2)2NH(CH2)2NH2J, which have
the structures shown in Figure 1.3.
The proposed comparison to be made of oden and etolen was extended to in
clude the metal ions co2 + and Zn2 + ,. in order to test whether the assertion
is also valid for different metal ions.
These two ligands differ principally in that oden has two primary nitrogen
atom donors, whereas etolen has a secondary nitrogen atom as well as a
primary nitrogen atom donor. (They also differ in that oden has an ethereal
oxygen donor atom, whereas etolen has an alcoholic oxygen donor atom.)
The proposed measurements were also to be made on the complexes of Ni 2+
with another two ligands, viz. 2-aminoethoxy.acetate [aea- = H2N(CH 2)2 0
CH2COO-J and N-(2-hydroxyethyl)glycinate [heg- = HO(CH2)2NHCH2COO-J,which
are also depicted in Figure 1.3.
These two ligands differ from oden and etolen in that one -CH2NH2 group
has been replaced by a -COO- group and they differ from each other in the
nature of the nitrogen and oxygen donor atoms in the same way as do oden
and etolen.
From the measurements to be made on the complexes of aea- and heg- with Ni2+,
the effect of a carboxylate group on the difference between the coordinating
properties of primary and secondary nitrogen atoms could be shown. This in
formation would be of value in assisting the interpretation of the observed
enthalpies of formation of complexes of metal ions with polyamine-carboxy
late ligands. Such data would be useful in determining whether an equation
similar to equation (1.32) could be used to predict the enthalpy changes
of such complexes.
It was felt that the Ni-O~: and Ni-O~~ bonds would be fairly similar in.
strength, since Everhart et al. (65) had shown that the ~H~ for replacement
of a water molecule by either an ethereal (R-O-R) or an alcoholic (R-O-H)
oxygen is zero. Also, provided that these pairs of complexes have similar
structures, one would expect the total strain energies developed in the
ring systems to be very similar. Thus, from the difference between the en-
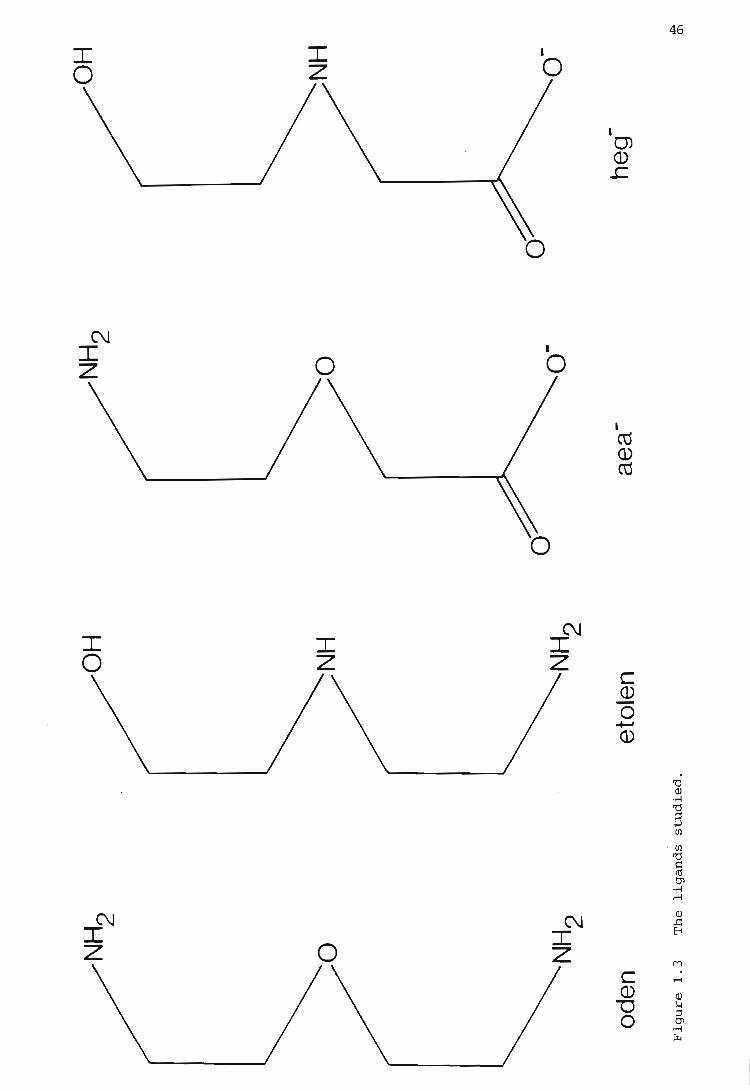
I o
N I Z
I 0
N I Z
I Z
o
I Z
0
I o
I o
N I Z
N I Z
I CJ) Q)
s:::.
I
CO Q) CO
c Q)
0 +-' Q)
C Q) "0 0
46
'0 Q) .~
'0 ~ +J Ul
' Ul '0 c:: cU tTl
.~
r-i
Q) ..c:: 8
M . ..... Q) ~
g, .~
rx.
47
thalpies of formation of the complexes of Ni2+ .with oden and etolen, it
should be possible to d.etermine whether secondary nitrogen donors do in
fact form stronger bonds than do primary nitrogen donors - and to what ex-
tent.
Paoletti et ai. (42) showed that, in the gas phase, the energy of a co
ordinate bond depends not only on the nature of the donor atoms but also
on the coordination number and geometry of the complex. Evidence is avai.l
able that when odep and etolen are coordinated to Ni2+ they are both tri
dentate ligands and the resulting complexes are octahedral in geometry.
Evilia et ai. (66) concluded from n.m.r. contact shift studies that the
ethereal oxygen atom in oden was coordinated to Ni2+. They also found that
at 300 K the facial isomer of the complex Ni(oden) (H20);+ is 1.05 kJ mol- 1
more stable (in free energy terms) than the meridional isomer, and that
6H~ is ~ositive for the isomerisation reaction facial~ meridional. The
greater stability of the facial isomer was thought to be due to stabiliza
tion by coordinated water molecules.
Much controversy has raged in the literature as to whether etolen coordi
nates as a bi- or a tridentate ligand.
In 1948 Breckenridge (67) reported the isolation of Ni(etolen)3Ct2' He
thought that the Ni2+ was hexacoordinated, i.e. the two amino groups in
each of the ligand molecules were coordinated to the metal ion whi.le the
alcoholic OH-groups were not. Although such a structure suggests the
possibility of isomerism no evidence of such isomerism was found.
Harvey U a.L (68) later carried out spectrophotometric studies and found
that Ni2+ forms the complexes Ni(etolen)2+ and Ni(etolen)~+ .in solution.
They found no evidence for the existence in solution of a compound similar
to that found by Breckenridge in the solid state.
Keller and Edwards (69) reported the preparation of the compounds
Ni(etolen)3 Br2 and Co(etolen)3X3 (where X = ct or Br). They assumed that
in these compounds the alcoholic OH-group was left free for further reac
tion. However they found that the latter compound was extremely unreac
tive towards reagents which normally react with freeOH-groups, a fact

48
which they ceuld net explain..
When this werk was repeated by Drinkard et at. (70) these authers ceuld
ebtain enly Ce(en)3Ct3' which resulted frem a cleavage of C-N bonds during
the exidatien ef Ce2. + .
To. aveid this cleavage the compound was reprepared,- this time using
Co. (NH3) 6 (N03 ) 3 as the starting mate.rial (71). The cempeund ebtained was
theught to. be Co. (etelen-) i, i .. e. the cempeund was fermulated as
+
in which etelen behaves as a tridentate ligand with a preten lest frem. the
hydrexyl greup.
Das Sarma and Bailar (72) shewed that under varying cenditiens etelen can
behave as a tridentate er a bidentate ligand. They feund that etelen
(etelen which has had a preten remeved frem the OH-greup) is tridentate,
attaching itself threugh two. nitregen and ene 0- dener atems. The ligand
etelen can behave as a tridentate ligand, but is bidentate when the ether
ceerdinatien sites are already eccupied by strengly ceerdinating greups
such as tridentate etelen, NO;, etc. These authers repert the preparatien
ef varieus Ce3+ cemplexes with the ligand etelen as well as that ef
Ni(etelen)2Brz, in which cemplexes etelen is bidentate. This was ascertained
threugh a study ef the electrical cenductivities and reflectan.ce, lor. and
n.m.r. spectra of the complexes.
49
Bassett et at. (73,74) found that etolen acts as a bidentate ligand in the
following solid tris complexes~ Ni(etolen)~Ct2 and Ni(etolen)~Br2 i. but
acts as a tridentate ligand in the following solid bis complexes:
Ni(etolen)2 I 2' Ni(etolen)2 (NCS)2' Ni(etolen)2 (N0 3 )2 and Ni(etolen)2 (Ct0 4)2·
In the bis nickel sulphate complex Ni(etolen)2S04, etolen is bidentate and
the sulphate anion is covalently linked to the metal ion. It was thought
that the formation of another five-membered ring would introduce a great
deal of strain into the molecule, and hence that coordination with the
anion occurs instead.
Rustagi and Rao (75) concluded from infrared spectral studies of solid
metal complexes with the ligand etolen that in all cases the NH~, NH and
OH-groups participated in complex formation, i .. e. etolen acts as a triden
tate ligand. They also found that in the complexes containing sulphate
as the anion it was not coordinated to the metal ion. For the nickel com
plexes Ni(etolen)2Ct2 and. Ni(etolen)2S04, the absorption spectra were
found to be very similar to the reflectance spectra, which indicated that
the complexes retained
and the solid state.
their octahedral geometry in both the solution
From infrared spectral data Nasanen et at. (76) have shown that, in the
solid state complex Ni(etolen)2 (N0 3 )2' etolen is tridentate.
Barbucci (77) determined the stability constants of Ni-etolen complexes in
order to ascertain whether or not the hydroxy · group is coordinated to the
metal ion. From a comparison of the 6S~ values obtained for the complexes
of Ni2+ with dien and those with etolen he concluded that in the Ni(etolen)i+
case not all the six donor atoms were coordinated, but that one ethylenic
branch containing an alcohol group was free.
Subsequently Everhart et at. (65) have shown by means of n.m.r. contact
shifts that alcoholic and ethereal oxygen donors can successfully compete
with water for metal coordination s i tes, provided that the other donor
groups in the ligand form bonds sufficiently strong to ensure the stability
of the complex. In the case of the Ni(etolen) (H20);+ complex, they found
that a substantial amount of oxygen coordination occurred. Furthermore ~
6H for the replacement of a coordinated water molecule by the R-OH group
on etolen is zero, and 6Se
is about 6.3 J K-1mol- 1 . A significant amount
50
of oxygen coordination was also observed for the complex Co (etolen) (H20)~+.
However for Co2 + .it was not possible to make quantitative measurem.ents.
On balance of the evidence available, it therefore appears that both oden
and etolen are tridentate and their complexes with Ni2 + are octahedral in
aqueous solution. Comparison of the results for these two ligands should
therefore constitute a fairly direct measure of the coordinating proper
ties of primary and secondary nitrogen atom donors in complexes of this '
type.
-& e- -e-Values of 6G , 6H and 6S for the formation of complexes involving oden and
etolen with Ni2+ have been reported with a view to evaluating the coordi
nating properties of the oxygen atom (77,78). However these values are in
poor accord with previously reported values (1,2) for the same quantities.
Thus the experimental data relating to the metal ion Ni 2 + with the ligands
oden and etolen needed to be checked.
Before the thermodynamic measurements for each pair of oden and etolen com
plexes can be compared, various assumptions should, Lf possible, be con
firmed. Although the total strain energies developed in the ring systems
for oden and etolen are expected to be rather similar, this could be con
firmed with the aid of conformational strain energy calculations. uvvisible spectra of the complexes were recorded to investigate whether the
d-d electronic energy level spacing increases or decreases when primary
nitrogen atom donors are replaced by secondary nitrogen atom donors. (This
spacing is a measure of the metal-ligand interaction for complexes having
the same geometry.) .. . ~~; ;
The stability constants (and hence 6G-&) of the reactions studied were
determined by glass electrode potentiometry (see Section 1.3), and the
enthalpy changes by titration calorimetry (see Section 1.4). All the'
measurements were made at an ionic strength of 0.5 mol dm- J using KNOJ
as
the background electrolyte, and at a temperature of 25 °C.
1.3. The potentiometric method of determining stability constants
Although various methods are available for the determination of stability
constants, the one which seemed most suitable for the systems under inves
tigation was glass electrode potent i ometry. Before discussing this method
51
we shall describe the various types of complex which can be formed, and
define some of the quantities fl::equently used in discussions of complex
equilibria.
Various types of complex species are known. The simplest species fonaed
are the mononuclear complexes. These can in.clude oligomers Mq which fonn
by self-association, such as Hgi.+, acids HpLr' and complexes MLr . If
more than one central metal ion is contained in the complex (MqLr , q > 1),
then the species is termed a polynuclear complex. Polynuclear complexes
may be homo- or hetero-nuclear, depending on whether the central metal
ions are the same or different. Species can also exist in which more than
one type of ligand is attached to ' the metal ion (MqLrXp ). These are called
mixed ligand or ternary complexes. X may be a second type of ligand, the
hydroxyl ion (in which case the complexes are usually described as 'hydro
lysed'), or a hydrogen ion (a protonated complex).
The reactions which lead to the formation of metal complexes are really
substitution reactions, i.e. one or more solvent molecules are substituted
by a ligand molecule. There may also be interaction of the species of in.
terest with the bulk electrolyte. However for simpli.city it is assumed that
the concentrations of the solvent and bulk electrolyte remain constant,
and their con.tributions are ignored.
We shall now consider the formation of mononuclear metal complexes t-1Lr .
In aqueous solution, a metal ion M (or more generally any Lewis acid, i.e.
an electron acceptor) can react with a ligand L (or Lewis base, i.e. an
electron donor) to form a series of complexes generally represented by the
following reversible reaction:
M(aq) + rL(aq) MLr(aq) ; r > o. (1. 34)
The resulting complexes can be cations, anions or uncharged molecules, but
for the sake of simplicity charges have been omitted.
The activities (a) of the species present at equilibrium are related to
the thermodynamic (activity) equilibrium con.stant a 8ir at a given tempera
ture as follows:
as lr =
a MLr
52
(1.35)
However the activity of a species Z is simply related to its concentra
tion ([zJ) by the activity coefficient, yz~
az Yz [zJ. (1. 36)
Hence equation (1.35) can be rewritten as
=
. S lr . (1.37)
IIf reaction (1.34) is carried out in a medium of constant ionic strength
~, the activity coefficients of the various species present in solution
will remain approximately constant. Hence aSlr will be proportional to
S1]:' since the activity coefficient quotient is a constant.
Hence the concentration quotient
S lr = (1 d8)
will also be a constant. SIr is known as the (cumulative) stability con
stant and is a constant for a given reaction at a given temperature and
ionic · strength.
Reaction (1.34) can alternatively be expressed as a series of r. steps ~
M+L~ ML
and equilibrium constants or stepwise stability constants for each of
these steps can be written as follows:
Ktr = [ J[ J MLr -l L
53
Thus it follows that the cumulativ e stability constants are obtained from
the product of the stepwise stability constants:
Sll Kll
S12 Kil· K12
Sir = K11 ·K12 • ···· K1r
r
ITKli i=l
In this work a third species besides M and L, viz. the hydrogen ion, was
considered. Hence the reaction analogous to reaction (1.34) is
pH (aq) + qM(aq) + rL(aq) ( 1. 39)
where p is an integer and q and r are nonnegative integers. If p < 0
coordination by hydroxide instead of hydrogen ions is indicated. The
corresponding cumulative stability constant is defined as
= [HpMqLrJ
[HJP[MJq[LJ r (1.40)
54
It is seldom possible to determin,e the equilibrium concentrations of
all the species present in a solution in which complexes are formed.
However it is possible to measure the concentration of one species and
relate it to the reactions occurring and the associated stability con
stants (see Section 4.3). Potentiometry is a particularly useful techni.
que for measuring the said equilibrium concentration, since the concentra
tion changes caused by complex formation are reflected in the potential
of a sensing electrode.
In this work a potentiometric titration method was used in which the con
centration of the free (uncomplexed) hydrogen ion was followed. This was
possible because the reactions being studied involved competition between
the hydrogen ion and the metal ion for the ligand.
The cell used to follow the hydrogen ion concentration was
reference electrode II
test solution
glass electrode
The details of ~his cell, as well as the various methods used to calibrate
it, will be described in Section 5.1.
The actual titration experiments can be designed in a number of ways (see
Chapter 6). If possible, though, they should be designed so as to furnish
as much information as possible from a s i ngle titration.
It is imperative that a good choice of background electrolyte should be
made so as to upset the measurements as little as possible. Beck (79)
lists the qualities of a good electrolyte. The salts most commonly used
are NaCl04 and KN0 3 •
Once the potentiometric data have been collected they have to be processed.
The first step is to obtain a graphical representation of the numerical data
in the form of formation curves. From these plots one can detect 'dud' experi-
mental data, as well as deduce the presence of complicated species such as
polynuclear complexes etc. One is able also to see whether the collection
of additional data is necessary. The second step is to deduce the nature
of the species present and to calculate the corresponding stability con
stants . In this work the stability constants were calculated from the
potentiometric data by the use of the computer programs MINIQUAD (see
section 4.4.4.) and ESTA (see Section 4.4.5 . ).
55
For simple systems in which up to three s.tability constants are unknown,
graphical methods can be used to obtain these stability constants. There
are two main types of graphical method: linear, non-logarithmic plots,
and curve-fitting methods. Graphical techniques have the advantage that
errors are more easily estimated than from a computer print-out, although
the results obtained may be less precise. Graphical methods of deter
mining the stability constants were not used in this work.
There are a number of references (79 - 84) which elaborate on the points
summarized here, and describe the various techniques by which stability
constants may be determined.
1.4. The titration calorimetric method of determining enthalpy changes
Titration calorimetry provides a convenient and rapid method for the deter
mination of enthalpy changes and, in some cases, values of the stability
constants as well. In this work the technique was applied only to the
determination of enthalpy changes. ' Since this methqd gives a direct mea
sure of the quantity desired, it is to be preferred over such methods as
temperature variation' of stability constants for the purpose of accurate
determination of enthalpy changes.
In titration calorimetry one reactant is ti.trated into another ~ and the
temperature of the system is measured as a function of the amount of tit
rant added. The temperature change may be the result of a chemical reac
tion or of physical interaction between the titrate and titrant. The re
sulting data, i.e. temperature versus volume of titrant added (or time) ,
can be analyzed to give information on the types and numbers of reactions
taking place, as well as values o·f 8.He- and (for incomplete reactions)
values of the corresponding stability constants.
Titration calorimeters come in two types - incremental and continuous _
depending on the mode of titrant deliv ery. In the former type the titrant
is added in increments, and the temperature is recorded after the addition
of each portion of titrant. Before the next increment of titrant is added
the temperature is readjusted to the initial value. In this way a series
56
of points, each corresponding to the addition of an increment of titrant,
is obtained. In the latter type the titrant is added at a constant rate
and the temperature is recorded continuously. This produces a continuous
plot of temperature versus volume of titrant added. Incremental titration
calorimetry has the advantage that temperature dependent corrections are
small. Nonetheless, the method is laborious for the collection of a
large volume of data, and errors are introduced in that a separate run has
to be performed for each data point. Continuous titration calorimeters have
the advantage that in one run an amount of data can be collected that would
take very many runs by the other method. However the continuous method
does require that the reactions being studied occur rapidly.
In this work a continuous titration calor-imeter was used. A description
of this calorimeter will be given in Section 3.2.
The data obtained from a typical titration calorimetric run are in the
form of potential difference (which is linearly related to temperature)
versus time (or moles of titrant added). A plot of such data is called a
thermogram. Such a thermogram consists of various regions in which diffe
rent heat effects predominate. This will be described in Section 4.2.,
together with the calculation procedure required to correct the data for
extraneous heat effects, heat of dilution, etc.
Data corrected in this way are then processed by the computer program
LETAGROP KALLE (see Section 4.4.10.). This program corrects the data
for the contributions made by reactions other than those of interest (pro
vided that their ~H~ values are known), and hence calculates values of ~
~H for the reactions of interest.
The shape of the thermogram is dependent on the equilibrium constant(s) and ~
~H value(s) of the reaction(s) occurring in the calorimeter. For titration
calorimetry to be successful in the determination of enthalpy changes, the
reaction of interest must produce a temperature change of at least 0.040C
(for the calorimeter used here), although a temperature change of about 0.40C
is to be preferred. If the technique were to be used to determine stability
constants as well as enthalpy changes, the equilibrium constant for the
overall reaction occurring in the calorimeter would have to lie between 1
and 104
, so that a measurable amount of reaction takes place and also so
57
that the heat evolved or absorbed depends on the value of the equilibrium I
constant as well as on the value of ~~.
e- e- e Christensen et at. (85) have shown that ~G , ~H and ~S can, under
certain conditions, be determined from a single titration.
From a thermogram it is also possible to check on the stoichiometry of an
incomplete reaction (86, 87). This is possible because the ~He- value
calculated must be constant throughout the titration. If the value of
~H-& is found to vary wi.th different total concentrations of titrate and
titrant, then the reaction postulated is incorrect and perhaps the
presence of other species has to be assumed.
Ba:r;thel (88) lists va:r;ious m.etal-complex systems for which the enthalpy
changes have been determined. by tib::atiQn calorimetry. Ch:r;istensen ,
Eatough, Izatt and Ruckman hav.·e published a se:r;ies of three papers (89,
90, 91) and a later review (92) in which the determination of equilibrium
con.stants by titration calo:r;imetry is described. Hansen, Iz.att and
Ch:r;istensen (93) hav.e rev.ie~ed the use of titration calo:r;imetry as an
analytical procedure for. the accu:r;ate and rapid standardization of
solutions.
CHAPTER TWO
MATERIALS
Throughout this work only A-grade volunetric glassware and twice deionized
water were used. Unless otherwise stated the solutions used for the
measurements were prepared by di.lution of the appropriate standardised
stock solutions.
2.1. Preparation and standardi.sati.on of stock solutions of strong acid
Stock solutions of nitric acid (ca. 5 mol drn.- 3) were prepared by diluting
MERCK p.a. HN0 3 (min. 65 % pure; sp. gr. 1.40) to the required concentra
tion and standardised by titration against freshly recrystalliz.ed borax
(94) .
2.2. Preparation and standardisation of stock solutions of strong base
Stock solutions of sodium hydroxi de (ca. 1 mol dm-3 ) were prepared from
~ERCK TTTRISOL concentrated '.(olum.etric solutions and were made up with
wat.er which had been twice deioniz.ed and. freshly boiled to expel COl. .
When these ampoules were not a'.(ailable the stock solutions were prepared
by dilution of a 50. % NaOH solution, as described by Vogel (95). In both
cases, the solutions prepared from thes.e stock solutions were standardised
by potentiometric titration against a standard HN03 solution, and applica
tion of the Gran method of end-point detection (see Section 4.1.1.).
2.3. Preparation and standardisation of stock solutions of background
electrolyte
Potassium nitrate was us.ed as the background electrolyte in these
measurements. A stock. solution (ca . 2 mol dm~3) was prepared by mass
from BDH ANALAR KNO) (99.5 % pure) an.d. standardised by passing a 5.00 Cl:n3
aliquot through a cati.on exchange resin. A column was packed with BDH
AMI3ERLITE IR-120 (H), which is an analytical grade ion-exchange resin
supplied in the protonated form with a s.trongly acidic acti'.(e group, '.(iz ..
-SO)H. Prior to use the resin was converted to the Na+ form (by eluting
with a 10 % solution of NaCl) and tb,en converted back to the a+ form (by
treating it with a 6 % solution of HC.e.). This was done to ensure tb,at
59
the resin was completely in the H+ form, and also to clean, and improve
the effective capacity of, the resin. After each treatment the column
was washed with deionized water until a neutral eluate was obtained.
The aliquot of KN0 3 was then passed through the column and the HN0 3 collec
ted was titrated against a freshly prepared and standardised NaOH solution,
by using methyl orange as the indicator.
Lt was found that the concentration of KN0 3 obtained in the above way
differed from that calculated by mass by only 0.4 %, which is not a
si.gnifi.cant difference fol;' a background electrolyte. Hence from then
onwards the KN0 1 stock solutions were prepared from the pure reagent by
mass.
2.4. Preparation and stand.al;'disation of stock solutions of metal nitrates
The nickel ni.trate stock solutions (ca. 0.2 mol dm- 3) were prepared from
MERCK p.a. Ni(N0 3 )2 .6H20 (min. 99 % pure), and standardised by direct
titration against a standal;'d solution of EDTA (MERCK p.a., min. 99 % pure)
with murexide as the indicator (96). Fol;' the standardisation a ca. 0.05
mol clm.- 1 Ni (N0 1 ) 2 solution was . used.
MERCK p.a. CO(NOJ)2.6H20 (min. 99 % pUl;'e) was used in the preparation of
the stock solutions of cobalt ni.trate. Again, for the standal;'disation
the stock solution was diluted. to Ca. 0.05 mol dm-1 and this dilute
solution was standardised by EDTA titration with mUl;'exide as the indi.cator
(97) •
The z.inc ni.trate stock solutiqns (ca. 0.2 mol dm:""3) were prepal;'ed from.
~ERCK p.a. Zn(N01)2.4H20 (min. 98.5 % pure). For standardisation purposes
the stock solution was dilut.ed. to 0.05 mol dm:-l. This dilute solution
was standardised by direct tit:x:ation against a standard solution of EDTA
with Eriochrome Black T as the indicator (98).
2.5. Preparation and standardLsation of ligand solutions
2.5.1. Preparation and standardisation of solutions of 2-(2-aminoethyl)aminoethanol (etolen)
60
The 2-(2-aminoethyl)aminoethanol (etolen) used was purchased from RIEDEL
DE HA.EN (Prosynth grade, 99 % pure) and was purified by fractional distil
lati.on under reduced pressure. The fractional disti llation equipment
used consisted of a liquid dividing fractional distillation head (QUICKFIT
SH 30/42) and a vacuum-jacketed column of approx. 50 em effective length.
This column was wrapped wi.th alumini.um foil and packed with 9 x 9 mm
RaschLg rings (QUICKFIT Fe 8/09) using a QUICKFIT EX 13/25 packing support.
The apparatus was connected to a rotary high v.acuum pump. It was found
that smaller Raschig rings, viz~ 6 x 6 mm (QUICKFIT FC 8/06), could not
be used because the hi.gh viscosity of the li.gand caused them to retain
too much of the liquid phase.
The fraction used distLlled OVer at 89°C at 0.9 mmHg. . The refractive
index of this fraction, · as m.easured by a Hilger and Watts Abbe refracto
meter, was found to be 1.4888 at .. 20.0°C, as compared to a published '
value of 1.4861 at 20.0°C (99). This di.sti~lation procedure. succeeded
in removing the yellow colour of' the ligand.
Earlier, etolen had been fractional,ly distilled under reduced pressure
through a 30 em-long vacuum-jacketed ~igreux column hav.ing eight sets of
points. However thi s proced:ure . did not . remove the yell.ow: colour of the
ligand. The fractions collected by thi.s method disti.lled over at 1350c
at r 5 lIIIPHg and had a refracti.ve i.nd.ex of 1.4878 at 22. 1°C.
The purity of the distLlled etolen was also checked by running a thin
layer chromatographic plate. The plates used were MERCK pre-coated
silica gel 60Fz 51+ aluminium-backed sheets of 0.2 mm. thickness. and. the
s.olvent system was~ 96 % aq. ethanol/ 25 % aq. ammoni.a in the ratio 4d.
The plate was sprayed wLth MERCK 0.1 %. ninhydrin solutLon. Only one spot
appeared on the plate, and it had. an Rf value of 0.33.
An infrared spectrum of neat etolen (between KBr plates) was recorded by .
using a BECKMAN ACCULAB 8 infrared spectrophotometer. The spectrum
obtained (shown Ln Fi.gu:r;-e 2.1) show.ect essentially the same features as
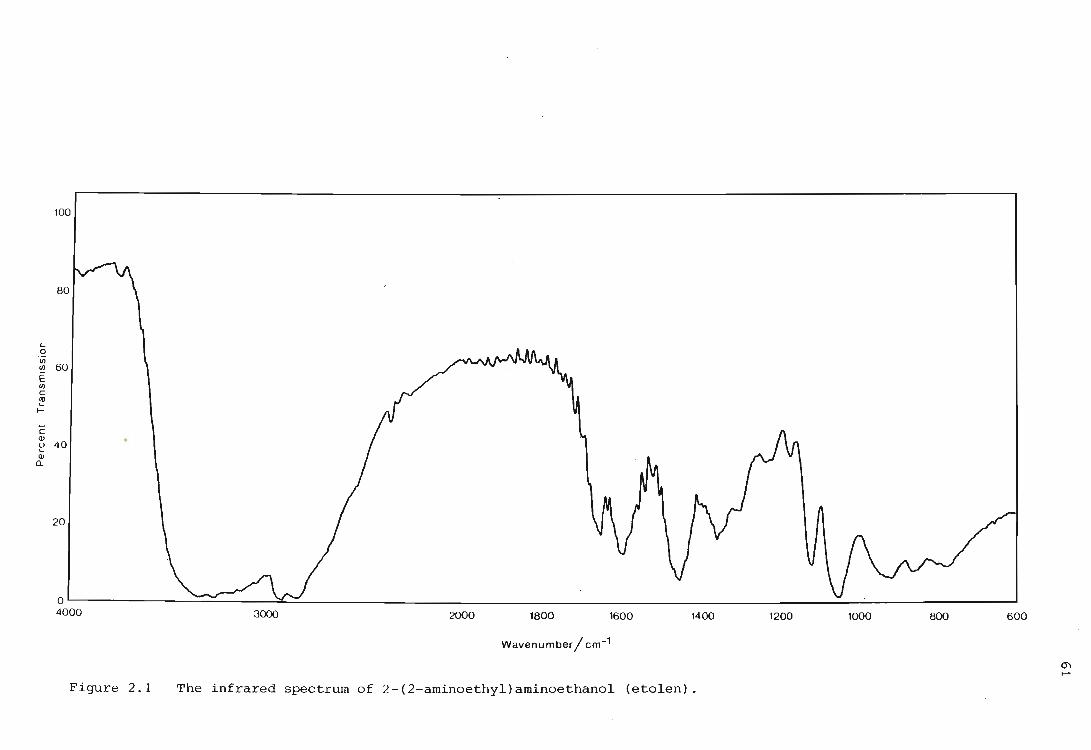
100
c 0 CI)
60 CI)
E CI)
c
'" ~ l-
e Ql () 40 ~
Ql a.
20
0' 4000 ----..r......,......, 3000 2000 1800 1600 1400 1200 1000 800 600
Wavenumber / cm-1
0'\ ......
Figure 2.1 The infrared spectrum of 2-(2-aminoethyl)aminoethanol (etolen).
previously reported infrared spectra of etolen (100, 101).
Solutions of this amine were prepared by using freshly boiled doubly
deionized water, and standardised a day before use. The concentrations
of the solutions were determined by potentiometric titration against a
standard nitric acid solution. The equivalence points were determined
by using an "extended" Gran plot method as described in section 4.1.3.
2 . 5.2. Preparation and standa.rdisation of solutions of 2,2' -oxybisethanamine (od.en)
The ligand 2,2'-oxybisethana~ne (oden) was purchased as the dihydro
chloride from ALDRICH. The ~elting point of the unpuri£ied compound,
reasured on a GALLENKAMP MF-370 ~elting point apparatus, was found to be
224 - 226°C, which did nQt agree '1.itn the ~elting point of 232 - 235°C
stated on the label of the Pottle.
62
Tne ~aterial was purified by recrystallizing i .t three times in tne
following ~anner:. the solid was dissol~ed in. the mini~)..1lll amount of hot·
water, and an equal . volume of etnanolwas added. I.t was. then dried to
constant ~ass under high vacuum in a drying pistol by using carbon tetra
cnloride (which boils. at 76.S0C) as tne neating ~edium and pnosphol';"us
pentoxide as tne drying agent. The ~elting point of tne recrystallized
rna ter i al was found to . be 226 - 22.6.5 ° c, wnich compared well wi tn the
publisned value (102) of 2.26 - 227°c_
An elemental analysis (in duplicate) was. performed on the solid by PASCEER.
The sample was dri.ed at 60°C under high vacuum. There was no ;Loss in
Qlass and the following results were obtained:. C:. 25.54 %, E:. 7.37S %,
N:. 14.77 %, 0:. 8.74 %, Cl:. 40.40 %. As can be seen, these percentages
leave 3. 18 % unaccounted for. On the assumption that the material con
tained some NaCl, the formulation C4E12~20.xHCl.yNaCl was . fi.tted to tne
experimental results by a least squares technique. Tne results obtained
were x = 1.88 and y = 0.26. A comparison of the experimental and
63
calculated percentages for each element is shown in Table 2.1. As can
be seen, the calculated results agree fairly well with the experimental
results.
An infrared spectrum of the same materi.al as sent for elemental analysis
was obtained on a BECKMAN ACCULAB 8 spectrophotometer. The spectrum
(shown in Figure 2.2) was taken as a Nuj 01 mull between KBr plates. The
wavenumbers of ' the absorptions W'ere found to correspond fairly well with
those reported in the literature (103).
Solutions of oden.2HCt were prepared fresh as required, by using boiled
de carbonated doubly deioniz.ed wat.er. They were standardised by poten
tiometric titration against a standard NaOH solution using the Gran plot
method of end-point detecti.on for dibasi.c acids (see Section 4.1.2).
The standa.rdisation of the NaOH titrant solution was carried out 'in situ'
beforehand. In this way the excess acid. that remained after this pre
liminary standardisation enabled one to check whether any 'dirt' acid
was present in the eden.2HCt solutions.. (Of course the possibility of
'dirt' acid does nat arise if indeed i .t is correct to assume x = 1.88,
i . e. the formulation. proposed.) The plot of e .m. f . versus volume for
the standardisation of. od.en.2Hct gives only, one point of inflection,
since log KlOl and log K20l a.re fairly similar for oden.2HCt (log KlOl =
9 . 7.7, log K20l = 9.17). In this respect od.en differs from etolen.
2 . 6. Ligand syntheses
The ligands aea and heg were not avai.lable commerCially and had to be
synthesized.
2.6.1. Synthesis of the ligand N-(2-hydroxyethyl)glycine (heg)
A number of syntheses for the ligand N-(2-hydroxyethyl) glycine (heg) have
been reported (104 - 107). The synthesi.s by Kipriyanov and Kipriyanov
(104) was not tried, as it seeQl.ed. to be more involved than that of Farbenind
(105) and it was anti.cipated that retnov-al of the by-products w;ould be
difficult. The methods of Stewart (106) and of Benedikovic eX. aL (107)
make uS.e of hydroxyacetoni trile (HOCH2 CH2. CN) as a starting material and
th,is chemical was too expensive to buy in the quantities required. The
latter two methods also require th,e dehydration in vacuum at 90°C of
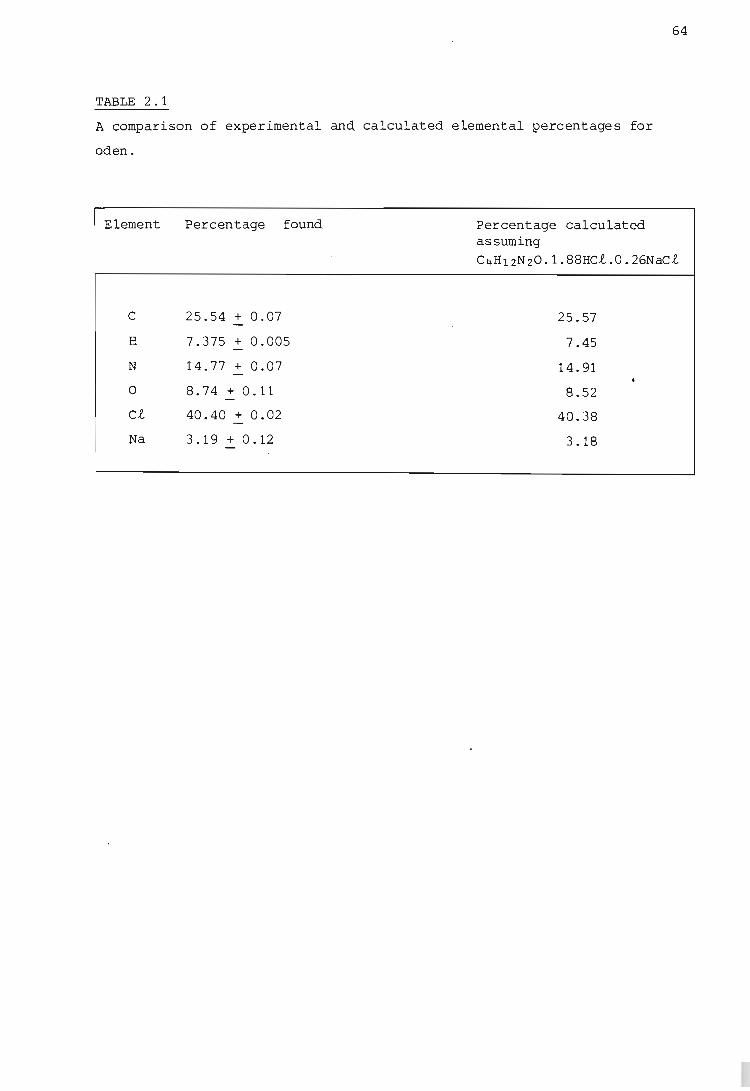
64
TABLE 2.1
A comparison of experimental and calculated elemental percentages for
oden.
Element Percentage found:
C 25.54 + 0.07
H 7.375 + 0.005
N 14.77 + 0.07
0 8.74+0.11
ct 40.40 + 0.02
Na 3.19 + 0.12
Percentage calculated assuming C~H12N20.1.88Hct.O.26NaCt
25.57
7.45
14.91
8.52
40.38
3.18
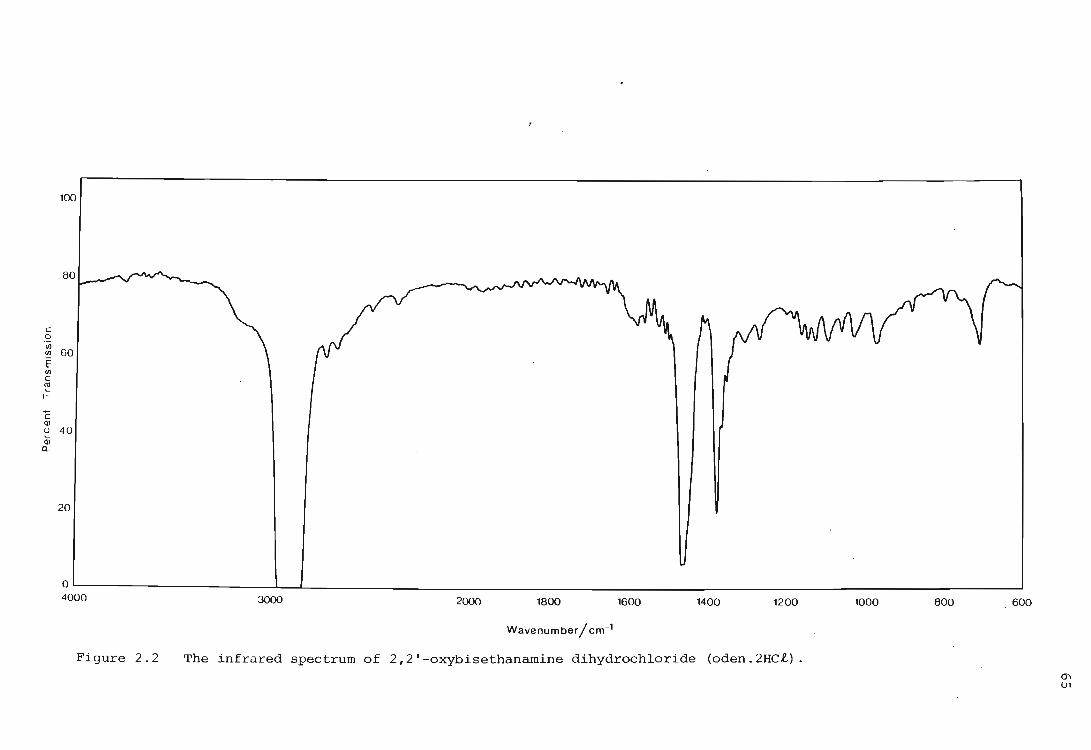
c a VJ VJ
E VJ c (\l
.= c Q)
u e-Q)
a.
100
60
40
20
ol. --____________ ~~ ______________________ ~----~~--~~--~~--~~--_; 4000 1400 1200 3000 2000 1800 1600 1000 800 600
Wavenumber / cm-1
Figure 2.2 The infrared spectrum of 2,2'-oxybisethanamine dihydrochloride (oden.2HCt). en U1

66
the reaction mixture. This appears to be a particularly violent reaction
and, according to advice obtained, should not be ~ttempted (108). Thus
the synthesis of heg was attempted by using the method published in a
French patent by I.G. Farbenind (105). This synthesis, however, yields
the by-product Na2CO~ in addition to the sodi.um salt of heg. Hence the
synthesis was modified in th~t the reaction products were passed through
an ion-exchange resin i .n ord.er to replace the Na+ by H+ and so remove the
by-product. A summary of the synthesis is shown in Scheme 2.1.
The first step in the synthesis is the formati.on of oxazolidine. Therefore
75 g (1,0 mole) of methanal soluti.on (BDH lab. reagent, 37 - 41 % w/v) was
added dropwise, with stirring, to 61 g (1.0 mole) of 2-aminoethanol (BDH
lab. reagent, 99 % pure) contained. in a three-necked round-bottomed
flask. The two clear li~uids were miscible and on reacting liberated
much heat (as expected, since this i .s a dehydration reaction), and formed
a pale yellow mixture.
The next step of the synthesis involved. the opening of the ring structure
of oxaz.olidine by the addition 0 f HCN to form a nitrile. To do this,
56 g (1.1 moles) of NaCN (BDH lab. reagent, 97 % pure) in the solid form
was then added to the mixture and, washed down with 20 - 30 cm3 of water.
The mixture was kept well stirred and at a temperature of 40 - 50°C while
gaseous CO 2 was bubbled through the solution. Two gas traps, the first
containing a concentrated soluti.on of potassium permanganat.e and. the
second a 30 % NaOH solution, and a beaker of concentrated KMn04 were
used to absorb any HCN that might have formed and escaped. As the reaction
proceeded, the mixture became a viscous pale yellow liquid. Carbop
dioxi.de was bubbled through for approx. one hour or until no further
change was visible in the mixture. At this stage the reaction ~ixture
was alkaline.
A \(olume of 30 em3 of a 20 % soluti.on of NaOH was added and. the mixture
was refluxed for two hours. The mixture became a pale brown/orange
colour during the hydrolysis and Na~ was liberated.
The reaction product consisted of a white solid at the bottom of the
flask and a pale-brown syrupy upper layer. The syrupy layer was separated
from t .he solid by decantation. The white solid was found to dissolve in
water and, when acid was added to an aqueous solution thereQf, CO2
was

SCHEME 2.1
Summary of the synthesis of heg undertaken.
oxazolidine
NaOH reflux
)
NaCN ) CO2
40 - 50°C
H+ cation-exchange resin
HOCH2 CH2 NHCH2 COOH + co2 t + H2 0
heg
67
)

68
liberated. It was therefore concluded that the solid was N~C03'
To remove the sodium Lons present i n the syrupy layer it was decided to
pass the mixture through a cat Lon-exchange resin in the H+ form. The
resin used was BDH AMBERLITE IR-t20(H). The resin was conditioned before
use as described in Secti.on 2 . 3. The res i n was then placed in a three
necked round-bottomed flask with just enough water to cover it. The flask
was fitted with a nitrogen inlet and an outlet leading to the same gas
traps as before. The third inlet was fitted with a dropping funnel con
taining the syrupy materi.al (approx. pH t o) referred to above. The
material was released drop by drop onto the resin while the resin was kept
well stirred, with nLtrogen bubbling through all the time so as to sweep
off the CO~ that formed and possibly any HCN that might have formed from
any unreacted NaCN present in the reaction mixture. Once this procedure
was completed the aqueous phas.e WaS filtered off from the resin by suction
and the resin was washed wi.th. water. The washings were combined with the
reaction product.
The reaction product was then tested. for the presence of CN- by standard
tests, as described by Vogel (109), to ensure that it could safely be
treated in the open wLthout further precauti.ons. The test results proved
to be negative.
To ensure that all the sodium ions had been removed the reaction product
was again treated with resin but this time in an open beaker. Again the
washings were combined wi.th the reaction product and the mixture was
evaporated by means of a rotary evaporator to a volume of approx. 400 em3 .
The product was then passed. through a column packed with regenerated
resin in the H+ form, to secure the benefits of a chromatographic separa
tion. The column was washed down wi th water. The mixture, now presumably
containing heg, was again evaporated by means of a rotary evaporator
unti.l it was thick and syrupy. After treatm.ent wi.th resin, the reaction
product had a pH value of 3.
On standing I the reaction product formed white crystals. These were
fi.ltered off by suction and washed with ethanol. Further crystals were
obta.ined from the mother liquor by adding an equal volum.e of ethanol. The
crystals obtained were then recrystalliz.ed by dissolv ing them. in the
minimum amount of hot water and addi ng an equal volume of ethanol. The
product was recrystallized four times in this manner. The yield was
30 g, which represented a yield of 25 % Lf the product was heg.
69
A small sample of this material was drled to constant mass under high
vacuum in a drying pistol, by using trLchloromethane (boiling point 61.7°C)
as the heating medium and phosphorus pentoxide as the drying agent. The
dried material was found to have a melting point of 174 - 175°C.
An elemental analysis was performed by the Council for Mineral Technology
on a sample of this materiaL The results obtained were: C: 40.45%,
H: 6.44%, N: 7.76%. The results calculated for CljH9N03, i.e. heg, are
C: 40.33 %, H: 7.62 %, N: 11.76 %, 0: 40.29 %. It can be seen that the
values obtained for Nand H are too low.
A. mass. spectrum of the product, recorded at 70 eV" and with a mass range
of 600,is shown in Fi.gure 2.3. The molar mass was found to be 177 g mol- 1
which is not the value expect.ed. for heg, viz.. 119 g mol- 1• Prominent
peaks occur at the following mle '(alues: 18, 28, 42, 56, 60, 74, 86, 88,
101, 102,114, 132, 146, 159 and 1-Tl.
From this evidence Lt s.eems.. that the compound formed is most probably
N- (2-hydroxyethyl) -iIn.inodiacetic acid [HOCH2. CH2. N (CH2. COOH) 2] . (molar mass
1 Tl g mol -1).. The calculated compositi.on percentages for this compound
(C6HllNOs) are: C: 40.68., H: 6.26, N:. 7.91 and 0: 45.16, which fit the
eJ,.emental analysis results. fa.irl.y wel.l.
An infrared spectrum of the reaction product (s.hown in Figure 2 . .4) was
record.ed on a BECKMAN ACCULAB 8 infrared spec.trophotometer. The spectrum
was. taken as a Nujol mull bet~een KBr plates. The spectrum obtained was
compared with a reported . spectrum for N-(2-hydroxyethyl)iminodiacetic
a.c id (110) and found to agree '(er'j we 11.
A p.m.r. spectrum of this material in Di ~ was. recorded on a VARIAN CFT-20
NMR spectrophotometer and is. shown in Figure 2.5. Relative to an internal
standard of acetone the following absorptions occurred:
c:. 1.22, 1.27, 1 .31, 1. 34, . quartet, 2Hi. C-C..!! .. -N
C :. 1.66, 1.70, 1.73, 1.79;. quartet, 2H;. HO-C..!! .. -C
C :. 1.86; singlet; 4H; N-CH 2 -COOH
c: 2.46; Singlet; H2. 0 .
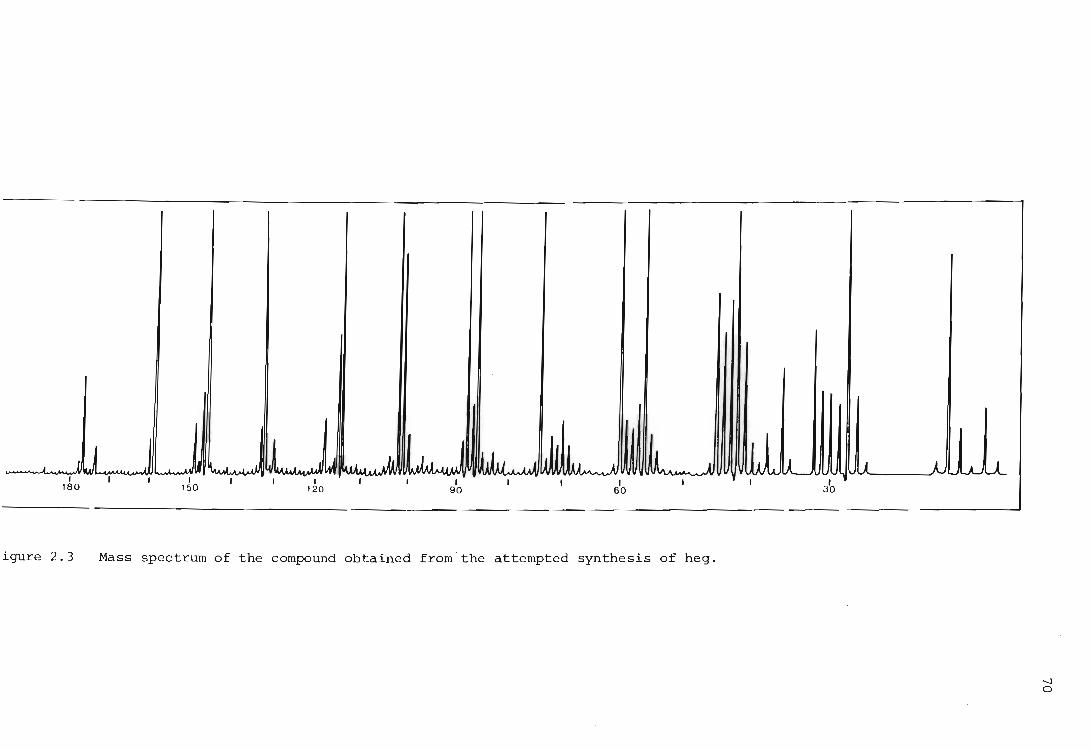
I 180
igure 2.3
I 150
I 120
I 90
I 60
Mass spectrum of the compound obtained from ' the attempted synthesis of heg.
3'0
----- --------------------------------------
-..J o
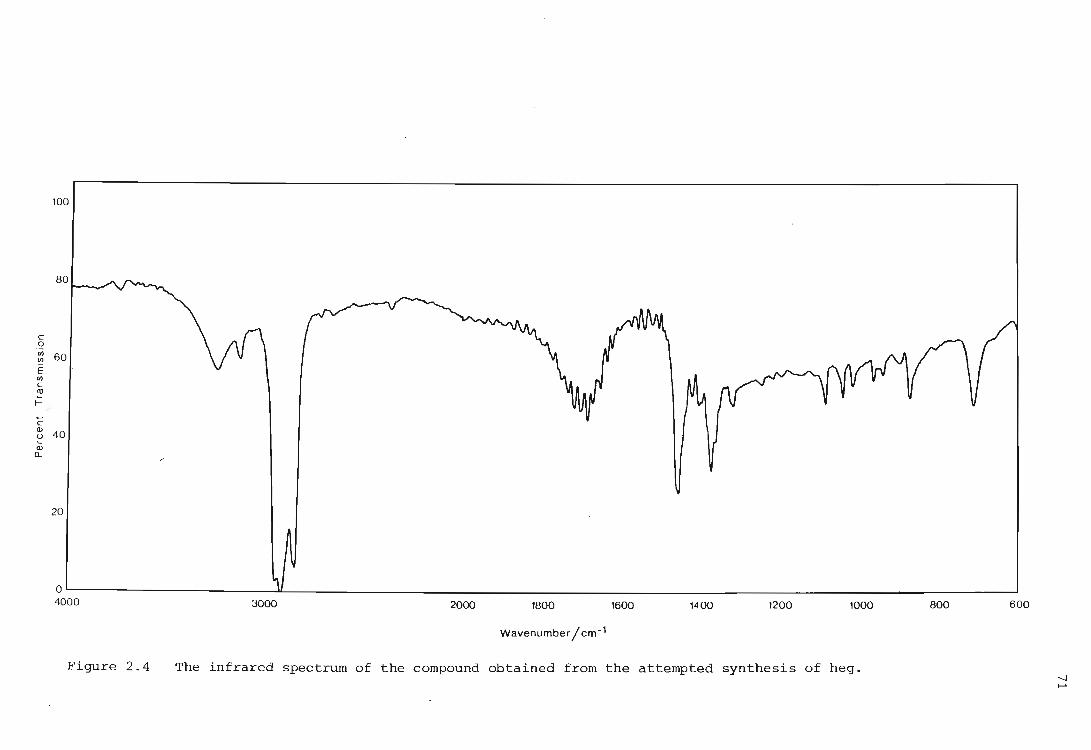
c 0 (/) (/)
E (/)
c ~ ~
c Q)
u ~
Q) Q.
100
60
4 0
20
0' U
4000 3000 2000 1800 1600 1400 1200 1000 800 600
Wavenumber / cm- 1
Figure 2.4 The infrared spectrum of the compound obtained from the attempted synthesis of heg. -...J .......
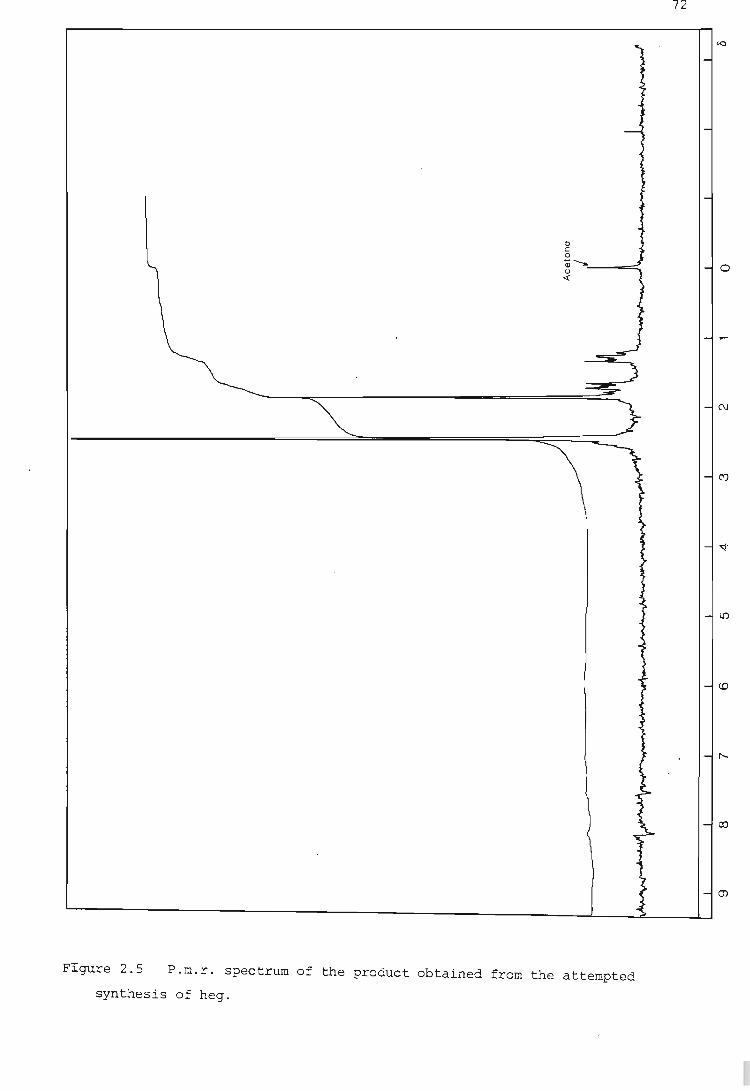
72
o
N
FIgure 2.5 P.m.r. spectrum of the product obtained from the attempted
synthesis of heg.
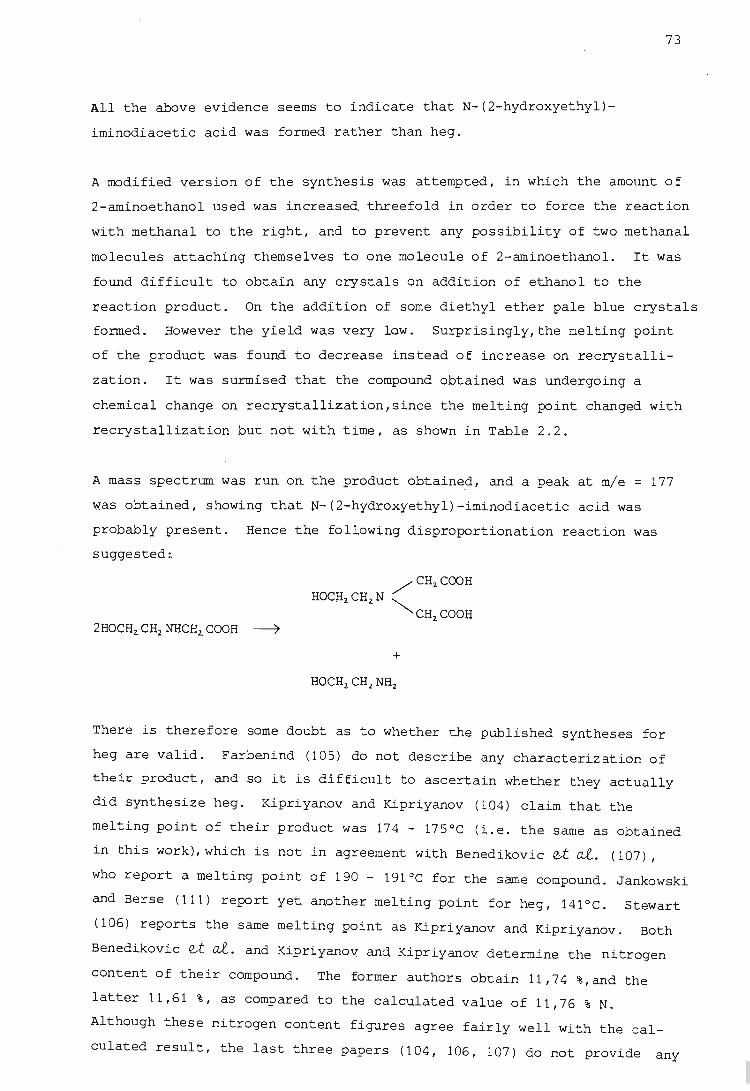
All the above evidence seems to i .ndicate that N- (2-hydroxyethyl)
iminodiacetic acid was formed rather than heg.
73
A modified version of the synthesis was attempted, in which the amount of
2-aminoethanol used was increased threefold in order to force the reaction
with methanal to the right, and to prevent any possibility of two methanal
molecules attaching themselves to one molecule of 2-aminoethanol. It was
found difficult to obtain any crystals on addition of ethanol to the
reaction product. On the add.ition of some diethyl ether pale blue crystals
formed. However the yi.eld was very low. Surprisingly, the melting point
of the product was found to dec;rease instead of increase on recrystalli
zation. It was surmi.sed that the compound obtained was undergoing a
chemical change on recrystallization, since the melting point changed with
recrystallization but not with time, as shown in Table 2.2.
A mass spectrum was run on the p;roduct obtained, and a peak at mle = 177
was obtained, showing that N~(2-hydroxyethyl)-iminodiacetic acid was
probably present. Hence the fallowing disproportionation reaction was
suggested :.
2aOCH2. CH2. NHCH2. COOH ---7
/CH2 COOH
~CH2.COOH
+
There is therefore same doubt as to whether the published syntheses for
heg are valid. Farbenind (105) do not describe any characterization of
their product, and so it is difficult to ascertain whether they actually
did synthesize heg. Kipri.yanov and Kipriyanov (104) claim that the
melting point of their product was 174 - 175°C (i.e. the same as obtained
in this work), which is not in agreement with Benedikovic & a.L (107),
who report a melting point of 190 - 191°C for the same compound. Jankowski
and Berse (111) report yet another melting point for heg, 141°C. Stewart
(106) reports the same melting point as Kipriyanov and Kipriyanov. Both
Benedikovic et at. and Kipriyanov and Kipriyanov determine the nitrogen
content of their compound. The former authors obtain 11,74 %,and the
latter 11,61 %, as compared to the calculated value of 11,76 % N.
Although these nitrogen content figures agree fairly well with the cal-
culated result, the last three papers (104, 106, 107) do not provide any

74
TABLE 2.2
Change of melting point on recrystallization of reaction product.
Date Description of Sample Melting Point/oC
Day 1 Crude 185
Day 1 Once recrystalli.zed 181
Day 4 Twice recrystallized 178 178.5
Day 7 Twice recrystalliz.ed 178 178.5
further characterizations of the compounds, and therefore it is
difficult to decide what compounds actually were prepared.
Takagi et at. (112) claim to have extracted heg from Petalonia fascia
(Formosan seaweed) and they c l aim. t hat heg decomposes at 182 - 184°C.
Thus there is some controversy o~er the melting point of heg.
75
A rathe:r; diffe:r;ent pos.sible synthetic :r;oute fo:r; heg involves an addition
:r;eaction as shown in Scheme 2. 2 .
This synthesis was however not attempted because it had been decided by
this time that heg was not sufficiently stable in aqueous solution for use
in thermodynamic measurements, and this part of the project was discon
tinued. A very similar synthesis, in which H2NCH2 COOH was heated with
2-chloroethanol in the presence of alkalL and water at 90 - 100°C, has
:r;ecently been published in a U, S,S.R, patent (113).
2.6.2. Synthesis of the ligand 2-aminoet:hoxy aceti.c acid (aea)
Syntheses for this ligand ha~e been repo:r;ted in the literature (114 - 117).
The first stage in the synthesi.s of 2-aminoethoxy acetic acid (aea) is
the p:r;oduction of the cyclic compound, 3-morpholone. This compound was
prepa:r;ed by the method of VHHes and . Seguin (115, 116). A summary of
the synthesis is shown in Scheme 2 .3 .
The fi:r;st step in the production of 3-mo:r;pholone is the fo:r;mation of the
sodium salt of 2-aminoethanol. For this, 1.00 cm:l of anhydrous di.oxane
(MERCK dried, max. 0.01 ~ H2 0, min. 99.5 % pure) was placed in a round-
bottomed flask. A mass of 35 g (0.51 moles) of 2-aminoethanol (BDH lab.
reagent, mlil. 99 % pure) wa.s then. dissolv ed in the dioxane. To this was
added, wi.th stirring, 11.5 g (0.5 moles) of sodium metal in small po:r;tions.
~uch heat was liberated. On, completing the addition of Na the mixture
was refluxed until as much Na as possible had. dissolved. . When the mixtw::-e
had cooled the remaining unreacted Na w.as removed. By now the mixtu:r;e
had a pale yellow colou:r;.
A mass of 63 g (0.51 moles) of ethy lchlo:r;oacetate (MERCK, 99 % pure) w.as
then added dropwise to the solution, which was kept well stirred and cool.
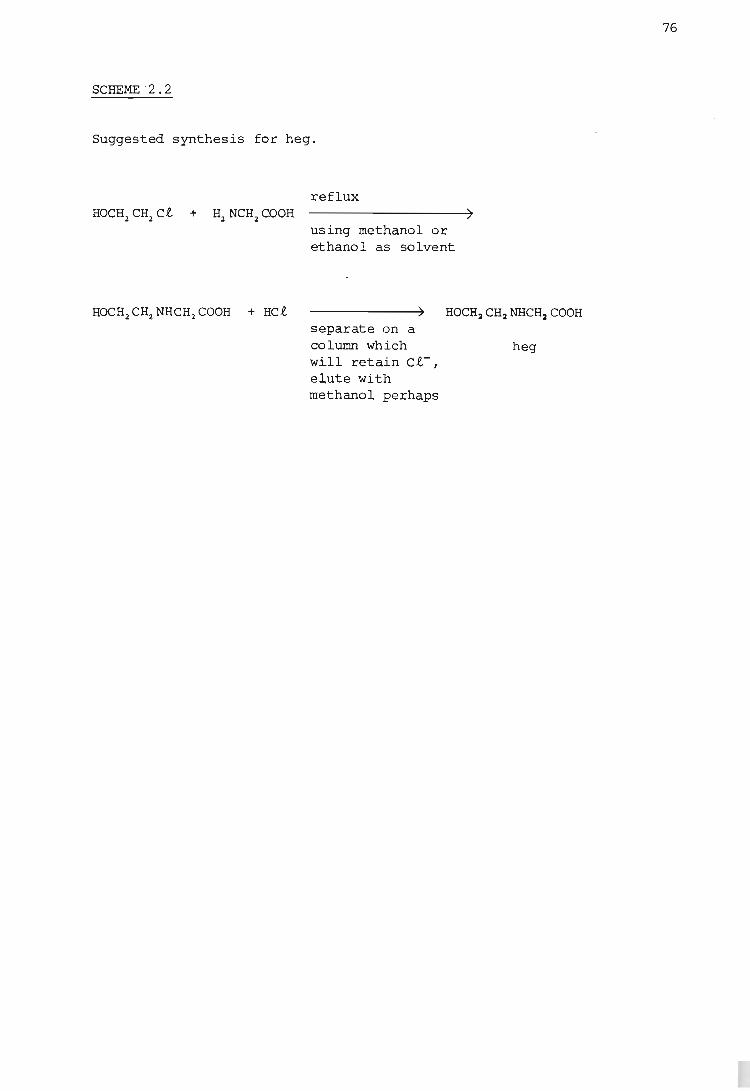
SCHEME ·2.2
Suggested synthesis for heg.
reflux
using methanol or ethanol as solvent
)
--------) HOCH:aCH:a NHCH:a COOH separate on a column which will retain C.e.- I
elute with methanol perhaps
heg
76
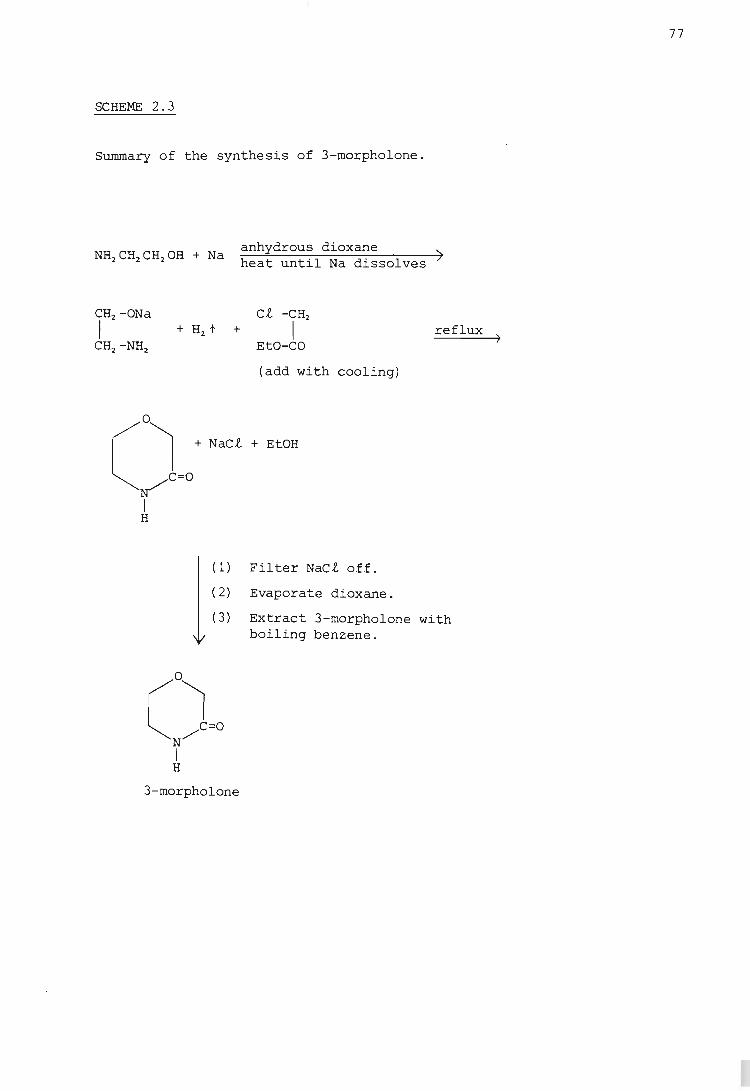
SCHEME 2.3
Summary of the synthesis of 3-morpholone.
anhydrous dioxane heat until Na dissolves)
ct -CH2
+ H2t + I reflux)
(1)
( 2)
(3)
3-morpholone
EtO-CO
(add with cooling)
+ EtOH
Fil ter NaCt off.
Evaporate dioxane.
Extract 3-morpholone with boiling benzene.
77
78
A white precipitate formed. The mixture was then refluxed for two
hours. Again the mixture was kept well stirred during the whole operation.
After refluxing, the solution had become pale brown and the white solid
remained.
The white solid, which was sodium. chloride, was filtered off by suction
and washed with boiling ethanol. The washings were combined with the
filtrate and the solution was evaporated to dryness using a rotary
evaporator. A viscous dark brown syrup remained.
The next step involved the ext.raction of the 3-morpholone with boiling
benzene. The syrupy mixture, was placed in a large beaker and to it was
added approximately one third of its volume of benzene. This was then
heated while being kept well stirred. The benzene was allowed to boil
for a short while « S minutes) and then was decanted from the hot
mixture. When the benzene extract had cooled slightly an equal volume
of diethyl ether was added,. W.hite needle-shaped crystals formed. The
crystals were filtered off and ;t;'ecrystalliz.ed twice from the minimum.
volume of benzene and diethyl ether. The syrupy substance was extracted
with boiling benz.ene a number of times in order to obtain an appreciable
quantity of product.
The melting point of the recrystallized product was found to be -100°C,as
compared to the published values of 104 - 10S.S0C (117) and 10S 0C (116)
for 3-morpholone.
The final step in the synthesis was to hydrolyse the 3-morpholone (116, 11 7)
to obtain the ligand required. This. step was not carried out since, by
this time, the attempted synthesis of heg had been abandoned and it had
been decided that this section of the project should not be pursued.
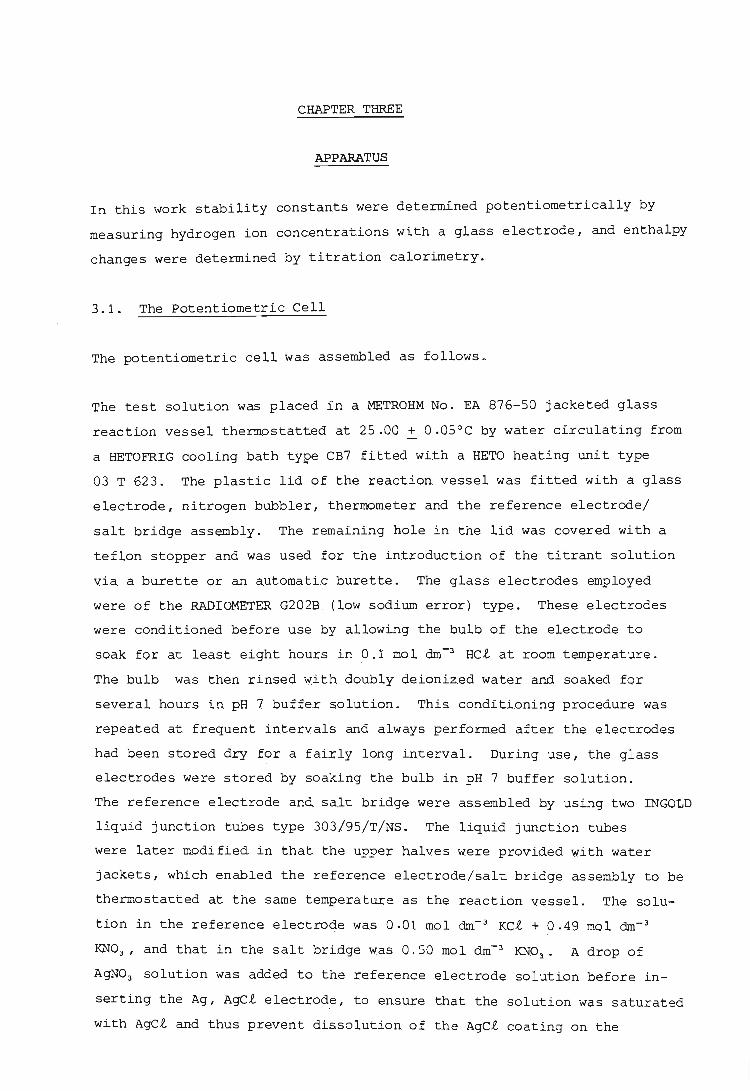
CHAPTER THREE
APPARATUS
In this work stability constants were determined potentiometrically by
measuring hydrogen ion concentrations with a glass electrode, and enthalpy
changes were determined by titration calorimetry.
3.1. The Potentiometric Cell
The potentiometric cell was assembled as follows.
The test solution was placed in a METROHM No. EA 876-50 jacketed glass
reaction vessel thermostatted at 25.00 .:!:. 0.05°C by water circulating from
a HETOFRIG cooling bath tYl?e CB7 fitted with a HETO heating unit type
03 T 623. The plastic lid of the reaction vessel was fi.tted with a glass
electrode, nitrogen bubbler, thermom.eter and the reference electrode/
salt bridge assembly. The remaining hole in the lid was covered with a
teflon stopper and was used for the introduction of the titrant solution
via a burette or an automati.c burette. The glass electrodes employed
were of the RADIOMETER G202B . (low sodium error) type. These electrodes
were conditioned before use by allowing the bulb of the electrode t .o
soak for at least eight hours .in 0.1 r;o.ol dm-l HC£. at room temperature.
The bulb was then rinsed w.i.th doubly deioniz.ed water and soaked for
several hours in pH 7 buffer solution. This condi.ti.oning procedure was
repeated at frequent intervals and always performed after the electrodes
had been stored dry for a fairly lon.g interval. During use, the glass
electrodes were stored by soaking the bulb in pH 7 buffer solution.
The reference electrode and salt bridge were assembled by using two INGOLD
liquid junction tubes type 303/95/T/NS. The liquid junction tubes
were later modified in that the upper halves were provided with water
jackets, which enabled the reference electrode/salt bridge assembly to be
thermostatted at the same temperature as the reaction vessel. The solu
tion in the reference electrode was 0.01 mol dm- 3 KC£. + 0.49 mol dm- 3
KN03 , and that in the salt bridge was 0.50 mol dm- l KNOl
• A. drop of
AgN03 solution was added to the reference electrode solution before in
serting the Ag, AgC£. electrode, to ensure that the solution was saturated
with AgC£. and thus prevent dissolution of the AgC£. coating on the
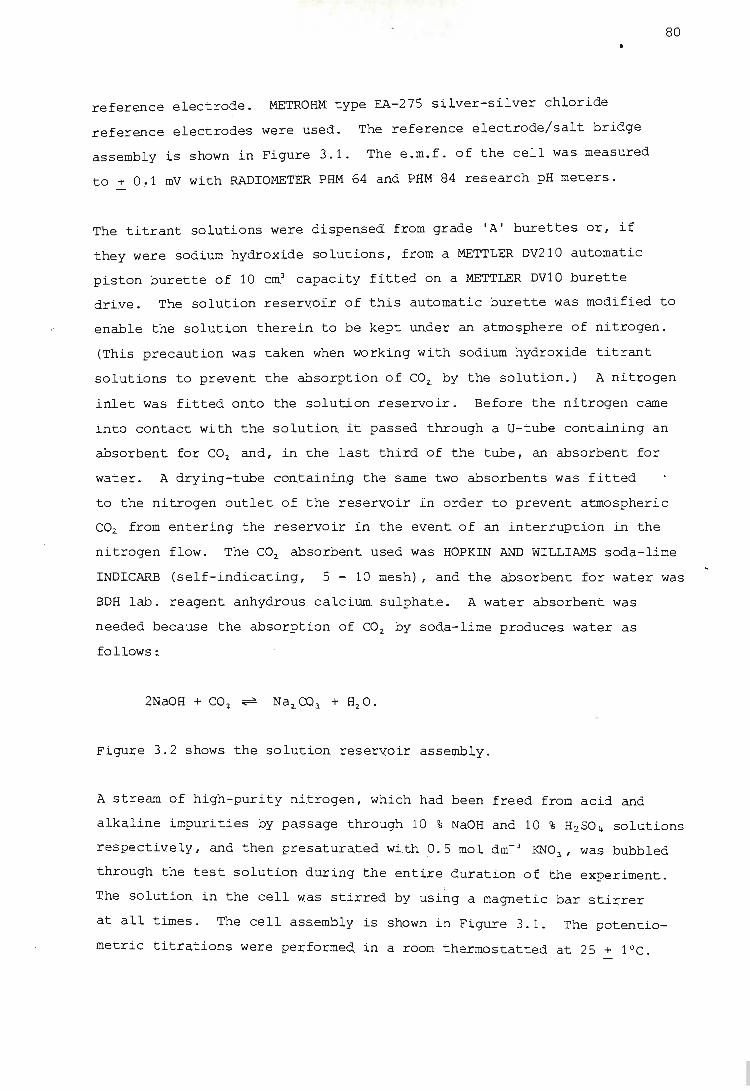
80
reference electrode. METROHM: type EA-275 silver-silver chloride
reference electrodes were used. The reference electrode/salt bridge
assembly is shown in Figure 3.1. The e.m.f. of the cell was measured
to + 0,1 mV with RADIOMETER PHM 64 and PHM 84 research pH meters.
The titrant solutions were dispensed from grade 'A' burettes or, if
they were sodium hydroxide solutions, from a METTLER DV210 automatic
piston burette of 10 cm3 capacity fitted on a METTLER DV10 burette
drive. The solution reserv.oir of this automatic burette was modified to
enable the solution therein to be kept under an atmosphere of nitrogen.
(This precaution was taken when wOl;'king with sodium hydroxide titrant
solutions to prevent the absorption of CO2 by the solution.) A nitrogen
inlet was fitted onto the soluti.on reservoir. Before the nitrogen came
into contact with the solution it passed through a U-tube containing an
absorbent for CO2 and, in the last third of the tube, an absorbent for
water. A drying-tube containing the same two absorbents was fitted
to the nitrogen outlet of the resel;"l.Oir in order to prevent atmospheric
CO2. fl;'om entering the resel;'voir in the event of an interruption in the
nitrogen flow. The CO2 absorbent used was HOPKIN AND WILLIAMS soda-lime
INDICARB (self-indicating, 5 - 10 mesh), and the absorbent for water was
BDH lab. reagent anhydrous . calcium sulphate. A water absorbent was
needed because the absorption of CO 2 by soda-lime produces water as
follows ~
2NaOH + CO 2
Figul;'e 3.2 shows the solution resel;'voir assembly.
A stream of high-purity nitxogen, which had been freed from acid and
alkaline impurities by passage through 10 % NaOH and 10 % H2 S0 4 solutions
respectively, and then pl;'esaturated with 0.5 mol dm- 3 KNOa , was bubbled
through the test solution dUl;'ing the entire duration of the experiment. ,
The solution in the cell was stirl;'ed by using a magnetic bar stixrer
at all times. The cell assembly is shown in Figure 3.1. The potentio
metric titrations were pel;'fol;'med in a room thermostatted at 25 + 10C.
thermometer------~
nitrogen bubbler
glass electrode----~
jacketed glass reaction vessel
Ag,Agcl reference ~-----electrode
81
.J reference electrode/ salt bridge assembly
sintered glass frits
water inlet and outlet
magnetic stirrer bar
Figure 3.1 The potentiometric cel l assembly .
soda -1 ime --+.-
calcium --4-sulphate
~..;....--to automatic burette
m~~rubber stopper
rubber stoppers
glass wool plugs
soda-lime
__ ~ ____ solution reservoir
Figure 3.2 Solution reservoir modified to prevent CO2
absorption.
82

83
3.2' . The Titration Calorimeter
The enthalpy changes were measured by means of a precision titration
calorimeter which the Department of Chemistry, University of Natal, Durban
has on loan from the Council for Mineral Technology. The construction
and testing of the calorimeter have been described in a N.I.M. Report
(118) •
The titration calorimeter consists essentially of the LKB 8721-2 titration
calorimeter assembly (I.e. a precision thermostatic bath type 7603A, a
proportional controller type 7602A, a calorimeter unit type 8721-2 and
a stirrer driver unit type 8723) with an electronic system designed and
constructed by the Council for t1ineral Technology (then the National
Institute for Metallurgy) . (See Plates 1 and 2.) Since the report on
the construction of the calorimeter was published some changes have been
made to the electronic assembly. The measuring instrument is no longer
the EMT type 213 MK2 six-digi.t voltmeter but a Fluke model 8810A 5!-digit
digital multimeter. The Moduprinter has also been replaced by a Fluke
model 2030A programmable printer . The calorimeter is housed in a room
thermostatted at 25 + lOCo
All the calorimetric measurements are carried out in a cylindrical stain
less steel water bath. This bath is in turn contained in a second cylinder
of stainless steel. Water from an auxiliary bath maintained at 25.00
+ 0.05°C is circulated. between the two cylinders. The temperature of the
wate:r;- in the inner bath is, main.tained at 25.000 + 0·001 °c by a proportional
con.troller. The whole . water bath assembly is surrounded by polystyrene
(to prevent heat loss to the s.urroundings) and placed in a metallic case.
The calorimeter reaction vessel con.sists of a glass bottle of about 110 cm.l
capaci.ty. Within the ves.sel . are three glass fingers. The first finger
con.tains the heater, the secono the thermistor, and the third. may be
filled from the outside with cooli ng materi.al. The vessel also contains
a. glass delivery ti.p which is connected to the titrant-deli very system
",fa thin tubing.
The glass reaction vessel has a metallic screw-thread at the neck. This
i .s uS.ed to attach the vessel to the underside of the stainless steel
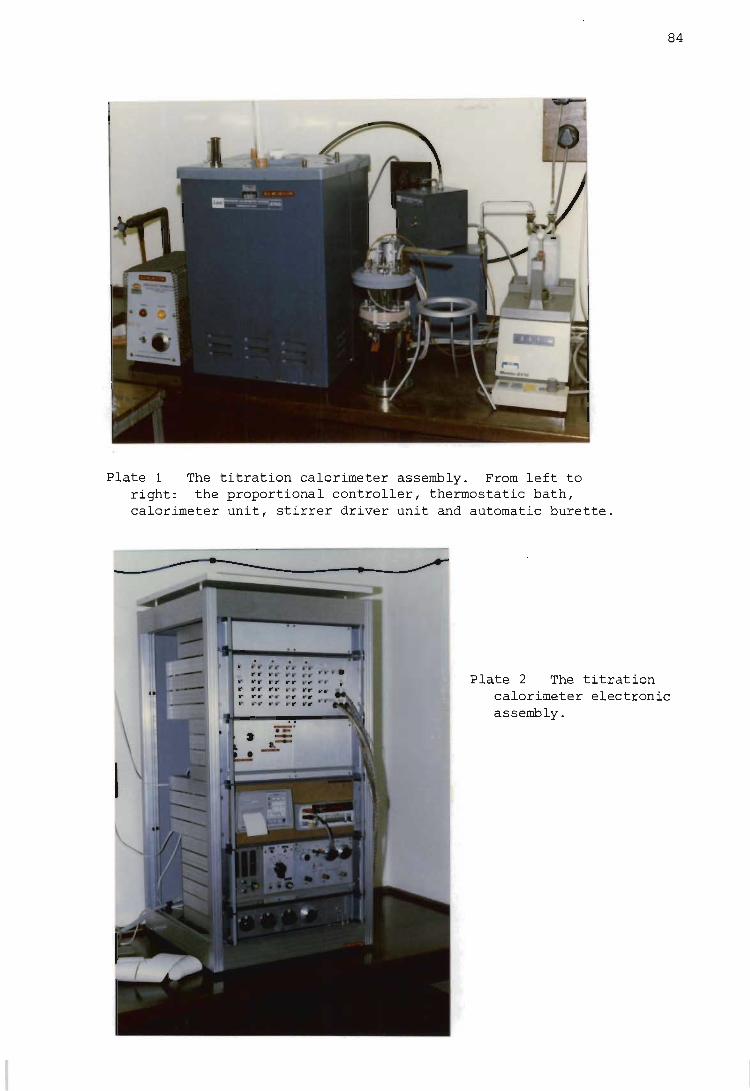
Plate 1 The titration calorimeter assembly. From left to right: the proportional controller, thermostatic bath, calorimeter unit, stirrer driver unit and automatic burette.
~--------~---~
Plate 2 The titration
84
calorimeter electronic assembly.
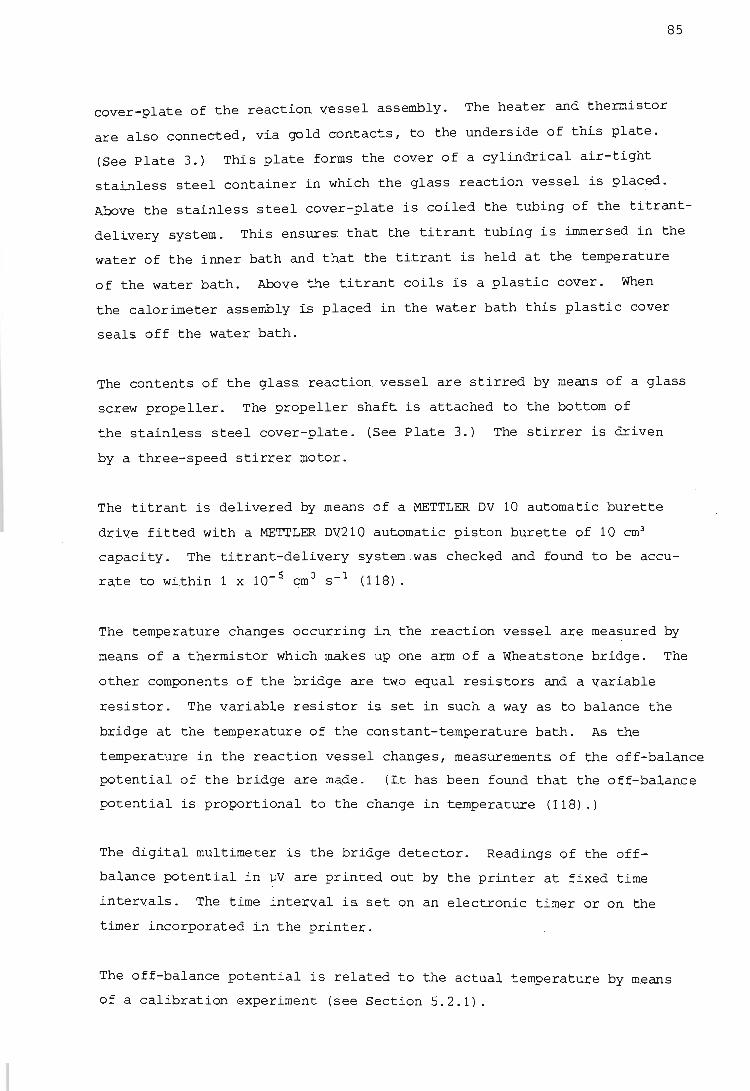
85
cover-plate of the reaction vessel assembly. The heater and thermistor
are also connected, vi.a gold contacts, to the underside of this plate.
(See Plate 3.) Thi.s plate forms the cover of a cylindrical air-tight
stainless steel container in which the glass reaction vessel is placed.
Above the stainless steel cover-plate is coiled the tubing of the titrant
delivery system. This ensures that the titrant tubing is immersed in the
water of the inner bath and that the ti.trant is held at the temperature
of the water bath. Above the titrant coils is a plastic cover. When
the calorimeter assembly is placed in the water bath this plastic cover
seals off the water bath.
The contents of the glass reaction vessel are stirred by means of a glass
screw: propeller. The propeller shaft. is attached to the bottom of
the stainless steel cover-plate. (See Plate 3.) The stirrer is driven
by a three-speed stirrer motor.
The titrant is delivered by means of a METTLER DV 10 automatic burette
drive fitted with a METTLER DV210 automatic piston burette of 10 cm3
capacity. The titrant-delivery system .was checked and found to be accu
rate to within 1 x 10- 5 cm3 s-1 (118).
The temperature changes occurring in the reaction vessel are measured by
means of a thermistor which makes up one arm of a Wheatstone bridge. The
other components of the bridge are two equal resistors and a variable
resistor. The variable resistor is set in such a way as to balance the
bridge at the temperature of tne constant-temperature bath. As tne
temperature in the reaction vessel changes,. measurements of the off-balance
potential of the brid.ge are mao..e. (Lt has been found that the off-balance
potential is proportional to the change in temperature (118).)
The digital multimeter is the bridge detector. Readings of the off
balance potential in ~V are printed out by the printer at fixed time
intervals. The time interval is set on an electronic timer or on. tne
timer incorporated in the printer.
The off-balance potential is rela.ted to the actual temperature by m.eans
of a calibration experiment (see Section 5.2.1).
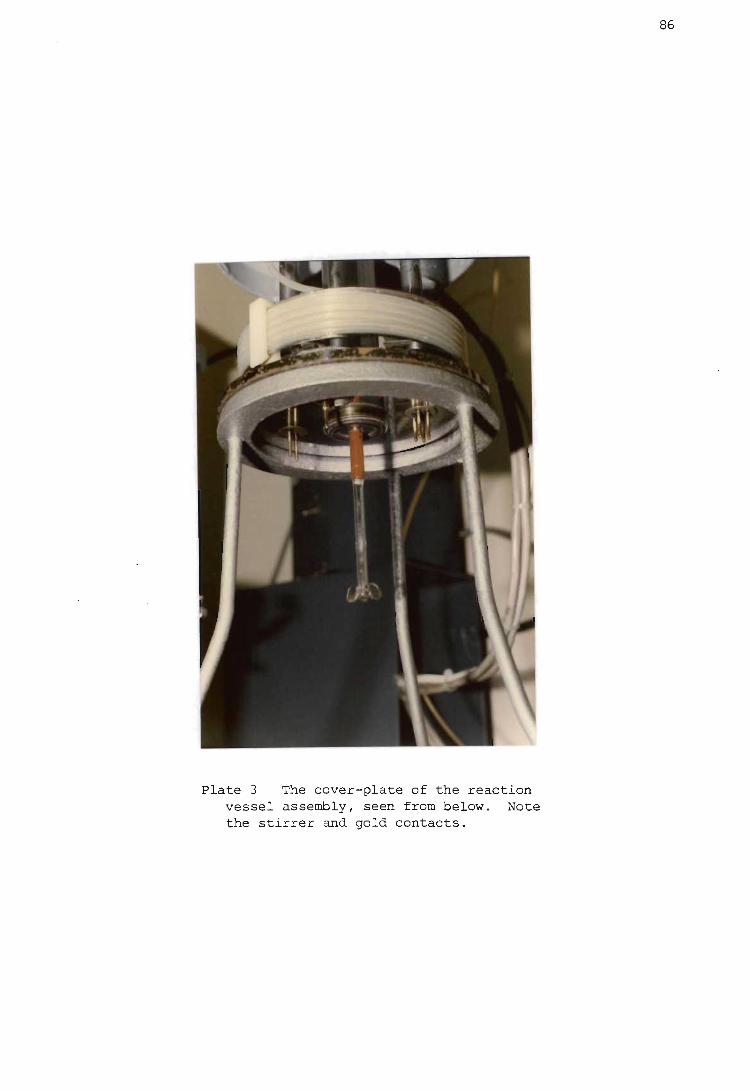
I
I \
I
\
Plate 3 The cover-plate of the reaction vessel assembly, seen from below. Note the stirrer and gold contacts.
86

87
There are three modes of operation of the titration calorimeter:
1) Burette mode - this swi.tches on the burette drive and a titra
tion can be perfonned.
2) Heater mode - this. switches on the heater to enable a heat
capacity to be deterr.nined.
3) Ampoule mode - this activates the ampoule smasher. (This last
function was not used in this work.)
For the first two modes of operati .on a time interval of length up to
999 seconds, during which the burette or heater is operative, must be
selected. When that pre-set inte~al has elapsed the burette or heater
automatically switches off.
An accurately known curren.t passes through the reaction vessel heater
when One sets a potential Of 1.000 00 V. across anyone of a set of
standard resistors built in.to the circuit. If one then measures the
v.oltage drop across the heater corresponding to the current flowing through
it, one can calculate the power dissipated by the heater for a particular
nominal power setting. (Values qf the current flowing through the heater
at particular power settings have been tabulated (118).)
Further detai.ls of the operation qf the calorimeter will be given in
Chapter 7.
CHAPTER FOUR
CALCULATION TECHNIQUES
In this chapter the various computational techniques employed in this work
will be described. These will include the Gran plot method for equivalence
point determination in potentiometric titrations, the various corrections
which have to be applied to the 'raw' calorimetric data before ~H~ values
can be calculated, and a description of how formation curves can be
derived from potentiometric data. The use of various computer programs
to process potentiometric and calorimetric data will also be described.
4.1. Gran Plots
Gran plots provide an easy and accurate means of determining the equiva
lence point of a potentiometric titration. The equivalence point of a
potentiometric titration can, in principle, be determined by plotting
values of the cell potential against the volume of titrant added and
finding the point of inflection (or maximum slope) of the titration curve.
This method presents problems when there is only a small potential change
at the end-point, e.g. in the titration of weak acids by strong bases.
In such cases it has been customary to plot the curve of ~E/~v against
the volume v of titrant added. These methods can be criticized in that
they do not use the data points which are far from the point of inflection.
Furthermore, if the titration curve is not symmetrical about the equiva
lence point, the results obtained may be erroneous.
Gran (119, 120) and later others (121) devised a way of linearizing the
titration curve in such a way that all the points in the titration are
used, and not only those in the vicinity of the equivalence point. In
his first paper (119) Gran showed that curves of ~v/~pH or ~v/~E against
v have two branches which intersect at the equivalence point. Although
for weak electrolyte systems these branches are parabolic they can be
transformed into straight lines, and this makes it possible to determine
the equivalence point very accurately. Later Gran (120) developed the
idea first proposed by S¢rensen that, if one plots the antilogarithm of
the pH as a function of the volume of titrant added, one can also trans
form potentiometric titration curves into straight lines.

89
The plots obtained are called Gran plots and consist of two straight
lines which, in theory, intersect each other and the volume axis at the
equivalence point. The straight line before the equivalence point shows
the titrate concentration decreasing and has a negative slope, whilst
that after the equivalence point has a positive slope and shows the
excess titrant concentration increasing.
The Gran plot method of determining the equivalence point in a potentio
metric titration has several advantages:
1. The titrant solution can be added in regular increments, which is
not the case in conventional titrations, where a large number of
readings have to be taken near the equivalence point. In this
way one may avoid the difficulty of obtaining many points in a
region in which the electrode potentials are unstable and drift
readily.
2. It provides a simple way of determining the equivalence point in
systems in which the end-point break is poor, e.g. weak acid
strong base titrations.
3. Since the plots consist of straight lines, one need only obtain
points in a region in which the electrode response is Nernstian or
near-Nernstian.
4. The calculations are simple and quick and can be computed and plotted
during the actual titration while one is waiting for steady poten
tial readings to be attained.
5. The presence of carbonate in alkali solutions is easily detected
and the concentration thereof easily computed.
6. The equivalence point can be determined accurately, even in cases
where the titration curve is asymmetrical.
The Gran plot method has the limitation that when ' the protonation constant
of the weak acid is greater than about 10 7 the method no longer gives
straight lines, but instead produces curves which do not intersect the
90
volume axis at the true equivalence point. This is due to the neglect of
minor components in the equilibria involved in the titration reactions.
Ingman and Still (122) have shown that, if the protonation constant of
the weak acid is known, an expression can be derived which, when plotted
against the titrant volume, does yield a straight line. This latter
method was tried on the standardisations of the ligands used here and will
be discussed in the relevant sections. The method also has the limitation
that it neglects variations in activity coefficients. This effect can be
minimized by the use of a constant ionic medium.
In this work the Gran plot method was used in the analysis of acid-base
neutralization titrations. The potentiometric readings for these titra
tions were obtained by measuring the e.m.f. of the following cell:
(-)RE Isalt bridge Ititration solution Iglass electrode (+) (I)
where RE (reference electrode) : Ag IAgC! 10.01 mol dm- J C!-, 0.49 mol dm-J
N03 -, 0.50 mol dm-J K+ and salt bridge: 0.50 mol dm-J KNOJ
•
The potential of cell (I) is (in theory) given by
E (4.1)
~ , Here E ~ncorporates the standard potential of the glass electrode half-
cell and the potential of the reference half-cell, EJ is the liquid
junction potential between the salt bridge and the test solution, YH+ is
the activity coefficient of H+ and s represents 2.3026 RT/nF - i.e. we
assume that the electrode response is Nernstian. As the ionic strength
was kept almost constant, Ee
, EJ and YH+ were considered to remain con
stant during a potentiometric titration. Equation (4.1) can thus be
simplified to
(4.2)
Although the Gran plot method has been described in some detail in the
literature (119 - 121, 123), a discussion of three cases of the method is
included for completeness. In the cas f th t't t ' e 0 e ~ ra ~on of a strong base
91
with a strong acid it is of interest to show how the method was used to
estimate the carbonate contamination in the strong base solution. The
application of Ingman and Still's extended Gran plot method (122) to the
titration of a weak diprotic base with a strong acid is described in
detail because that case was not treated by them.
In passing, it may be worth noting that, besides acid-base neutralisation
titrations, the Gran plot method can also be applied to precipitation,
complex formation and redox titrations and the multiple standard addition
technique. These applications are discussed in the review article by
Mascini (123) and also in Gran's papers (119, 120). A modified Gran plot
technique has been described for the determination of activity coefficients
and junction potentials (124).
4.1.1. Titration of a strong base with a strong acid
If Vo cm3 of strong base, of initial concentration CB, is titrated with
a strong acid of concentration CA, the concentration of hydroxide ions
after the addition of v cm3 of acid will be:
(4.3)
where Va is the total initial volume r i.e. besides Vo it includes the
volume of background electrolyte added at the start of the titration.
Setting v = ve, the volume of acid added at the equivalence point, we
see that
(4.4)
Hence, substituting equation (4.4) into equation (4.3) 1 we obtain
(4.5)
Now
(4.6)
where Kw is the ionic product of water .
Thus
Kw(V O + v)
CA(Ve - v)
92
(4.7)
If the above expression is substituted into equation (4.2) we obtain the
following:
~* (YH+KW(V a + V») E = E + slog C ( ) , . A ve - v
(4.8)
which is a nonlinear relationship between E and . v containing the quantity
ve which one wishes to determine. The relationship can be linearized if
one considers the following:
CA(Ve - v)
YH+Kw(Va + v)
=
(where aH+ is the activity of the hydrogen ion). On rearrangement one
obtains the function ¢ given by
¢(v) (Va + v) 10-E/ S (4.9a)
~*/ 10-E s (ve - v) , (4.9b)
which is linear in v.
After the equivalence point has been passed
(4.10)
since we are now in the region of excess ac;d. A ' ub t' • ga~n, s s ~tuting
equation (4.4) into equation (4.10), we obtain
Equation (4.2) for the cell potential now becomes
eo ~H+CA (v - v e )) E = E * + slog t1 •
"'0 + v
One can then linearize as before:
10-pH
and
~' (v)
= aH+
YH+[H+1
YH+CA (v - ve ) =
Vo + v
10 (E - E"O'*)/S
E/s = (V 0 + v) 10
93
(4.11)
(4.12)
(4.13a)
(4.13b)
If the ionic strength is kept quite high and almost constant during the
titration, then YH+ and Kw do not change appreciably and the functions
¢ and ¢' are linear functions of v. The functions ¢ and ¢',given by
equations (4.9a) and ~.13a)respectivelYI can be plotted and extrapolated
to intersect the horizontal axis at the point vel since both functions
assume the value zero when v = ve.
An example of a Gran plot for the titration of a strong base with a
strong acid is shown in Figure 4.1. In this example a mixture of 5.00
cm3 of approx. 0.1 mol dm- 3 NaOH and 50.00 cm3 of 0.50 mol dm- 3 KN0 3 was
titrated with 0.0999 mol dm- J HN03 in a cell containing a glass electrode
and a silver-silver chloride --reference electrode as shown in cell (I).
All the solutions used were made -' up to an ionic strength of 0.50 mol dm- 3
by using KNO J • The data collected and the calculations performed to
obtain the Gran plot are shown in Table 4.1.
From Figure 4.1 one obtains ve 4.87 cm3 I whence the concentration of
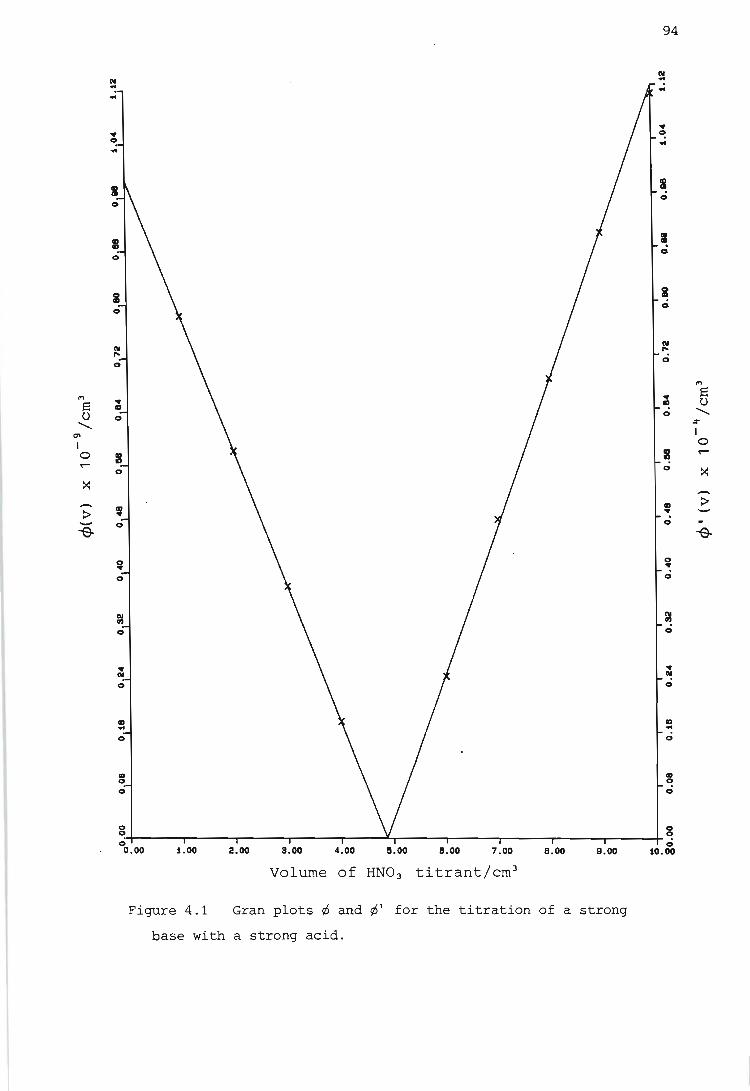
PI
S o
.........
I o .-
II' ..
• .. .. I .. I ..
..
.. ~ .. D .. .. • .. .. .. .. .. 0.00 1.00
Figure 4.1
2.00 3.00 4.00 !I. 00 8.00 7.00 8.00 8.00
Volume of RN0 3 titrant/em3
Gran plots ¢ and ¢' for the titration of a strong
base with a strong acid.
94
II' .. .;
• .. .. I ..
i .. II' r-.. • D .. II .;
, .;
* ..
• .;
• II' .. D .. .;
D .. .. g ..
10.00
PI
S 0
......... ~
I 0 ..-
~
:::-
--e-
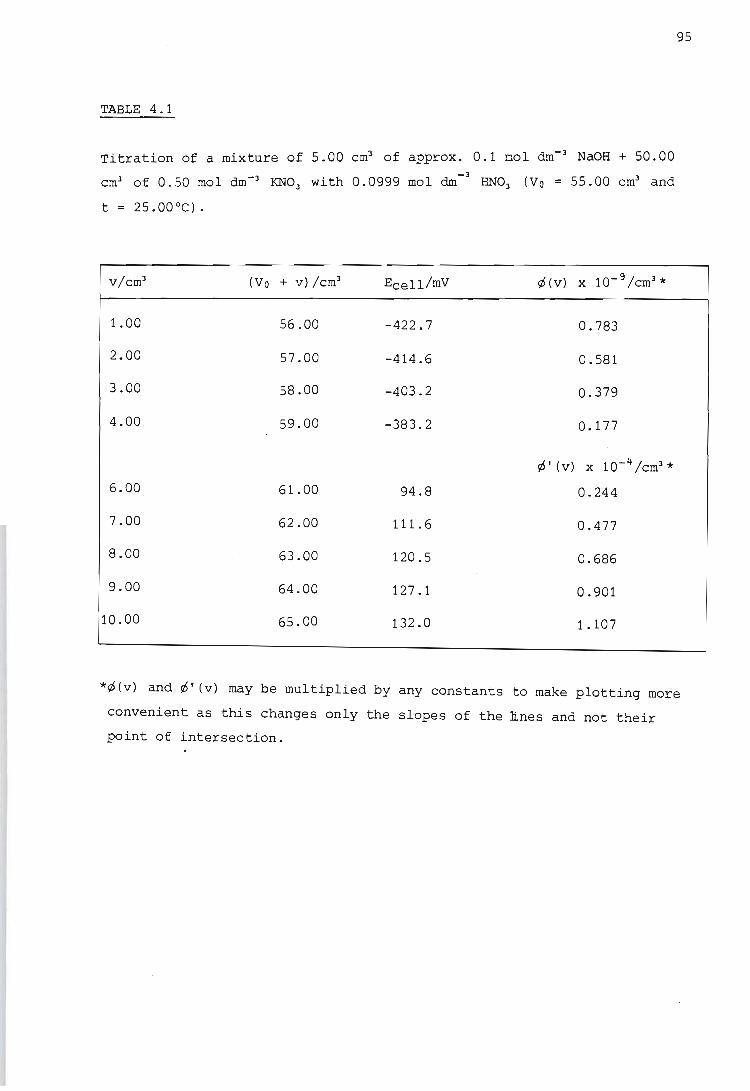
TABLE 4.1
Titration of a mixture of 5.00 cm3 of approx. 0.1 mol dm-3
NaOH + 50.00
cm3 of 0.50 mol dm-3 KN03
with 0.0999 mol dm-3
HN03 (Va = 55.00 cm3
and
t = 25.00 °C) .
v/cm3 (Va + v) /cm3 Ecell/mV ¢(v) x 10- 9/cm3 *
1.00 56.00 -422.7 0.783
2.00 57.00 -414.6 0.581
3.00 58.00 -403.2 0.379
4.00 59.00 -383.2 0.177
95
¢' (v) x 1O-4 /cm3 *
6.00 61.00 94.8 0.244
7.00 62.00 111.6 0.477
8.00 63.00 120.5 0.686
9.00 64.00 127.1 0.901
10.00 65.00 132.0 1.107
*¢(v) and ¢' (v) may be multiplied by any constants to make plotting more
convenient as this changes only the slopes of the lines and not their
point of intersection.
96
the sodium hydroxide solution can be calculated to be 0.0973 mol dm- 3•
The functions ¢ and ¢' do sometimes deviate from linearity because of one
or more of the following factors.
1. If curvature of the Gran plots at values of v remote from ve occurs
it suggests that the activity coefficient and junction potential
are not constant at extreme values of hydrogen and hydroxide ion
concentrations. If such plots are linear near the equivalence
point the value of ve must be obtained from this region alone.
2. If the strong base is contaminated with carbonate, ¢, the function
on the alkaline side of the equivalence point ve ' is curved in the
vicinity of that point l and ¢', the function on the acidic side,
now cuts the horizontal axis at some point ve' > ve. (An example
of this is shown in Figure 4 . 2.) In this case
(4.14)
where CB = [OH-] + 2[C03 =], the total concentration of base. If
the function ¢ is linear over an appreciable range of v it may be
extrapolated to cut the horizontal axis at the point
(4.15)
i.e. from this point the concentration of hydroxide ions in the
strong base can be obtained. Thus the concentration of carbonate
in the base can be estimated from the difference between ve' and ve.
Symbolically
(4.16)
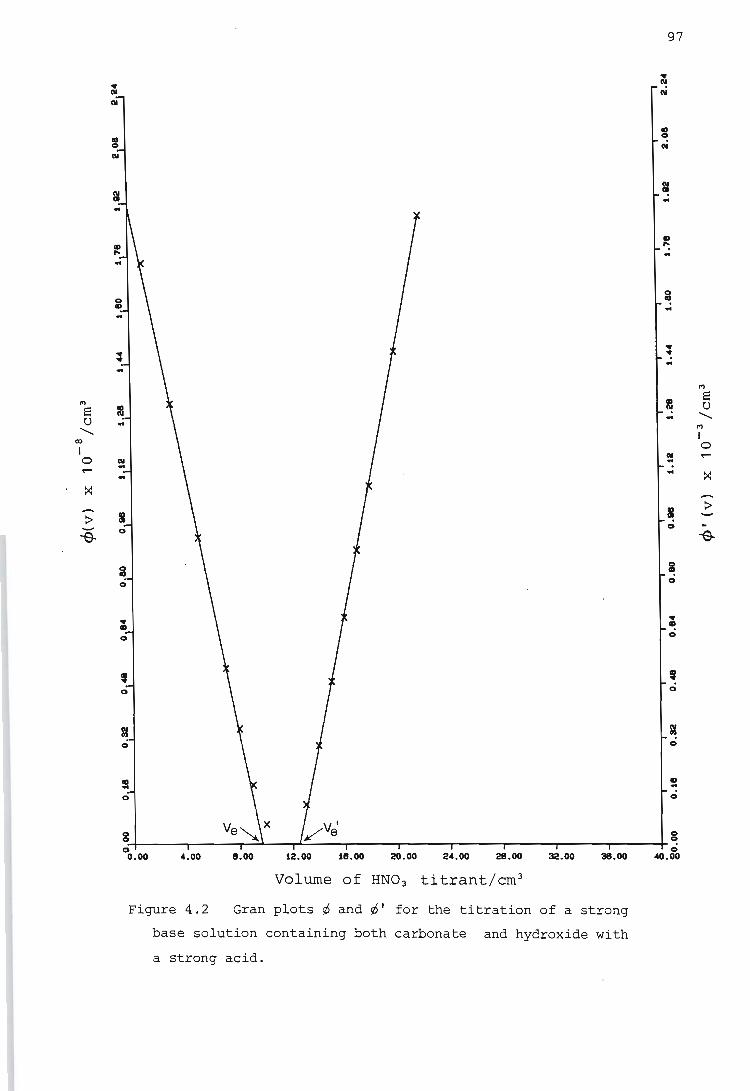
• N
I o
o
• D o
o
= o
o
I o
i o
• D o
, o
D -o
97
g g O~------~----~~--~~~--'-----~------~-----r------r------r----~o O.~ 4.00 a.~ ~.OO ~ .~ ~ .~ 24.~ ~.~ ~.~ •. 00 ~.OO
Volume of RN0 3 titrant/em 3
Figure 4.2 Gran plots ~ and ~' for the titration of a strong
base solution containing both carbonate and hydroxide with
a strong acid.
~
I o
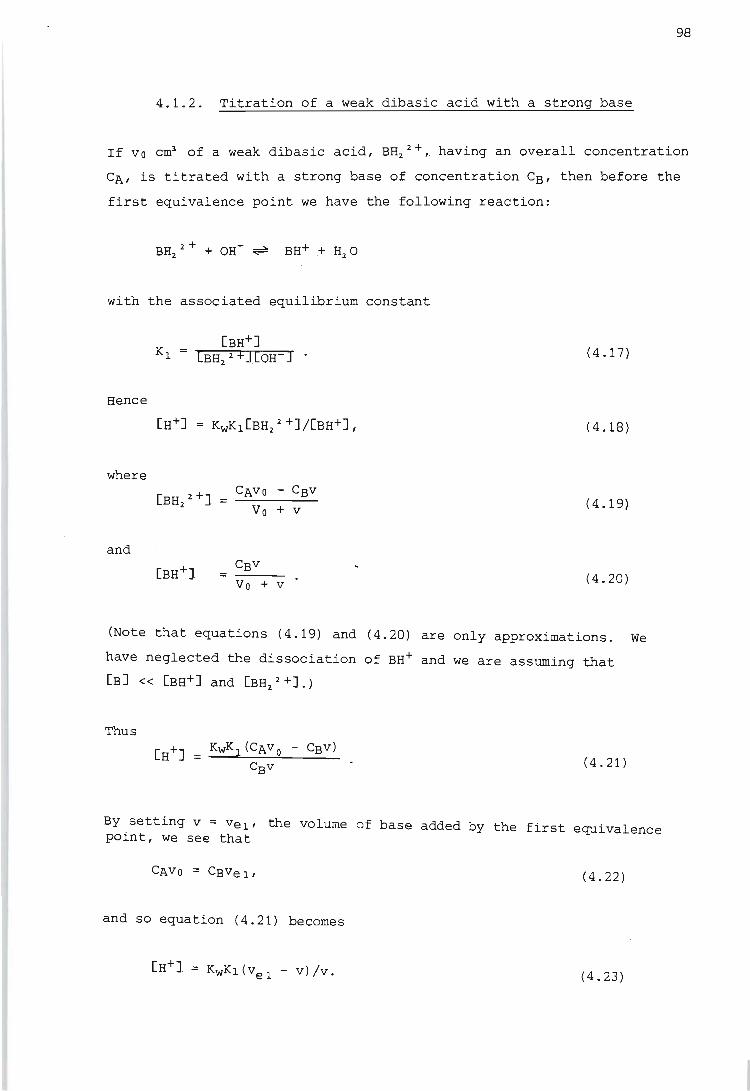
98
4.1 . 2. Titration of a weak dibasic acid with a strong base
If va cm3 of a weak dibasic acid, BH22 +, having an overall concentration
CA, is titrated with a strong base of concentration CB' then before the
first equivalence point we have the following reaction:
with the associated equilibrium constant
(4.17)
Hence
(4.18)
where
[BH2
2 +] CAva - CBV
;:::;
Va + v (4.19)
and
[BH+] CBv
= Va + v (4.20)
(Note that equations (4.19) and (4.20) are only approximations. We
have neglected the dissociation of BH+ and we are assuming that
[B] « [BH+] and [BH2
2 +].)
Thus
(4.21 )
By setting v = vel' the volume of base added by the first equivalence point, we see that
(4.22)
and so equation (4.21) becomes
(4.23)
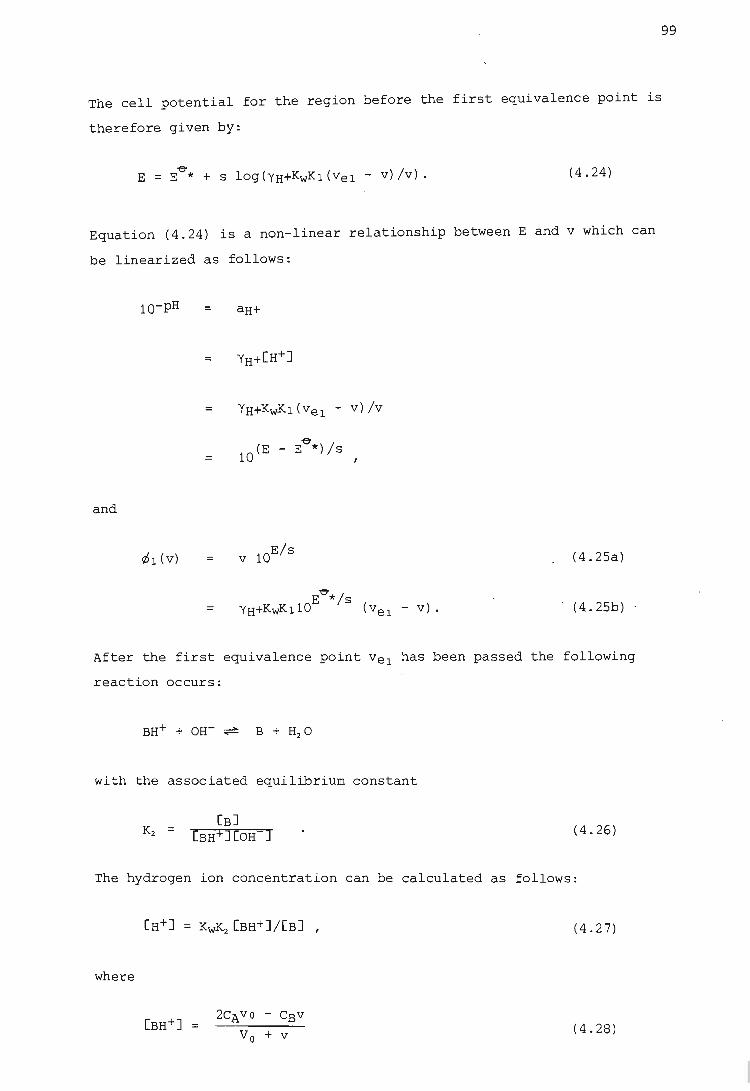
The cell potential for the region before the first equivalence point is
therefore given by:
(4.24)
Equation (4.24) is a non-linear relationship between E and v which can
be linearized as follows:
=
"0-(E - E *) /s = 10 I
and
(4.2Sa)
(4.2Sb) .
After the first equivalence point vel has been passed the following
reaction occurs:
with the associated equilibrium constant
[BJ (4.26)
The hydrogen ion concentration can be calculated as follows:
(4.27)
where
(4.28)
99

and
[BJ
(Again, equations (4.28) and (4.29) are only approximate.)
Thus KWK2 (2CAv a - CBv)
CBv - CAva
From v = vel we already have
100
(4.29)
(4.30)
(4.31)
and by setting v = v e2 ' the volume of base added by the second equivalence
point, we get
(4.32)
Substituting equations (4.31) and (4.32) into equation (4.30) gives
Therefore
KWK2 (Ve2 - v) (v - vel)
(4.33)
(4.34)
Equation (4.34) can be linearized as follows for the region after the
first equivalence point but remote from the second equivalence point:
=
10(E~* - E) / s
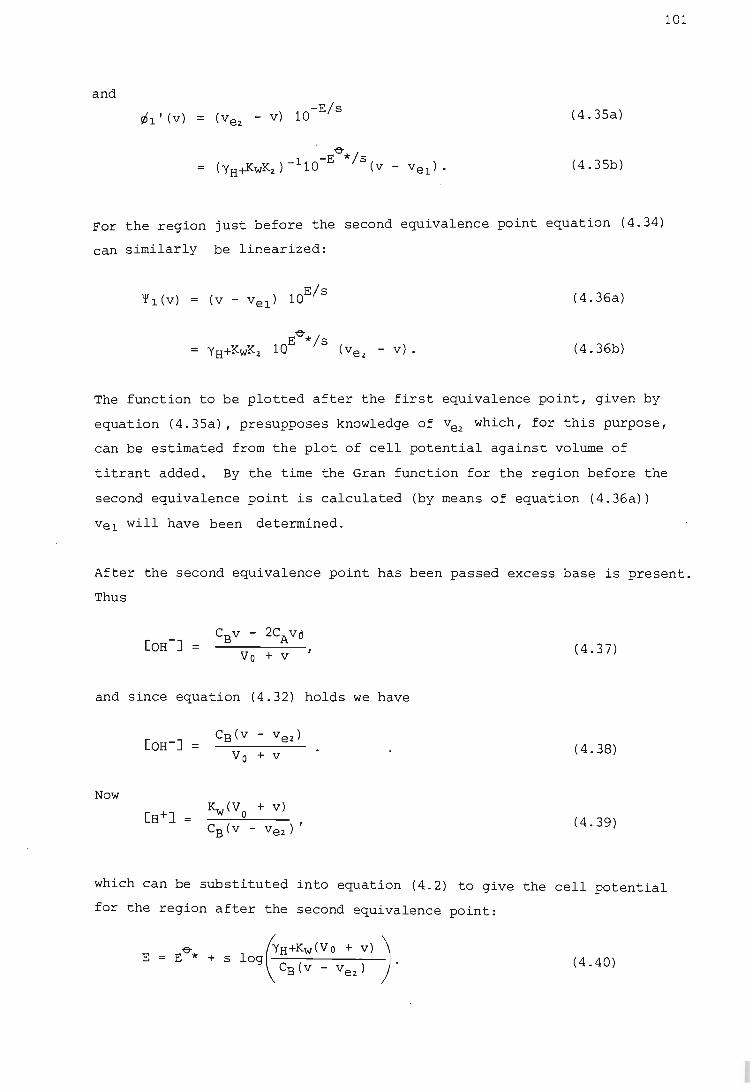
and
~l' (v) = (vea - v) 10-E
/S (4.35a)
(4.35b)
For the region just before the second equivalence point equation (4.34)
can similarly be linearized:
(4.36a)
(4.36b)
101
The function to be plotted after the first equivalence point, given by
equation (4.35a), presupposes knowledge of vea which, for this purpose,
can be estimated from the plot of cell potential against volume of
titrant added. By the time the Gran function for the region before the
second equivalence point is calculated (by means of equation (4.36a))
vel will have been determined.
After the second equivalence point has been passed excess base is present.
Thus
and since equation (4.32) holds we have
Now
CB (v - vel)
Va + v
l<w(V a + v)
CB (v - vea) ,
(4.37)
(4.38)
(4.39)
which can be substituted into equation (4.2) to give the cell potential
for the region after the second equivalence point:
-e E = E * + S (4.40)
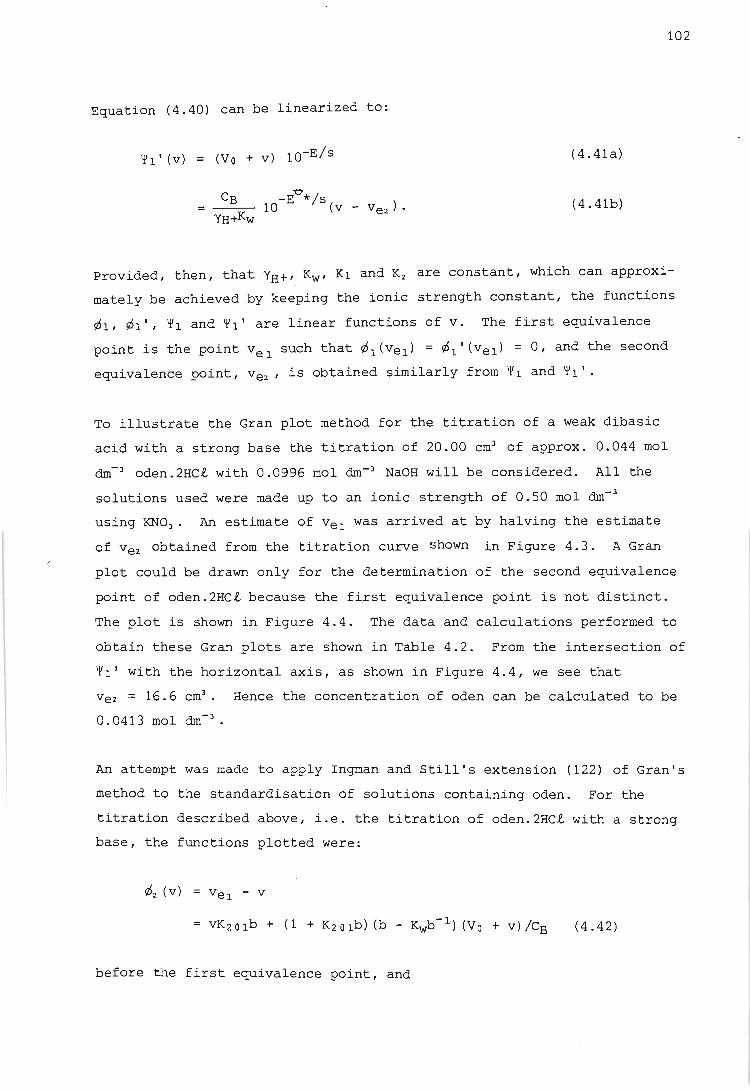
102
Equation (4.40) can be linearized to:
'1'1' (v) = (Va + v) 10-E / S (4.41a)
c e*/ B 10-E s(v ) = ----- - vez . YH+l<w
(4.41b)
Provided, then, that YH+' Kw' Kl and K2 are constant, which can approxi
mately be achieved by keeping the ionic strength constant, the functions
¢l, ¢l', '1'1 and '1'1' are linear functions of v. The first equivalence
point is the point vel such that ¢l(vel) = ¢l' (vel) = 0, and the second
equivalence point, v e2 ' is obtained similarly from '1'1 and '1'1'·
To illustrate the Gran plot method for the titration of a weak dibasic
acid with a strong base the titration of 20.00 cm3 of approx. 0.044 mol
dm- 3 oden.2HCt with 0.0996 mol dm- 3 NaOH will be considered. All the
solutions used were made up to an ionic strength of 0.50 mol dm- 3
using KN0 3 • An estimate of vel was arrived at by halving the estimate
of vez obtained from the titration curve shown in Figure 4.3. A Gran
plot could be drawn only for the determination of the second equivalence
point of oden.2HCt because the first equivalence point is not distinct.
The plot is shown in Figure 4.4. The data and calculations performed to
obtain these Gran plots are shown in Table 4.2. From the intersection of
'1'1' with the horizontal axis, as shown in Figure 4.4, we see that
vez = 16.6 cm3• Hence the concentration of oden can be calculated to be
0.0413 mol dm- 3•
An attempt was made to apply Ingman and Still's extension (122) of Gran's
method to the standardisation of solutions containing oden. For the
titration described above, i.e. the titration of oden.2HCt with a strong
base, the functions plotted were:
¢2 (v)
(4.42)
before the first equivalence point, and
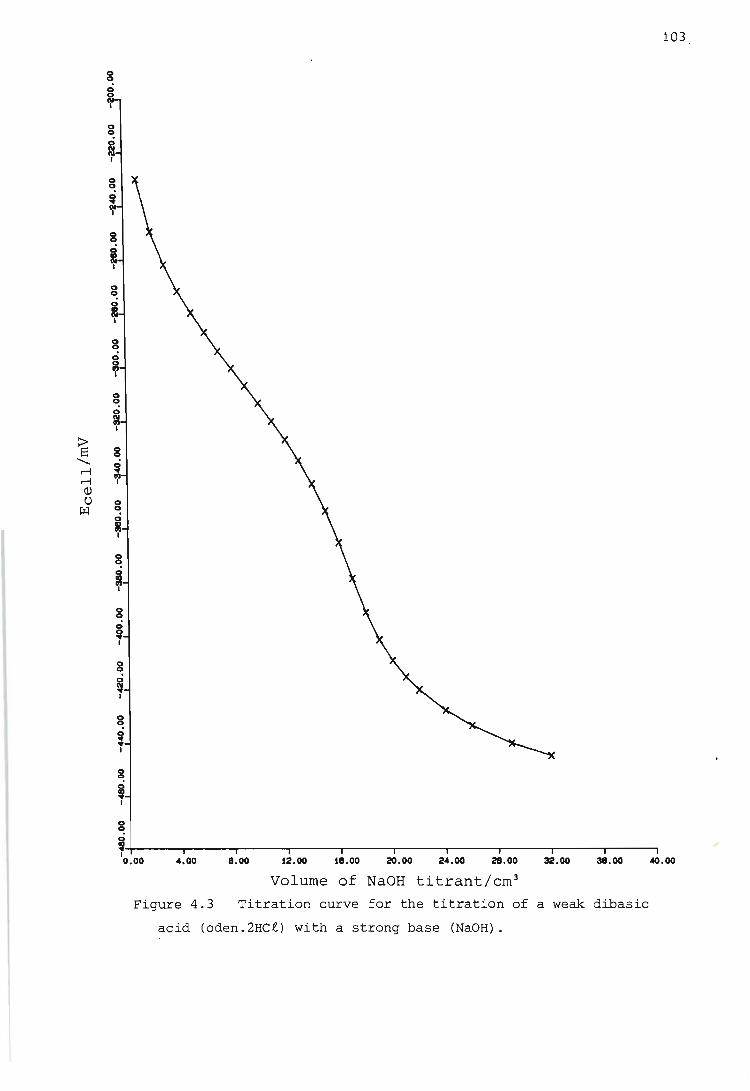
103
g o
g , I
g
,+---~--~~--~--~----~--~--~----~--~--~ I 0.00 4.00 8.00 12.00 18.00 20.00 24.00 28.00 32.00 38.00 40.00
Volume of NaOH titrant/em3
Figure 4.3 Titration curve for the titration of a weak dibasic
acid (oden.2HCt) with a strong base (NaOH).
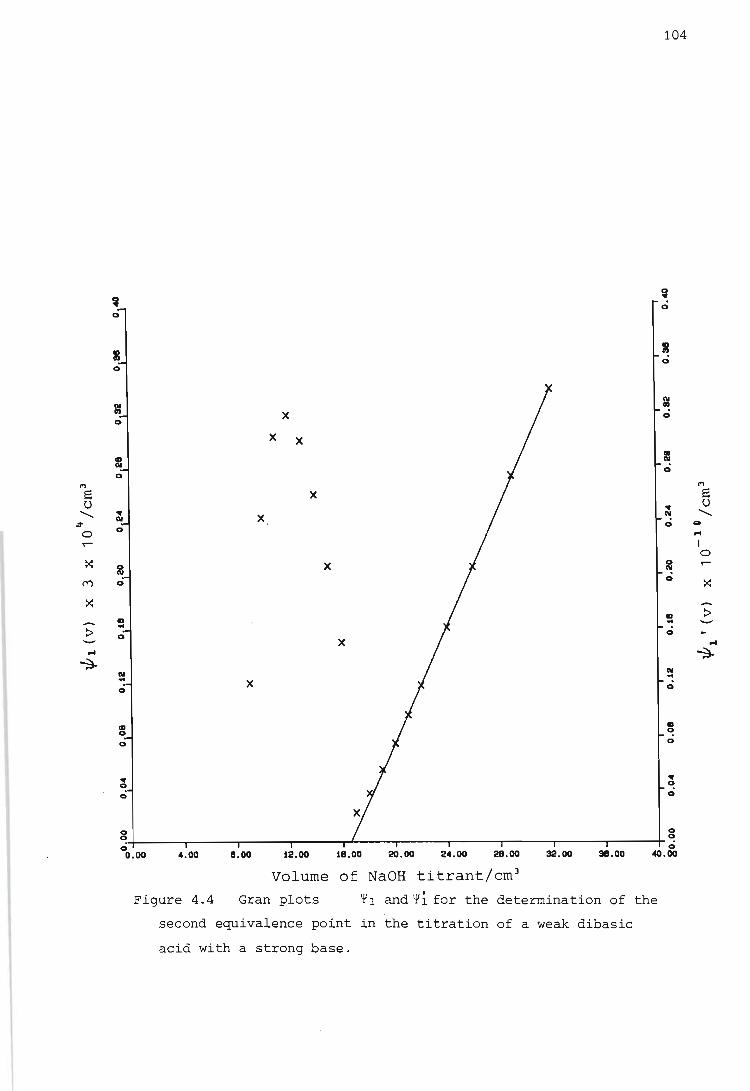
'" s 0 "-
3
0 ......
>: M
>:
:> P4
~
~ 0
I 0
I 0
:I 0
• N X,
0
.. .. 0
N .. 0
X
.. 0
0
• 0
0
x
X X
X
X
X
104
~ 0
I 0
III 0
:I 0
• N
0
2 0
.. .. 0
N .. 0
! o
• o o
0 0
0 ~-----'------r------r----~~----r-----'------r-----.r-----~-----r: 0.00 4.00 8.00 12.00 UI.oo 20.00 24.00 28.00 32.00 38.00 40.00
Volume of NaOH titrant/em3
Figure 4.4 Gran plots '¥ l and '¥ i. for the determination of the
second equivalence point in the titration of a weak dibasic
acid with a strong base.
'" S 0 "-..
P4
I 0 ......
>:
:>
P4
~
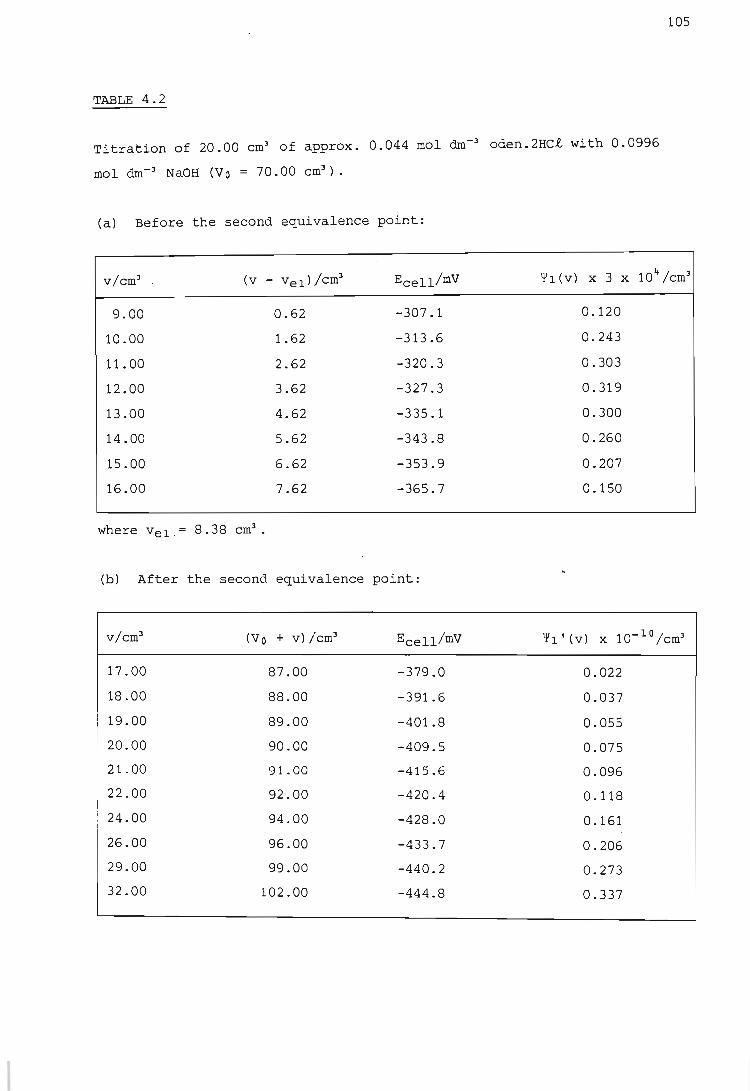
105
TABLE 4.2
Titration of 20.00 cm3 of approx. 0.044 mol dm- 3 oden.2HCt with 0.0996
mol dm- 3 NaOH (Vo = 70.00 cm3).
(a) Before the second equivalence point:
v/cm3 (v - vel) /crn3 ECell/mV '1'1 (v) x 3 X 10 4 /cm3
9.00 0.62 -307.1 0.120
10.00 1.62 -313.6 0.243
11.00 2.62 -320.3 0.303
12.00 3.62 -327.3 0.319
13.00 4.62 -335 . 1 0.300
14.00 5.62 -343.8 0.260
15.00 6.62 -353.9 0.207
16.00 7.62 -365.7 0.150
where vel .= 8.38 cm3•
(b) After the second ·equivalence point:
v/cm3 (Vo + v) /cm3 Ecell/mV 'i'1'(V) x 1O- 1O /cm3
17.00 87.00 -379.0 0.022
18.00 88.00 -391.6 0.037
19.00 89.00 -401.8 0.055
20.00 90.00 -409.5 0.075
21.00 91.00 -415.6 0.096
22.00 92.00 -420.4 0.118
24.00 94.00 -428.0 0.161
26.00 96.00 -433.7 0.206
29.00 99.00 -440.2 0.273
32.00 102.00 -444.8 0.337
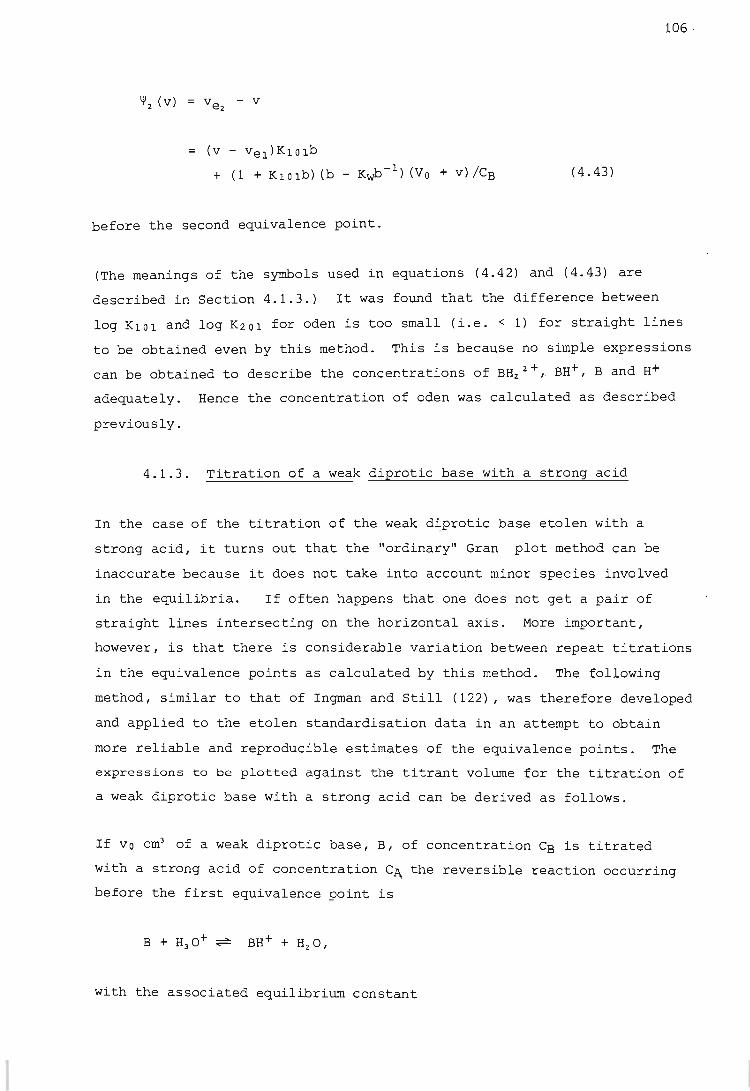
'¥ 2 (V) V - V e2
= (V - Vel)KlOlb
+ (1 + KlOlb) (b - Kwb-l) (Vo + V) ICB
before the second equivalence point.
(4.43)
(The meanings of the symbols used in equations (4.42) and (4.43) are
described in Section 4.1.3.) It was found that the difference between
106 ·
log KlOl and log K201 for oden is too small (i.e. < 1) for straight lines
to be obtained even by this method. This is because no simple expressions
can be obtained to describe the concentrations of BHz2 +, BH+, Band H+
adequately. Hence the concentration of oden was calculated as described
previously.
4.1.3. Titration of a weak diprotic base with a strong acid
In the case of the titration of the weak diprotic base etolen with a
strong acid, it turns out that the "ordinary" Gran plot method can be
inaccurate because it does not take into account minor species involved
in the equilibria. If often happens that one does not get a pair of
straight lines intersecting on the horizontal axis. More important,
however, is that there is considerable variation between repeat titrations
in the equivalence points as calculated by this method. The following
method, similar to that of Ingman and Still (122), was therefore developed
and applied to the etolen standardisation data in an attempt to obtain
more reliable and reproducible estimates of the equivalence points. The
expressions to be plotted against the titrant volume for the titration of
a weak diprotic base with a strong acid can be derived as follows.
If Vo cm3 of a weak diprotic base, B, of concentration CB is titrated
with a strong acid of concentration C~ the reversible reaction occurring
before the first equivalence point is
with the associated equilibrium constant
[BH+] [B][H+]
107
(4.44)
The following expressions can be written for the concentrations of BH+ and .
B in solution:
(4.45)
and
(4.46 )
where Va is the total initial volume. (The equations analogous to (4.45)
and (4.46) appearing in Gran's method are:
[BH+1 CAV.
and = Va + v
[BJ CBva - CAv
respectively. = , Va + v
We see that these two equations neglect the terms in [H+J and [OH-J. In
other words, Gran's method ignores the fact that proton at ion of the base
B is a reversible reaction - i.e. a reaction that does not necessarily
proceed quantitatively to completion - and that the base B is capable of
generating BH+ in solution through hydrolysis reactions.)
At the first equivalence point, vel' we have
(4.47)
Substitution of equations (4.45), (4.46) and (4.47) into the equilibrium
constant expression (equation (4.44» and subsequent rearrangement yield
vel - v
(4.48)
108
Now the cell potential is given by
where E~II incorporates the standard potential of the probe half-cell,
the potential of the reference half-cell, the liquid junction potential
and the activity coefficient of H+. E~II was .considered to remain constant
during a titration because the ionic strength was kept almost constant.
Hence
(4.50)
and since Kw
= TH+J ' (4.51)
equation (4.48) can be rewritten to define a function ¢3 as follows:
v/ (bK10 1)
+ (Kwb- l - b) (1 + K10lb) (Vo + v)/(bK101CA)
(E - E~II)/S where b represents 10
(4.52)
03 is a linear function of v and intersects the horizontal axis at vel'
The only disadvantage of this method is that the value of K10l at the
ionic strength being used must be known.
After the first equivalence point, vel, has been passed we have the
following reaction occurring:
BH++ H30+,,= BH22 + + H
20
with the associated equilibrium constant
(4.53)
Again, expressions for the reactant concentrations can be written:
and 2CBVO - CAv
Vo + v
(The expressions appearing in Gran's method are:
and
= . )
When v = vel we have the following relationship:
(4.54)
(4.55)
(4.56)
109
whereas when v vez' the volume of acid added at the second equivalence
point, we have
(4.57)
After substitution of equations (4.54), (4.55), (4.56) and (4.57) into
equation (4.53) and subsequent rearrangement, we obtain
Again equations (4.50) and (4.51) hold, and we can define a function ~3
as follows:
~ 3 (v) = vez - v
= (v - vel)/(bK20l)
+ (Kwb- l - b) (1 +K20lb )(VO +V)/(bK201CA) (4.59)
which is again linear in v. Equation (4.59) presupposes knowledge of
the first equivalence point, ve l ' but this is usually d~termined before
the second equivalence point.
110
In conclusion, we see that the plots of ¢3 (v) and ~3 (v) against v are
linear provided Ee ", Kw, K10l and K20l are constant, i.e. if the ionic
strength is kept constant. One obtains vel from ¢3 (vel) = 0 and ve2 from
~3 (ve2 ) = o.
To illustrate this method the titration of a mixture of 20.00 cm3 of
approx. 0.1 mol dm- 3 etolen and 50.00 cm3 of 0.50 mol dm- 3 KN03 with
0.09992 mol dm- 3 HN0 3 will be considered. All the solutions used in this
titration were made up to an ionic strength of 0.50 mol dm- 3 by using
KN03 • The resulting titration curve is shown in Figure 4.5, and the data
and calculations performed to obtain the extended Gran plots are shown
in Table 4.3. The value of Ee
" required for these calculations was
determined experimentally by calibrating the potentiometric cell as des
cribed in Section 5.1.1 prior to standardising the ligand solution. For
those standardisations in which the value of E-ell was not determined
experimentally it was estimated from log [H+] values obtained from a
species distribution calculation. The computer program HALTAFALL (see
Section 4.4.1) was used to calculate the required species distribution.
The program was provided with the protonation constants of the ligand,
an estimate of the ligand concentration obtained from the titration curve,
and the titrant acid concentration. From the calculated log [H+] and
the experimental cell potential values an estimate for Ee " could be ob
tained through use of the Nernst relationship (equation (4.49)).
Figure 4.6 depicts the extended Gran plot obtained for the determination
of the first equivalence point, Vel' of etolen. As can be seen, a curve
was obtained instead of a straight line . It seems that the difference
between log K10l and log K20l is insufficient (being < 3) to prevent
partial overlap of the two protonati on equilibria. However a straight
line was obtained for the second equivalence point, ve2. From Figure
4.7 we see that the extended Gran plot gives ve2 = 40.80 cm 3 • In plotting
~3 (v) an estimate for Vel is required. This was obtained from the graph
of cell potential against volume of titrant added. It was found that
the value of Ve2 obtained was not very sensitive to the estimate of Vel
used. The concentration of etolen was calculated from the value of ve2 alone. In this example the concentration of etolen was found to be 0.1019
mol dm- 3•
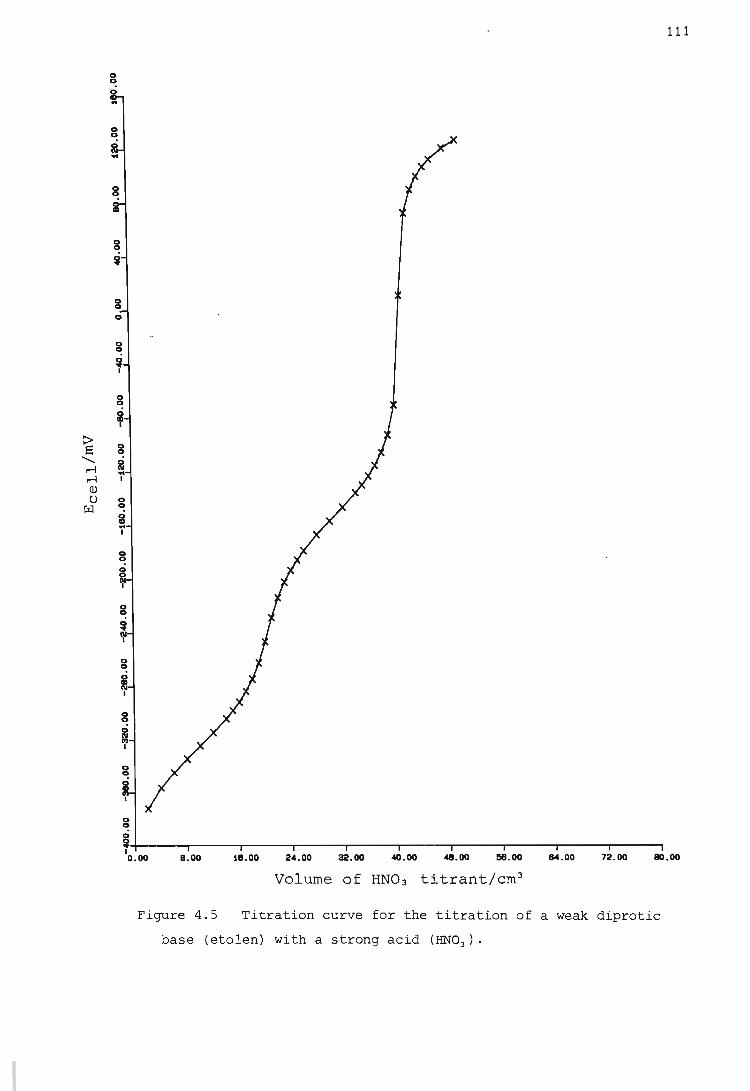
o o
o
8
1
8
8
':~----~----~---'----~-----r----'-----~----r---~r----'
111
o.~ 8.~ ~.~ 24.~ ~.~ ~.~ •. ~ ~.OO ~.oo n.~ ~.~
Volume of RN0 3 titrant/em3
Figure 4.5 Titration curve for the titration of a weak diprotic
base (etolen) with a strong acid (ENO)).

112
TABLE 4.3
Titration of a mixture of 20.00 cm3 of approx. 0.1 mol dm-3 etolen
+ 50.00 cm3 of 0.50 mol dm- 3 KN03 with 0.09992 mol dm- 3 EN0 3 (Vo ~ 70.00
cm3) •
(a) Determination of the first equivalence point, vel:
v/cm3 EceU/mV
2.00 -372.0
4.00 -356.3
6.00 -344.3
8.00 -333.9
10.00 -324.3
12.00 -314.4
14.00 -303.9
15.00 -298.1
16.00 -291.5
17.00 -283.6
18.00 -274.4
19.00 -262.3
20.00 -246.6
21.00 -229.1
22.00 -214.3
23.00 -202.8
24.00 -194.0
25.00 -186.4
26.00 -179.5
Values of constants used to evaluate ¢3 :
Kw 1.8197 x 10- 14
KIO l ~ 5.4954 X 10 9
E-e-" ~ 252.4 mV
¢3 (v) /cm3
16.60
15.37
13.87
12.14
10.36
8.42
6.51
5.56
4.58
3.58
2.65
1. 74
1.00
0.53
0.31
0.21
0.15
0.12
0.09
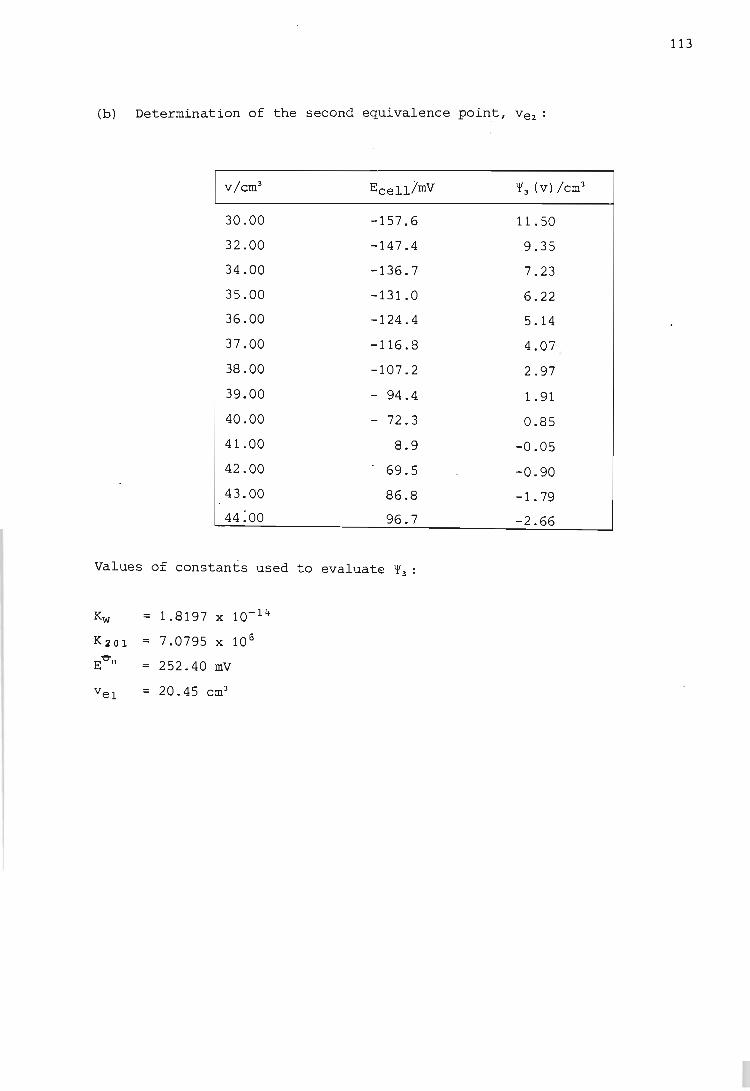
113
(b) Determination of the second equivalence point, ve2:
v/cm3 Ec~ilJmV '*'3 (v) /cm3
30.00 -157.6 11.50
32.00 -147.4 9.35
34.00 -136.7 7.23
35.00 -131.0 6.22
36.00 -124 . 4 5.14
37.00 -116.8 4.07
38.00 -107.2 2.97
39.00 - 94.4 1. 91
40.00 - 72.3 0.85
41.00 8.9 -0.05
42.00 69.5 -0.90
43.00 86.8 -1.79
44:00 96.7 -2.66
Values of constants used to evaluate '*'3:
Kw 1.8197 X 10- 14
K2 0 1 = 7.0795 X 10 6
E~II = 252.40 mV
vel = 20.45 cm3
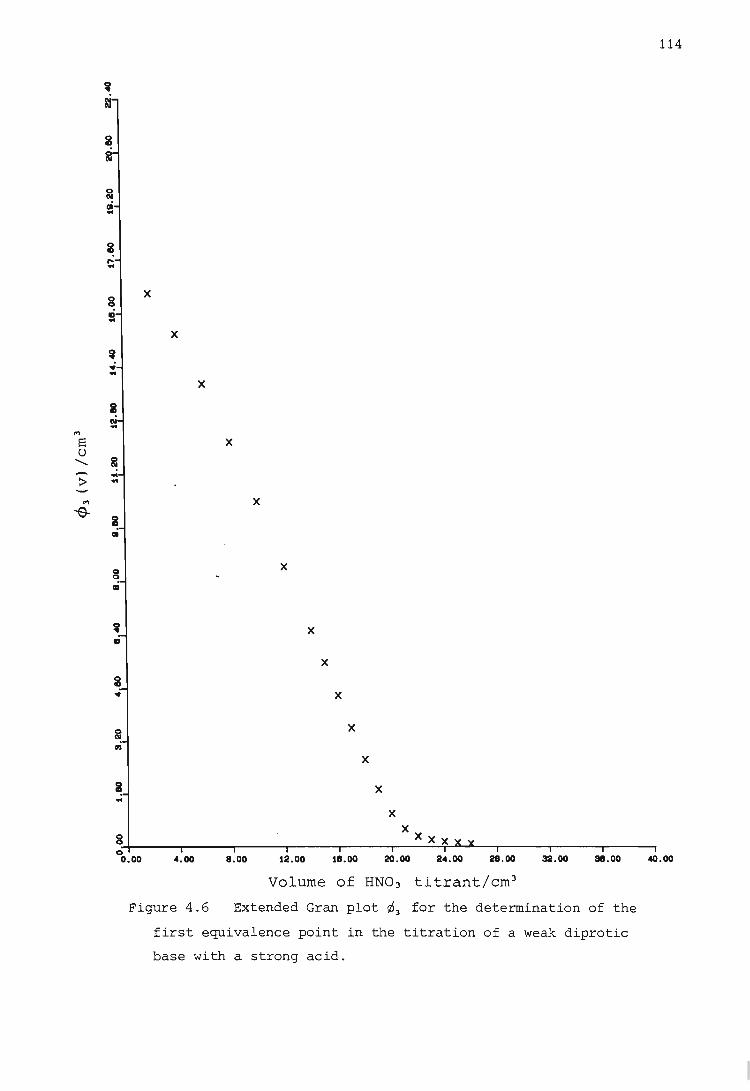
'" s ()
"-::-
'" ""S-
a ,.. .. 8
x Ii ..
X
* X
.. x
II .. .. x
a
x
•
* x •
x a ~ x
0 x CII
."
x
a x .. x
8 xxx 0 0.00 4.00 8.00 12.00 111.00 20.00 24.00 211.00 32.00 311.00
Volume of HNO) titrant/ern)
Figure 4.6 Extended Gran plot ¢3 for the determination of the
first equivalence point in the titration of a weak diprotic
base with a strong acid.
114
40.00

8
8
8 N I
31.20 32.110 34.40 38.00 37.110 .... 00
x
Volume of HN0 3 titrant/em3
Figure 4.7 Extended Gran plot ~3 for the determination of the
second equivalence point in the t i tration of a weak diprotic
base with a strong acid.
115
48.110
116
In spite of the problems associated with the first equivalence point,
this method did indeed overcome the irreproducibility encountered in the
"ordinary" Gran plot method.
4.2. Calculation of 'non-chemical' heat corrections for titration
calorimetric data
The gross heat liberated in the reaction vessel during a titration calori
metric run not only consists of the heats of the reactions being studied
but is also the result of extraneous heat effects operating during the e-
experiment. Thus, in general, the determination of ~H values from
titration calorimetric data involves four main steps:
(1) the experimental determination of the gross heat liberated in
the reaction vessel as a function of titrant added,
(2) the calculation of all correction terms for 'non-chemical'
heat effects occurring in the reaction vessel,
(3) the evaluation of heat effects contributed from reactions
other than the ones being studied, and
(4) the calculation of the energy changes due to the reactions in
question and, finally, the ~He- values.
In this section the first two points will be considered.
Continuous titration calorimeters (such as the one used in this study)
produce data consisting of times of titrant delivery and the corresponding
temperature of the system. (In the calorimeter used in this work the
Wheatstone bridge off-balance potentials were measured. Over a small
temperature interval such potentials are liriearly related to temperature
(90). This relationship is determined by calibrating the Wheatstone
bridge - see Section 5.2.1.) Plots of such data are called thermograms.
In essence a thermogram consists of three parts: a lead (or initial)
period, a titration period, and a trail (or final) period. There are
two basic types of thermogram. The first type is obtained for reactions
that proceed to completion, i.e. every aliquot of titrant added is almost
completely consumed up to the end-point, and further addition of titrant
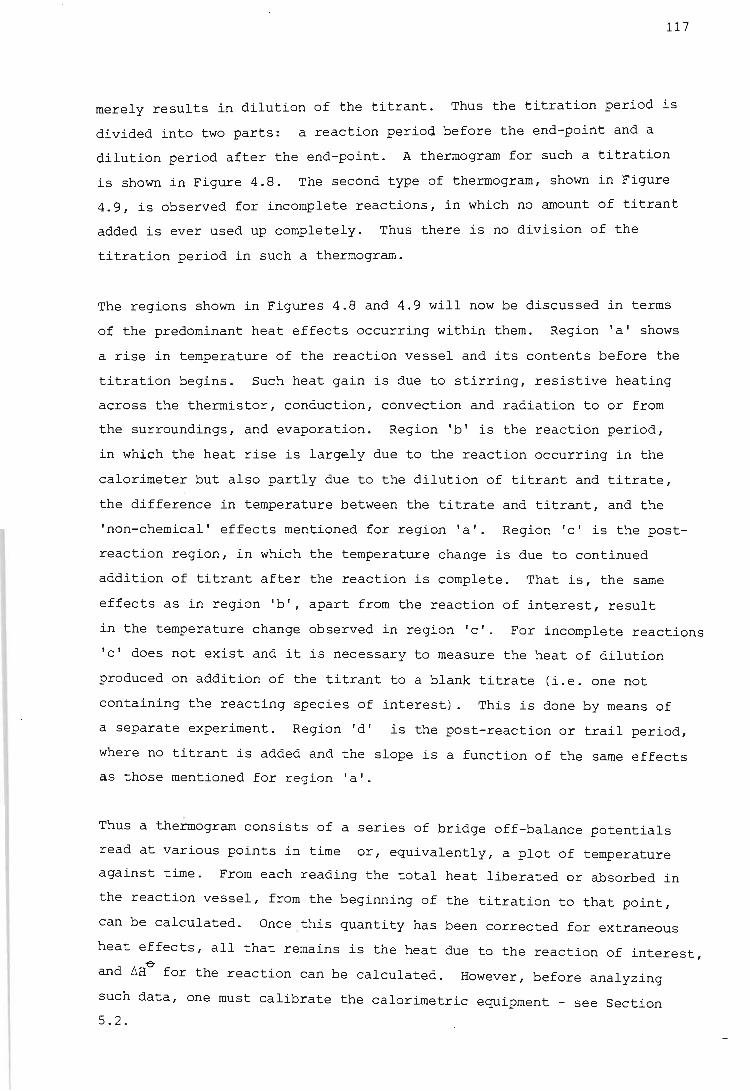
117
merely results in dilution of the titrant. Thus the titration period is
divided into two parts: a reaction period before the end-point and a
dilution period after the end-point. A thermogram for such a titration
is shown in Figure 4.8. The second type of thermogram, shown in Figure
4.9, is observed for incomplete reactions, in which no amount of titrant
added is ever used up completely. Thus there is no division of the
titration period in such a thermogram.
The regions shown in Figures 4.8 and 4.9 will now be discussed in terms
of the predominant heat effects occurring within them. Region 'a' shows
a rise in temperature of the reaction vessel and its contents before the
titration begins. Such heat gain is due to stirring, resistive heating
across the thermistor, conduction, convection and radiation to or from
the surroundings, and evaporation. Region 'b' is the reaction period,
in which the heat rise is largely due to the reaction occurring in the
calorimeter but also partly due to the dilution of titrant and titrate,
the difference in temperature between the titrate and titrant, and the
'non-chemical' effects mentioned for region 'a'. Region 'c' is the post
reaction region, in which the temperature change is due to continued
addition of titrant after the reaction is complete. That is, the same
effects as in region 'b', apart from the reaction of interest, result
in the temperature change observed in region 'c'. For incomplete reactions
'c' does not exist and it is necessary to measure the heat of dilution
produced on addition of the titrant to a blank titrate (i.e. one not
containing the reacting species of interest). This is done by means of
a separate experiment. Region 'd' is the post-reaction or trail period,
where no titrant is added and the slope is a function of the same effects
as those mentioned for region 'a'.
Thus a thermogram consists of a series of bridge off-balance potentials
read at various points in time or, equivalently, a plot of temperature
against time. From each reading the total heat liberated or absorbed in
the reaction vessel, from the beginning of the titration to that point,
can be calculated. Once this quantity has been corrected for extraneous
heat effects, all that remains is the heat due to the reaction of interest, ~
and ~H for the reaction can be calculated. However, before analyzing
such data, one must calibrate the calorimetric equipment - see Section
5.2.
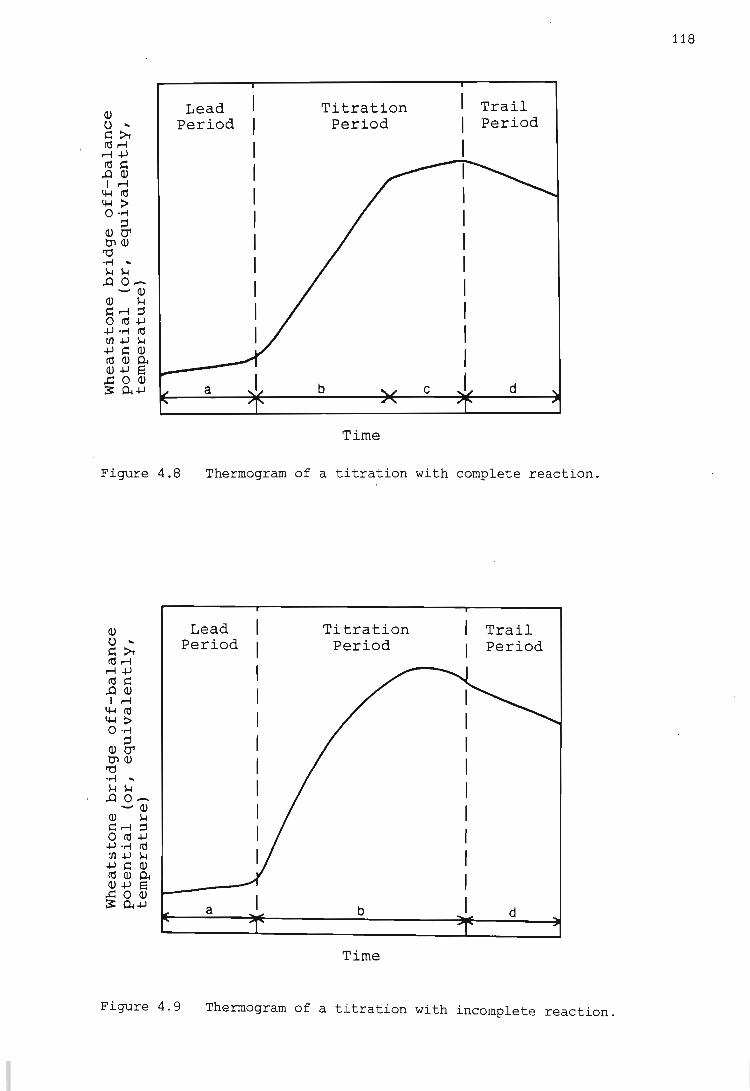
118
Lead I Titration Trail (!) Period I Period Period 0 ..
1::>' ro~ I ~+J ro C I ..o(!) I~
I ~ro 44 :> 0·",; I ~ (!)Q'1
I tJ'I(!) '0 .,..; .. I ~ ~ .00- I -(!) (!) ~
I I: ~ ~ Oro+J +J."'; ro I Ul+J~ +JC(!) ro(!)~ (!) +J e: ..c:O(!)
b d 3: ~+J a
Time
Figure 4.8 Thermogram of a titration with complete reaction.
(!) Lead Titration Trail 0 .. Period Period Period 1::>' ro~ ~+J ro C .o(!) I~
44ro 44 :> 0·",;
~ (!)Q'1 tJ'I(!) rtj .,..; .. ~ ~ ..00-
-(1) (1) ~ I: ~ ::l Oro+J +J."'; ro Ul +J ~ +J1:(1) ro(1)~ (1) +J S ..c::0(1) 3: ~+J a b d
Time
Figure 4.9 Thermogram of a titration with incomplete reaction.

119
In calculating the various corrections to be applied to the gross heat
liberated in the reaction vessel one first determines the heat capacities
of all the solutions used in the experiment. Experimentally one actually
measures Cp, the heat capacity of the reaction vessel plus its contents.
This quantity is made up of two parts, as shown in the following equation:
(4.60)
Here Cpr is the heat capacity of the empty reaction vessel plus the
various parts of the calorimeter (such as the stirrer, thermistor, heater
and burette tip) which are immersed in the reaction solution and heated
with it, and Cps is the heat capacity of the solution in the reaction
vessel. (For the determination of Cpr see Section 5.2.3.) A typical
thermogram for the determination of the heat capacity of a filled reaction
vessel is shown in Figure 4.10.
One can relate ~, the electrical heat introduced into the reaction
vessel during a heat capacity determination, to the temperature rise
observed, ~Tobs, by means of
Cp = ~/~Tobs. (4.61)
This equation is however an oversimplification, as it does not take into
account the heat effects such as heat of stirring, resistive heating of
the thermistor and heat exchange with the surroundings. A procedure for
correcting for these effects can be developed by making use of the fact
that these are the only effects occurring in regions 'a' and 'd' of the
thermogram, and this is done as follows.
If one takes N points, equally spaced in time along the heating section
of the thermogram, one can calculate for each time point the rate of
change in bridge off-balance potential attributable at that point to the
abovementioned effects. The rate of change, rk, at the k-th time point,
tk, is obtained as follows by interpolation between Si and Sf' the slopes
of the lead and trail sections respectively of the thermogram:
for k = 1, 2, ... , N. (4.62)
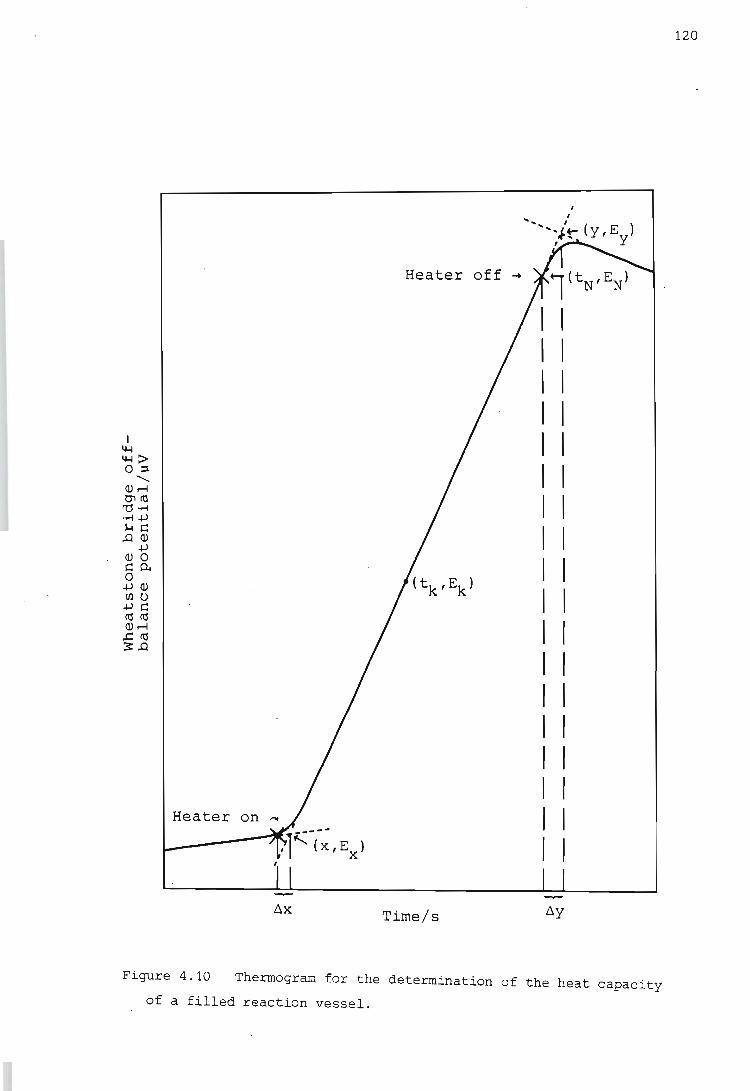
Heater off ~
Heater on
~x Tirne/s
1 (tN' EN)
I I I I I I I I I I I I I I I I I I I I I I I I I I I I I I I I I I I I
~y
Figure 4.10 Thermogram for the determination of the heat capacity
of a filled reaction vessel.
120
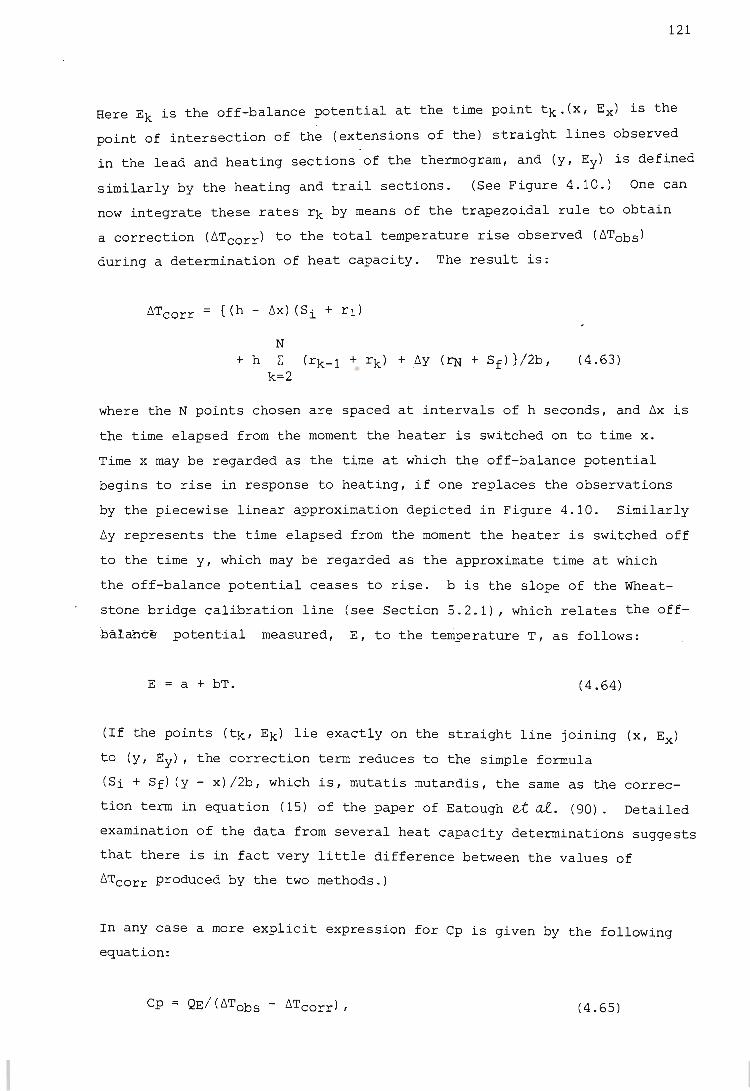
121
Here Ek is the off-balance potential at the time point tk.(x, Ex) is the
point of intersection of the (extensions of the) straight lines observed
in the lead and heating sections of the thermogram, and (y, Ey) is defined
similarly by the heating and trail sections. (See Figure 4.10.) One can
now integrate these rates rk by means of the trapezoidal rule to obtain
a correction (~Tcorr) to the total temperature rise observed (~Tobs)
during a determination of heat capacity. The result is:
N + h [ (rk-l +rk) +~y (~ + Sf)} / 2b,
k=2 (4.63)
where the N points chosen are spaced at intervals of h seconds, and ~x is
the time elapsed from the moment the heater is switched on to time x.
Time x may be regarded as the time at which the off-balance potential
begins to rise in response to heating, if one replaces the observations
by the piecewise linear approximation depicted in Figure 4.10. Similarly
~y represents the time elapsed from the moment the heater is switched off
to the time y, which may be regarded as the approximate time at which
the off-balance potential ceases to rise. b is the slope of the Wheat
stone bridge calibration line (see Section 5.2.1), which relates the off
~aiance potential measured, E, to the temperature T, as follows:
E = a + bT. (4.64)
(If the points (tk, Ek) lie exactly on the straight line joining (x, Ex)
to (y, Ey), the correction term reduces to the simple formula
(Si + Sf) (y - x) / 2b, which is, mutatis mutandis, the same as the correc
tion term in equation (15) of the paper of Eatough et at. (90). Detailed
examination of the data from several heat capacity determinations suggests
that there is in fact very little difference between the values of
~Tcorr produced by the two methods. )
In any case a more explicit expression for Cp is given by the following
equation:
(4.65)
122
where ~ is found by multiplying the calibration heater power by the
total time for which the heater was in use during the run, and ~Tobs is
taken to be (Ey - Ex)/b.
A computer program called CALCAL has been written by Prof. F. Marsicano
to calculate such heat capacity values. The use of this program will
be described in Section 4.4.7.
If one now considers a reaction run, as distinct from a heat capacity
determination,one can calculate for each of the N equally spaced time
points tk the total heat capacity of the reaction vessel and its contents
at that point, CPk. For a given volume VT,k of titrant added at point
tk we have:
CPk = Cpr +Vo.Cps + VT,k.CpT + VT,k(dCpr/dV) k = 1, 2, ... , N,
(4.66)
where Vo is the initial volume of the titrate, and Cps and CpT are, in
J K=l cm-3
, the specific heats (per unit volume) of the titrate and
titrant solutions respectively. The derivative dCpr / dV is the rate of
increase of the heat capacity of the reaction vessel with increase in
volume above Vo. This increase in heat capacity occurs because further
parts of the vessel and stirrer paddle come into contact with solution ~
The additivity of the heat capacities in the above equation is a reason
able assumption because one is here considering dilute aqueous solutions.
The gross heat produced in going from tk-1 to tk can be calculated as follows:
k = 2, 3, ... , N.
(4.67)
Tk and Tk-1 are the temperatures in the reaction vessel at times tk and
tk-1 respectively. QPl, the gross heat produced between time x and time
tl, is calculated as follows:
(4.68)
Thus for each of the N points on the thermogram a corresponding QPk value
123
can be determined which represents the total heat produced in the reaction
vessel from tk-1 to tk. These QPk values therefore have to be corrected
for all the heat effects other than the reaction of interest before the
6H~ values can be obtained.
Among the heat effects which must be corrected for are the heat generated
by stirring of the solution, resistive heating by the thermistor, and the
heat exchange due to the temperature difference between the reaction
vessel and its surroundings. For a suitably constructed calorimeter it
can be assumed that the power derived from the thermistor and stirrer,
w, is a constant.
For each of the N points of the titration one can calculate the rate of
heat loss of the reaction vessel by assuming that it obeys Newton's law
of cooling, i.e. this rate is proportional to the difference in tempera
ture between the reaction vessel and its surroundings. The~efore the
net rate of heat loss, qHL,k' at the kth point is:
(4.69)
where wand c are positive constants and 6 is the temperature of the
surroundings. To obtain the rates of heat loss at points x and y we can
make use of Si and Sf' the slopes of the initial and final portions of
the thermogram. The results we get are:
and
-SfCpy/ b
= - w - c(6 - Ty)'
where CPy is given by
(4.70)
(4.71)
(4.72)
and VT,y represents the total volume of titrant added. The relationships
involving 6 given in (4.69) - (4.71) are difficult to use because of the
difficulty of obtaining values for 6 . By combining equations (4.69) to
I I
I I I
124
(4.71) we can however arrive at an expression for qHL,k not involving 6,
w, or c:
qHL,k Ek - Ex
qHL,x + (~L,y -qHL,x) Ey - Ex (4.73)
To obtain QHL,k' the total contribution of the non-chemical heat effects
from time tk-1 to time tk, we assume that qHL is a linear function of
time between tk-1 and tk' (This is why it is desirable to choose a
sufficiently large number, N, of data points so that the interval between
points is small.) Thus one arrives at:
k = 2,3, ... , N (4.74)
and
QHL,l = (h - t.x)
2 . (~L,x + qHL,l) . (4.75)
The second correction which must be applied is one that takes account of
the difference in temperature between the titrate and the titrant. Since
the titrant is kept at the temperature of the water bath, heat appears
to be liberated or absorbed according to whether the titrate in the reac
tion vessel is at a temperature lower or higher than that of the constant
temperature bath. The correction for this effect over the interval from
tk-1 to tk is given by
(4.76)
where Tk is obtained from Ek by means of equation (4.64), and Tbath is
the temperature of the thermostatic bath. In the case of the first time
interval one has to allow for the time lag occurring at the start of the
titration, hence the temperature correction term is
(4.77)
The next correction which must be applied is that which allows for the
dilution of the titrant as it is added to the titrate. This heat effect
Occurs as a result of solvation and ion-pairing, and its magnitude changes
according to the relative concentrations of the species present in the
125
titrate solution. Usually the concentrations and concentration changes
of the species present in the titrate solution are small enough so that
their contribution to the heat of dilllltion is negligible. However this is
not true in the case of the titrant solution, which undergoes dilution
by a factor of about twenty during a typical calorimetric titration.
In this work the heat of dilution for each titration was determined experi
mentally by adding the titrant to a blank titrate solution (i.e. to a
titrate solution which differs from the usual one only in that the react
ing species of interest has been replaced by an equivalent amount of
background electrolyte). In each determination the 'raw' heats obtained
are corrected for the non-chemical heat effects. To obtain the heat of
dilution HD (in J mol-l) for the titrant of concentration CT into the
appropriate titrate solution, we proceed as follows. The corrected heats
liberated or absorbed between tk-l and tk are averaged and divided by
~v, the incremental volume, and by the concentration CT. The heat of
dilution correction is calculated as follows for the interval from tk-l
to tk:
k 2,3, ... ,N. (4.78)
(The factor of 1000 in the denominator accommodates the usual practice of
expressing CT in mol dm- 3 and VT,y in cm3.) However the value of QD,l
must be corrected for the usual time lag observed at the beginning of the
titration. Hence
QD,l (4. 79)
Once all these corrections have been calculated the gross heat liberated
or absorbed from time t k - 1 to tk can be corrected appropriately. Thus
Qc,k' the corrected gross heat produced between tk-l and tk' is given by:
QP)c-QHLk-QTCk-Q , , D,k k l,2, ... ,N.
(4.80)
A computer program called CALC OR has been written by Prof. F Marsicano
to correct calorimetric data for 'non-chemical' heat effects.
of this program will be described in Section 4.4.8.
The use
126
Once these Qc,k values have been obtained they can be supplied to a
published computer program such as LETAGROP KALLE (see Section 4.4.10),
which then corrects these values for the heats contributed from side
reactions and finally calculates ~He values for the reactions of interest.
Christensen et at. have published three papers describing titration
calorimetry (89), the calculation techniques used therein (90), and appli
cations of the method (91). The above discussion of corrections for non
chemical heat effects is based partly on their treatment of this issue,
and partly on the work of Prof. F Marsicano as implemented in the programs
CALCAL and CALCOR. Barthel (125) also gives a mathematical description
of the heat processes involved during a calorimetric titration.
4.3. Formation Curves
Before one calculates stability constants by computerised methods it is
advisable to perform a simple exploratory graphical analysis in order to
obtain a general view of the behaviour of the system and detect the
presence of errors. For this purpose plots of formation curves are extre
mely useful. Such curves can also be used for species selection and the
determination of numeri~al values of stability constants (79 - 81). For
mation curves were however not used for this last purpose. The construc
tion of formation curves and their interpretation will now be discussed.
The ligands used in this study are diprotic bases. Hence the theory out
lined in Sections 4.3.1. and 4.3.2. will be for such ligands only.
4.3.1. j(log[HJ) plots
Since the stability constants of the complexes studied in this work were
determined by a method involving competition between metal ions and hydro
gen ions for the ligand L, the protonation constants of these ligands
had to be measured first.
Fora diprotic base there are two protonation reactions:
H + L HL (4.81)
and

(4.82)
for which we can write the following stability constants respectively:
and
[H, LJ [HY [L]
(Charges have been omitted for the sake of clarity.)
(4 .83)
(4.84)
We may express the total concentrations of the ligand and hydrogen ion
as
(4.85)
and
(4.86)
Since the equilibrium concentrations of HL, H2L and OH can be given in
terms of the equilibrium concentrations of Hand L and the appropriate
stability constants, we get:
(4.87)
and
(4.88)
127
The extent of protonation is expressed by means of the quantity j, defined
as the average number of hydrogen ions bound to each ligand. Thus
j bound H total L
[HJ t - [HJ + [OHJ [LJt
= [H]t - [H] + KW[H]-l , [L]t (4.89)
and therefore, by using equations (4.88) and (4.87), we arrive at
- BIOl[H] + 2B201[H]2 j = 1 + BIOl[H] + B201[H]2
(4.90)
-
128
By means of equation (4.89), values of j can be calculated from the ex-
perimental values of [H]t, [L]t and [H]. From equation (4.90) we see that
j is a function only of [H] and is independent of [H]t and [L]t. The way
in which j varies with [H] depends on the values of BIOland B201.
Plots of j against log [H] can therefore be drawn to show this variation
with [H]. Such plots are called 'formation curves'. The formation curve
of a diprotic ligand has the following characteristics:
1. The points plotted form a single curve for all values of [H]t
and [L]t.
2. The curve is horizontal near j o and j = 2.
-3. The only other plateau is at j = 1.
4. The formation curve is symmetrical under rotation through 180 0
about its mid-point.
If any deviations from the above characteristics occur, then there is an
error either in the measurements or in the species assumed to be present.
An error in the measurements can arise through use of an incorrect value
for [L]t or [H]t due to faulty standardisation of a stock solution. A
description of how one can deduce the types of species present in solution
from formation curves will be given in the following section.
4.3.2. Z(log[L]) plots
For equilibrium systems involving a metal ion the formation curves of
interest are plots of Z against log (concentration of free ligand, L),
where Z is the average number of ligands bound to each metal ion and is
given by
-Z
conc. of ligand bound to metal total metal ion concentration
(4.91)
129
In this study metal complex formation was followed by measuring the
hydrogen ion concentration by means of a glass electrode. The ligands
used can complex with both metal ions and hydrogen ions. These considera
tions must therefore be borne in mind when deriving mass balance expres
sions for the total concentrations of metal ion, ligand and hydrogen ion.
Thus, if we assume that only the mononuclear species ML to MLN are present,
and that there is no hydrolysis of the metal aquo ion, we obtain equations
(4.92) - (4.94) for the total concentrations.
where
N
[M]t = L [MLi] i=O
N = L Boli[M][L]i
i=O
BOli = [MLi] [M][L] r and BOlO = 1.
N 2 [L]t = L i[MLi] + L [HjL]
i= 1 j=O
N 2 = L i BOli [M][L]i + L
i=1 j =O
where 13 0 0 1 1 .
2 [H] - [OH] + L j [HjL]
j=1
2 [H] - Kw[H]-l + L j BjOl[H]j[L].
j=1
Equation (4.91) may be expressed as
(4.92)
(4.93)
(4.94)
N N
L i [MLi] L i So 1 i[L]i
- i=l i=l (4.95) Z = =
N N
L [MLi] L So 1;" [L]i
i=O i=O
using (4.92) and (4.93) we obtain the following expressions for Z:
= [L]t - [L] - 810~H][L] - 8201 [H]2[L] [M]t
From equation (4.94)
[H]t - [H] + Kw[H]-l 8101[H] + 28201[H]2
(4.96)
(4.97)
Substituting equation (4.97) into equation (4.96) and using equation
(4.90) we obtain
(4.98)
130
Thus Z can easily be calculated since [M]t, [L]t and [H]t are usually
known, [H] is measured experimentally, and B101and B2 01 have usually been
determined previously.
The derivation of the expressions (4.95), (4.96) and (4.98) for the quan
tity Z assumes that no polynuclear or ternary species are present. Under -
these assumptions Z is identical to the quantity n used by various other
authors. If such species are present, these expressions are no longer
exact: exact calculation of Z would require knowledge of the stability
constants for these species.
-From equation (4.95) we see that Z is a function of the stability con-
stants and the free ligand concentration if only mononuclear species MLi
131
-are present. If polynuclear species are present Z (as given by equation
4.96) will depend on [M] in additi on to [LJ and the stability constants.
If however the complexes are mononuclear but include hydrolysed or proto
nated complexes, Z will be independent of [M] but will vary according to
[H]t, [L]t and the stability constants.
Thus, if plots of Z against log [L] are superimposable for diffe~ing values
of [M]t, polynuclear species are absent. If the formation curve plots
are superimposable for widely differing values of [H]t and [L]t, the possi
bility of proton~ted or hydroxo- complexes may be ruled out (126, 127).
Thus formation curves give an indication of the types of complexes pre
sent in the system being studied.
If the highest value of Z obtained (say N) lies on a plateau and is an
integer then the highest mononuclear complex formed is~. However it
is sometimes not possible to obtain a complete formation curve. Neverthe
less some information can be obtained in that case. For instance, if the
highest value of Z obtained is slightly greater than 1, the ·'.hlghest. complex
present is at least ML 2 , whereas if a maximum value of Z just below 2 is
obtained but there is no decrease in slope, then the presence of at least
ML3 can tentatively be assumed.
caution must be exercised when using the procedures described in the
above paragraph, because, at high p[H+] values, Z(log[L]) curves seem to
exhibit 'shoot-up'. (That is, after some stage Z increases very steeply
relative to 10g[LJ.) It seems that, in the presence of excess hydroxide,
Z becomes very sensitive to small changes in [H]t, and so this " shoot-up'
effect could merely reflect experimental error (see Section 8.3). Another
feature exhibited by formation curves is a 'curl-back' effect (see Section
8.4). This feature seems to indicate the presence of ternary hydroxy
metal complexes (128).
In practice formation curves obtained from experimental measurements are
compared with theoretical formation curves obtained for the various models
postulated. The model which best reproduces the experimental formation
curve is then accepted as giving a satisfactory description of the system.
(For the calculation of experimental and theoretical formation curves see
Sections 4.4.1, 4.4.3, and 4.4.5.)
132
Formation curves can also reveal the presence of various kinds of errors.
This enables 'bad' points (i.e. outliers) to be discarded, and some sys
tematic errors, e.g. those due to incorrect solution concentrations, to
be detected.
4.4. Computer Programs Used
A number of computer programs were used in order to process the potentio
metric and calorimetric data. Their use will now be described.
4.4.1. HALTAFALL
The computer program HALTAFALL (129) is a general program for calculating
the concentrations of species in an equilibrium mixture. It can treat a
mixture of several components which can form a number of complexes and
solid phases. The calculations can be carried out if one specifies the
overall concentrations of the components, the relevant equilibrium constants
(known or estimated, expressed as stability constants), and a description
of the composition of the mixture.
In this study the program was used to simulate titrations in a single
solution phase. In order to do this, values of the unknown stability con
stants were estimated. From the species distribution tables obtained for
various reagent concentrations it could be decided under what conditions
(e.g. p[H+] range) the experiments should be performed in order to optimize
the formation of the species desired without interference from side reac
tions. The program was also use~ to determine which experimental proce
dure would result in the greatest sensitiv ity of the measured quantity,
in this case [H+], to the stability constant/s being determined. To do
this the estimate of the stability constant under consideration was changed
by one log unit at a time and the effect on the estimated p[H+] was noted.
A modified version of the standard HALTAFALL program, viz. HALTA1, was
developed in order to calculate the ionic strength at each point of a
titration. The only additional input information required is the concen
tration of the inert electrolyte and the charges of all the components
present. This version of the program is useful in verifying that an
approximately constant ionic medium is present during a titration. This
modification to the standard HALTAFALL program was carried out by L. Biggs
133
in December 1979.
The program HALTAFALL was also used to calculate species distributions
once the stability constants for a particular system were known (e.g. see
Section 4.1.3). These species distributions can be used to calculate
theoretical values of Z, denoted Z(calc) I which can then be compared with
the observed values, denoted Z(obs) .
4.4.2. MAGEC
The computer program MAGEC (130) uses potentiometric glass electrode cell
calibration data to set up and solve a set of equations for the values of
E~II, Kw' the protonation constants of the calibrant, and the slope of the
electrode calibration line. It can also refine estimates of solution con
centrations if so required. The titrate and titrant solutions can consist
of a strong acid, a strong base, a ligand, or any combination of these.
In addition it contains a subprogram called CALIBT which analyses calibra
tion data from potentiometric acid-base neutralisation titrations involving
monobasic reactants only. It determines the electrode calibration line
by least squares. It can also scan pKw and adjust the reagent concentra
tions in order to improve the fit . It also provides a Gran plot analysis
for comparison.
MAGEC is useful when weak acids or weak bases are used as calibrants, since
their protonation constants can be determined at the same temperature and
ionic strength as the rest of the experiment while one is calibrating
the potentiometric cell. In practice, however, the use of MAGEe for the
simultaneous determination of the cell calibration line and the ligand
protonation constants is limited. If correlation of errors between two or
more of the parameters occurs the program may give a false solution. The
authors advise the use of MAGEC in conjunction with MINIQUAD (131) in a
cycling procedure (130).
Various problems were encountered with the use of the program MAGEC. These
are described in Section 5.1.3. Despite its advantages, this program was
in fact not used in the final analysis of the data.
134
MAGEe was used via the program FORMAT which will be described briefly in
Section 4.4.6.
4.4.3. ZBAR
A FORTRAN program called ZBAR was written to calculate Z(obs) (as given by
equation 4.96) from e.m.f. data. This program was tested on Ni 2 +-etolen
data which had previously been used in hand calculations of Z(obs) .
4.4.4. MINIQUAD
The stability constants of the complex species in solution were calculated
from the potentiometric data by making use of the computer program MINIQUAD
(131), which is specifically written for the purpose. In this work the
original version of MINIQUAD, with the modifications made by Leggett (132)
to the subroutine ML,was used. The program used incorporated another
change which made it possible to specify a non-Nernstian slope for the electrode
calibration line.
A further modified version of the MINIQUAD program called MINIQUAD 75
(133) also exists. It is claimed by the authors that this latter program
is more efficient and produces more reliable convergence, and is thus
better suited for use in model selection, where a number of possibilities
have to be tested. However it was found by Leggett (132) that MINIQUAD 75
produced slower execution times than MINIQUAD, especially for systems having
more than one metal and one ligand. Leggett showed that the efficiency
of program execution depended largely on the algorithm used to compute the
equilibrium concentrations. He found that the method employed by MINIQUAD, viz.
a modified Newton-Raphson approach, was the most satisfactory of those he
surveyed.
MINIQUAD arose from further development of the Gauss-Newton variant of the
LEAST program (134), and uses the Gauss-Newton method for refinement of
stability constants. The version used in this study can treat data from
systems containing up to 5 reactants, 20 complexes, 3 electrodes and 600
data pOints. However these dimensions can easily be changed by the user.
The complexes specified can be mononuclear, polynuclear or hydrolysed
species. Fuller information, including a listing of the program, can be
found in the original paper by Sabatini et ai. (131).

135
4.4.5. ESTA
Towards the end of this work a new general program for the analysis of
potentiometric titration data called ESTA (135, 136) became available.
ESTA is actually a suite of five programs which perfo~m various calcula
tions used in the analysis of potentiometric data. However only those
options used in this work will be discussed.
This program (as well as MINIQUAD) was used to calculate the stability con
stants for the various complexes studied. The Gauss-Newton method is
used to minimize the objective function, which may be one of two possibi
lities. Either the sum of squared e.m.f. residuals is used, or the sum
of squares of residuals of the total analytical concentrations. In both
cases weighted or unweighted residuals can be selected. It was decided
to use the objective function based on weighted e.m.f. residuals. To
determine the weights the program was supplied with the estimated random
errors in the titre v~lumes (0.01 cm3) and observed e.m.f. (0.10 mV).
This is in contrast to MINIQUAD (131), where the unweighted sum of squared
residuals of total analytical concentrations is used. The facility for
correcting for changes in the ionic strength during a titration was used.
For this purpose ESTA uses the extended Debye-Huckel expression for the
calculation of activity coefficients. This facility was especially useful
for those titrations in which part of the background electrolyte had been
replaced by a significant amount of protonated ligand. In order to per
form such corrections the ionic size parameter ~ and the empirical
parameter c are required. These values were obtained from Kielland (137),
or estimated as described by Linder and Murray (138).
This program was also used to calculate values of Z(calc) for various
postulated models of the species present in solution. These were then
compared with Z(obs) values. Species distribution plots for the various
systems were obtained by means of the SPEC task in the program.
The BETA simulation task was used to provide clues as to the identity of
the minor species present in the various systems. To use this facility
the program is supplied with estimates of the stability constants of the
major species assumed present. A list of likely minor species is then
added to the model and the program calculates, at each titration point,
I I \
.• 136
the stability constant for the minor species. Each minor species is
regarded as the only remaining complex required to produce agreement be
tween calculated and observed data at each titration point. The use of
this facility for model selection will be described in more detail in
Section 4.5.
Further details of this program can be found in the ESTA Users Manual (139), . "
4.4.6. FORMAT
FORMAT is a program designed to assist the entering of potentiometric data
to a wide range of programs used for the analysis of such data sets. It
was developed at the University of Wales Institute of Science and Techno
logy during 1978, and instructions for its use were provided by Prof. P.W.
Linder of the University of Cape Town.
As already mentioned, FORMAT was used in this work as a 'front-end' to
MAGEC.
4 . 4 • 7 . CALCAL
The computer program CALCAL was written by Prof. F. Marsicano. It calcu
lates the heat capacity of the calorimeter reaction vessel and its contents
from data of the Wheatstone bridge off-balance potential and time. The
theory employed by the program is described in Section 4.2. A listing of
the program appears in Appendix II.
4.4.8. CALCOR
CALCOR was also written by Prof. Marsicano.. This program corrects the gross
heat change between the (k - l)th and k-th points for 'non-chemical' heat
effects, the temperature difference between the titrate and titrant, and
the heat of dilution of the titrant. The corrections are made as descri
bed in Section 4.2. The program is also used to calculate heats of dilu
tion from experimental data. The program produces output in the form of
a table of the quantities QP, QHL' QTCI QD and Qc for each of the titra-
tion points considered. (For the definitions of these symbols see
Section 4.2.) The text of this program can be found in Appendix III.
137
4.4.9. PREKAL
The computer program PREKAL is an input program for the program LETAGROP
KALLE (140), which calculates values of ~H~ from titration calorimetric
data. The data supplied to PREKAL are converted into a form compatible
with the input requirements of LETAGROP KALLE and stored in a data file
accessed by LETAGROP KALLE. The data required by PREKAL consist of:
1. the concentrations of the reagents in the titrate and titrant,
2. the initial volume of the titrate,
3. the titration data in the form of total volume of titrant added
up to the k-th point and (corrected) heat liberated between
(k - l)th and k-th points,
4. the complexes assumed present,
5. the known or estimated values of the cumulative enthalpy changes
for the abovementioned complexes, and
6. the stability constants for the complexes assumed present.
4.4.10. LETAGROP KALLE
In this work the computer program LETAGROP KALLE (140) was used to calcu
late values of ~He from titration calorimetric data. LETAGROP KALLE is
one of a suite of programs known as LETAGROPVRID (141) that use the 'pit
mapping' minimisation technique to provide the least-squares estimates
of the parameters of interest.
The necessary inputs are provided via PREKAL (see Section 4.4.9). LETAGROP
KALLE corrects the data for the effect of side reactions and then produces
values of ~H~ for the reactions of interest.
e In addition to calculating ~H values from calorimetric data, this
program can also calculate the stability constants of the species present
and adjust the solution concentrations. However the stability constants
obtained from calorimetric titration data are less accurate than those
determined by, say, potentiometry. In this work LETAGROP KALLE was used
to calculate ~He values only, because all the stability constants were
determined by potentiometry.
138
The version of the program used in this work has some limitations. It can
handle data sets containing up to 3 reactants, 3 titrations and 20 data
points per titration. It also cannot deal with data obtained from experi
ments which use pre-reacted components in the titrant. If one wishes to
use more than one reactant in the titrant, a separate burette must be
used for each component. However, in the titration calorimeter used in
this work, only one burette was available. This meant that protonated
ligand species could be introduced for buffering purposes only in the
titrate.
4.5. Species Selection
One of the major problems in solution chemistry is still that of identify
ing the chemical model for a particular equilibrium mixture. A number
of authors (142 - 147) have dealt with the problem. of species selection
but, as pointed out by Gans (148), 'the development of a sound model
selection procedure presents the greatest challenge to the computational
chemist interested in solution equilibria'
The choice of a chemical model entails finding the set of pqr triples and
corresponding stability constants Bpqr that best reproduce the experimen
tal data. One cannot exhaustively try all sets of pqr triples, so some
degree of chemical intuition must be applied. The model ultimately chosen
is the one that gives the most satisfactory account of the data from
chemical and statistical. points of view. Of course, .when judging the
adequacy of the model chosen, one must keep in mind any likely systematic
errors in the experimental data. These errors can transmit themselves to
the model (136, 149) and thereby make it difficult to decide when to stop
adding species to the model.
In this work the likely major species present in any system were chosen
by inspection of the Z(log[LJ) plots obtained from the experimental data.
Then a likely set of minor species was chosen. These were included in
the model either singly, in pairs, or triples. The likely models were
tested by making use of the BETA task in the ESTA program (see Section

139
4.4.5). With the BETA task one can test a number of these models at the
same time. From the output provided by BETA one can consider for inclu
sion in the model the minor species which best fits the following descri-
ption (139).
1. The minor species is present at a large number of titration points.
2. The stability constant of the minor species does not vary much.
3. The percentage component of the minor species changes appreciably
from point to point, and lies between 15 % and 85 %.
The most likely models were then submitted to a program which calculates
stability constants, e.g. ESTA or MINIQUAD. The adequacy of each model
was evaluated by looking at the value of the objective function. That
model which yields the lowest value of the objective function gives the
best fit to the experimental data. Where several models had similar
values for the objective function the simplest model was chosen, in
keeping with Occam's Razor. In addition the program MINIQUAD provides two
statistics to judge the adequacy of a model, viz. the R factor and a X2
value. If the value of R is less than the value of Rlim' as defined by
Vacca et al. (146), then the postulated model is acceptable. The value 2
of X gives a measure of the randomness of the experimental error. This
value should be less than about 12.6 for an 'acceptable'model.
The adequacy of the models eventually selected to describe the solution
equilibria was also tested visually by comparing plots of Z(calc) and
Z(obs). If any serious discrepancies occurred then other models were
tried.
CHAPTER FIVE
INSTRUMENT CALIBRATION
Both of the main experimental techniques employed, viz. potentiometry and
titration calorimetry, entail as a first step the calibration of the in
strumentation. In this chapter a description is given of the various
methods used in this work for calibration of electrochemical cells and the
titration calorimeter.
5.1. Calibration of an electrochemical cell having a glass indicating
electrode
The general technique for potentiometric determination of stability con
stants involves setting up an electrochemical cell which has an indicator
electrode reversible to one of the ions in the system, and a reference
electrode of fixed potential. In this work the glass electrode was chosen
as the indicator electrode in order to monitor the hydrogen ion concen
tration. This was possible because the ligands used can act as Lewis
bases and complex with the metal ion, in addition to acting as Br¢nsted
bases and combining with hydrogen ions. Thus the reactions studied en
tailed competition between the metal ions and hydrogen ions for the ligand.
The silver-silver chloride electrode was chosen as the reference electrode
of fixed potential.
The electrochemical cell used in these titrations to determine the equili
brium hydrogen ion concentration can be written as follows:
(-) RE I salt bridge I test soluti on /glass electrode (+) (I) j J
where RE (reference electrode) ; Ag /AgCtI0.01 mol dm- 3 ct-, 0.49 mol dm- 3
N03 -, 0.50 mol dm- 3 K+ and salt bridge = 0.50 mol dm- 3 KN03
• This is
thus an electrochemical cell with two liquid junctions - one between the
reference electrode and the salt bri dge (j) and one between the salt
bridge and the test solution (J). The e.m.f. of cell (I) is given by (150):
141
Ecell (5.1)
(5.2)
where the term E~ is a constant which includes the potential of the
reference half-cell (E ), the standard potential and asymmetry potential ~
of the glass electrode (E + and d, respectively), and the diffusion
potential at the junction between the reference electrode and the salt
bridge (Ej)' (Ej is unaffected by changes in the test solution and
should remain constant.) The term EJ is the diffusion potential generated
at the liquid junction between the salt bridge and the test solution.
The electrode calibration slope, s, is in theory 2 . 3026 RT/nF (i.e.
Nernstian), but may in practice depart slightly from this value. As
pointed out by Mascini (123) 'very few electrodes have a truly Nernstian
value of the calibration slope, but all electrodes have a very large
range in which the slope is constant'.
In this work the activity coefficients were kept near-constant by use of
a constant ionic medium. Hence equation (5.2) then relates cell potential
to hydrogen ion concentration as follows (82):
Ecell E~' + slog [H+] + EJ' (5.3)
where Ee, E~ + slog Y +. . H (5.4)
The asymmetry potential, d, of a glass electrode arises because the two
sides of the glass membrane do not behave exactly alike. Although this
quantity varies with time it can usually be assumed that it will remain
effectively constant during the periods required to make measurements
( 151) . ~ Nevertheless it is necessary that the value of E ' be determined
afresh for each set of measurements and that it should remain constant
during the period over which an experiment is performed. For this
electrochemical cell, then,the composition of the reference half-cell
remains constant (as required) while that of the other half-cell varies
as the titration proceeds.

142 .
The liquid junction potential EJ arises from the diffusion of ions across
the liquid junction between two solutions in contact, from a region of
high activity to one of low activity. EJ becomes large if the two
adjoining solutions differ greatly in the concentration, mobility or charge
of one or more ions. This is especially true if the adjoining solutions
contain appreciably different concentrations of hydrogen or hydroxyl ions,
both of which have very high mobilities. In such cases it is best to
determine EJ experimentally. Methods of estimating the value of EJ,and
methods of eliminating the liquid junction potential, have been discussed
by a number of authors (82, 152 - 155). Thus, in order to keep the value
of EJ as low as possible, gross concentration gradients between two
solutions in contact must be avoided. The use of a high concentration of
the same background electrolyte in the two half-cell solutions and the
salt bridge helps to minimize the junction potential or keep it constant. a-
EJ can then be added to the term E ' (156). If
Ea-" -e E ' + E . J
equation (5.3) becomes
constant,
~ E " + slog [H+] .
(5.5)
(5.6)
Hence the concentration of hydrogen ions in a solution of unknown acidity
can easily be calculated from the cell potential, provided that values of a-
E " and s can be obtained.
A number of ways of determining E-e" exist. Molina e;t al. (157) discuss
various methods, including one of their own, for calibrating glass elec
trodes in cells with liquid junctions, and demonstrate the effect of
different calibration methods on the determination of stability constants.
Four methods of cell calibration were used in this work. These will now
be described, as well as tests for the validity of equation (5.6) and a
verification of the constancy of the liquid junction potential, EJ
.
5.1.1. Calibration using a strong acid
The simplest method of determining E-e" is by titrating known volumes of
a solution of known hydrogen ion concentration (such as a 0.01 mol dm-J
143
solution of strong acid like nitric acid), made up to the required ionic
strength with the background electrolyte, into an aliquot of a solution
of the background electrolyte at the same ionic strength (in this work
50.00 cm3 of 0.5 mol dm- 3 KN0 3 ). The e.m.f. of the cell is measured after
each addition of titrant. Hence E"O"" can be calculated by rearranging
equation (5.6), if one assumes that the glass electrode has a Nernstian
slope:
Eell 2.3026 RT
= Ecell - F log [H+I. (5.7) ·
Assuming a Nernstian slope here is probably more reliable than determining
s from a narrow range of values of [H+j. The values of E"O"" obtained for
each addition are then averaged provided that they are approximately con-
stant. (Constancy of Ee
" is in accordance with the assumption that the
activity coefficients and the liquid junction potentials are constant and
the glass electrode responds in Nernstian or near-Nernstian fashion.
When variations in E"O"" occur at high acidity, changes in EJ become signi
ficant.) This average E"O"" value is used in all subsequent calculations.
This caliOration procedure was used in those potentiometric titrations
performed to determine the protonation constants of etolen, and in some
of the titrations performed on the Ni 2 +-.etolen system.
It was also used to verify the validity of equation (5.6), and to deter
mine the p[H+] region in which changes in the junction potential term,
EJ' became significant. In this experiment four titrant solutions of
known hydrogen ion concentration were used, instead of just one, in order
to cover a somewhat wider p[H+]. range. Data collected from one such
titration are given in Table 5.1. The corresponding plot of cell potential
against p[H+J is shown in Figure 5.1.
It was found that, for p[H+l values from 2.0 to 3.3, the response of the
glass electrode with respect to log[H+] was linear. This is in agreement
with the comment made by Linder and Torrington (158) that strong acid
calibrants should be used only m the p[H+1 region 2.0 to 3.0. At p[H+]
values lower than 2.0 the liquid junction potential becomes significant
and must be taken into account. However, in the experiments performed
in this work, there was. no necessity to work at such low p[H+]. values
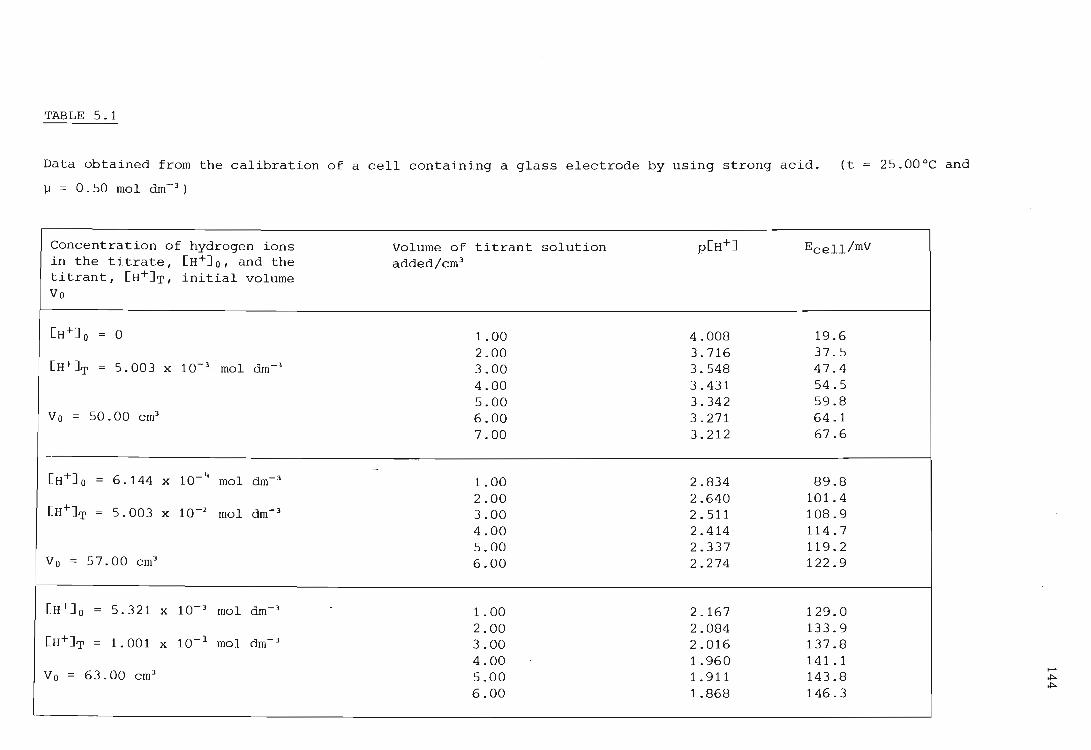
TABLE 5.1
Data obtained from the calibration of a cell containing a glass electrode by using strong acid. (t
~ = 0.50 mol dm- 3)
concentration of hydrogen ions Volume of titrant solution p[H+] Ecell/mV in the titrate, [H+]o, and the added/cm3
titrant, [H+]T, initial volume Vo
[H+] 0 0 1.00 4.008 19.6 2.00 3.716 37.5
[H+]T 5.003 x 10⁻³ mol dm-3 3.00 3.548 47 . 4 4.00 3.431 54.5 5 . 00 3.342 59.8
Vo 50.00 cm3 6.00 3.271 64.1 7.00 3.212 67.6
[H+]o 6.144 x 10- 4 mol dm- 3 1.00 2.834 89.8 2.00 2.640 101.4
[H+]T 5.003 x 10⁻² mol dm- 3 3.00 2.511 108.9 4.00 2.414 114.7 5.00 2.337 119.2
Vo 57.00 cm3 6.00 2.274 122.9
[H+]o 5.321 x 10⁻³ mol dm- 3 1.00 2.167 129.0 2.00 2.084 133.9
[H+]T 1.001 x 10- 1 mol dm- 3 3.00 2.016 137.8 4.00 1.960 141.1
V 0 = 63. 00 cm3 5.00 1. 911 143.8 6.00 1.868 146.3
25.00°C and
..... "" ""
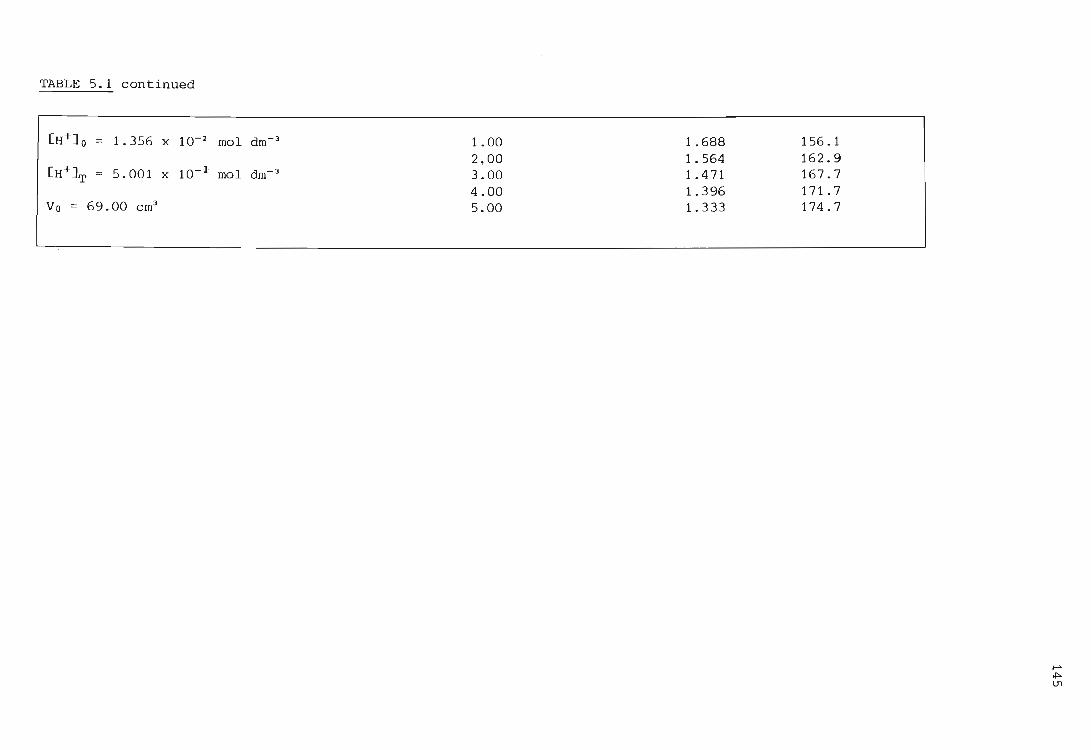
TABLE 5.1 continued
[H+]O 1.356 x 10⁻² mol dm- 3
[H+] T 5.001 X 10- 1 mol dm- 3
Vo = 69.00 cm3
1.00 1.688 2,00 1.564 3.00 1.471 4.00 1.396 5.00 1.333
156.1 162.9 167.7 171. 7 174.7
...... oj:::.
l.Tl
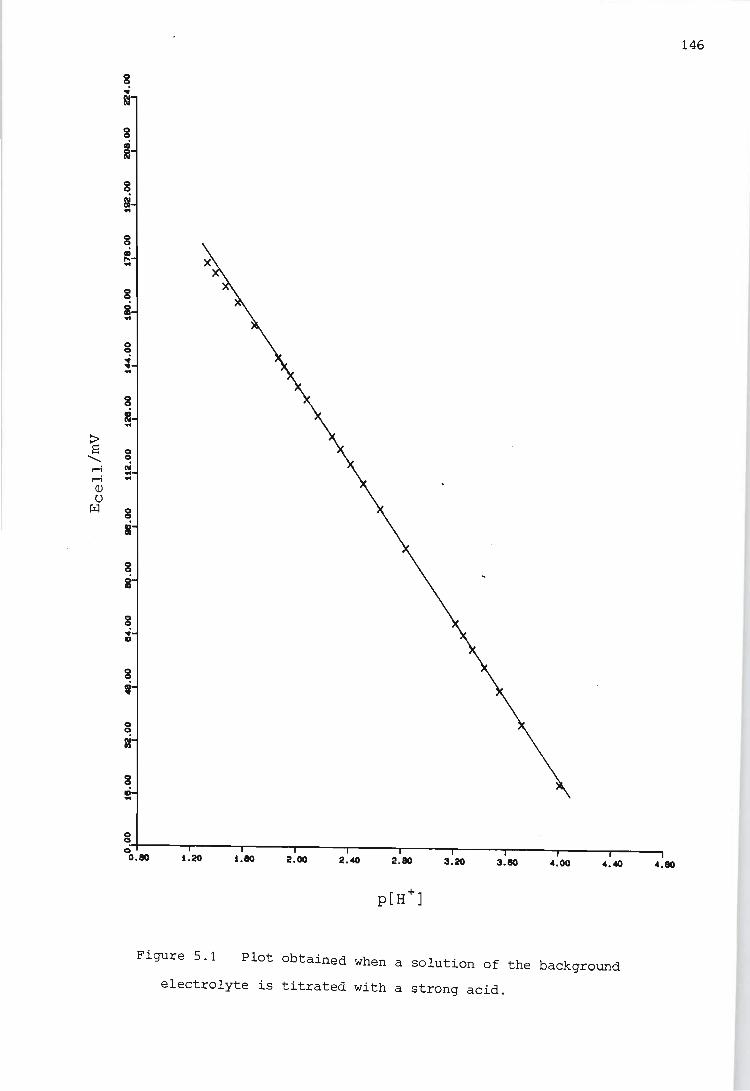
:> s "-r-i r-i <lJ U
ril
8 i .. ~ ~ ~ .. 8 i .. 8 N
8W---~----T-__ ~ ____ r-__ -' __ -, ____ ,-__ -, ____ ,-__ , o 0.80 i.2O 1.110 2.00 2. <to 2 . 80 3.20 3 . 110 4.00 4. <to 4.80
Figure 5.1 Plot obtained when a solution of the background
electrolyte is titrated wit h a strong acid.
146
147
and this term was not considered. According to Corrie and Williams (128),
the solution is not buffered above a p[H+J. of 3.0, and so deviations from
linearity occur there. In all stability constant measurements the systems
are buffered and such deviations should not occur. The points in the
linear region of (e.g.) Figure 5.1 were then used to obtain least squares
estimates of Ee " and s. For the data of Table 5.1 the estimates were
Ee " = 256.77 mV and s = 58.91 mV. The values of s obtained for the dif
ferent titrations were found to range between 58.4 and 59.6 mV, which is in
fair agreement with the theoretical Nernstian value of 59.16 mV. Hence we
see that our use of equation (5.6) is justified.
h e" . This method of calibrating the cell suffers from the drawback t at E 1S
determined over a rather narrow range of p[H+J., viz. 2.0 - 3.3, and it is
unlikely that the measurements to be made will fall entirely within this
range. Furthermore, rather few experimental points can be obtained within eo
this range, which makes it difficult to obtain reliable values for E " and
s by analysis of the linear region of the data. An improvement of this
calibration procedure is easily achieved by using both strong acid and
strong base as calibrants.
5.1.2. Calibration using a strong acid and a strong base
This calibration technique entails titrating a solution containing back
ground electrolyte and a strong base such as sodium hydroxide, with a
standardised solution of a strong acid such as nitric acid. All the
solutions used are made up to the same ionic strength with the background
electrolyte, in this case KNO). For each addition of acid the cell
potential is measured. If cell potentials are obtain~d before and after
the equivalence point, the Gran plot method of equivalence point deter
mination (see Section 4.1.1) can be applied to determine the concentration
of the NaOH solution and that of any carbonate contamination present in it.
The concentrations of acid, base and carbonate in the titrate and titrant,
together with the value of Kw and the protonation constants of carbonate,
are supplied to a computer program such as HALTAFALL (see Section 4.4.1)
in order to calculate the p[H+] at each point during the titration. The
p[H+] values thus calculated are then plotted against the corresponding
cell potential values. The points l ying on the linear part of the curve
are then used to obtain least-squares estimates of Eeo" and s. Table 5.2
148
shows typical data for such a cell calibration. Figure 5.2 is a plot of
Ecell against calculated p[H+l,. from which Ee
" and s were obtained. For
these data E~" = 252.63 mV and s = 58.41 mV.
Various authors (159) in this field use a different calculation technique
when dealing with strong acid - strong base calibration of an electro
chemical cell using a glass electrode. Instead of assuming a constant
value of Kw, as was done here, they assume that the glass electrode has a
perfectly Nernstian calibration slope. They then determine (from their
observations in the alkaline region of the calibration) that value of Kw
which is most consistent with this assumption. In the present work, however,
the assumption of a perfectly Nernstian slope was not made, in keeping
with the ideas of workers in the field of ion-selective electrodes (123).
Instead the single value of 1.8197 x 10⁻¹⁴ (160) was used throughout for
Kw, and the calibration slope determined as described above.
The above calibration method was used mainly for measurements involving
the ligand oden. It has the advantage over the method of Section 5.1.1
that a wider range of p[H+] values is spanned, i.e. the calibration proce
dure includes points both in the high and the low p[H+] regions, and ~
E " and s can be obtained with greater accuracy. The response of the
electrode in the high p[H+] region is linear, but (as in the case of acid
calibration) only over a limited range of p[H+] values, viz. 10.3 - 11.0.
However, since the measurements made in this study did not involve p[H+]
values greater than 11, correction for junction potential effects was not
necessary.
This method has the drawback that p[H+] values in the intermediate range,
4 - 9, cannot be reached.. For such purposes cali bration with a strong
acid and a weak base is preferable. (See Section 5.1.3.)
5.1.3. Calibration using a strong acid and a weak base
The cell calibration procedure can be adapted to cover a more appropriate
range of p[H+] values by using the l i gand (a weak base) instead of the
strong base hydroxide, to obtain readings at intermediate p[H+] values,
which cannot be obtained by using hydroxide alone.
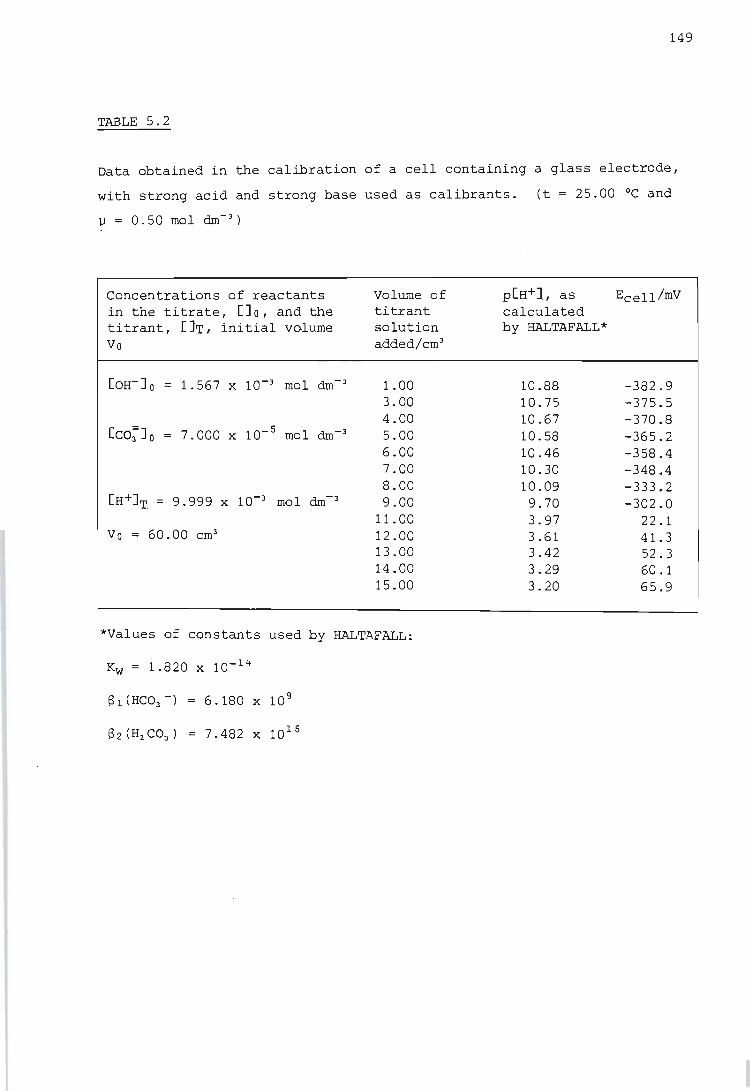
149
TABLE 5.2
Data obtained in the calibration of a cell containing a glass electrode,
with strong acid and strong base used as calibrants. (t = 25.00 °c and
~ = 0.50 mol dm- 3)
Concentrations of reactants in the titrate, [Jo, and the titrant, []T, initial volume Vo
1.567 X 10⁻³ mol dm- 3
Volume of titrant solution added/cm3
1.00 3.00 4.00
[CO:J 0 = 7.000 x 10- 5 mol dm- 3 5.00 6.00 7.00 8.00
[H+IT = 9.999 X 10- 3 mol dm- 3 9.00
Vo = 60.00 cm3
11.00 12.00 13.00 14.00 15.00
*Values of constants used by HALTAFALL:
Kw = 1.820 X 10⁻¹⁴
6.180 X 10 9
7.482 x 10¹⁵
p[H+l, as Ecell/mV calculated by HALTAFALL*
10.88 -382.9 10.75 -375.5 10.67 -370.8 10.58 -365.2 10.46 -358.4 10.30 -348.4 10.09 -333.2 9.70 -302.0 3.97 22.1 3.61 41.3 3.42 52.3 3.29 60.1 3.20 65.9
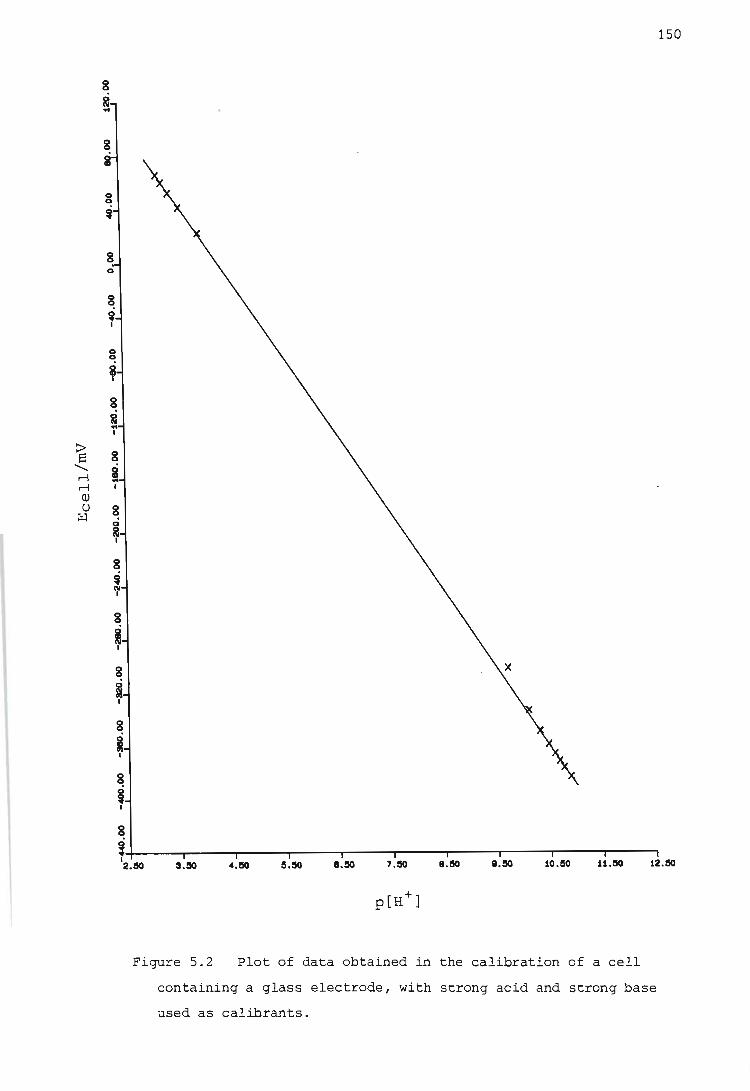
:> S ....... ,..-! ,..-! Q) u ~
150
g 0
g
* I
g , g 2
g
I I
g
I I
g , I
g
! I 2.80 3.!50 4.50 5.80 8.!50 7.!50 8.!50 1I.!50 10.50 11.50 12.50
Figure 5.2 Plot of data obtained in the calibration of a cell
containing a glass electrode, with strong acid and strong base
used as calibrants.

151
The calibration method adopted was the following:
1. About 5 points were obtained in the p[H+1 range 2.0 to 3.3 by adding
a solution of known hydrogen ion concentration (0.01 mol dm- 3 HN0 3 )
to an aliquot of background electrolyte solution (50 cm3 of 0.50 mol
dm- 3 K(03 )·
2. A further aliquot of strong acid (5 cm3 of 0.1 mol dm- 3 HN03 ) was then
added. The mole ratio of acid present at this stage to ligand
eventually to be added was of the order of 1 : 2.5. The aliquot
of strong acid solution mentioned above is added in one step and no
e.m.f. readings are taken, since they would be in a region in which
the liquid junction potenti al comes into effect.
3. This acidic solution was then titrated with the ligand solution (24
cm3 of 0.05 mol dm- 3 ligand solution). Readings of the cell poten-
tial were taken after each addition. One must ensure that sufficient
ligand is added to cover the intermediate p[H+]range, since these
are the points of interest. Ligand added at this stage of the pro
cedure also acts as protonated ligand in the background later in
the experiment. This is especially useful when one wants to lower
the p[H+1 of the reaction mixture.
4. The above procedure was then reversed by adding a solution of strong
acid (21 cm3 of 0.1 mol dm- 3 HN03 ). Again, readings of the cell
potential were taken after each addition of acid. Sufficient acid
was added so that, at the end of the calibration, all of the ligand
present was protonated to saturation.
As always, all the solutions used in the calibration were made up
to the same ionic strength (0.5 mol dm- 3) by using the background
electrolyte. The volumes and concentrations of the solutions used
in the procedure described above serve merely as an illustration.
The actual values used in each experiment depended on such require
ments as the metal to ligand ratio and metal ion concentration needed.
5. The p[H+] value of each of the data points was then calculated as
follows. For those points obtained in part· 1., the p[H+] was cal-
152
culated directly from the concentration and volumes of the strong
acid solution added. The p[H+l values for the points obtained in
parts 3. and 4. of the procedure were calculated by using the com
puter program HALTAFALL (see Section 4.4.1). The program was pro
vided with Kw' the protonation constants of the ligand, and the con
centrations of the reactants in the titrate and titrant solutions.
The output produced was the hydrogen ion concentration for each
titration point. A plot of cell potential against -log[H+1 was then
drawn. This plot was used as a visual indication of the linearity
of the data and to discard any 'dud' points. A simple linear regres
sion was then performed on the data to find E-e-" and s. Typical data
obtained in a calibration of this sort are shown in ~able 5.3, and -e-
plotted in Figure 5.3. The values of E " and s found were 242.66 mV
and 58.56 mV respectively.
This calibration technique, involving the use of a strong acid and a weak
basel was used for most of the potentiometric titrations performed in this
work. This calibration technique has the advantage that one determines
Ee" and s under conditions (e.g. p[H+J.) similar to those encountered in
the actual potentiometric titration. The method has the disadvantage that
the protonation constants of the ligand must be known under the same con
ditions of ionic strength and temperature as used in the experiment.
The abovementioned disadvantage can be overcome with the use of a computer
program such as MAGEe (see Section 4 . 4.2). The program MAGEe can simul
taneously determine the calibration constants of the cell and the proto
nation constants of the ligand. This makes it unnecessary to determine
the protonation constants of the ligand in a separate experiment.
Various attempts were made to use the program MAGEe to determine simul
taneously the protonation constants of the ligand and the cell calibration
constants. The program was supplied with the following information:
a) the concentrations of the reactants in the titrate and titrant
solutions;
b) an estimate of Ee
" obtained from the data collected in part 1.
of the calibration and calculated in the same way as for the
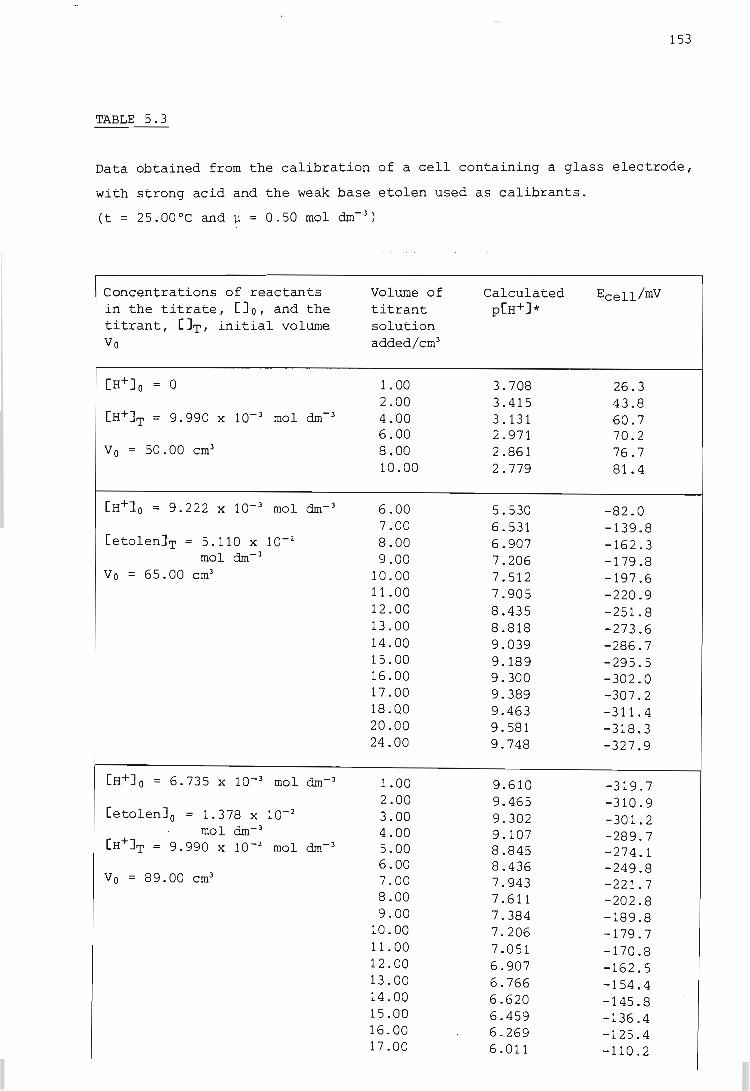
153
TABLE 5.3
Data obtained from the calibration of a cell containing a glass electrode,
with strong acid and the weak base etolen used as calibrants.
(t = 25.00°C and ~ = 0.50 mol dm- 3) .
Concentrations of reactants in the titrate, [J 0, and the titrant, [JTI initial volume Va
[H+IT = 9.990 X 10⁻³ mol dm- 3
Va = 50.00 cm3
[H+la = 9.222 X 10⁻³ mol dm- 3
[etolenJT = 5.110 x 10⁻²
mol dm-3
Va = 65.00 cm3
[H+J a = 6.735 x 10⁻³ mol dm- 3
[etolenJ a = 1.378 x 10⁻²
mol dm- 3
[H+JT = 9.990 x 10⁻² mol dm- 3
Va = 89. 00 cm3
Volume of titrant solution added/cm3
1.00 2.00 4.00 6.00 8.00 10.00
6.00 7.00 8.00 9.00
10.00 11.00 12.00 13.00 14.00 15.00 16.00 17.00 18.00 20.00 24.00
1.00 2.00 3.00 4.00 5.00 6.00 7.00 8.00 9.00
10.00 11.00 12.00 13 .00 14.00 15.00 16.00 17.00
Calculated p[H+J*
3.708 3.415 3.131 2.971 2.861 2.779
5.530 6.531 6.907 7.206 7.512 7.905 8.435 8.818 9.039 9.189 9.300 9.389 9.463 9.581 9.748
9.610 9.465 9.302 9.107 8.845 8.436 7.943 7.611 7.384 7.206 7.051 6.907 6.766 6.620 6.459 6.269 6.011
Ecell/mV
26.3 43.8 60.7 70.2 76.7 81.4
-82.0 -139.8 -162.3 -179.8 -197.6 -220.9 -251.8 -273.6 -286.7 -295.5 -302.0 -307.2 -311. 4 -318.3 -327.9
-319.7 -310.9 -301.2 -289.7 -274.1 -249.8 -221.7 -202.8 -189.8 -179.7 -170.8 -162.5 -154.4 -145.8 -136.4 -125.4 -110.2
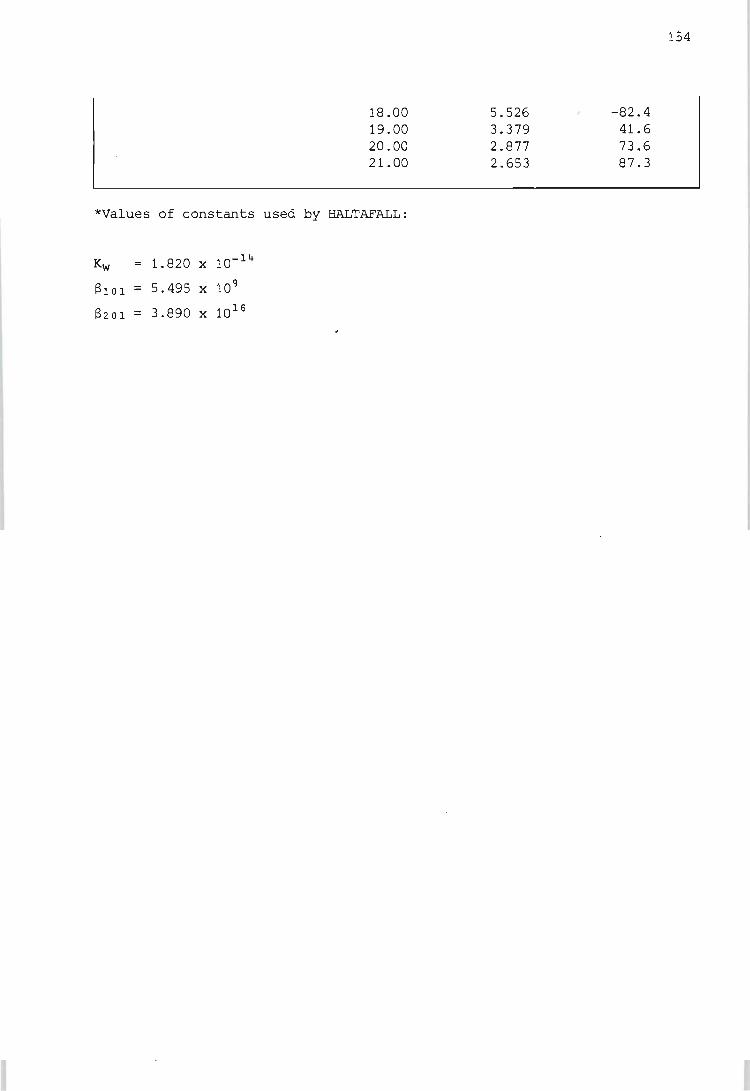
18.00 19.00 20.00 21.00
*Values of constants used by HALTAFALL:
Kw 1.820 X 10⁻¹⁴
SlOl 5.495 X 10 9
S201 = 3.890 X 10 16
5.526 3.379 2.877 2.653
-82.4 41.6 73.6 87.3
154
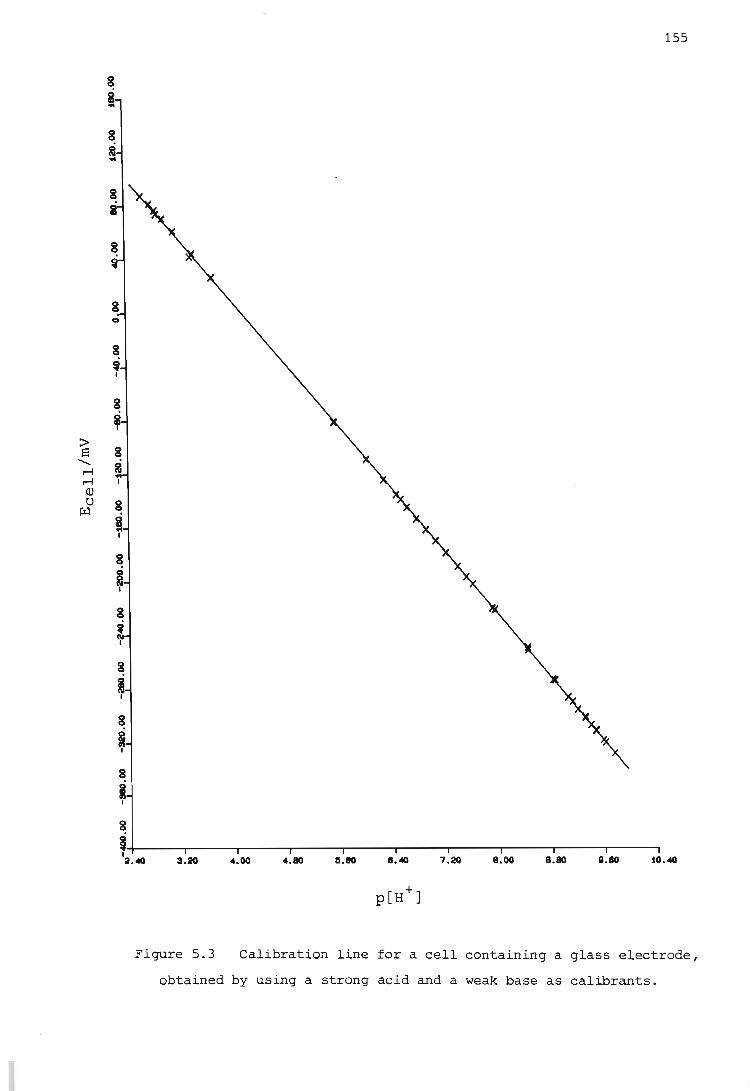
155
8
* I
8 , !>
8 S .......... iii ~ ~ <lJ ()
ILl
8 , 8
8 , 8
'~4-----r---~-----r----'-----.----.-----.----'-----r----' a.~ 3.20 4.00 4 . 80 15.80 8.~ 7.20 8.00 8.80 11.80 10.40
Figure 5.3 Calibration line for a cell containing a glass electrode,
obtained by using a strong acid and a weak base as calibrants.
strong acid calibration of the cell (see Section 5.1.1) i
c) the Nernstian value for Si and
d) the titration data obtained in the intermediate p[H+1 region,
i.e. the titration points obtained in parts 3.and 4. of the
calibration procedure.
156
Care was taken when carrying out the calibration that not too much acid
was added at step 2., because the p[H+J of the solution would then no
longer have been a sensitive function of the protonation constants of the
ligand. The sensitivity of the measured p[H+] to the protonation con
stants of the ligand, as well as the p[H+1 range covered during the cali
bration, were previously investigated by using HALTAFALL to do a species
distribution calculation.
Some problems were encountered with MAGEC which made it impossible to
determine simultaneously both the protonation constants and the cell ~
calibration constants. It was found that the values of E ", s and the
protonation constants to which MAGEC converged depended considerably on
the initial approximations supplied. This is perhaps due to ill-condition
ing of the numerical problem solved by MAGEC. Furthermore, the proton a
tion constants obtained from several similar calibration experiments dif
fered considerably. This made it difficult to choose a single set of
protonation constants to supply as input to the programs MINIQUAD and
ESTA. These constants were required when several sets of titration data
were being refined simultaneously to determine the metal-ligand stability
constants. The values of the calibration constants obtained for the
forward and backward parts of the calibration run also differed. This
latter problem could not be solved by refining the data from the forward
and backward runs simultaneously, as the program cannot deal with the
change in the titrant solution. Hence it was decided not to use MAGEC
but to use the calculation procedure described earlier.
These attempts to use the program MAGEC took place prior to publication
of the paper by May ~ ai. (130) on its use. It is there stated that
MAGEC can be" used in a cycling procedure with MINIQUAD. These authors
do point out that when MAGEC is used alone to determine both the cell
calibration constants and the protonation constants of the ligand, a false
157
solution can be obtained if correlation of errors between two or more
parameters occurs.
A modified version of the strong acid-weak base calibration technique
exists. In this version the calibration is performed over a whole day and
many points are taken. The titration vessel is then cleaned. On the
following day one calibration point is taken in order to establish the
intercept of the calibration line, and then the rest of the experiment is
performed. It was felt that this version was notfrS reliable as one in
which the calibration and actual experiment are performed on the same day.
5.1.4. Calibration using a strong acid, a strong base and a weak
acid
In an attempt to find a calibration technique which included points in
the p[H+] range 4 to 10 it was' decided to use acetic acid in addition to
HN0 3 and NaOH. It was claimed by Linder and Torrington (161) that 'plots
of Ecell versus log [H+] for acetic acid are usually fairly linear over
qui te an extended range of log [H+] values' . 'They were unhappy with the
use of strong acid and strong Qase .calibrants because they 'found that
plots of Ecell against log [H+] for such systems are only very approxi
mately linear over a very limited range of log [H+] values', and they
concluded that acetic acid was a better calibrant.
There is a problem associated with using acetic acid as a calibrant, which
is that in the systems studied here the acetate ion can act as a ligand.
That is, if it is present during the actual experiment, it will coordinate
to the metal ion and thus complicate the equilibria being studied, which
is of course not desired. To determine whether acetic acid could indeed
be used as a calibrant it was decided to test the assumption that the cell
calibration constants remained the same after the calibrating solutions
had been discarded. If so, then it would be reasonable to calibrate the
cell, rinse out the calibrating solutions, and perform the main experiment
separately: the glass electrode would no longer be calibrated in situ.
To test the above assumption two calibration runs were carried out on the
same day, with the cell being rinsed out after the completion of the first
run. The calibrations were carried out as follows. First a solution of
known HN03 concentration was titrated into an aliquot of background elec-
158
trolyte to obtain points in the low p[H+1 region. Then a solution of
known NaOH concentration was titrated into the mixture in order to neutra
lize the acid present and obtain cell potential readings at high p[H+]
values. Finally a solution of known acetic acid concentration was titrated
into the mixture to obtain points in the intermediate region. All the
solutions used were made up to the appropriate ionic strength by using
The pCH+] values for the strong acid and strong base points were obtained
from the analytical concentrations of H+ and OH-, whereas the pCH+] values
for the acetate points were obtained from a species distribution calcula
tion carried out by the program HALTAFALL. A value of pKa = 4.50 for
acetic acid at an ionic strength of 0.5 mol dm- 3 and a temperature of 25°C
was obtained from the literature (162). Table 5.4 contains the data col
lected in these trial calibrations. A plot of Ecell against the calcula
ted value of p[H+] is given in Figure 5.4. For the sake of clarity only
points' obtained from run 1 are shown in the figure. E-e-" and s were obtained,
as usual, by simple linear regression and are shown in Table 5.5.
From these results it appears that the calibration line has shifted
somewhat between runs. It was therefore thought to be unwise to go to
the considerable extra effort involved in the acetic acid technique, since
it would quite possibly produce results less accurate than those of an
in situ calibration method. A comparison of Figures 5.3 and 5.4 suggests
that the strong acid - weak base technique is in any case capable of
producing a far better fit to a straight line than is the acetic acid
technique. This latter calibration technique was therefore not adopted.

159
TABLE 5.4
Data obtained from the calibration of a cell containing a glass electrode,
with strong acid, strong base and acetic acid used as calibrants.
(t = 2S.00°C and ~ = 0.50 mol dm- 3) .
Concentrations of reactants Volume of Calculated Ecell/mV in the titrate, [] 0, and titrant p[H+] the titrant, []T' initial solution Run 1 Run 2 volume Vo added/cm3
[H+l o = 0 4 . 00 3.431 49.1 49.4 8.00 3.161 65.7 66.8
[H+]T = 5.000 x 10⁻³ 12.00 3.014 74.8 75.9 mol dm- 3 16.00 2.916 80.2 81.5
Vo = 50.00 cm3 20.00 2.845 84.7 86.1
[H+]o = 1.429 x 10⁻³ 12.00 10.123 -340.1 -341.7 mol dm- 3 14.00 10.416 -356.8 -357.9
[OH-]T = 9.986 x 10⁻³ 16.00 10.582 -366.8 mol dm- 3 17.00 10.644 -369.5
18.00 10.697 -371.8 -372.9 Vo = 70.00 cm3 20.00 10.785 -376.3 -376.2
[OH-] o. = 1.108 X 10⁻³ 12.00 5.207 - 62.6 - 63.0 mol dm-3 14.00 4.912 - 42.3 - 41.3
[HAc]T = 1.000 x 10- 2 16.00 4.740 - 31.0 mol dm- 3 17.00 4.675 - 26.0
18.00 4.619 - 23.3 Vo = 90.00 cm3 20.00 4.526 - 17.5 16.5 -

8 ~ .. 8
160
8 , 8
~ ~ , 8
'14-----~--~----~----r_--~----~--~r_--_r----~--_. 2.80 3.80 ~.~ 15.20 11.00 11.80 7.80 II.~ 8.20 10.00 10.80
+ p[H 1
Figure 5.4 Calibration line for a cell containing a glass
electrode, obtained by using a strong acid, a strong base
and acetic acid as calibrants .
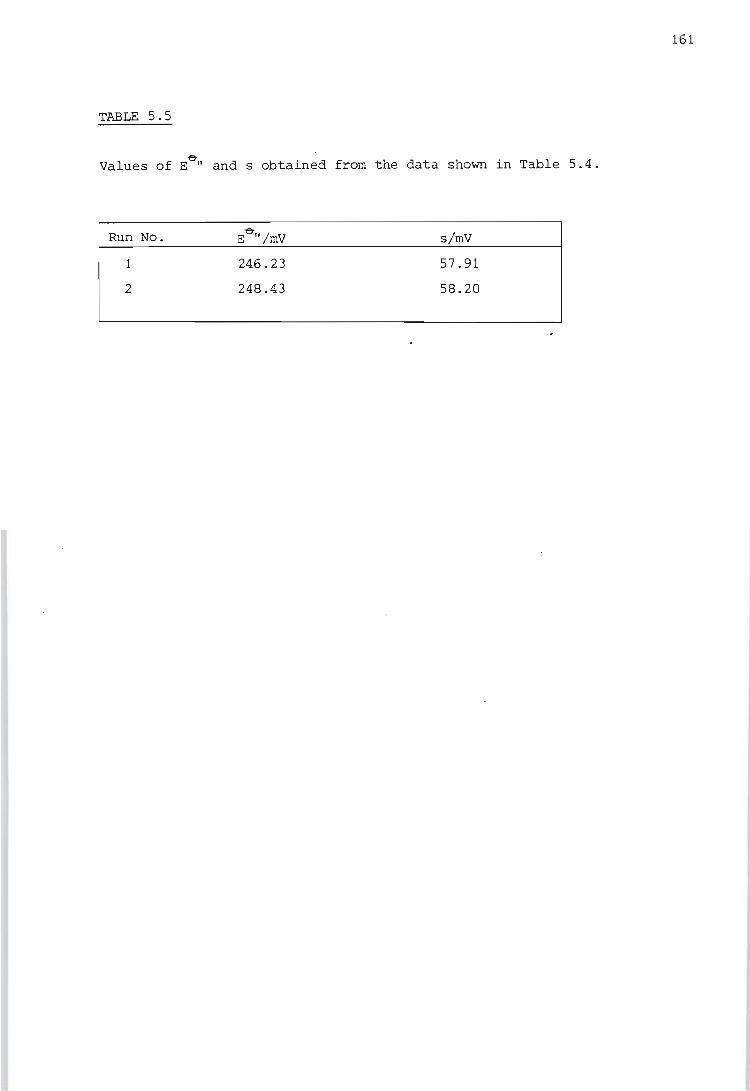
TABLE 5 . 5
~ Values of E .. and s obtained from the data shown in Table 5.4.
Run No.
1
2
246.23
248.43
s/mV
57.91
58.20
161
162
5.2. Calibration of the titration calorimeter
Before the data obtained from the titration calorimetric experiments can
be analyzed, the calorimeter must be calibrated. Such calibration entails
the following:
1. calibration of the Wheatstone bridge containing the reaction
vessel thermistor, in order to establish the relation between
the temperature in the reaction vessel and the measured off
balance potential of the bridge;
2. determination of the temperature rise caused by heat generated
by the stirrer;
3. determination of the heat capacity of the reaction vessel as a
function of the volume of liquid contained;
4. testing of the accuracy of the titrant-delivery system; and
5. ca"libration of the reaction vessel heater.
The last two tasks were carried out by Lowe et at. (163), and we now con
sider the remaining three aspects in detail . The procedures described
below were performed each time a set of calorimetric experiments was under
taken, usually over a period of about two months. It was assumed that
the characteristics of the calorimeter were sufficiently stable for this
to be reasonable.
5.2.1. Calibration of the Wheatstone bridge containing the
thermistor
The Wheatstone bridge was calibrated by measuring the off-balance potential
corresponding to small, accurately measured changes in the temperature of
the water bath surrounding the calorimeter assembly. The value of the
variable resistor in the bridge was set at 1979.0 Q, so that the bridge was
balanced at approximately 25°C and all experiments were carried out in
the linear response region of the thermistor. The changes in the
temperature of the water bath were measured with a 1°C Beckmann thermometer
(GALLENKAMP TJ 525). Measurements were performed as follows,at intervals
163
within the range 25°C - 26°C. The reaction vessel was filled with 95.00
cm3 of doubly deionized. water, encapsulated in .the calorimeter assembly,
and placed in the water bath. The stirrer was switched on with its speed
set on 'high', and the thermistor was switched. into the bridge circuit.
The temperature of the water bath was set at the desired level by adjus
ting the setting on the proportional controller. The whole assembly,
including the 1°C Beckmann thermometer, was then allowed to equilibrate
for 24 hours. Once the system had equilibrated, the bridge off-balance
potential was recorded for 5 minutes and the reading on the Beckmann
thermometer noted. The absolute temperature scale was fixed by means of
a standard mercury-in-glass thermometer calibrated for the range 24°C to
35°C. For each temperature selected, the readings of off-balance potential
were averaged and corrected for the temperature rise caused by the heat
of stirring (see Section 5.2.2). A plot of corrected off-balance poten
tial against the temperature in the water bath (and reaction vessel) was
then drawn. A typical plot is shown in Figure 5.5.
As mentioned in Section 4.2, the temperature in the reaction vessel (T) is
related to the off-balance potential (E) by an equation of the form
E = a + bT. Simple linear regression applied to the data plotted in Figure
5.5 yields the result
Ej~V = -195825 + 7739.83 (TjOC). (5.8)
It can be seen from the figure that this straight line fits the data very
well, and thereby provides the relation needed in this case to convert
readings of off-balance potential into temperature values.
5.2.2. Determination of the temperature rise caused by the heat of
stirring
In the calibration of the Wheatstone bridge the water in the reaction ves
sel was kept stirred throughout the course of the measurements. In cal
culating the results of this calibration, one must correct for the steady
state rise in temperature resulting from the heat generated by stirring.
This correction must be made to obtain an accurate relationship between
the temperature sensed in the reaction vessel by the thermistor and the
temperature actually measured by the thermometer, i.e. that of the water
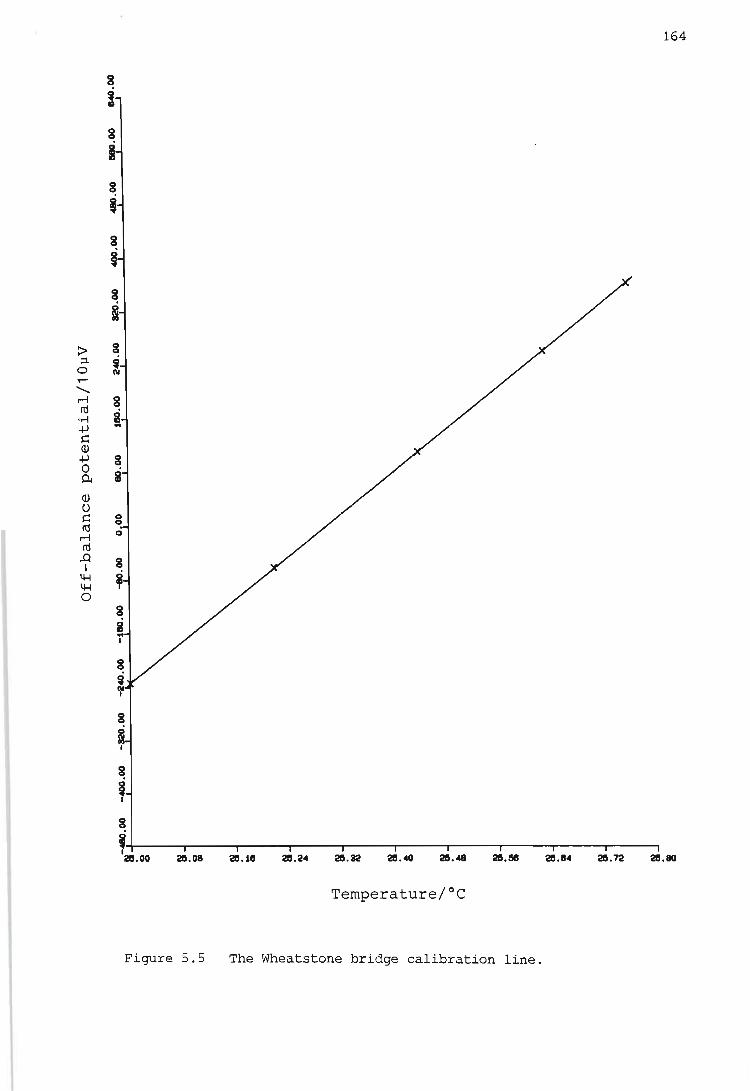
8
!
8
~ , 8
164
':~----~----~--~----~-----r----.-----~----r---~r----' ~.~ ~ .Ol ~.~ ~.24 ~.a ~.~ ~.. ~.M ~.14 ~.72 ~.~
Ternperature/oC
Figure 5 . 5 The Wheatstone bri dge calibration line.
165
surrounding the calorimeter assembly. Since the rate of stirring is kept
constant, it is assumed that the rate of generation of heat by stirring
is constant.
The steady-state temperature rise resulting from the stirring action,
6Tstir' was determined as follows. The reaction vessel, containing
95.00 cm3 of water and placed within the calorimeter assembly, was left
for about 72 hours to come to temperature equilibrium with the water (in
the bath) surrounding the assembly . During this period the stirrer was
left off and the thermistor isolated from the Wheatstone bridge circuit.
Then the stirrer was switched on at 'high', and simultaneously the thermi
stor was switched into the bridge circuit. (The high stirring rate is the
most efficient rate for removing build-up of heat in the vicinity of the
thermistor, and also the rate used in all subsequent measurements.) The
off-balance potential was recorded every 4 seconds for a period of 10
minutes after switch-on, and then again for 5 minutes 24 hours after
switch-on.
Figure 5.6 shows a plot of the off-balance potential recorded over ·the
full 24-hour period in one case. Figures 5.7 and 5.8 show expanded ver
sions of the intial and final porti ons of the curve displayed in Figure 5.6.
It was concluded that the thermistor attained its steady-state operating
temperature at the point marked 'a' in Figure 5.7 . This stage was always
reached within one minute of switch-on. It was thought that the heat
dissipated by the thermistor in such a short period would have a negligible
effect on the overall temperature of the vessel, and similarly that the
amount of heat generated by the stirrer would be insignificant. The
gradual rise in off-balance potential taking place after point 'a' is
assumed to result from the stirring action. The levelling-off in off
balance potential by point 'b' in Figure 5.8, 24 hours after switch-on, is
an indication that the system has attained steady state. Furthermore, the
off-balance potential was steady after 48 hours at the same value as was
reached after 24 hours, viz. -1803 ~V.
The difference in off-balance potential between points 'a' and 'b' was, in
general, taken to represent 6Ts.tir. The value of 6Tstir thus calculated
was then subtracted from the off-balance potential reading obtained at
each pOint of the calibration of the Wheatstone bridge. 6Ts tir was found
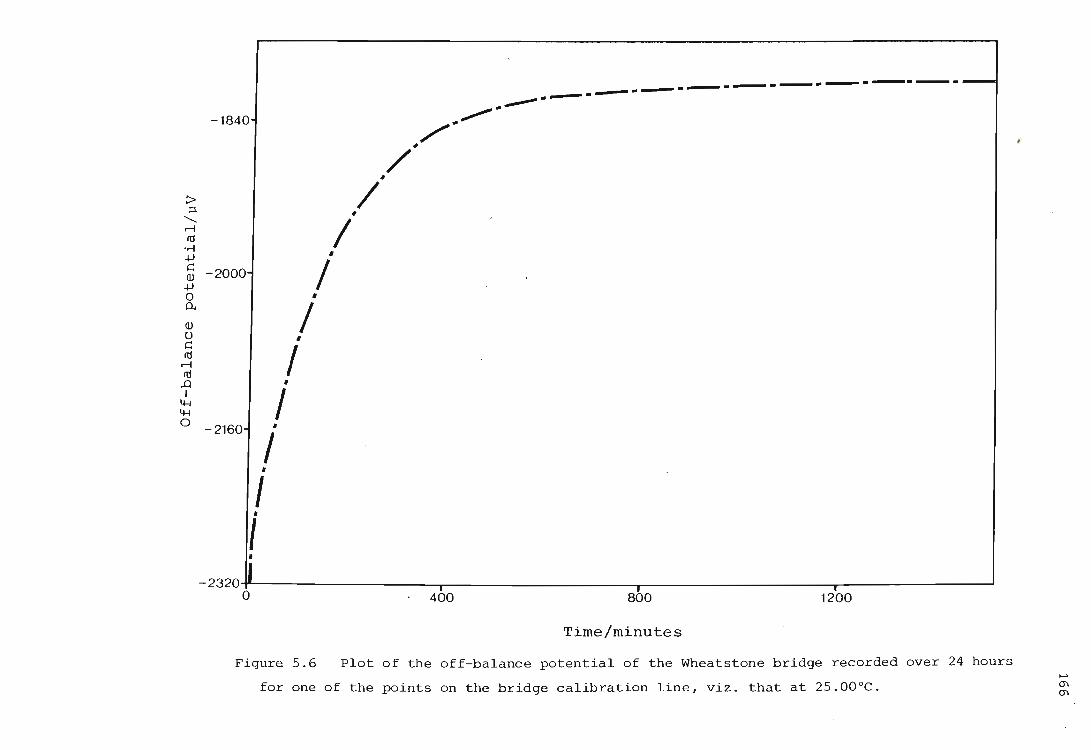
--------------------~------/--1840
/' /#
#
/ f
:> ;::l
"-rl m
.r-l +J ~ -2000 QJ / +J 0 0..
QJ 0 ~ m rl m
.Q I
4-1 4-1 0
• / • / •
/ •
/ -2160
•
I •
I •
-2320 II ~o--------~~I~--------~~----------~--------J v 400 860 i 1200
Time/minutes
Figure 5.6 Plot of the off-balance potential of the Wheatstone bridge recorded over 24 hours
for one of the points on the bridge calibration line, viz. that at 25.00°C. .... 0"1 0"1
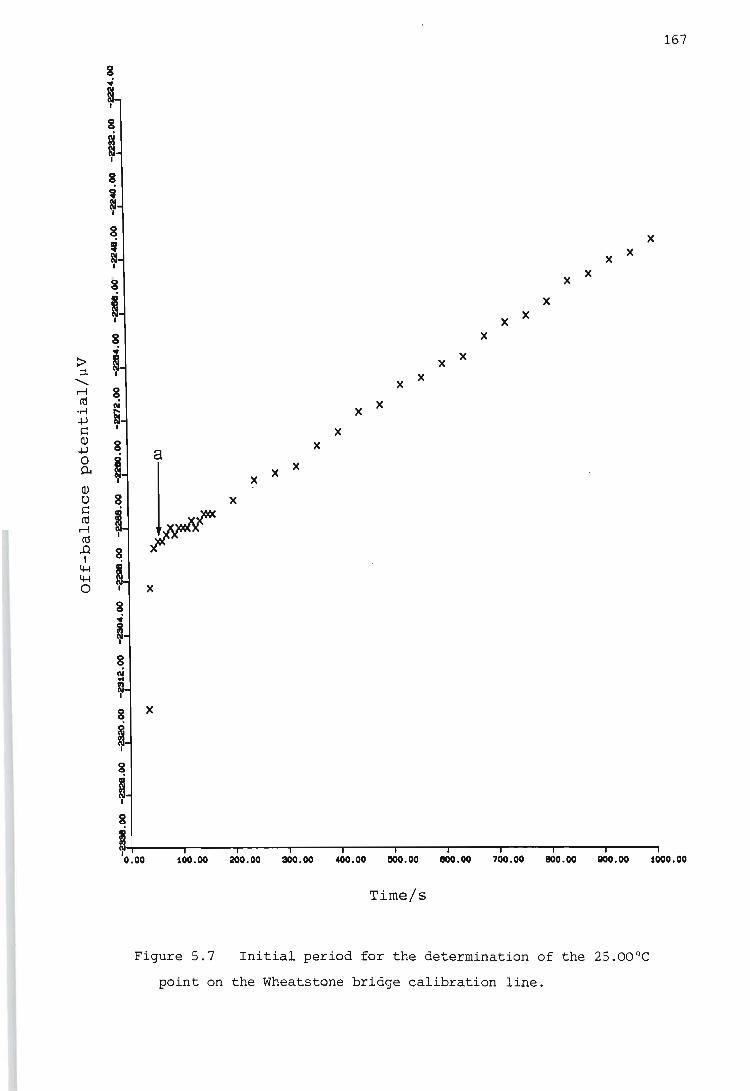
a
~x x
x
x x x
x x
x x x
x
167
x x x
x x x
x x x
x x
100.00 200.00 300.00 <400.00 1500.00 Il00.00 700.00 Il00.00 800.00 1000.00
Time/s
Figure 5.7 Initial period for the determination of the 25.00 oC
point on the Wheatstone bridge calibration line.
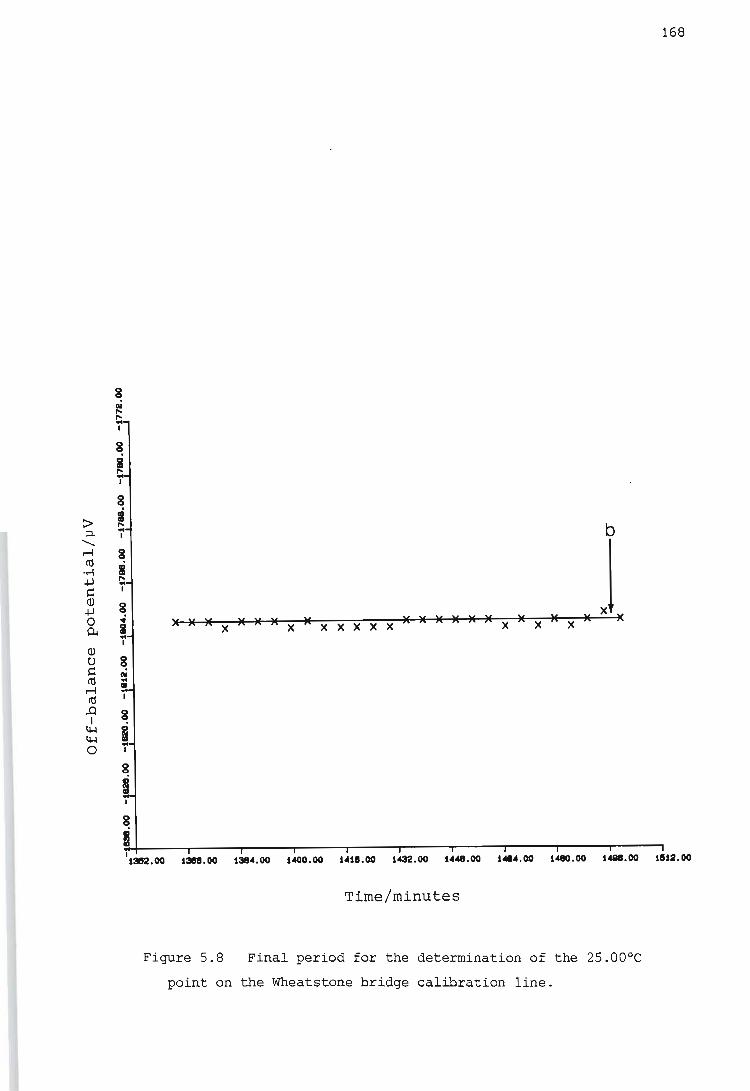
168
b
~ M M X M M M X M X X X X X M M M M M H X M X H X M J
8
i I 1352.00 1388.00 1314.00 1400.00 1418.00 1432.00 1441.00 1414.00 1410.00 1488.00 1812.00
Time/minutes
Figure 5.8 Final period for the determination of the 25.00°C
point on the Wheatstone bridge calibration line.
169
to have a value in the range 484 + 4 ~V. This represents a temperature
range of 0.063 ~ O.OOl°C.
It should be pointed out that the procedure described in Section 5.2.1.,
for obtaining readings of off-balance potential at different temperatures,
is in fact a quicker way than the above of obtaining points such as 'b'.
Before 1982, however, ~Tstir was determined by the procedure described in
the N.I.M. Report (164), a procedure which (unlike that described above)
does not yield reproducible results, and appears to be incorrect. If one
looks at Figure 5 of that report (165), it will be seen that the difference
found (i.e. ~Tstir) is negative. This of course contradicts the reasonable
assumption that heat is generated by stirring. The explanation appears to
be the following. The liquid in the vicinity of the thermistor is at a
higher temperature than the rest of the liquid in the reaction vessel, as
a result of resistive heating of the thermistor. Stirring serves to dis
sipate this heat from the vicinity of the thermistor, which therefore registers
a lower temperature. (The greater the rate of stirring, the greater is
the drop in temperature caused by such dissipation.) This dissipation
of heat from the vicinity of the thermistor can, it seems, mask the heat
generated by stirring.
The measurements made before 1982 to calibrate the Wheatstone bridge were
therefore corrected by using a value for ~Tstir determined by the new
procedure. A slight complication was caused by the fact that the low
stirring rate was originally the rate used in the calibration of the bridge.
(This rate had been used for calibration because it was thought that this
would minimise the heat generated by stirring, but the high rate had been
used for all other measurements.) It was, however, decided not to re-
calibrate the bridge at the high rate. Hence the readings originally
taken at the low rate were converted so that they represented equivalent
readings taken at the high rate. To do this, the position of one of the
calibration points, viz. that at 25.000°C, was re-determined at high and
low rates. The difference between the two readings of off-balance poten
tial was taken to be the difference between the ~Tstir values correspon
ding to high and low stirring rates. This difference was found to be
445 + 27 ~V (or 0.057 + 0.003°C).
170
5.2.3. Determination of the heat capacity of the reaction vessel
The heat capacity of the reaction vessel, containing a known volume of
doubly deionized water, was determined by the dissipation of a known quan
tity of electrical energy and measurement of the resulting temperature rise.
Water was used in the reaction vessel because its heat capacity is accu-
rately known as a function of temperature.
The reaction vessel, containing the known volume of doubly deionized water
and positioned in the calorimeter assembly, was placed in the water bath
at 25.000°C in order to equilibrate. Once the equilibrationperiod (> 45
minutes) was over, the off-balance potential was recorded for approximately
5 minutes to obtain the lead period of the thermogram. The heater was
then switched on for the selected time period, and once again the off
balance potential was followed. Observation of the off-balance potential
for 5 minutes after the heater was switched off provided the trail period
of the thermogram. The resulting thermogram was plotted and the data were
corrected for heat exchange effects, etc., with the aid of the computer
program CAL CAL (see Section 4.4.7), which also calculates the heat capacity
of the reaction vessel and its contents. The heat capacity of the empty
reaction vessel, Cpr, was then found by subtracting the contribution of
the water to the total heat capacity.
cpr is constant for a given volume of liquid in the reaction vessel, but
varies as this volume changes. This change results from more of the re
action vessel and stirrer coming into contact with the liquid as its
volume increases. Therefore Cpr was determined as a function of the
volume of water in the reaction vessel, for volumes between 95.00 and
100.00 cm3•
Care was taken during these, and subsequent, heat capacity measurements
to ensure that the stirrer was always attached in exactly the same posi
tion, so as not to change the area in contact with the liquid and thereby
introduce an error in the heat capacity determinations. As a further
precaution the capillary tube, through which the titrant solution is nor~
mally added into the vessel, was kept filled throughout the heat capacity
measurements.

A typical set of results obtained for the various heat capacity deter
minations performed in order to calculate Cpr is shown in Table 5.6.
171
The result of a simple linear regression performed on this set of volume
Cpr data is the relationship:
28.82 + (0.2884 cm-3) (V - 95). (5.9)
A plot of the data leading to equation (5.9) is shown in Figure 5.9.
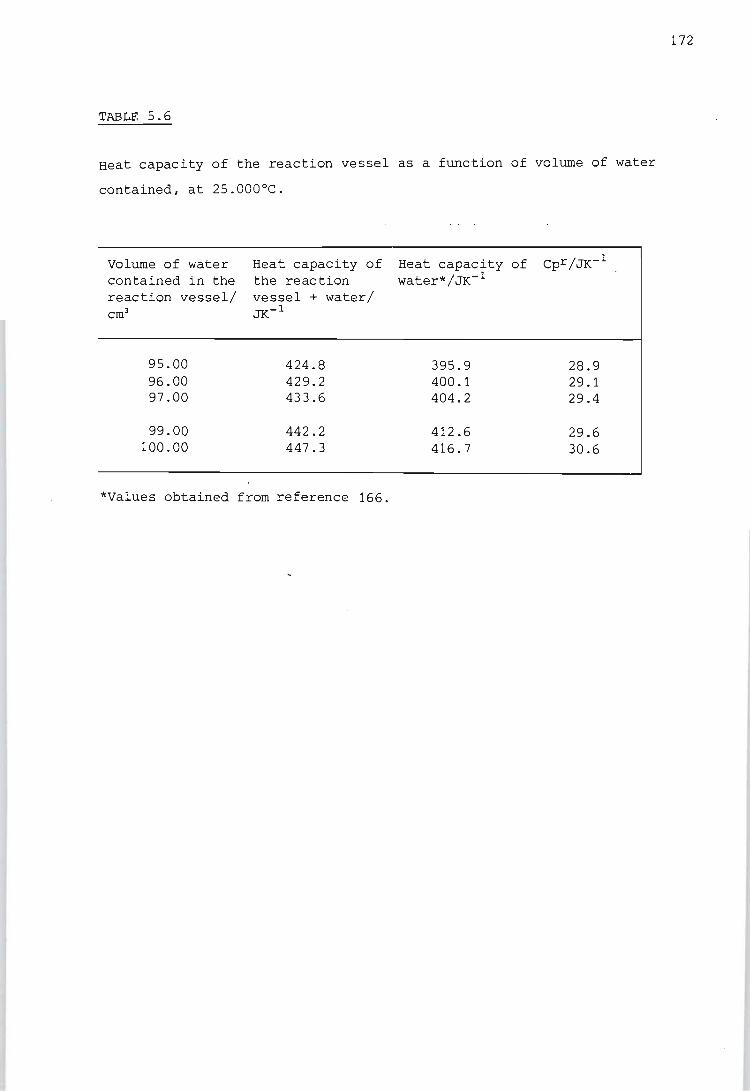
TABLE 5.6
Heat capacity of the reaction vessel as a function of volume of water
contained, at 25.000°C.
Volume of water contained in the reaction vessel/ cm3
95.00 96.00 97.00
99.00 100.00
*Values obtained
Heat capacity of the reaction vessel + water/ JK- 1
424.8 429.2 433.6
442.2 447.3
from reference 166.
Heat capacity of water*/JK- 1
395.9 400.1 404.2
412.6 416.7
28.9 29.1 29.4
29.6 30.6
172
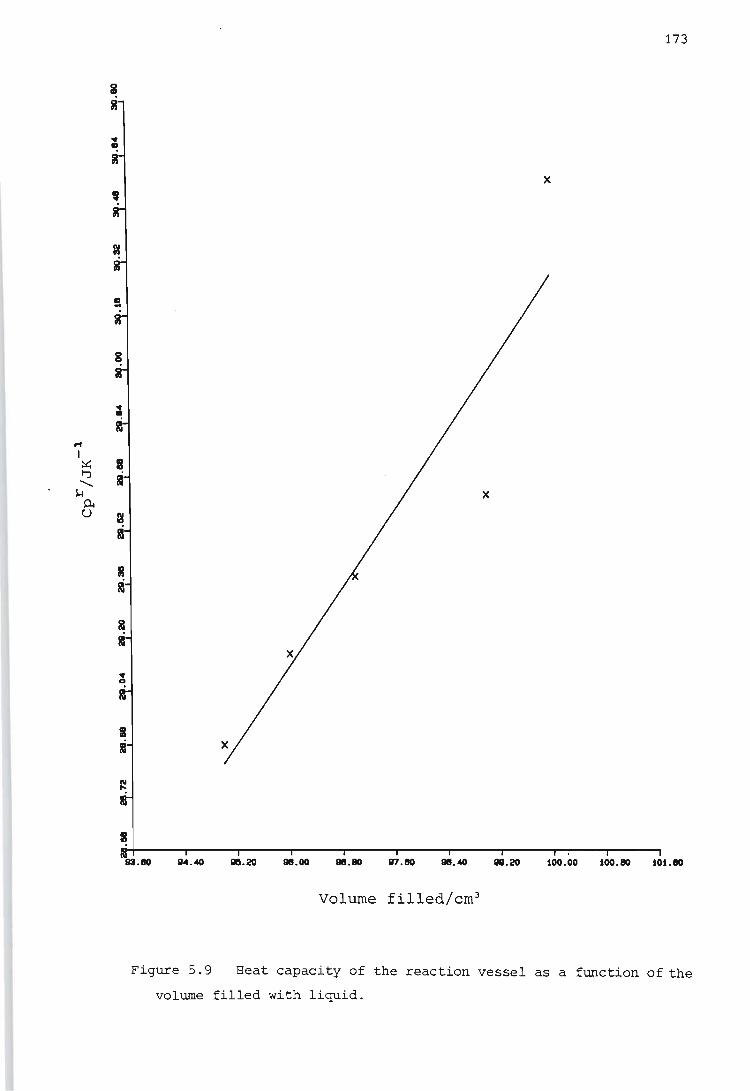
I
I til
I I
N ,..
I
173
x
ii4---~----~----r----'----~---.----'----'~, ---r---. lila.. 84.40 815.20 l1li.00 l1li.80 87.80 •. 40 111.20 100.00 100.80 101.80
Volume filled/em 3
Figure 5.9 Heat capacity of the reaction vessel as a function of the
volume filled with liquid.
CHAPTER SIX
SELECTION OF EXPERIMENTAL CONDITIONS
When selecting the conditions for an experiment, one must consider the
relationship between the desired thermodynamic quantity and the measured
quantity so as to choose the conditions that will enable the maximum
amount of useful information to be extracted from the measurements.
6.1. General approach to the selection of experimental conditions
First the considerations arising in the choice of conditions for a poten
tiometric titration will be discussed. If reliable values of the stability
constants are to be determined, such experiments must be well designed
and the measurements made as accurately as possible.
In choosing the conditions for determining a particular stability constant,
one must ensure that the quantity being measured, in this case the hydro
gen ion concentration, quantitatively reflects the effects of complex for
mation: that is, the measured quantity must be a sensitive function of
the stability constant being determined.
If several species coexist to a significant extent, this will cause a
decrease in the precision of the stability constants extracted from the
experimental data. Hence it is advisable that the species of interest
predominates over an appreciable part of the concentration range covered
by the titration. In particular, if one wishes to study mononuclear com
plexes (as in this case) one should if possible avoid conditions under
which mixed or polynuclear species predominate. If on the other hand one
wishes to study polynuclear or mixed complexes, measurements should of
course be made under conditions where such complexes are more likely to
occur, e.g. high metal-ion concentrations or high p[H+J. Nevertheless,
one should always test for the presence of unwanted species through the use
of Z(log[LJ) plots. For this reason the potentiometric titrations should
be carried out at several metal ion concentrations. (See Section 4.3.2.)
Since one is studying systems at equilibrium, one should ensure that
equilibrium (as indicated by a steady potential reading) has indeed been
175
attained after each addition of titrant. Reversibility of the reaction
should also be checked, by carrying out a reverse titration. That is,
if the addition of titrant has caused an increase in p[H+], then at the
end of this titration the titrant is changed so that further titration
causes a decrease in p[H+1 to its initial value. If the Z(log[LJ) plots
for the forward and reverse titrations are superimposable, the reaction is
reversible.
One should always ascertain that the results obtained are reproducible.
This need not be checked by repeating a titration if tneformation curves
obtained by using different concentrations of reactants are superimposable.
Should the formation curves not coincide, however, then it is best to
repeat one of the titrations and use fresh stock solutions.
The experiments should be planned in such a way that the concentration of
each of the reactants is varied over as wide a range as is practically
possible. In this way one facilitates the attainment of reliable stability
constants. (The upper limit of the concentrations which can be used is
controlled by such factors as the variation of activity coefficients and
limited solubility, whereas the lower limit is reached when the equilibria
being studied are swamped by the dissociation equilibria within the medium,
or by experimental error.) Another advantage of covering a wide range of
concentrations is that the stability constant for a particular species
can be extracted from a selected region where other, interfering species
appear to be absent.
In titration calorimetry the general considerations are somewhat different,
since here one wishes, for reasons of accuracy, to maximise the amount of
heat liberated for a given amount of titrant added. With the instrument
used in this work the desirable change in off-balance potential is 3000 ~V,
which is equivalent to about 0.4°C. Again it is important that the species
of interest predominates in the concentration range covered, so that most
of the heat liberated can be ascribed to the reaction of interest and not
to interfering reactions. The calorimetric experiments for each system
should be carried out under similar conditions, i.e. within roughly the
same p[H+] and 2 regions, as the potentiometry. This ensures that the
stabil~ty constants of all the species present are known. Such knowledge
greatly simplifies the calculation procedure used to determine the enthal
py changes of complex formation (see Section 4.4.10). Unfortunately the
176
computer program LETAGROP KALLE (used to calculate the enthalpy changes)
cannot in its present form deal with more than one reacting component in
the titrant. This fact limits somewhat the range of experimental conditions
available.
In selecting experimental conditions for both the potentiometric and the
calorimetric titrations much use was made of the program HALTAFALL (see
Section 4.4.1). The program was used to arrive at species distribution
diagrams, from which one could determine which concentration combinations
give the optimum formation · of a certain species. From HALTAFALL-calculated
p[H+] values it could be decided whether the p[H+] changes occurring in a
particular potentiometric titration were sensitive to changes in the sta
bility constant being determined. In order to perform these calculations
HALTAFALL requires as inputs the reagent concentrations, and the stability
constants for the species assumed present. The former inputs were chosen
by the author, while the latter were either obtained directly from the
literature, or estimated from knowledge of similar systems previously
studied.
Throughout ·this work the measurements were undertaken at an ionic strength
of 0.5 mol dm-3 by using KN03 as the background electrolyte, and at a
temperature of 25°C. This ionic strength was chosen mainly because of
calorimetric considerations. At this strength reagent concentr.ations could
be kept sufficiently high so that adequate amounts of heat were liberated
for the enthalpy changes to be determined precisely. In addition, the
higher the ionic strength in comparison with reagent concentrations, the
more likely it is that the activity coefficients will remain constant. The
background electrolyte was chosen to be KN03 mainly because the NO)- anion
is small in size and therefore unlikely to form precipitates with protonated
polyamine ligands or with metal-polyamine complexes. Also, N03 - has no
affinity in aqueous solution for Ni2 +, C02 + or Zn2 +. Finally, the cation
K+ has a very low tendency to form complexes. It was therefore hoped that
this background electrolyte would have no unwanted effect on the equilibria
being studied. The working temperature was chosen to be 25°C because this
is the temperature most often used for thermodynamic measurements.
In some of the measurements care was·needed to prevent hydrolysis of the
metal-ligand complexes. In an attempt to overcome this potential problem
it was decided toreplace some of the cation in the background electrolyte
177
with protonated ligand, as this would lower the p[H+I. However, this
method of lowering the working p[H+1 can cause loss of sensitivity if
[M]t is much lower · than [L]t, especially in the case of potentiometric
measurements. On the other hand~ reagent concentrations must not be too
high in comparison with the concentration of background electrolyte, as
this would cause fluctuations in the ionic strength and resultant changes
in activity coefficients. A compromise technique was therefore adopted.
The program HALTA1 (see Section 4.4.1) was used to calculate the ionic
strength at each point of the titrations to ensure, if possible, that an
approximately constant ionic strength would be maintained.
In both potentiometry and calorimetry the formation of precipitates is
undesirable. In some cases the experimental conditions can be chosen in
such a way as to avoid their formation. For instance, the problem can
often be overcome in potentiometry by the use of more dilute solutions.
This option is not always available in titration calorimetry, however, as
it can result in insufficient heat liberation and hence poor determination
6f the enthalpy change for the reaction of interest. Lowering the p[H+1
of the reaction mixture as described in the previous paragraph can also
help to prevent precipitation of metal hydroxides.
What now follows is a discussion of how the experimental conditions for
each of the different types of measurement undertaken were chosen. An
example will be given for each case discussed.
6.2. Choice of experimental conditions for potentiometric measurements
There were three methods available for the determination of the stability
constants of the metal-ligand complexes:
1. addition of acid to a solution containing the metal-ligand com
plexes, i.e. decomposing the metal-ligand complexes with acid;
2. addition of a hydroxide solution to a solution containing the
metal ion plus protonated ligand, i.e. deprotonating the ligand
so that it can then complex with the metal ion; and
3. addition of deprotonated ligand to a solution containing metal
ion and protonated ligand .

178
For practical convenience and because of the form in which the ligands
were available, methods 1. and 3. were used for the complexes of etolen,
and methods 2. and 3. used for oden.
Four methods were available for the determination of the protonation con
stants of oden and etolen. These were:
1. titration of acid into a solution containing deprotonated ligand;
2. titration of a solution of deprotonated ligand into an acid
solution;
3. titration of hydroxide into a solution containing protonated
ligand; and
4. titration of protonated ligand into a solution containing hydrox
ide.
It must however be noted that the p[H+] readings which are sensitive to the
values of the protonation constants lie in the range from pKa - 1 to
pKa + 1. Readings outside this range are not useful. Therefore, in using
any of the above four methods, one must ensure th~t p[H+] readings are
taken in the appropriate range. For the sake of convenience method 2. was
used for determination of the protonation constants of etolen, since this
ligand was available in deprotonated form. Method 3. was used for oden
because the ligand was purchased and purified in protonated form.
For the metal-ligand systems the working p[a+] was kept fairly low in
order to suppress hydrolysis of the metal-ligand complexes. This was
achieved largely by introducing some protonated ligand as part of the back
ground electrolyte.
As an example, the selection of the reagent concentrations for the poten
tiometric measurements involving etolen and Ni2 + will be described. In
these titrations the cell was calibrated with strong acid and with the J. ligand
as base (see Section 5.1.3). Hence, on completion of the calibration,
part of the background electrolyte consisted of doubly protonated etolen.
The following stability constants, obtained from the literature and valid
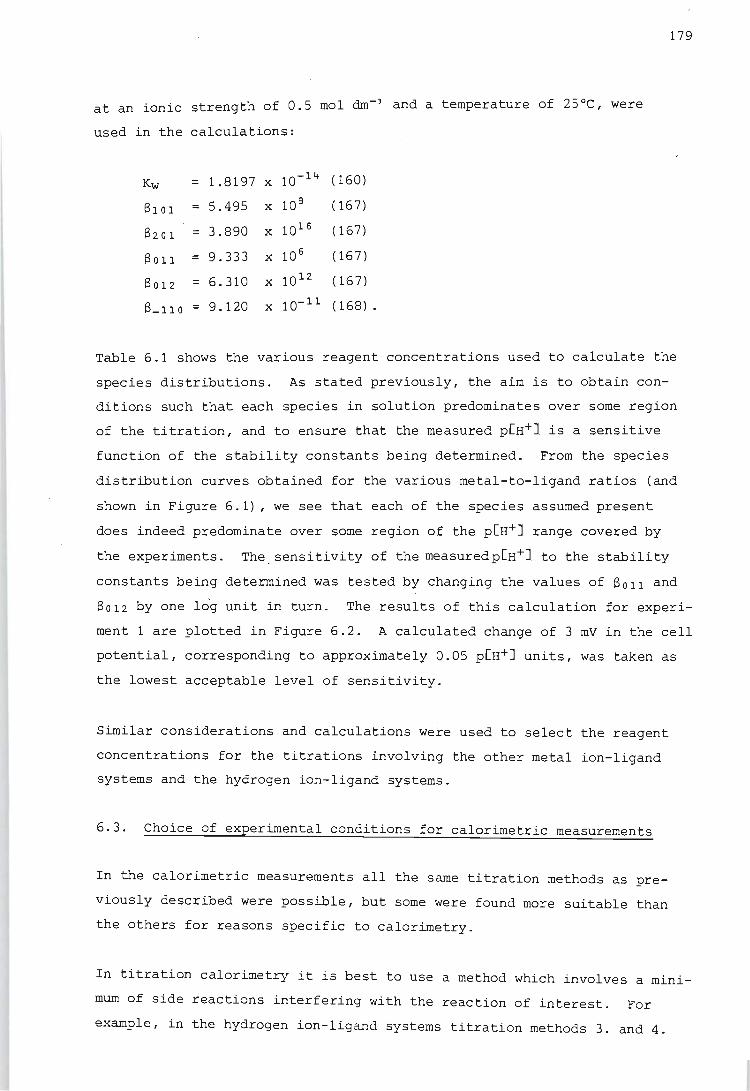
at an ionic strength of 0.5 mol dm- 3 and a temperature of 25°C,. were
used in the calculations:
Kw 1.8197 X 10⁻¹⁴ ( 160)
thOl = 5.495 X 10 9 ( 167)
8201 = 3.890 X 10¹⁶ ( 167)
8011 = 9.333 x 10 6 (167)
8012 6.310 X 10 12 ( 167)
8_11 0 9.120 X 10⁻¹¹ (168) .
179
Table 6.1 shows the various reagent concentrations used to calculate the
species distributions. As stated previously, the aim is to obtain con
ditions such that each species in solution predominates over some region
of the titration, and to ensure that the measured p[H+] is a sensitive
function of the stability constants being determined. From the species
distribution curves obtained for the various metal-to-ligand ratios (and
shown in Figure 6.1), we see that each of the species assumed present
does indeed predominate over some region of the p[H+] range covered by
the experiments. The. sensitivity of the measuredp[H+] to the stability
constants being determined was tested by changing the values of 8011 and
8012 by one lo'g unit in turn. The results of this calculation for experi
ment 1 are plotted in Figure 6.2. A calculated change of 3 mV in the cell
potential, corresponding to approximately 0.05 p[H+] units, was taken as
the lowest acceptable level of sensitivity.
Similar considerations and calculations were used to select the reagent
concentrations for the titrations involving the other metal ion-ligand
systems and the hydrogen ion-ligand systems.
6.3. Choice of experimental conditions for calorimetric measurements
In the calorimetric measurements all the same titration methods as pre
viously described were possible, but some were found more suitable than
the others for reasons specific to calorimetry.
In titration calorimetry it is best to use a method which involves a mini
mum of side reactions interfering with the reaction of interest. For
example, in the hydrogen ion-ligand systems titration methods 3. and 4.
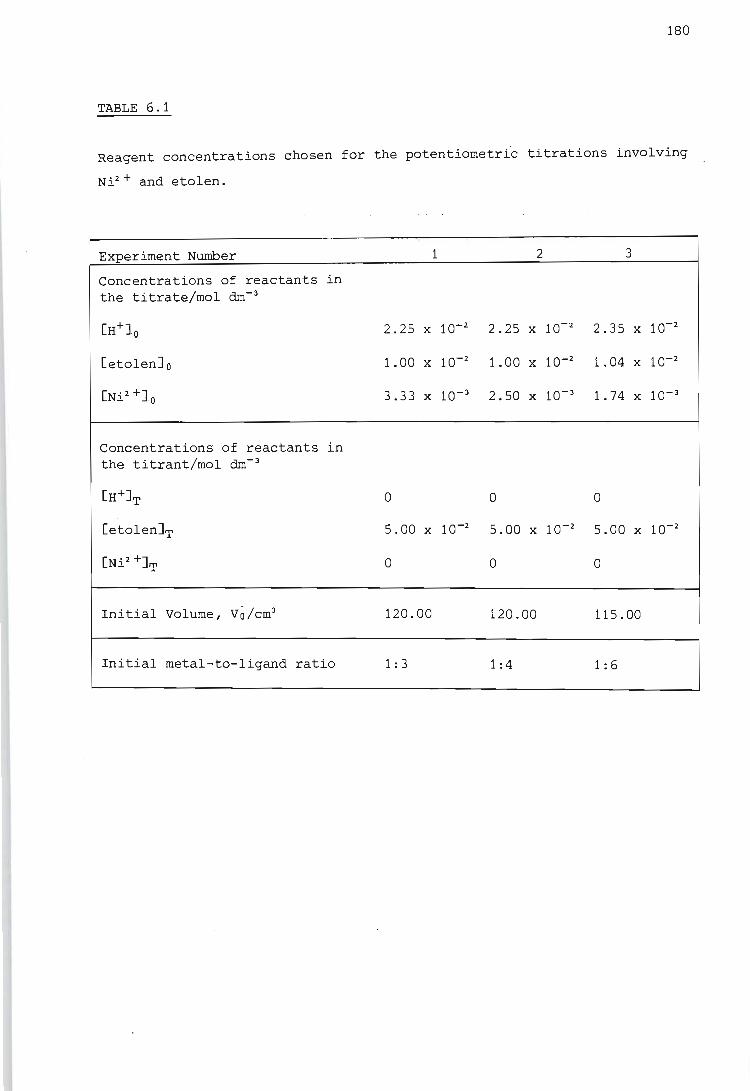
180
TABLE 6.1
Reagent concentrations chosen for the potentiometri"c titrations involving
Ni2 + and etolen.
Experiment Number 1 2 3
Concentrations of reactants in the titrate/mol dm- 3
[H+10 2.25 x 10⁻²- 2.25 X 10⁻² 2.35 X 10⁻²
[etolenJ o 1.00 x 10⁻² 1.00 X 10⁻² 1.04 X 10⁻²
[Ni 2 +]0 3.33 X 10- 3 2.50 X 10- 3 1.74 X 10- 3
Concentrations of reactants in the titrant/mol dm- 3
[H+]T 0 0 0
[etolenJT 5.00 x 10⁻² 5.00 X 10⁻² 5.00 X 10⁻²
[Ni2 +]T 0 0 0
Initial Volume, Vo/cm3 120.00 120.00 115.00
Initial metal-to-ligand ratio 1: 3 1 :4 1: 6
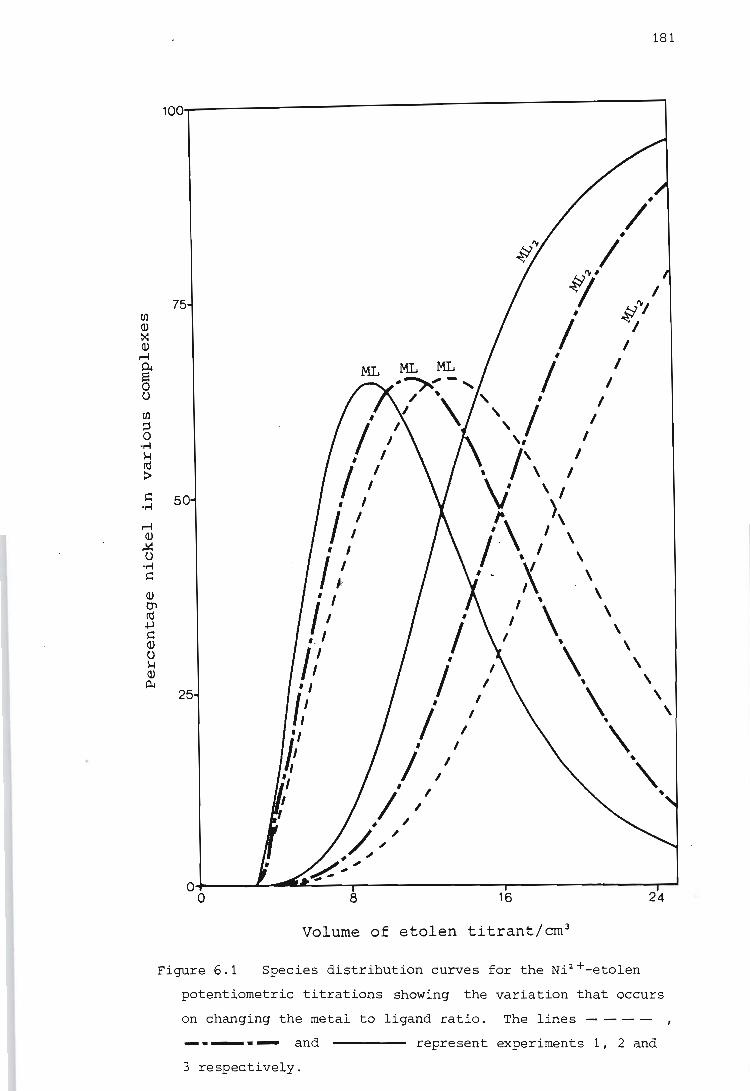
181
100~----------------------------------------1
#
/ #
/ 75
~;I# , ,I ~~,
/ " # I
}~~,~, / , /.. , I I
# II \ "/ I
/ I " I
I,' ,,' , /', " \j 'I
I, ,,' J4.), ' . \ I ,
, , / ,I \
/ : · - X \ , , ' , , /' " \ " ,. , , ,
// \. " j,/ " \. \
5
25
t ,,' ~ " " , ..
O+-----~--.w~--_r--------------_.--------------~~ o 8 16 24
Volume of etolen titrant/em3
Figure 6.1 Species distribution curves for the Ni2 +-etolen
potentiometric titrations showing the variation that occurs
on changing the metal to ligand ratio. The lines _ _ _ _ I
----- and represent experiments 1, 2 and 3 respectively.

182
7.0
5.5
....... +
::x:: ...... 0.
'0 OJ +J ~
,...; ;j u
,...; ~ U
4.0
2.5~-------~-------~----___ r--' o 8 16 24
Volume of etolen titrant/em3
Figure 6.2 Plot illustrating the sensitivity of the calculated
p[H+] to the stability constants being determined. The line
is based on the literature values of the stability
constants. The lines ----- and - - - - result when
log 6011 and log 6012 respectively are increased by one unit.
183
have the disadvantage that the heat associated with the reaction of
interest is overshadowed by the heat liberated by the formation of water.
Hence these two methods are not the best for accurate determination of
the heats of protonation.
Another consideration to bear in mind is that in this calorimetry the
titrant solution should be very much more concentrated than the titrate
solution. Hence for convenience titration method 1. (titration of acid
into a solution containing deprotonated ligand) was chosen for the deter
mination of the enthalpy changes of protonation for both etolen and oden.
Similarly method 3., the titration of deprotonated ligand into a solution
containing metal ion and protonated ligand, was chosen for the metal ion
systems involving etolen. The high cost of oden prevented its use in
concentrated ligand titrant solutions. Therefore measurements of the
heats of reaction of the various metal ions with oden were performed by
titrating a solution of metal ion into a solution containing a mixture of
ligand and protonated ligand.
As an example, the selection of the reagent concentrations for the calori
metric measurements involving Co2+ and etolen will now be described. Re
agent concentrations for the other systems were chosen similarly.
The calorimetric experiments had to be carried out under conditions simi
lar to those used for the potentiometric experiments, to ensure that the
solution equilibria were adequately described. In practice this meant
that the p[H+] and Z regions covered during the calorimetric titrations
?hould lie within those covered during the potentiometric titrations.
Hence the experiments were designed in such a way that the titrate con
tained the metal ion and some protonated ligand. The latter was included
in order to lower the p[H+] of the resulting solution. The titrant con
sisted solely of the ligand etolen made up to the correct ionic strength
with KNO~. Only one reacting species could be used in the titrant solu
tion, because of the limitation of the program LETAGROP KALLE already men
tioned in Section 6.1. In addition, the solutions had to be sufficiently
concentrated to produce an acceptable change in temperature (i.e. about
O.4°C). The required enthalpy changes were estimated from the enthalpy
changes for the Ni2+-etolen system and other systems involving, Ni2+and
Co2
+ with polyamine ligands. Table 6.2 shows the reagent concentrations
chosen. A species distribution f or these reagent concentrations was cal-
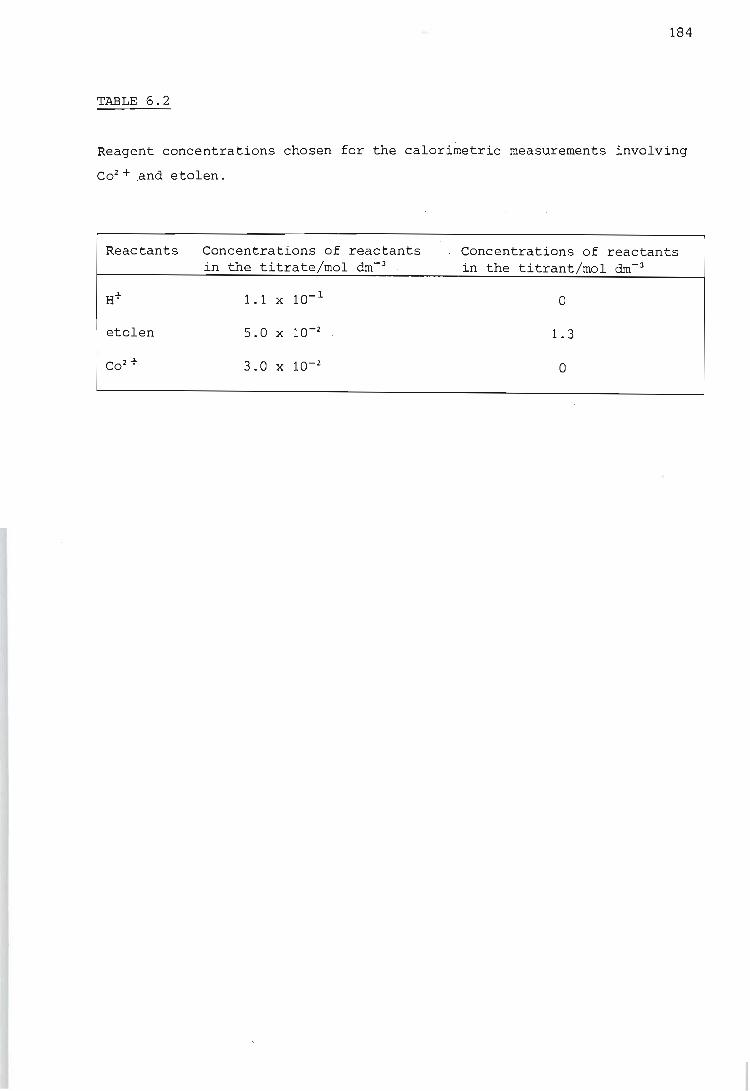
184
TABLE 6.2
Reagent concentrations chosen for the calorimetric measurements involving
Co2 + .and etolen.
Reactants Concentrations of reactants . Concentrations of reactants in the titrate/mol dm- J in the titrant/mol dm- J
H+ 1.1 X 10- 1 0
etolen 5.0 x 10⁻² 1.3
Co2 + 3.0 x 10⁻² 0
185
culated (by HALTAFALL) to ensure that the different species of interest
would predominate over roughly equal portions of the titration.
CHAPTER SEVEN
EXPERIMENTAL PROCEDURE AND DATA
This chapter describes a series of potentiometric and calorimetric
titrations performed in order to obtain the stability constants and
enthalpy changes of complex formation for each system studied. Numerical
data obtained from these experiments are included. Also reported here
are the preparations of various solid complexes and the recording of the
electronic spectra of some of these complexes. All the titrations were
carried out at an ionic strength of 0.5 mol dm- 3 with KN03 as the back
ground electrolyte and at a constant temperature of 25.00 + 0.05°C for
the potentiometry and 25.0 ~0.2°C for the calorimetry. All the solu
tions mentioned here were made up by dilution of the appropriate stock
solution or as described in Chapter 2.
In the potentiometric measurements, the whole assembly was allowed to
come to equilibrium over a period of at least 2 - 3 hours after the first
addition of calibrating titrant solution. After each subsequent addition
of titrant solution, sufficient time was allowed to ensure that the sys
tem had come to equilibrium. An equilibration period of 10 to 15
minutes was allowed for points in the low p[H+1 region, whereas for points
in the high p[H+] region 30 or more minutes were allowed. When successive
cell e.m.f. readings differed by less than 3 mV the volume of titrant
solution added was doubled.
In the calorimetric titrations the heats of reaction were measured as
follows. First the automatic burette and the titrant tubing were filled
with the titrant solution. Then 95.00 cm3 of the titrate solution were
placed in the reaction vessel. The vessel was attached to the calorimeter
assembly and the stirrer was switched on at the high stirring speed.
The capillary tube through which the titrant enters the vessel was then
filled. However, a small air gap was left to separate the titrant from
the titrate in order to avoid premature mixing of the two solutions. The
temperature of the reaction vessel and its contents was brought to
approximately 25°C, either by warming the contents of the vessel by means
of the calibration heater, or by cooling the outside of the vessel with
187
iced water. When the required temperature had been attained, the out
side surface of the reaction vessel was wiped clean with tissue paper to
ensure the reproducibility of the heat capacity of the reaction vessel.
The calorimeter assembly was clamped closed and placed in the constant
temperature water bath maintained at 25.000 +O.OOl°C.
A period of at least 45 minutes was allowed for thermal stabilisation of
the calorimeter assembly. (The stirrer was switched on to 'high' and
the thermistor switched into the Wheatstone bridge circuit throughout
these operations.) The off-balance potential was then recorded for a
period of approximately 5 minutes to obtain the lead period of the
thermogram. The automatic burette and timer were then switched on
simultaneously and again the off-balance potential was followed, to
obtain the titration curve. The titration period continued for the
length of time selected. Once this was over the trail period of the
thermogram was obtained in the same way as the lead period. The volume
of titrant solution dispensed by the automatic burette was noted.
The heats of dilution were " measured in the same way as the heats of reaction,
except that the titrate solution was replaced by the corresponding blank
titrate solution.
The operational procedure for determination of the heat capacities of
the various solutions is described in Section 5.2.3. Before each heat
capacity determination a potential difference of 1.0000 V was set across
one of the standard resistors in order to maintain the design-specified
CUl!'rent value through the heater for the power setting selected (169).
The heat capacity of each of the solutions used was measured. In each
case the vessel was filled with 95.00 cm3 of solution. During these
measurements the capillary tube through which the titrant solution enters
the reaction vessel was kept filled with the titrant solution. A small
air gap was left at the tip to prevent mixing of the solutions. The
length of time for which the calibration heater was activated was selec
ted in such a way as to yield approximately the same temperature change
as occurred during the reaction runs. At the end of each heat capacity
determination the potential difference across the calibration heater
was recorded.
188
The data collected from the potentiometric experiments are listed in
full in Table 7.1 of Section 7.9, together with the solution concentra
tions ·used. The calorimetric titration data, together with the corres
ponding solution concentrations, are presented in Table 7.2 of Section
7.9. Unless otherwise stated, the calorimetric data have been corrected
for non-chemical heat effects by the method described in Section 4.2.
7.1. The hydrogen ion - etolen system
The protonation constants for etolen wer2 determined potentiometrically
by the addition of a titrant solution containing ligand to a titrate
solution containing acid. First the cell was calibrated by using a
strong acid, as described in Section 5.1.1. ~
Deviations of the E " values
from constancy could usually be traced to contamination of the apparatus.
The addition of acid was discontinued at a p[H+] of 2.7. After the deter
mination of E~" a solution of the ligand was added in small increments.
After each addition the system was allowed to corne to equilibrium and the
cell e.m.f. noted. The experiment was carried out in triplicate.
The calorimetric titrations for the determination of the heats of proto
nation of etolen were carried out by the addition of a 0.5 mol dm- J
nitric acid solution to a solution containing 0.01 mol dm- J etolen. The
specific heat capacities of the titrant, titrate and blank titrate were
measured in duplicate, as was the heat of dilution of the titrant into
the blank titrate. The heat of reaction for addition of the titrant to
the titrate was measured in triplicate.
7.2. The hydrogen ion - oden system
The potentiometric titrations for this system were carried out by the
addition of a titrant solution containing hydroxide to a titrate solution
containing oden.2HCl. In these titrations the cell was calibrated by
using strong acid and strong base. A solution of 0.01 mol dm- J HN03
was
added in small increments to a mixture of 50.00 cmJ of 0.50 mol dm- J
KNOJ and 5.00 cmJ of the NaOH solution later to be used as the titrant.
The concentrations of hydroxide and carbonate, as well as the constants
E"O''' and s, were calculated from the cell potential readings as described
in Section 5.1.2. Once the cell had been calibrated, a 10.00 cmJ aliquot
189
of a solution of oden.2HCt was pipetted into the reaction mixture.
This was then titrated with the solution of NaOH, whose concentration
had been determined in the first part of the experiment. The experiment
was carried out in quadruplicate. (Note that in Table 7.1 each titra-
tion is split into two parts: (a) and (b). 'This was done because the
carbonate present in the hydroxide solution was taken into account only
at p[H+] values greater than 10. At p[H+] values below 10 the total
base concentration is used. See Section 8.2.)
The heats of protonation for oden were determined by the addition of a
titrant solution containing acid to a titrate solution containing oden.
The heat capacity of each of the solutions used, the heat of dilution
and the heat of reaction were all measured in duplicate.
7.3. The nickel ion - etolen system
Some of the potentiometric titrations for this system (titrations 1 - 3)
were performed by starting with the complex ion in solution and stripping
the ligand off the metal ion with acid. In these titrations the poten
tiometric cell was calibrated with strong acid alone, as described in
Section 5.1.1. The addition of acid was discontinued at a p[H+] of 2.7.
Once Ee
" had been determined, appropriate aliquots of Ni 2 + and deproto
nated ligand solutions were added to the reaction mixture in order to
obtain the required initial metal to ligand ratio. This mixture was then
titrated with a solution of HNOl and Ni2 + (the latter to keep the total
metal ion concentration constant) in order to strip the ligand off the
metal ion.
In the rest of the titrations (nos. 4 - 7) the cell was calibrated with
strong acid and ligand, as described in Section 5.1.3. Once the cell
had been calibrated and metal ion added, a titrant solution containing
ligand was added to the reaction mixture. At the completion of the
calibration the reaction mixture in these titrations was approximately
0.01 mol dm- l in doubly protonated ligand. This helped to lower the
working p[H+J,and possibly to suppress hydrolysis of the metal-ligand
complexes.
In the first three titrations the total concentration of Niz + was kept
constant. In the rest of the titrations, however, neither the total

190
concentration of Ni 2 + nor that of etolen was kept constant. In titrations
2 and 3 the reversibility of the equilibria was tested by performing
both forward (decreasing p[H+J) and reverse (increasing p[H+J) titrations.
(The titrations were reversed by titrating the reaction mixture with a
solution of NaOH.) One titration (no. 4) was carried out in duplicate
in order to check the reproducibility of the results obtained. The
repeat titration is no. 7. The total initial concentrations of Ni 2 + and
etolen were varied within the limits 5.0 x 10⁻⁴ ~ [Ni 2 +J o ~ 3.3 x 10- 3
mol dm- 3 and 4.2 x 10⁻³ ~ [etolenJ o ~ 1.1 x 10⁻² mol dm- 3• The following
initial metal to ligand ratios were studied: 1:2.2, 1:3.1, 1: 3.6,
1:4.1, 1:4.5, 1:6.1, 1:8.5 and 1:11.1.
The calorimetric titrations involving etolen and Ni2 + were designed so that
a titrant solution containing ligand was added to a titrate solution con
taining metal ion, some doubly protonated ligand and some surplus acid.
In this way approximately 30 % of the background electrolyte was replaced
by the nitrate salt of the doubly protonated ligand, which lowered the
p[H+] and suppressed hydrolysis of the metal-ligand complexes. For this
system all the calorimetric measurements were carried out in triplicate.
The raw calorimetric data were processed as described in Section 4.2, apart
from two modifications.
First, the heat of dilution of the titrant into the titrate for this
system was not calculated in exactly the way previously described. This
was because the heat liberated during the determination was due not only
to dilution of the titrant, but also to some reaction between the ligand
titrant solution and the excess acid which was present in the titrate
solution. The heat of dilution was therefore calculated as follows.
First the raw data from the heat of dilution titrations were corrected
for non-chemical heat effects by using CALCOR. The calorimetric data
obtained (i.e. VT,~Qc,k pairs) were then corrected for ligand protonation
by using LETAGROP KALLE. This program was supplied with the concentrations
of each of the components, the protonation constants and the heats of
protonation of the ligand, and the calorimetric data. The first set of
output from LETAGROP KALLE gives the differences between the heat observed
and the heat calculated on the basis of the concentrations and enthalpy
changes provided. These differences, which are the heats arising from
the dilution process, were used to calculate ED' the heat of dilution,
191
by the same method as before.
The second modification was made as follows. The titrate solution used
in the heat of reaction experiments contained excess acid to ensure that
the ligand forming part of the background electrolyte was completely
protonated. However this meant that at the beginning of each titration
there was an end-point, i.e. this excess acid protonated the ligand added
from the titrant. This is not desirable since it introduces errors into
the LETAGROP KALLE calculations. Hence the concentrations of the compo
nents in the titrate were modified to include the volume of titrant
added up to just after the end-point. The heat liberated from the begin
ning of the titration up to this point was disregarded. This modification
was carried out only after the heats had been corrected for non-chemical
heat effects by using CALCOR.
The calorimetric data for this system listed in Table 7.2 reflect these
modifications.
7.4. The nickel ion - oden system
Some of the potentiometric titrations for this system (nos. 1 - 3) were
carried out by adding a titrant solution containing hydroxide to a titrate
containing Ni2 + and oden.2HCl. In these titrations the potentiometric
cell was calibrated with strong acid and strong base, as described in
Sections 5.1.2 and 7.2. (In these calibrations the HN0 3 concentration
was 0.02 mol dm-3 and the NaOH concentration was 0.04 mol dm- 3 .)
In the remainder of the titrations (nos. 4 - ·7) a titrant solution
containing ligand was added to a reaction mixture containing Ni 2 +, doubly
protonated ligand and surplus acid. In these titrations the cell was
calibrated with strong acid and ligand. At the completion of the calibra
tion the reaction mixture in these titrations was approximately 0.01 mol
dm-3
in doubly protonated ligand, except in titration no. 6, where the
concentration was approximately 6.7 x 10⁻³ mol dm- 3 • Once the cell had
been calibrated, an appropriate aliquot of the metal ion solution was
added and the titration commenced.
192
In titration 1 the total concentration of Ni2 + was kept constant at
1.0 x 10- 3 mol dm-3 • In the rest of the titrations neither the metal ion
concentration nor that of the ligand was kept constant. In the first
titration the reversibility of the reactions was tested by performing a
reverse titration (decreasing p[H+J) once the forward titration had been
completed. This was achieved by adding a titrant solution containing
hydrogen ion. One titration (no. 4) was carried out in duplicate in
order to check the reproducibility of the results obtained. The repeat
titration was no. 7. The initial concentrations of Ni 2 + and oden were
varied within the limits 5.0 x 10- 4 ~ [Ni2 +J o ~ 5.0 x 10- 3 mol dm- J and
1.7 x 10⁻³ ~ [odenJ o ~ 1.0 x 10⁻² mol dm- 3• The following initial metal
to ligand ratios were studied: 1:1.7, 1:2.0, 1: 2.2, 1:4.0, 1:4.5,
1:6.0 and 1:9.0.
The high cost of oden prevented the use of concentrated ligand solutions
in the calorimetric titrations. These titrations were therefore performed
by titrating a solution of the metal ion into a solution containing a
mixture of ligand and protonated ligand. The heat capacities of the solu
tions and the heat of dilution were determined in triplicate. The heat
of reaction titration was carried out in quadruplicate.
When the calorimetric experiments for this system were first carried out,
a solution of the metal ion (0.1667 mol dm- 3) was titrated into a dilute
solution of the deprotonated ligand (0.0083 mol dm- 3) made up to the
correct ionic strength with KNO l • When the first heat of reaction titra
tion was carried out, a turquoise-coloured precipitate formed. Three
options were open to overcome th~s problem:
1. addition of a known quantity of protonated ligand to the titrate
in order to lower the p[H+l;
2. reduction of the ligand concentration in the titrate; and
3. reduction of the reacti on time.
At the time option 1. was not feasible, as no further quantities of ligand
were available. (However this option was subsequently adopted. By the
replacement of some of the background electrolyte with protonated ligand

193
it was possible to lower the p[H+] sufficiently so that the h~ats of
reaction could be measured successfully with the total avoidance of any
precipitation.) The second option was not feasible because, if the
ligand concentration had been reduced further, insufficient heat would
have been liberated for an accurate determination of the heats of
complexation with the titration calorimeter available. Reduction of the
reaction time would avoid the formation of a precipitate, since it was
ascertained that precipitation occurred towards the end of the titration.
This option would however reduce the amount of information obtainable,
especially in respect of the ML complex, which formed towards the end of
the titration. Although this option was tried, it never completely
succeeded in avoiding the precipitation problem. Hence these titrations
were abandoned and subsequently repeated as already described.
7.5. The cobalt ion - etolen system
Two potentiometric titrations (nos. 1 and 2) were performed in which a
titrant solution containing hydroxide was added to a titrate solution
containing Co2 + .and etolen.H~+. In these two titrations the cell was
calibrated with strong acid and . strong base. (In these calibrations a
10.00 cm3 aliquot of approximately 0.023 mol dm-3 NaOH was titrated with
0.02 _mol dm- 3 HN03 .) Once the calibration of the cell was completed,
appropriate aliquots of solutions containing Co2 +, etolen and HN03
were
placed in the vessel and titrated with a titrant solution containing
hydroxide.
The rest of the titrations (nos. 3 - 9) involved the use of protonated
ligand as part of the background electrolyte, and calibration of the cell
with strong acid and ligand. The reaction mixture was approximately
0.024 or 0.05 mol dm- 3 in doubly protonated ligand at the start of the
titration, i.e. after completion of the cell calibration. Depending on
the initial concentration of Co 2 + desired, an appropriate aliquot of a
solution containing C02 + was added to the mixture in the reaction vessel,
and this was then titrated with a solution containing etolen.
In all these titrations neither the metal ion concentration nor that of
the ligand was kept constant. The initial concentrations of C02 + and
etolen were varied within the limits 5.0 x 10- 4 ~ [C02.+]o ~1.4 X 10⁻²
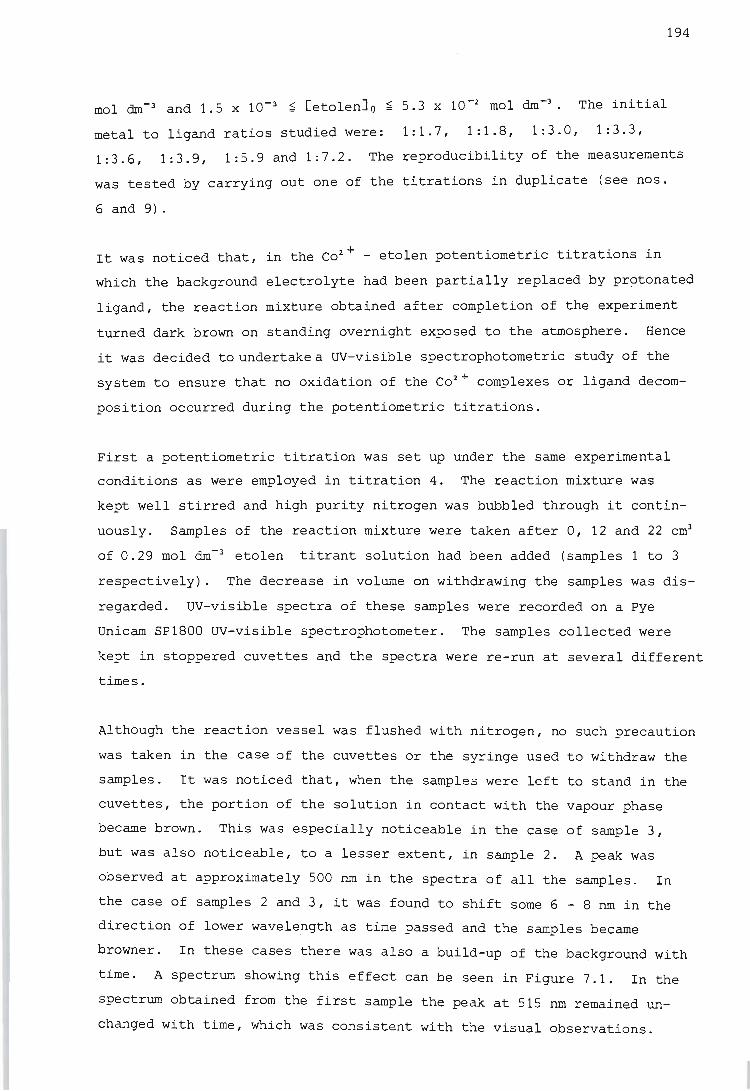
194
mol dm- 3 and 1.5 x 10⁻³ ~ [etolenJ o ~ 5.3 x 10⁻² mol dm-3• The initial
metal to ligand ratios studied were: 1:1.7, 1:1.8, 1:3.0, 1:3.3,
1:3.6, 1:3.9, 1:5.9 and 1:7.2. The reproducibility of the measurements
was tested by carrying out one of the titrations in duplicate (see nos.
6 and 9).
It was noticed that, in the Co 2 + - etolen potentiometric titrations in
which the background electrolyte had been partially replaced by protonated
ligand, the reaction mixture obtained after completion of the experiment
turned dark brown on standing overnight exposed to the atmosphere. Hence
it was decided to undertake a UV-visible spectrophotometric study of the
system to ensure that no oxidation of the Co2 + complexes or ligand decom
position occurred during the potentiometric titrations.
First a potentiometric titration was set up under the same experimental
conditions as were employed in titration 4. The reaction mixture was
kept well stirred and high purity nitrogen was bubbled through it contin
uously. Samples of the reaction mixture were taken after 0, 12 and 22 cm3
of 0.29 mol dm- 3 etolen titrant solution had been added (samples 1 to 3
respectively). The decrease in volume on withdrawing the samples was dis
regarded. UV-visible spectra of these samples were recorded on a pye
Unicam SP1800 UV-visible spectrophotometer. The samples collected were
kept in stoppered cuvettes and the spectra were re-run at several different
times.
Although the reaction vessel was flushed with nitrogen, no such precaution
was taken in the case of the cuvettes or the syringe used to withdraw the
samples. It was noticed that, when the samples were left to stand in the
cuvettes, the portion of the solution in contact with the vapour phase
became brown. This was especially noticeable in the case of sample 3,
but was also noticeable, to a lesser extent, in sample 2. A peak was
observed at approximately 500 nm in the spectra of all the samples. In
the case of samples 2 and 3, it was found to shift some 6 - 8 nm in the
direction of lower wavelength as time passed and the samples became
browner. In these cases there was also a build-up of the background with
time. A spectrum showing this effect can be seen in Figure 7.1. In the
spectrum obtained from the first sample the peak at 515 nm remained un
changed with time, which was consistent with the visual observations.
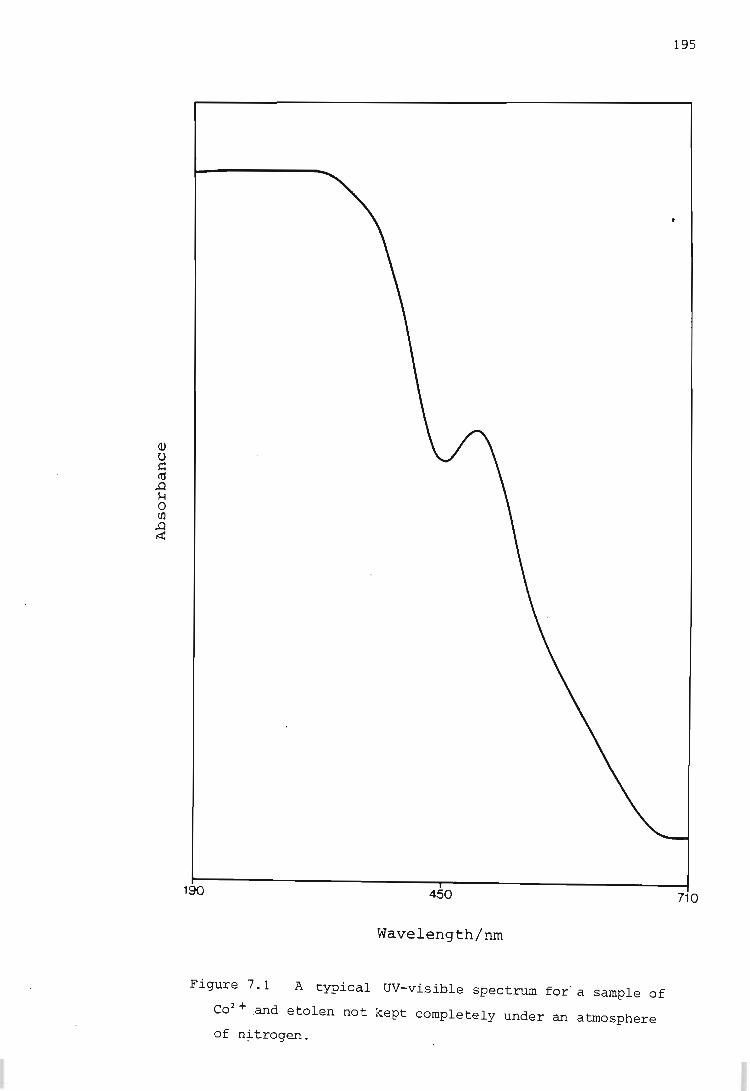
190 450
Wavelength/nm
Figure 7.1 A typical UV-visible spectrum for" a sample of
Co2
+ .and etolen not kept completely under an atmosphere
of n~trogen.
195
710
196
This experiment thus indicated that oxidation of the Co-etolen complexes
occurred when the samples were in contact with air. It still remained to
be seen whether or not oxidation or decomposition occurred when the
reaction mixture was kept under an atmosphere of nitrogen. Hence the
experiment was repeated, but this time the cuvettes and syringe were
flushed out with nitrogen beforehand. The sample was placed in the cuvette
in such a way that no vapour space remained, and nitrogen was flushed over
the solution before the cuvette was stoppered.
Three potentiometric titration vessels were set up. In each of these was
placed the same titrate solution as was used for titration 4. No titrant
was added to the first vessel, but 12.5 and 25.0 cm3 of 0.29 mol dm-3
etolen titrant solution were added to the others (2.2 and 4.4 moles
etolen to 1 mole CoL+respectively). One sample was taken from each of
the three vessels in the manner described and UV-visible spectra were
recorded at hourly intervals for a total of five hours. The spectra
obtained from these samples remained unchanged with time. A typical
spectrum is shown in Figure 7.2. A fourth potentiometric titration vessel
was set up containing the same titrate solution. In this experiment a
mock titration was performed and samples were taken at hourly intervals.
The purpose of this experiment was to see whether decomposition occurred
under the conditions prevailing during an actual titration. The spectra
obtained at various stages during the experiment compared well with the
corresponding spectra obtained in the three experiments described above.
Hence it was concluded that no significant oxidation or decomposition
occurred during the course of the titration, provided that the reaction
mixture was kept under an atmosphere of nitrogen.
The calorimetric titrations involving etolen and Co2 + were performed in
much the same way as those for the Ni 2 + - etolen system. The only difference
was that a higher cobalt ion concentration was used because it was anti-~
cipated that the values of ~H would be lower for this system than for Ni 2 +
and etolen. All the calorimetric measurements were carried out in trip
licate. The data were corrected as described in the case of Ni 2 + and
etolen.
Because the calorimeter reaction ve s sel is not equipped with a nitrogen
inlet, there was some doubt as to whether the Co2 + - etolen system,
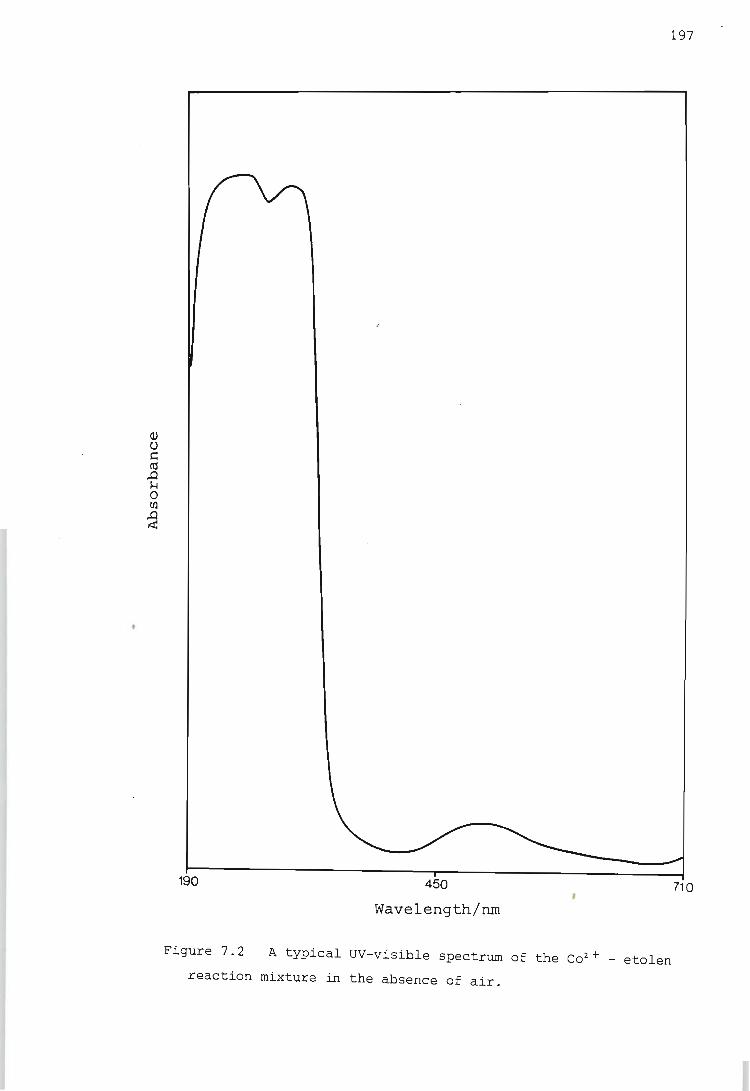
190 450
Wavelength/run
197
710
Figure 7.2 A typical UV-visible spectrum of the Co2 + - etolen
reaction mixture in the absence of air.
198
which oxidises easily, could be studied calorimetrically. Hence a mock
calorimetric run was performed to ascertain whether oxidation occurred
even if the titrate solution was flushed out with nitrogen before the
start of the titration.
The mock titration was carried out as follows. The calorimeter reaction
vessel was filled with 95.00 cm3 of the titrate solution. The titrate
solution was not kept under an atmosphere of nitrogen at this stage,
because it had been observed in the previous UV-visible study that, when
the ligand is in a protonated state, no oxidation occurs. The stirrer
shaft and stirrer were then removed from the calorimeter and the reaction
vessel attached. A nitrogen inlet tube was inserted in the space left
by the stirrer shaft and the vapour space above the titrate solution in
the reaction vessel was flushed out with nitrogen. As soon as the nitro
gen inlet had been removed, the stirrer shaft and stirrer were screwed
into place. After the solution had been left for approximately one hour
to simulate equilibration, the titration was performed. Fiveminutes
after completion of the titration a sample of the solution in the reaction
vessel was withdrawn with a syringe flushed out with nitrogen. The
sample was withdrawn by undoing the vessel's burette tube from the burette,
attaching, a piece of heat shrink tubing to the syringe in place of a
needle, and inserting one tube into the other.
When the first sample was withdrawn, the air in the burette tube and
syringe oxidised the top part of the sample solution. This sample was
forced back into the vessel and so diluted, as the solution in the reac
tion vessel was stirred continuously. A fresh sample was then withdrawn
and placed in a cuvette previously flushed out with nitrogen, and the
cuvette was stoppered.
A UV-visible spectrum of the reaction mixture was recorded, but it was
difficult to ascertain, by comparison with the previous spectra, whether
oxidation had occurred. It was decided to repeat the calorimetrictitra
tion under conditions in which there was certainty that no oxidation
occurred, i.e. repeat it in a potentiometric titration vessel flushed
out with nitrogen. From a comparison of the spectra obtained, it appeared
that if oxidation did occur during the calorimetric titration it was
slight and did not progress with time. If was felt that this small degree
199
of oxidation (if any) would introduce negligible error into the calorimetric
measurements. Furthermore there was no evidence of any continuing reac
tion at the end of any of these titrations. That is, no further heat was
absorbed or liberated, which would have happened if continuous oxidation
were taking place.
Accordingly, it was concluded that the enthalpy changes for this system
could be determined calorimetrically.
7.6. The cobalt ion - oden system
For this system some of the potentiometric titrations (nos. 1 - 4) invol
ved the addition of a titrant solution containing hydroxide to a titrate
containing Co2 + and oden.2HCt. In these titrations the cell calibration
constants were obtained by using strong acid and strong base. After the
cell had been calibrated, appropriate aliquots of solutions of Co2 + and
oden.2HCt were placed in the vessel to achieve the desired metal to ligand
ratio. This mixture was then titrated with a titrant solution containing
hydroxide. In "titrations 1 and 2 a precipitate formed before a significant
concentration range had been covered. Hence in the subsequent titrations
performed in this manner (nos. 3 and 4) a more dilute hydroxide titrant
solution was used. However this meant that a smaller range of p[H+J was
covered than originally intended.
The remainder of the potentiometric titrations for this system (nos. 5 -
8) were performed in the same manner as titrations 4 - 7 for the Ni2 + -
oden system (see Section 7.4). The presence of some protonated ligand
in the background electrolyte helped to lower the p[H+] sufficiently
to avoid any further precipitation problems.
The concentrations of Co2 +and oden were not kept constant during any of
these eight titrations. The initial metal to ligand ratios studied were:
1:2.0, 1:2.2, 1:4.0, 1:4.5, 1:6.0 and 1:9.0. The initial concentrations
of Co2 + and oden were varied within the limits 5.0 x 10- 4 ~ [Co2 +]o ~ 5.0 x 10⁻³
mol dm-3 and 2.2 x 10⁻³ ~ [odenJ o ~ 1.0 x 10⁻² mol dm- 3 • One titration
(no. 5) was carried out in duplicate in order to check the reproducibility
of the results obtained. "The repeat titration was no. 8.
200
The calorimetric titrations for this system were performed in the same
manner as those for the Niz + - oden system. The heat capacities of the
solutions and the heat of dilution were measured in triplicate. The heat
of reaction titration was carried out in quadruplicate.
The first time the calorimetric measurements for this system were carried
out, a 0.1667 mol dm- 3 Coz + solution was titrated into a 0.0083 mol dm- 3
oden solution. When the first titration was performed, an olive-green
precipitate formed. On reduction of the quantity of titrant added a pink
precipitate formed. Attempts were then made to find concentration condi
tions that would obviate precipitation, but without replacement of any
background electrolyte by protonated ligand. It was found that precipi
tates formed under all the concentration conditions suitable for calori
metric measurements. It was thought that the size of the anion possibly
had some influence on the incidence of precipitation. Experiments were
performed with CoCiz instead of Co(N03 )z, but precipitates formed as before.
Once again the use of protonated ligand as part of the background electro
lyte succeeded in overcoming this problem.
7.7. The zinc ion - etolen system
All the potentiometric titrations carried out for this system involved the
use of protonated ligand as part of the background electrolyte. The poten
tiometric cell was calibrated by using strong acid and ligand. At the
completion of the calibration the reaction mixture in these titrations
was approximately either 0.01 or 0.02 mol dm- 3 in doubly protonated ligand.
The titrations were then carried out by titrating a titrant solution con-
taining ligand into a reaction mixture containing Zn2 +, doubly protonated
ligand and surplus acid .
The initial concentrations of Zn2 + and etolen were varied within the limits
1.7 x 10- 3 ~ [Zn2 +J o ~ 1.0 x 10⁻² mol dm~ and 1.0 x 10⁻²~ [etolenJ o ~
2.1 x 10⁻² mol dm~. The following initial metal to ligand ratios were
studied: 1:2.0, 1:4.0 and 1:6.0. The reproducibility of the results was'
checked by performing one titration (no . 2) in duplicate (repeat titration:
no. 6).
The calorimetric titrations were carried out by titrating a titrant
solution containing ligand into a titrate containing metal ion, some doubly
201
protonated ligand and some surplus acid. For this system all the calo
rimetric measurements were carried out in quadruplicate. The calorimetric
data were treated as described in the c,ase of Ni2 + and etolen.
7.8. The zinc ion - oden system
This system was not studied experimentally as both the stability constants
and the enthalpy changes of complex formation had previously been reported
(78) .
7.9. Experimental Data
The pot:entiometric titration data collected in this work are presented in
Table 7.1 and the corrected titration calorimetric data in Table 7.2.
In both of these tables the descriptions of the titrations performed
begin with a listing of the concentrations of the components in the titrate
solution (denoted [ J o) and titrant solution (denoted [JT) , and the initial
volume (Va) of the titrate solution. The concentration of the background
electrolyte has been omitted for simplicity. For the potentiometric
titration data, i.e. Table 7.1, the cell calibration constants (E~II and s)
have also been included.
In Table 7.1 the description of the solutions is followed by a listing
of the volume and cell e.m.f. data and several derived quantities, for
each point in the titration under discussion. For the protonation titra
tions, i.e. systems 1 and 2, the data are given as groups of four numbers,
viz. (in order): volume of titrant solution added/ cm3, cell e.m.f./mV,
-log{[H+l/mol dm-J}, and j. For the metal ion - complexation titrations
involving one titrant the data listed are: volume of titrant solution
added/ cm3, cell e.m.f. / mV, -log{[H+l/ mol dm- 3
}, log{[LJ / mol dm- 3 }, and
z. For those titrations involving more than one titrant, these are
referred to as titrant A and titrant B. The data for such titrations
are given as: volume of titrant solution A added/ cm3 , volume of titrant
solution B added/cm3, cell e.m.f. /mV, -log{[H+J / mol , dm- 3 }, log{[LJ / mol dm- 3 },
and Z.
In Table 7. 2 the solution descripti on is followed by pairs of numbers, the
first being the total volume (in cm3) of titrant solution added up to

that point, and the second being the corrected incremental heat (in J) .
A minus sign in the second position indicates liberation of heat.
202

203
TABLE 7.1
Potentiometric titration data for the various systems. (Those points
marked with an asterisk were not used in the calculation of stability con
stants. )
1. System: H+ + etolen
Titration No.1
e-E " = 255.13 mV, s = 59.158 mV,
[H+]o = 1.667 x 10⁻³ mol dm- 3 , [etolenJ o = 0,
[H+]T = 0, [etolenJT = 1.009 X 10⁻² mol dm- 3 ,
Va = 60.00 cm3•
* 1.00
* 2.00
* 3.00
* 4.00
5.00
6.00
7.00
8.00
9.00
10.00
11.00
12.00
13.00
14.00
15.00
16.00
17.00
19.00
21.00
23.00
25.00
84.7
76.6
64.9
44.2
-75.8
-135.2
-159.3
-180.4
-205.6
-240.0
-263.7
-277.0
-285.7
-291.8
-296.8
-301. 0
-304.3
-309.8
-314.4
-317.9
-321.1
2.881
3.018
3.216
3.566
5.594
6.598
7.006
7.362
7.788
8.370
8.770
8.995
9.142
9.245
9.330
9.401
9.457
9.550
9.627
9.687
9.741
1.961
2.008
2.038
2.048
1.980
1.652
1.417
1.240
1.103
0.995
0.908
0.837
0.777
0.725
0.680
0.641
0.607
0.548
0.502
0.463
0.430
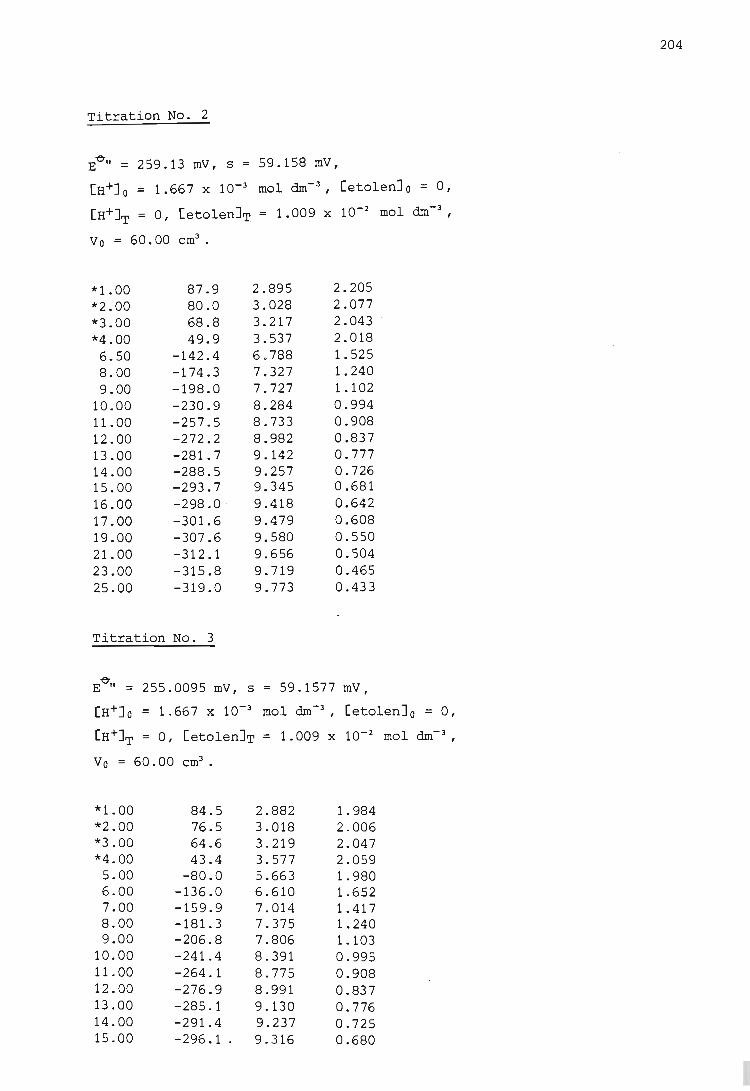
Titration No.2
E~" = 259.13 mV, 5 = 59.158 mV,
[H+la = 1.667 x 10⁻³ mol dm-3, [etolenJ a = 0,
[ +] [ ] 1 009 10-2 mol dm-3 , -H T = 0, etolen T =. x
Va = 60.00 em3•
*1.00 *2.00 *3.00 *4.00
6.50 8.00 9.00
10.00 11.00 12.00 13.00 14.00 15.00 16.00 17.00 19.00 21.00 23.00 25.00
87.9 80.0 68.8 49.9
-142.4 -174.3 -198.0 -230.9 -257.5 -272.2 -281.7 -288.5 -293.7 -298.0 --301. 6 -307.6 -312.1 -315.8 -319.0
Titration No.3
2.895 3.028 3.217 3.537 6 . 788 7.327 7.727 8.284 8.733 8.982 9.142 9.257 9.345 9.418 9.479 9.580 9.656 9.719 9.773
2.205 2.077 2.043 2.018 1.525 1.240 1.102 0.994 0.908 0.837 0.777 0.726 0.681 0.642 0.608 0.550 0.504 0.465 0.433
E~" = 255.0095 mV, 5 = 59.1577 mV,
[H+]a = 1.667 x 10⁻³ mol dm- 3, [etolen]a = 0,
[H+]T = 0, [etolen]T = 1.009 x 10⁻² mol dm- 3 ,
Va = 60.00 em3•
*1.00 *2.00 *3.00 *4.00 5.00 6.00 7.00 8.00 9.00
10.00 11.00 12.00 13 .00 14.00 15.00
84.5 76.5 64.6 43.4
-80.0 -136.0 -159.9 -181.3 -206.8 -241. 4 -264.1 -276.9 -285.1 -291.4 -296.1 .
2.882 3.018 3.219 3.577 5.663 6.610 7.014 7.375 7.806 8.391 8.775 8.991 9.130 9.237 9.316
1.984 2.006 2.047 2.059 1.980 1.652 1.417 1 . 240 1.103 0.995 0.908 0.837 0.776 0.725 0.680
204
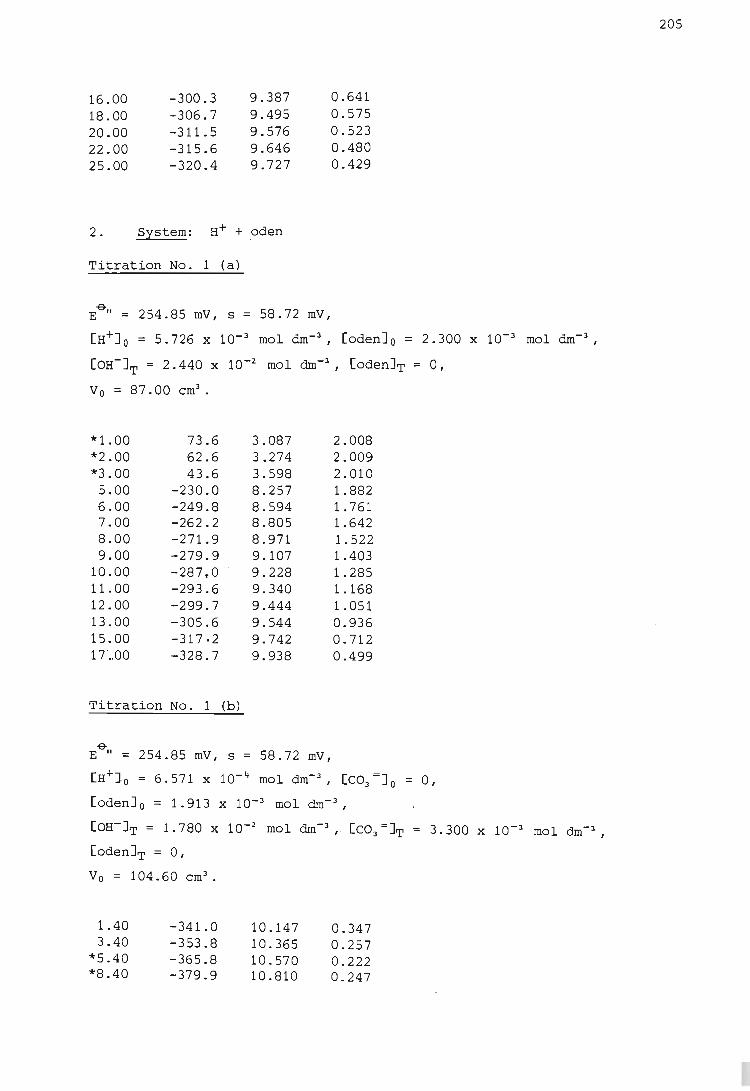
16.00 -300.3 9.387 0.641 18.00 -306.7 9.495 0.575 20.00 -311.5 9.576 0.523 22.00 -315.6 9.646 0.480 25.00 -320.4 9.727 0.429
2. System: H+ + oden
Titration No. 1 (a)
B-E " = 254.85 mV, s = 58.72 mV,
[H+lo = 5.726 X 10⁻³ mol dm- 3, Coden] o. = 2.300 X 10⁻³ mol dm- 3
,
[OH-]T = 2.440 X 10⁻² mol dm- 3 , . [oden]T = 0,
Vo = 87.00 em3•
*1.00 73.6 3.087 2.008 *2.00 62.6 3.274 2.009 *3.00 43.6 3.598 2.010 5.00 -230.0 8.257 1.882 6.00 -249.8 8.594 1.761 7.00 -262.2 8.805 1.642 8.00 -271.9 8.971 1.522 9.00 -279.9 9.107 1.403
10.00 -287.0 9.228 1.285 11.00 -293.6 9.340 1.168 12.00 -299.7 9.444 1.051 13.00 -305.6 9.544 0.936 15.00 -317·2 9.742 0.712 17 · .. 00 -328.7 9.938 0.499
Titration No. 1 (b)
B-E " = 254.85 mV, s = 58.72 mV,
[odenJ o = 1.913 x 10⁻³ mol dm- 3 ,
[OH-JT = 1.780 x 10⁻² mol dm- 3 , [C03
=JT [odenJT = 0,
Va = 104.60 em3•
1.40 3.40
*5.40 *8.40
-341. 0 -353.8 -365.8 -379.9
10.147 10.365 10.570 10.810
0.347 0.257 0.222 0.247
3.300 X 10⁻³ mol dm- 3 ,
205
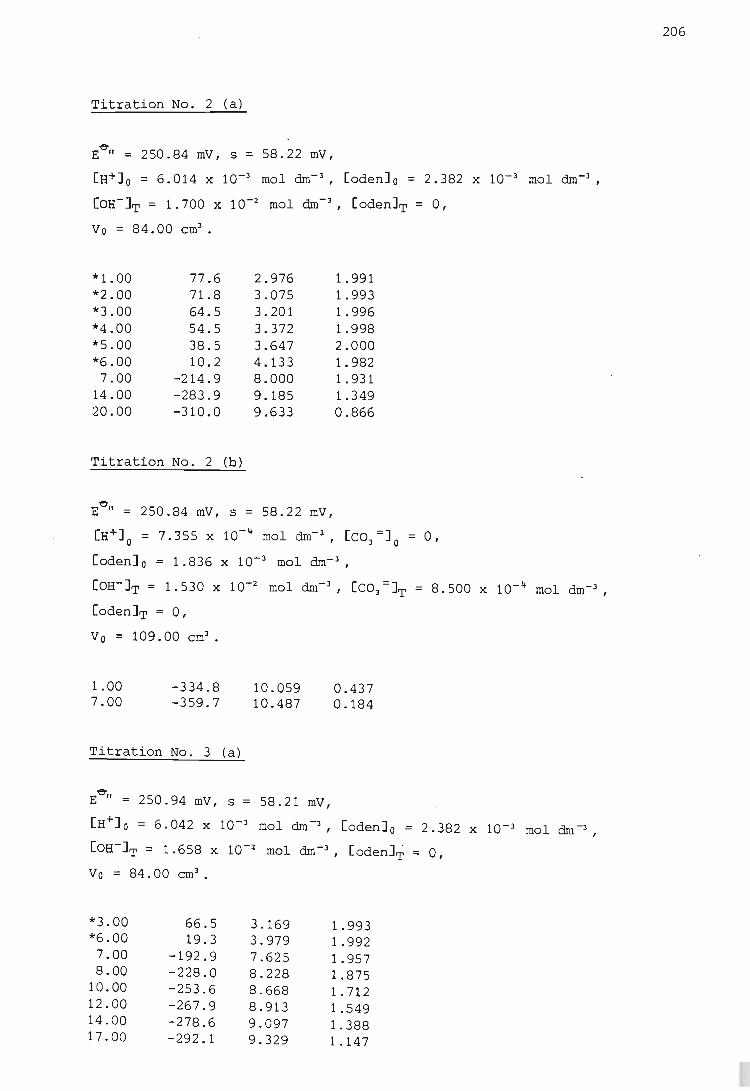
Titration No. 2 (a)
¢ E " = 250.84 mV, s = 58.22 mV,
[H+]o = 6.014 x 10⁻³ mol dm- 3, [oden]o = 2.382 x 10⁻³ mol dm-3
,
[OH-]T = 1.700 x 10⁻² mol dm- 3, [oden]T = 0,
Vo = 84.00 em3•
*1.00 77 .6 2.976 1.991 *2.00 71.8 3.075 1.993 *3.00 64.5 3.201 1.996 *4.00 54.5 3.372 1.998 *5.00 38.5 3.647 2.000 *6.00 10.2 4.133 1.982
7.00 -214.9 8.000 1.931 14.00 -283.9 9.185 1.349 20.00 -310.0 9.633 0.866
Titration No. 2 (b)
¢ E " = 250.84 mV, s = 58.22 mV,
[H+]o = 7.355 x 10- 4 mol dm'-3, [C03 =]0 = 0,
[oden]o = 1.836 x 10⁻³ mol dm- J,
[OH-]T = 1. 530 X 10-2 mol dm- l , [COl =]T
[oden]T = 0,
Vo = 109.00 em3•
1.00 7.00
-334.8 -359.7
Titration No. 3 (a)
10.059 10.487
"0-E " = 250.94 mV, s = 58.21 mV,
0.437 0.184
8.500 X 10⁻⁴ mol dm-l ,
[H+]O = 6.042 x 10⁻³ mol dm-J, [oden]o = 2.382 x 10⁻³ mol dm-J ,
[OH-]T = 1.658 x 10⁻² mol dm-J , [oden]T = 0,
Vo = 84.00 em3•
*3.00 66.5 3.169 1.993 *6.00 19.3 3.979 1.992 7.00 -192.9 7.625 1.957 8.00 -228.0 8.228 1.875
10.00 -253.6 8.668 1.712 12.00 -267.9 8.913 1.549 14.00 -278.6 9.097 1.388 17.00 -292.1 9.329 1.147
206
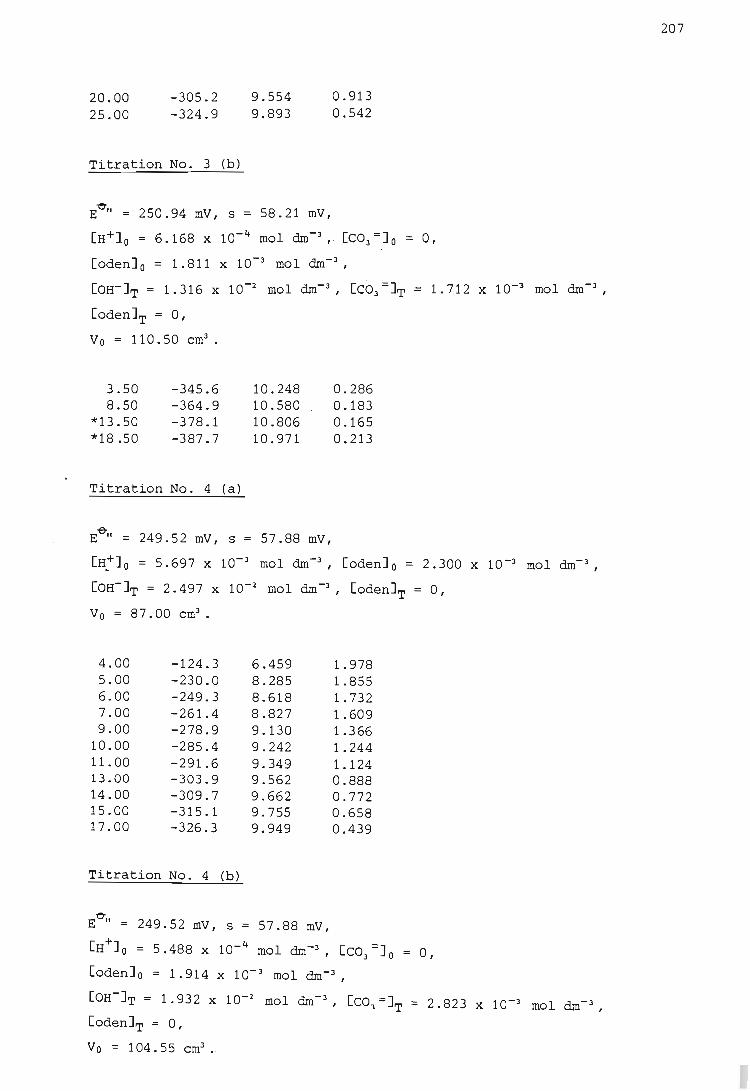
20.00 25.00
-305.2 -324.9
Titration No. 3 (b)
9 . 554 9.893
e E " = 250.94 mV, s = 58.21 mV,
0.913 0.542
[H+J.o = 6.168 X 10- 4 mol dm-3 , . [C03 =J 0 == 0,
[odenJ o = 1.811 x 10⁻³ mol dm-3 ,
[OH-JT = 1.316 x 10⁻² mol dm-3 , [C03==JT == 1.712 x 10⁻³ mol dm-3 ,
[odenJT = 0,
Vo == 11 0.50 em3 .
3 . 50 8 . 50
*13.50 *18.50
-345.6 -364.9 -378.1 -387.7
Titration No. 4 (a)
10.248 10.580 10.806 10.971
-& E " = 249.52 mV, s = 57.88 mV,
0.286 0.183 0.165 0.213
[H+J = 5.697 x 10⁻³ mol dm-3 , [odenJ o = 2.300 x 10~3 mol dm- 3 , _ 0
[OH-JT = 2.497 x 10⁻² mol dm-3 , [odenJT ::: 0,
v 0 == 87.00 em3 .
4.00 -124.3 6.459 1.978 5.00 -230.0 8.285 1.855 6.00 -249.3 8.618 1.732 7.00 -261.4 8.827 1.609 9.00 -278.9 9.130 1.366
10.00 -285.4 9.242 1.244 11.00 -291.6 9.349 1.124 13.00 -303.9 9.562 0.888 14.00 -309.7 9.662 0.772 15.00 -315.1 9.755 0.658 17.00 . -326.3 9.949 0.439
Titration No. 4 (b)
Ee
" = 249.52 mV, s = 57.88 mV,
[H+J o 5.488 x 10- 4 mol dm-3 , [C03 :::J o ::: 0,
[odenJ o ::: 1.914 X 10⁻³ mol dm-3 ,
[OH-JT = 1.932 x 10⁻² mol dm- 3 , [C03=JT ::; 2.823 x 10⁻³ mol dm-3 ,
[odenJT ::: 0,
V 0 = 1 04 . 55 em3•
207
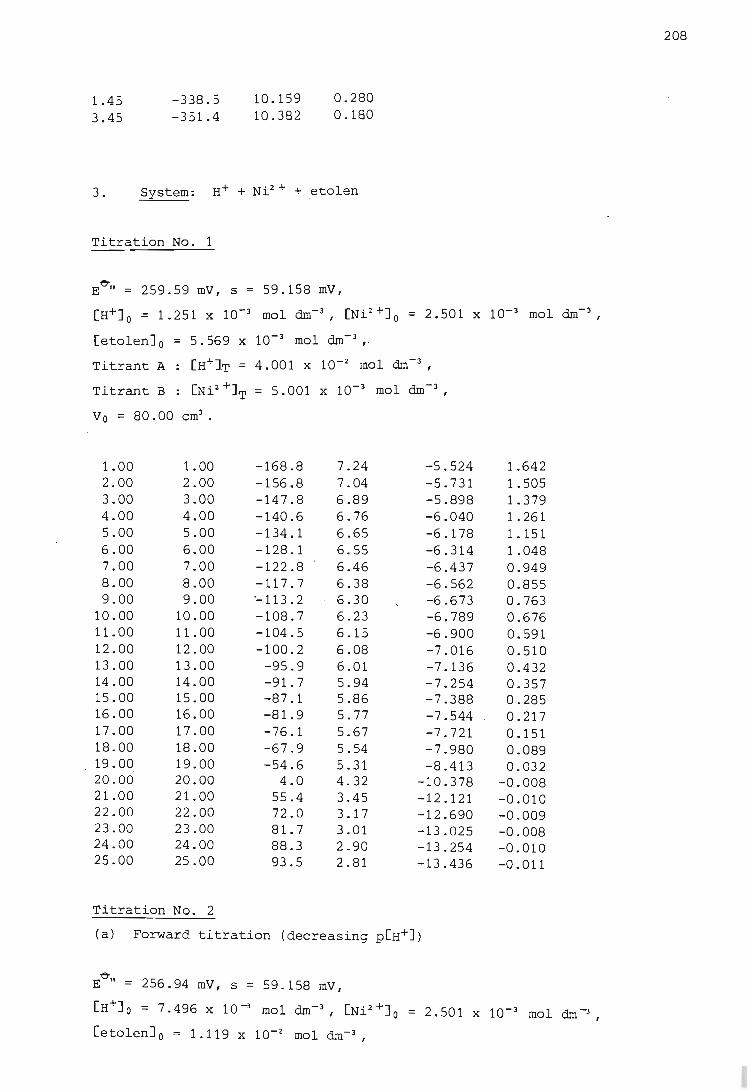
I
I I
1.45 3.45
-338.5 -351.4
10.159 10.382
0.280 0.180
3. System: H+ + Ni2 + ,+ etolen
Titration No.1
E~" = 259.59 mV, s = 59.158 mV,
[H+lo = 1.251 x 10⁻³ mol dm- 3, [Ni2 +1o = 2.501 x 10⁻³ mol dm- 3
,
[etolenJ o = 5.569 x 10⁻³ mol dm- 3,
Titrant A [H+IT = 4.001 x 10⁻² mol dm-3,
Titrant B
Vo = 80.00 cm3•
1.00 2.00 3.00 4.00 5.00 6.00 7.00 8.00 9.00
10.00 11.00 12.00 13.00 14.00 15.00 16.00 17.00 18.00 19.00 20.00 21.00 22.00 23.00 24.00 25.00
1.00 2.00 3.00 4.00 5.00 6.00 7.00 8.00 9.00
10.00 11.00 12.00 13.00 14.00 15.00 16.00 17.00 18.00 19.00 20.00 21.00 22.00 23.00 24.00 25.00
Titration No.2
-168.8 -156.8 -147.8 -140.6 -134.1 -128.1 -122.8 -117.7 '-113.2 -108.7 -104.5 -100.2 -95.9 -91.7 -87.1 -81.9 -76.1 -67.9 -54.6
4.0 55.4 72.0 81.7 88.3 93.5
7.24 7.04 6.89 6.76 6.65 6.55 6.46 6.38 6.30 6.23 6.15 6.08 6.01 5.94 5.86 5.77 5.67 5.54 5.31 4.32 3.45 3.17 3.01 2.90 2.81
-5.524 1.642 -5.731 1.505 -5.898 1.379 -6.040 1.261 -6 . 1 78 1. 15 1 -6.314 1.048 -6.437 0.949 -6.562 0.855 -6.673 0.763 -6.789 0.676 -6.900 0.591 -7.016 0.510 -7.136 0.432 -7.254 0.357 -7.388 0.285 -7.544 0.217 -7.721 0.151 -7.980 0.089 -8.413 0.032
-10.378 -0.008 -12.121 -0.010 -12.690 -0.009 -13.025 -0.008 -13.254 -0.010 -13.436 -0.011
(a) Forward titration (decreasing p[H+J )
E-et" = 256.94 mV, s = 59.158 mV,
[H+1 0 = 7.496 x 10⁻³ mol dm- 3, [Ni 2 +1o = 2.501 x 10⁻³ mol dm-:l,
[etolenJ o = 1.119 x 10⁻² mol dm- 3 ,
208
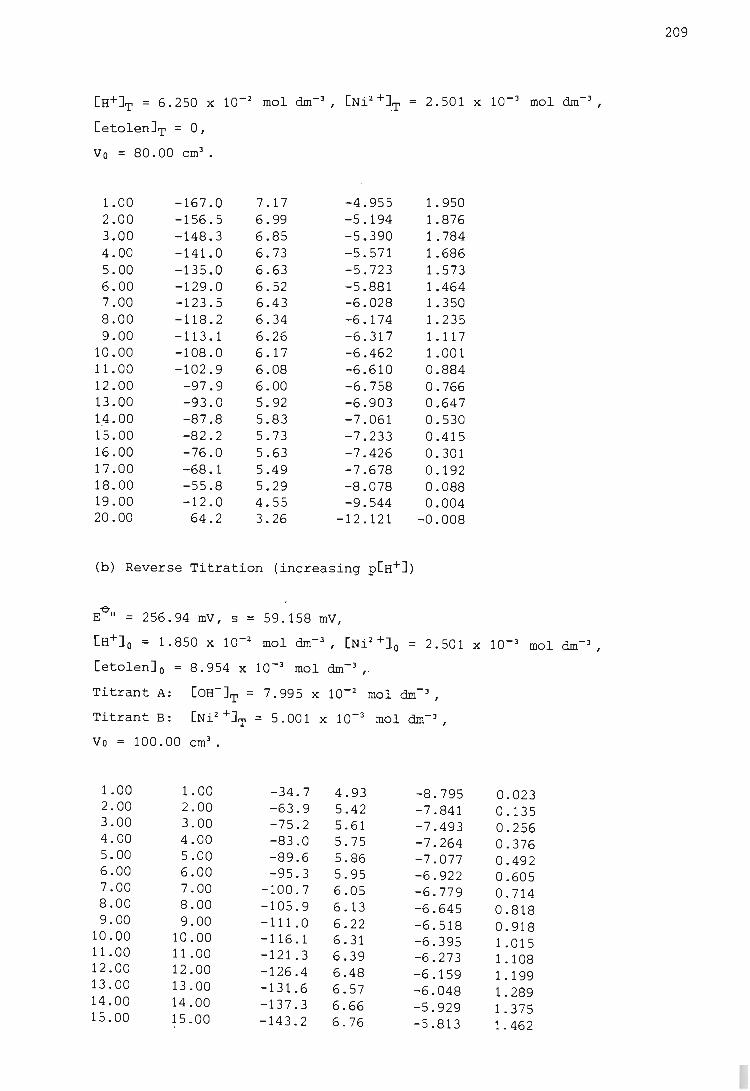
[H+]T = 6.250 x 10⁻² mol dm-3 , [Ni2 +] . .T
[etolen]T = 0,
Vo = 80.00 cm3•
1.00 -167.0 7.17 -4.955 2.00 -156.5 6.99 -5.194 3.00 -148.3 6.85 -5.390 4.00 -141.0 6.73 -5.571 5.00 -135.0 6.63 -5.723 6.00 -129.0 6.52 -5.881 7.00 -123.5 6.43 -6.028 8.00 -118.2 6.34 -6.174 9.00 -113.1 6.26 -6.317
10.00 -108.0 6.17 -6.462 11.00 -102.9 6.08 -6.610 12.00 -97.9 6.00 -6.758 13.00 -93.0 5.92 -6.903 14.00 -87.8 5.83 -7.061 15.00 -82.2 5.73 -7.233 16.00 -76.0 5.63 -7.426 17.00 -68.1 5.49 -7.678 18.00 -55.8 5.29 -8.078 19.00 -12.0 4.55 -9.544 20.00 64.2 3.26 -12.121
(b) Reverse Titration (increasing p[H+])
E'O" 256.94 mV, s = 59.158 mV,
[H+1 0 = 1.850 X 10⁻² mol dm- 3 , [Ni 2 +10
[etolen]o = 8.954 x 10⁻³ mol dm-3 r
2.501 X 10⁻³ mol dm-3,
1.950 1.876 1.784 1.686 1.573 1.464 1.350 1.235 1.117 1.001 0.884 0.766 0.647 0.530 0.415 0.301 0.192 0.088 0.004
-0.008
2.501 X 10⁻³ mol dm- 3,
Titrant A: [OH-]T = 7.995 x 10⁻² mol dm- 3 ,
Titrant B: [Ni2 +]T = 5.001 x 10⁻³ mol dm- 3 ,
Vo = 100.00 cm3•
1.00 1.00 -34.7 4.93 -8.795 0.023 2.00 2.00 -63.9 5.42 -7.841 0.135 3.00 3.00 -75.2 5.61 -7.493 0.256 4.00 4.00 -83.0 5.75 -7.264 0.376 5.00 5.00 -89.6 5.86 -7.077 0.492 6.00 6.00 -95.3 5.95 -6.922 0.605 7.00 7.00 -100.7 6.05 -6.779 0.714 8.00 8.00 -105.9 6.13 -6.645 0.818 9.00 9.00 -111.0 6.22 -6.518 0.918
10.00 10.00 -116.1 6.31 -6.395 1.015 11.00 11.00 -121.3 6.39 -6.273 1.108 12.00 12.00 -126.4 6.48 -6.159 1.199 13.00 13.00 -131.6 6.57 -6.048 1.289 14.00 14.00 -137.3 6.66 -5.929 1.375 15.00 15.00 -143.2 6.76 -5.813 1.462
209
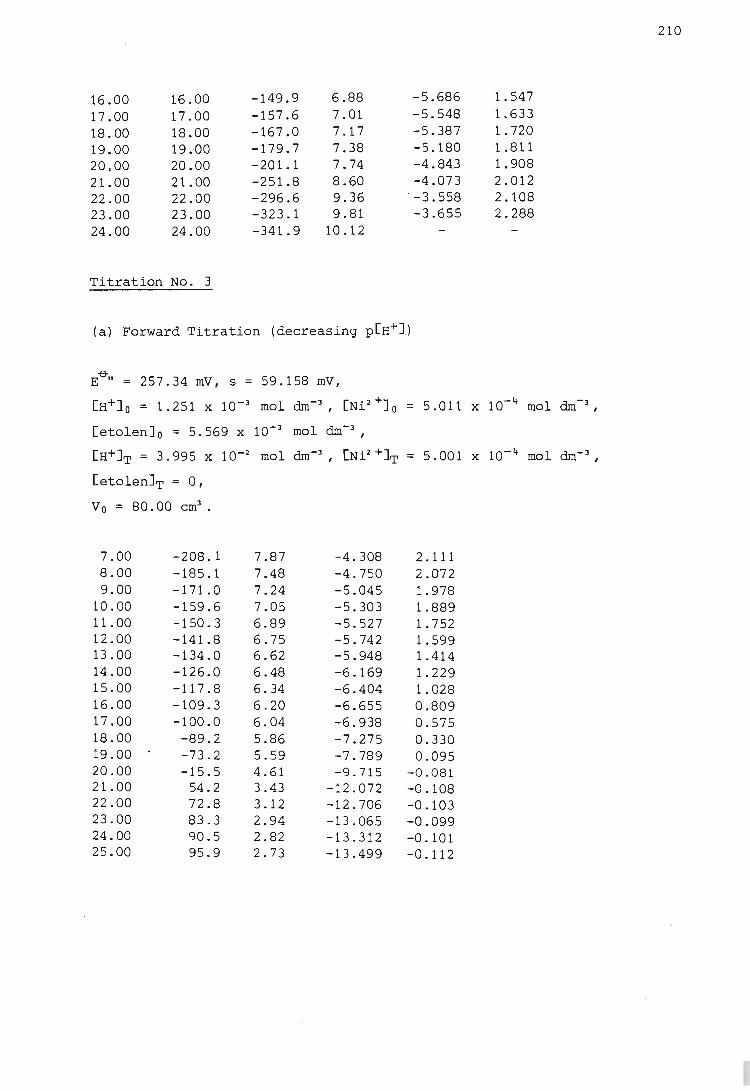
210
16.00 16.00 -149.9 6.88 -5.686 1.547 17.00 17.00 -157.6 7.01 -5.548 1.633 18.00 18.00 -167.0 7.17 .,..5.387 1.720 19.00 19.00 -179.7 7.38 -5.180 1.811 20.00 20.00 -201.1 7.74 -4.843 1.908 21.00 21.00 -251.8 8.60 -4.073 2.012 22.00 22.00 -296.6 9.36 -3.558 2.108 23.00 23.00 -323.1 9.81 -3.655 2.288 24.00 24.00 -341.9 10.12
Titration No.3
(a) Forward Titration (decreasing p[H+I)
E'6'1I 257.34 mV, s = 59.158 mV,
[H+lo = 1.251 x 10⁻³ mol dm-3, [Ni2 +Jo = 5.011 x 10⁻⁴ mol dm- 3 ,
[etolenJ o = 5.569 x 10⁻³ mol dm-3 ,
[H+IT = 3.995 x 10⁻² mol dm-3 , [Ni2 +IT 5.001 x 10- 4 mol dm- 3
,
[etolenJT = 0,
Va = 80.00 cm3•
7.00 -208.1 7.87 -4.308 2.111 8.00 -185.1 7.48 -4.750 2.0-72 9.00 -171.0 7.24 -5.045 1.978
10.00 -159.6 7.05 -5.303 1.889 11.00 -150.3 6.89 -5.527 1.752 12.00 -141.8 6.75 -5.742 1.599 13 .00 -134.0 6.62 -5.948 1.414 14.00 -126.0 6.48 -6.169 1.229 15.00 -117.8 6.34 -6.404 1.028 16.00 -109.3 6.20 -6.655 0.809 17.00 -100.0 6.04 -6.938 0.575 18.00 -89.2 5.86 -7.275 0.330 19.00 -73.2 5.59 -7.789 0.095 20.00 -15.5 4.61 -9.715 -0.081 21.00 54.2 3.43 -12.072 -0.108 22.00 72.8 3.12 -12.706 -0.103 23.00 83.3 2.94 -13.065 -0.099 24.00 90.5 2.82 -13.312 -0.101 25.00 95.9 2.73 -13 .499 -0.112
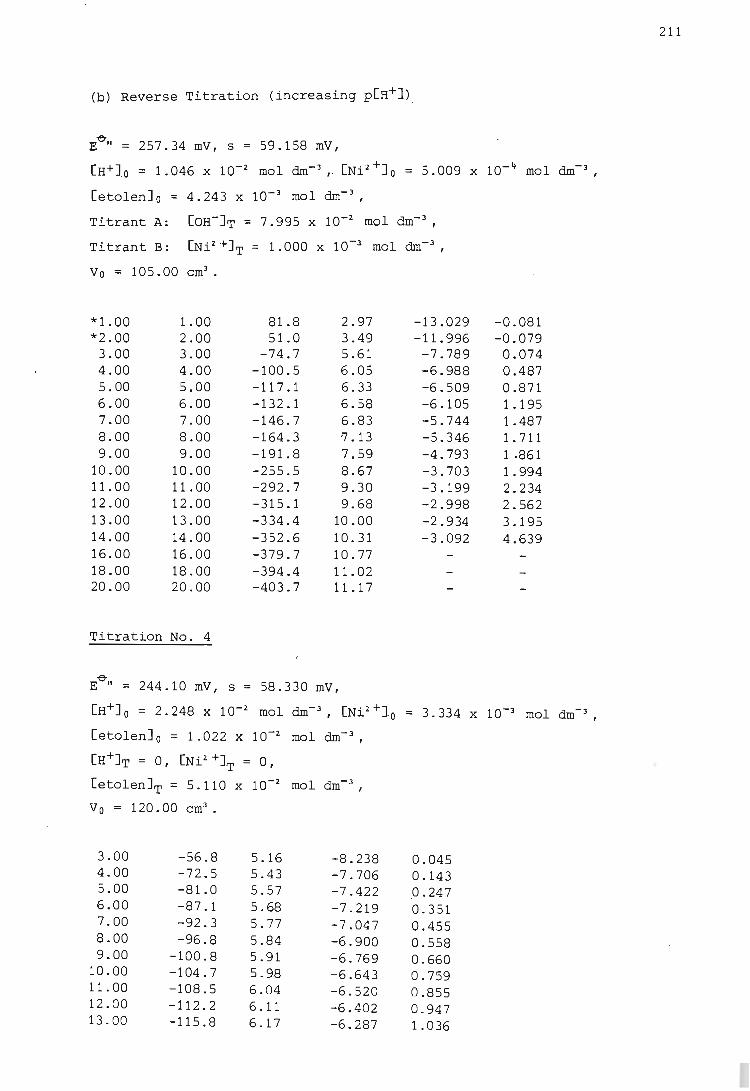
(b) Reverse Titration (increasing p[H+J.)
Ee" = 257.34 mV, s = 59.158 mY,
[H+]o = 1. 046 X 10-2 mol dm- 3 , [Ni 2 +10
[etolenJ o = 4.243 x 10⁻³ mol dm- 3,
Titrant A: [OH-JT = 7.995 x 10⁻² mol dm- 3,
Titrant B: [Ni2 +JT = 1.000 x 10⁻³ mol dm-3,
Vo = 105.00 cm3•
*1.00 1.00 81.8 2.97 -13.029 *2.00 2.00 51.0 3.49 -11.996 3.00 3.00 -74.7 5.61 -7.789 4.00 4.00 -100.5 6.05 -6.988 5.00 5.00 -117.1 6.33 -6.509 6.00 6.00 -132.1 6.58 -6.105 7.00 7.00 -146.7 6.83 -5.744 8.00 8.00 -164.3 '7.13 -5.346 9.00 9.00 -191.8 7.59 -4.793
10.00 10.00 -255.5 8.67 ";'3.703 11.00 11.00 -292.7 9.30 -3.199 12.00 12.00 -315.1 9.68 -2.998 13.00 13.00 -334.4 10.00 -2.934 14.00 14.00 -352.6 10.31 -3.092 16.00 16.00 -379.7 10.77 18.00 18.00 -394.4 11.02 20.00 20.00 -403.7 11.17
Titration No.4
Ee
" = 244.10 mV, s = 58.330 mV,
-0.081 -0.079
0.074 0.487 0.871 1.195 1.487 1.711 1 .861 1.994 2.234 2.562 3.195 4.639
[H+J o = 2.248 x 10⁻² mol dm- 3, [Ni2 +J. o = 3.334 x 10⁻³ mol dm- 3 ,
[etolenJ o = 1.022 x 10⁻² mol dm- 3 , [H+J.T = 0, [Ni2 +JT = 0,
[etolenJT = 5.110 X 10⁻² mol dm- 3 ,
Vo = 120.00 cm3•
3.00 -56.8 5.16 -8.238 0.045 4.00 -72.5 5.43 -7.706 0.143 5.00 -81.0 5.57 -7.422 0.247 6.00 -87.1 5.68 -7.219 0.351 7.00 -92.3 5.77 -7.047 0.455 8.00 -96.8 5.84 -6.900 0.558 9.00 -100.8 5.91 -6.769 0.660
10.00 -104.7 5.98 -6.643 0.759 11.00 -108.5 6.04 -6.520 0.855 12.00 -112.2 6.11 -6.402 0.947 13.00 -115.8 6.17 -6.287 1.036
211
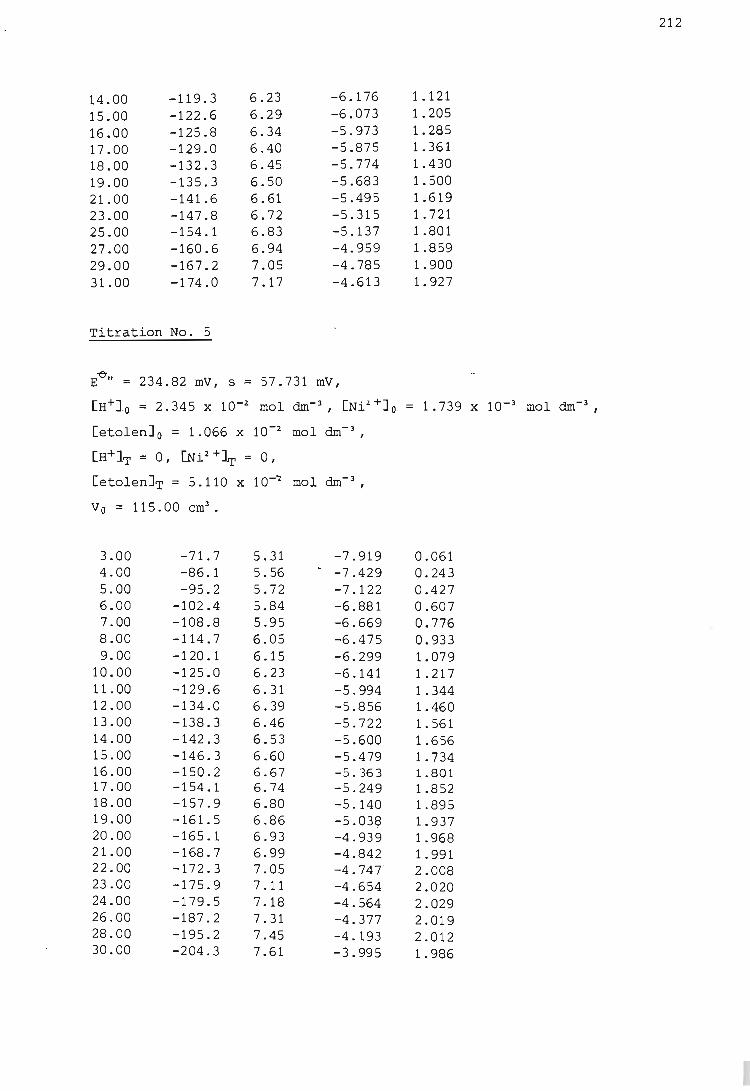
212
14.00 -119.3 6.23 -6.176 1.121 15.00 -122.6 6.29 -6.073 1.205 16.00 -125.8 6.34 -5.973 1.285 17.00 -129.0 6.40 -5.875 1.361 18.00 -132.3 6.45 -5.774 1.430 19.00 -135.3 6.50 -5.683 1.500 21.00 -141.6 6.61 -5.495 1.619 23.00 -147.8 6.72 -5.315 1 . 721 25.00 -154.1 6.83 -5.137 1 . 801 27.00 -160.6 6.94 -4.959 1.859 29.00 -167.2 7.05 -4.785 1.900 31.00 -174.0 7.17 -4.613 1. 927
Titration No. 5
E~" = 234.82 mV, s = 57.731 mV,
[H+1 0 = 2.345 X 10⁻² mol dm- 3 , [Ni2 +10 = 1. 739 X 10-3 mol dm-3 ,
[etolenJ o = 1.066 x 10⁻² mol dm- 3 ,
[H+]T = 0, [Ni 2 +JT = 0,
[etolenJT = 5.110 x 10-"2 mol dm- 3 ,
Vo = 115.00 em3•
3.00 -71. 7 5.31 -7.919 0.061 4.00 -86.1 5.56 - -7.429 0.243 5.00 -95.2 5.72 -7.122 0.427 6.00 -102.4 5.84 -6.881 0.607 7.00 -108.8 5.95 -6.669 0.776 8.00 -114.7 6.05 -6.475 0.933 9.00 -120.1 6.15 -6.299 1.079
10.00 -125.0 6.23 -6.141 1.217 11.00 -129.6 6.31 -5 . 994 1.344 12.00 -134.0 6.39 -5.856 1.460 13.00 -138.3 6.46 -5.722 1.561 14.00 -142.3 6.53 -5.600 1.656 15.00 -146.3 6.60 -5.479 1.734 16.00 -150.2 6.67 -5.363 1 . 801 17.00 -154.1 6.74 -5.249 1.852 18.00 -157.9 6.80 -5.140 1.895 19.00 -161.5 6.86 -5.031;3 1.937 20.00 -165.1 6.93 -4.939 1 . 968 21.00 -168.7 6.99 -4.842 1. 991 22.00 -172.3 7.05 -4.747' 2 . 008 23.00 -175.9 7.11 -4.654 2.020 24.00 -179.5 7.18 -4.564 2.029 26.00 -187.2 7.31 -4.377 2.019 28.00 -195.2 7.45 -4.193 2.012 30.00 -204.3 7.61 -3.995 1.986
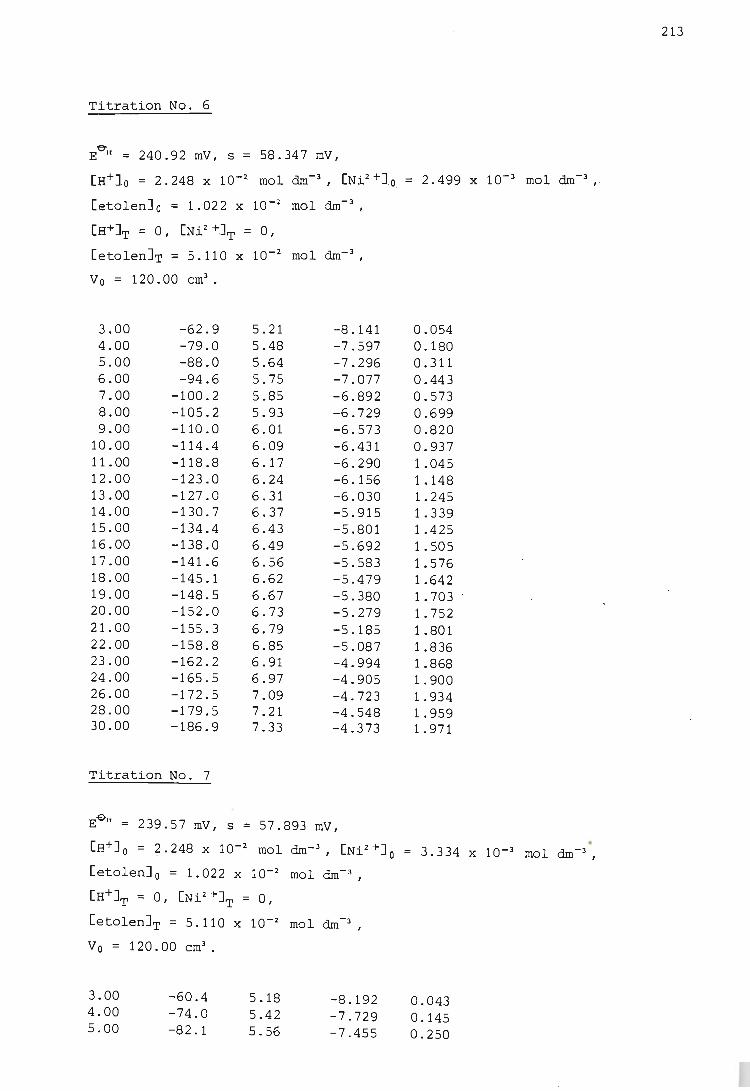
213
Titration No. 6
E-eT" = 240.92 mY, s = 58.347 mY,
[H+lo = 2.248 x 10⁻² mol dm-3 , [Ni2 +1o = 2.499 x 10⁻³ mol dm- 3 ,
[etolenJ o = 1.022 x 10⁻² mol dm- 3 ,
[H+1T = 0, [Ni2 +JT = 0,
[etolenJT = 5.110 x 10⁻² mol dm- 3 ,
Vo = 120.00 em3 . .
3.00 -62.9 5.21 -8.141 0.054 4.00 -79.0 5.48 -7.597 0.180 5.00 -88.0 5.64 -7.296 0.311 6.00 -94.6 5.75 -7.077 0.443 7.00 -100.2 5.85 -6.892 0.573 8.00 -105.2 5.93 -6.729 0 . 699 9.00 -110.0 6.01 -6.573 0.820
10.00 -114.4 6.09 -6.431 0.937 11.00 -118.8 6.17 -6.290 1.045 12.00 -123.0 6.24 -6.156 1.148 13.00 -127.0 6.31 -6.030 1.245 14.00 -130.7 6.37 -5.915 1.339 15.00 -134.4 6.43 -5.801 1.425 16.00 -138.0 6.49 -5.692 1.505 17.00 -141.6 6.56 -5.583 1.576 18.00 -145.1 6.62 -5.479 1.642 19.00 -148.5 6.67 -5.380 1.703 20.00 -152.0 6.73 -5 . 279 1. 752 21.00 -155.3 6.79 -5.185 1.801 22.00 -158.8 6 . 85 -5.087 1.836 23.00 -162.2 6.91 -4.994 1.868 24.00 -165.5 6.97 -4.905 1.900 26.00 -172.5 7.09 -4.723 1.934 28.00 -179.5 7.21 -4.548 1.959 30.00 -186.9 7.33 -4.373 1.971
Titration No. 7
E-Q-n = 239.57 mY, s = 57.893 mY,
[H+J o = 2.248 X 10⁻² mol dm- 3 , [Ni 2 +]o .
3.334 X 10⁻³ mol dm- 3 ,
[etolenJ o = 1.022 X 10⁻² mol dm- 3 ,
[H+JT = 0, [Ni 2 +JT = 0,
[etolenJT = 5.110 x 10⁻² mol dm- l ,
Vo = 120.00 em3 .
3.00 -60.4 5.18 -8.192 0.043 4.00 -74.0 5.42 -7.729 0.145 5.00 -82.1 5.56 -7.455 0 .250
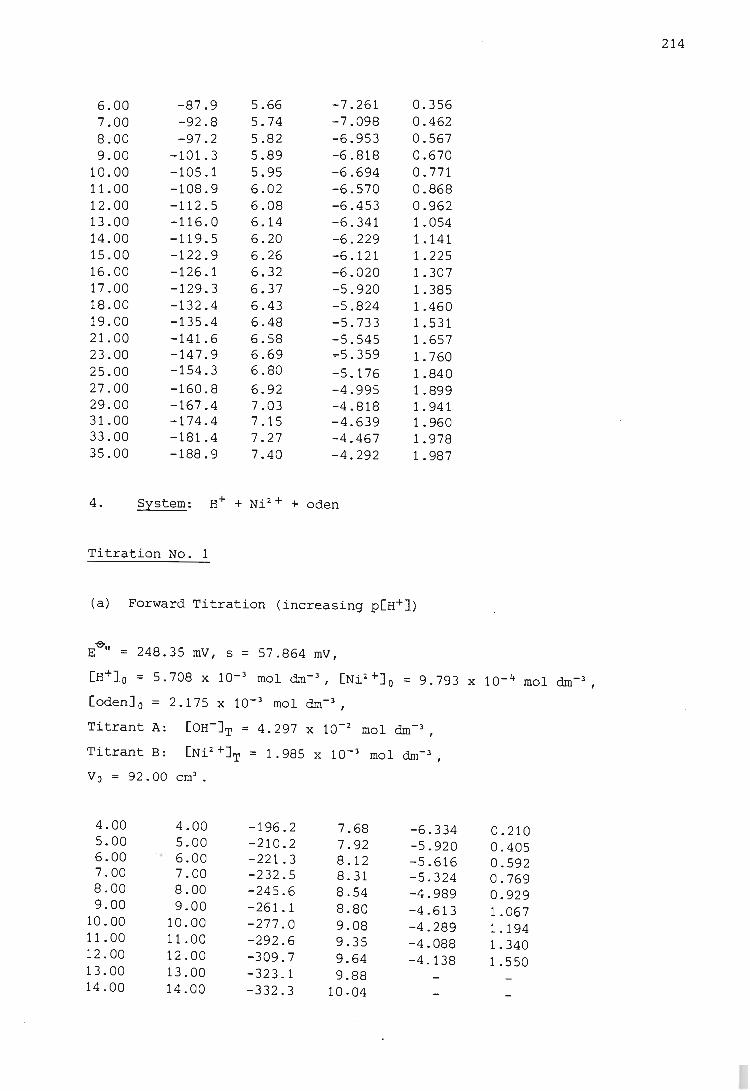
6.00 -87.9 5.66 -7.261 0.356 7.00 -92.8 5.74 -7.098 0.462 8.00 -97.2 5.82 -6.953 0.567 9 . 00 -101.3 5.89 -6.818 0.670
10.00 -105.1 5.95 -6.694 0.771 11.00 -108.9 6.02 -6.570 0.868 12.00 -112.5 6.08 -6.453 0.962 13 .00 -116.0 6.14 -6.341 1 . 054 14.00 -119.5 6.20 -6.229 1.141 15.00 -122.9 6.26 -6.121 1.225 16.00 -126.1 6.32 -6.020 1.307 17 . 00 -129.3 6.37 -5.920 1.385 18.00 -132.4 6.43 -5.824 1.460 19.00 -135.4 6.48 -5.733 1.531 21.00 -141.6 6.58 -5.545 1.657 23.00 -147.9 6.69 .".5.359 1.760 25.00 -154.3 6.80 -5.176 1 . 840 27.00 -160.8 6.92 -4.995 1.899 29.00 -167.4 7.03 -4.818 1.941 31.00 -174.4 7.15 -4.639 1.960 33.00 -181.4 7.27 -4.467 1.978 35.00 -188.9 7.40 -4.292 1.987
4. System: H++ Ni 2 + + aden
Titration No.1
(a) Forward Titration (increasing p[H+])
E'6'" = 248.35 mY, s = 57.864 mY,
[H+]o = 5.708 X 10⁻³ mol dm- 3, [Ni 2 +J a = 9.793 X 10- 4 mol dm- 3 ,
[odenJ o = 2.175 x 10⁻³ mol dm- 3 ,
Titrant A: [OH-JT = 4.297 x 10⁻² mol dm-3 ,
Titrant B: [Ni2 +JT = 1.985 x 10⁻³ mol dm- 3 ,
Vo = 92.00 em3•
4.00 4.00 -196.2 7.68 -6.334 5.00 5.00 -210.2 7.92 -5.920 6.00 6.00 -221.3 8.12 -5.616 7.00 7.00 -232.5 8.31 -5.324 8.00 8.00 -245.6 8.54 -4.989 9.00 9.00 -261.1 8.80 -4.613
10.00 10.00 -277.0 9.08 -4.289 11.00 11.00 -292.6 9.35 -4.088 12.00 12.00 -309.7 9.64 -4.138 13.00 13.00 -323.1 9.88 14.00 14.00 -332.3 10.04
0.210 0.405 0 . 592 0.769 0.929 1 . 067 1.194 1.340 1 . 550
214
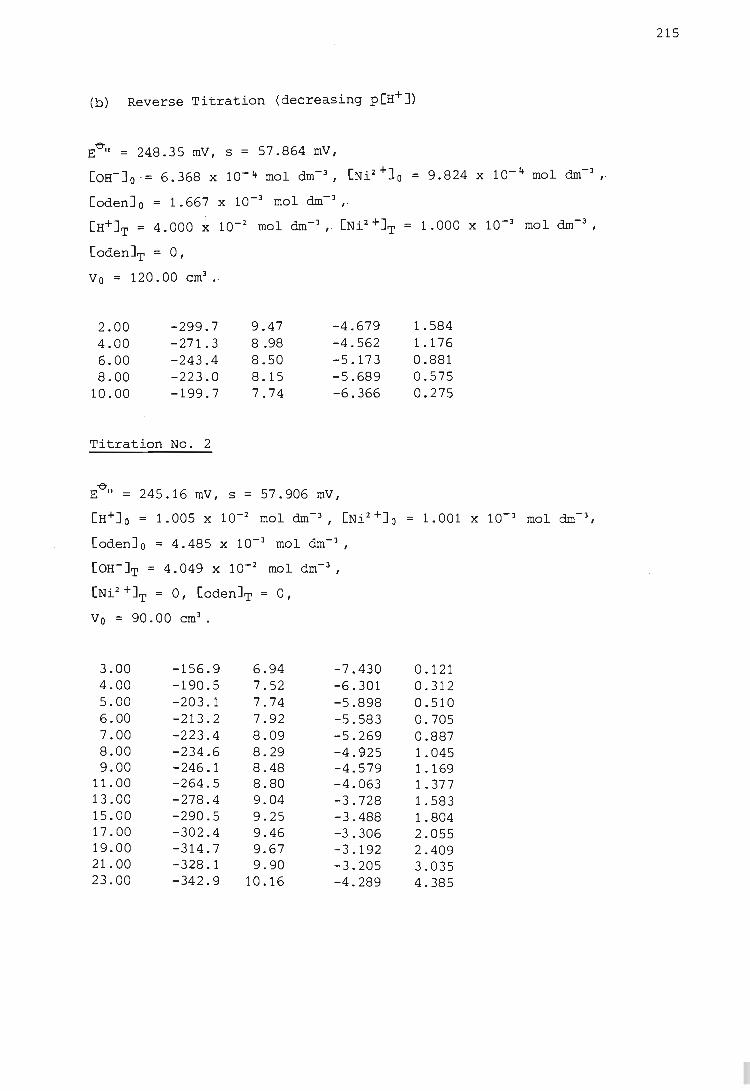
215
(b) Reverse Titration (decreasing p[H+J)
Ee " = 248.35 mV, s = 57.864 mV,
[OH-J o ' = 6.368 x 10-'+ mol dm- 3 , [Ni2 +1o = 9.824 x 10-'+ mol dm-3,
[odenJ o = 1.667 x 10⁻³ mol dm- 3,
[H+JT = 4.000 X 10⁻² mol dm- 3 , [Ni 2 +]T = 1.000 X 10⁻³ mol dm- 3
,
[odenJT = 0,
Vo = 120.00 em3•
2.00 -299.7 9.47 -4.679 1 . 584 4.00 -271.3 8 .98 -4.562 1.176 6.00 -.243.4 8.50 -5. 173 0.881 8.00 -223.0 8.15 -5.689 0.575
10.00 -199.7 7.74 -6.366 0.275
Titration No.2
~ E " = 245.16 mV, s = 57.906 mV,
[H+]o = 1.005 x 10⁻² mol dm- 3 , [Ni2 +J o
[odenJ o = 4.485 x 10⁻³ mol dm- 3 ,
[OH-JT = 4.049 x 10⁻² mol d -3 m ,
[Ni2 +JT = 0, [odenJT = 0,
Vo = 90.00 em3•
3.00 -156.9 6.94 -7.430 0.121 4.00 -190.5 7.52 -6.301 0.312 5.00 -203.1 7.74 -5.898 0.510 6.00 -213.2 7.92 -5.583 0.705 7.00 -223.4 8.09 -5.269 0.887 8.00 -234.6 8.29 -4.925 1.045 9.00 -246.1 8.48 -4.579 1.169
11.00 -264.5 8.80 -4.063 1.377 13.00 -278.4 9.04 -3.728 1.583 15.00 -290.5 9.25 -3.488 1 . 804 17.00 -302.4 9.46 -3.306 2.055 19.00 -314.7 9.67 -3.192 2 . 409 21.00 -328.1 9.90 -3.205 3.035 23.00 -342.9 10.16 -4.289 4.385
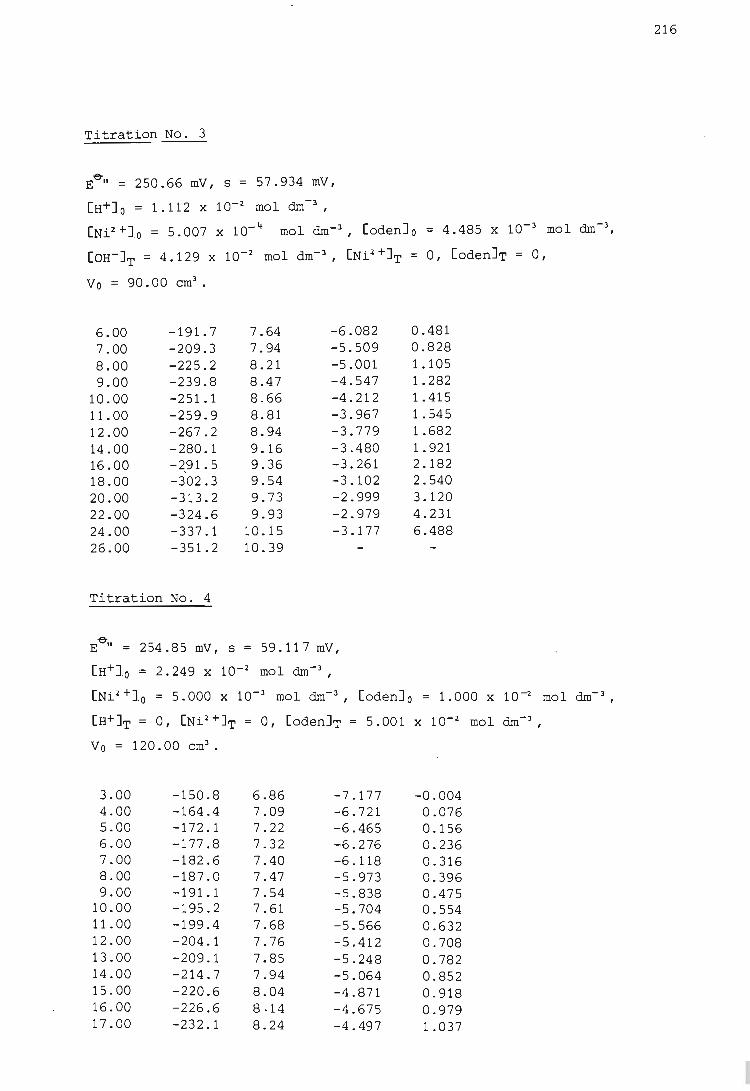
Titration No.3
E-e-II = 250.66 mV, s = 57.934 mV,
[H+J a 1.112 x 10⁻² mol dm-3,
[Ni2 +Ja = 5.007 x 10⁻¹+ mol dm- 3, [odenJ a = 4.485 x 10- 3 mol dm- 3
,
[OH-JT = 4.129 x 10⁻² mol dm-3, [Ni2 +JT = 0, [odenh = 0,
Va = 90.00 em3•
6.00 -191.7 7.64 -6.082 7.00 -209.3 7.94 -5.509 8.00 -225.2 8.21 -5.001 9.00 -239.8 8.47 -4.547
10.00 -251.1 8.66 -4.212 11.00 -259.9 8.81 -3.967 12.00 -267.2 8.94 -3.779 14.00 -280.1 9.16 -3.480 16.00 -~91. 5 9.36 -3.261 18.00 -302.3 9.54 -3.102 20.00 -313.2 9.73 -2.999 22.00 -324.6 9.93 -2.979 24.00 -337.1 10.15 -3.177 26.00 -351.2 10.39
Titration No.4
E-e-II = 254.85 mV, s = 59.117 mV,
[H+la = 2.249 X 10- 2 mol dm-3 ,
0.481 0.828 1.105 1.282 1.415 1.545 1.682 1.921 2.182 2.540 3.120 4.231 6.488
[Ni 2 +1a = 5.000 x 10- 3 mol dm- 3, [odenJ a = 1.000 x 10⁻² mol dm- 3 ,
[H+JT = 0, [Ni2 +JT = 0, [odenJT = 5.001 x 10⁻² mol dm- 3 ,
Va = 120.00 em3•
3.00 -150.8 6.86 -7.177 -0.004 4.00 -164.4 7.09 -6.721 0.076 5.00 -172.1 7.22 -6.465 0.156 6.00 -177.8 7.32 -6.276 0.236 7.00 -182.6 7.40 -6.118 0.316 8.00 -187.0 7.47 -5.973 0.396 9.00 -191.1 7.54 -5.838 0.475
10.00 -195.2 7.61 -5.704 0.554 11.00 -199.4 7.68 -5.566 0.632 12.00 -204.1 7.76 -5.412 0.708 13.00 -209.1 7.85 -5.248 0.782 14.00 -214.7 7.94 -5.064 0.852 15.00 -220.6 8.04 -4.871 0.918 16.00 -226.6 8.14 -4.675 0.979 17.00 -232.1 8.24 -4.497 1.037
216
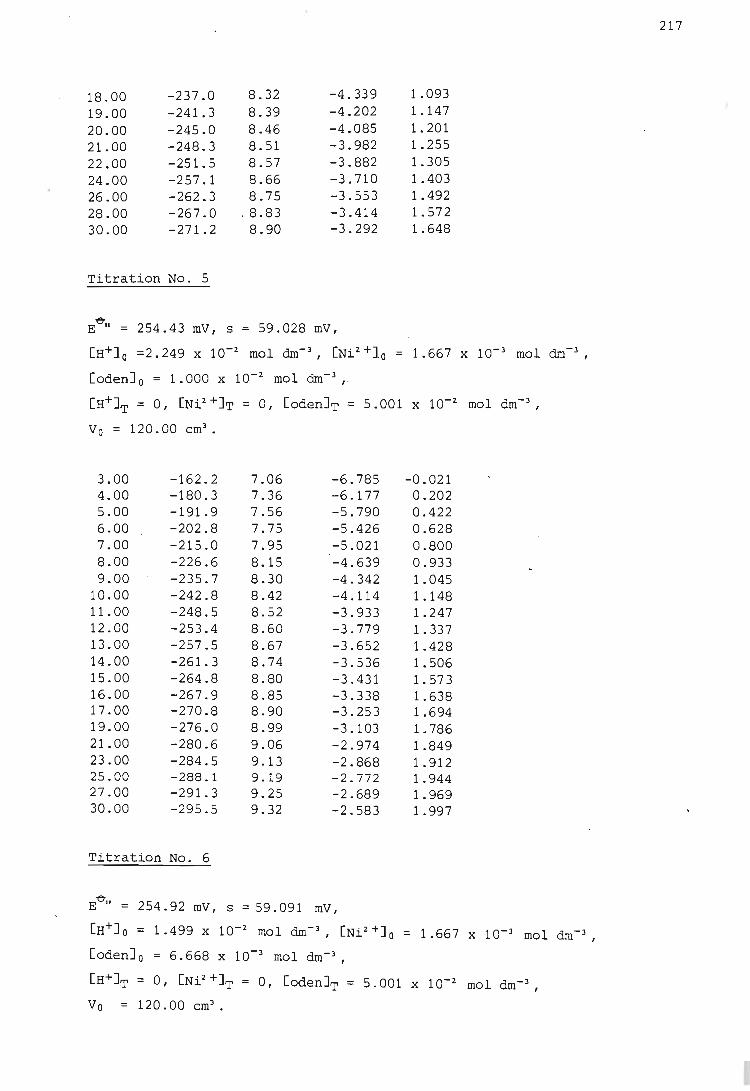
18.00 19.00 20.00 21.00 22.00 24.00 26.00 28.00 30.00
-237.0 -241.3 -245.0 -248.3 -251.5 -257.1 -262.3 -267.0 -271.2
Titration No.5
8.32 8.39 8.46 8.51 8.57 8.66 8.75
. 8.83 8.90
-4.339 -4.202 -4.085 -3.982 -3.882 -3.710 -3.553 -3.414 -3.292
~ E \I = 254.43 mV, s = 59.028 mV,
1.093 1.147 1. 201 1.255 1.305 1.403 1.492 1.572 1 .. 648
[H+J. O =2.249 x 10⁻² mol dm- 3 , . [Ni2 +J. o = 1.667 x 10⁻³ mol dm-3 ,
[oden]o = 1.000 x 10- 2 mol dm-3 ,
[H+]T = 0, [Ni 2 +1T = 0, [oden]T = 5.001 X 10⁻² mol dm- 3 ,
Vo = 120.00 em3•
3.00 4.00 5.00 6.00 7.00 8.00 9.00
10.00 11.00 12.00 13.00 14.00 15.00 16.00 17.00 19.00 21.00 23.00 25.00 27.00 30.00
-162.2 -180.3 -191.9 -202.8 -215.0 -226.6 -235.7 -242.8 -248.5 -253.4 -257.5 -261. 3 -264.8 -267.9 -270.8 -276.0 -280.6 -284.5 -288.1 -291. 3 -295.5
Titration No.6
7.06 7.36 7.56 7.75 7.95 8.15 8.30 8.42 8.52 8.60 8.67 8.74 8.80 8.85 8.90 8.99 9.06 9.13 9.19 9.25 9.32
-6.785 -6.177 -5.790 -5.426 -5.021 -4.639 -4 . 342 -4.114 -3.933 -3.779 -3.652 -3.536 -3.431 -3.338 -3.253 -3 . 103 -2.974 -2.868 -2.772 -2.689 -2.583
"0-E " = 254.92 mV, s = 59.091 mV,
-0.021 0.202 0.422 0.628 0.800 0.933 1.045 1.148 1.247 1. 337 1.428 1.506 1.573 1.638 1.694 1.786 1.849 1. 912 1.944 1.969 1.997
[H+J. o = 1.499 x 10⁻² mol dm- 3, [Ni2 +]o = 1.667 x 10⁻³ mol dm-3,
[oden]o = 6.668 x 10⁻³ mol dm-3 ,
[H+]T = 0, [Ni 2 +]T = 0, [odenJT = 5.001 X 10⁻² mol dm- 3 ,
Vo 120.00 em3•
217
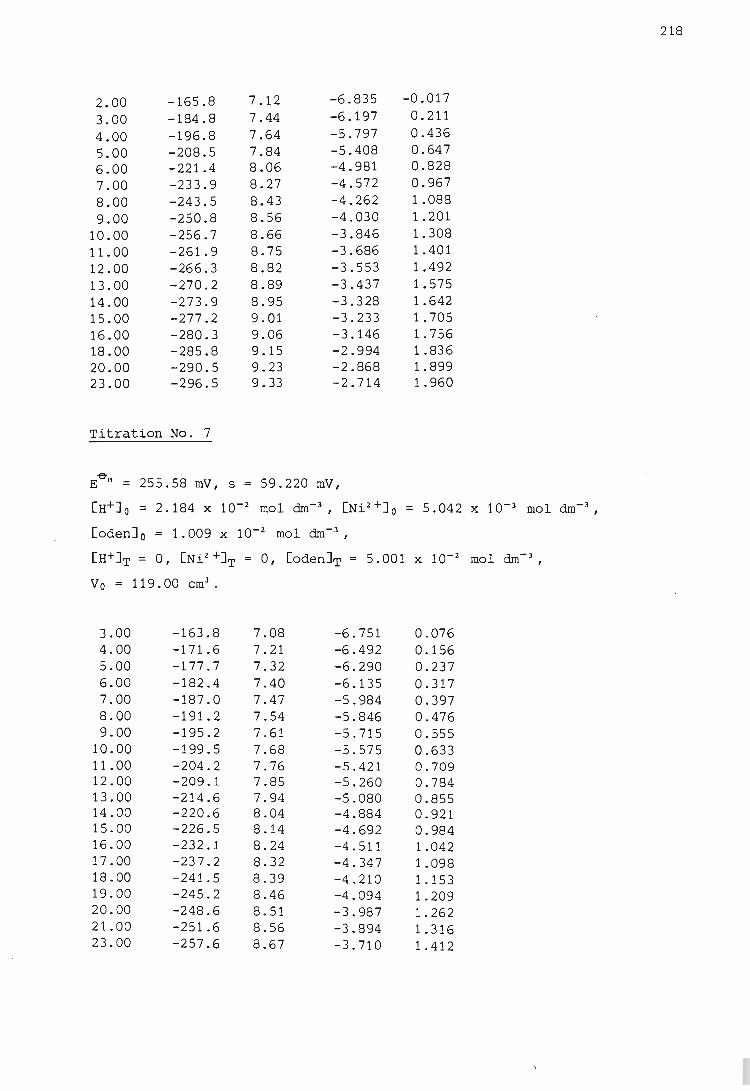
2.00 3.00 4.00 5.00 6.00 7.00 8.00 9.00
10.00 11.00 12.00 13.00 14.00 15.00 16.00 18.00 20.00 23.00
-165.8 -184.8 -196.8 -208.5 -221.4 -233.9 -243.5 -250.8 -256.7 -261.9 -266.3 -270.2 -273.9 -277 .2 -280.3 -285.8 -290.5 -296.5
Titration No.7
7.12 7.44 7.64 7.84 8.06 8.27 8.43 8.56 8.66 8.75 8.82 8.89 8.95 9.01 9.06 9.15 9.23 9.33
-6.835 -6.197 -5.797 -5.408 -4.981 -4.572 -4.262 -4.030 -3.846 -3.686 -3.553 -3.437 -3.328 -3.233 -3.146 -2.994 -2.868 -2.714
-e-E " = 255.58 mV, s = 59.220 mV,
-0.017 0.211 0.436 0.647 0.828 0.967 1.088 1.201 1.308 1.401 1.492 1.575 1.642 1.705 1.756 1.836 1.899 1.960
[H+lo 2.184 x 10⁻² mol dm-3 , [Ni 2 +J o = 5.042 x 10⁻³ mol dm- 3 ,
[odenJ o = 1.009 x 10⁻² mol dm- 3,
[H+JT = 0, [Ni2 +1T = 0, [odenJT = 5.001 x 10⁻² mol dm- 3 ,
V 0 = 119.00 em3•
3.00 4.00 5.00 6.00 7.00 8.00 9.00
10.00 11.00 12.00 13.00 14.00 15.00 16.00 17.00 18.00 19.00 20.00 21.00 23.00
-163.8 -171.6 -177.7 -182.4 -187.0 -191.2 -195.2 0-199.5 -204.2 -209.1 -214.6 -220.6 -226.5 -232.1 -237.2 -241. 5 -245.-2 -248.6 -251.6 -257.6
7.08 7.21 7.32 7.40 7.47 7.54 7.61 7.68 7.76 7.85 7.94 8.04 8.14 8.24 8.32 8.39 8.46 8.51 8.56 8.67
-6.751 -6.492 -6.290 -6.135 -5.984 -5.846 -5.715 -5.575 -5 . 421 -5.260 -5.080 -4.884 -4.692 -4.511 -4.347 -4.210 -4.094 -3.987 -3.894 -3.710
0.076 0.156 0.237 0.317 0.397 0.476 0.555 0.633 0.709 0.784 0.855 0.921 0.984 1.042 1.098 1.153 1.209 1.262 1.316 1.412
218

5. System: H+ + Co2 ++ etolen
Titration No.1
"0' E \I = 245.00 mV; s = 58.541 mV,
[H+]o = 3.716 x 10- 3 mol dm-3,
[Co2 +Jo = 5.005 X 10- 4 mol dm- 3, [etolen]o = 1.488 x 10⁻³ mol dm- 3
,
[OH-]T = 2.284 x 10⁻² mol dm-3, .
[Co2 +JT = 0, [etolen]T = 0,
V 0 = 100. 00 em3 •
1.00 51.6 3.30 -12.813 -0.011 3.00 - 6.0 4.29 -10.855 -0.007 4.00 -101.7 5.,~2 -7.641 0.018 5.00 -127.6 6.36 -6.838 0.039 6.00 . -143.5 6.64 -6.389 0.080 7.00 -156.4 6.86 -6.059 0.143 8.00 -168.4 7.06 -5.783 0.235 9.00 -180.9 7.28 -5.525 0.359
10.00 -194.8 7.51 -5.269 0.532 11.00 -210.3 7.78 -5.019 0.774 12.00 -224.8 8.03 -4.828 1.101 13.00 -238.4 8.26. -4.693 1.482 14.00 -251.0 8.47 -4.624 1.894 17.00 -308.3 9.45
Titration No.2
"0' E " = 249.29 mV, s = 58.499 mV,
[H+Jo = 6.208 X 10⁻³ mol dm- 3 ,
[Co2 +J O = 5.005 x 10- 4 mol dm- 3, [etolen]o = 2.976 x 10⁻³ mol dm- 3 ,
[OH-]T = 2.294 x 10⁻² mol dm-3 ,
[Co2 +]T = 0, [etolen]T = 0,
Vo = 100.00 em3•
1.00 -12.1 4.47 -10.186 -0.005 2.00 -81.7 5.66 -7.838 0.025 3.00 -104.0 6.04 -7.116 0.036 4.00 -117.2 6.26 -6.708 0.052 5.00 -127.0 6.43 -6.419 0.078 6.00 -135.0 6.57 -6.195 0.116 7.00 -142.1 6.69 -6.006 0.163 8.00 -148.7 6.80 -5.838 0.220
10.00 -161.6 7.02 -5.534 0.358 12.00 -174.9 7.25 -5.253 0.557 14.00 -190.4 7.52 -4.960 0.835
219
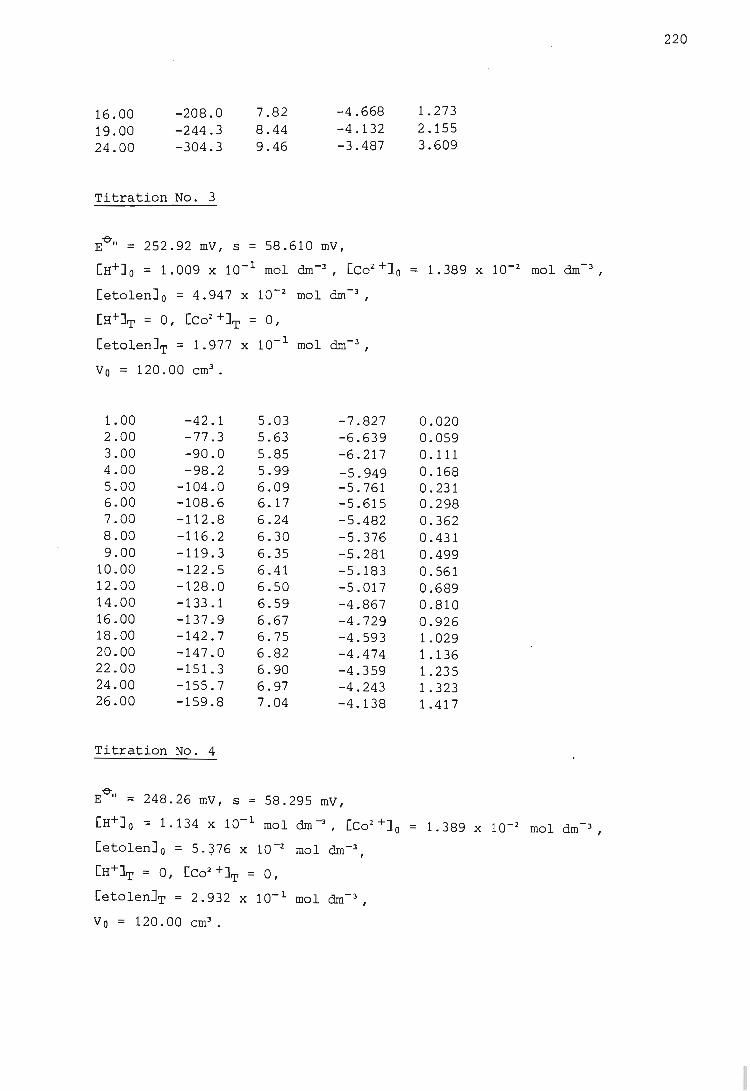
16.00 19.00 24.00
-208.0 -244.3 -304.3
Titration No.3
7.82 8.44 9.46
-4.668 -4.132 -3.487
Ee " = 252.92 mV, s = 58.610 mV,
1.273 2.155 3.609
[H+J a = 1.009 x 10- 1 mol dm-3, [co2 +1a = 1.389 x 10⁻² mol dm-),
[etolen]a = 4.947 x 10⁻² mol dm-3,
[H+]T = 0, [cd +]T = 0,
[etolen]T = 1.977 x 10- 1 mol dm-) ,
Va = 120.00 em3•
1.00 -42.1 5.03 -7.827 0.020 2.00 -77 .3 5.63 -6.639 0.059 3.00 -90.0 5.85 -6.217 0.111 4.00 -98.2 5.99 -5.949 0.168 5.00 -104.0 6.09 -5.761 0.231 6.00 -108.6 6.17 -5.615 0.298 7.00 -112.8 6.24 -5.482 0.362 8.00 -116.2 6.30 -5.376 0.431 9.00 -119.3 6.35 -5.281 0.499
10.00 -122.5 6.41 -5.183 0.561 12.00 -128.0 6.50 -5.017 0.689 14.00 -133.1 6.59 -4.867 0.810 16.00 -137.9 6.67 -4.729 0.926 18.00 -142.7 6.75 -4.593 1.029 20.00 -147.0 6.82 -4.474 1.136 22.00 -151.3 6.90 -4.359 1.235 24.00 -155.7 6.97 -4.243 1.323 26.00 -159.8 7.04 -4.138 1.417
Titration No. 4
Ee
" = 248.26 mV, s = 58.295 mV,
[H+Ja = 1. 134 x 10- 1 mol dm -), [Co2 +10 = 1. 389 x 10-2 mol dm -) ,
[etolen]a = 5.~76 x 10-:Z mol dm-3,
[H+]T = 0, [Co2 +]T = 0,
[etolen]T = 2.932 x 10- 1 mol dm-) ,
Va = 120.00 em) .
220
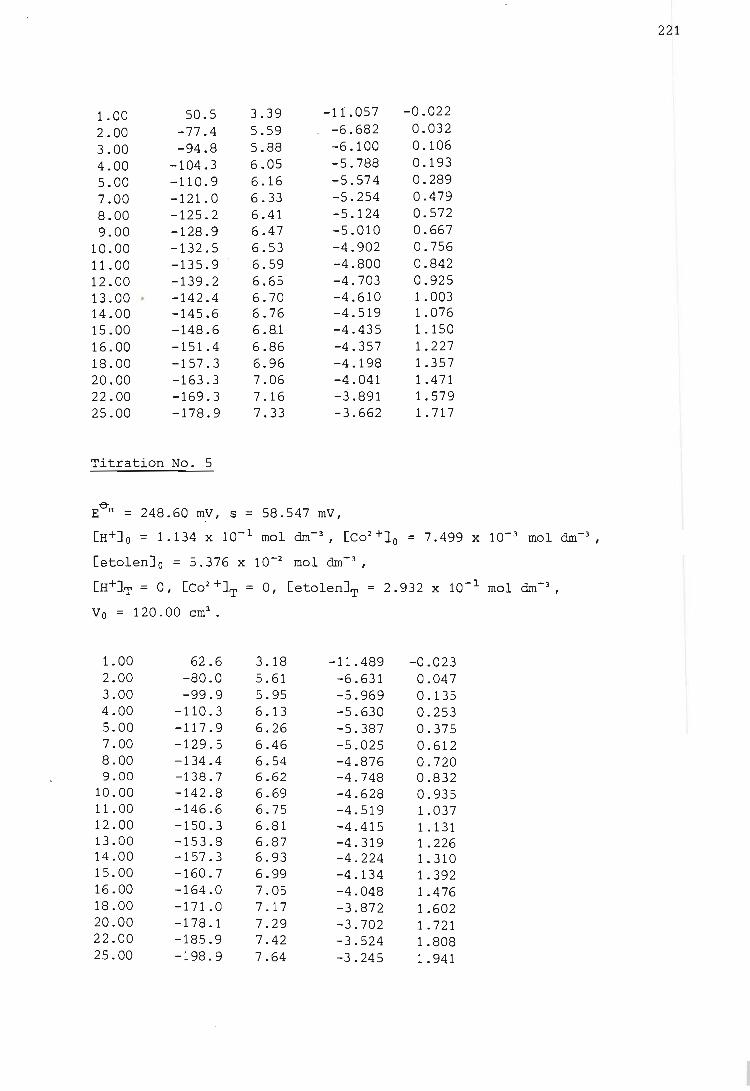
1.00 50.5 3.39 -11.057 -0.022 2.00 -77 .4 5.59 -6.682 0.032 3.00 -94.8 5.88 -6.100 0.106 4.00 -104.3 6.05 -5.788 0.193 5.00 -110.9 6.16 -5.574 0.289 7.00 -121.0 6.33 -5.254 0.479 8.00 -125.2 6.41 -5.124 0.572 9.00 -128.9 6.47 -5.010 0.667
10.00 -132.5 6.53 -4.902 0.756 11.00 -135.9 6.59 -4.800 0.842 12.00 -139.2 6.65 -4.703 0.925 13.00 . -142.4 6.70 -4.610 1.003 14.00 -145.6 6.76 -4.519 1.076 15.00 -148.6 6.81 -4.435 1.150 16.00 -151.4 6.86 -4.357 1.227 18.00 -157.3 6.96 -4.198 1.357 20.00 -163.3 7.06 -4.041 1.471 22.00 -169.3 7.16 -3.891 1.579 25.00 -178.9 7.33 -3.662 1.717
Titration No.5
e-E It =: 248.60 mV, s =: 58.547 mV,
[H+J a =: 1.134 x 10- 1 mol dm- 3, [Co2 +]a =: 7.499 x 10- 3 mol dm-3 ,
[etolenJ a =: 5.376 x 10⁻² mol dm- 3 ,
[H+IT =: 0, [Co2 +IT =: 0, [etolenJT =: 2.932 x 10- 1 mol dm- 3 ,
Va =: 120.00 em3•
1.00 62.6 3.18 -11.489 -0.023 2.00 -80.0 5.61 -6.631 0.047 3.00 -99.9 5.95 -5.969 0.135 4.00 -110.3 6.13 -5.630 0.253 5.00 -117.9 6.26 -5.387 0.375 7.00 -129.5 6.46 -5.025 0.612 8.00 -134.4 6.54 -4.876 0.720 9.00 -138.7 6.62 -4.748 0.832
10.00 -142.8 6.69 -4.628 0.935 11.00 -146.6 6.75 -4.519 1.037 12.00 -150.3 6.81 -4.415 1.131 13.00 -153.8 6.87 -4.319 1.226 14.00 -157.3 6.93 -4.224 1. 310 15.00 -160.7 6.99 -4.134 1.392 16.00 -164.0 7.05 -4.048 1.476 18.00 -171.0 7.17 -3.872 1.602 20.00 -178.1 7.29 -3.702 1.721 22.00 -185.9 7.42 -3.524 1.808 25.00 -198.9 7.64 -3.245 1.941
221
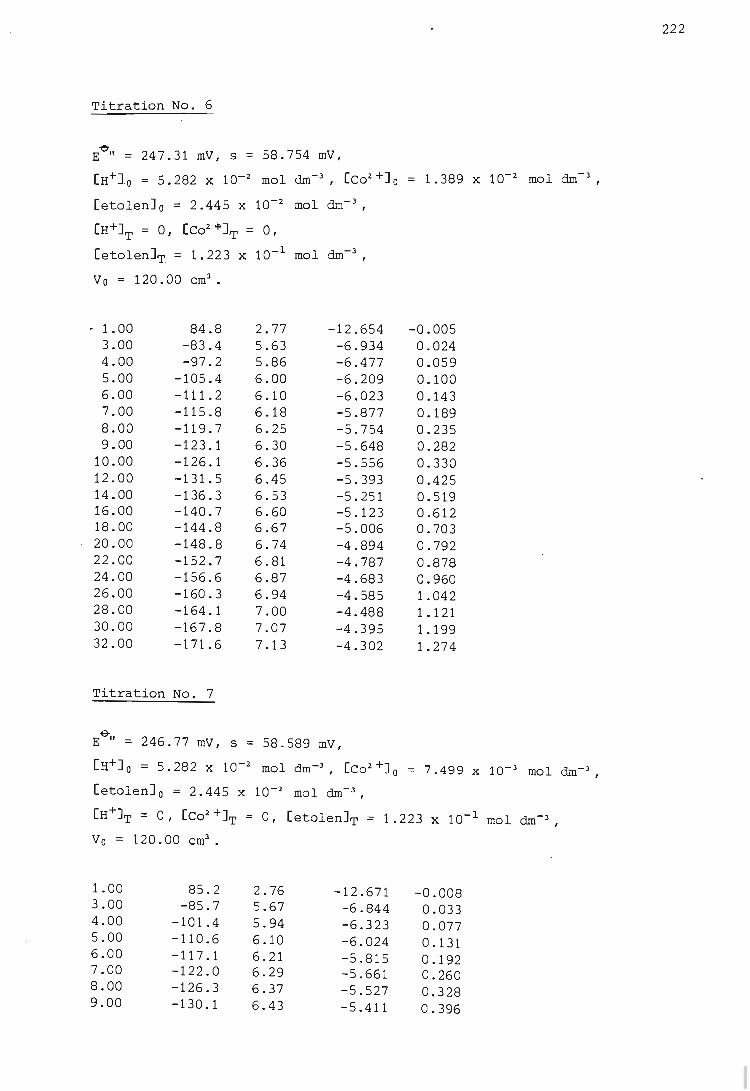
Titration No. 6
Ee
" = 247.31 mV, s = 58.754 mV,
[H+l o = 5.282 x 10⁻² mol dm- 3 , . [Co2 +]0. = 1.389 X 10⁻² mol dm- 3 ,
[etolen]o = 2.445 x 10- 2 mol dm- 3 ,
[H+]T = 0, [Co2 +]T = 0,
[etolen]T = 1.223 x 10⁻¹ mol dm- 3, .
Vo = 120.00 em3•
. 1.00 84.8 2.77 -12.654 -0.005 3.00 -83.4 5.63 -6.934 0.024 4.00 -97.2 5.86 -6.477 0.059 5.00 -105.4 6.00 -6.209 0.100 6.00 -111.2 6.10 -6.023 0.143 7.00 -115.8 6.18 -5.877 0.189 8.00 -119.7 6.25 -5.754 0.235 9.00 -123.1 6.30 -5.648 0.282
10.00 -126.1 6.36 -5.556 0.330 12.00 -131.5 6.45 -5.393 0.425 14.00 -136.3 6.53 -5.251 0.519 16.00 -140.7 6.60 -5.123 0.612 18.00 -144.8 6.67 -5.006 0.703 20.00 -148.8 6.74 -4.894 0.792 22.00 -152.7 6.81 -4.787 0.878 24.00 -156.6 6.87 -4.683 0.960 26.00 -160.3 6.94 -4.585 1.042 28.00 -164.1 7.00 -4.488 1.121 30.00 -167.8 7.07 -4.395 1.199 32.00 -171.6 7.13 -4.302 1.274
Titration No.7
-e-E " = 246.77 mV, s = 58.589 mV,
[H+]o = 5.282 x 10⁻² mol dm-3 , [Co2 +]o 7.499 X 10⁻³ mol dm- 3,
[etolen]o = 2.445 x 10⁻² mol dm- 3 ,
[H+]T = 0, [Co2 +]T = 0, [etolen]T = 1.223 x 10- 1 mol dm- 3 ,
Vo = 120.00 em3•
1.00 85.2 2.76 -12.671 -0.008 3.00 -85.7 5.67 -6.844 0.033 4.00 -101.4 5.94 -6.323 0.077 5.00 -110.6 6.10 -6.024 0.131 6.00 -117.1 6.21 -5.815 0.192 7.00 -122.0 6.29 -5.661 0.260 8.00 -126.3 6.37 -5.527 0.328 9.00 -130.1 6.43 -5.411 0.396
222
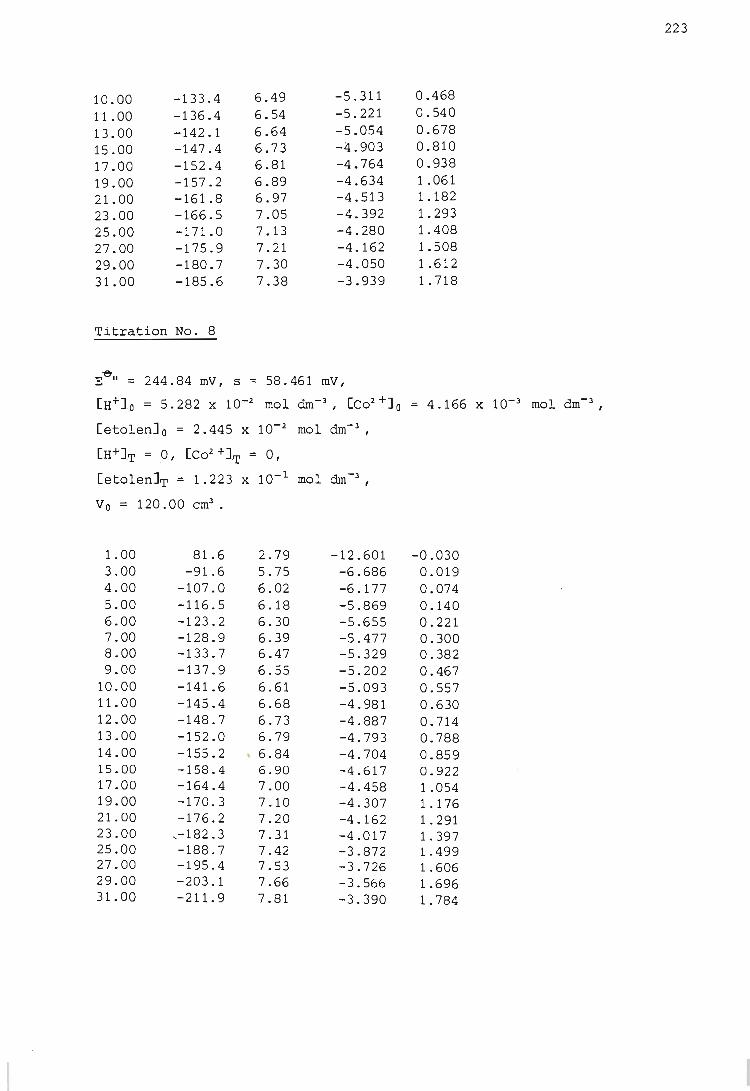
223
10.00 -133.4 6.49 -5.311 0.468 11.00 -136.4 6.54 -5.221 0.540 13.00 -142.1 6.64 -5.054 0.678 15.00 -147.4 6.73 -4.903 0.810 17.00 -152.4 6.81 -4.764 0.938 19.00 -157.2 6.89 -4.634 1.061 21.00 -161.8 6.97 -4.513 1.182 23.00 -166.5 7.05 -4 .. 392 1.293 25.00 -171.0 7.13 -4.280 1.408 27.00 -175.9 7.21 -4.162 1.508 29.00 -180.7 7.30 -4.050 1.612 31.00 -185.6 7.38 -3.939 1.718
Titration No. 8
E~II = 244.84 mV, s = 58.461 mV,
[H+lo = 5.282 x 10⁻² mol dm- 3 , [Co2 +10 = 4.166 X 10⁻³ mol dm- 3 ,
[etolenJ o = 2.445 X 10⁻² mol dm- 3 ,
[H+IT = 0, [Co2 +IT = 0,
[etolenJT = 1.223 x 10⁻¹ mol dm-3 ,
Vo = 120.00 em3•
1.00 81.6 2.79 -12.601 -0.030 3.00 -91.6 5.75 -6.686 0.019 4.00 -107.0 6.02 -6.177 0.074 5.00 -116.5 6.18 -5.869 0.140 6.00 -123.2 6.30 -5.655 0.221 7.00 -128.9 6.39 -5.477 0.300 8.00 -133.7 6.47 -5.329 0.382 9.00 -137.9 6.55 -5.202 0.467
10.00 -141.6 6.61 -5.093 0.557 11.00 -145.4 6.68 -4.981 0.630 12.00 -148.7 6.73 -4.887 0.714 13.00 -152.0 6.79 -4.793 0.788 14.00 -155.2 6.84 -4.704 0.859 15.00 -158.4 6.90 -4.617 0.922 17.00 -164.4 7.00 -4.458 1.054 19.00 -170.3 7.10 -4.307 1.176 21.00 -176.2 7.20 -4.162 1.291 23.00 ,-182.3 7.31 -4.017 1.397 25.00 -188.7 7.42 -3.872 1.499 27.00 -195.4 7.53 -3.726 1.606 29.00 -203.1 7.66 -3.566 1.696 31.00 -211.9 7.81 -3.390 1.784
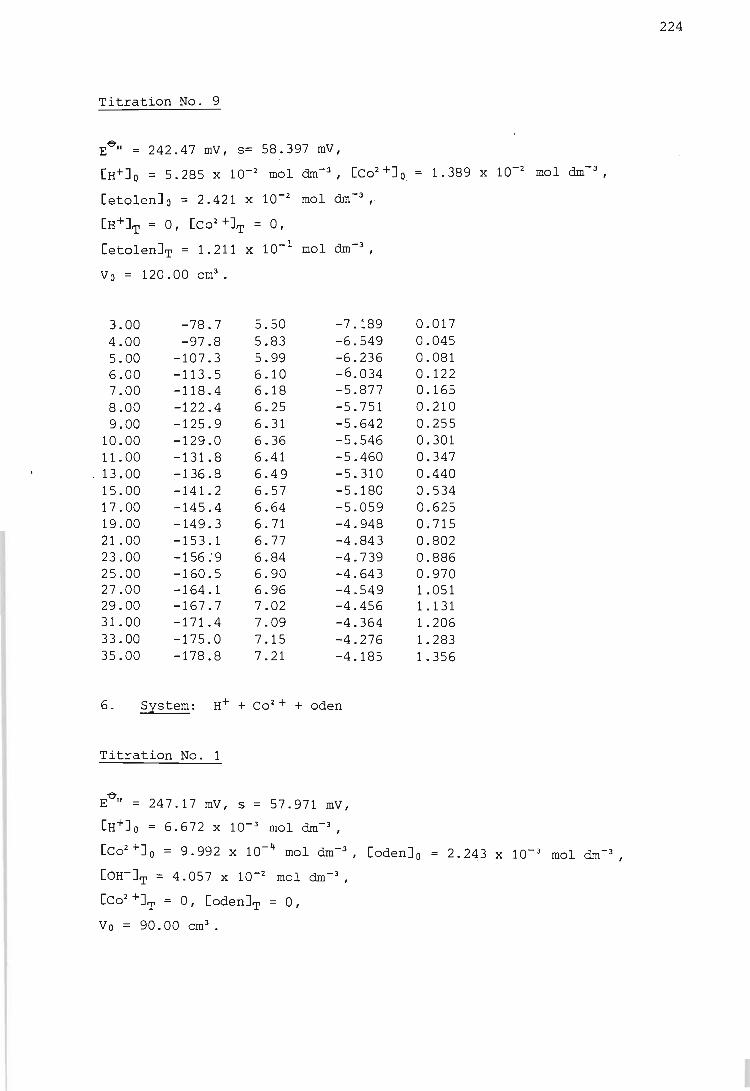
Titration No.9
E-&" = 242.47 mV, s= 58.397 mV,
[H+]o = 5.285 x 10⁻² mol dm-3, . [Co2 +]0 = 1.389 x 10⁻² mol dm- 3
,
[etolen]o = 2.421 x 10⁻² mol dm- 3, .
[H+]T = 0, [Co2 +]T = 0,
[etolen]T = 1.211 x 10- 1 mol dm-3,
Va = 120.00 cm3•
3.00 -78.7 5.50 -7.189 4.00 -97.8 5.83 -6.549 5.00 -107.3 5.99 -6.236 6.00 -113.5 6.10 -6.034 7.00 -118.4 6.18 -5.877 8.00 -122.4 6.25 -5.751 9.00 -125.9 6.31 -5.642
10.00 -129.0 6.36 -5.546 11.00 -131.8 6.41 -5.460
. 13.00 -136.8 6.49 -5.310 15.00 -141.2 6.57 -5.180 17.00 -145.4 6.64 -5.059 19.00 -149.3 6.71 -4 . 948 21.00 -153.1 6.77 -4.843 23.00 -156:9 6.84 -4.739 25.00 -160.5 6.90 -4.643 27.00 -164.1 6.96 -4.549 29.00 -167.7 7.02 -4.456 31.00 -171.4 7.09 -4.364 33.00 -175.0 7.15 -4.276 35.00 -178.8 7.21 -4.185
6. System: H+ + Co2 + + oden
Titration No. 1
E"O-" = 247.17 mV, s = 57.971 mV,
[H+]O = 6.672 x 10- 3 mol dm-3 ,
0.017 0.045 0.081 0.122 0.165 0 . 210 0.255 0.301 0.347 0 :440 0.534 0.625 0.715 0.802 0.886 0.970 1.051 1.131 1.206 1.283 1.356
[Co2 +]0 = 9.992 X 10- 4 mol dm- 3, Coden] a
[OH-]T = 4.057 x 10⁻² mol dm- 3 ,
2.243 X 10⁻³ mol dm-3 ,
[co2 +]T = 0, [oden]T = 0,
Va = 90.00 cm3•
224
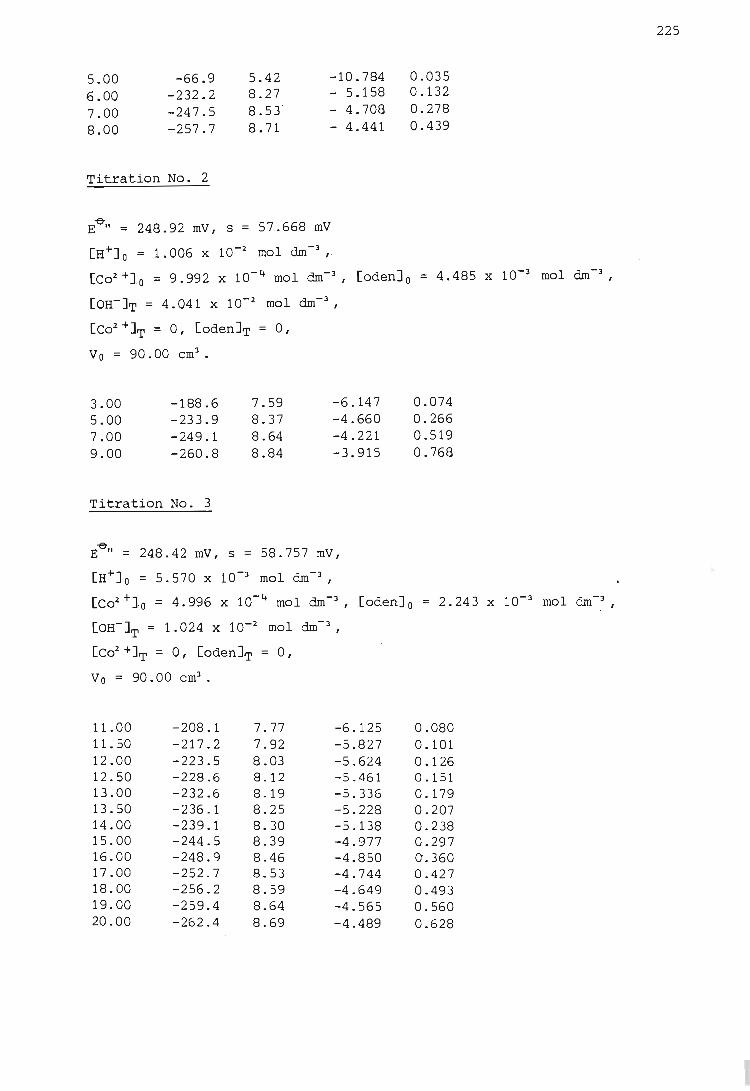
5.00 -66.9 5.42 -10.784 6.00 -232.2 8.27 - 5.158 7.00 -247.5 8.53 ' - 4.708 8.00 -257.7 8.71 - 4.441
Titration No.2
E-e" = 248.92 mV, s = 57.668 mV
[H+1 0 = 1. 006 X 10-2 mol dm-3 "
0.035 0.132 0.278 0.439
[co2 +J. O = 9.992 x 10- 4 mol dm- 3" [odenJ o = 4.485 x 10⁻³ mol dm- 3
,
[OH-JT = 4.041 x 10⁻² mol dm-3,
[co2 +JT = 0, [odenJT = 0,
Va = 90.00 em3•
3.00 5.00 7.00 9.00
-188.6 -233.9 -249.1 -260.8
Titration No.3
7.59 8.37 8.64 8.84
-6.147 -4.660 -4.221 -3.915
E-e" = 248.42 mV, s = 58.757 mV,
[H+l o = 5.570 x 10⁻³ mol dm-3 ,
[Co2 +]0 = 4.996 X 10- 4 mol dm- 3 , [odenJ o [OH-JT = 1. 024 X 10-2 mol dm- 3 ,
[Co2 +JT = 0, [odenJT = 0,
Va = 90.00 em) .
11.00 -208.1 7.77 -6.125 11.50 -217.2 7.92 -5.827 12.00 -223.5 8.03 -5.624 12.50 -228.6 8.12 -5.461 13.00 -232.6 8.19 -5.336 13 .50 -236.1 8.25 -5.228 14.00 -239.1 8.30 -5.138 15.00 -244.5 8.39 -4.977 16.00 -248.9 8.46 -4.850 17.00 -252.7 8.53 -4.744 18.00 -256.2 8.59 -4.649 19.00 -259.4 8.64 -4.565 20.00 -262.4 8.69 -4.489
0.074 0.266 0.519 0.768
2.243 x
0.080 0.101 0.126 0.151 0.179 0.207 0.238 0.297 0.360 0.427 0.493 0.560 0.628
10- 3 mol dm-3
"
225
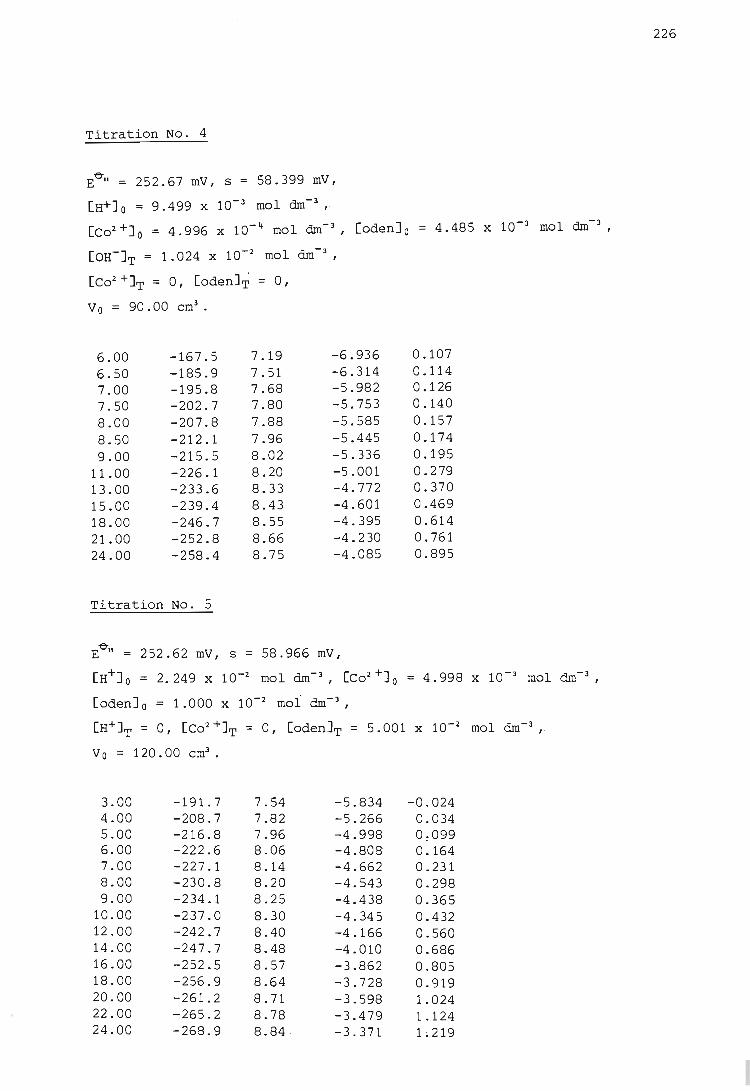
Titration No.4
E-e-" = 252.67 mV, s = 58.399 mV,
[H+]o = 9.499 x 10⁻³ mol dm-3"
[Co2 +]0 = 4.996 X 10⁻¹+ mol dm- 3, [oden] 0
[OH-]T = 1.024 x 10⁻² mol dm- 3,
[Co2 +]T = 0, [oden].r = 0,
Vo = 90.00 em3•
6.00 -167.5 7.19 -6.936 6.50 -185.9 7.51 -6.314 7.00 -195.8 7.68 -5.982 7.50 -202.7 7.80 -5.753 8.00 -207.8 7.88 -5.585 8.50 -212.1 7.96 -5.445 9.00 -215.5 8.02 -5.336
11.00 -226.1 8.20 -5.001 13.00 -233.6 8.33 -4.772 15.00 -239.4 8.43 -4.601 18.00 -246.7 8.55 -4.395 21.00 -252.8 8.66 -4.230 24.00 -258.4 8.75 -4.085
Titration No.5
-e-E " = 252.62 mV, s = 58.966 mV,
0.107 0.114 0.126 0.140 0.157 0 . 174 0.195 0.279 0.370 0.469 0.614 0.761 0.895
[H+]o = 2 .. 249 X 10-2 mol dm- J , [Co2 +10 = 4.998 X 10⁻³ mol dm-3 ,
[oden] 0 = 1.000 X 10⁻² mol dm- 3 ,
[H+]T = 0, [co2 +]T = 0, [oden]T = 5.001 x 10⁻² mol dm-3 ,
V 0 = 120. 00 em3•
3.00 -191.7 7.54 -5.834 -0.024 4.00 -208.7 7.82 -5.266 0.034 5.00 -216.8 7.96 -4.998 0~099 6.00 -222.6 8.06 -4.808 0.164 7.00 -227.1 8.14 -4.662 0.231 8.00 -230.8 8.20 -4.543 0.298 9.00 -234.1 8.25 -4.438 0.365
10.00 -237.0 8.30 -4.345 0.432 12.00 -242.7 8.40 -4.166 0.560 14.00 -247.7 8.48 -4.010 0.686 16.00 -252.5 8.57 -3.862 0.805 18.00 -256.9 8.64 -3.728 0.919 20.00 -261.2 8.71 -3.598 1.024 22.00 -265.2 8.78 -3.479 1.124 24.00 -268.9 8.84 . -3.371 1~219
226
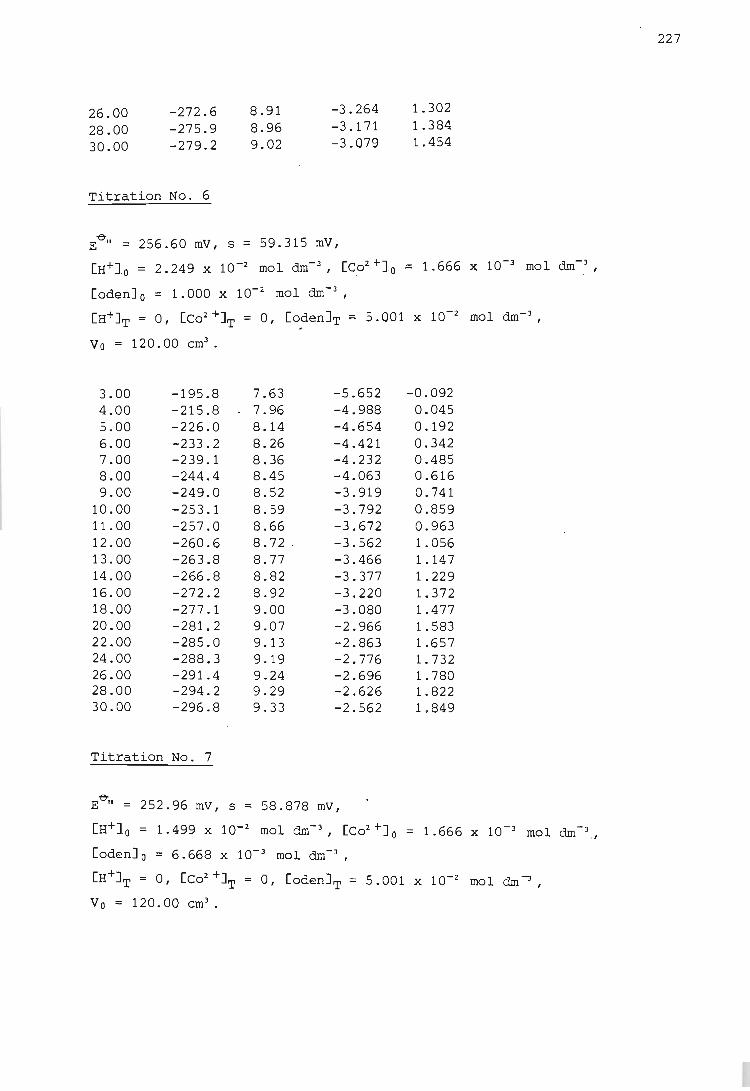
26.00 28.00 30.00
-272.6 -275.9 -279.2
Titration No.6
8.91 8.96 9.02
-3.264 -3.171 -3.079
E'O"II = 256.60 mV, s = 59.315 mV,
1.302 1.384 1.454
[H+1 o = 2.249 x 10⁻² mol dm- 3, [Co2 +1o = 1.666 x 10⁻³ mol dm- 3
,
[odenJ o = 1.000 x 10⁻² mol dm-3,
[H+JT = 0, [C02 +JT = 0, [odenJT = 5.001 x 10⁻² mol dm- 3,
Vo = 120.00 em3•
3.00 -195.8 7.63 -5.652 -0.092 4.00 -215.8 7.96 -4.988 0.045 5.00 -226.0 8.14 -4.654 0.192 6.00 -233.2 8.26 -4.421 0.342 7.00 -239.1 8.36 -4.232 0.485 8.00 -244.4 8.45 -4.063 0.616 9.00 -249.0 8.52 -3.919 0.741
10.00 -253.1 8.59 -3 . 792 0.859 11.00 -257.0 8.66 -3.672 0.963 12.00 -260.6 8.72 . -3.562 1.056 13.00 -263.8 8.77 -3.466 1.147 14.00 -266.8 8.82 -3.377 1.229 16.00 -272.2 8.92 -3.220 1.372 18.00 -277 .1 9.00 -3.080 1.477 20.00 -281. 2 9.07 -2.966 1.583 22.00 -285.0 9.13 -2.863 1.657 24.00 -288.3 9.19 -2.776 1. 732 26.00 -291.4 9.24 -2.696 1.780 28.00 -294.2 9.29 -2.626 1.822 30.00 -296.8 9.33 -2.562 1 . 849
Titration No. 7
E'O"II = 252.96 mV, s = 58.878 mV,
[H+1 0 = 1. 499 X 10- 2 mol dm- 3 , [Co2 +10 1.666 x 10⁻³ mol dm- 3
. ,
[odenJ o = 6.668 x 10⁻³ mol dm- l ,
[H+JT = 0, [Co2 +JT = 0, [odenJT = 5.001 X 10⁻² mol dm -:l ,
Vo = 120.00 em3•
227
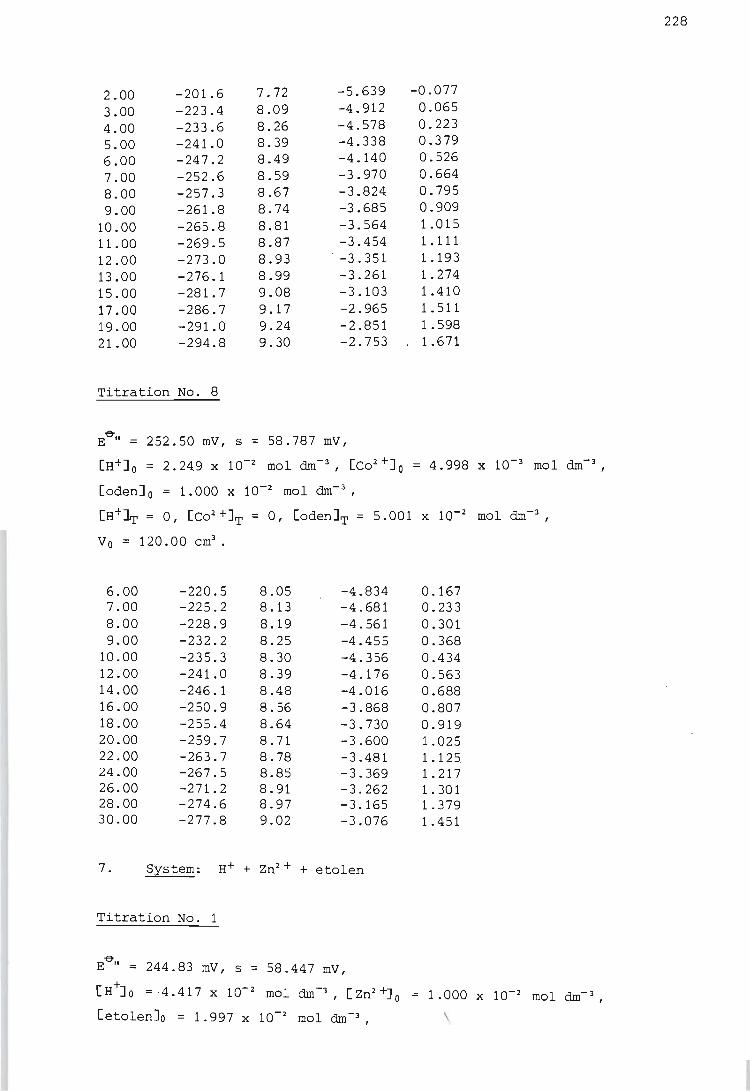
2.00 -201. 6 7.72 -5.639 -0.077
3.00 -223.4 8.09 ~4.912 0.065
4.00 -233.6 8.26 .,..4.578 0.223
5.00 -241.0 8.39 -4.338 0.379
6.00 -247.2 8.49 -4.140 0.526
7.00 -252.6 8.59 -3.970 0.664 8.00 -257.3 8.67 -3.824 0.795 9.00 -261.8 8.74 -3.685 0.909
10.00 -265.8 8.81 -3.564 1.015 11.00 -269.5 8.87 -3.454 1.111 12.00 -273.0 8.93 -3.351 1.193 13.00 -276.1 8.99 -3.261 1.274 15.00 -281.7 9.08 -3.103 1.410 17.00 -286.7 9.17 -2.965 1.511 19.00 -291.0 9.24 -2.851 1.598 21.00 -294.8 9.30 -2.753 1.671
Titration No.8
e-E " = 252.50 mV, s = 58.787 mV,
[H+]o = 2.249 X 10⁻² mol dm- 3, [Co2 +]0 = 4.998 X 10⁻³ mol dm- 3
,
[odenJ o = 1.000 x 10⁻² mol dm- 3,
[H+JT = 0, [Co2 +JT = 0, [odenJT = 5.001 x 10⁻² mol dm-3,
V 0 = 120. 00 em3 •
6.00 -220.5 8.05 -4.834 0.167 7.00 -225.2 8.13 -4.681 0.233 8.00 -228.9 8.19 -4.561 0.301 9.00 -232.2 8.25 -4.455 0.368
10.00 -235.3 8.30 -4.356 0.434 12.00 -241.0 8.39 -4.176 0.563 14.00 -246.1 8.48 -4.016 0.688 16.00 -250.9 8.56 -3.868 0.807 18.00 -255.4 8.64 -3.730 0.919 20.00 -259.7 8.71 -3.600 1.025 22.00 -263.7 8.78 -3.481 1.125 24.00 -267.5 8.85 -3.369 1. 217 26.00 -271.2 8.91 -3.262 1.301 28.00 -274.6 8.97 -3.165 1.379 30.00 -277.8 9.02 -3.076 1.451
7. System: H+ + Zn2 + + etolen
Titration No. 1
Ee-" = 244.83 mV, s = 58.447 mV,
[H+Jo = ·4.417 x 10- 2 mol dm-3, [Zn2 +10 = 1.000 x 10⁻² mol dm- 3 ,
[etolenJo = 1.997 x 10⁻² mol dm- 3 ,
228
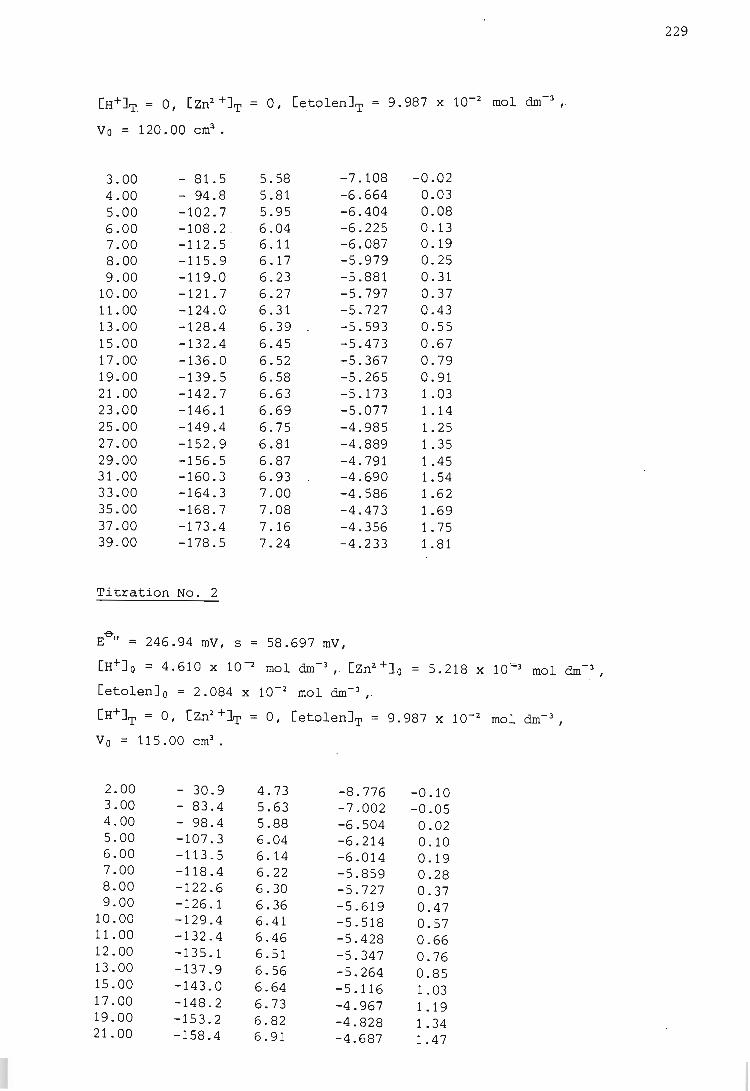
[H+IT = 0, [zn2 +JT = 0, [etolenJT = 9.987 x 10⁻² mol dm-3,
V 0 = 120. 00 eml • .
3.00 4.00 5.00 6.00 7.00 8.00 9.00
10.00 11.00 13.00 15.00 17.00 19.00 21.00 23.00 25.00 27.00 29.00 31.00 33.00 35.00 37.00 39.00
- 81.5 - 94.8 -102.7 -108.2 . -112.5 -115.9 -119.0 -121.7 -124.0 -128.4 -132.4 -136.0 -139.5 -142.7 -146.1 -149.4 -152.9 -156.5 -160.3 -164.3 -168.7 -173.4 -178.5
Titration No.2
5.58 5.81 5.95 6.04 6.11 6.17 6.23 6.27 6.31 6.39 6.45 6.52 6.58 6.63 6.69 6.75 6.81 6.87 6.93 7.00 7.08 7.16 7.24
-7.108 -6.664 -6.404 -6.225 -6.087 -5.979 -5.881 -5.797 -5.727 -5.593 -5.473 -5.367 -5.265 -5.173 -5.077 -4.985 -4.889 -4.791 -4.690 -4.586 -4.473 -4.356 -4.233
E~" = 246.94 mV, s = 58.697 mV,
-0.02 0.03 0.08 0.13 0.19 0.25 0.31 0.37 0.43 0.55 0.67 0.79 0.91 1.03 1.14 1.25 1.35 1.45 1.54 1.62 1.69 1. 75 1.81
[H+l o = 4.610 x 10' mol dm- l, [Zn2 +10 = 5.218 x 10~3 mol dm-3 ,
[etolenJ o = 2.084 x 10⁻² mol dm-l , .
[H+JT = 0, [Zn2 +1T = 0, [etolenJT = 9.987 x 10⁻² mol dm-3 ,
Vo = 115.00 em3 .
2.00 - 30.9 4.73 -8.776 -0.10 3.00 - 83.4 5.63 -7.002 -0.05 4.00 - 98.4 5.88 -6.504 0.02 5.00 -107.3 6.04 -6.214 0.10 6.00 -113.5 6.14 -6.014 0.19 7.00 -118.4 6.22 -5.859 0.28 8.00 -122.6 6.30 -5.727 0.37 9.00 -126.1 6.36 -5.619 0.47
10.00 -129.4 6.41 -5.518 0.57 11.00 -132.4 6.46 -5.428 0.66 12.00 -135.1 6.51 -5.347 0.76 13 .00 -137.9 6.56 -5.264 0.85 15.00 -143.0 6.64 -5.116 1.03
. 17.00 -148.2 6.73 -4.967 1.19 19.00 -153.2 6.82 -4.828 1.34 21.00 -158.4 6.91 -4.687 1.47
229
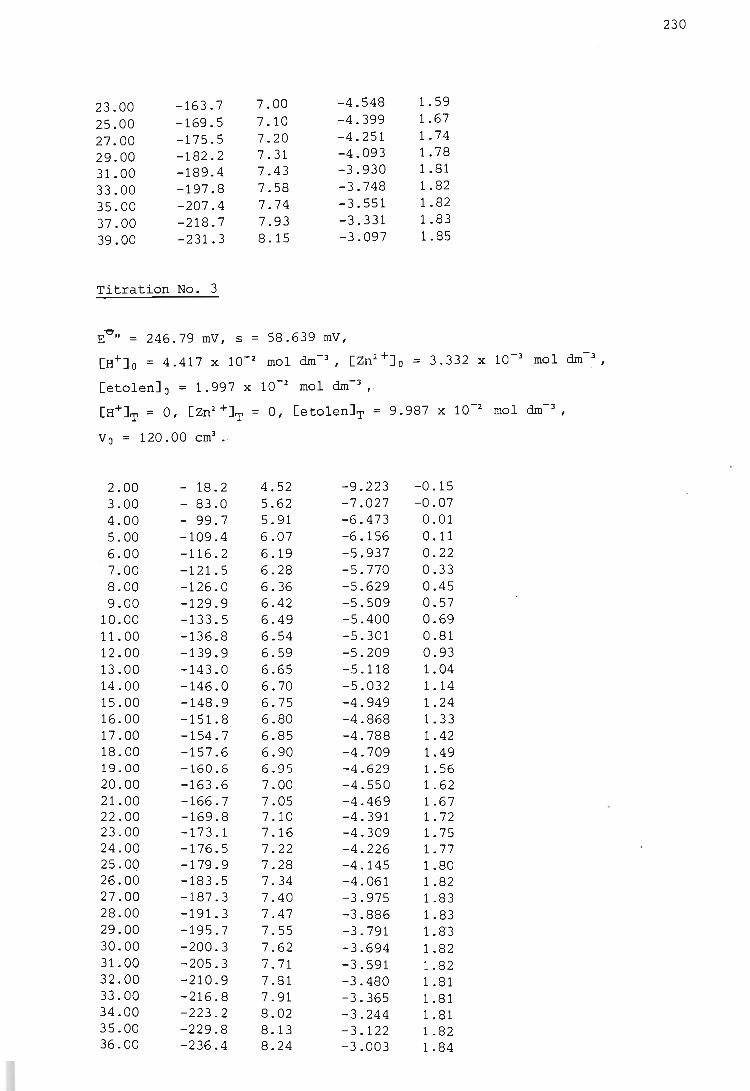
23.00 25.00 27..00 29.00 31.00 33.00 35.00 37.00 39.00
-163.7 -169.5 -175.5 -182.2 -189.4 -197.8 -207.4 -218.7 -231. 3
Titration No.3
7.00 7.10 7.20 7.31 7.43 7.58 7.74 7.93 8.15
-4.548 -4 . 399 -4.251 -4.093 -3.930 -3.748 -3.551 -3.331 -3.097
Ee" = 246.79 mV, 5 = 58.639 mV,
1.59 1.67 1. 74 1. 78 1.81 1.82 1 .. 82 1.83 1.85
[H+]o = 4.417 x 10⁻² mol dm-3, [Zn2 +]o = 3.332 x 10⁻³ mol dm- 3
I
[etolenJ o = 1.997 x 10⁻² mol dm- 3,
[H+JT = 0, [zn2 +JT = 0, [etolenJT = 9.987 x 10⁻² mol dm- 3,
Vo = 120.00 em3•
2.00 3.00 4.00 5.00 6.00 7.00 8.00 9.00
10.00 11.00 12.00 13.00 14.00 15.00 16.00 17.00 18.00 19.00 20.00 21.00 22.00 23.00 24.00 25.00 26.00 27.00 28.00 29.00 30.00 31.00 32.00 33.00 34.00 35.00 36.00
- 18.2 - 83.0 - 99.7 -109.4 -116.2 -121.5 -126.0 -129.9 -133.5 -136.8 -139.9 -143.0 -146.0 -148.9 -151.8 -154.7 -157.6 -160.6 -163.6 -166.7 -169.8 -173.1 -176.5 -179.9 -183.5 -187.3 -191.3 -195.7 -200.3 -205.3 -210.9 -216.8 -223 . 2 -229.8 -236.4
4.52 5.62 5.91 6.07 6.19 6.28 6.36 6.42 6.49 6.54 6.59 6.65 6.70 6.75 6.80 6.85 6.90 6.95 7.00 7.05 7.10 7.16 7.22 7.28 7.34 7.40 7.47 7.55 7.62 7.71 7.81 7.91 8.02 8.13 8.24
-9.223 -7.027 -6.473 -6.156 -5.937 -5.770 -5.629 -5.509 -5.400 -5.301 -5.209 -5.118 -5.032 -4.949 -4.868 -4.788 -4.709 -4.629 -4.550 -4.469 -4.391 -4.309 -4.226 -4.145 -4.061 -3.975 -3.886 -3.791 -3.694 -3.591 -3.480 -3.365 -3.244 -3.122 -3.003
-0.15 -0.07
0.01 0.11 0.22 0.33 0.45 0.57 0.69 0.81 0.93 1.04 1.14 1.24 1.33 1.42 1.49 1.56 1.62 1.67 1.72 1. 75 1.77 1.80 1.82 1.83 1.83 1.83 1.82 1.82 1.81 1.81 1.81 1.82 1.84
230
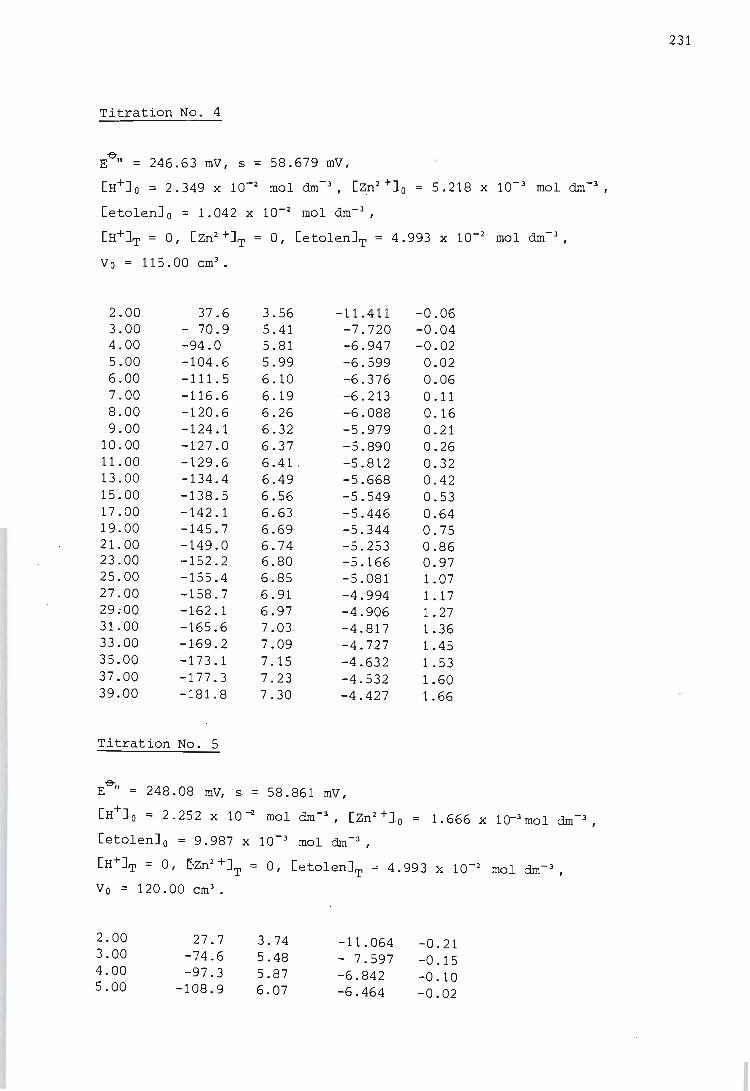
Titration No.4
~ E II = 246.63 mV, s = 58.679 mV,
[H+10 = 2.349 X 10⁻² mol dm -3, [Zn2 +]0 5.218 X 10- 3 mol dm-3,
[etolen]o = 1.042 x 10⁻² mol dm- 3,
[H+IT = 0, [zn2 +]T = 0, [etolen]T = 4.993 x 10⁻² mol dm- 3,
Vo = 115.00 em3•
2.00 3.00 4.00 5.00 6.00 7.00 8.00 9.00
10.00 11.00 13.00 15.00 17.00 19.00 21.00 23.00 25.00 27.00 29;00 31.00 33.00 35.00 37.00 39.00
37.6 - 70.9 -94.0 -104.6 -111.5 -116.6 -120.6 -124.1 -127.0 -129.6 -134.4 -138.5 -142.1 -145.7 -149.0 -152.2 -155.4 ~158.7
-162.1 -165.6 -169.2 -173.1 -177.3 -181.8
Titration No.5
3.56 5.41 5.81 5.99 6.10 6.19 6.26 6.32 6.37 6.41 ' 6.49 6.56 6.63 6.69 6.74 6.80 6.85 6.91 6.97 7.03 7.09 7.15 7.23 7.30
-11.411 -7.720 -6.947 -6.599 -6.376 -6.213 -6.088 -5.979 -5.890 -5.812 -5.668 -5.549 -5.446 -5.344 -5.253 -5.166 -5.081 -4.994 -4.906 -4.817 -4.727 -4.632 -4.532 -4.427
-0.06 -0.04 -0.02
0.02 0.06 0.11 0.16 0.21 0.26 0.32 0.42 0.53 0.64 0.75 0.86 0.97 1.07 1.17 1.27 1.36 1.45 1.53 1.60 1.66
-e-E 11 = 248.08 mV,s = 58.861 mV,
[H+]o = 2.252 x 10⁻² mol dm-3, [Zn2+]0 1.666 x 1O-3 mol dm- 3 ,
[etolen]o = 9.987 x 10⁻³ mol dm-3 ,
[H+]T = 0, ~zn2+]T = 0, [etolen]T = 4.993 x 10⁻² mol dm- 3 ,
Vo = 120.00 em3•
2.00 3.00 4.00 5.00
27.7 -74.6 -97.3
-108.9
3.74 5.48 5.87 6.07
-11 . 064 -0 . 21 - 7.597 -0.15 -6.842 -0.10 -6.464 -0.02
231
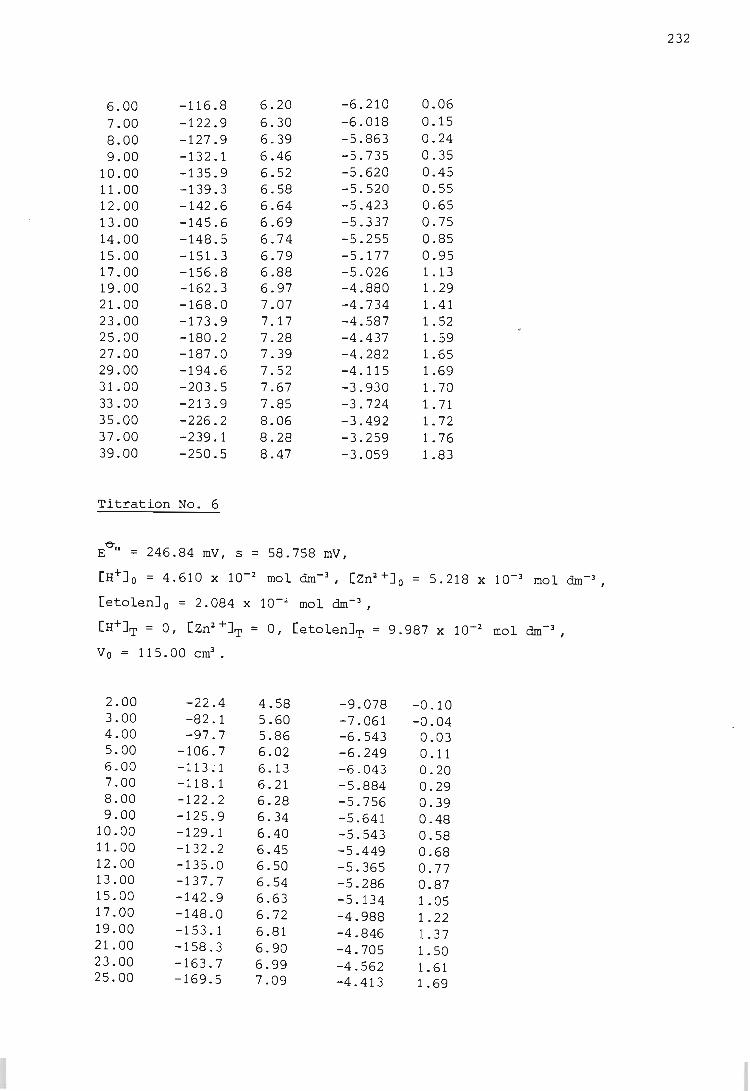
232
6.00 -116.8 6.20 -6.210 0.06
7.00 -122.9 6.30 -6.018 0.15
8.00 -127.9 6.39 -5.863 0.24
9.00 -132.1 6.46 -5.735 0.35 10.00 -135.9 6.52 -5.620 0.45 11.00 -139.3 6.58 -5.520 0.55 12.00 -142.6 6.64 -5.423 0.65 13.00 -145.6 6.69 -5.337 0.75 14.00 -148.5 6.74 -5.255 0.85 15.00 -151.3 6.79 -5.177 0.95 17.00 -156.8 6.88 -5.026 1.13 19.00 -162.3 6.97 -4.880 1.29 21.00 -168.0 7.07 -4.734 1.41 23.00 -173.9 7.17 -4.587 1.52 25.00 -180.2 7.28 -4.437 1.59 27.00 -187.0 7.39 -4.282 1.65 29.00 -194.6 7.52 -4.115 1.69 31.00 -203.5 7.67 -3.930 1. 70 33.00 -213.9 7.85 -3.724 1. 71 35.00 -226.2 8.06 -3.492 1.72 37.00 -239.1 8.28 -3.259 1. 76 39.00 -250.5 8.47 -3.059 1.83
Titration No. 6
E~11 = 246.84 mV, 5 = 58.758 mV,
LH+10 = 4.610 x 10⁻² mol dm- 3 , [Zn2 +10 = 5.218 x 10- 3 mol dm- 3 , .
[eta len] 0 = 2.084 x 10⁻² mol dm- 3 ,
[H+]T = 0, [Zn2 +] T = 0, [etolen]T = 9.987 x 10⁻² mol dm-3 ,
Vo = 115.00 em3•
2.00 -22.4 4.58 -9.078 -0.10 3.00 -82.1 5.60 -7.061 -0.04 4.00 -97.7 5.86 -6.543 0.03 5.00 -106.7 6.02 -6.249 0.11 6.00 -113~1 6.13 -6.043 0.20 7.00 -118.1 6.21 -5.884 0.29 8.00 -122.2 6.28 -5. 756 0.39 9.00 -125.9 6.34 -5.641 0.48
10.00 -129.1 6.40 -5.543 0.58 11.00 -132.2 6.45 -5.449 0.68 12.00 -135.0 6.50 -5.365 0.77 13.00 -137.7 6.54 -5.286 0.87 15.00 -142.9 6.63 -5.134 1.05 17.00 -148.0 6.72 -4.988 1.22 19.00 -153.1 6.81 -4.846 1. 37 21.00 -158.3 6.90 -4.705 1. 50 23.00 -163.7 6.99 -4.562 1. 61 25.00 -169.5 7.09 -4.413 1.69
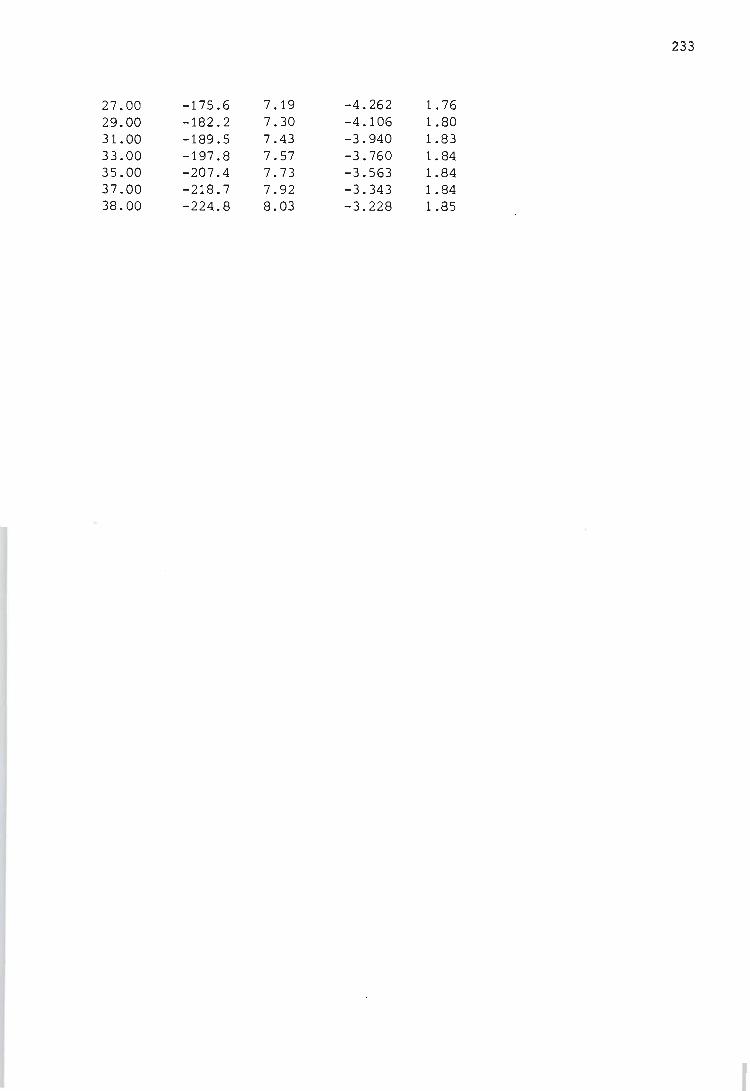
233
27.00 -175.6 7.19 -4.262 1. 76 29.00 -182.2 7.30 -4.106 1.80 31 . 00 -189.5 7.43 -3.940 1.83 33.00 -197.8 7.57 -3.760 1.84 35.00 -207.4 7.73 -3.563 1.84 37 . 00 -218.7 7.92 -3.343 1.84 38.00 -224.8 8.03 -3.228 1.85
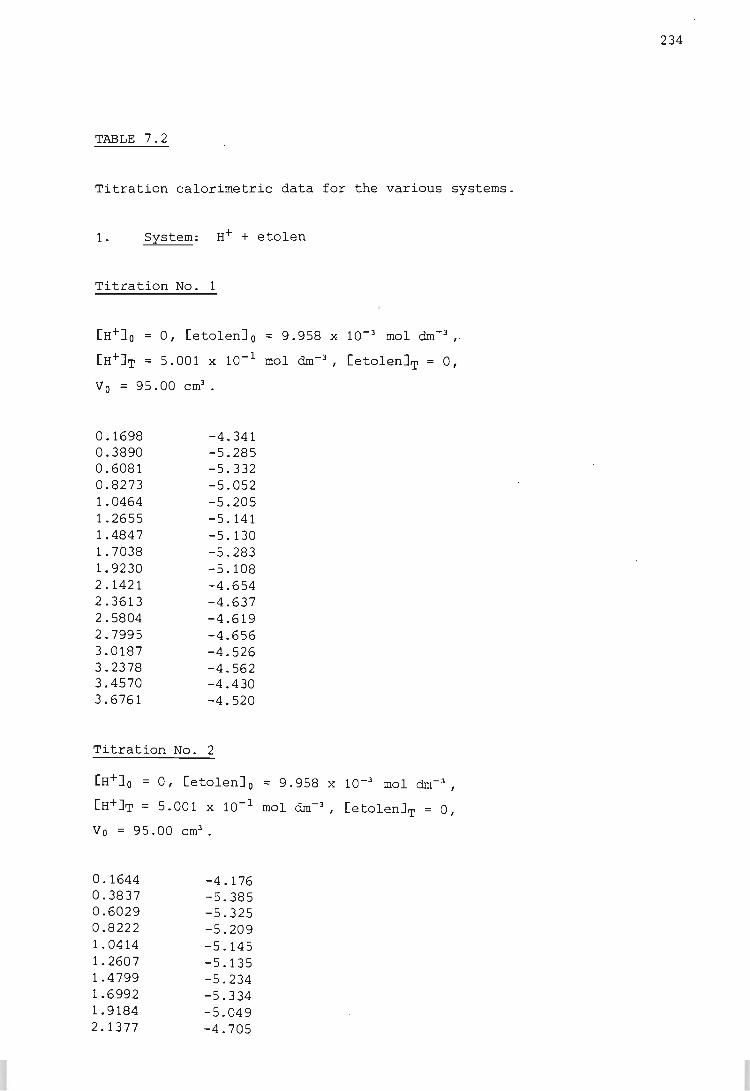
TABLE 7.2
Titration calorimetric data for the various systems.
1. System: H+ + etolen
Titration No.1
[H+]O = 0, [etolenJ a = 9.958 X 10⁻³ mol dm-3 , .
[H+1T = 5.001 x 10- 1 mol dm- 3, [etolenJT = 0,
Va = 95.00 cm3•
0.1698 -4.341 0.3890 -5.285 0.6081 -5.332 0.8273 -5.052 1.0464 -5.205 1.2655 -5.141 1.4847 -5.130 1.7038 -5.283 1. 9230 -5.108 2.1421 -4.654 2.3613 -4.637 2.5804 -4.619 2.7995 -4.656 3.0187 -4.526 3.2378 -4.562 3.4570 -4.430 3.6761 -4.520
Titration No.2
0, [etolenJ o = 9.958 x 10⁻³ mol dm- 3 I
5.001 X 10- 1 mol dm- 3, [etolenJT = 0,
Va = 95.00 cm3•
0.1644 -4.176 0.3837 -5.385 0.6029 -5.325 0.8222 -5.209 1. 0414 -5.145 1.2607 -5.135 1.4799 -5.234 1.6992 -5.334 1.9184 -5.049 2.1377 -4.705
234
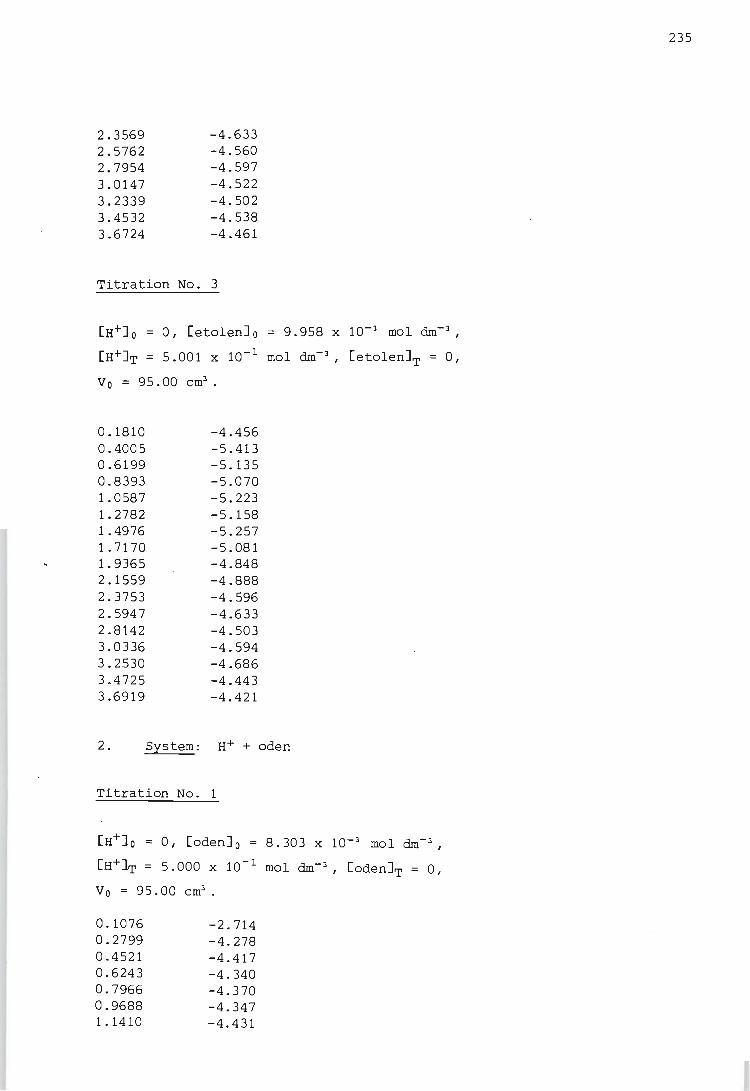
2.3569 -4.633 2.5762 -4.560 2.7954 -4.597 3.0147 -4.522 3.2339 -4.502 3.4532 -4.538 3.6724 -4.461
Titration No.3
= 0, [etolenJ a = 9.958 x 10⁻³ mol dm- 3,
5.001 x 10⁻¹ mol dm- 3, [etolenJT = 0,
Va = 95.00 em3•
0.1810 -4.456 0.4005 -5.413 0.6199 -5.135 0.8393 -5.070 1.0587 -5.223 1.2782 -5.158 1.4976 -5.257 1.7170 -5.081 1.9365 -4.848 2.1559 -4.888 2 . 3753 -4.596 2.5947 -4.633 2.8142 -4.503 3.0336 -4.594 3.2530 -4.686 3.4725 -4.443 3.6919 -4.421
2. System: H+ + aden
Titration No.1
[H+l a = 0, [odenJ a = 8.303 X 10⁻³ mol dm- 3 I
[H+IT 5.000 x 10- 1 mol dm- J I [odenJT = 0,
Va = 95.00 em3•
0.1076 -2.714 0.2799 -4.278 0.4521 -4.417 0.6243 -4.340 0.7966 -4.370 0.9688 -4.347 1.1410 -4.431
235
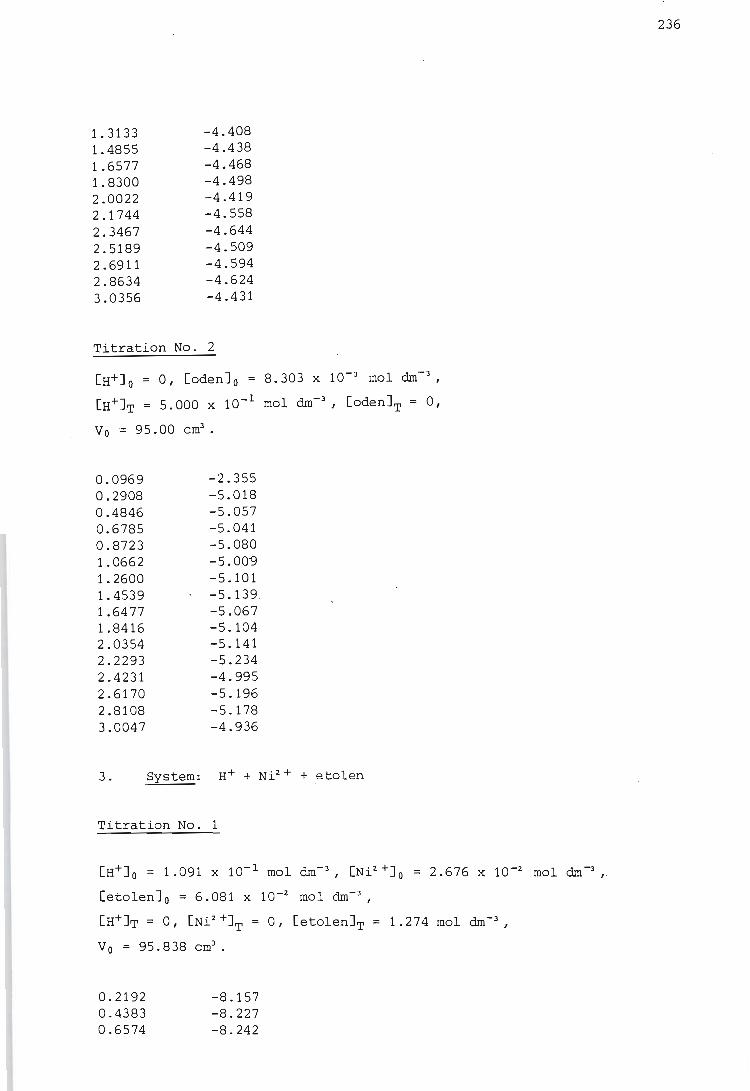
1.3133 -4.408 1. 4855 -4.438 1.6577 -4.468 1.8300 -4.498 2.0022 -4.419 2.1744 -4.558 2.3467 -4.644 2.5189 -4.509 2.6911 -4.594 2.8634 -4.624 3.0356 -4.431
Titration No.2
[H+J O = 0, [odenJ o 8.303 x 10⁻³ mol dm- 3 ,
[H+IT = 5.000 X 10- 1 mol dm- 3 I [odenJT = 0,
Vo = 95.00 em3•
0.0969 -2.355 0.2908 -5.018 0.4846 -5.057 0.6785 -5.041 0.8723 -5.080 1. 0662 -5.00"9 1.2600 -5.101 1. 4539 -5.139 1.6477 -5.067 1.8416 -5.104 2.0354 -5.141 2.2293 -5.234 2.4231 -4.995 2.6170 -5.196 2.8108 -5.178 3.0047 -4.936
3. System: H++ Ni 2 + + etolen
Titration No.1
[H+J O = 1.091 x 10- 1 mol dm- 3, [Ni2 +1o = 2.676 x 10⁻² mol dm',
[etolenJ o = 6.081 x 10⁻² mol dm- 3 ,
[H+JT = 0, [Ni2 +JT = 0, [etolenJT = 1.274 mol dm- 3 ,
Vo = 95.838 em3•
0.2192 0.4383 0.6574
-8.157 -8.227 -8.242
236
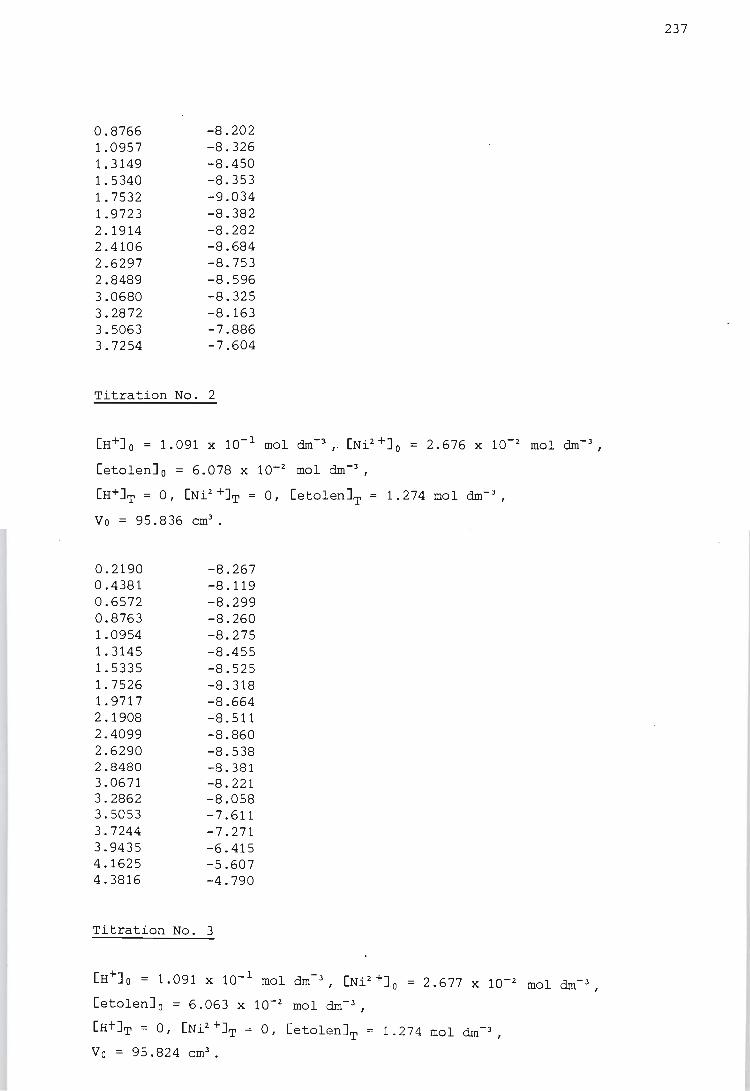
0.8766 -8.202 1.0957 -8.326 1. 3149 -8.450 1.5340 -8.353 1.7532 -9.034 1.9723 -8.382 2.1914 -8.282 2.4106 -8.684 2.6297 -8.753 2.8489 -8.596 3.0680 -8.325 3.2872 -8.163 3.5063 -7.886 3.7254 -7.604
Titration No.2
[H+J O = 1.091 x 10- 1 mol dm-:l, . [Ni2 +]0 = 2.676 x 10- 2 mol dm- 3 ,
[etolenJ o = 6.078 x 10⁻² mol dm-3,
[H+JT = 0, [Ni2 +JT = 0, [etolenJT = 1.274 mol dm- 3,
Vo = 95.836 em3•
0.2190 -8.267 0.4381 -8.119 0.6572 -8.299 0.8763 -8.260 1.0954 -8.275 1. 3145 -8.455 1.5335 -8.525 1. 7526 -8.318 1. 971 7 -8.664 2.1908 -8.511 2.4099 -8.860 2.6290 -8.538 2.8480 -8.381 3.0671 -8.221 3.2862 -8.058 3.5053 -7.611 3.7244 -7.271 3.9435 -6.415 4.1625 -5.607 4.3816 -4.790
Titration No.3
[H+lo = 1. 091 X 10- 1 mol dm -3, [Ni 2 +]0 = 2.677 X 10⁻² mol dm- 3 ,
[etolenJ o = 6.063 x 10⁻² mol dm- 3 ,
[HtJT = 0, [Ni2+J~ = 0, [etolenJT = 1.274 mol dm- 3 ,
Vo = 95.824 em3•
237
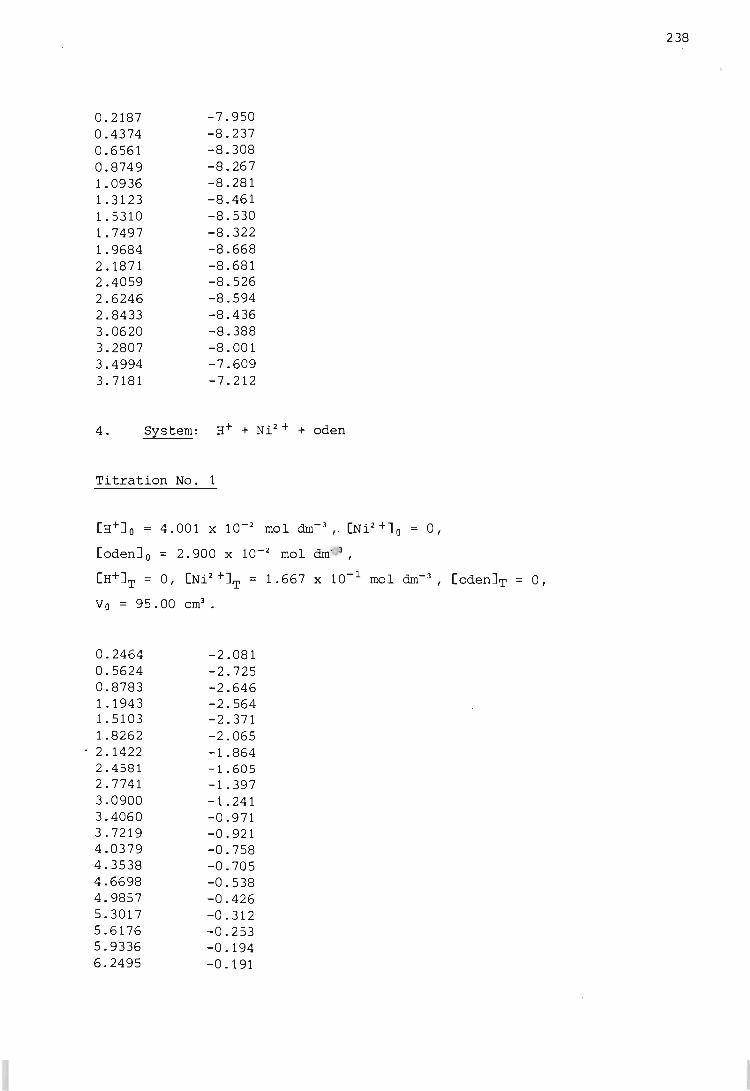
0.2187 -7.950 0.4374 -8.237 0.6561 -8.308 0.8749 -8.267 1. 0936 -8.281 1. 3123 -8.461 1. 5310 -8.530 1.7497 -8.322 1.9684 -8.668 2.1871 -8.681 2.4059 -8.526 2.6246 -8.594 2.8433 -8.436 3.0620 -8.388 3.2807 -8.001 3.4994 -7.609 3.7181 -7.212
4. System: H+ + Ni2 + + oden
Titration No.1
[H+J a ::; 4.001 x 10⁻² mol dm- J, [Ni2 +1a ::; 0,
[oden]a ::; 2.900 x 10⁻² mol dm' J ,
[H+JT ::; 0, [Ni2 +JT ::; 1 . 667 x 10- 1 mol dm- J, [odenJT = 0,
Va ::; 95.00
0.2464 0.5624 0.8783 1.1943 1. 5103 1.8262 2.1422 2.4581 2.7741 3.0900 3.4060 3.7219 4.0379 4.3538 4.6698 4.9857 5.3017 5.6176 5.9336 6.2495
-2.081 -2.725 -2.646 -2.564 -2.371 -2.065 -1.864 -1.605 -1.397 -1.241 -0.971 -0.921 -0.758 -0.705 -0.538 -0.426 -0.312 -0.253 -0.194 -0.191
238
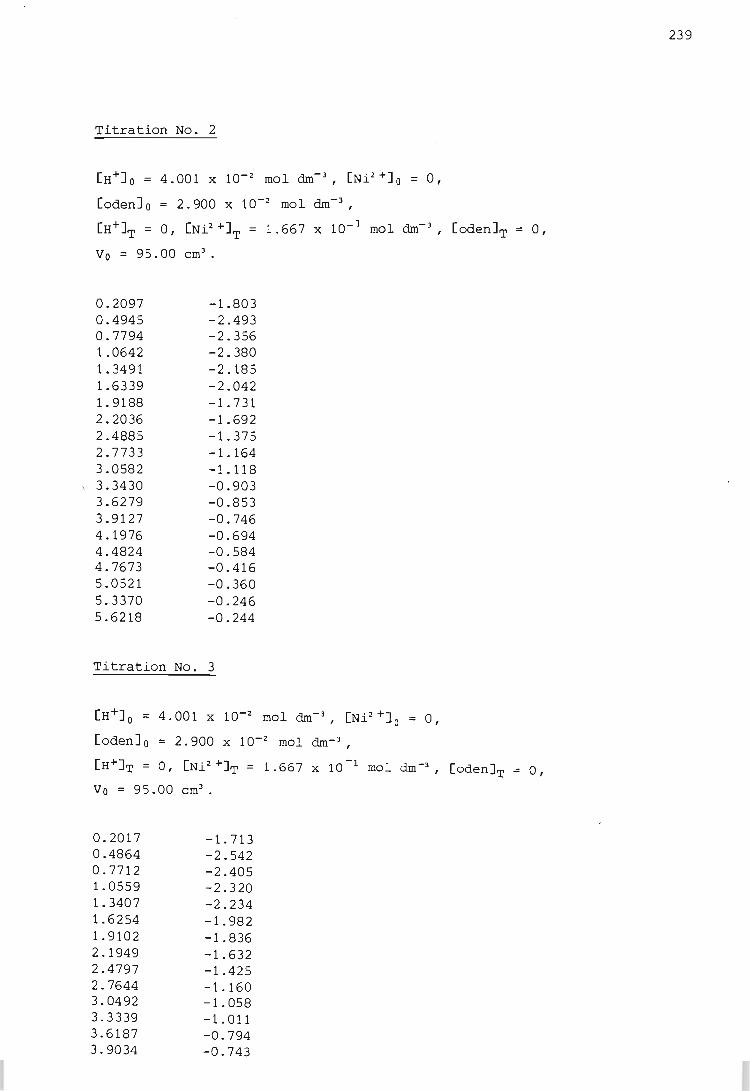
Titration No.2
[H+J O ::; 4.001 x 10⁻² mol dm- 3, [Ni2 +J o ::; 0,
[odenJ o ::; 2.900 x 10⁻² mol dm- 3,
[H+JT ::; 0, [Ni2 +JT ::; 1.667 x 10- 1 mol dm- 3 , [odenJT ::; 0,
Vo ::; 95.00
0.2097 0.4945 0.7794 1.0642 1.3491 1.6339 1. 9188 2.2036 2.4885 2.7733 3.0582
, 3.3430 3.6279 3.9127 4.1976 4.4824 4.7673 5.0521 5.3370 5.6218
-1.803 -2.493 -2.356 -2.380 -2.185 -2.042 -1.731 -1. 692 -1. 375 -1.164 -1.118 -0.903 -0.853 -0.746 -0.694 -0.584 -0.416 -0.360 -0.246 -0.244
Titration No.3
[H+J O ::; 4.001 x 10⁻² mol dm- 3 , [Ni2 +J. o ::; 0,
[odenJ o ::; 2.900 x 10⁻² mol dm- 3 ,
[H+]T = 0, [Ni 2 +JT = 1.667 x 10⁻¹ mol dm-3, [oden]T ::; 0,
Vo ::; 95.00
0.2017 0.4864 0.7712 1.0559 1.3407 1.6254 1.9102 2.1949 2.4797 2.7644 3.0492 3.3339 3.6187 3.9034
-1.713 -2.542 -2.405 -2.320 -2.234 -1.982 -1. 836 -1.632 -1.425 -1.160 -1.058 -1.011 -0.794 -0.743
239

4.1882 -0.635 4.4729 -0.582 4.7577 -0.415 5.0424 -0.359 5.3272 -0.245 5.6119 -0.187
Titration No.4
[H+J 0 = 4.001 X 10⁻² mol dm-3, [Ni 2 +10 0,
[odenJ o = 2.900 x 10⁻² mol dm- 3,
[H+JT = 0, [Ni2 +JT = 1.667 x 10⁻¹ mol dm- 3 I [odenJT = 0,
V 0 = 95. 00 em3 •
0.2039 -1. 733 0.4884 -2.531 0.7729 -2.447 1.0574 -2.363 1. 3419 -2.222 1.6264 -2.024 1. 9109 -1. 878 2.1954 -1.620 2.4799 -1.413 2.7644 -:-1.203 3.0489 -1.101 3.3334 -0.998 3.6179 -0.838 3.9024 -0.731 4.1869 -0.566 4.4714 -0.569 4.7559 -0.459 5.0404 -0.290 5.3249 -0.290 5.6094 -0.175
5. System: H+ + Co2 ++ etolen
Titration No.1
[H+J O = 1.091 x 10- 1 mol dm- 3, [Co 2 +10 = 2.974 x 10⁻² mol dm- 3 ,
[etolenJ o = 6.085 x 10⁻² mol dm-3 ,
[H+JT = 0, [C02 +JT = 0, [etolenJT = 1.274 mol dm- 3 ,
Vo = 95.842 em3•
240
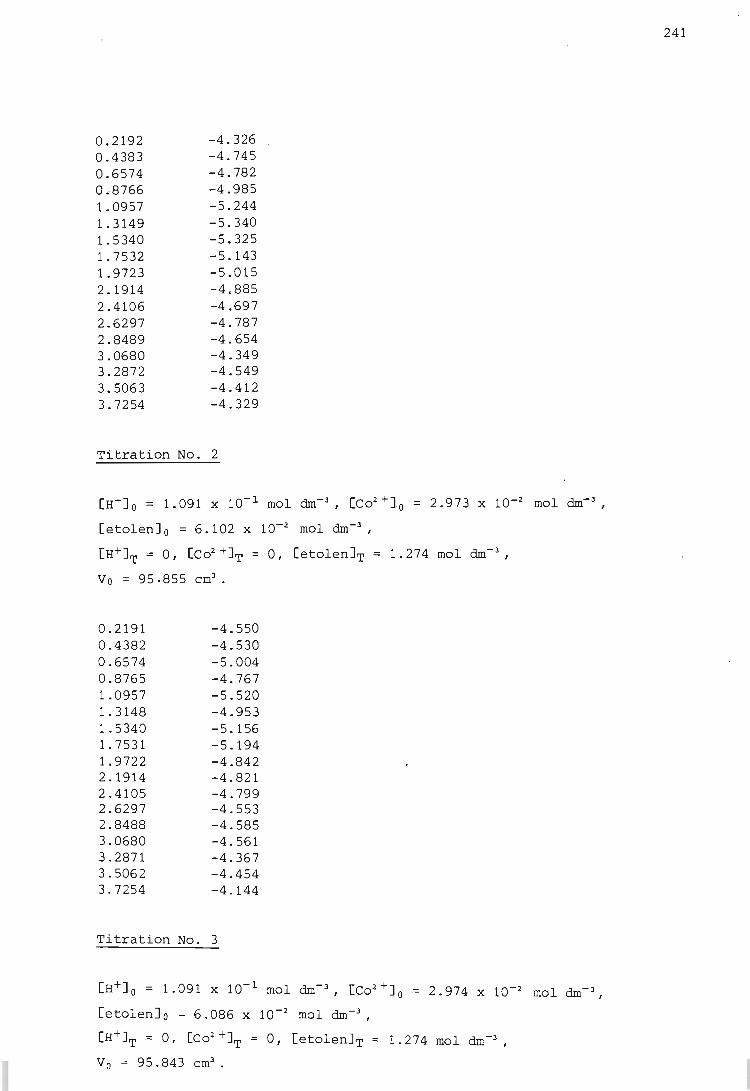
0.2192 -4.326 0.4383 -4.745 0.6574 -4.782 0.8766 -4.985 1. 0957 -5.244 1.3149 -5.340 1.5340 -5.325 1.7532 -5.143 1.9723 -5.015 2.1914 -4.885 2.4106 -4.697 2.6297 -4.787 2.8489 -4.654 3.0680 -4.349 3.2872 -4.549 3.5063 -4.412 3.7254 -4.329
Titration No.2
2.973 X 10⁻² mol dm- 3, .
[etolenJ a = 6.102 x 10⁻² mol dm-3,
[H+JT = 0, [C02 +JT = 0, [etolenJT = 1.274 mol dm- 3 ,
Va = 95.855 em3•
0.2191 -4.550 0.4382 -4.530 0.6574 -5.004 0.8765 -4.767 1.0957 -5.520 1.3148 -4.953 1.5340 -5.156 1.7531 -5.194 1.9722 -4.842 2.1914 -4.821 2.4105 -4.799 2.6297 -4.553 2.8488 -4.585 3.0680 -4.561 3.2871 -4.367 3.5062 -4.454 3.7254 -4.144
Titration No.3
[H+J a = 1.091 x 10- 1 mol dm- 3 , [Co2 +]a
[etolenJ a = 6.086 x 10⁻² mol dm-3 ,
[H+JT = 0, [C02 +JT = 0, [etolenJT = 1.274 mol dm-3 ,
Va = 95.843 em3•
241
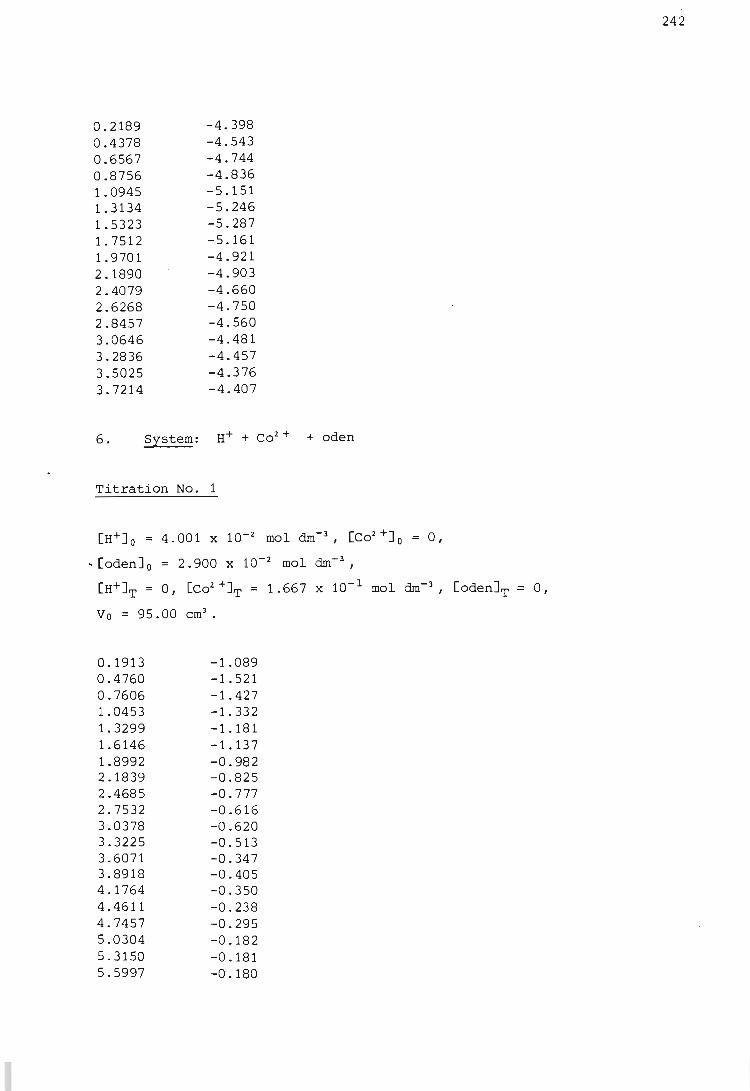
0.2189 -4.398 0.4378 -4.543 0.6567 -4.744 0.8756 -4.836 1.0945 -5.151 1.3134 -5.246 1.5323 -5.287 1. 7512 -5.161 1. 970 1 -4.921 2.1890 -4.903 2.4079 -4.660 2.6268 -4.750 2.8457 -4.560 3.0646 -4.481 3.2836 -4.457 3.5025 -4.376 3.7214 -4.407
6. System: H+ + Co2 + + oden
Titration No.1
[H+]O = 4.001 x 10⁻² mol dm- 3, [Co2 +]o = 0,
-[odenJ a = 2.900 x 10⁻² mol dm- 3,
[H+JT = 0, [C02 +JT = 1.667 x 10⁻¹ mol dm- 3, [odenJT = 0,
Va = 95.00
0.1913 0.4760 0.7606 1.0453 1.3299 1.6146 1.8992 2.1839 2.4685 2.7532 3.0378 3.3225 3.6071 3.8918 4.1764 4.4611 4.7457 5.0304 5.3150 5.5997
-1.089 -1.521 -1.427 -1. 332 -1.181 -1.137 -0.982 -0.825 -0.777 -0.616 -0.620 -0.513 -0.347 -0.405 -0.350 -0.238 -0.295 -0.182 -0.181 -0.180
242
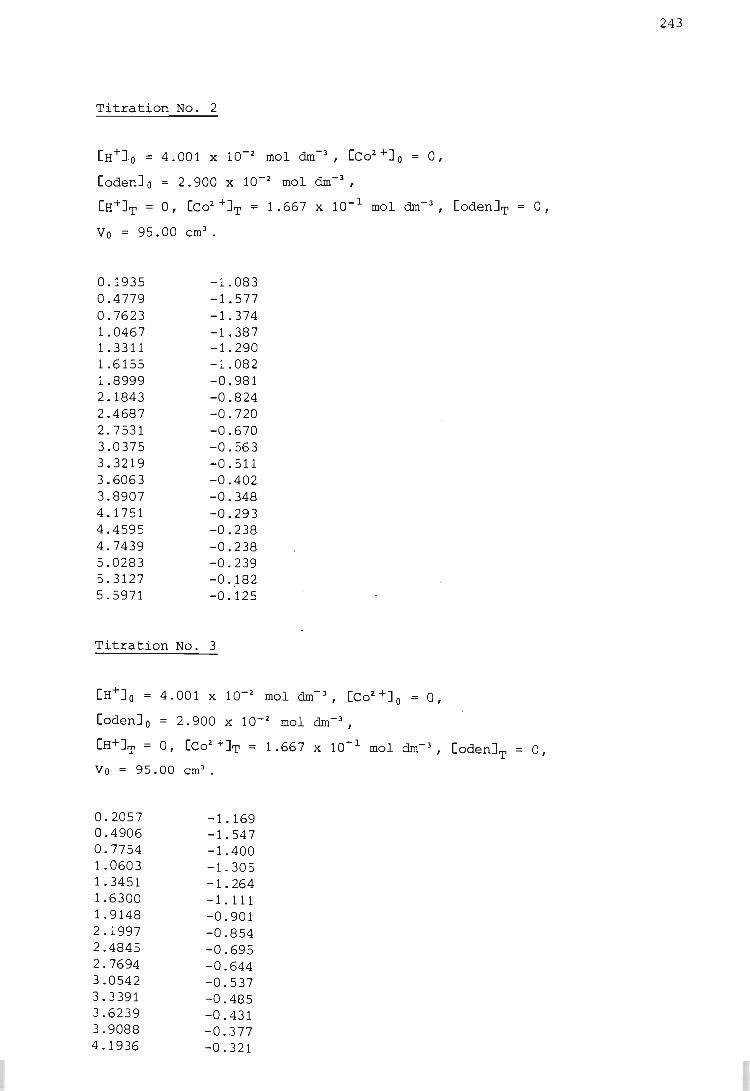
Titration No.2
[H+l o = 4.001 x 10⁻² mol dm-3, [co2 +1o 0,
[odenJ o = 2.900 x 10⁻² mol dm-3,
[H+JT = 0, [C02 +JT = 1.667 x 10- 1 mol dm- 3 I [odenJT = 0,
Vo = 95.00 em3•
0.1935 -1.083 0.4779 -1.577 0.7623 -1.374 1.0467 -1. 387 1. 3311 -1.290 1.6155 -1.082 1.8999 -0.981 2.1843 -0.824 2.4687 -0.720 2.7531 -0.670 3.0375 -0.563 3.3219 -0.511 3.6063 -0.402 3.8907 -0.348 4.1751 -0.293 4.4595 -0.238 4.7439 -0.238 5.0283 -0.239 5.3127 -0.182 5.5971 -0.125
Titration No.3
[H+]O = 4.001 x 10⁻² mol dm- 3 I [Co2 +1o = 0,
[odenJ o = 2.900 x 10⁻² mol dm- 3 ,
[H+ JT = 0, [Co2 +IT = 1. 667 x 10- 1 mol dm- 3 , [odenJT =: 0,
Vo = 95.00 ern' .
0.2057 -1.169 0.4906 -1.547 0.7754 -1.400 1.0603 -1. 305 1. 3451 -1.264 1.6300 -1.111 1. 9148 -0.901 2.1997 -0.854 2.4845 -0.695 2.7694 -0.644 3.0542 -0.537 3.3391 -0.485 3.6239 -0.431 3.9088 -0.377 4.1936 -0.321
243
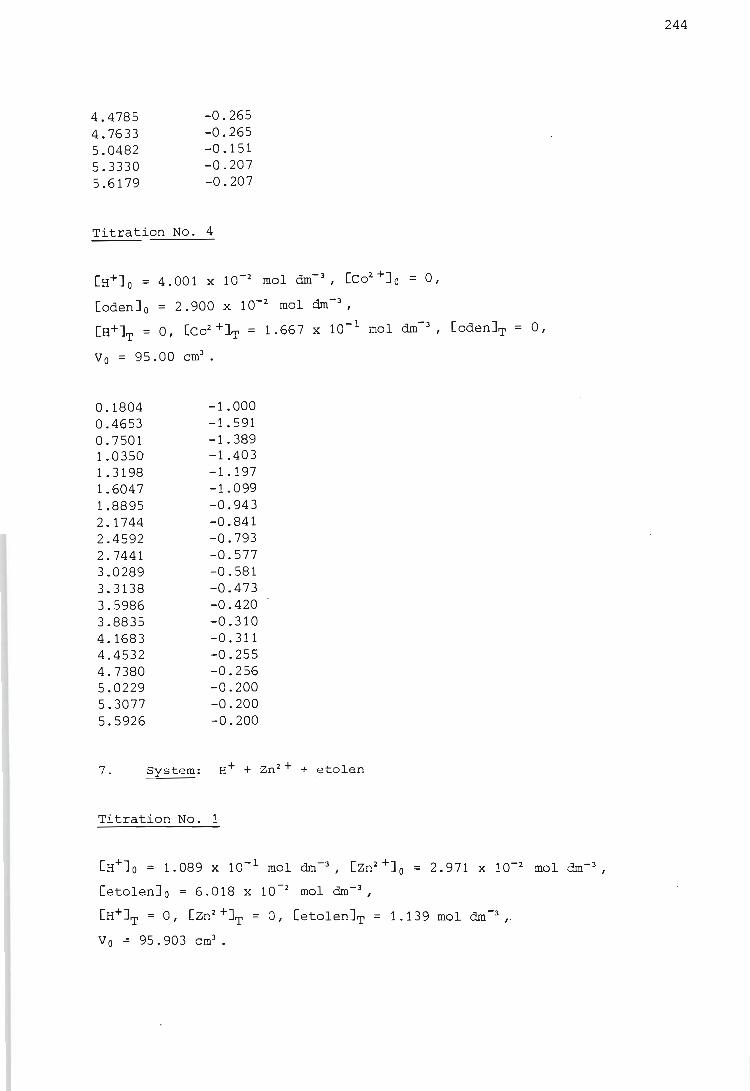
4.4785 -0.265 4.7633 -0.265 5.0482 -0.151 5.3330 -0.207 5.6179 -0.207
Titration No.4
[H+J 0 = 4.001 X 10⁻² mol dm- 3, [Co2 +10 = 0,
[odenJ o = 2.900 x 10⁻² mol dm- 3 ,
[H+JT = 0, [Co2 +1T = 1.667 x 10- 1 mol dm- 3, [oden]T 0,
Vo = 95.00 em3•
0.1804 -1.000 0.4653 -1.591 0.7501 -1.389 1.0350' -1.403 1.3198 -1.197 1.6047 -1.099 1.8895 -0.943 2.1744 -0.841 2.4592 -0.793 2.7441 -0.577 3.0289 -0.581 3.3138 -0.473 3.5986 -0.420 3.8835 -0.310 4.1683 -0.311 4.4532 -0.255 4.7380 -0.256 5.0229 -0.200 5.3077 -0.200 5.5926 -0.200
7. System: H+ + Zn 2 + + etolen
Titration No.1
[H+1 0 = 1.089 X 10- 1 mol dm-3 I [Zn2 +)0 = 2.971 X 10⁻² mol dm- 3 ,
[etolenJ o = 6.018 x 10⁻² mol dm-3 ,
[H+JT = 0, [Zn2 +JT = 0, [etolen]T = 1.139 mol dm -3 ,
Vo = 95.903 em3•
244
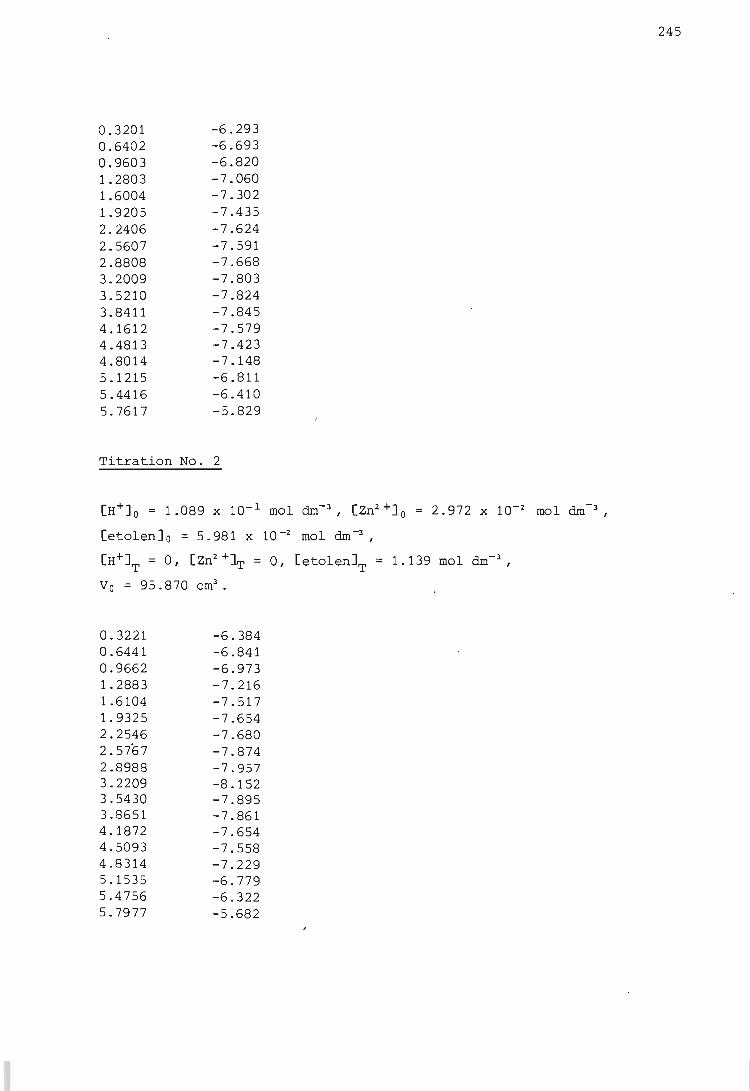
0.3201 -6.293 0.6402 -6.693 0.9603 -6.820 1. 2803 -7.060 1.6004 -7.302 1.9205 -7.435 2.2406 -7.624 2.5607 -7.591 2.8808 -7.668 3.2009 -7.803 3.5210 -7.824 3.8411 -7.845 4.1612 -7.579 4.4813 -7.423 4.8014 -7.148 5.1215 -6.811 5.4416 -6.410 5.7617 -5.829
Titration No.2
[H+J a ;::; 1.089 x 10- 1 mol dm- 3 I [Zn2 +1 a ;::; 2.972 x 10⁻² mol dm- 3 I
[etolenJ a ;::; 5.981 x 10 -2 mol dm -J ,
[H+JT ;::; 0, [Zn2 +J'l' ;::; 0, [etolenJT ;::; 1.13.9 mol dm- 3 ,
Va ;::; 95.870 em3•
0.3221 -6.384 0.6441 -6.841 0.9662 -6.973 1.2883 -7.216 1.6104 -7.517 1.9325 -7.654 2.2546 -7.680 2.5767 -7.874 2.8988 -7.957 3.2209 -8.152 3.5430 -7.895 3.8651 -7.861 4.1872 -7.654 4.5093 -7.558 4.8314 -7.229 5.1535 -6.779 5.4756 -6.322 5.7977 -5.682
245
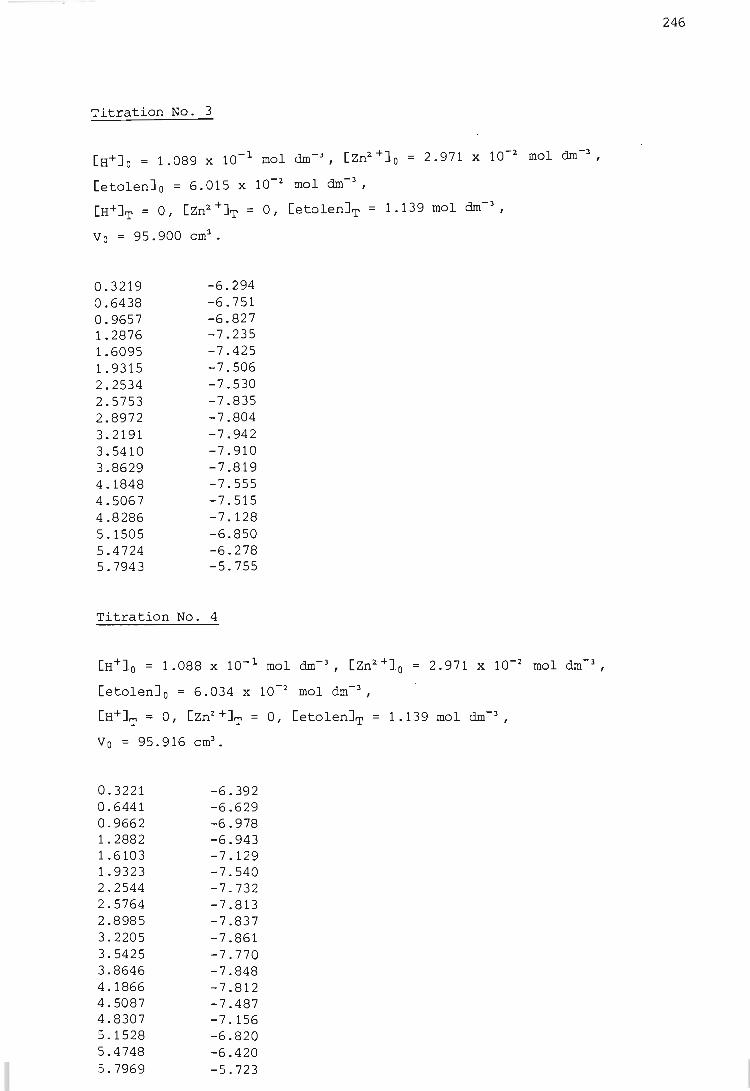
Titration No.3
[H+J O = 1.089 x 10- 1 mol dm- J, . [Zn2 +]0 = 2.971 x 10⁻² mol dm-3
,
[etolenJ o = 6.015 x 10⁻² mol dm- 3, .
[H+JT = 0, [zn2 +JT = 0, [etolenJT = 1 . 139 mol dm- 3,
Vo = 95.900 em3•
0.3219 -6.294 0.6438 -6.751 0.9657 -6.827 1.2876 -7.235 1.6095 -7.425 1. 9315 -7.506 2.2534 -7.530 2.5753 -7.835 2.8972 -7.804 3.2191 -7.942 3.5410 -7.910 3.8629 -7.819 4.1848 -7.555 4.5067 -7.515 4.8286 -7.128 5.1505 -6.850 5.4724 -6.278 5.7943 -5.755
Titration No.4
[H+]O = 1. 088 X 10- 1 mol dm- 3, [Zn2 +]0 = 2.971 X 10⁻² mol dm -3 ,
[etolenJ o = 6.034 x 10⁻² mol dm- 3 ,
[H+JT = 0, [Zn2 +JT = 0, [etolenJT = 1.139 mol dm- 3 ,
Vo = 95.916 em3•
0.3221 -6.392 0.6441 -6.629 0.9662 -6.978 1.2882 -6.943 1.6103 -7.129 1.9323 -7.540 2.2544 -7.732 2.5764 -7.813 2.8985 -7.837 3.2205 -7.861 3.5425 -7.770 3.8646 -7.848 4.1866 -7.812 4.5087 -7.487 4.8307 -7.156 5.1528 -6.820 5.4748 -6.420 5.7969 -5.723
246
247
7.10. Preparation of various solid complexes
The assumption that the total strain energies developed in the ring systems
for oden and etolen are rather similar, can be checked with the aid of
conformational strain energy calculations. For such calculations to be
possible the crystal structures of the complexes mu~t be known. To this
end attempts were made to prepare crystals, of crystallographic quality,
of the various complexes studied.
7.10.1. Preparation of [Ni (etolen) 2. ] (N03 ) 2.
A quantity of Ni(N0 3 )2 .6H2 0 was dissolved in the minimum amount of hot
ethanol. This solution was then added dropwise to a sample of neat
etolen. The mole ratio of the metal salt to the ligand was 1:2. To the
ethanolic solution was added an equal volume of a mixture containing 90 %
acetone and 10 % butanol. On cooling of the mixture in ice, crystals
were obtained. This preparation sometimes yielded blue crystals and at
other times purple crystals. In fact, when the above procedure was
repeated with the use of a liquid diffusion method (170) and without
cooling in ice, both types of crystals were obtained in the same tube.
The space group and approximate cell constants of each type of crystal were
determined by standard oscillation and Weissenberg techniques using Co-K a.
o radiation with A = 1.7902 A. (Mrs P Sommerville is thanked for help given
with these measurements.) Only the blue crystals were suitable for an
X-ray structural study. These were sent to the Chemistry Department of
the University of the Witwatersrand, where Mr P W Wade determined the
crystal structure (171).
The results of all the above measurements are given in Section 8.8.
7.10.2. Attempted preparations of other solid complexes
Despite numerous attempts to grow crystals of Ni 2 + and oden, no crystals
of this complex were obtained.
Attempts were also made to grow cry stals of Zn2 + and etolen. The following
248
procedure was used. A quantity of etolen (2 mmol) was added to
Zn(N03)2.4H20 (1 mmol) which had been previously dissolved in the minimum
amount of hot ethanol. Acetone was then added as the precipitant. White
crystals were obtained when the liquid diffusion method described by
Jones (170) was used. However these crystals turned yellow on standing
in air for a couple of hours, which indicated possible oxidation. No
attempt was made to prepare these crystals under an inert atmosphere.
7.11. Electronic Spectra
The electronic spectra of the complexes of etolen and oden with Ni 2+ were
recorded. For these measurements solutions with a metal to ligand
ratio of 1:2 were prepared . The spectra of these solutions were recorded
on a Pye Unicam SP1800 UV-visible spectrophotometer. The spectra obtained
are shown and discussed in Section 8.9.
CHAPTER EIGHT
RESULTS AND DISCUSSION
In this chapter the results derived from the potentiometric and calorimetric
data are described and discussed in detail. In addition the results of
the crystallographic and spectroscopic studies are discussed.
The analysis of the potentiometric data listed in Table 7.1 was started
by plotting the appropriate formation curve. In the plots of these curves
the symbols C) I ~ , + , X ,~ ,"t ,~ ,Z , and Y were used, in that
order, to represent the successive titrations . (In those cases where for
ward and reverse titrations were performed, separate symbols were used
for the forward run and the reverse run.) Once the choice of model had
been made the final stability constants were calcul~ted by using either
MINIQUAD or ESTA. The program used is indicated in the tables together
with the results obtained. These stability constants were then used
to arrive at 'calculated' formation curves. These are depicted as solid
lines on the various figures.
The program LETAGROP KALLE was used to calculate all the enthalpy changes
from the corrected calorimetric data listed in Table 7.2. In those cases
where four titrations were performed the data from three were input at a
time. The resulting four sets of output were then averaged.
For all the results obtained in this work the standard deviation calculated
by the program is shown in parentheses after the appropriate result. In
the calculation of stability constants and enthalpy changes fixed values
of certain constants were used, some of which were taken from the litera
ture. Table 8.1 lists those values.
8.1. The hydrogen ion - etolen system
The formation curves for this system are shown in Figure 8 . 1 and can be
seen to be superimposable. Hence the titrations were considered to be
reproducible . Unfortunately the titrations were not carried out to p[H+]
values high enough to achieve complete deprotonation of the ligand. As
far as can be determined, however, the formation curves are symmetrical
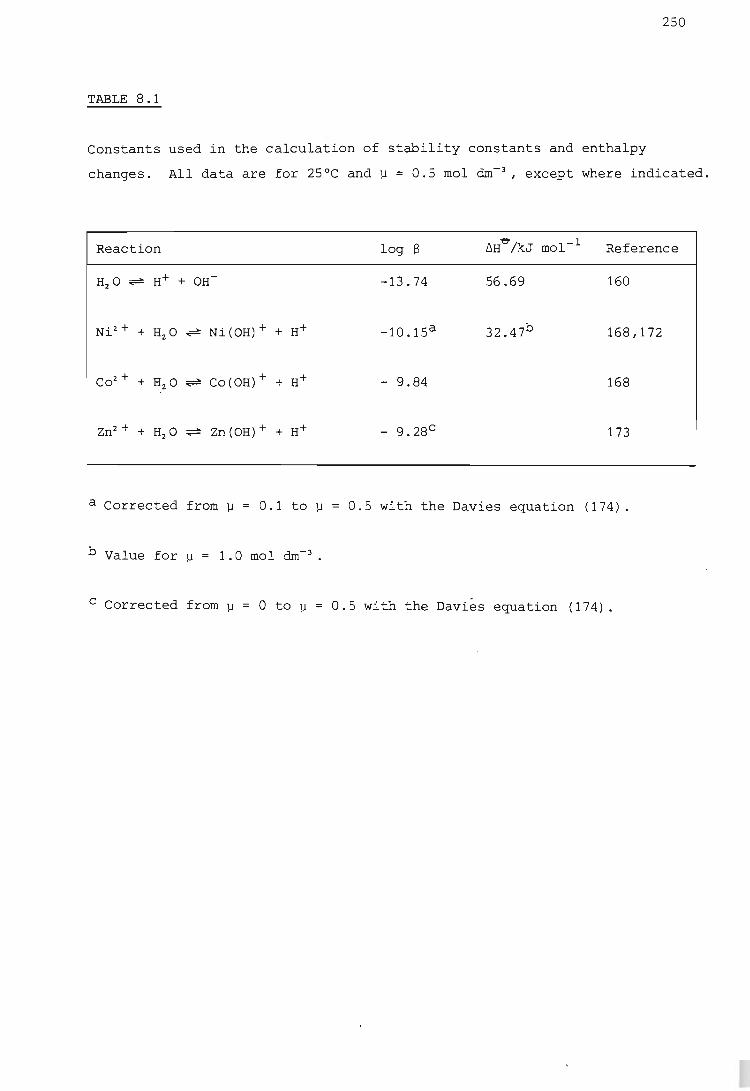
250
TABLE 8.1
constants used in the calculation of stability constants and enthalpy
changes. All data are for 25°C and ~ = 0.5 mol dm- J, except where indicated.
Reaction log S !:::.Ht:r /kJ mo 1-1 Reference
H2 0 ~ H+ + OH- -13.74 56.69 160
Ni2 + + H 0 ~ Ni(OH)+ + H+ -10.15a 32.47b 168,172 2 ..,..-
co2 + + H2 O ~ Co(OH)+ + H+ - 9.84 168 ..,..-
Zn2 + + H2 O ~ Zn(OH)+ + H+ - 9.28c 173 ...--
a Corrected from ~ = 0.1 to ~ = 0.5 with the Davies equation (174).
b Value for ~ = 1.0 mol dm- J•
c Corrected from ~ o to ~ = 0.5 with the Davies equation (174).
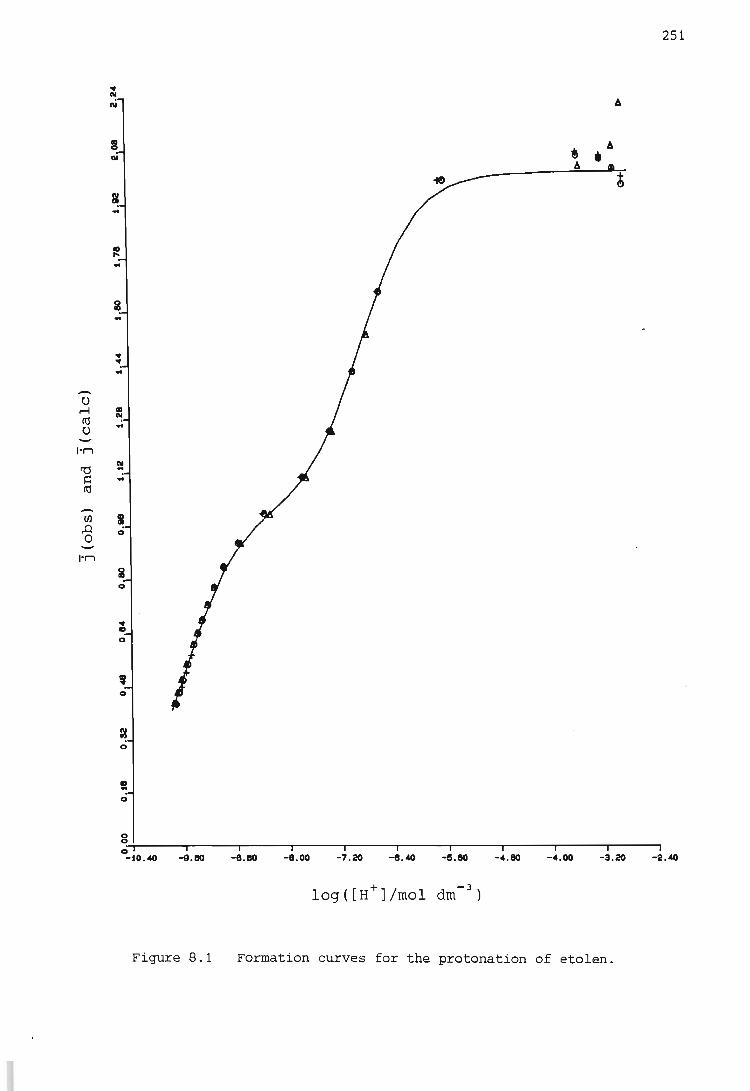
• N N
• N ~
I o
o
• D o
o
~ A • A
g o:4-----~------r-----,-----_r----_.r_----~----_r----_,------r_----,
251
~O . ~ ~.. -8.. ~. OO -7 .~ -8.~ ~.. -. .. - •. 00 -3.~ -2.~
Figure 8.1 Formation curves for the protonation of etolen.
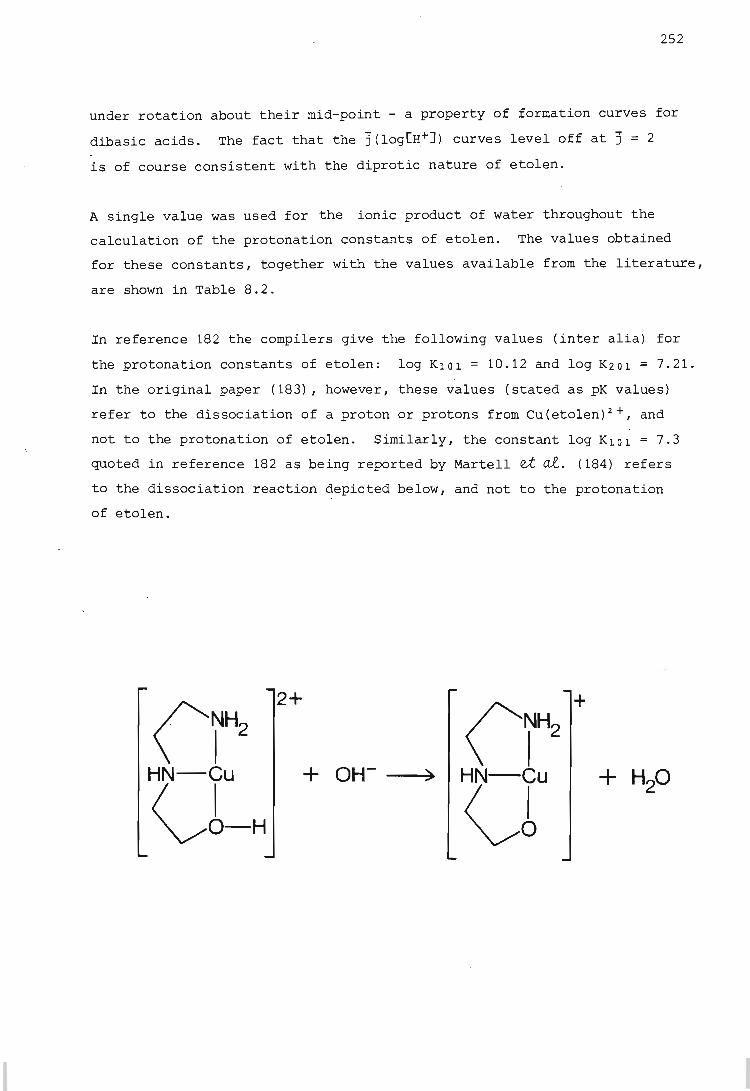
252
under rotation about their mid-point - a property of formation curves for
dibasic acids. The fact that the J(log[H+]) curves level off at J = 2
is of course consistent with the diprotic nature of etolen.
A single value was used for the ionic product of water throughout the
calculation of the protonation constants of etolen. The values obtained
for these constants, together with the values available from the literature,
are shown in Table 8.2.
In reference 182 the compilers give the following values (inter alia) for
the protonation constants of etolen: log K10l = 10.12 and log K201 = 7.21.
In the original paper (183) 1 however 1 these values (stated as pK values)
refer to the dissociation of a proton or protons from eu (etolen) 2 + I . and
not to the protonation of etolen. Similarly, the constant log K10l = 7.3
quoted in reference 182 as being reported by Martell et aI. (184) refers
to the dissociation reaction depicted below, and not to the protonation
of etolen.
2+
+ ) +
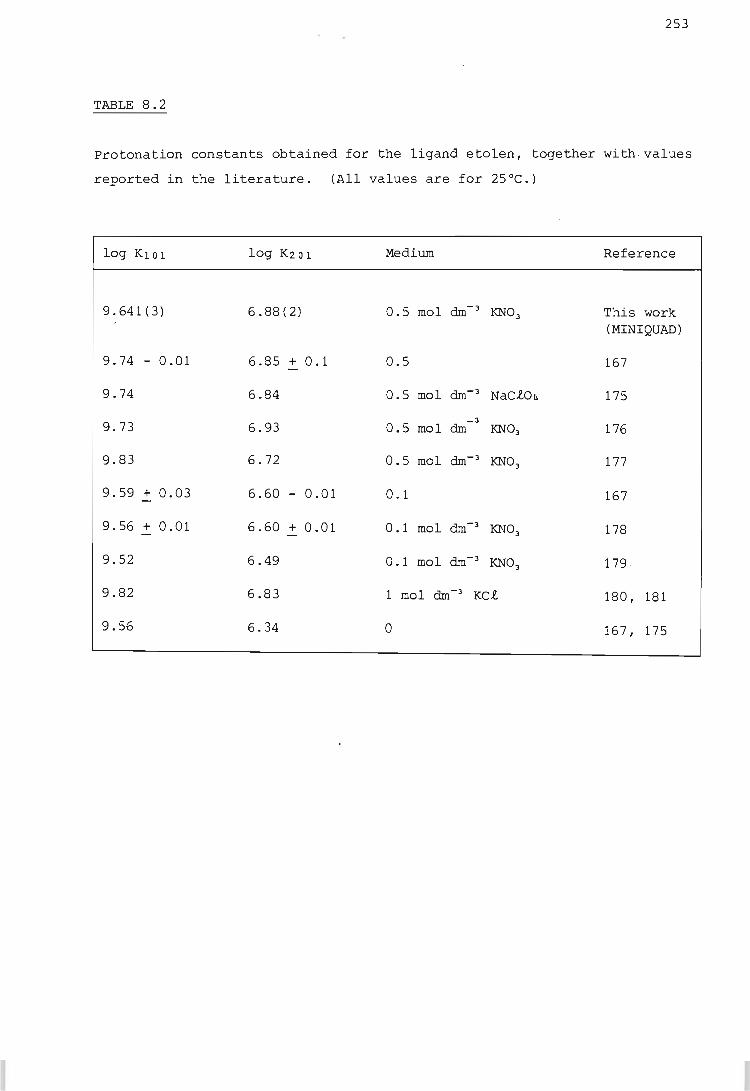
253
TABLE 8.2
Protonation constants obtained for the ligand etolen, together with values
reported in the literature. (All values are for 25°C.)
log Kl 0 1 log K201 Medium Reference
9.641(3) 6.88 (2) 0.5 mol dm- 3 KN0 3 This work (MINIQUAD)
9.74 - 0.01 6.85 + 0 . 1 0 . 5 167
9.74 6.84 0.5 mol dm- 3 NaCtO,+ 175
9.73 6.93 _3
0.5 mol dm KN03 176
9.83 6.72 0 . 5 mol dm- 3 KN03 177
9.59 + 0.03 6.60 - 0.01 0.1 167
9.56 + 0.01 6.60 + 0.01 0.1 mol dm-3 KN0 3 178 -9.52 6.49 0.1 mol dm- 3 KN0 3 179 ·
9.82 6.83 1 mol dm-3 KCt 180, 181
9.56 6.34 0 167, 175
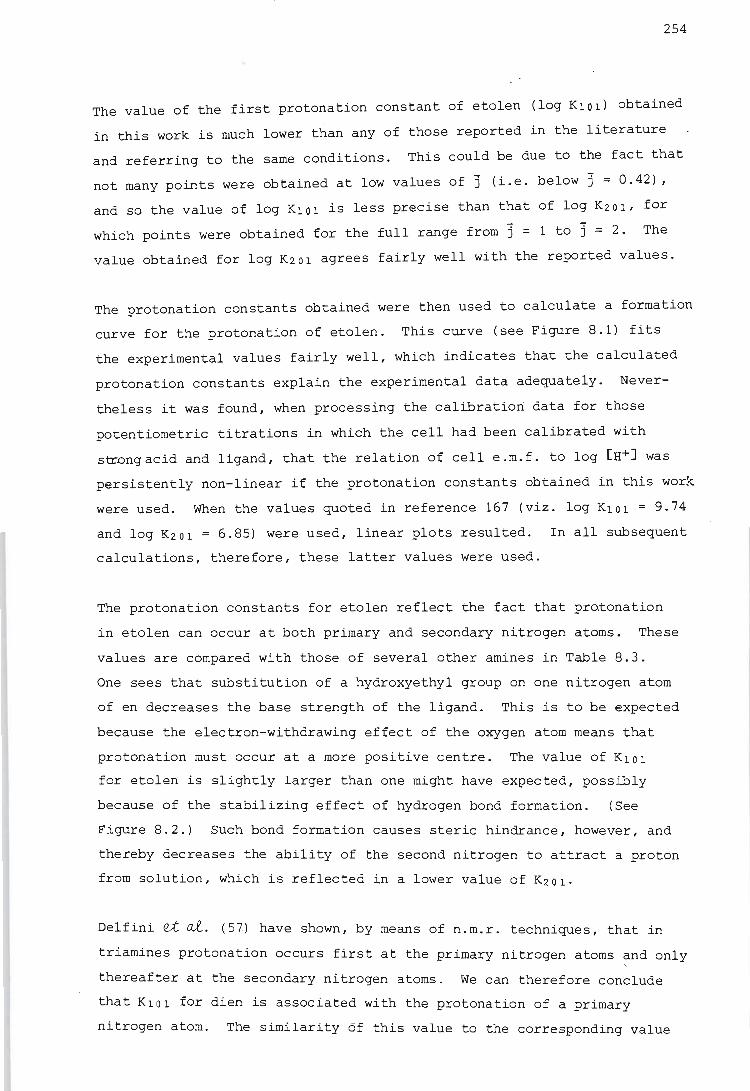
254
The value of the first protonation constant of etolen (log K10l) obtained
in this work is much lower than any of those reported in the literature
and referring to the same conditions. This could be due to the fact that
not many points were obtained at low values of J (i.e. below J ~ 0.42) ,
and so the value of log K10l is less precise than that of log K201, for
which points were obtained for the full range from J = 1 to J = 2. The
value obtained for log K201 agrees fairly well with the reported values.
The protonation constants obtained were then used to calculate a formation
curve for the protonation of etolen. This curve (see Figure 8.1) fits
the experimental values fairly well, which indicates that the calculated
protonation constants explain the experimental data adequately. Never
theless it was found, when processing the calibration data for those
potentiometric titrations in which the cell had been calibrated with
strong acid and ligand, that the relation of cell e.m.f. to log [H+] was
persistently non-linear if the protonation constants obtained in this work
were used. When the values quoted in reference 167 (viz. log K10l = 9.74
and log K201 = 6.85) were used, linear plots resulted. In all subsequent
calculations, therefore, these latter values were used.
The protonation constants for etolen reflect the fact that protonation
in etolen can occur at both primary and secondary nitrogen atoms. These
values are compared with those of several other amines .in Table 8.3.
One sees that substitution of a hydroxyethyl group on one nitrogen atom
of en decreases the base strength of the ligand. This is to be expected
because the electron-withdrawing effect of the oxygen atom means that
protonation must occur at a more positive centre. The value of K10l
for etolen is slightly larger than one might have expected, possibly
because of the stabilizing effect of hydrogen bond formation. (See
Figure 8.2.) Such bond formation causes steric hindrance, however, and
thereby decreases the ability of the second nitrogen to attract a proton
from solution, which is reflected in a lower value of K201.
Delfini ~ at. (57) have shown, by means of n.m.r. techniques, that in
triamines protonation occurs first at the primary nitrogen atoms ~nd only
thereafter at the secondary nitrogen atoms. We can therefore conclude
that K10l for dien is associated with the protonation of a primary
nitrogen atom. The simi~arity 6 f this value to the corresponding value
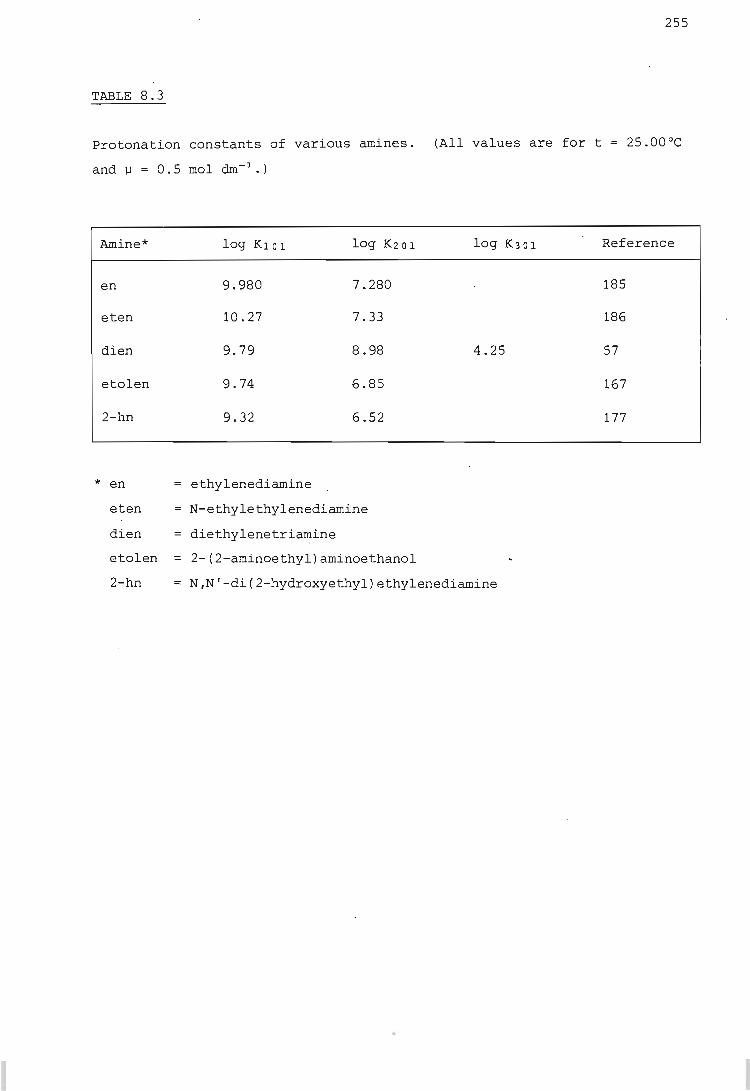
TABLE 8.3
Protonation constants of various ami nes. (All values are for t
and ~ = 0.5 mol dm- J.)
Amine* log K10l log K201 log K3 0 1
en 9.980 7 .280
eten 10.27 7 . 33
dien 9.79 8 . 98 4.25
etolen 9.74 6.85
2-hn 9.32 6.52
* en ethylenediamine
eten N-ethylethylenediamine
dien = diethylenetriamine
etolen 2-(2-aminoethyl)aminoethanol
2-hn N,N'-di(2-hydroxyethyl) ethylenediamine
255
Reference
185
186
57
167
177
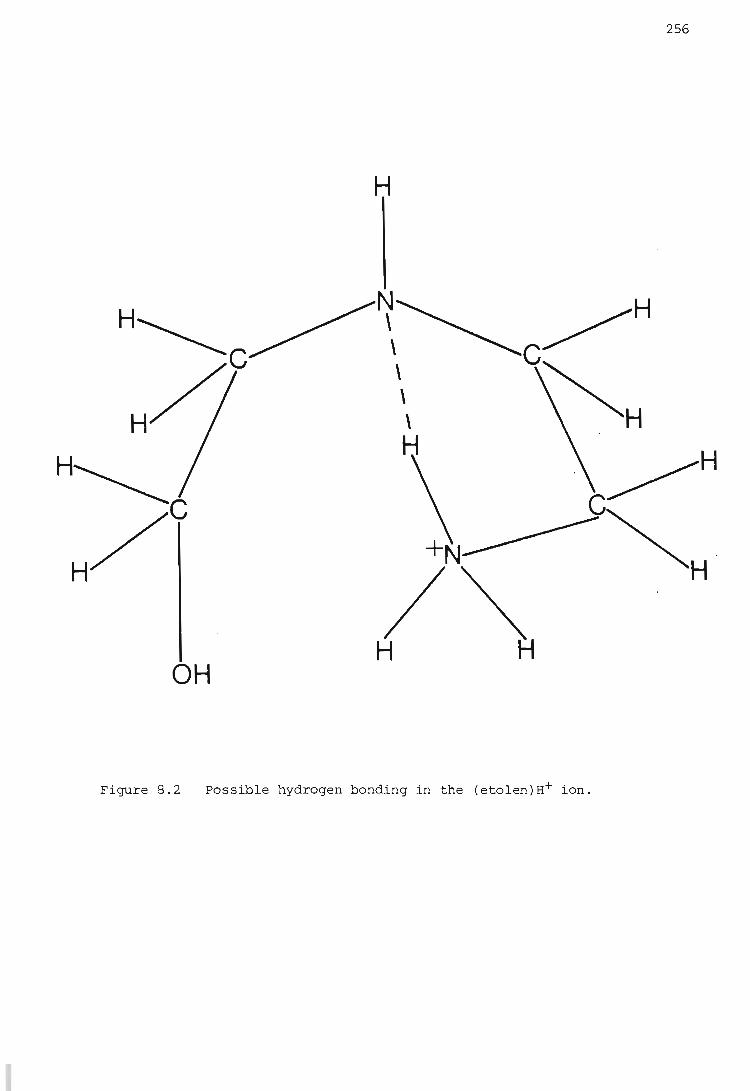
. 256
H
~ ~H \ c~ \ H H H
. ~ C
+N------~ . /~ H
H H OH
Figure 8.2 Possible hydrogen bonding in the (etolen)H+ ion.
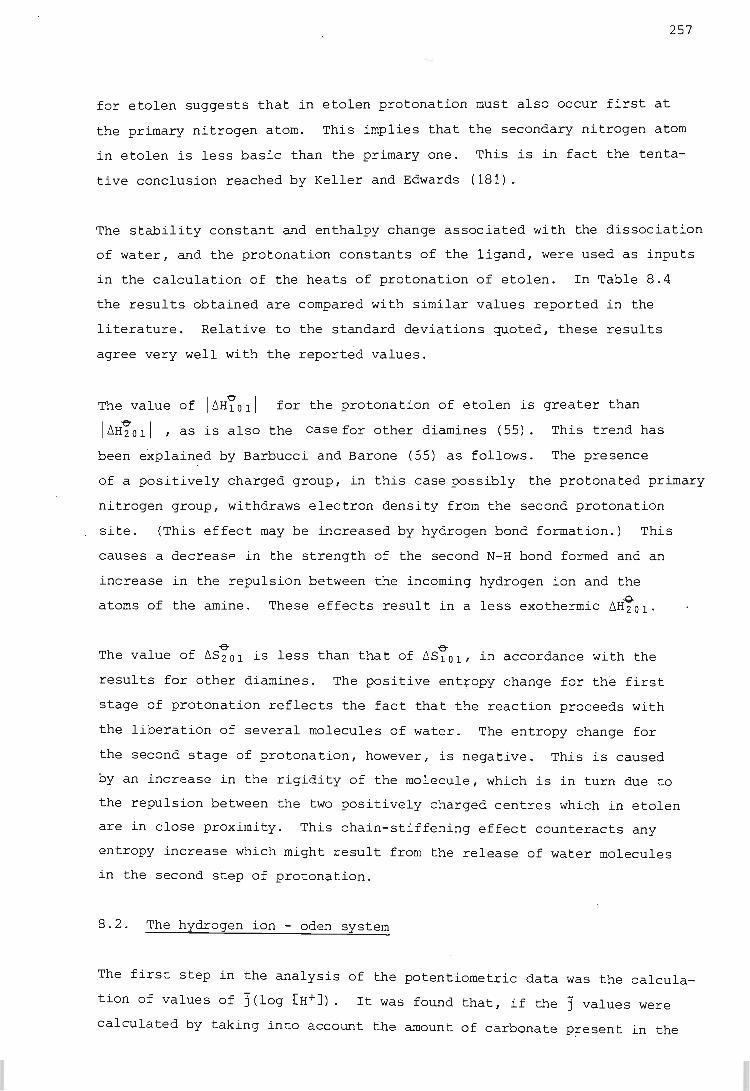
257
for etolen suggests that in etolen protonation must also occur first at
the primary nitrogen atom. This implies that the secondary nitrogen atom
in etolen is less basic than the primary one. This is in fact the tenta
tive conclusion reached by Keller and Edwards (181).
The stability constant and enthalpy change associated with the dissociation
of water, and the protonation constants of the ligand, were used as inputs
in the calculation of the heats of protonation of etolen. In Table 8.4
the results obtained are compared with similar values reported in the
literature. Relative to the standard deviations quoted, these results
agree very well with the reported values.
The value of 1 6H~Oll for the protonation of etolen is greater than
1 6H~Ol l , as is also the case for other diamines (55). This trend has
been explained by Barbucci and Barone (55) as follows. The presence
of a positively charged group, in this case possibly the protonated primary
nitrogen group, withdraws electron density from the second protonation
site. (This effect may be increased by hydrogen bond formation.) This
causes a decrease in the strength of the second N-H bond formed and an
increase in the repulsion between the incoming hydrogen ion and the
atoms of the amine. These effects result in a less exothermic 6H~Ol.
The value of 6S~Ol is less than that of 6SY01, in accordance with the
results for other diamines. The positive entroPY change for the first
stage of protonation reflects the fact that the reaction proceeds with
the liberation of several molecules of water. The entropy change for
the second stage of protonation, however, is negative. This is caused
by an increase in the rigidity of the molecule, which is in turn due to
the repulsion between the two positively charged centres which in etolen
are in close proximity. This chain-stiffening effect counteracts any
entropy increase which might result from the release of water molecules
in the second step of protonation.
8.2. The hydrogen ion - oden system
The first step in the analysis of the potentiometric data was the calcula
tion of values of ](log [H+J). It was found that, if the] values were
calculated by taking into account the amount of carbonate p~esent in the
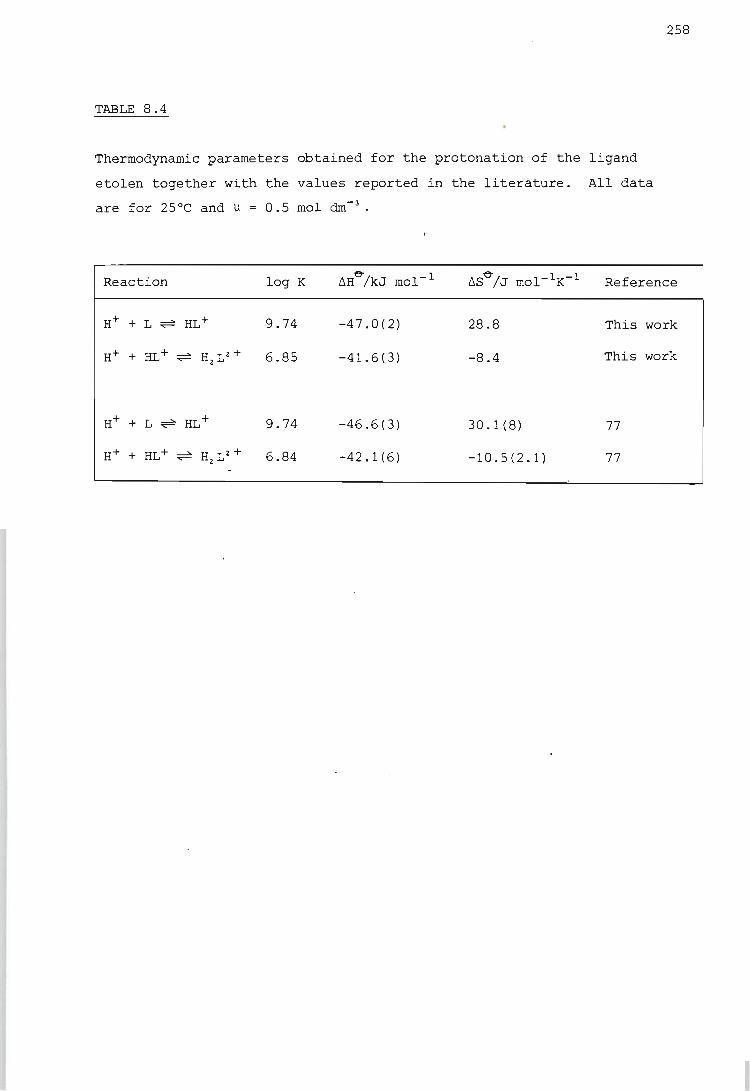
258
TABLE 8.4
Thermodynamic parameters obtained for the protonation of the ligand
etolen together with the values reported in the literature. All data
are for 25°C and ~ = 0.5 mol dm- 3•
Reaction log K !J.He-/kJ mol- 1 Reference
H+ + L ~ HL+ 9.74 -47.0(2) 28.8 This work
6.85 -41.6(3) -8.4 This work
9.74 -46.6(3) 30.1(8) 77
6.84 -42.1(6) -10.5(2.1) 77
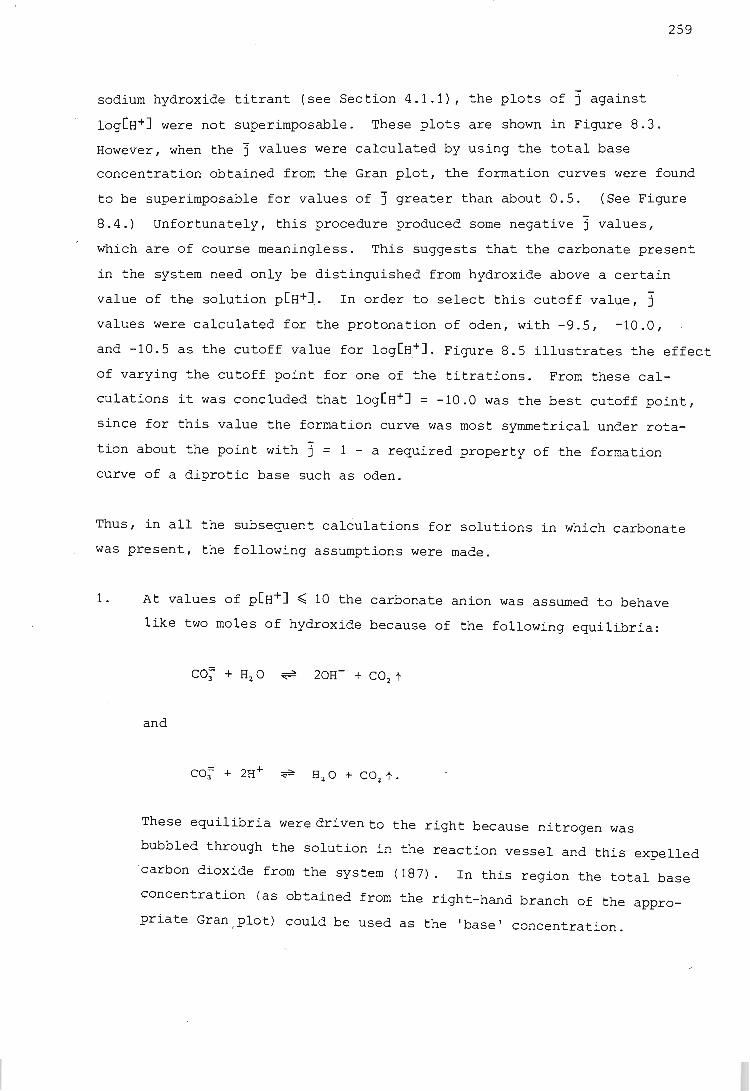
259
sodium hydroxide titrant (see Section 4.1.1), the plots of j against
log[H+] were not superimposable. These plots are shown in Figure 8.3.
However, when the J values were calculated by using the total base
concentration obtained from the Gran plot, the formation curves were found
to be superimposable for values of J greater than about 0.5. (See Figure
8.4.) Unfortunately, this procedure produced some negative j values,
which are of course meaningless. This suggests that the carbonate present
in the system need only be distinguished from hydroxide above a certain
value of the solution p[H+]. In order to select this cutoff value, J values were calculated for the protonation of oden, with -9.5, -10.0,
and -10.5 as the cutoff value for log[H+1. Figure 8.5 illustrates the effect
of varying the cutoff point for one of the titrations. From these cal
culations it was concluded that log[H+] = -10.0 was the best cutoff point~
since for this value the formation curve was most symmetrical under rota-
tion about the point with j = 1 - a required property of the formation
curve of a diprotic base such as oden .
Thus, in all the subsequent calculations for solutions in which carbonate
was present, the following assumptions were made.
1. At values of p[H+1 ~ 10 the carbonate anion was assumed to behave
like two moles of hydroxide because of the following equilibria:
and
These equilibria were driv en to the right because nitrogen was
bubbled through the solution in the reaction vessel and this expelled
'carbon dioxide from the system (187). In this region the total base
concentration (as obtained from the right-hand branch of the appro
priate Gran ,plot) could be used as the 'base' concentration.
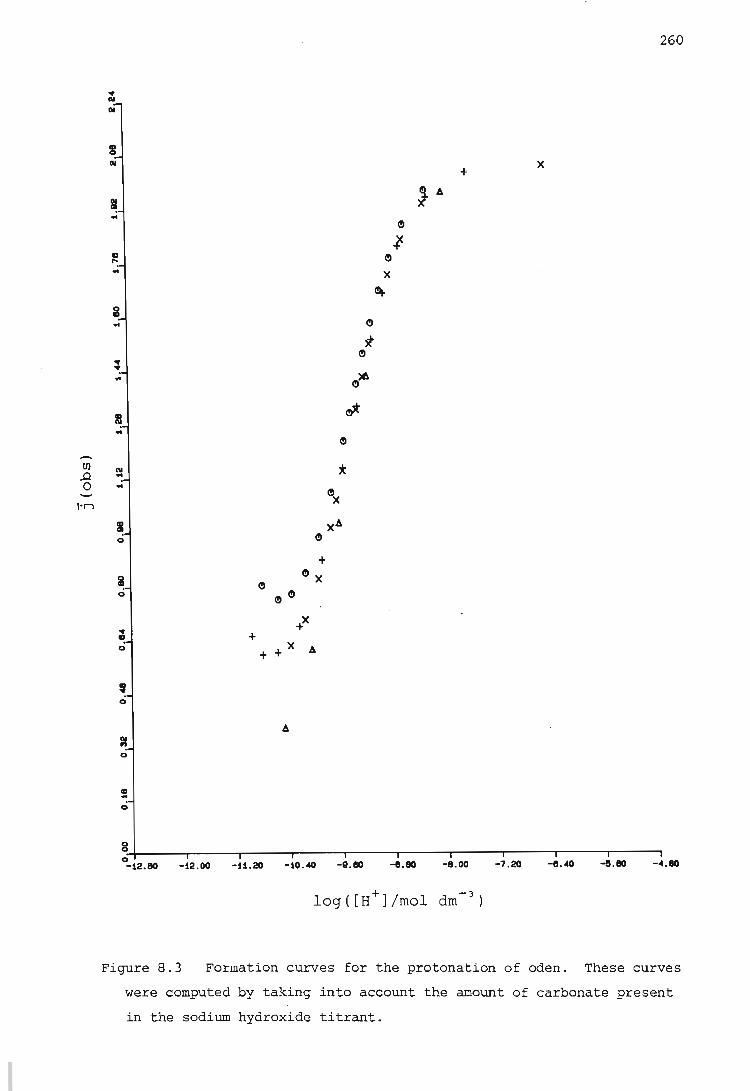
en ..0 0
I·"
260
~ N
III
• 0
N X +
I ,. A
.. \!)
1-• \!) ,.. X
~
\!)
t \!)
\!)>6
~
\!)
* .. \!)x
I XA 0 \!)
+ Ii \!)
\!)X 0 \!) \!)
~ ~ • + 0 +X A +
, 0
:c 0
• .. 0
8 0 -12.80 -12.00 -U.2O -10.40 -11.80 -8.80 -8.00 -7.20 -8.40 -8.80 -4.80
+ log ([H ] frnol drn- 3 )
Figure 8.3 Formation curves for the protonation of oden. These curves
were computed by taking into account the amount of carbonate present
in the sodium hydroxide titrant .
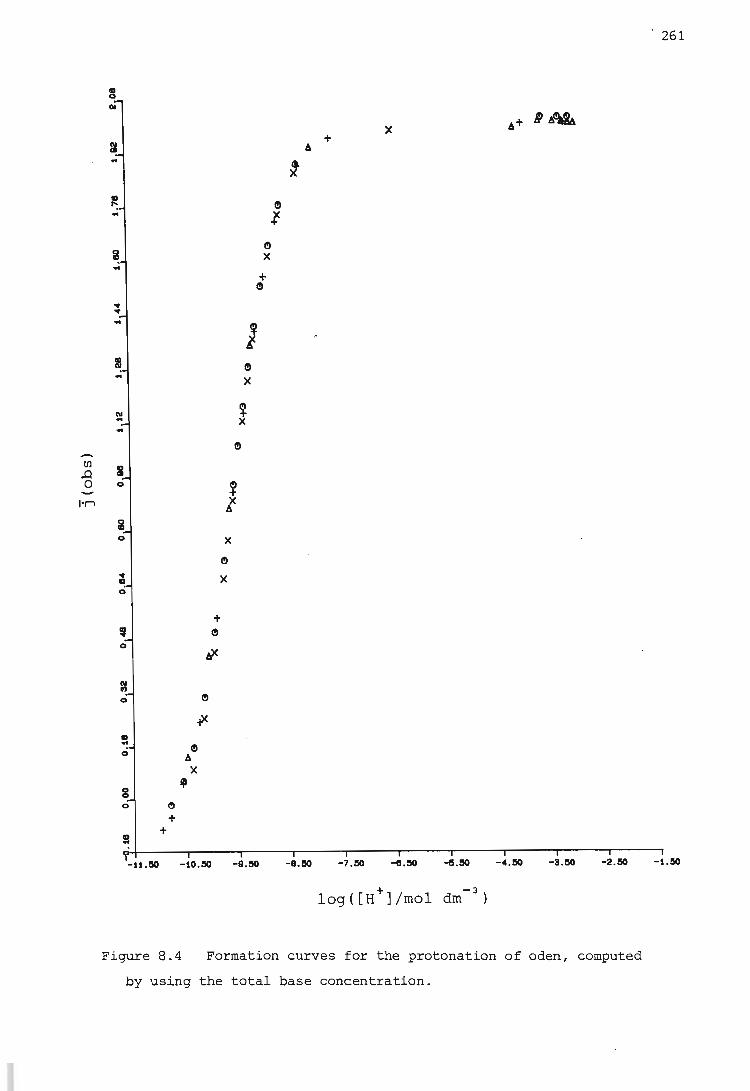
261
B N
A+ gA,L X
+ I A ..
~
• ,.. e .. 1 e
i x .. + e
~ ~ ..
} II e .. x
N
* .. .. e
U) I ..0
0 ~ 1'1\ f
x e x
0
+ , e 0
17-
~ e
.r e
A X ..
C!)
+ +
-U.!IO -iO.!IO -8.110 -8.110 -7.110 -a. 110 -a. 110 -4.110 -3.110 -2.110 -LIIO
+ log ([H ] frnol drn -3 )
Figure 8.4 Formation curves for the protonation of oden, computed
by using the total base concentration.
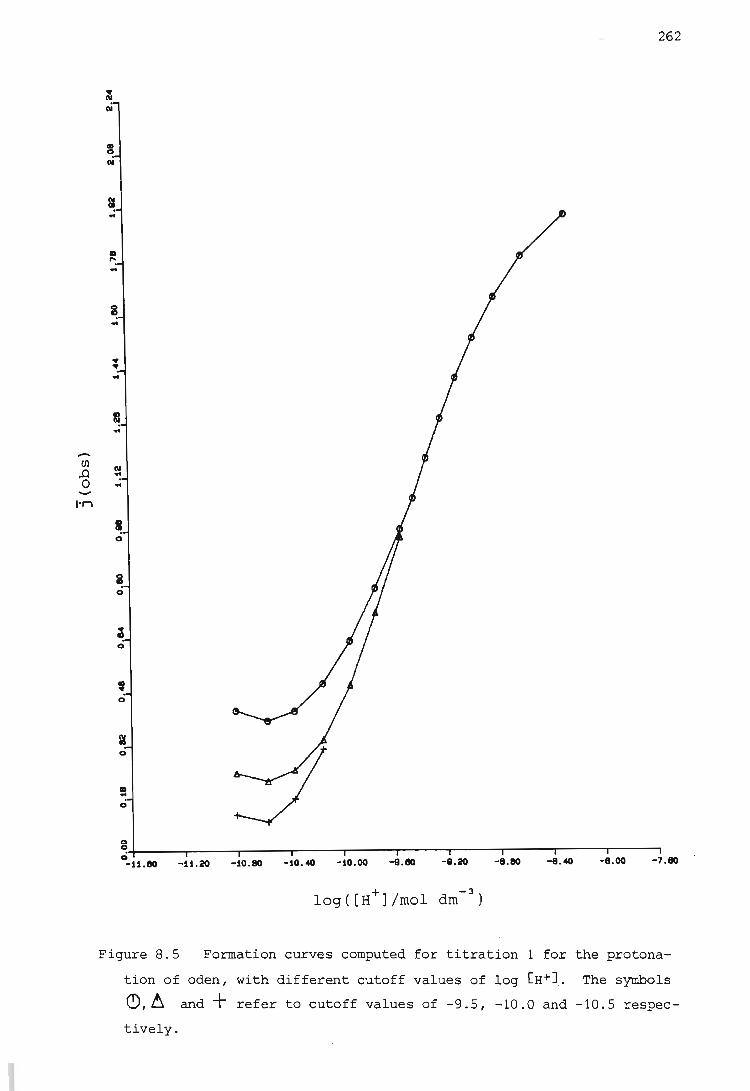
til .0 0
I'n
262
!II .. N ..
0
a 0
~ 0
, 0
91
o
8~------------~----~------'-----~------~-----r------r------r-----. o_U.80 -U.2O -SO.80 -10.~ -10.00 -a.80 -8.20 -8.80 -8.~ -8.00 -7.80
Figure 8.5 Formation curves computed for titration 1 for the protona-
tion of oden, with different cutoff values of log [H+]. The symbols
Q),~ and 1- refer to cutoff values of -9.5, -10.0 and -10.5 respec
tively.
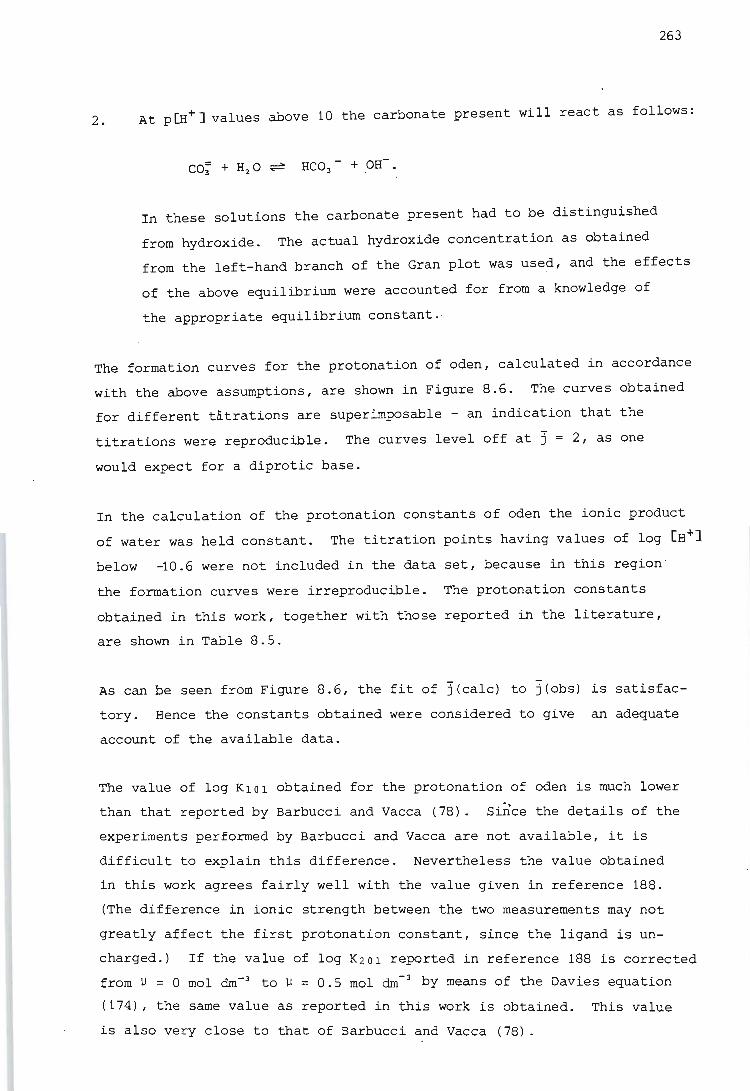
263
2. At p[H+] values above 10 the carbonate present will react as follows:
In these solutions the carbonate present had to be distinguished
from hydroxide. The actual hydroxide concentration as obtained
from the left-hand branch of the Gran plot was used, and the effects
of the above equilibrium were accounted for from a knowledge of
the appropriate equilibrium constant. ,
The formation curves for the protonation of oden, calculated in accordance
with the above assumptions, are shown in Figure 8.6. The curves obtained
for different tltrations are superimposable - an indication that the
titrations were reproducible. The curves level off at J = 2, as one
would expect for a diprotic base.
In the calculation of the protonation constants of oden the ionic product
of water was held constant. The titration points having values of log [H+]
below ~0.6 were not included in the data set, because in this region '
the formation curves were irreproducible. The protonation constants
obtained in this work, together with those reported in the literature,
are shown in Table 8.5.
As can be seen from Figure 8.6, the fit of J(calc) to j(obs) is satisfac
tory. Hence the constants obtained were considered to give an adequate
account of the available data.
The value of log K10l obtained for the protonation of oden is much lower
than that reported by Barbucci and Vacca (78). Si~ce the details of the
experiments performed by Barbucci and Vacca are not available, it is
difficult to explain this difference. Nevertheless the value obtained
in this work agrees fairly well ,with the value given in reference 188.
(The difference in ionic strength between the two measurements may not
greatly affect the first protonation constant, since the ligand is un
charged.) If the value of log K 2 01 reported in reference 188 is corrected
from ~ = 0 mol dm- 3 to ~ = 0.5 mol dm- 3 by means of the Davies equation
(174), the same value as reported in this work is obtained. This value
is also very close to that of Barbucci and Vacca (78).
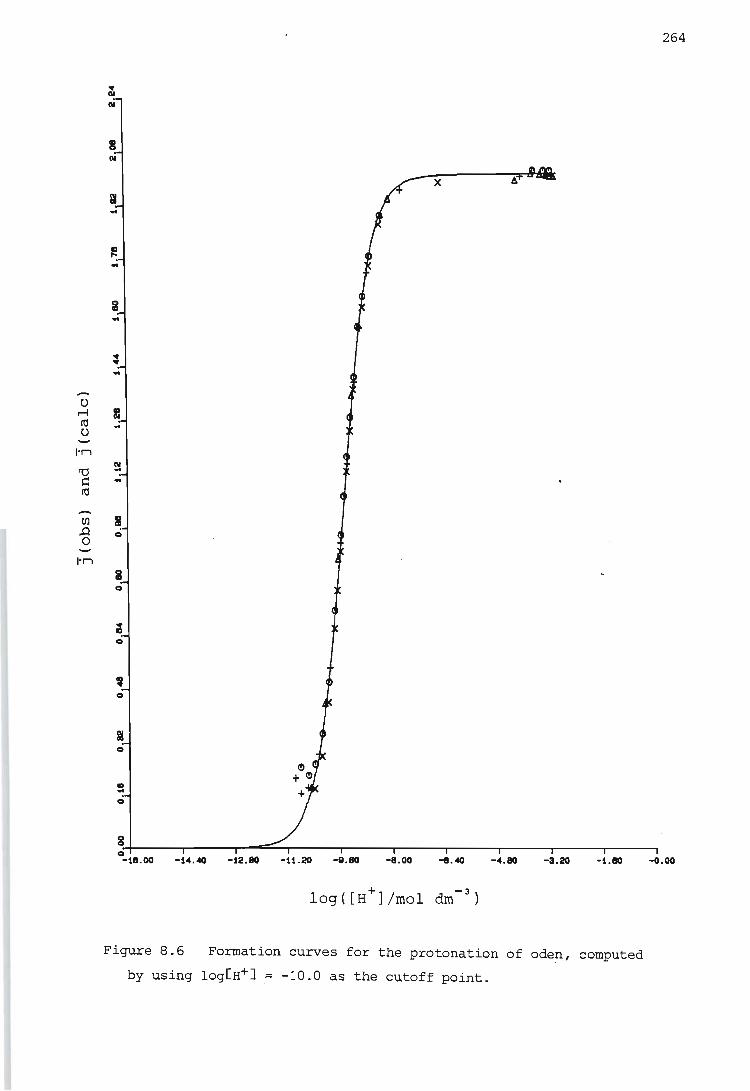
C) r-I ro C)
I'"
ro ~ ro
til .0 0
I'"
.. N
.. a .. ;
a 0
;
o
til .. o
264
x
8W---~----~~~----r----r---.----'----.----.---~ 0_111 . 00 -14.40 -12.110 -11.20 -8.110 -8.00 -e. 40 -4.110 -3.20 -1.110 -0.00
Figure 8.6 Formation curves for the protonation of oden, computed
by using log[H+] = -10.0 as the cutoff point.
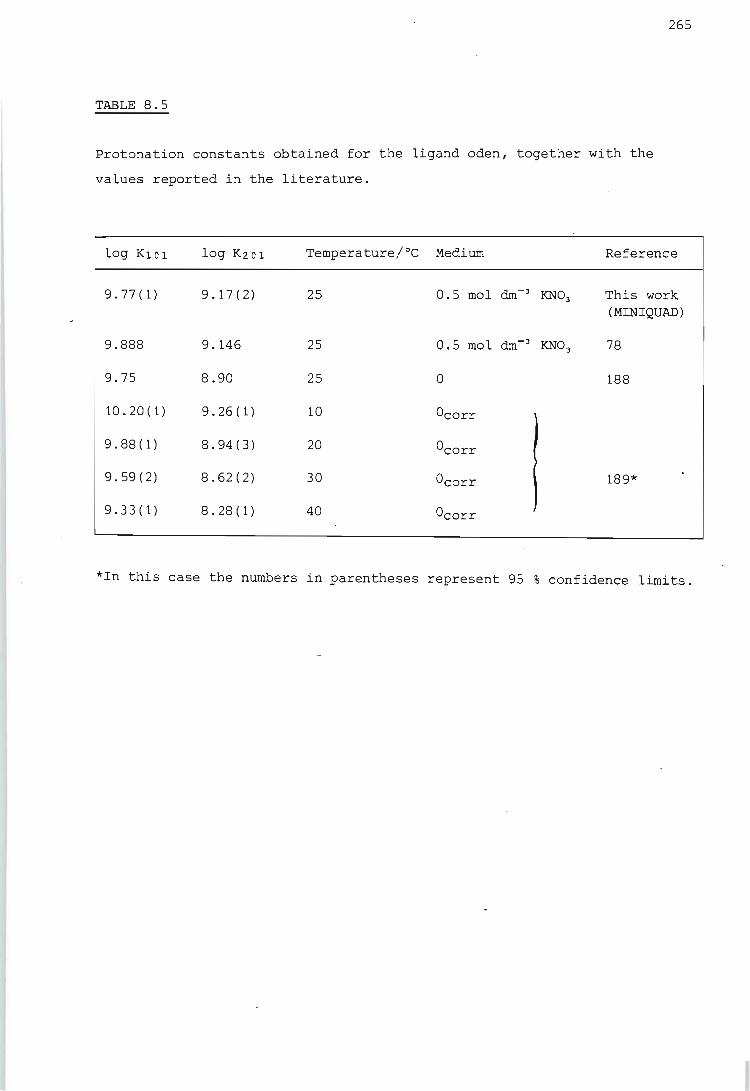
265
TABLE 8.5
Protonation constants obtained for the ligand oden, together with the
values reported in the literature.
log KlOl log K20l Temperature/oC Medium Reference
9.77(1) 9.17(2) 25 0.5 mol dm-3 KN0 3 This work (MINIQUAD)
9.888 9.146 25 0.5 mol dm- 3 KN0 3 78
9.75 8.90 25 0 188
10.20(1) 9.26 (1) 10 Ocorr
9.88 (1) 8.94(3) 20 °corr
9.59 (2) 8.62(2) 30 °corr 189*
9.33 (1) 8.28 (1) 40 Ocorr
*In this case the numbers in parentheses represent 95 % confidence limits.

266
The j (log[H+J) plots for both oden and etolen show no plateau at j 1
because the difference between the stepwise formation constants is
insufficient to prevent overlap of the successive protonation steps.
For oden this difference, i.e. between log K10l and log K201, is much
smaller (0.6) than for etolen (2.89). This is to be expected, since oden
has two primary nitrogen atoms (which one would expect to have very
similar protonation constants) and etolen has one primary and one secon
dary nitrogen atom. In addition, the protonation sites in oden are much
further apart than in etolen and thus exert less influence on each other.
The protonation constant of the second nitrogen atom in oden has never
theless a lower value than the first. This too is possibly due to hydro
gen bonding of the ~ depicted in Figure 8.2 and the increased repulsion
of the incoming hydrogen ion caused by the presence of a positively
charged centre. These effects, though, are less marked than in etolen
because of the greater distance between the amine groups. Oden is more
basic than etolen because of the symmetric nature (175) of the former
ligand and because there is less steric hindrance for the incoming
hydrogen ions.
In the calculation of the heats of protonation of oden, the stability
constant and enthalpy change assoc i ated with the dissociation of water,
and the protonation constants of the ligand, were used as inputs. The
results obtained in this work, together with the values reported in the
literature, are shown in Table 8.6. The enthalpy changes of protonation
obtained for oden are in good agreement with the reported values.
As can be observed, 16H~Ol l > 1'6HYol i for oden, unlike the situation
for most other diamines. This reversal of trend was explained by Barbucci
and Barone (55) as follows.
Since oden is symmetric about the oxygen atom, when it is diprotonated
it exists as two terminal centres of positive charge separated by a
central negative charge. This configuration generates a new orientation
of the solvent water molecules (as depicted in Figure 8.7) about the
diprotonated amine. Barbucci and Barone have calculated that this pro
duces a favourable energy contribution of 3.3 kJ mol- 1 . This value is in
close agreement with the difference J6H~ol J - 16H~Ol J obtained in this
work (3.2 kJ mol- 1).
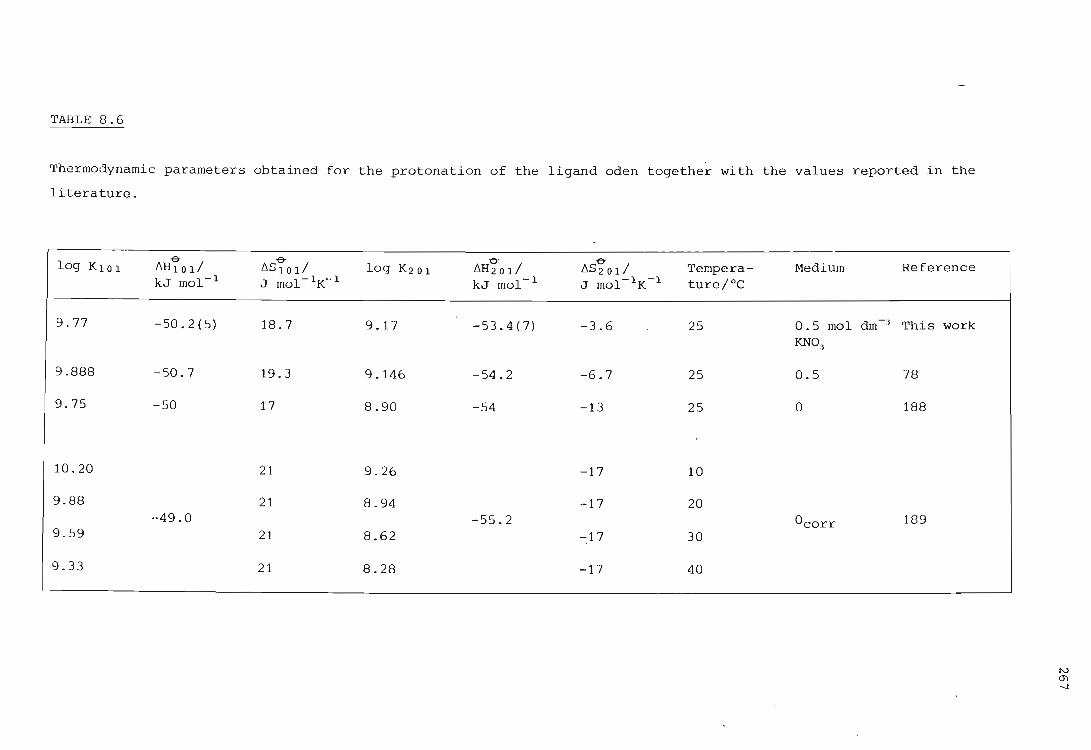
TABLE 8.6
Thermodynamic parameters obtained for the protonation of the ligand oden together with the values reported in the
literature.
log KIOI -& -& 0- 0-
Medium Reference ~HIOd ~slOd log K20I ~H20d ~S2od Tempera-kJ mol- I J mol-IK- I kJ mol- I J mol-1K-1 ture/oC
9.77 - 50.2 (5) 18.7 9.17 -53.4(7) -3.6 25 0.5 mol dm-3 This work KN0 3
9.888 -50.7 19.3 9.146 -54.2 -6.7 25 0 . 5 78
9.75 -50 17 8.90 -54 -13 25 0 188
10.20 21 9.26 -17 10
9.88 21 8.94 .,.17 20 -49.0 -55.2 °corr 189
9.59 21 8.62 -17 30
9.33 21 8.28 -17 40
N (j\ -...J
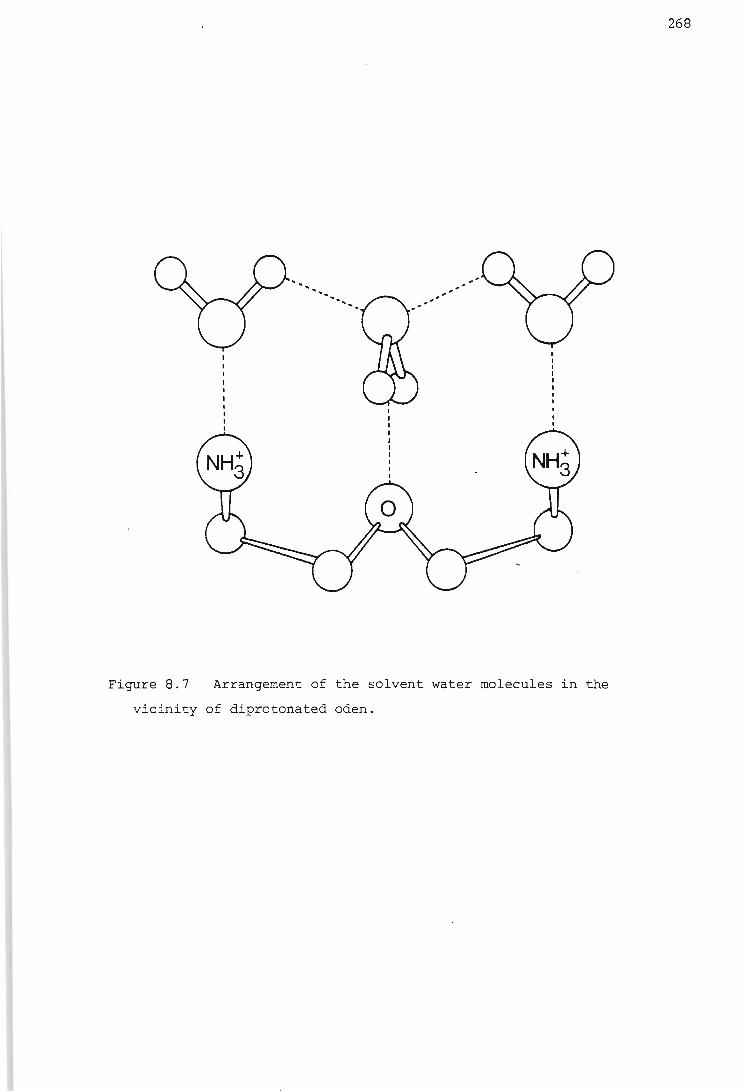
Figure 8.7 Arrangement of the solvent water molecules in the
vicinity of diprotonated oden.
268
269
The decrease in ~S~ with successive protonations observed for etolen is I
also observed for oden. However, the decrease is smaller for oden than
for etolen. This is possibly because the two centres of positive charge
are further apart in oden and this leads to a smaller decrease in the
ligand entropy, i.e. a smaller increase in rigidity of the ligand.
The solvent orientation effects discussed above may tend to increase the
rigidity of the ligand, but presumably this causes only a small decrease
in entropy.
8.3. The nickel ion - etolen system
The observed formation curves for the Ni-etolen system are shown in Figure
8.8. A number of features of these curves will now be discussed.
One sees that the formation curves are fairly superimposable up to a value
of Z = 1.5. Above this value there is a 'fanning out' effect, as well
as 'shoot-up' and 'curl-back'. The fanning out for Z values between 1.5
and 2.0 is most probably due to small errors in the solution concentrations.
From an analysis of the formation curves obtained by varying the solution
concentrations slightly, it was found that Z was more sensitive to errors
in the concentrations of the components at high p[H+] values than at low
values. These findings are in keeping with those of Cabani (190) and
Avdeef et al. (191). The reason why Z is not very sensitive to concentra
tion errors at low values of p[H+J is that in this region [HJ t is always
significantly larger than [HJ. This results from the presence of sub
stantial amounts of protonated ligand. All the data points with Z ~ 1.5
were obtained at p[H+J values greater than about 6.5, where these errors
become more significant.
The reverse runs of ti~rations 2 and 3 exhibit 'shoot-up' and 'curl-back'
at Z values greater than 2. These data points were all obtained at basic
p[H+]values (above p[H+] = 7.5), i.e. when [HJ t in equation (4.98) becomes
negative. In these cases the expression for [LJ, given by equation
(4.103) , has a numerator which i s the difference between two numbers of
similar magnitude. It was found that a small uncertainty in the value
of [HJ t results in a large uncertainty in the value of Z for Z > 2, i.e.
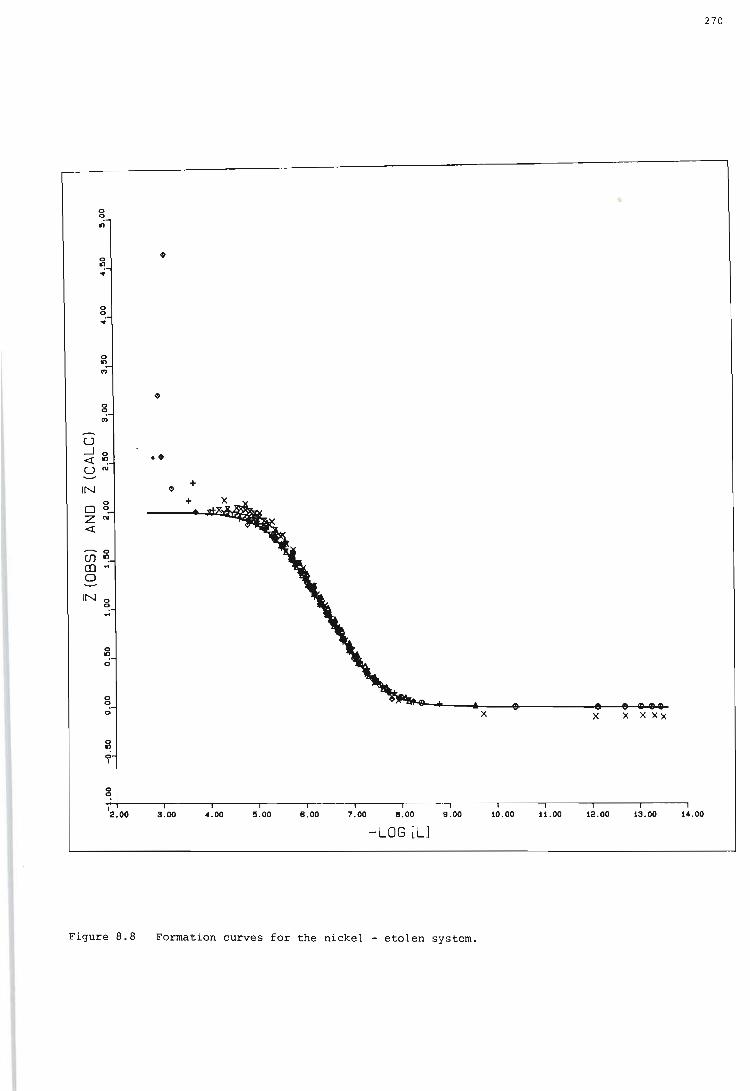
U
o o til
o o ..
o o
'"
•
•
~ ~ .. <t . UN
IN o
00 ZN <t
--. 0
UJ"! III" o IN g ..
o o o
~ o I
I
•
2.00 3.00
+ +
4 .00 5 . 00 8.00 7.00 8.00 9 . 00
-LOG [L]
Figure 8.8 Formation curves for the nickel - etolen system.
270
x x x X Xx
10 . 00 H.OO 12 . 00 13 . 00 14 . 00
271
when excess hydroxide is present. Hence this 'curl-back' and 'shoot-up'
effect may well be a manifestation of experimental error. It is noted
that these effects occur only in those titrations in which no excess pro
tonated ligand is present. One cannot exclude the possibility, though,
that these effects may arise from the formation of ternary hydroxo
complexes, or traces of ML 3 , or the deprotonation of the alcoholic group
of etolen.
Thus, within estimated experimental error, the formation curves obtained
for Z values between ° and 2 are superimposable. Since the metal ion
concentration was varied, and repeat and reverse titrations were performed,
one can conclude that no polynuclear species are present, the results
are reproducible, and the equilibria are reversible.
Because the highest reliable value of Z reached was approximately 2, and
there was evidence of a plateau at this value, the highest major mono
nuclear complex formed was t?ken to be ML2 . Also, the formation curves
are fairly symmetrical under rotation about the point with Z = 1, which
suggests that only two major species, viz. ML and ML2 , are present.
Attempts were made to introduce various minor species into the model, but
with no success.
During the calculation of the stability constants for this system, fixed
values of the stability constants for the species H20, HL + ,. H2 L2 + and
Ni(OH)+, as given in Table 8.1 and Section 8.1,were used. The results
obtained, together with pertinent values reported in the literature, are
shown in Table 8.7.
The Z (calc) curve derived from these results, and shown in Figure 8.8,
agrees fairly well with the experimental formation curves. Hence it was
concluded that the complexes Ni(etolen)2+ and Ni(etolen)i+adequately
account for the potentiometric data.
The stability constants obtained for this system agree very well with
those reported in references 167 and 175 and obtained under similar
experimental conditions. However, they do not agree well with those ob
tained by Hall et at. (183), and even less with those reported by Edwards
(180, 192).
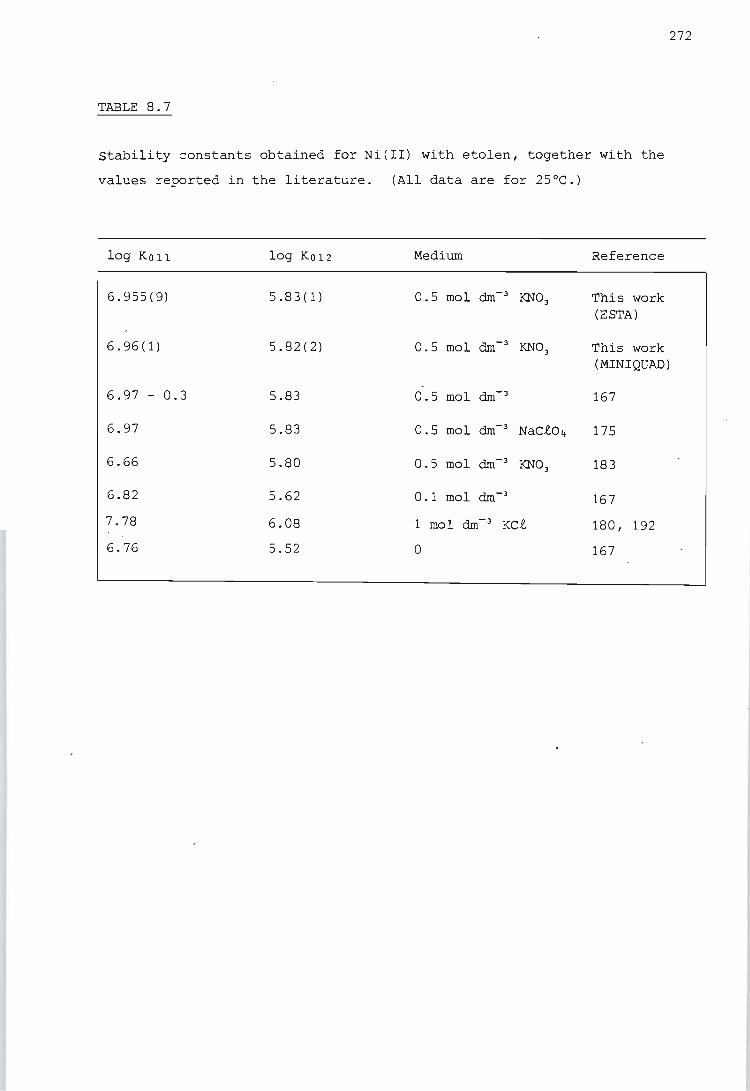
TABLE 8.7
stability constants obtained for Ni(II) with etolen, together with the
values reported in the literature. (All data are for 25°C.)
log Ko 11 log K012 Medium Reference
6.955(9) 5.83(1) 0.5 mol dm- 3 KN03 This work (ESTA)
6.96 (1) 5.82(2) 0.5 mol dm- 3 KN03 This work (MINIQUAD)
6.97 - 0.3 5.83 0.5 mol dm- 3 167
6.97 5.83 0.5 mol dm- 3 NaCt0 4 175
6.66 5.80 0.5 mol dm- 3 KN0 3 183
6.82 5.62 0.1 mol dm- 3 167
7.78 6.08 1 mol dm- 3 KCt 180, 192
6.76 5.52 0 167
272
273
The values reported by Edwards are very high relative to the others, even
if one takes into account the differences in ionic strength used. However,
if the results for other systems reported by Edwards in reference 192
are compared with other literature values, it will be noticed that his
values are all considerably higher. When the formation curves obtained
by Edwards are compared with those obtained in this work the former are
seen to lie at lower free ligand concentrations, which implies greater
stability of the complexes present. Thus there seems to be something
inherent in the experimental method employed by Edwards that gives rise
to higher values. His manner of calculating log K values by the 'half n
method' may be the problem. The equilibria in this system are not
sufficiently separated for this method to be reliable. As his 'raw'
data were not available it was not possible to re-analyze , his data to see ,
if any improvement could be achieved.
Although the value reported by Hall et at. for log K012 is in fair agree
ment with the values reported later, the value of log KOll is substantially
lower. The reason for this discrepancy is not apparent.
These studies, like those of other authors (175, 183, 192), do not provide
evidence for the formation of a Ni(etolen);+ complex in solution.
Breckenridge (67) and Karpeiskaya et at. (193) report the formation of such
a complex in the solid state, however. It has been shown (65) by means
of n.m.r. contact shifts that etolen behaves as a tridentate ligand in
aqueous solution. This seems to indicate that the ML3 complEx, which
requires etolen to bind as a bidentate ligand, does not form in solution.
To calculate the heats of formation of the Ni-etolen complexes, LETAGROP
KALLE was provided with the stability constants and enthalpy changes for
the species H2 0, HL+, H2L2+ and Ni(OH)+, and the stability constants for
ML2
+ and ML;+. The thermodynamic parameters obtained for the formation
of Ni(etolen)2+ and Ni(etolen);+are shown in Table 8.8, together with
pertinent values reported in the literature.
The enthalpy changes obtained for the formation of the Ni-etolen complexes
do not agree well with the values reported by Barbucci (77). However,
the calorimetric results obtained for the protonation experiments agree
very well with those of Barbucci. This seems to indicate that the experi-
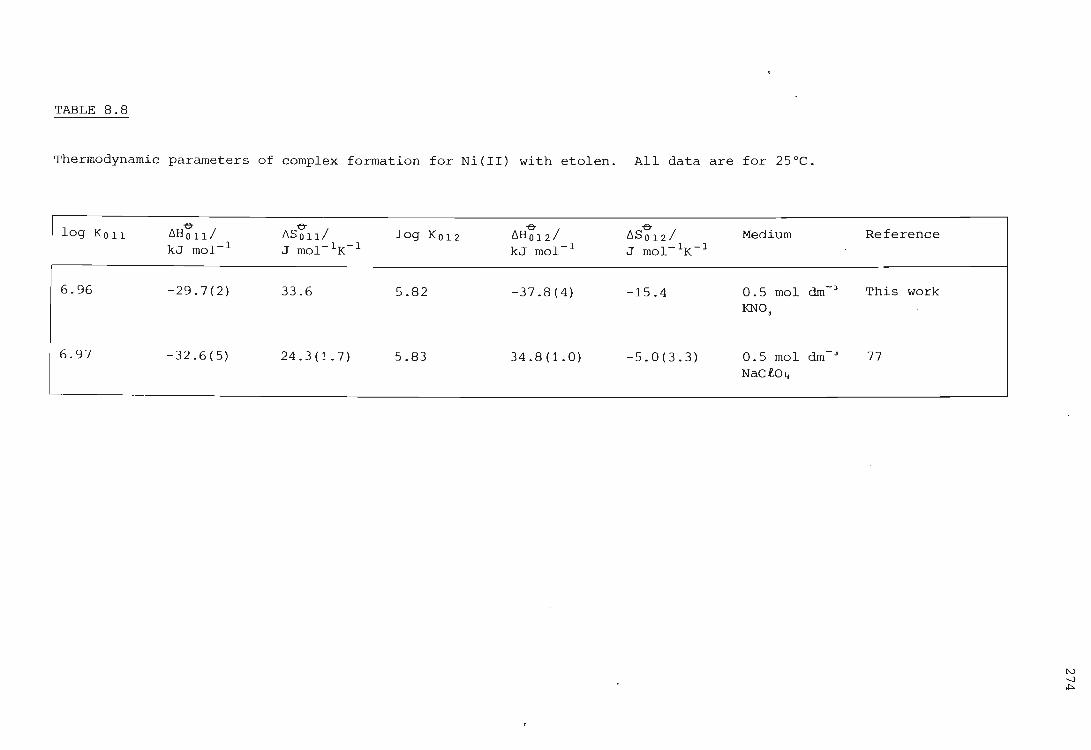
TABLE 8.8
Thermodynamic parameters of complex formation for Ni(II) with etolen. All data are for 25°C.
log Ko 11 -(7 -(7 -(7 -(7
lIHo III liS 0 III log Ko 12 lIHo121 lIS o 121 Medium kJ mol- 1 J mol- 1K- 1 kJ mol- 1 J mol- 1K- 1
6.96 -29.7(2) 33.6 5.82 -37.8(4) -15.4 0.5 mol dm-)
KNO)
6.97 -32.6(5) 24.3(1.7) 5.83 34.8(1.0) -5.0(3.3) 0.5 mol dm-)
NaC.e0 4
Reference
This work
77
N -..J ~
275
mental methods used here are not in question. The discrepancy could arise
from the way Barbucci performed the complex formation titrations. He
destroyed the Ni-etolen complexes by addition of excess nitric acid. This
indirect method has the disadvantage that the heat liberated by the reac
tions of interest is overshadowed by the heat liberated by the protonation
reactions. In this work the heat liberated was a direct measure of the
extent of complex formation. The p[H+] in Barbucci's experiments would
also have been higher than in these experiments where part of the back
ground electrolyte was replaced by protonated ligand. This higher p[H+]
may have led to hydrolysis reactions which were not corrected for. Apart
from the reasons mentioned above, it is difficult to explain the discre
pancy, especially as the same model of the species in solution and
virtually the same stability constants were used in the calculations.
The exothermicity of the complex formation reactions is expected, because
these are reactions between a fairly 'soft" ligand and a metal ion which
is borderline (194) between 'hard' and 'soft'. Hence the energy released
to form the metal-nitrogen bonds greatly exceeds that required to displace
the coordinated water molecules. The greater exothermicity on reaction
with a second ligand molecule is in keeping with the behaviour of many 3d
metal ions when reacted with polyamines, and has been explained as
follows (42). On the addition of a molecule of ligand the charge on the
metal ion is partially neutralized and the soft character of the metal ion
is enhanced. Thus the reaction with a second ligand molecule will involve
a more covalent interaction, with a correspondingly greater (exothermic)
heat of reaction.
The entropy change for the first step is positive and that for the second
step is negative. This is in keeping with the model for metal-polyamine
complex formation suggested by Paoletti et at. (42), and they explain the
observation as follows. On complex formation solvent molecules attached
to the metal ion and ligand are released,which makes a positive contribu
tion to the entropy change. This positive contribution is partially off
set by the loss of ligand entropy on formation of the chelate ring.
However, for the first step of complex formation the former contribution
is greater than the second and so the ove~all entropy change observed is
positive. The addition of a ligand molecule to the metal ion causes a
dielectric screening of the metal i on, which in turn results in a decrease
276
in the interaction with the solvent. Hence, on the addition of a second
chelating ligand, fewer water molecules will be released and the loss in
ligand entropy exceeds the positive contribution made by the release of
solvent molecules. This results in decreasing entropy changes with suc
cessive steps of complexation.
In considering the entropy change for the reaction Ni2 ++ 2L ~ NiLi+,
Barbucci (77) used the fact that the value for etolen (19.2 J mol- 1 K- 1)
is larger than that for dien (0) to suggest that one of the alcohol
groups in Ni(etolen)~+ is not coordinated to the metal ion. The value
obtained here for this entropy change (18.2 J mol- 1 K- 1) is only slightly
smaller. One can however explain the entropy changes observed for the
formation of the Ni-etolen complexes by making use of the results of
Everhart et at. (65). They showed for Ni(etolen) (H2 0);+that, although
6He
for coordination of the alcoholic oxygen is 0, coordination is favoured
by a gain in entropy of about 6.3 J mol- 1 K- 1 . When this result is used
in conjunction with the entropy changes for the Ni-dien complexes in the
equation
e 6S (etolen) = pqr 2[6S~ (dien)/3J + 6.3,
pqr
one obtains 6S~11 = 30.0 J mol-1K- 1 and 6S~12 = -17.4 J mol- 1 K- 1 for the
stepwise formation of the Ni-etolen complexes. These estimates are fairly
close to the experimentally observed values. It therefore seems reasonable
to assume that etolen behaves as a tridentate ligand in these complexes.
8.4. The nickel ion - oden system
The formation curves obtained from the potentiometric data for this system
are shown in Figure 8.9.
One notable feature is that, except for low values of -log[LJ, the curve
for titration no. 3 (denoted by ><) lies slightly above the others. This
titration was carried out at the lowest metal ion concentration used
([Ni2
+J o = 5.007 x 10- 4 mol dm- 3). It is well known that titrations in
volving sub-millimolar concentration levels are more prone to experimental
error, so it was concluded that this upward displacement was merely a
reflection of slight inaccuracies in the solution concentrations.
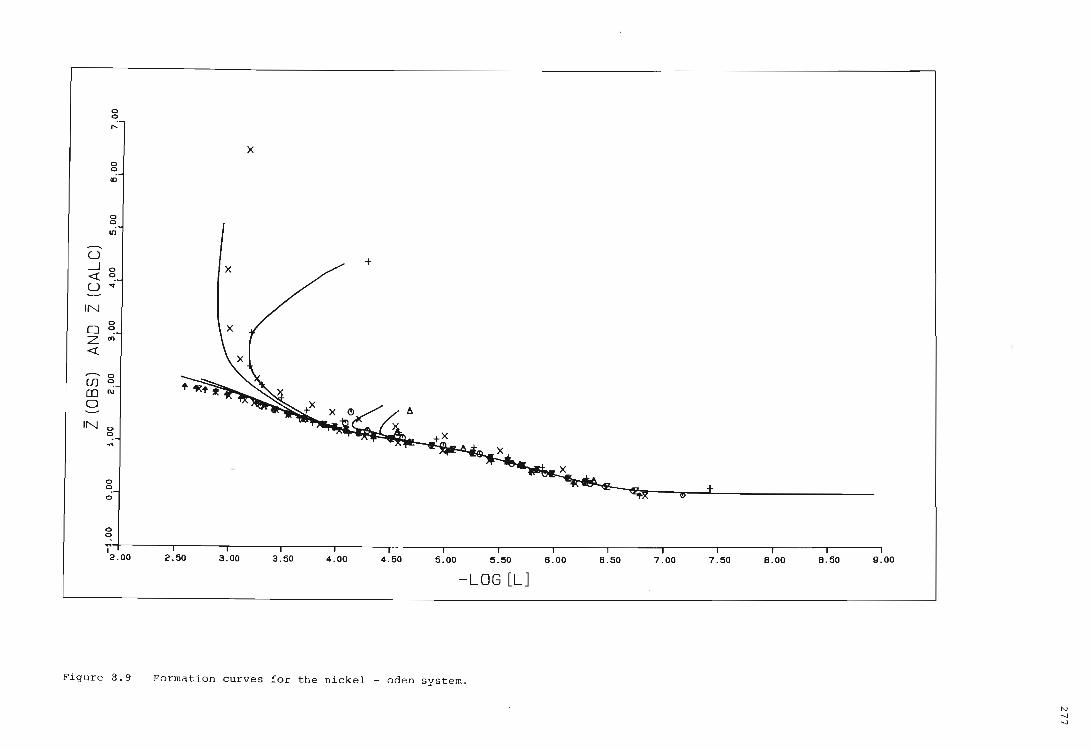
0
~ .....
0 0
CD
0 0
III
U ---10
<t~ U ..
IN 0
O~ Z '" <t
0
cn~ CDN 0
IN 0
~
o o o
o o
X
r I I I I i I I I I I I I I I I 2 . 00 2.50 3.00 3.50 4 . 00 4.50 5.00 5 . 50 B. OO B. 50 7.00 7.50 B.OO B.50 9 . 00
-LOG [L]
Figure 8.9 Formation curves for the nickel - oden system.
tv -.J -.J
Those titrations (nos. 1 - 3) which were carried out at higher p[H+]
values exhibit 'curl-back' and 'shoot-up'. These effects are observed
even for Z values somewhat less than 2 (which was not the case for
278
the Ni-etolen system). This suggests that these effects may not be due
only to experimental error, and that the possible presence of hydrolysed
or protonated species needs to be investigated. The 'curl-back' feature
starts at lower Z values for titration no. 1 than for the other two.
This is not surprising, because no. 1 was carried out at the highest
metal to ligand ratio of the three. The operating p[H+] was therefore
higher and hydrolysis more likely to occur at an early stage. It is
interesting to note that those titrations (nos. 4 - 7) which were carried
out with protonated ligand as part of the background electrolyte exhibit -
no hydrolysis and level off at Z = 2.
The plots of the repeat titrations (nos. 4 and 7) were completely super
imposable, which indicates that the results are reproducible. The forward -and reverse runs of titration no. 1 are also superimposable, up to Z - 1.
Thus within experimental error the formation curves are superimposable
(apart from ·the 'curl-back' and 'shoot-up'), and one can conclude that no
polynuclear species ' are present.
For species selection purposes, ML and ML2 were treated as the major
complexes present. Attempts were then made to introduce various protonated
and hydrolysed species into the model. Fixed values were used for the
stability constants of the species H2 0, HL+, H2 L2 + and Ni(OH)+. Table
8.9 lists the results obtained for the 'successful' models tried, i.e.
those models for which the program ESTA yielded successful refinements.
For models 1 and 2 the data were divided into two sets. One set
(titrations 4 - 7) consisted of those titrations which were carried out
with protonated ligand as part of the background electrolyte, and exhibited
no 'shoot-up' or 'curl-back'. The titrations in the other set (nos. 1 _
3) did not use protonated ligand, and did exhibit 'shoot-up' and 'curl
back'. All attempts to include hydroxy species in the model failed
when the two sets were treated separately. The 'curl-back' and 'shoot-up'
effects could be reproduced only when the complete data set was used. On
the basis of the value of the objective function U, model 4 was taken
to be the best description of the species present in solution. It is
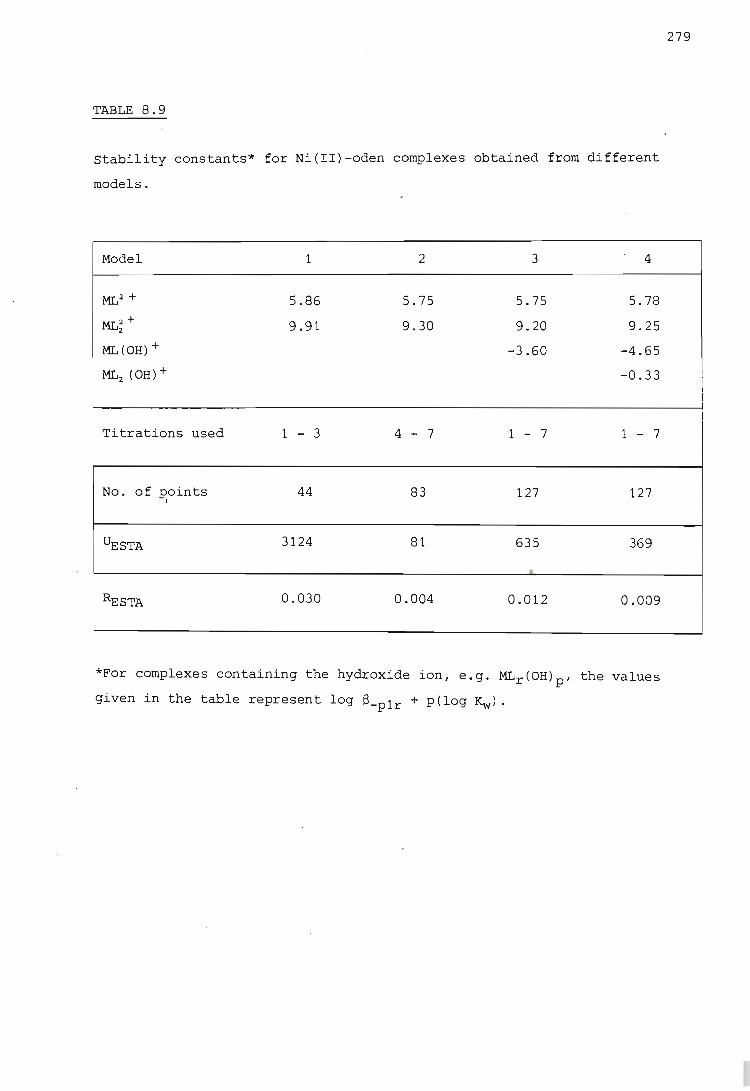
TABLE 8.9
stability constants* for Ni(II)-oden complexes obtained from different
models.
Model 1 2 3 4
ML2 + 5.86 5.75 5.75 5.78
ML2+ 2 9.91 9.30 9.20 9.25
ML(OH) + -3.60 -4.65
ML2 (OH)+ -0.33 ,
Titrations used 1 - 3 4 - 7 1 - 7 1 - 7
No. of points 44 83 127 127 I
UESTA 3124 81 635 369
•
RESTA 0.030 0.004 0.012 0.009
*For complexes containing the hydroxide ion, e.g. MLr(OH)p' the values
given in the table represent log S-p1r + p(log Kw) .
279
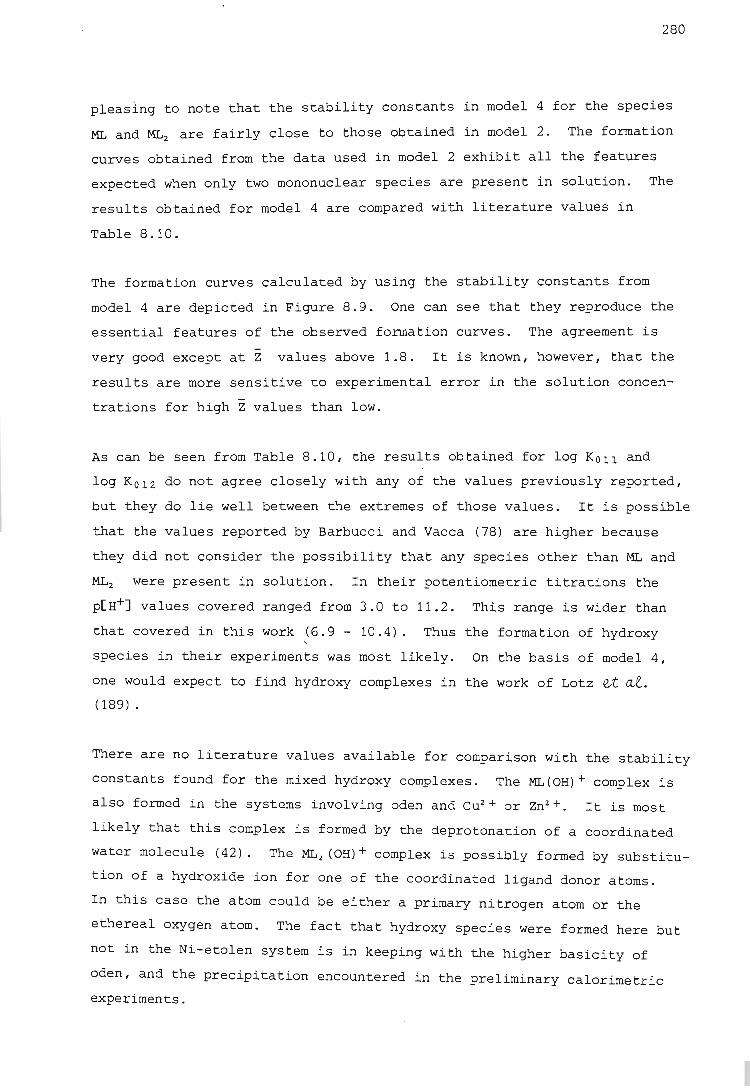
280
pleasing to note that the stability constants in model 4 for the species
ML and MLz are fairly close to those obtained in model 2. The formation
curves obtained from the data used in model 2 exhibit all the features
expected when only two mononuclear species are present in solution. The
results obtained for model 4 are compared with literature values in
Table 8.10.
The formation curves calculated by using the stability constants from
model 4 are depicted in Figure 8.9. One can see that they reproduce the
essential features of the observed formation curves. The agreement is -very good except at Z values above 1. 8. It is known, however, that the
results are more sensitive to experimental error in the solution concen
trations for high Z values than low.
As can be seen from Table 8.10, the results obtained for log KOll and
log K012 do not agree closely with any of the values previously reported,
but they do lie well between the extremes of those values. It is possible
that the values reported by Barbucci and Vacca (78) are higher because
they did not consider the possibility that any species other than ML and
MLz were present in solution. In their potentiometric titrations the
p[H+1 values covered ranged from 3.0 to 11.2. This range is wider than
that covered in this work (6.9 - 10.4). Thus the formation of hydroxy
species in their experiments was most likely. On the basis of model 4,
one would expect to find hydroxy complexes in the work of Lotz et at. (189) .
There are no literature values available for comparison with the stability
constants found for the mixed hydroxy complexes. The ML(OH) + .complex is
also formed in the systems involving oden and Cuz+ or Znz+. It is most
likely that this complex is formed by the deprotonation of a coordinated
water molecule (42). The ML z (OH)+complex is possibly formed by substitu
tion of a hydroxide ion for one of the coordinated ligand donor atoms.
In this case the atom could be either a primary nitrogen atom or the
ethereal oxygen atom. The fact that hydroxy species were formed here but
not in the Ni-etolen system is in keeping with the higher basicity of
oden, and the precipitation encountered in the preliminary calorimetric
experiments.
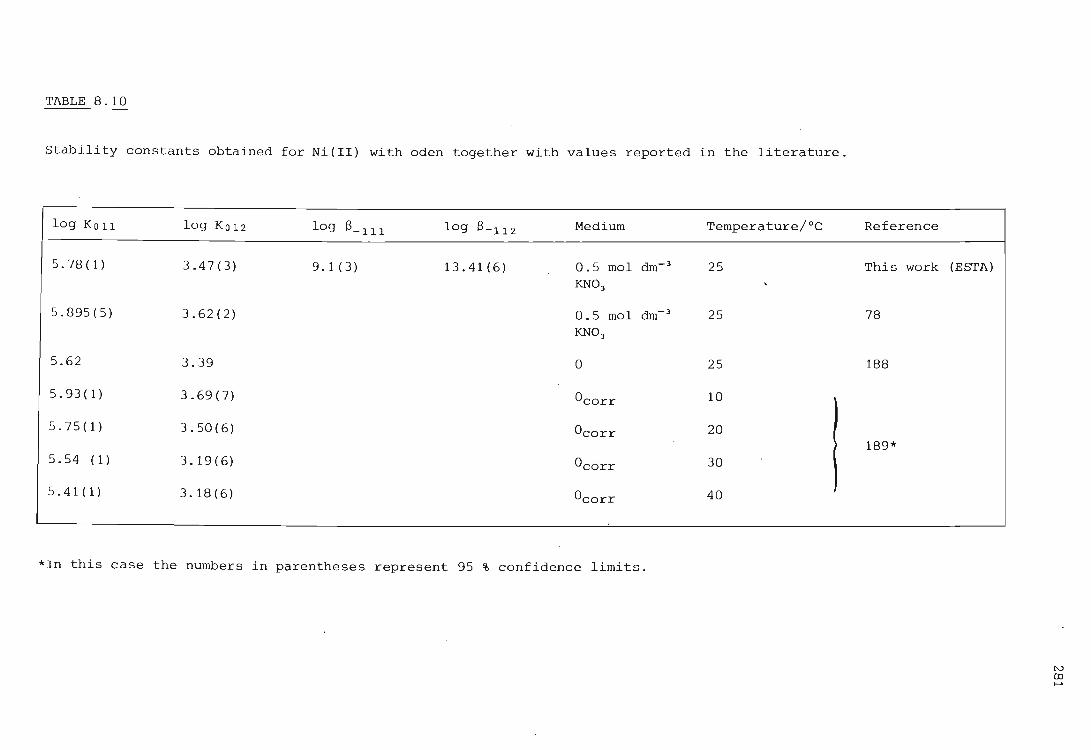
TABLE 8.10
Stability constants obtained for Ni(II) with oden together with values reported in the literature.
log K011 log Ko 12 log 8- 111 log 8-112 Medium Temperature/oC
5.78 (1) 3.47(3) 9.1(3) 13.41 (6) 0.5 mol dm-) 25 KNO)
5.895(5) 3.62(2) 0.5 mol dm-) 25 KNO)
5.62 3.39 0 25
5.93(1) 3.69(7) °corr 10
5.75(1) 3.50(6) °corr 20
> 5.54 (1) 3.19(6) °corr 30
5.41(1) 3.18(6) °corr 40
*In this case the numbers in parentheses represent 95 % confidence limits.
Reference
This work (ESTA)
78
188
189*
I\.)
en ~
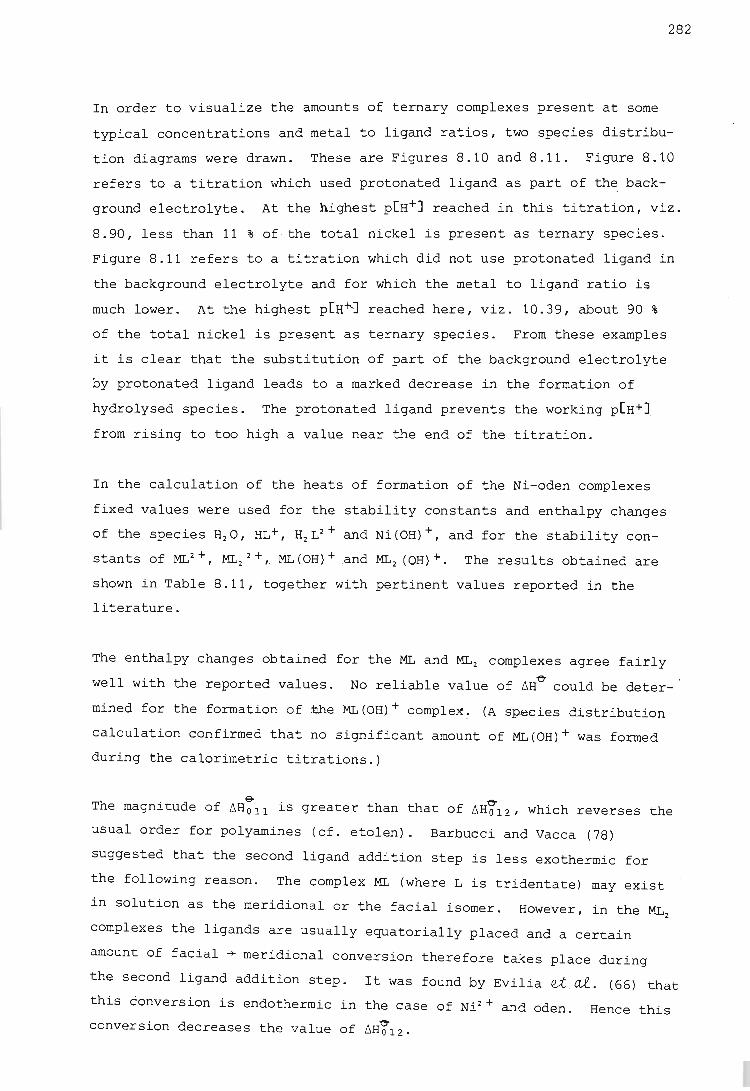
282
In order to visualize the amounts of ternary complexes present at some
typical concentrations and metal to ligand ratios, two species distribu
tion diagrams were drawn. These are Figures 8.10 and 8.11. Figure 8.10
refers to a titration which used protonated ligand as part of the back
ground electrolyte. At the highest p[H+1 reached in this titration, viz.
8.90, less than 11 % of the total nickel is present as ternary species.
Figure 8.11 refers to a titration which did not use protonated ligand in
the background electrolyte and for which the metal to ligand ratio is
much lower: At the highest p[H~] reached here, viz. 10.39, about 90 %
of the total nickel is present as ternary species. From these examples
it is clear that the substitution of part of the background electrolyte
by protonated ligand leads to a marked decrease in the formation of
hydrolysed species. The protonated ligand prevents the working p[H+]
from rising to too high a value near the end of the titration.
In the calcul~tion of the heats of formation of the Ni-oden complexes
fixed values were used for the stability constants and enthalpy changes
of the species H20, HL+, H2L2+ and Ni(OH)+, and for the stability con
stants of ML2+, ML22+,. ML(OH)+and ML2 (OH)+. The results obtained are
shown in Table 8.11, together with pertinent values reported in the
literature.
The enthalpy changes obtained for the ML and ML2 complexes agree fairly
well with the reported values. . ~ , No re11able value of ~H could be deter-
mined for the formation of the ML(OH)+ comple~ : (A species distribution
calculation confirmed that no significant amount of ML(OH)+was formed
during the calorimetric titrations . )
The magnitude of ~H!ll is greater than that of ~H~12' which reverses the
usual order for polyamines (cf. etolen) . Barbucci and Vacca (78)
suggested that the second ligand addition step is less exothermic for
the following reason. The complex ML (where L is tridentate) may exist
in solution as the meridional or the facial isomer. However, in the ML2
complexes the ligands are usually equatorially placed and a certain
amount of facial + meridional conversion therefore takes place during
the second ligand addition step. It was found by Evilia et .al. (66) that
this conversion is endothermic in the case of Ni2 + and oden. Hence this
conversion decreases the value of ~H~1 2 .
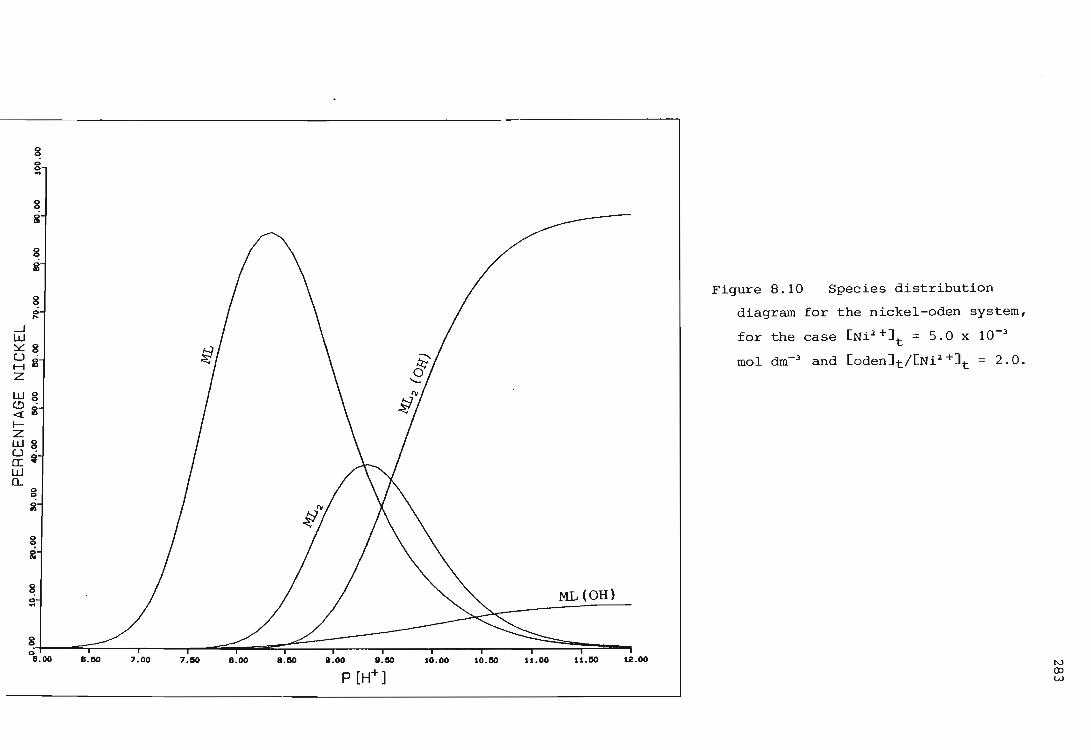
-.J w
8 8 .. 8 i
8
~ 0 ...
~8 u . Hi z wg (!) . «2 f-Z wg U· a:~ w a...
0 0
i
~ 2
~ ~
~ 0 1 . 00 1.110 7.00 7.110 1.00 1 . 110 1.00 1.110 10.00 10.110
P [H+]
ML(OH)
U.OO U.IIO 12.00
Figure 8.10 Species distribution
diagram for the nickel-oden system,
for the case [Ni2 +]t = 5.0 x 10⁻³
mol dm- 3 and [oden]t/[Ni2 +]t = 2.0.
N co w
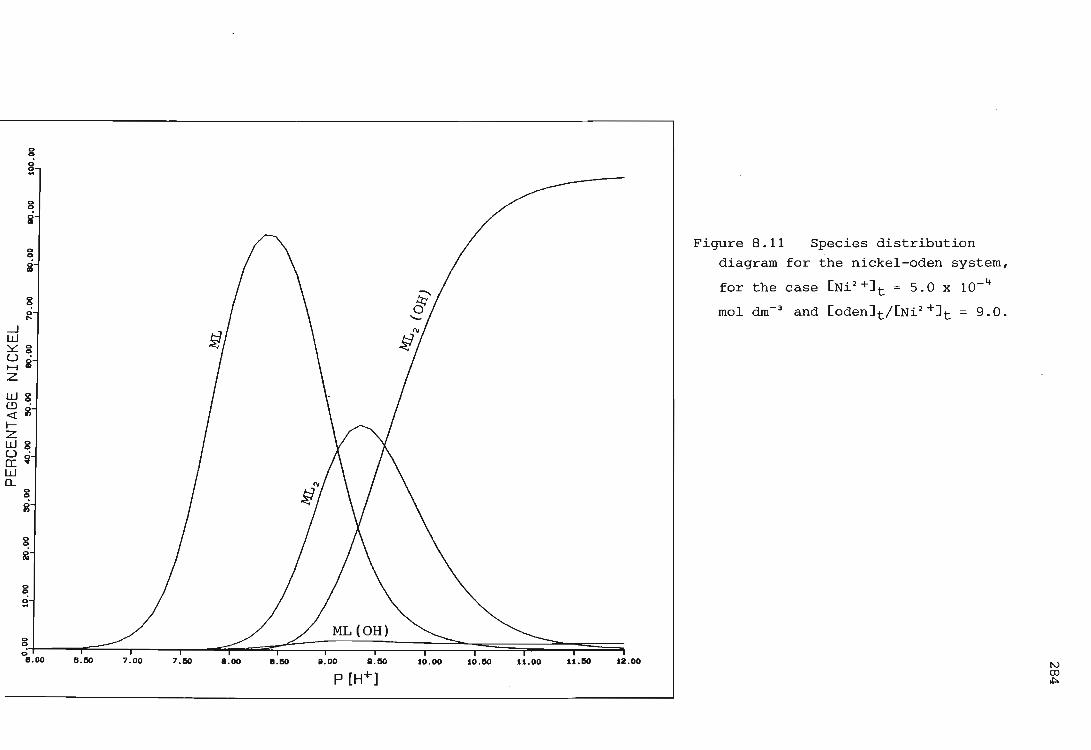
g
§
~ Ii
0 0
i
g 0
'" -.J W ~g U · Hi Z
wg (!) . <{2 I-Z wg U · a: i w Q.
g 2
g Ii:
g ~
g 0
B . OO B.IIO 7 .00 7.110 B. OO B. IIO 1.00 11.110 10.00
P [H+] 10.110 11.00 St.1IO 12.00
Figure 8.11 Species distribution
diagram for the nickel-oden system,
for the case [Ni2 +]t = 5.0 x 10⁻⁴
mol dm- 3 and [oden]t/[Ni2 +]t = 9.0.
I\.)
CD
"'"
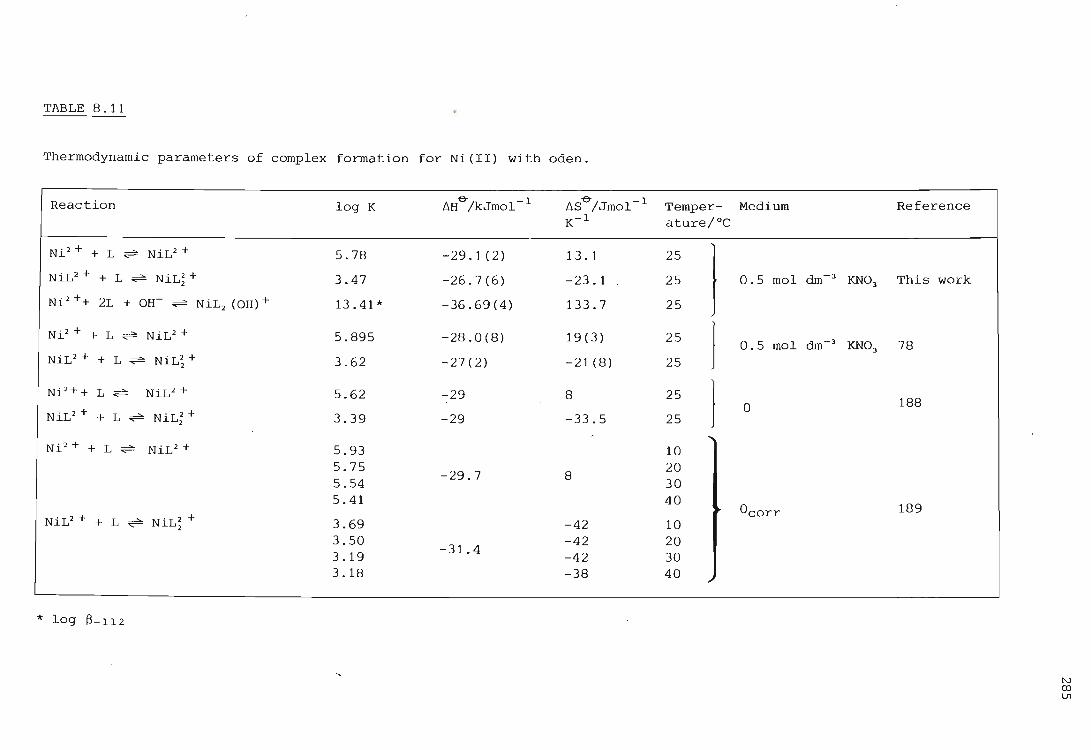
TABLE 8.11
Thermodynamic parameters of complex formation for Ni(II) with oden.
Reaction log K L'lHe-/kJmol-1 L'lSe-/Jmol-1 K- 1
Ni2 + + L ~ NiL2 + 5.78 -29.1(2) 13.1
NiL2 + + L ~ NiL~+ 3.47 -26.7(6) -23.1
Ni 2 ++ 2L + OH- ~ NiL2 (OH)+ 13.41* -36.69(4) 133.7
Ni2 + + L ~ NiL2 + 5.895 -28.0(8) 19(3)
NiL2 + + L ~ NiL; + 3.62 -27(2) -21 (8)
Ni2++ L ~ NiL2 + 5.62 -29 8
NiL 2 + + L ~ NiL; + 3.39 -29 -33.5
Ni2 + + L ~ NiL2 + 5.93 5.75
-29.7 8 5.54 5.41
NiL2 + + L ~ NiL; + 3.69 -42 3.50
-31.4 -42
3.19 -42 3.18 -38
* log 13-112
Temper-ature/oC
25
} 25
25
25
1 25
25
1 25
10 20 30 40
)-10 20 30 40 .-
Medium
0.5 mol dm- J KNOJ
0.5 mol dm- J KNO J
0
°corr
Reference
This work
78
188
189
N (l)
lJ1
286
The above explanation presupposes that the ML2 complex is meridional. This
assumption is justified by Barbucci and Vacca on the grounds that the
rather similar Ni(dien);+complex. is meridional in the solid state. There
is however no evidence to suggest that the stereochemistry observed in the
solid state is maintained in solution. In fact there are suggestions to
the contrary (42). The crystal Istructure of Ni(oden)~+ has not yet been
reported.
This decrease in the enthalpy change on addition of a second ligand mole
cule was also observed in studies of the ligand dpt with Ni 2 +, where it
was known that all the nitrogens are coordinated to the metal ion in solu
tion (195). In that case steric repulsion between the two ligand molecules
was used to account for the phenomenon. This may also be the explanation
in the case of oden.
Another possible explanation for this phenomenon is that in the second
step of complex formation more water molecules are lost. This endothermic
effect lowe.rs the heat liberated in spite of the fact that the second step
is a softer interaction and should· be more exothermic than the first.
If this increased de solvation effect were operative it would manifest
itself in abnormally large !J.S~ values. As this does not obvious.ly occur,
the previous explanation is the more plausible of the two.
Again, the entropy changes observed follow the usual trend for polyamines.
A comparison of the stability constants obtained for the etolen and oden
complexes of Ni(II) shows that ·the oden complexes are weaker than those
of etolen. This is in keeping with the supposition that the stability
of a nickel-polyamine complex increases as the number of secondary nitrogen
donors increases at the expense of primary nitrogen donors. But Barbucci
and Vacca (78) and Lotz et at. (189) ascribed this lower stability of the
oden complexes to the destabilizing effect of the ether oxygen. This
lower stability cannot be ascribed to non-coordination of the ether oxygen,
because it has been shown that in aqueous solution oden behaves as a tri
dentate ligand towards Ni 2 + (66). The lower stability of oden complexes
is also due to a somewhat less favourable enthalpic contribution. The
s~aller positive entropy change observed for the formation of the ML2 +
com~le~ . involv~g oden suggests differing degrees of solvation of the
ML2 + complexes of the two ligands. The difference between the lIS%ll values of etolel
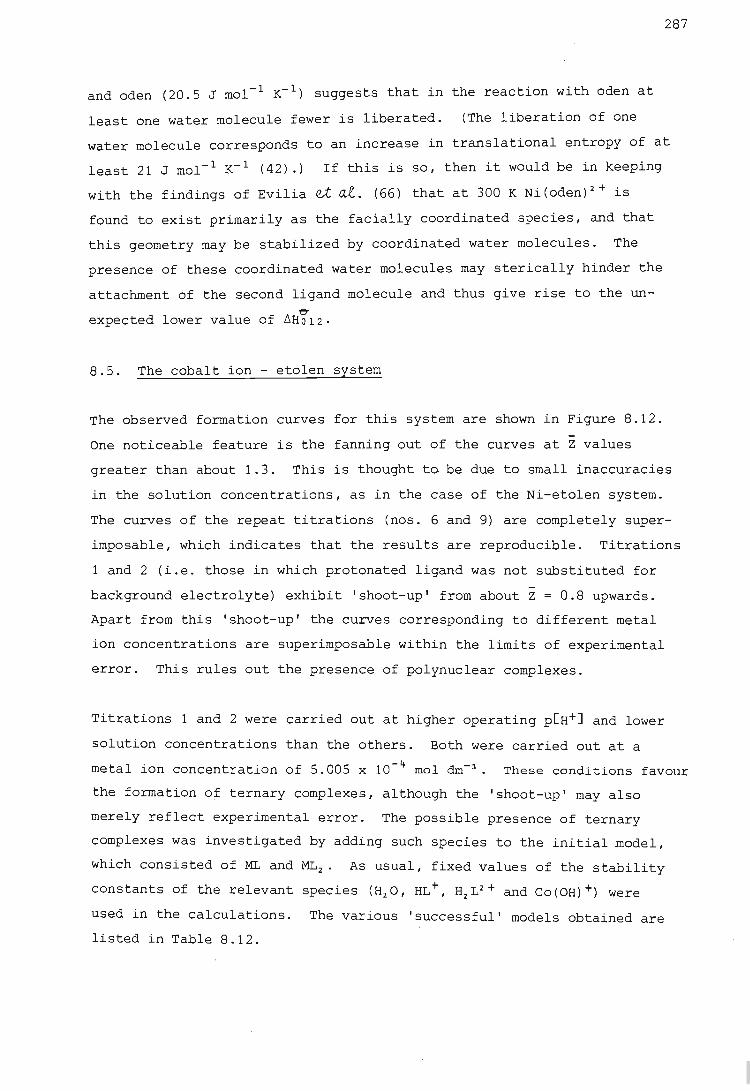
287
and oden (20.5 J mol- 1 K- 1) suggests that in the reaction with oden at
least one water molecule fewer is liberated. (The liberation of orie
water molecule corresponds to an increase in translational entropy of at
least 21 J mol- 1 K- 1 (42).) If this is so, then it would be in keeping
with the findings of Evilia ~ at. (66) that at 300 K Ni(oden)2+is
found to exist primarily as the facially coordinated species, and that
this geometry may be stabilized by coordinated water molecules. The
presence of these coordinated water molecules may sterically hinder the
attachment of the second ligand molecule and thus give rise to the un-~
expected lower value of ~H012·
8.5. The cobalt ion - etolen system
The observed formation curves for this system are shown in Figure 8.12.
One noticeable feature is the fanning out of the curves at Z values
greater than about 1.3. This is thought to be due to small inaccuracies
in the solution concentrations, as in the case of the Ni-etolen system.
The curves of the repeat titrations (nos. 6 and 9) are completely super
imposable, which indicates that the results are reproducible. Titrations
1 and 2 (i.e. those in which protonated ligand was not substituted for
background electrolyte) exhibit 'shoot-up' from about Z = 0.8 upwards.
Apart from this 'shoot-up' the curves corresponding to different metal
ion concentrations are superimposable within the limits of experimental
error. This rules out the presence of polynuclear complexes.
Titrations 1 and 2 were carried out at higher operating p[H+] and lower
solution concentrations than the others. Both were carried out at a
metal ion concentration of 5.005 x 10- 4 mol dm- 3 • These conditions favour
the formation of ternary complexes, although the 'shoot-up' may also
merely reflect experimental error. The possible presence of ternary
complexes was investigated by adding such species to the initial model,
which consisted of ML and ML2 . As usual, fixed values of the stability
constants of the relevant species (H20, HL+, H2L2+ and CO(OH)+) were
used in the calculations. The various 'successful' models obtained are
listed in Table 8.12.

U ~ <C. U
IN
0 Z <C.
(J)
CD 0
IN
0 0 .,
0 ttl
I'l
0 0
I'l
0 ttl
N
0 0
N
0
If! ~
0
~ ~
0 ttl
0
o o o
~ o I
o o
A
~~------~------r------.-------r------'-------r------.r-----~-------r------' I 3.00 4.00 5.00 B. OO 7 .00 B.OO 8.00 10.00 11.00 12.00 13.00
-LOG [L]
Figure 8.12 Formation curves for the cobalt - etolen system.
288
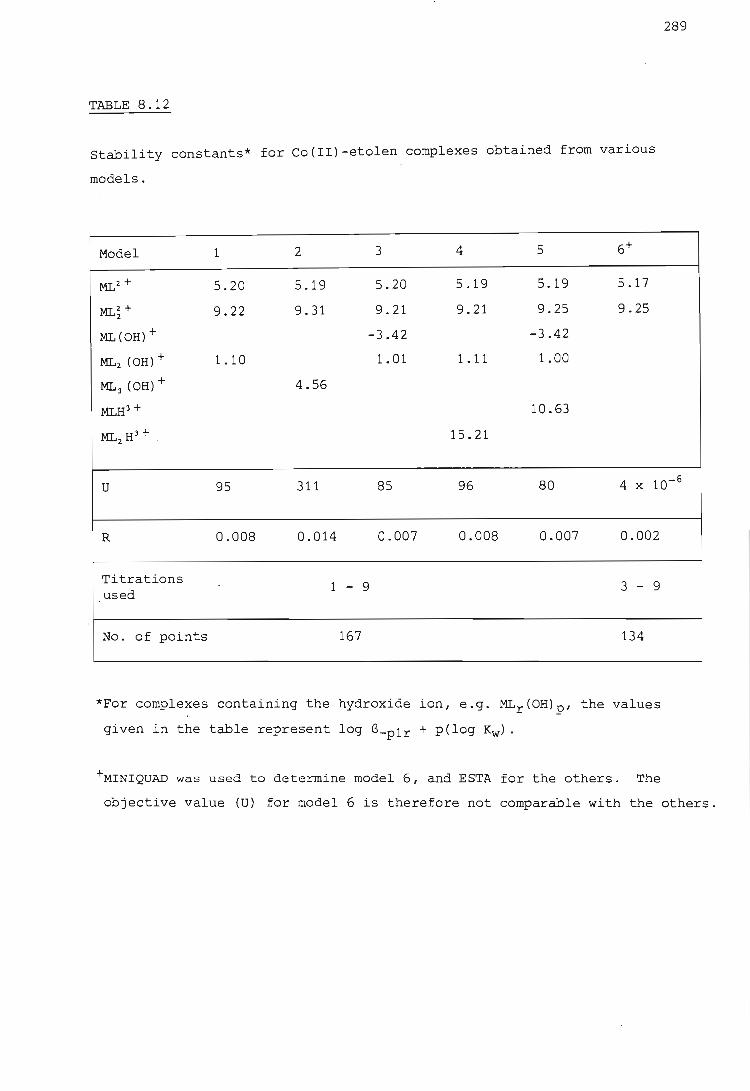
TABLE 8.12
Stability constants* for Co(II)-etolen complexes obtained from various
models.
Model 1 2 3 4 5 6+
ML2+ 5.20 5.19 5.20 5.19 5.19 5.17
ML2+ 2 9.22 9.31 9.21 9.21 9.25 9.25
ML(OH) + -3.42 -3.42
ML2 (OH)+ 1.10 1.01 1.11 1.00
ML3 (OH)+ 4.56
MLH3+ 10.63
ML2 H3 + . 15.21
289
U 95 311 85 96 80 4 x 10- 6
R 0.008 0.014 0.007 0.008 0.007 0.002
Titrations 1 - 9 3 - 9 used
No. of points 167 134
*For complexes containing the hydroxide ion, e.g. MLr(OH)p' the values
given in the table represent log S-p1r + p(log Kw) .
+MINIQUAD was used to determine model 6, and ESTA for the others. The
objective value (U) for model 6 is therefore not comparable with the others.
290
Obviously model 6 is not comparable with the others because it cannot
reproduce the 'shoot-up' observed. On the basis of the values of U and
the numbers of complexes included in the models, possibilities 2 and 4
were rejected. From inspection of the remaining three models it appears
that inclusion of species other than ML2+, ML;+ and ML2 (OH)+ does not
greatly improve the objective value. Modell was therefore preferred
because of its simplicity and because it reproduces the essential features
of the observed formation curves. It should be noted that the inclusion
of various minor species does not greatly alter the values of the stabi
lity constants for the ML2+ .and ML~ + .complexes. The results obtained
from model 1 are compared with various reported values in Table 8.13.
The Z(calc) curves based on model 1 and depicted in Figure 8.12 are aple
to reproduce the 'shoot-up' and fanning out to a very satisfactory extent.
Therefore it was decided that thi s model of the species present in solu
tion adequately describes the data collected.
The value of log KOll obtained is higher than that of Hall et ai. (183),
and vice versa for the value of log K012. However, as stated by Hall et
ai., their value of log KQ12 is unreliable because further action with
base was required in order to obtain complete formation of the ML2
complex. It should be noted that Martell and Smith, in their stability
constant compilation (167), quote as unreliable both values reported by
Hall et ai. The values obtained in this work are in keeping with those
obtained for other, similar, systems in that log KOll > log K012, whereas
the results of Hall et ai. reverse this relation.
The fact that the stability constants obtained by Edwards (180, 192) for
this system are much higher than the other sets of values is perhaps to
be expected, in view of the comments made in Section 8.3.
Species distribution diagrams for this system are shown in Figures 8.13
and 8.14. In 8.13, which relates to a typical titration with no proto
nated ligand in the background electrolyte and a high metal to ligand
ratio, the ternary complex ML2 (OH) + . accounts for over 90 % of the total
cobalt at the end of the titration, i . e. at p[H+] = 9.45. In 8.14,
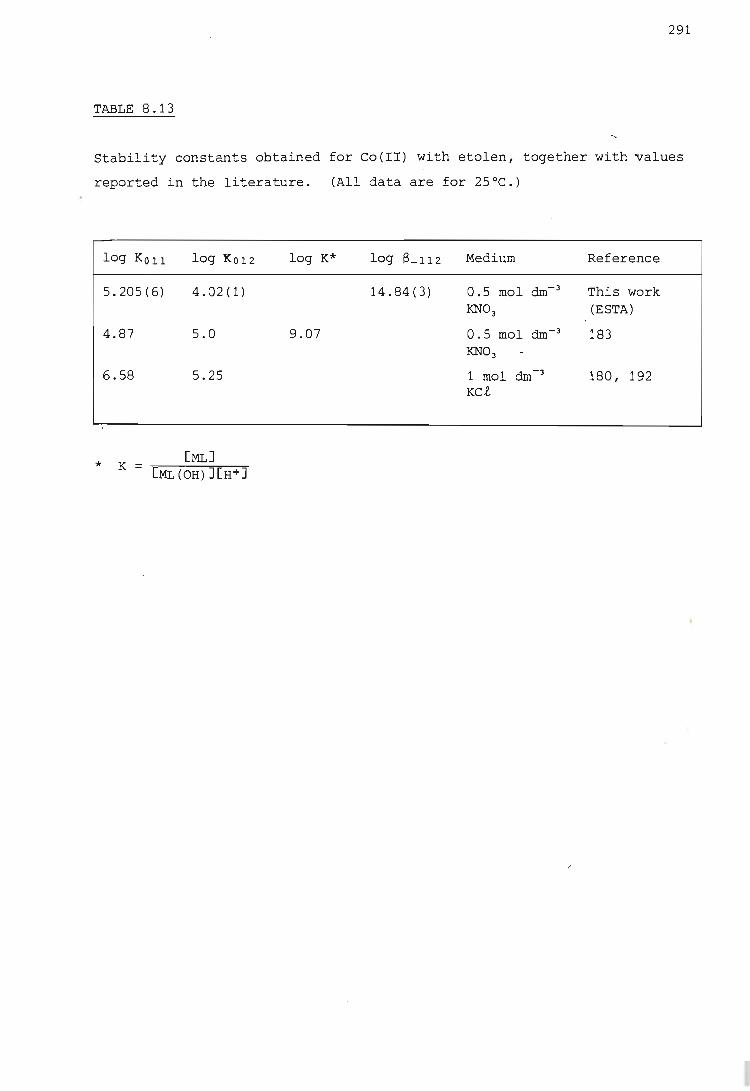
291
TABLE 8.13
Stability constants obtained for Co(II) with etolen, together with values
reported in the literature. (All data are for 25°C.)
log KOll log K012 log K* log fL1l2 Medium Reference
5.205(6) 4.02(1) 14.84(3) 0.5 mol dm-3 This work KN0 3 (ESTA)
4.87 5.0 9.07 0.5 mol dm-3 183 KN0 3
6.58 5.25 1 mol dm-3 180, 192 KCt
* K
/
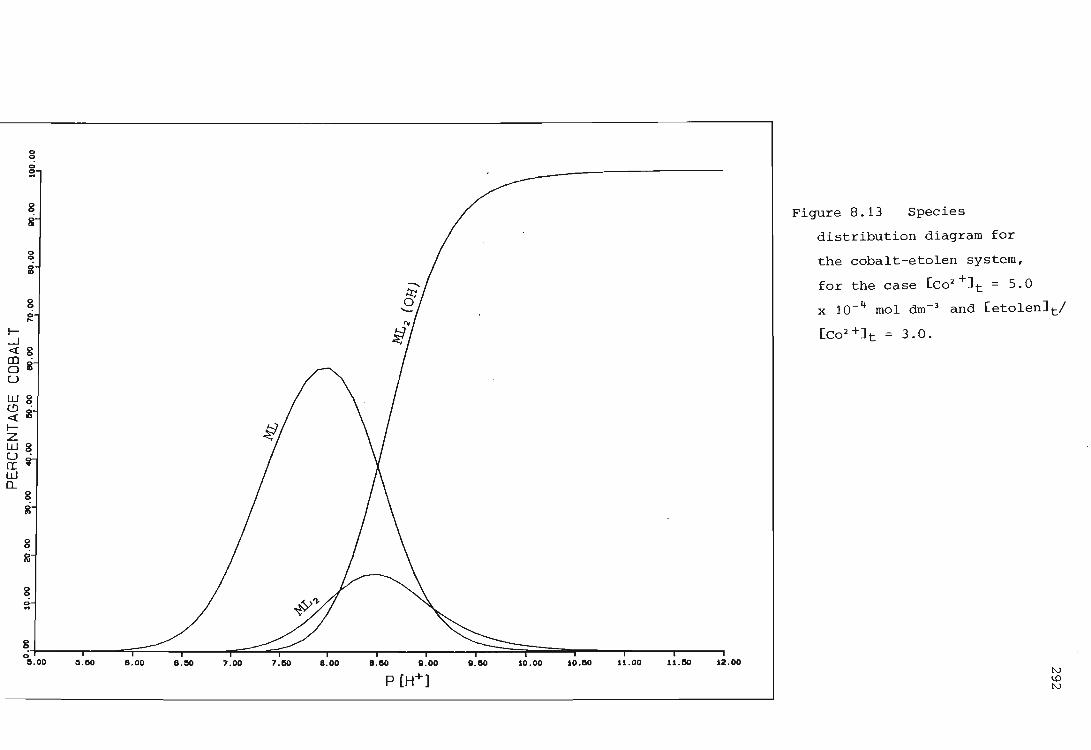
g
~
g i
g 2
0 0
0 ... J---.l «g Ill ' 0 2 u wg (!). «S J--Z wg U· a:~ w 0...
g 2
0 0
~
g ~
g 0 11.00 11.110 B. OO B.IIO 7.00 7.110 1 . 00 B.IIO 11.00 11.110
P [H+] 10.00 10.110 11.00 11 . 110 12.00
Figure 8.13 Species
distribution diagram for
the cobalt-etolen system,
for the case [co2 +]t = 5.0
x 10-~ mol dm- 3 and [etolen]tl
[Co2 +]t = 3.0.
I\..)
w I\..)
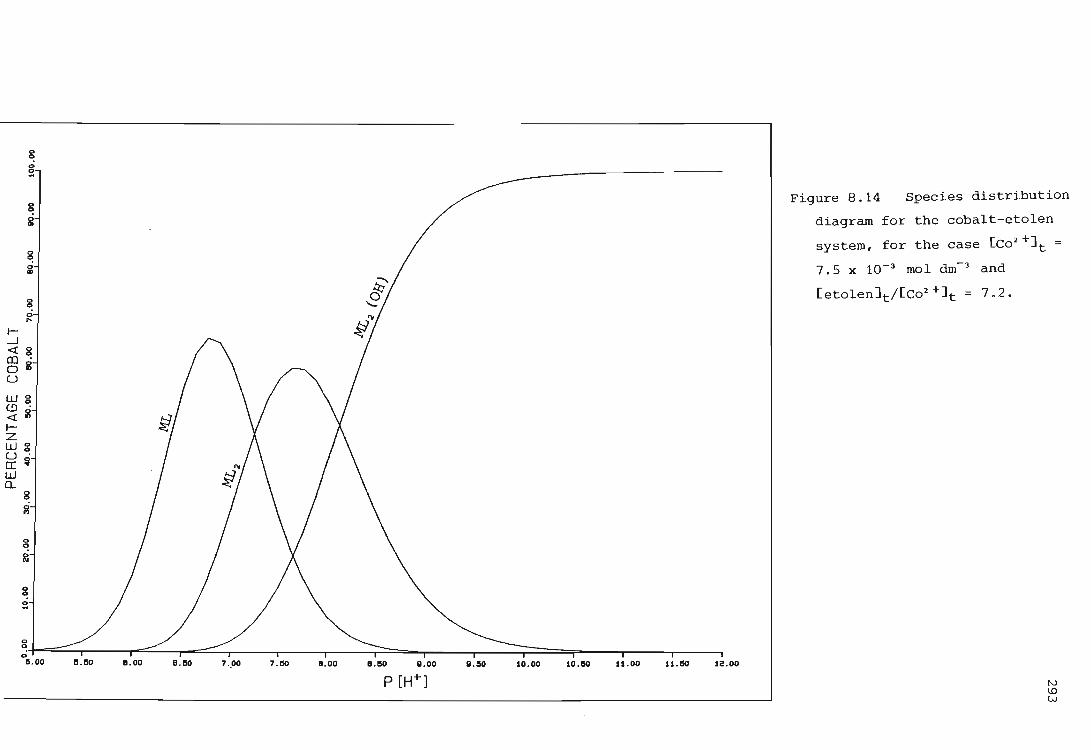
0 0
~
0 0
g
0 0
2
0 0
0 ,.. t--1 <ig co" 0 2 u wg (!)" <i 2 t-z wg u" o:~ W 0..
0 0
2
g Ii:
0 0
0 .. g 0 11.00 11 . 50 11.00 11.50 7 •. 00 7.50 1.00 1.50 8.00
P [H+] 8.50 10.00 10.50 11.00 11.50 12.00
Figure 8.14 Species distribution
diagram for the cobalt-etolen
system, for the case [co2 +]t
7.5 x 10⁻³ mol dm- 3 and
[etolen]t/[co2 +]t = 7 . 2 .
N ~ w
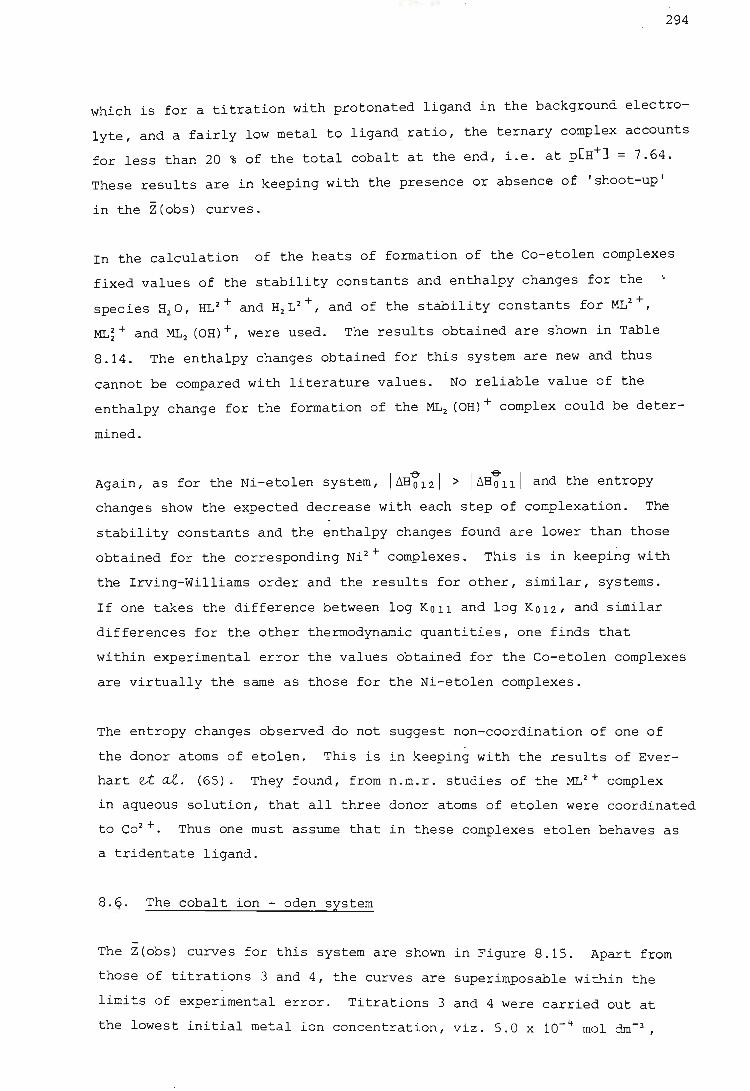
294
which is for a titration with protonated ligand in the background electro
lyte, and a fairly low metal to ligand ratio, the ternary complex accounts
for less than 20 % of the total cobalt at the end, i.e. at p[H+1 = 7.64.
These results are in keeping with the presence or absence of 'shoot-up'
in the Z(obs) curves.
In the calculation of the heats of formation of the Co-etolen complexes
fixed values of the stability constants and enthalpy changes for the
species H20, HL 2 + and H2 L2 +, and of the stability constants for ML
2 +,
ML~+ and ML2 (OH)+, were used. The results obtained are shown in Table
8.14. The enthalpy changes obtained for this system are new and thus
cannot be compared with literature values. No reliable value of the
enthalpy change for the formation of the ML2 (OH)+ complex could be deter
mined.
Again, as for the Ni-etolen system, I~H~121 > I~H~lll and the entropy
changes show the expected decrease with each step of complexation. The
stability constants and the enthalpy changes found are lower than those
obtained for the corresponding Ni 2 + complexes. This is in keeping with
the Irving-Williams order and the results for other, similar, systems.
If one takes the difference between log KOll and log K012, and similar
differences for the other thermodynamic quantities, one finds that
within experimental error the values obtained for the Co-etolen complexes
are virtually the same as those for the Ni-etolen complexes.
The entropy changes observed do not suggest non-coordination of one of
the donor atoms of etolen. This is in keeping with the results of Ever
hart et al. (65). They found, from n.m.r. studies of the ML 2 + complex
in aqueous solution, that all three donor atoms of etolen were coordinated
to Co2 +. Thus one must assume that in these complexes etolen behaves as
a tridentate ligand.
8.G. The cobalt ion - oden system
The Z(obs) curves for this system are shown in Figure 8.15. Apart from
those of titrations 3 and 4, the curves are superimposable within the
limits of experimental error. Titrations 3 and 4 were carried out at
the lowest initial metal ion concentration, viz. 5.0 x 10- 4 mol dm-J ,
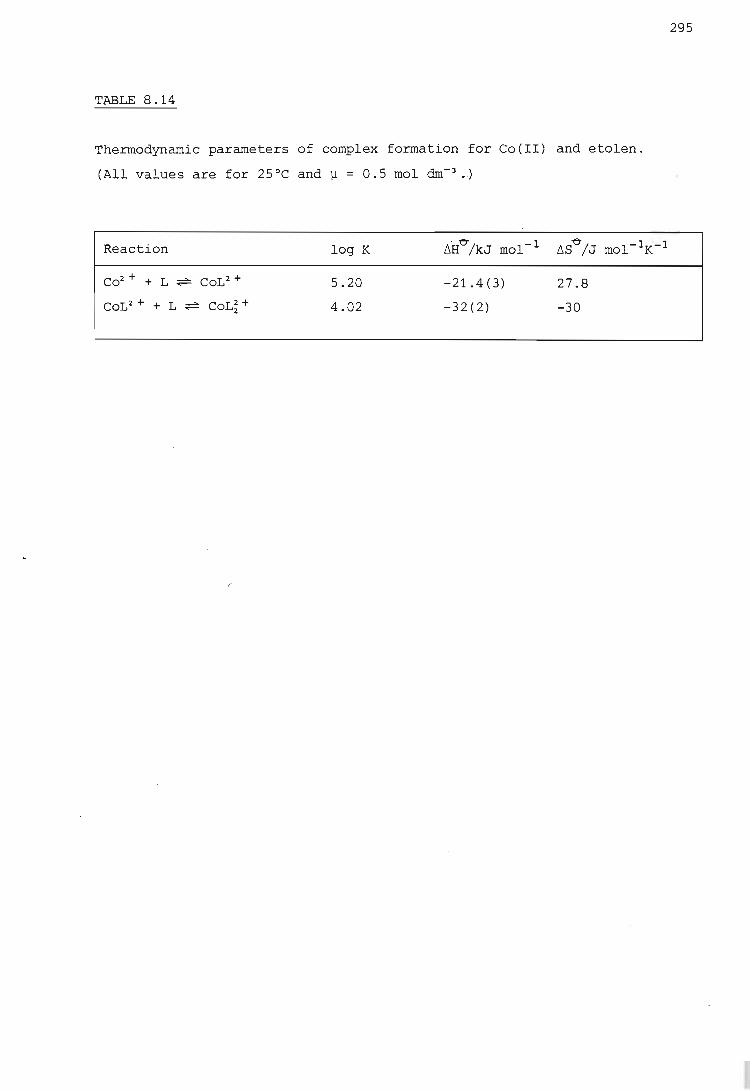
TABLE 8.14
Thermodynamic parameters of complex formation for Co(II) and etolen.
(All values are for 25°C and ~ = 0.5 mol dm-3 • . )
Reaction
Co2 + + L ~ CoL2 +
CoL2 + + L ~ COL;+
log K
5.20
4.02
. e- 1 L'lH /kJ mol-
-21.4(3)
-32(2)
27.8
-30
295
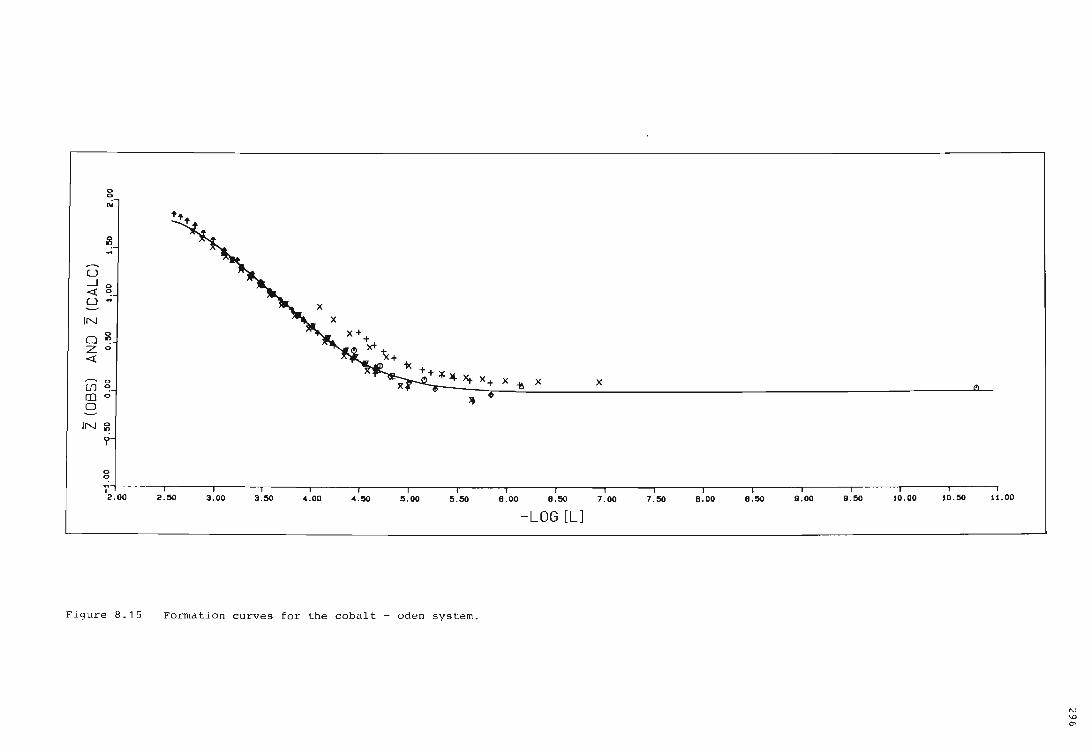
0 0
N
g .. U ...J O <t~ U ..
IN 0
Oil! Z 0
<t
0
UJ~ m o
0
IN ~ 0 I
0 0
i 2.00
Figure 8.15
X -to X
2.!IO 3.00 3.!IO "' .00 ",.!IO 5.00 5 .!IO 8 . 00 8.50
-LOG [LJ
Formation curves for the cobalt - oden system.
X
7 .00 7.50 8 . 00 8.!IO 9.00 9.!IO 10 . 00 SO.!IO 11 . 00
IV
'" 0"1
297
-so it is very likely that the upward shift in the Z curves reflects
experimental error rather than the formation of polynuclear complexes.
Nevertheless attempts were made to include various polynuclear complexes
in the model to see whether the upward shift could be explained thus.
The repeat titrations (nos. 5 and 8) are completely superimposable, and
the results are therefore reproducible. Apart from nos. 3 and 4 the
curves are straightforward and what one would expect if only two mQno
nuclear complexes ML and ML2 were present. During the calculation of
stability constants, fixed values of the stability constants of the
species H20, HL+, H2L2 + .and Co(OH)+ were used. The various 'successful'
models tested are shown in Table 8.15.
The attempts to introduce polynuclear complexes into the model were
unsuccessful. This meant that the upward bias of the Z curves for titra
tions 3 and 4 could not be reproduced. The data for these titrations
were subsequently removed from the data set.
The U values of the models determined from the remaining six titrations
can be seen to be very similar. The simplest of these models, viz. model
7, was therefore selected. The results are new and hence cannot be com
pared with any reported vaiues. Figure 8.15 displays the calculated
formation curve based on the model selected. Clearly the observed and
calculated formation curves match very satisfactorily.
In the calculation of the heats of formation of these complexes fixed
values were used for the stability constants and enthalpy changes of
H20, HL+ and H2L2+, and the stability constants of ML 2 + and MLi+. The
thermodynamic parameters of complexation of Co(II) and oden are given
in Table 8.16.
As in the Ni-oden case, I~H~lll is greater than I~H~121. However, the
entropy values do not display the u$.ual pattern. Both are positive, -e-
and in fact the value of ~S012 is surprisingly high. This is almost
suggestive of non-coordination of one of the ligand donor atoms. However,
if this is so it is not reflected in the enthalpy changes. So one must
conclude tentatively that both ligands in the ML~+ complex are tridentate.
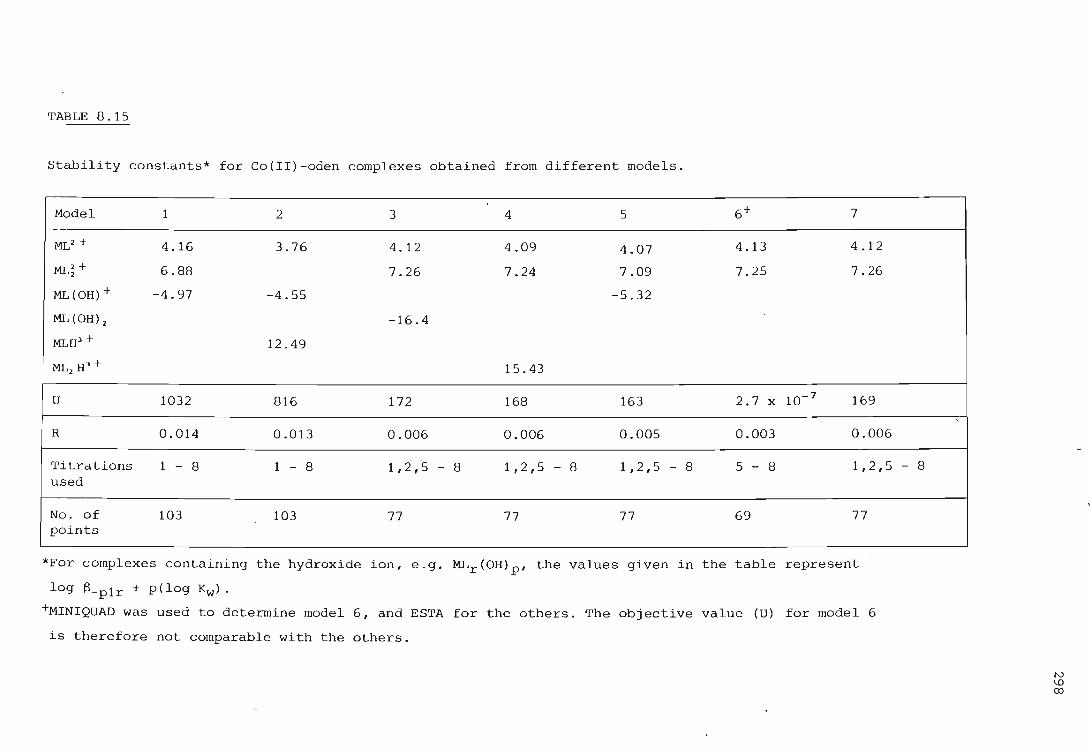
TABLE 8.15
Stability constants* for Co(II)-oden complexes obtained from different models.
Model 1 2 3 4 5 6+ 7
ML2 + 4.16 3.76 4.12 4.09 4.07 4.13 4.12
ML2 + 2 6.88 7.26 7.24 7.09 7.25 7.26
ML(OH)+ -4.97 -4.55 -5.32
ML (OH) 2 -16.4
MLH3 + 12.49
ML2 H3 + 15.43
U 1032 816 172 168 163 2.7 x 10- 7 169
R 0.014 0.013 0.006 0.006 0.005 0.003 0.006
Titrations 1 - 8 1 - 8 1,2,5 - 8 1,2,5 - 8 1,2,5 - 8 5 - 8 1,2,5 - 8 used
No. of 103 103 77 77 77 69 77 points
*For complexes containing the hydroxide ion, e.g. MLr(OH)p' the values given in the table represent
log 8-p 1r + p(log Kw) .
+MINIQUAD was used to determine model 6, and ESTA for the others. The objective value (U) for model 6
is therefore not comparable with the others.
tv \.0 co
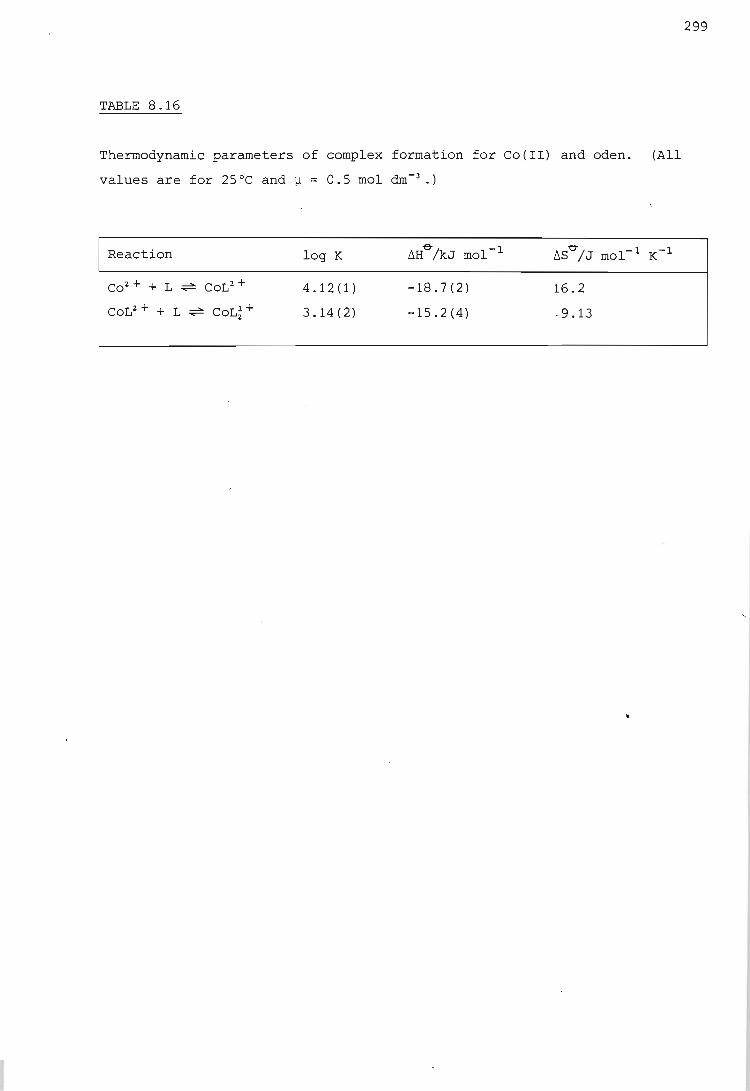
TABLE 8.16
Thermodynamic parameters of complex formation for Co(II) and oden. (All
values are for 25°C and ~ 0.5 mol dm-3.)
Reaction
Co2 + + L ~ CoL2 +
CoU + + L ~ CoL; +
log K
4.12(1)
3.14(2)
-18.7(2)
-15.2(4)
16.2
-9.13
299

300
The complexes of oden with coz+are weaker than the analogous complexes
of Ni2 +. This is a consequence of the less favourable enthalpy contribu
tion, because the entropy term makes a larger contribution to the stabili
zation of the Co-oden complexes than to that of the Ni-oden complexes.
The larger entropy stabilization is in keeping with the greater hardness
of C02 + (196).
The complexes of Coz + .with oden are also weaker than those with etolen,
which is further evidence of the greater donor power of secondary nitrogen
atoms. The difference between the ~S~12 values for oden and etolen is
rather large at 39.13 J mol- 1 K- 1 . A possible explanation is that in
the second step of complexation two more molecules of water are liberated
in the case of oden than for etolen. Such
imply a larger endothermic contribution to
This could also account for the fact that
greater desolvation would ~
~H012 for the oden complex.
I~H~121 is less than I~H~lll. (This explanation can however be shown to be invalid in the case of Niz +.)
8.7. The zinc ion - etolen system
In Figure 8.16 are shown the formation curves for this system. It can be
seen that the curve for one titration (no. 5) is displaced downwards from
the rest. This titration was carried out at the lowest metal ion concen-
tration (1.67 x 10⁻³ mol dm- 3) and the lowest initial metal to ligand
ratio (1 : 6). These conditions may have increased the likelihood of
experimental error but it is not clear that this is in fact so. The fact
that the remaining curves, including those of the repeat titrations, are
superimposable makes one suspect that the data from no. 5 may be unreli
able. This titration was therefore excluded from the data set for
calculation purposes. The rest of the curves show an interesting feature
in that, instead of levelling off at Z - 2 as might be expected, they
consistently level off at Z - 1.8. As has been shown by Avdeef et at. (191), such an effect is produced by small systematic errors in the
solution concentrations. It was however thOQghtsafest not to alter these
solution concentrations during the calculation of the stability constants.
During the calculation of the stability constants of the species present
in solution fixed values 6f the stability constants for H20, HL+, Hz L2 +
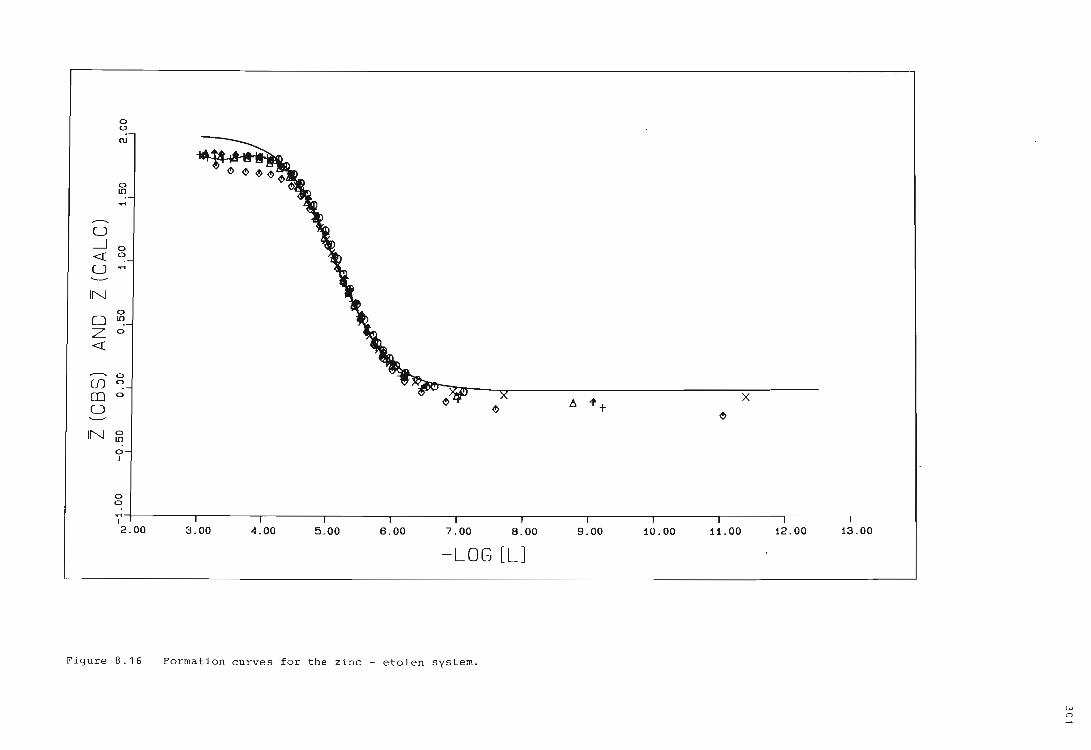
a a N
a It')
'"
U -1 a <!~ U '"
IN a
O~ Z a
<!
a U1~ m a
0
IN ~ a I
a a
'" I 2.00
Fi g ure 8.16
~
3.00 4 . 00 5 . 00 6 . 00 7.00 8.00
-LOG [L]
Format i on curves for the zinc - etolen system.
h. 1'+ ~
9.00 10 . 00 11 . 00
x
12.00 13 . 00
w o
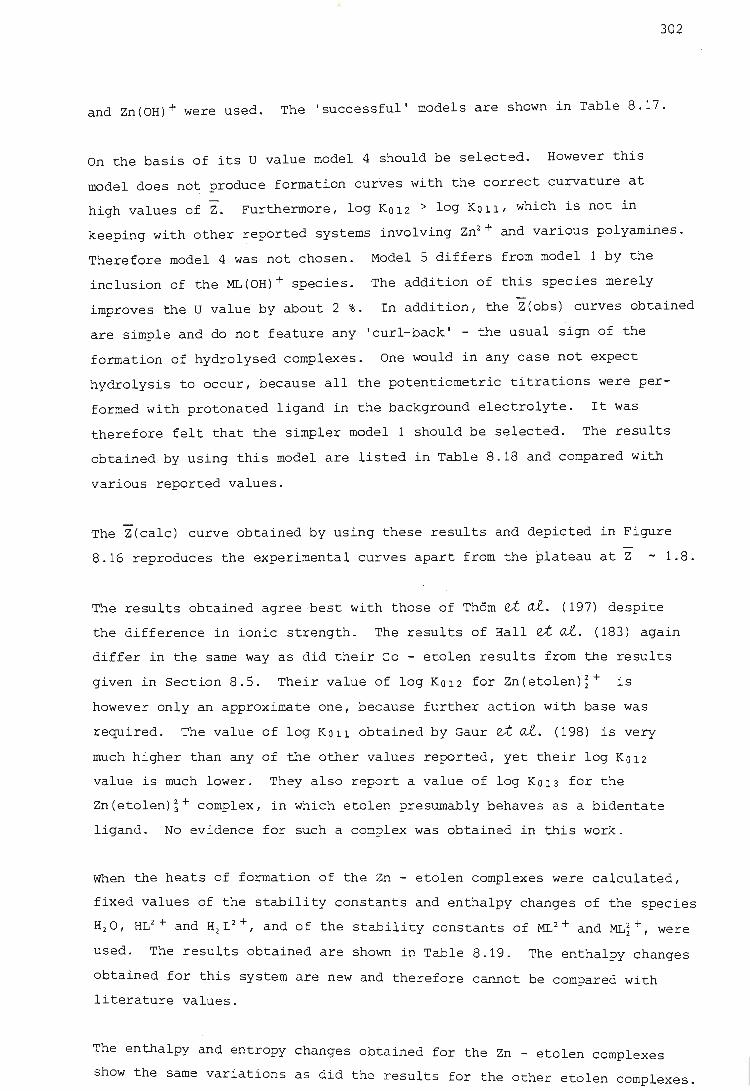
302
and Zn(OH)+ were used. The 'successful' models are shown in Table 8.17.
On the basis of its U value model 4 should be selected. However this
model does not produce formation curves with the correct curvature at
high values of Z. Furthermore, log K012 > log KOll, which is not in
keeping with other reported systems involving Zn2 + and various polyamines.
Therefore model 4 was not chosen. ModelS differs from model 1 by the
inclusion of the ML(OH) + species. The addition of this species merely
improves the U value by about 2 %. In addition, the Z(obs) curves obtained
are simple and do not feature any 'curl-back' - the usual sign of the
formation of hydrolysed complexes. One would in any case not expect
hydrolysis to occur, because all the potentiometric titrations were per
formed with protonated ligand in the background electrolyte. It was
therefore felt that the simpler model 1 should be selected. The results
obtained by using this model are listed in Table 8.18 and compared with
various reported values.
The . Z(calc) curve obtained by using these results and depicted in Figure
8.16 reproduces the experimental curves apart from the plateau at Z - 1.8.
The results obtained agree best with those of Thom et al. (197) despite
the difference in ionic strength. The results of Hall et al. (183) again
differ in the same way as did their Co - etolen results from the results
given in Section 8.5. Their value of log K012 for Zn(etolen)i+ is
however only an approximate one, because further action with base was
required. The value of log KOll obtained by Gaur et al. (198) is very
much higher than any of the other values reported, yet their log K012
value is much lower. They also report a value of log K013 for the
Zn(etolen);+ complex, in which etolen presumably behaves as a bidentate
ligand. No evidence for such a complex was obtained in this work.
When the heats of formation of the Zn - etolen complexes were calculated,
fixed values of the stability constants and enthalpy changes of the species
H2 0, HL2
+ and H2 Lz +, and of the stability constants of ML z + and ML; +, were
used. The results obtained are shown in Table 8.19. The enthalpy changes
obtained for this system are new and therefore cannot be compared with
literature values.
The enthalpy and entropy changes obtained for the Zn - etolen complexes
show the same variations as did the results for the other etolen complexes.
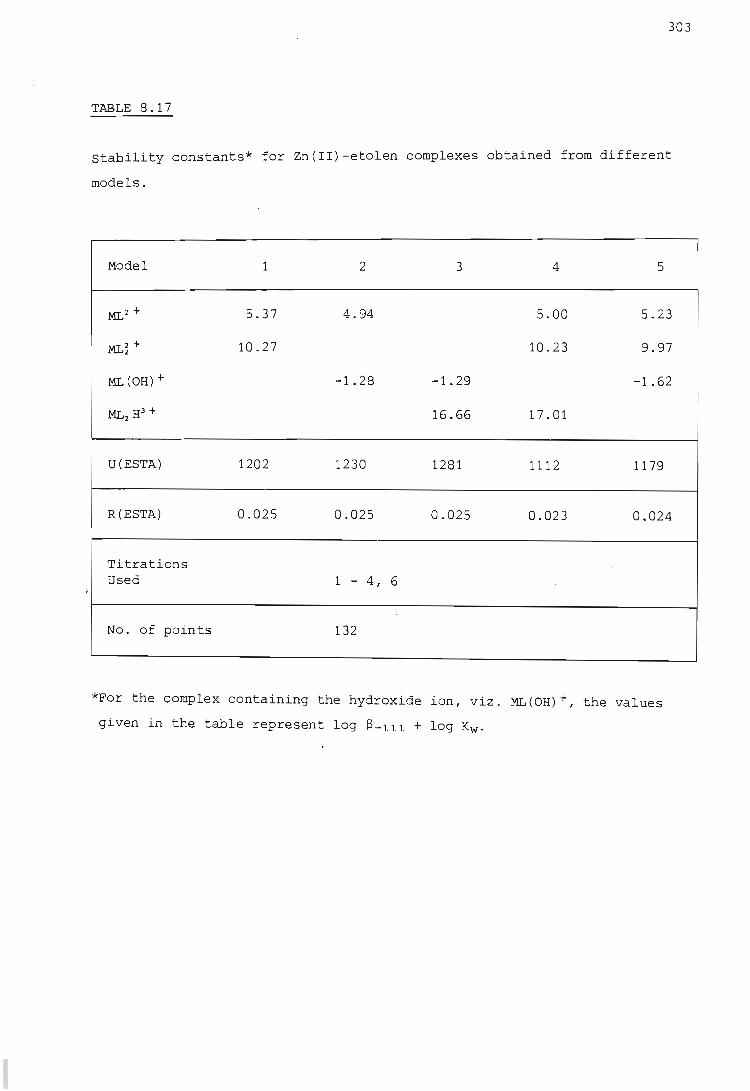
,
303
TABLE 8.17
stability constants* for Zn(II)-etolen complexes obtained from different
models.
Model 1 2 3 4 5
ML 2 + 5.37 4.94 5.00 . 5.23
ML~+ 10.27 10.23 9.97
ML(OH)+ -1.28 -1.29 -1.62
ML2 H3 + 16.66 17.01
U(ESTA) 1202 1230 1281 1112 1179
R(ESTA) 0.025 0.025 0.025 0.023 0.024
Titrations Used 1 - 4, 6
No. of points 132
*For the complex containing the hydroxide ion, viz. ML(OH)+, the values
given in the table represent log S- l ll + log Kw.
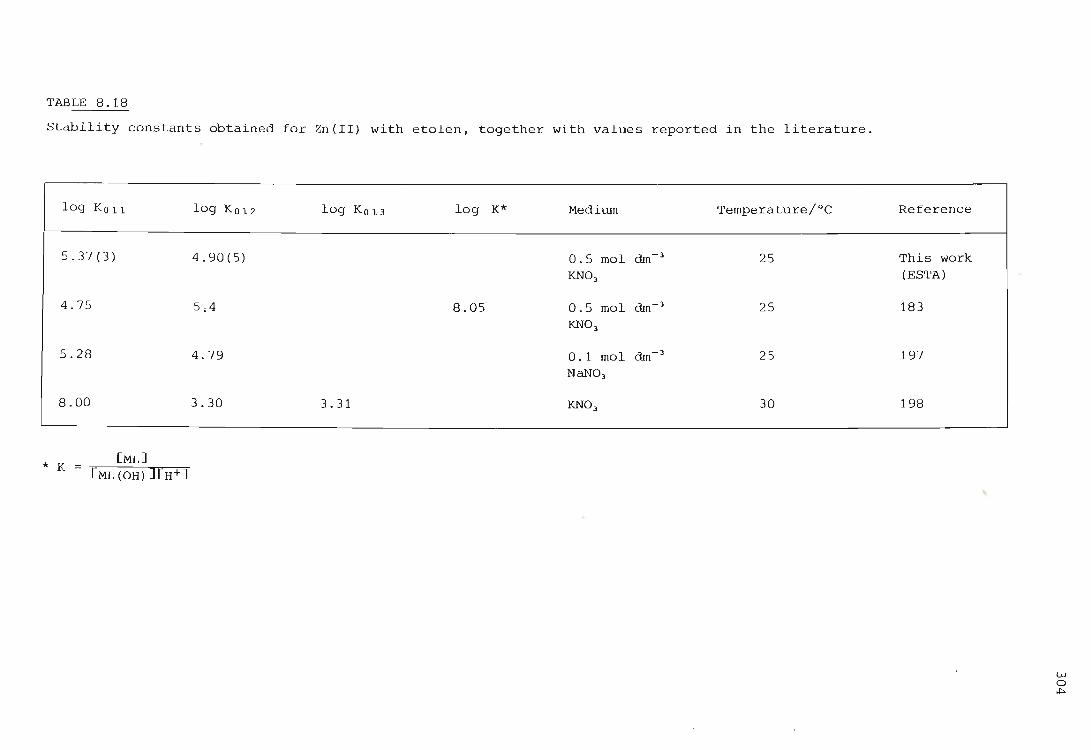
TABLE 8.18
Stability constants obtained for Zn(II) with etolen, together with values reported in the literature.
log K011 log Ko 12 log Ko 13 log K* Medium Temperature/oC
5.37(3) 4.90(5) 0.5 mol dm-) 25 KNO)
4.75 5,4 8.05 0.5 mol dm-) 25 KNO)
5. 28 4.79 0.1 mol dm-) 25 NaNO)
8.00 3.30 3.31 KNO) 30
* K [ML]
[Mi,(OH)J[H+]
Reference
This work (ESTA)
183
197
198
,
w o
"'"
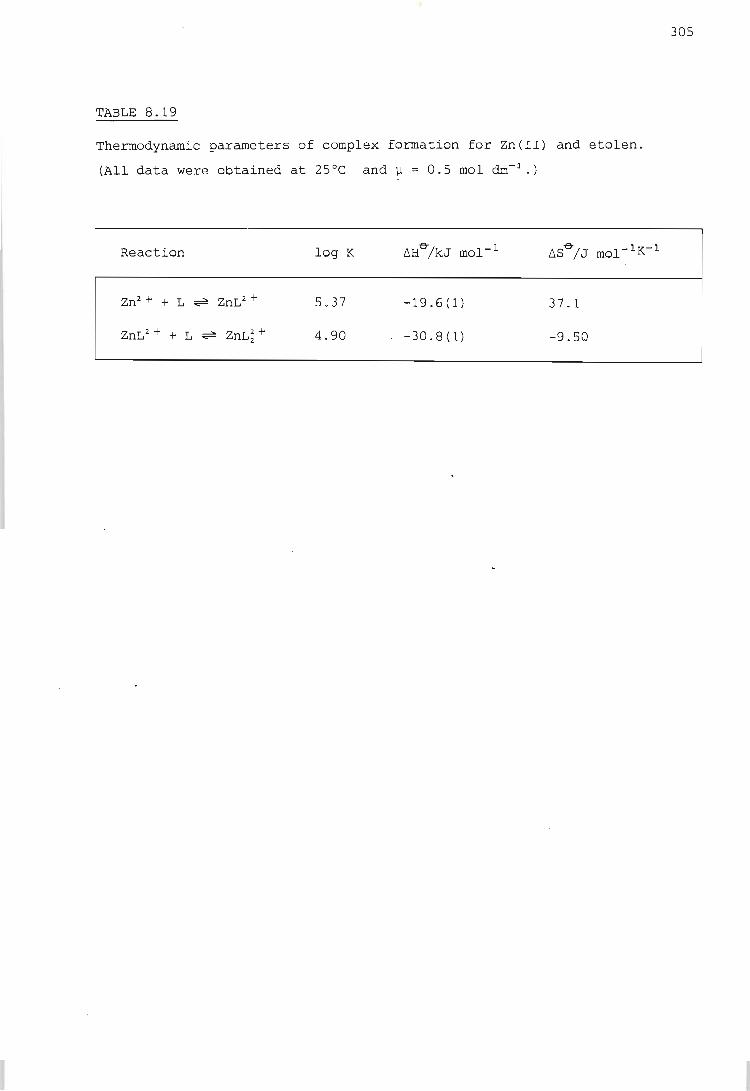
TABLE 8.19
Thermodynamic parameters of complex formation for Zn(II) and etolen.
(All data were obtained at 25°C and ~ = 0.5 mol dm- J.)
Reaction log K
5 . 37
4.90
-19.6(1)
-30.8(1)
37.1
-9.50
305
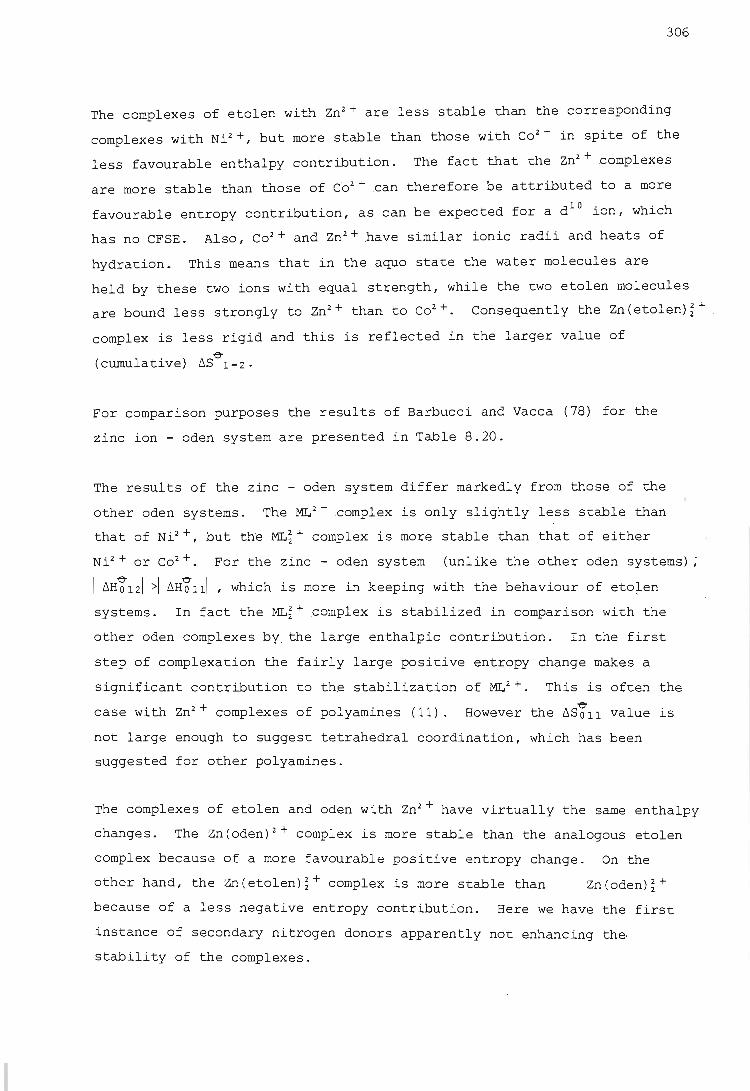
306
The complexes of etolen with Zn2 + .are less stable than the corresponding
complexes with Ni2 +, but more stable than those with Co 2 + in spite of the
less favourable enthalpy contribution. The fact that the Zn2 + .complexes
are more stable than those of Co2 + can therefore be attributed to a more
favourable entropy contribution, as can be expected for a d lO ion, which
has no CFSE. Also, Co2 + and Zn2 + have similar ionic radii and heats of
hydration. This means that in the aquo state the water molecules are
held by these two ions with equal strength, while the two etolen molecules
are bound less strongly to Zn 2 + than to Co2 +. Consequently the Zn(etolen)i+
complex is less rigid and this is reflected in the larger value of
(cumulative) ~S~l-2.
For comparison purposes the results of Barbucci and Vacca (78) for the
zinc ion - oden system are presented in Table 8.20.
The results of the zinc - oden system differ markedly from those of the
other oden systems. The ML 2 + .complex is only slightly less stable than
that of Ni2 +, but the ML;+ complex is more stable than that of either
Ni 2 + .or Co2 +. For the zinc - oden system (unlike the other oden systems);
1 ~H~121 >1 ~H~lll , which is more in keeping with the behaviour of eto~en systems. In fact the ML;+ complex is stabilized in comparison with the
other oden complexes by, the large enthalpic contribution. In the first
step of complexation the fairly large positive entropy change makes a
significant contribution to the stabilization of ML2+. This is often the
case with Zn2 + complexes of polyamines (11). However the ~S~ll value is
not large enough to suggest tetrahedral coordination, which has been
suggested for other polyamines.
The complexes of etolen and oden with Zn2 + have virtually the same enthalpy
changes. The Zn(oden) 2 + complex is more stable than the analogous etolen
complex because of a more favourable positive entropy change. On the
other hand, the Zn(etolen);+ complex is more stable than Zn(oden)i+
because of a less negative entropy contribution. Here we have the first
instance of secondary nitrogen donors apparently not enhancing the,
stability of the complexes.

307
TABLE 8.20
Thermodynamic parameters of complex formation for Zn(II) with oden.
(All data are from reference 78 and were obtained at 25°C and ~ = 0.5 mol
dm- 3 KNO).)
Reaction log .K 6H&/kJ mol- 1 6S&/J mol- 1 K- 1
Zn2 + + L ~ ZnL2 + 5.74(1) -20.1 (4) 43(2)
ZnL 2 + + L ~ ZnLi+ 4.12 (3) -30.5(8) -24(4)
ZnL 2 + + OH- ~ ZnL(OH)+ 5.11(3) 1.7(2.1) 103 (8)
ZnL 2 + + 20H- ~ ZnL (OH) 2 8.37(3)
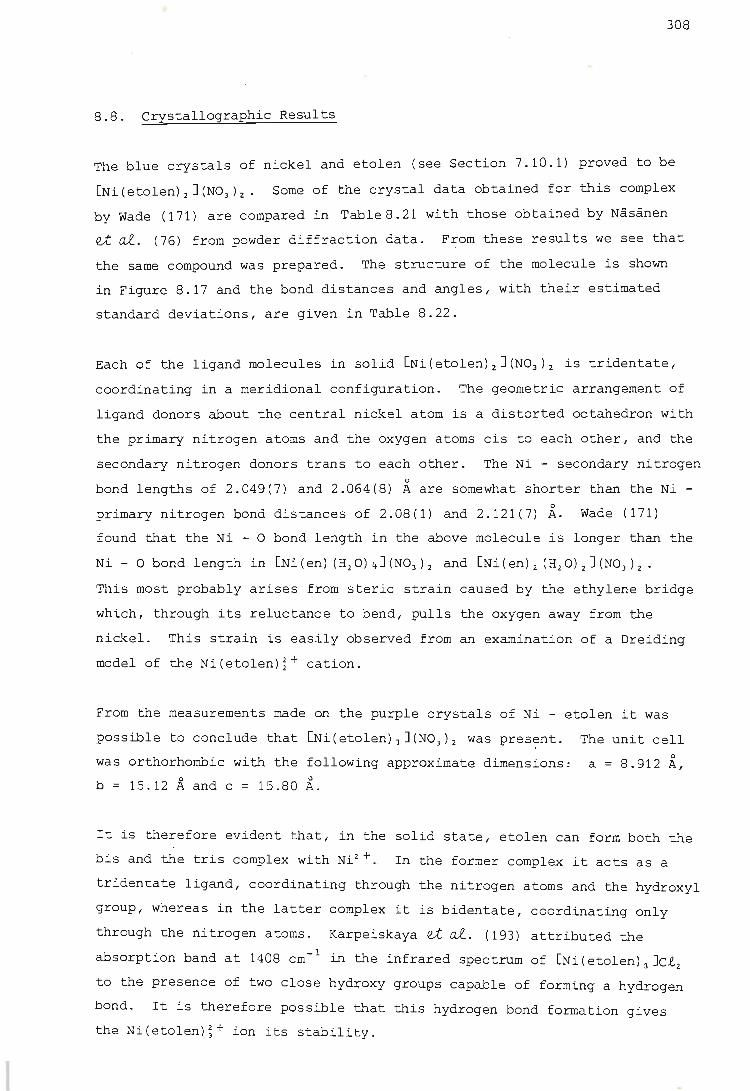
308
8.8. Crystallographic Results
The blue crystals of nickel and etolen (see Section 7.10.1) proved to be
[Ni(etolen)2](N03)2. Some of the crystal data obtained for this complex
by Wade (171) are compared in Table 8. 21 with those obtained by Nasanen
et al. (76) from powder diffraction data. From these results we see that
the same compound was prepared. The structure of the molecule is shown
in Figure 8.17 and the bond distances and angles, with their estimated
standard deviations, are given in Table 8.22.
Each of the ligand molecules in solid [Ni(etolen)2](N03)2 is tridentate,
coordinating in a meridional configuration. The geometric arrangement of
ligand donors about the central nickel atom is a distorted octahedron with
the primary nitrogen atoms and the oxygen atoms cis to each other, and the
secondary nitrogen donors trans to each other. The Ni - secondary nitrogen o
bond lengths of 2.049(7) and 2.064(8) A are somewhat shorter than the Ni -o
primary nitrogen bond distances of 2.08(1) and 2.121(7) A. Wade (171)
found that the Ni - ° bond length in the above molecule is longer than the
Ni - ° bond length in [Ni(en) (H20)4](N03)2 and [Ni(en)2 (H 20)2](N03)2.
This most probably arises from steric, strain caused by the ethylene bridge
which, through its reluctance to bend, pulls the oxygen away from the
nickel. This strain is easily observed from an examination of a Dreiding
model of the Ni(etolen)~+ cation.
From the measurements made on the purple crystals of Ni - etolen it was
possible to conclude that [Ni(etolen)3](N03)2 was present.
was orthorhombic with the following approximate dimensions:
b = 15.12 A and c = 15.80 A.
The unit cell o
a = 8.912 A,
It is therefore evident that, in the solid state, etolen can form both the
bis and the tris complex with Ni2 +., In the former complex it acts as a
tridentate ligand, coordinating through the nitrogen atoms and the hydroxyl
group, whereas in the latter complex it is bidentate, coordinating only
through the nitrogen atoms. Karpeiskaya et al. (193) attributed the
absorption band at 1408 cm-1
in the infrared spectrum of [Ni(etolen)3]C!2
to the presence of two close hydroxy groups capable of forming a hydrogen
bond. It is therefore possible that this hydrogen bond formation gives
the Ni(etolen)~+ ion its stability.
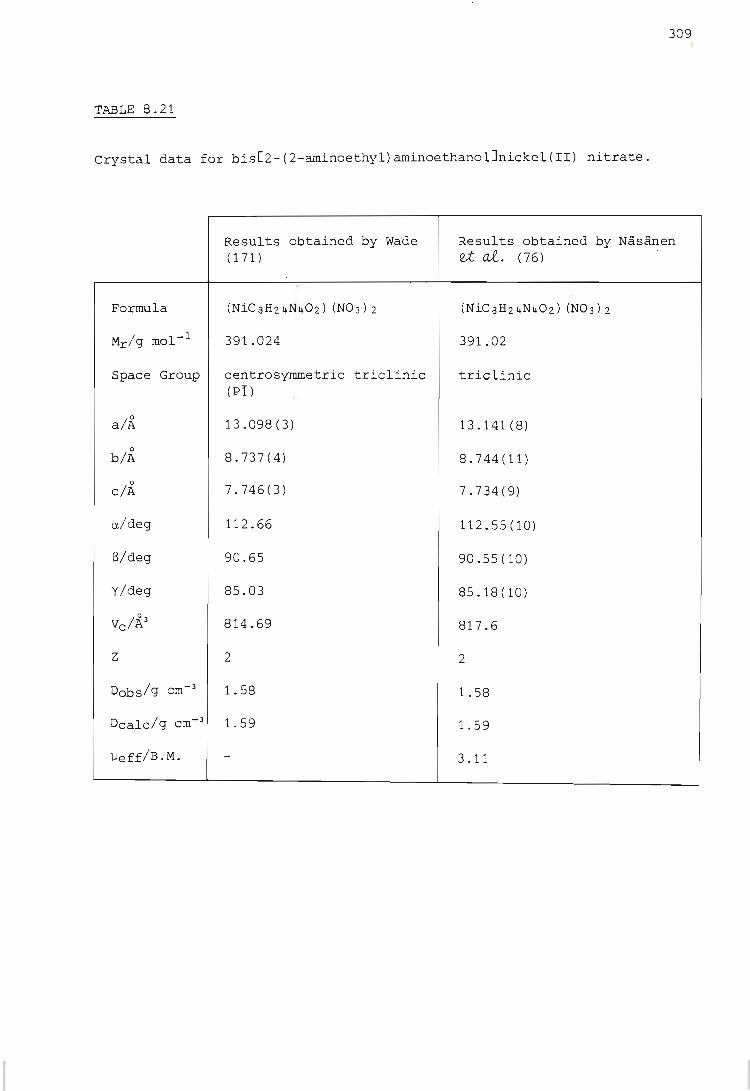
309
TABLE 8.21
Crystal data for bis[2-(2-aminoethyl)aminoethanolJnickel(II) nitrate.
Results obtained by Wade Results obtained by Nasanen (171 ) e;t .a.t. (76)
Formula (NiCsH24N40 2) (N0 3) 2 (NiCsH2 4N402) (N03) 2
Mr/g mol- 1 391.024 391. 02
Space Group centro symmetric triclinic triclinic (PI)
a l A 13 . 098 (3) 13.141(8)
0
b/A 8.737(4) 8.744 (11)
0
ciA 7.746(3) 7.734(9)
o. / deg 112.66 112.55(10)
S/deg 90.65 90.55(10)
y/ deg 85.03 85.1.8(10)
vc / A3 814.69 817 . 6
z 2 2
Dobs/g cm-3 1.58 1.58
Dcalc/g cm-3 1. 59 1.59
)left/B.M. - 3.11
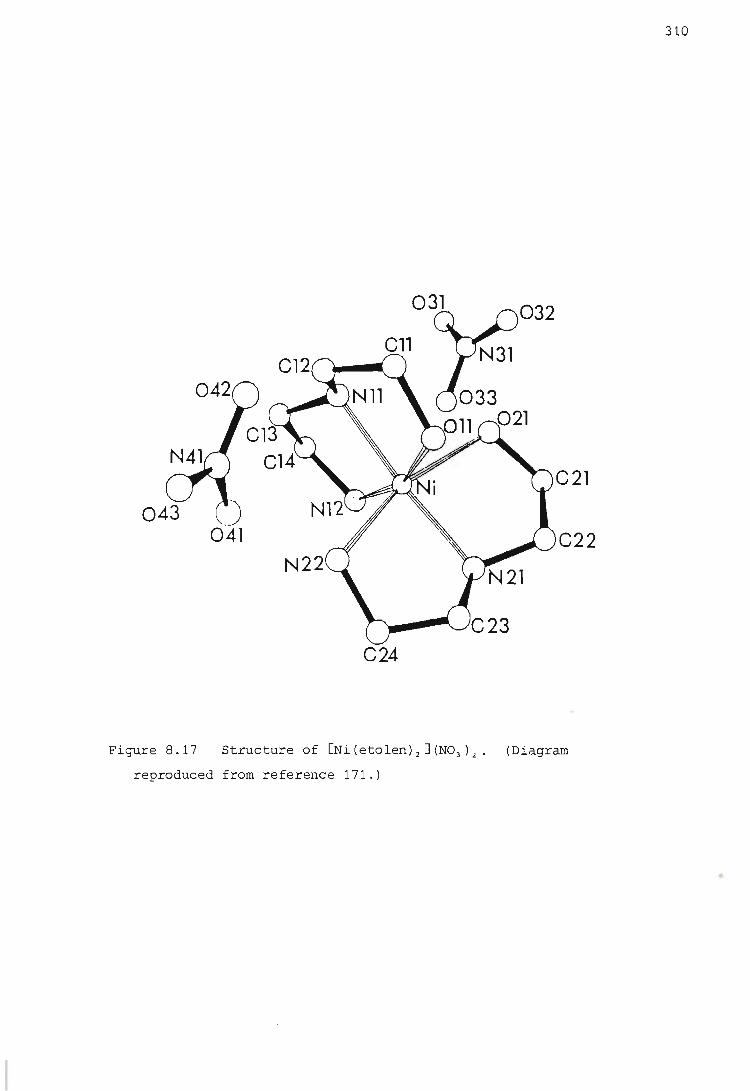
310
032
Cll
~C22
C24
Figure 8.17 Structure of [Ni (etolen) 2] (N0 3 ) 2. (Diagram
reproduced from reference 171.)
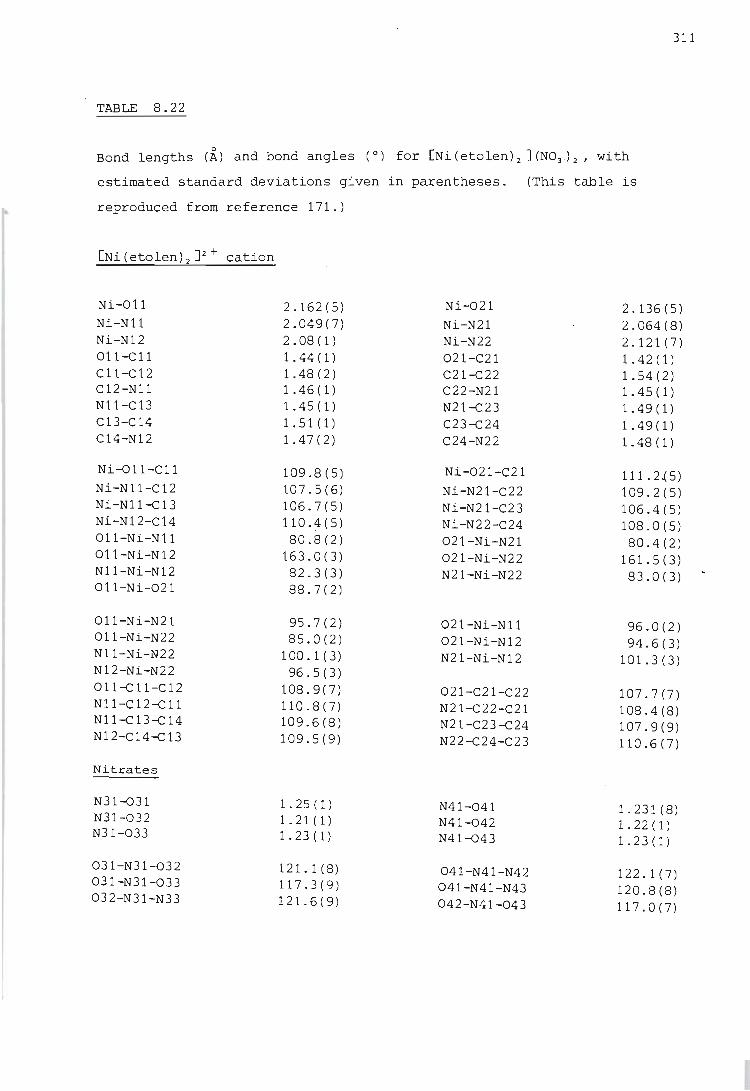
311
TABLE 8.22
Bond lengths d~.) and bond angles (0) for [Ni (etolen) 2] (N0 3 ) 2 I with
estimated standard deviations given in parentheses. (This table is
reproduced from reference 171.)
Ni-Oll Ni-Nll Ni-N12 011-Cll Cll-C12 C12-Nll Nl1-C13 C13-C14 C14-N12
Ni-011-C11 Ni-N11-C12 Ni-Nll-C13 Ni-N12-C14 011-Ni-N11 011-Ni-N12 N11-Ni-N12 011-Ni-021
011-Ni-N21 011-Ni-N22 N11-Ni-N22 N12-Ni-N22 011-Cll-C12 Nll-C12-Cll Nll-C13-C14 N12-C14-C 13
Nitrates
N31-031 N31-032 N31-033
031-N31-032 031-N31-033 032-N31-N33
2.162(5) 2.049(7) 2.08 (1) 1. 44 (1) 1 .48 (2) 1.46(1) 1.45 (1) 1.51 (1)
1.47(2)
109.8 (5) 107.5(6) 106.7(5) 110.4(5) 80.8(2)
163.0(3) 82.3(3) 88.7(2)
95.7(2) 85.0(2)
100.1 (3) 96.5(3)
108.9(7) 110.8 (7) 109.6(8) 109.5(9)
1.25 (1)
1.21(1) 1.23 (1)
121.1 (8) 117.3(9) 121.6 (9)
Ni-021 2.136(5) Ni-N21 2.064(8) Ni-N22 2.121(7) 021-C21 1. 42 (1) C21-C22 1.54(2) C22-N21 1.45(1) N21~23 1.49(1) C23-c24 1.49(1) C24-N22 1. 48 (1)
Ni-021-C21 111.2~5) Ni-N21-C22 109.2(5) Ni-N21-C23 106.4(5) Ni-N22-C24 108.0(5) 021-Ni-N21 80.4(2) 021-Ni-N22 161.5(3) N21-Ni-N22 83.0(3)
021-Ni-N11 96.0(2) 021-Ni-N12 94.6(3) N21-Ni-N12 101.3(3)
021-C21-C22 107.7(7) N21-C22-C21 108.4(8) N21-C23-C24 107.9(9) N22-C24-C23 110.6(7)
N41-041 1.231(8) N41-042 1.22 (1) N41-043 1.23(1)
041-N41-N42 122.1(7) 041-N41-N43 120.8(8) 042-N41-043 117.0(7)
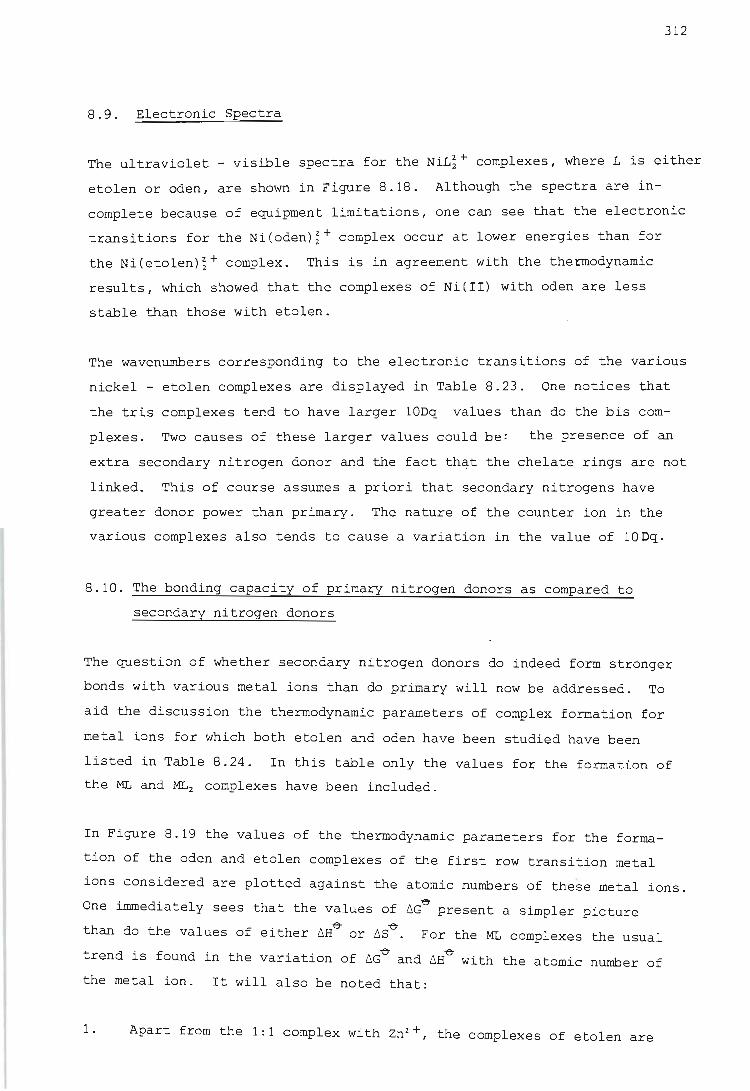
312
8.9. Electronic Spectra
The ultraviolet - visible spectra for the NiL; + complexes, where L is either
etolen or oden, are shown in Figure 8.18. Although the spectra are in
complete because of equipment limitations, one can see that the electronic
transitions for the Ni(oden)~+ .complex occur at lower energies than for
the Ni(etolen);+ complex. This is in agreement with the thermodynamic
results, which showed that the complexes of Ni(II) with oden are less
stable than those with etolen.
The wavenumbers corresponding to the electronic transitions of the various
nickel - etolen complexes are displayed in Table 8.23. One notices that
the tris complexes tend to have larger 10Dq values than do the bis com-
plexes. Two causes of these larger values could be: the presence of an
extra secondary nitrogen donor and the fact that the chelate rings are not
linked. This of course assumes a priori that secondary nitrogens have
greater donor power than primary. The nature of the counter ion in the
various complexes also tends to cause a variation in the value of 10Dq.
8.10. The bonding capacity of primary nitrogen donors as compared to
secondary nitrogen donors
The question of whether secondary nitrogen donors do indeed form stronger
bonds with various metal ions than do primary will now be addressed. To
aid the discussion the thermodynamic parameters of complex formation for
metal ions for wh.ich both etolen and oden have been studied have been
listed in Table 8.24. In this table only the values for the formation of
the ML and ML2 complexes have been included.
In Figure 8 . 19 the values of the thermodynamic parameters for the forma
tion of the oden and etolen complexes of the first row transition metal
ions considered are plotted against the atomic numbers of these metal ions.
One immediately sees that the values of 6Ge present a simpler picture
than do the values of either 6H& or 6Se
. For the ML complexes the usual
trend is found in the variation of 6Ge
and 6H& with the atomic number of
the metal ion. It will also be noted that:
1. Apart from the 1:1 complex with Zn2 +, the complexes of etolen are
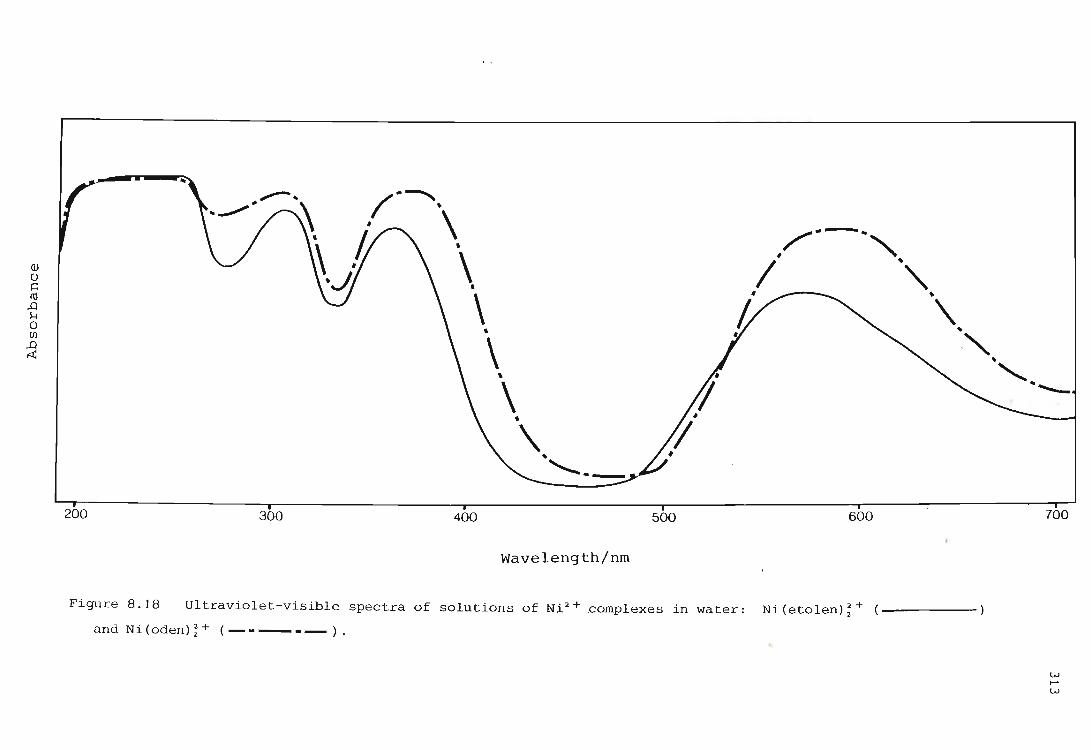
Q)
o s:: cO
..Q H o UJ
~
...
200 300 400
Wavelength/nm
~
? • r;
500
/---" i',. /~ \ V "'- "
600
Figure 8.18 Ultraviolet-visible spectra of solutions of Ni 2 +complexes in water: Ni(etolen)~+
and N i (oden) ~ + (- - ___ ) . ,
"" .. '--
700
w ....... w
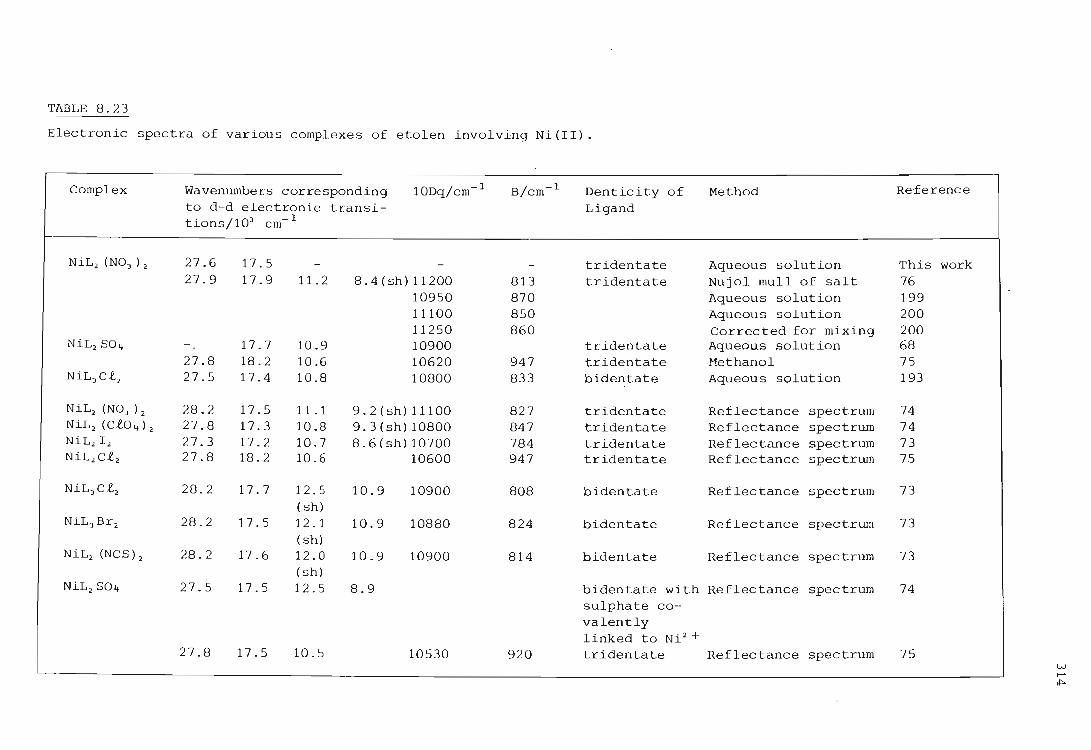
TABLE 8.23
Electronic spectra of various complexes of etolen involving Ni(11).
Complex Wavenumbers corresponding 10Dq/cm- 1 B/cm- 1 Denticity of Method Re·ference
to d-d electronic transi- Ligand tions/l0) -1 cm
NiL2 (NO) ) 2 27.6 17.5 tridentate Aqueous solution This work 27.9 17.9 11. 2 8 . 4 (sh) 11200 813 tridentate Nujol mull of salt 76
10950 870 Aqueous solution 199 11100 850 Aqueous solution 200 11250 860 Corrected for mixing 200
NiL2SO'! 17.7 10.9 10900 tridentate Aqueous solution 68 27.8 18. 2 10.6 10620 947 trident ate Hethanol 75
NiL) Ci 2 27. 5 17.4 10.8 10800 833 bidentate Aqueous solution 193
NiL2 (NO) ) 2 28.2 17. 5 11.1 9. 2 (sh) 11100 827 tridentate Reflectance spectrum 74 NiL2 (Ci0 4) 2 27.8 17.3 10.8 9.3(sh)10800 847 tridentate Reflectance spectrum 74 NiL212 2 7.3 17. 2 10.7 8.6(sh)10700 784 tridentate Reflectance spectrum 73 NiL2Ci2 27.8 18.2 10.6 10600 947 tridentate Reflectance spectrum 75
NiL) Ci2 28. 2 17.7 12 .5 10.9 10900 808 bidentate Reflectance spectrum 73 (sh)
NiL ) Br2 28. 2 17 . 5 12 . 1 10.9 10880 824 bidentate Reflectance spectrum 73 (sh)
NiL2 (NCS) 2 28.2 17.6 12.0 10.9 10900 814 bidentate Reflectance spectrum 73 (sh)
NiL2S04 27.5 17.5 12.5 8.9 bidentate with Reflectance spectrum 74 sulphate co-valently linked to Ni2 +
27.8 17.5 10 . 5 10530 920 tridentate Reflectance spectrum 75 w ..... ~
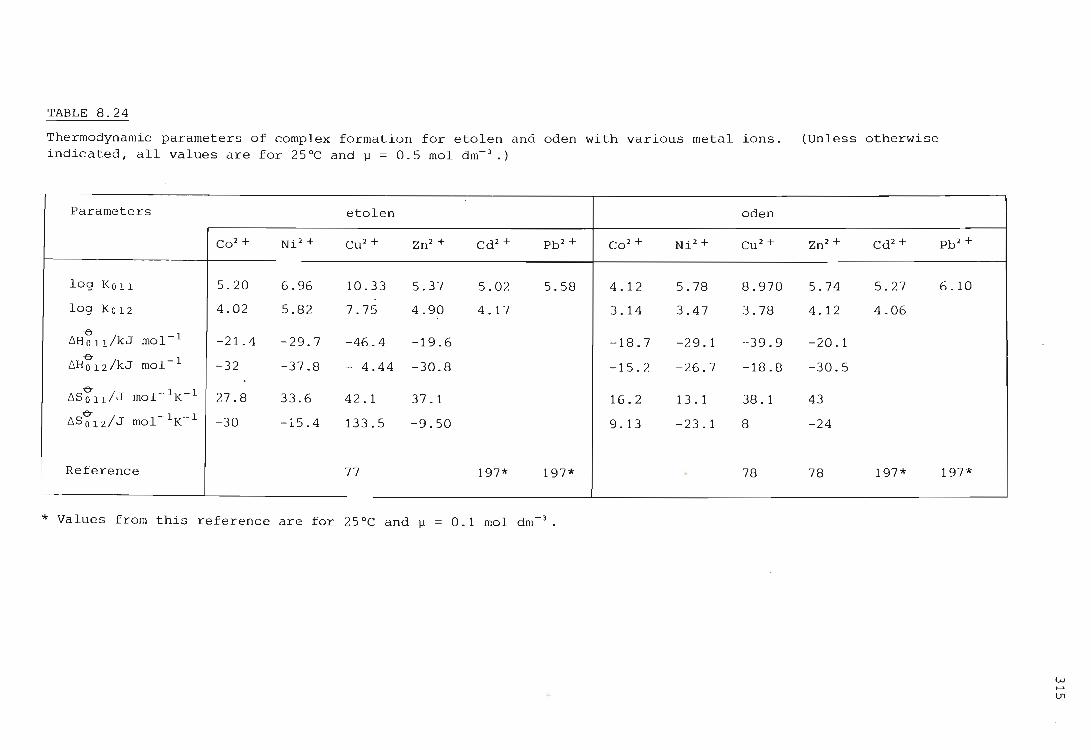
TABLE 8.24
Thermodynamic parameters of complex formation for etolen and aden with various metal ions. (Unless otherwise indicated, all values are for 25°C and ~ = 0.5 mol dm- 3
.)
Parameters eta len aden
Co 2 + Ni 2 + Cu 2 + Zn2 + Cd2 + Pb 2 + Co2 + Ni 2 + Cu 2 + Zn2 + Cd2 +
log K011 5.20 6.96 10.33 5.37 5.02 5.58 4.12 5.78 8.970 5.74 5.27
log K012 4.02 5.82 7.75 4.90 4.17 3.14 3.47 3.78 4.12 4.06
-e- / -1 6Ho 11 kJ mol -21. 4 -29.7 -46.4 -19.6 -18.7 -29.1 -39.9 -20.1 -e- / -1 6Ho12 kJ mol -32 -37.8 - 4.44 -30.8 -15.2 -26.7 -18.8 -30.5
6S~1l/J mol- 1K- 1 27.8 33.6 42.1 37.1 16.2 13.1 38.1 43
6StY / -1 -1 012 J mol K -30 -15.4 133.5 -9.50 9.13 -23.1 8 -24
Reference 77 197* 197* . 78 78 197*
-
* Values from this reference are for 25°C and ~ 0.1 mol dm- 3•
-l
Pb2 +
6.10
197*
-----
w ...... U1
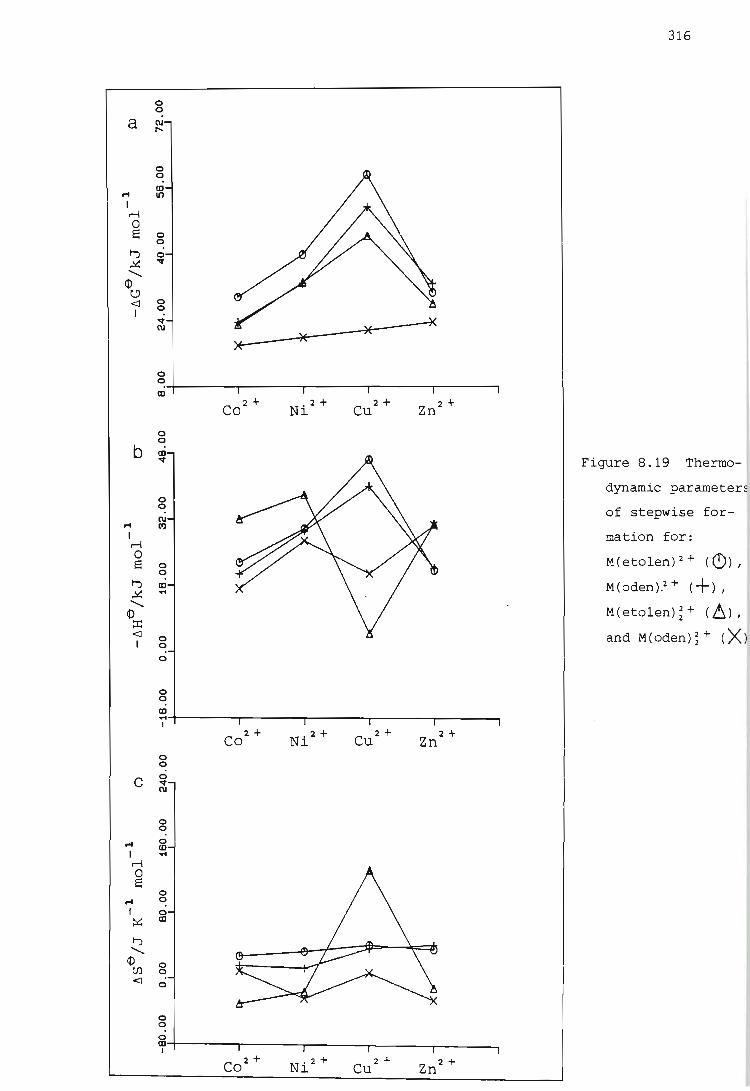
316
0 0
a N .....
0 0
CD ... III I r-I 0 S 0
0
t-:l 0 ~
., .........
(J) (.!) <l 0
I 0 ., N
*"" )(
0 0
CD
Co 2+ . 2+
N~ Cu 2+
Zn 2 +
0 0
b CD
Figure 8.19 Thermo-.,
0 dynamic parameter~
0
N of stepwise for-... ('I)
I mation for: r-I 0
M(etolen)2+ (C)) I S 0 0
t-:l CD M(oden)? + (+) I ~ .... .........
M(etolen);+ (~) I ¢)
::r: and M(oden)~+ (X)
<l 0 I 0
0
0 0
CD .... I
2+ Ni 2 + Cu 2 + 2+ Co Zn
0 0
C 0 ., N
0 0
... 0 CD
I .... r-I 0 S
0 ... 0
I 0 ~ CD
t-:l .........
cp 0
(/) 0 <l 0
0 0
0 CD I
Co 2 + Ni 2 + Cu 2 +
Zn 2+
317
more stable than the corresponding ones of oden.
2. Apart from the 1:1 complex with Zn2+ .and the 1:2 complex with Cu2 +,
the complex formation reactions of etolen are more exothermic than
the corresponding ones of oden.
3. Apart from the 1:1 complex of Zn2+ and the 1:2 complex of Co2+,
the etolen complexes have greater entropy of formation than do the
corresponding oden complexes.
From the above observations it is clear that the Zn(oden)2+complex does
not follow the trend exhibited by the other oden complexes under considera
tion. However, a plot of log KOll(oden) against log KOll(etolen) (Figure
8.20) displays the interesting feature that those metal ions for which
CFSE is expected (Co2+, Ni2+ and Cu2+) fall very close to a straight line,
and those for which CFSE is not expected (Zn2 +, Cd2 + and Pb2+) fall very
close to a quite distinct straight line. For the first group the etolen
complexes are the more stable, and for the second the oden complexes are.
A similar split based on the presence or absence of CFSE was also observed
by Hancock and Nakani (201) in their study of the oxygen donor ligands
acetylacetonate and hydroxide.
It has been found (202) that if two very similar ligands A and B form
complexes MA and MB with a series of metal ions such that the size, the
number and the geometry of chelated rings is the same, a plot of log KMA
against log KMB should be a straight line with a slope of one and an
intercept of log KHA - log KHB' The line containing Co2+, Ni2+ and Cu2+
does have a slope fairly close to one, viz. 0.95. However the other
line has a much larger slope, 1.5. Thus it seems that the stereochemistry
for the Zn2+, Cd2 + and Pb2+ complexes may not be the same as for the
remainder of the "metal ions.
Let us now review what is known about the stereochemistry of the etolen
and oden complexes with various metal ions. Information concerning the
complexes in solution is summarized in Table 8 . 25, and Table 8.26
presents the information for the solid state. The complexes of the tri
dentate ligand dien are considered also, for comparison purposes. In
addition the following points should be noted:
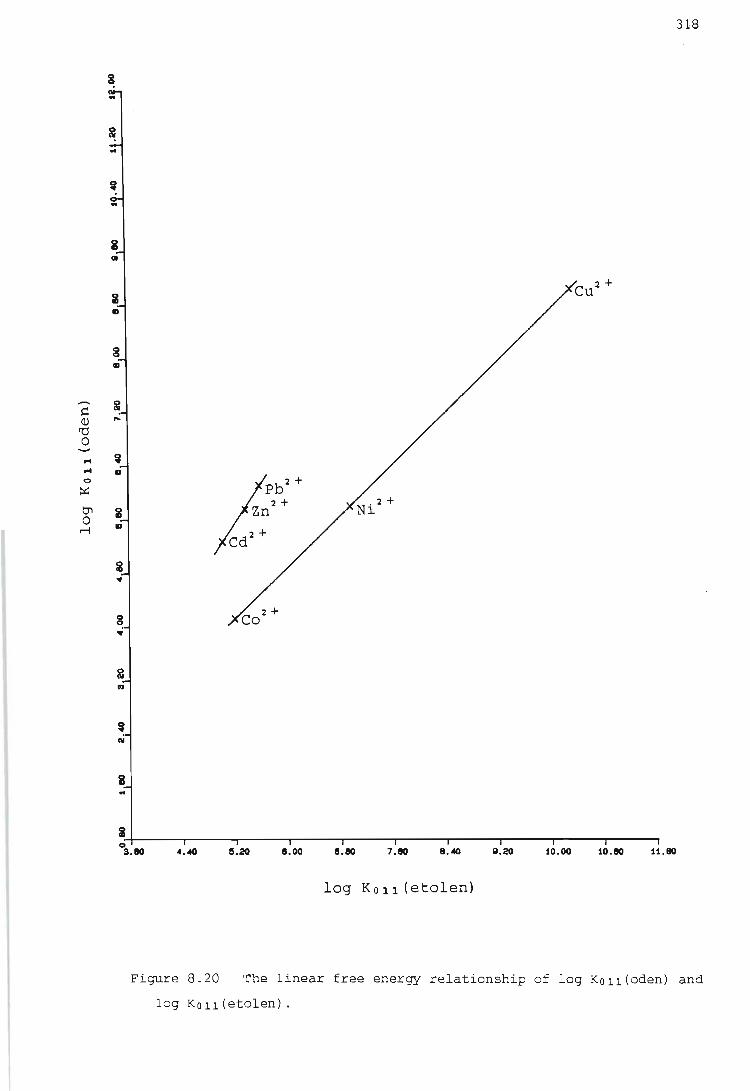
318
g
.. a .. a .,
g .,
~ Ii: (])
ro 0
r4 r4 ., <:>
fPbH ~ 2+
tJ'I a Zn 0
1D ~
Cd2 +
a •
g •
Ii:
III
..
i~-----r-----r-----T----~----~----~-----'-----.r---r-~---. o 3.80 11.20 8.00 8.80 7.80 8.~ &.20 10.00 10.80 11.80
log K all (etolen)
Figure 8.20 The linear free energy relationship of log KOll (oden) and
log KOll(etolen).
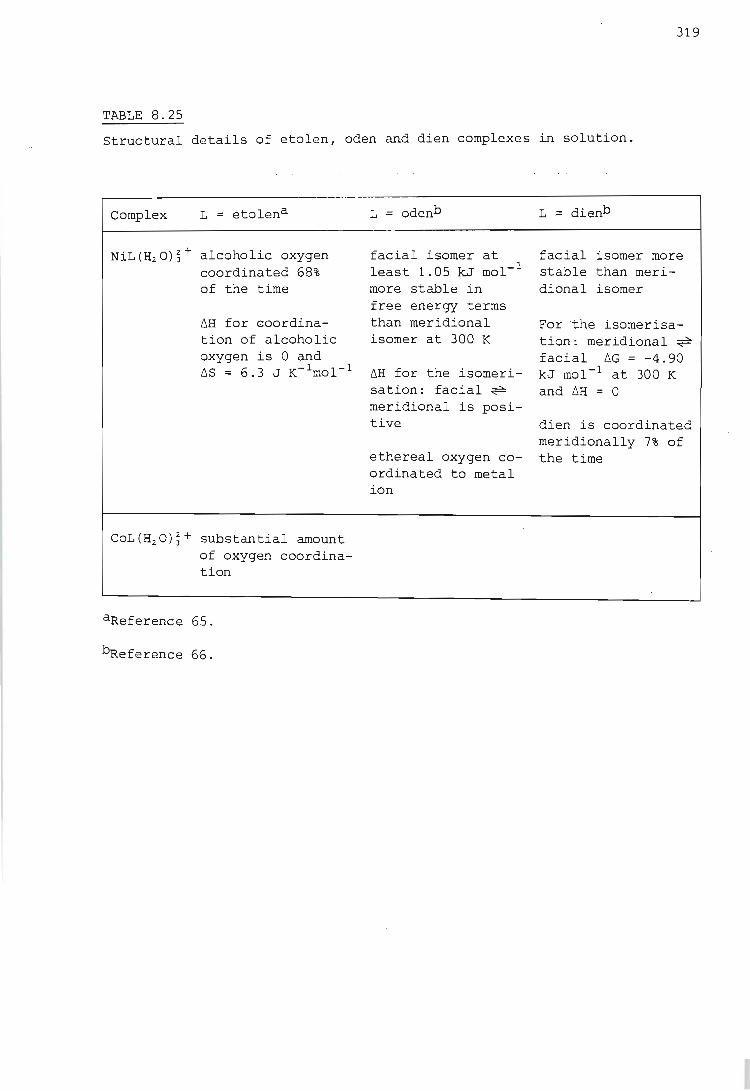
319
TABLE 8.25
Structural details of etolen, oden and dien complexes in solution.
Complex L = etolena
NiL(H20);+alcoholic oxygen coordinated 68% of the time
lIH for eoordination of alcoholic oxygen is 0 and liS = 6.3 J K-1mol- 1
COL(H20)~+ substantial amount of oxygen coordination
aReference 65.
bReference 66.
L = ·odenb
facial isomer at least 1.05 kJ mol- 1
more stable in free energy terms than meridional isomer at 300 K
lIH for the isomerisation: facial ~ meridional is positive
ethereal oxygen coordinated to metal ion
L ;:: dienb
facial isomer more stable than meridional isomer
For the isomerisation: meridional ~ facial lIG = -4.90 kJ mol- 1 at 300 K and lIH = 0
dien is coordinated meridionally 7% of the time

TABLE 8.26
Structural details of etolen and dien complexes in the solid state.
Complex
Cu (dien) 2 (N03 ) 2
Mo03 (dien)
Mo(CO)3 (dien)
Zn (dien) 2 (N03 ) 2
Zn (dien) 2 Br2 .H2 0
Cu (etolen) 2 ct2
Cu(etolen) 2 (Ct04) 2
Information
meridional N i -1 oN "j N i - 2 oN
meridional Cu-l°N > Cu-2°N
meridional
facial
facial
meridional Zn-l°N > Zn-2 oN
meridional Zn -1 oN > Zn - 2 oN
etolen bidentate, hydroxyethyl arms of ligands free and trans to each other, four nitrogens lie at corners of a distorted square, Cu-l°N < Cu-2°N as in other asymmetrically substituted ethylenediamine complexes, hydrogen bond between o and N on adjacent molecules
facial, distorted octahedron (tetragonal elongation ) , Cu -1 oN < Cu - 2 ON , four nitrogens not coplanar to accommodate axial elongation, each 2°N displaced in direction of hydroxyethyl group to which it is attached, strain in two ligands at 2°N atoms,
Reference
46, 203
204
205
206
207
208
209
210
211
320
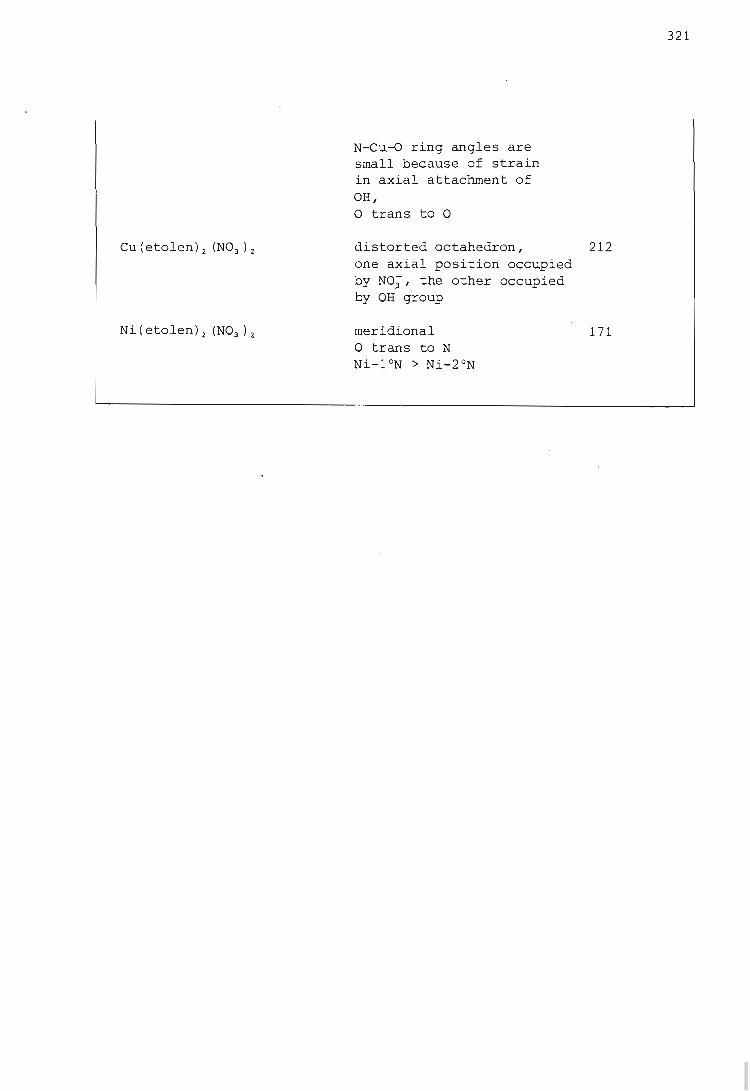
Cu(etolen)2 (NO~)2
Ni (etolen) 2 (N03 ) 2
N-Cu-O ring angles are small because of strain in axial attachment of OH, o trans to 0
distorted octahedron, one axial position occupied by NO;, the other occupied by OH group
meridional o trans to N Ni-1°N > Ni-2 oN
321
212
171

322
1. From repulsion - energy calculations it has been shown (213) that
in the solid state the meridional isomers of bis(tridentate ligand)
metal complexes are generally more stable than the facial isomers.
2. It is possible that the greater stability of the facial isomers
of the ML complexes in solution is due to the presence of coordinated
water molecules (66).
3. A study of the isomers of [Co(NH3h(dien)]3+ and [Co(NH3){en) (dien)]3+
(214) revealed that facial isomers tend to have slightly lower
strain energies than meridional.
We have seen from the UV-visible spectra of the Ni 2 + complexes of oden
and etolen that the ligand field is essentially octahedral. Hence we can
reasonably assume that this is also the case for the metal ions C02 +
and Cu2 +.
On balance of the information available it seems likely that the facial
isomers of the NiL2 + complexes are probably present in solution. One
would also expect C02 + .to behave in this fashion.
Because of the tetragonally distorted octahedral coordination favoured
by copper, one would expect the meridional isomers of the ML complexes
to be stabilized relative to other stereochemistries. This meridional
stereochemistry would enhance the CFSE for the ML complexes. This is in
keeping with the trends observed in Figure 8.19(b). This planar structure
would have a lower dipole moment and would therefore be able to orientate
fewer water molecules, hence the somewhat higher value of ~S~ll than
those of Ni 2 + and C02 +. In the ML2 complex the tetragonal distortion
would be smaller, with a concomitant smaller CFSE resulting in a lower
heat of formation for the ML2 complex. This is especially marked in the
of the Cu(etolen);+ complex. this complex, eo case For ~Ho 12 is extremely
low and out of line with the behaviour of the other etolen complexes,
which suggests incomplete coordination of the second ligand molecule.
The fact that ~G~12 is not particularly low suggests that perhaps only
the hydroxyethyl arm of the ligand is uncoordinated. If this is so, it
would help to explain the extremely high value of ~S~12. This latter
value is consistent with a flexible structure . for the complex.
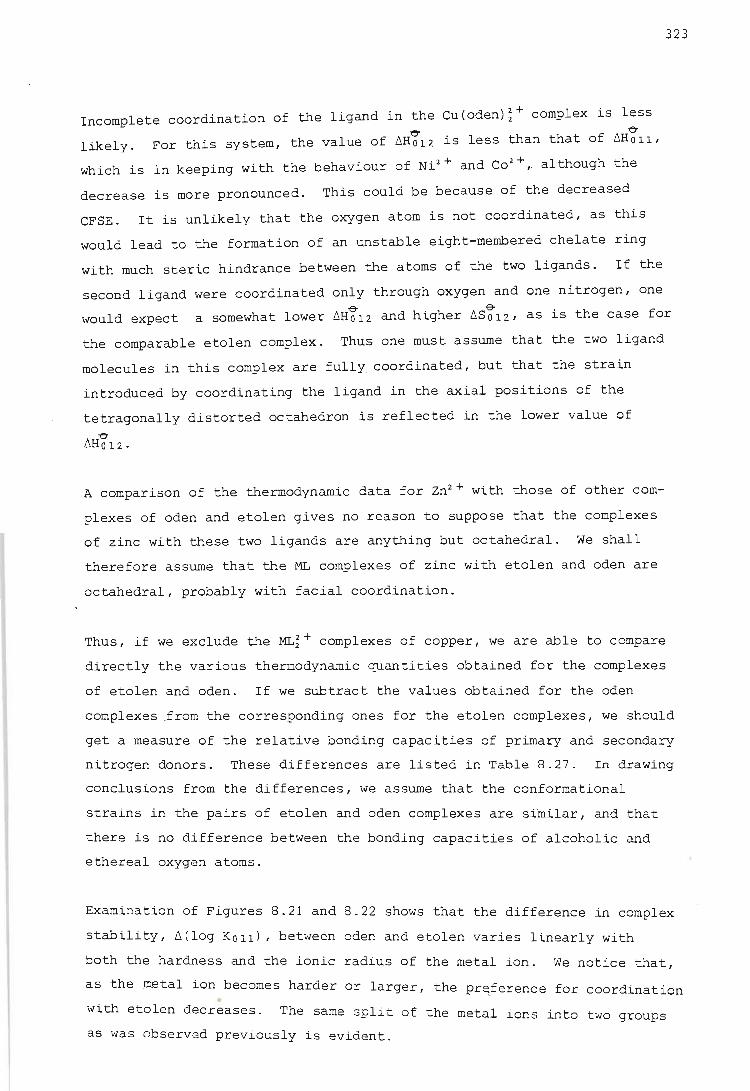
323
Incomplete coordination of the ligand in the Cu(oden);+ complex is less ~ ~
likely. For this system, the value of ~H012 is less than that of ~HOll'
which is in keeping with the behaviour of Ni 2 + and Co 2 +,. although the
decrease is more pronounced. This could be because of the decreased
CFSE. It is unlikely that the oxygen atom is not coordinated, as this
would lead to the formation of an unstable eight-membered chelate ring
with much steric hindrance between the atoms of the two ligands. If the
second ligand were coordinated only through oxygen and one nitrogen, one
would expect a somewhat lower ~H!12 and higher ~S~12' as is the case for
the comparable etolen complex. Thus one must assume that the two ligand
molecules in this complex are fully coordinated, but that the strain
introduced by coordinating the ligand in the axial positions of the
tetragonally distorted octahedron is reflected in the lower value of ~
~H012.
A comparison of the thermodynamic data for Zn2 + with those of other com
plexes of oden and etolen gives no reason to suppose that the complexes
of zinc with these two ligands are anything but octahedral. We shall
therefore assume that the ML complexes of zinc with etolen and oden are
octahedral, probably with facial coordination.
Thus, if we exclude the ML;+ complexes of copper, we are able to compare
directly the various thermodynamic quantities obtained for the complexes
of etolen and oden. If we subtract the values obtained for the oden
complexes .from the corresponding ones for the etolen complexes, we should
get a measure of the relative bonding capacities of primary and secondary
nitrogen donors. These differences are listed in Table 8.27. In drawing
conclusions from the differences, we assume that the conformational
strains in the pairs of etolen and oden complexes are similar, and that
there is no difference between the bonding capacities of alcoholic and
ethereal oxygen atoms.
Examination of Figures 8.21 and 8.22 shows that the difference in complex
stability, ~(log KOll) , between oden and etolen varies linearly with
both the hardness and the ionic radius of the metal ion. We notice that,
as the ~tal ion becomes harder or larger, the pr~ference for coordination
with etolen decreases. The l ' f same sp ~t 0 the metal ions into two groups as was observed previously is ev ident.
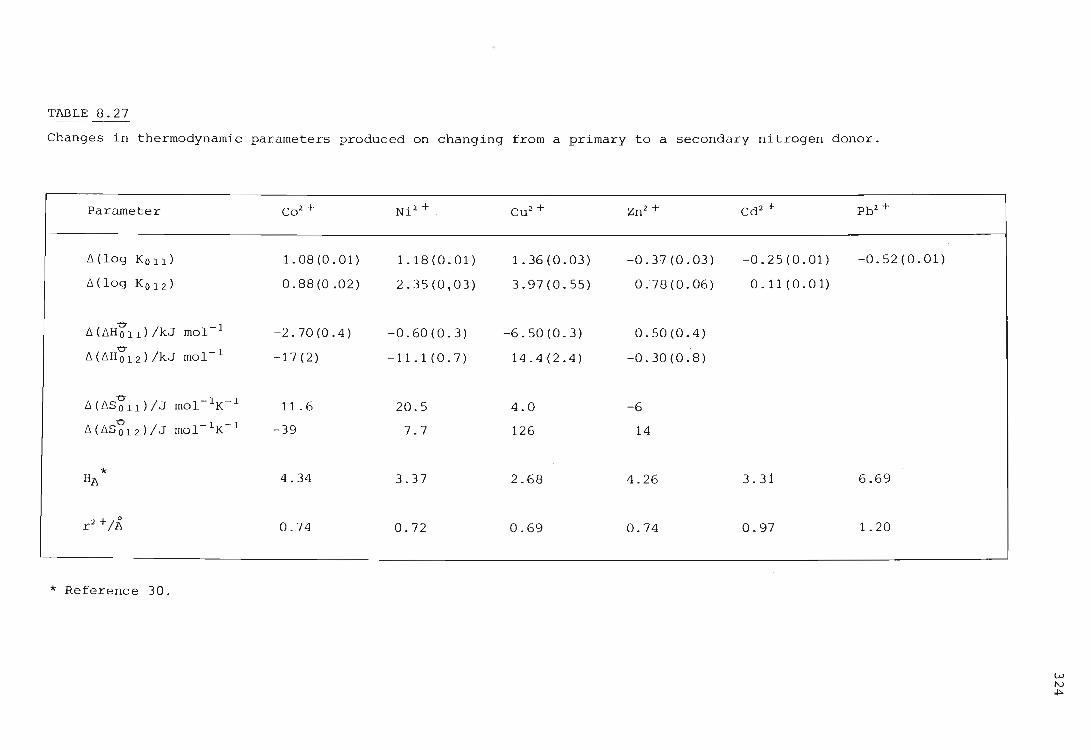
TABLE 8.27
Changes in thermodynamic parameters produced on changing from a primary to a secondary nitrogen donor.
Parameter Co 2 + N' 2 + 1 . Cu2 + Zn2 + Cd2 + Pb2 +
~ (log Ko 11) 1.08(0.01) 1.18(0.01) 1.36(0.03) -0.37(0.03) -0 . 25 (0 . 01 ) -0.52(0.01)
td log Ko 12) 0.88(0.02) 2.35(0,03) 3.97(0.55) 0 ; 78(0.06) 0.11 (0.01)
~ (~H~ll)/kJ mol- 1 -2. 70(0.4) -0.60(0.3) -6.50(0.3) 0.50(0.4)
~(~H~1 2 )/kJ mol- 1 -17( 2 ) -11.1(0 . 7) 14.4(2.4) -0.30(0.8)
~(~S~ll)/J mol- 1K- 1 11.6 20 . 5 4.0 -6
~(~ e / -1 -1 S01 2 ) J mol K -39 7.7 126 14
* 3.3i 6.69 HA 4.34 3.37 2.68 4.26
r 2 +/A 0.74 0.72 0.69 0.74 0.97 1. 20
* Reference 30.
W N
"'"
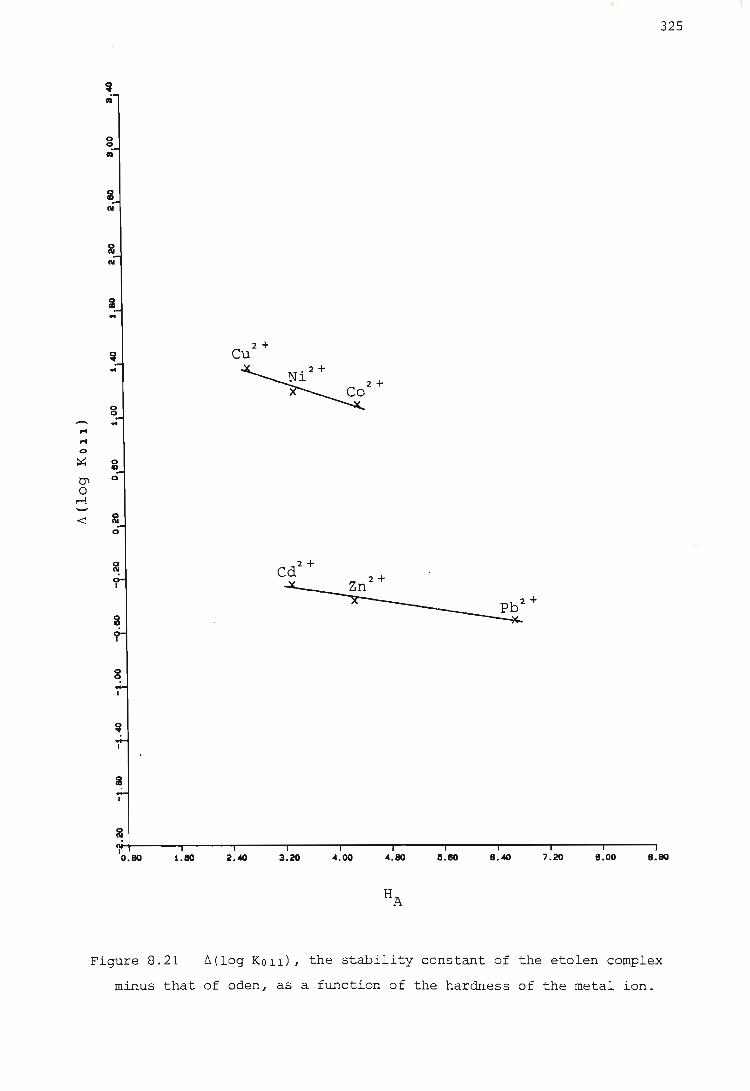
g
N
2 N
.. g
I 0.80 1.80
Figure 8.21
2 + Cu
Nl 2+ ~2+
Co
Cd2 +
2.<40 3 . 20 4 . 00
325
4.80 11.80 8.<40 7.20 8.00 8.80
~ (log KOll), the stability constant of the etolen complex
minus that of oden, as a function of the hardness of the metal ion.
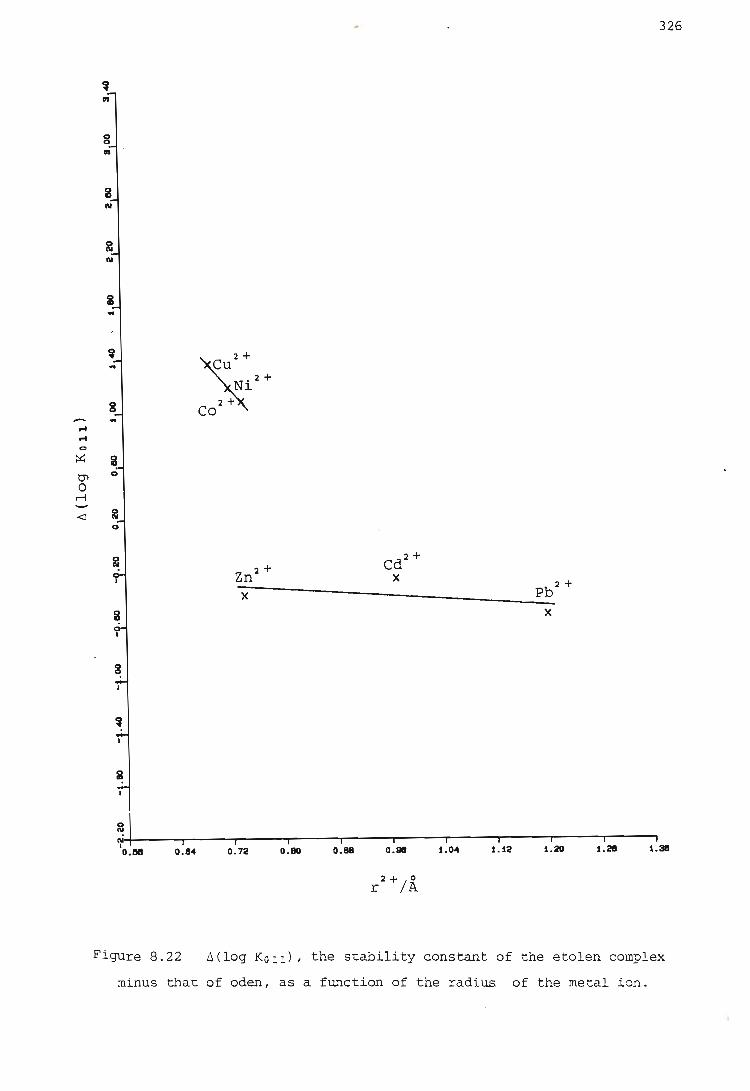
g III
.. ... .... 0
::.:: Ii tJI 0
0 ~
<J &: 0
&:
I 0 •• 0.84
Figure 8.22
~,. 2+
Co
Zn2 +
X
0.72 0.80 0.88
Cd2 + X
0.81
2+/0 r A
1.04 1.12
Pb 2 +
X
1.20 1.28 1.38
6(log KOIIl, the stability constant of the etolen complex
minus that of aden, as a function of the radius of the metal ion.
326
e If we consider the difference between the 6Holl values for etolen and
those of oden, we see (Table 8.27) that this difference varies with the
metal ion considered. However, there does not seem to be any obvious
trend in 6(6H~11) with hardness or ionic radius.
327
It is noticeable that the value for nickel is -0.60 kJ mol- 1 , which is
very different from -7.1 kJ mol- 1 , the value predicted by Hancock et at. (29). One possible explanation of this discrepancy is that the wrong
stereochemistry has been assumed here for the Ni(etolen)2+complex, i.e.
we have assumed it to be the facial isomer when it is in fact the meri-
dional.
The Ni(oden)2+complex is known to be predominantly facial in solution
(66). The above explanation therefore implies that we must correct the
value of -29.7 kJ mol- 1 obtained for 6H%11 for Ni(etolen)2+ in order that
it should refer to the facial isomer and thus be directly comparable to
the figure for Ni(oden)2+. This can be accomplished as follows.
Yoshikawa et at. (214) have shown that the difference in strain energy
between the meridional and facial isomers of [CO(NH3 )3 (dien)]3+ is
3.7 kJ mol- 1 , the facial isomer being the less strained. If we assume
that the isomers of nickel and etolen behave similarly, we C~q correct ~
the 6Holl value for nickel and etolen by means of the equation (1.33) of
Hancock et at. (29):
Assuming that 6Hp and 6Hs are the same for the two isomers, we then
conclude that, for the facial isomer of Ni(etolen)2+, 6H!11 is approxi
mately -33.4 kJ mol- 1 . Hence the difference between the 6H~11 values
for the facial isomers of the Ni(etolen)2+ and Ni(oden)2+ complexes is
-4.3 kJ mol-1
. When we use this value in plotting 6(6H!11) against
hardness or ionic radius, it falls on a straight line with the values
for Co2+ and Cu2+. (See Figures 8.23 and 8.24.)
It therefore seems likely that the Ni(etolen)2+ complex was predominantly
meridional in solution, and that we have corrected adequately for this

pol
I ~ 0 S
I-J ~ "-
... ... 4)0 :I: <J
<J
a at
8 III
iii .. ~ 0
~
?
iii
~ • I
~
I 1.110 2.00
Figure 8.23
xZn 2+
2.«1 2.80 3.20 3.110 4.00 4.80 5.20 5.110
eo ~(~HOll), the enthalpy change for the etolen complex minus
that of aden, as a function of the hardness of the metal ion.
328
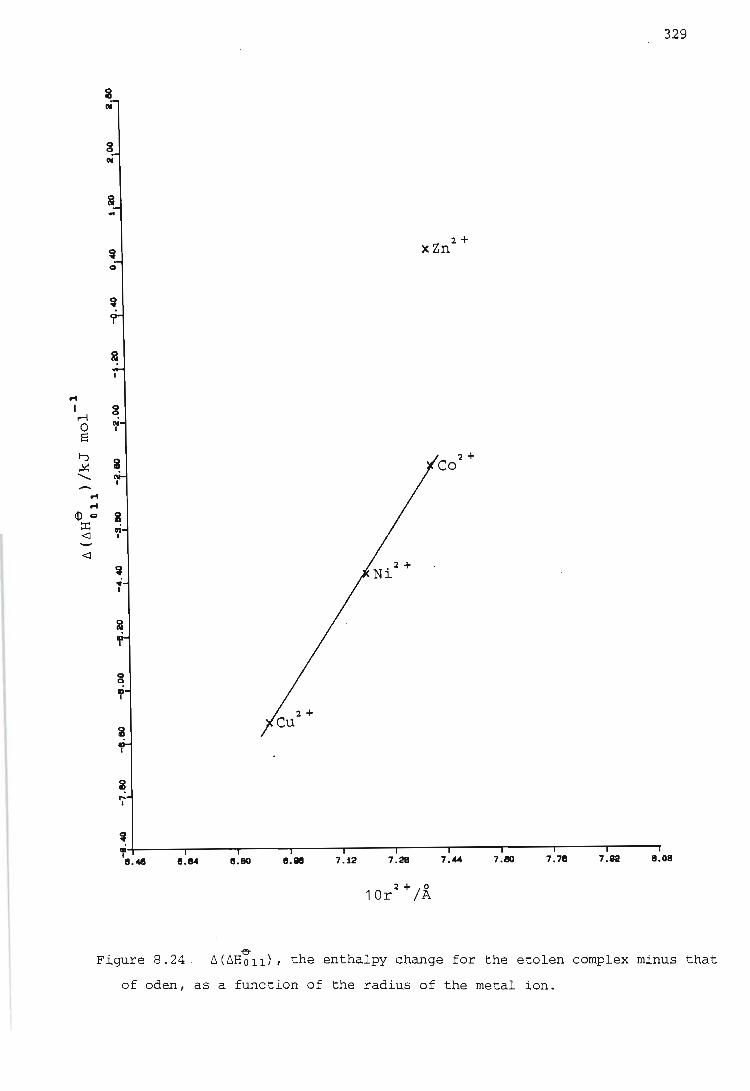
329
a (II
g (II
z .. xZn 2+
~ o ·
~
rt
I ~ 0 S ~ 2+ ~ Co .........
rt rt
¢l '" a ::c .i <l I
<l
~ .. I
Z
11.4 11.11<4 11.80 1I.Q8 7.12 7.28 7." 7.80 7.78 7.92 11.08
Figure 8.24 . -e
~(~HOll)' the enthalpy change for the etolen complex minus that
of oden, as a function of the radius of the metal ion.
phenomenon.
Although the unavailability of enthalpy data for the cadmium and lead
complexes makes it impossible to determine whether the six metal ions
again split neatly into two groups, it can be seen at least that the
behaviour of zinc is not consistent with that of cobalt, nickel and
copper.
~ An interesting feature of the ~(~H012) values for nickel and cobalt is
that they are significantly greater in modulus than the corresponding ~
~(~HOll) values. This phenomenon could be due to the increased softness
330
of the metal ion which results from the first addition of a ligand
molecule. It could also occur because the strain induced by the addition
of a second ligand molecule is less than that induced by the first.
The strain energy calculations reported for the· similar ligand dien (215)
support this latter explanation in that the strain for the ML;+ complex
is less than twice that for the ML 2 + complex. It must be noted, however,
that, in the case of the complexes of cobalt and nickel with oden,
I~H%121<I~H%111, whereas for etolen (and many other polyamines) the
opposite is true. This makes it difficult to draw any firm conclusions ~
from the ~(~H012) values. It might be possible to discover by means of
strain energy calculations whether the above reversal of the usual
trend is due to strain in the oden complexes.
No useful general conclusion can be drawn about the cumulative thermo
dynamic parameters for the ML~+ complexes, because the copper ion has
to be excluded for the reasons previously mentioned, and lead has no
ML~+ complex. This leaves two sets of only two points each.
The three metal ions considered which have no CFSE, Zn2 +, Cd2 + and Pb2 +,
seem to fall into a different category as regards the behaviour of
primary and secondary. nitrogen donors. For these metal ions the M(oden)2+
complexes are more stable than the M(etolen)2+ complexes. However, the
opposite is true for the stepwise formation of the ML~+ complexes from
the ML2+ complexes. Thus, as in the case of cobalt and nickel, the
second addition of a ligand molecule involves a softer interaction than
does the first and so the enhancement of secondary over primary nitrogen
bonding is observed. This is in accordance with what has been obser~d

331
of the crystal structures of the Zn(dien)i+ complexes, that is, that the
zinc - primary nitrogen bonds are longer than the zinc - secondary nitrogen
bonds (208, 209). (The secondary nitrogen donor is thus seen to have an
inductive effect when one ligand molecule has already been attached to
the zinc ion. This effect may provide an alternative explanation of the
observations of Ciampolini et al. (8) in the case of the complexes of
dien with zinc: they observed that 6H~1; is much less exothermic than
6H~12·)
The zinc ion does seem to be the crossover point for the difference in
behaviour between the etolen and the oden complexes. It has also been
noticed by Thorn and Hancock (216) that zinc does not seem to discriminate
between oxygen and nitrogen donors in macrocycles.
This difference in behaviour between metal ions which have CFSE and those
which do not, and the intermediate nature of zinc, can be observed in a
number of other respects:
1. The variation in complex stability with changes in the number of
atoms in the macrocyclic ring of tetraazamacrocycles (217 - 219).
2. The variation in complex' stability when rings or pendent groups
bearing neutral oxygen donors are added (220).
(In the above references, however, the variations are explained in terms
of the sizes of the metal ions rather than the presence or absence of
CFSE.)
There is evidence that in the gas phase all metal ions respond more
favourably to secondary amines than to primary (215). There is also
evidence of a similar preference for ethereal over alcoholic oxygens (215).
From this work we can conclude that only metal ions which have CFSE and
are fairly small seem to show a preference for secondary over primary
nitrogen donors. The size of this apparent effect increases linearly
with increasing softness and decreasing size of the metal ion. Such metal
ions do not seem to distinguish between alcoholic and ethereal oxygen
donors. (This conclusion is consistent with those of Everhart et al.
332
(65) and Thom et al. (215).) In fact it seems that, in complexes of these
metal ions, the complexation of any neutral oxygen donor is destabilized
by steric strain (221). On the other hand, metal ions which have no CFSE
and are larger do not distinguish between types of nitrogen donor, but in
fact do prefer the (harder) oxygen donors (197).
However, for all the metal ions investigated, the addition of a second
ligand molecule to the ML complex leads to enhancement of secondary over
primary nitrogen bonding. It seems that the addition of on.e ligand
molecule softens the metallic centre sufficiently for the inductive effect
of the secondary nitrogen donor to overcome all other effects.
We therefore conclude that the bonds between metal ions and secondary
nitrogen donors are not in general stronger than those involving primary
nitrogen. (This conclusion may need to be modified if evidence emerges
that the larger metal ions distinguish between ethereal and alcoholic
oxygen donors.) These bonds do, however, appear to be stronger in those
cases where crystal field stabilization energy is present and the metal
ion is small. This enhanced stability appears to decrease as the size or
the hardness of the metal ion increases.
APPENDIX I
DERIVATION OF EQUATION (1.16)
The empirical equation of Hancock and Marsicano (28) states that
log Kl(polyamine) = 1.152 log Sn(NH3 ) + (n-1) log 55.5,
(1.16)
where n is the denticity of the polyamine. The form of this equation can
be shown to arise as a result of the conventional asymmetric choice of
standard states of solute and solvent species for reactions taking place
in aqueous solution.
Consider the following ligand replacement reaction:
MAn(aq) + L(aq) ~ ML(aq) + nA(aq) + xH2 0,
where M is· the metal ion, A is a monodentate ligand, L is an n-dentate
ligand and x is the number (usually unknown) of water molecules released
in the process.
The chemical potential lli of any species.-- i ean be written in terms of its
chemical potential llT in some defined standard state and a thermodynamic
activity ai, as follows: ~
lli lli + RT in ai·
If the standard state of species i is defined as a hypothetical solution
of unit molar concentration in which the environment of every molecule is
the same as at infinite dilution, then, neglecting nonideal effects in the
real solutions, we may replace ai by ci' the molarity of species i, since
by assumption the activity coefficient Yi is 1. Hence:
where the superscript ec serves to indicate that the standard state is
taken to be unit molar concentration.
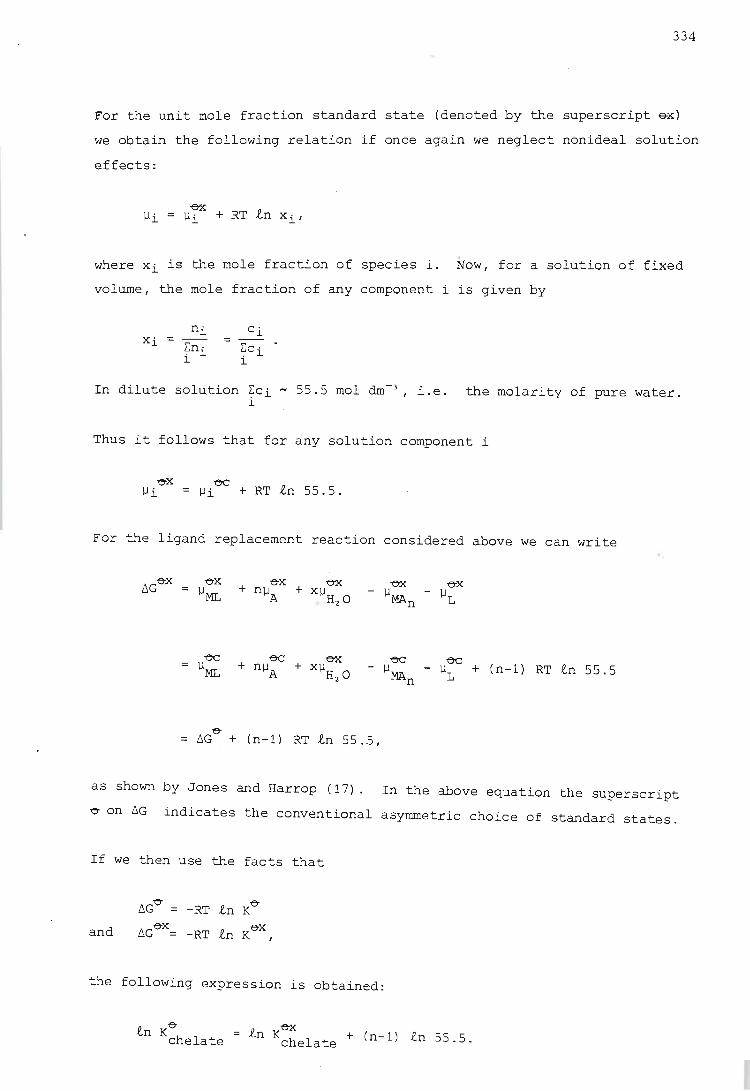
334
For the unit mole fraction standard state (denoted by the superscript ~x)
we obtain the following relation if once again we neglect nonideal solution
effects:
where xi is the mole fraction of species i. Now, for a solution of fixed
volume, the mole fraction of any component i is given by
xi ci
Ec ' . l l
In dilute solution ~Ci - 55.5 mol dm-J, i.e. the molarity of pure water.
l
Thus it follows that for any solution component i
'Ox ec ~i = ~i + RT In 55.5.
For the ligand replacement reaction considered above we can write
ex =lJ
ML ex
+ n~ A
-ex ex - ~ - ~L MAn
ec ec - ~ - ~L + (n-l) RT In 55.5
MAn
6G'O' + (n-1) RT In 55.5,
as shown by Jones and Harrop (1 7). In the above equation the superscript
'0' on 6G indicates the conventional asymmetric choice of standard states.
If we then use the facts that
6G'O = -RT In K'O'
and 6G'O'x= -RT In K'O'x
the following expression is obtained:
In Ke chelate i n K;~elate + (n- 1) i n 55.5.
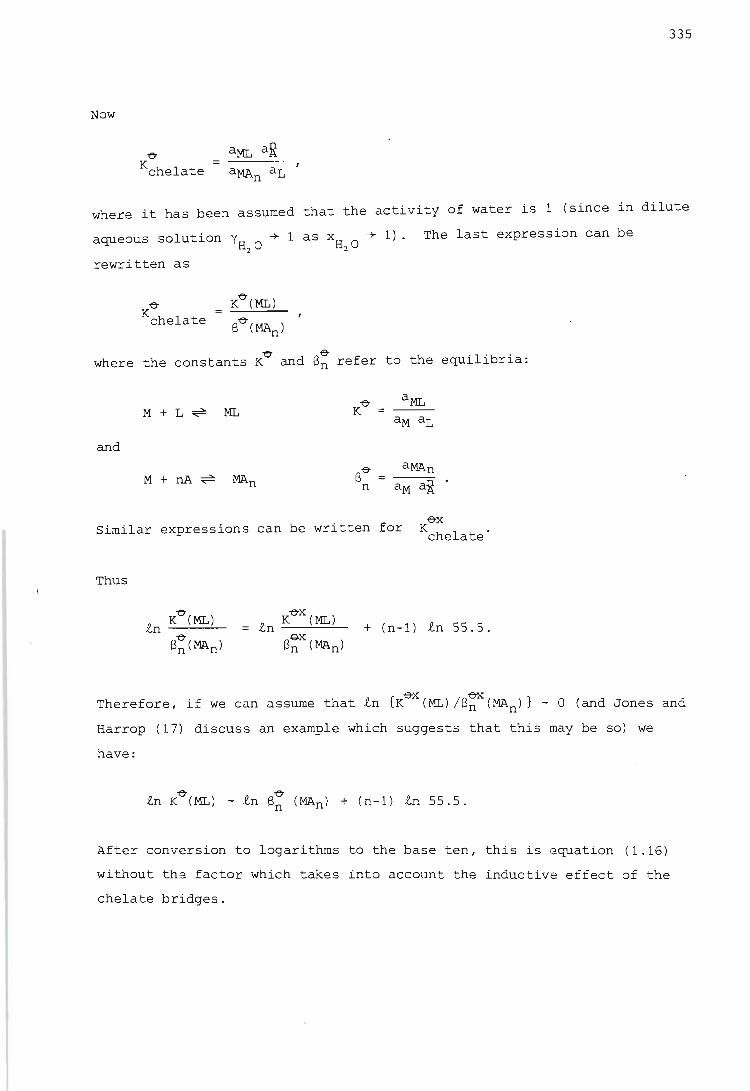
Now
e Kchelate =
335
where it has been assumed that the activity of water is 1 (since in dilute
aqueous solution y + 1 as xH
0 + 1). The last expression can be H2 0 2
rewritten as
Ke chelate =
where the constants Ke and e~ refer to the equilibria:
Ke a ML
M + L --"" ML = ~
aM aL
and
e-e aMAn M + nA -"" MAn = ...- n aM aR
Similar expressions can be written for K-ex chelate
Thus
+ (n-1) tn 55.5.
. {-ex ~ } Therefore, If we can assume that tn K (ML)/en (MAn) - 0 (and Jones and
Harrop (17) discuss an example which suggests that this may be so) we
have:
e e tn K (ML) - tn en (MAn) + (n-1) tn 55.5.
After conversion to logarithms to the base ten, this is equation (1 .16)
without the factor which takes into account the inductive effect of the
chelate bridges.
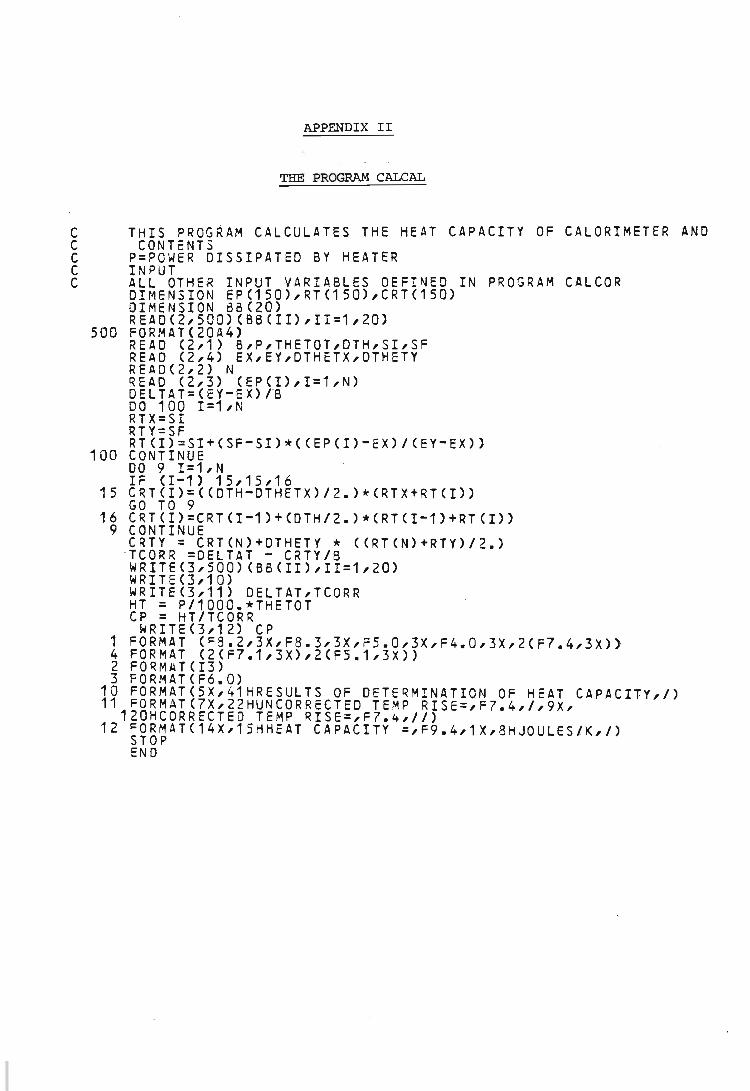
C C C C C
APPENDIX II
THE PROGRAM CALCAL
THIS PROGRAM CALCULATES THE HEAT CAPACITY OF CALORIMETER AND CONTeNTS
P=POWER DISSIPATED BY HEATER INPUT ALL OTHER INPUT VARIABLES DEFINED IN PROGRAM CALCOR DIMENSION EP(1S0),RT(1S0),CRT(150) DIMENSION B8(20) READ(2,SOO)(B8(II),II=1,20)
500 FORMAT(20A4) READ (2,1) 8,P,THETOT,DTH,SI,SF READ (2,4) EX,EY,DTHETX,DTHETY READC2,2) N READ (2,3) (EPCI),I=1,N) DELTAT=CEY-EX)IB DO 100 I=1,N RTX=SI RTY=SF RT(I)=SI+(SF-SI)*(CEP(I)-EX)/CEY-EX»
100 CONTINUE DO 9 I=1,N IF (1-1) 15,15,16
15 CRT(I)=«DTH-DTHETX)/2.)*CRTX+RTCI» GO TO 9
16 CRTCI)=CRTCI-1)+(OTH/2.)*CRTCI-1)+RT(I» 9 CONTINUE
CRTY = CRT(N)+DTHETY * C(RT(N)+RTY)!2.) ·TCORR =OELTAT - CRTY!B WRITE(3,500)'BSCII),II=1,20) WRITE (3,1 0) WRITE'3,11) OELTAT,TCORR HT = P!1000.*THETOT CP = HT!TCORR ~RITEC3,12) CP
1 FORMAT (F8.2,3X,F8.3,3X,F5.0,3X,F4.0,3X,2(F7.4,3X)} 4 FORMAT C2(F7.1,3X),2(FS.1,3X» 2 FORMAT(I3) 3 FORMATCF6.0)
10 FORMAT(SX,41HRESULTS OF DETERMINATION OF HEAT CAPACITY,!) 11 FORMATC7X,22HUNCORRECTED TEMP RISE=,F7.4,1,9X,
120HCORRECTED TEMP RISE=,F7.4,//) 12 FORMAT(14X,1SHHEAT CAPACITY =,F9.4,1X,8HJOULES/K,/)
STOP END

APPENDIX III
THE PROGRAM CALC OR
C THIS PROGRAM CORRECTS TITRATION CALORIMETER READINGS FOR C 1 ) NON-CHEMICAL ENERGY TERMS C 2 ) TEMPERATURE DIFFERENCE BETWEEN TITRANT AND TITRATE C 3 ) DILUTION OF TITRANT . C C C IT DOES NOT CORRECT FOR HEAT CONTRIBUTIONS FROM SIDE REACTIONS C C INPUT C C 8 = THERMISTOR CALIBRATION CONSTANT C CPR=HEAT CAPACITY OF EMPTY CALORIMETER C DCPOV= RATE OF CHANGE OF CALORIMETER HEAT CAPACITY WITH C VOLUME OF LIQUID IN EXCESS OF 95 CC C CPT= VOLUMETRIC SPECIFIC HEAT OF TITRANT C CPS = VOLUMETRIC SPECIFIC HEAT OF TITRATE C VOS : INITIAL VOLUME OF TITRATE C DTH: PRINTOUT INTERVAL IN SECS C DTHETX = TIME FROM START OF BURETTE TO POINT X C VTOT ~ TOTAL VOLUME DELIVERED( METTLER) C THETOT = TOTAL DELIVERY TIME C SI : INITIAL THERMOGRAM SLOPE C SF = FINAL THERMOGRAM SLOPE 'C EX = OFF-BALANCE POTENTIAL AT START OF REACTION C EY = OFF-BALANCE POTENTIAL AT END OF RE~CTION C EP = OFF-BALANCE POTENTIAL AT ANY POINT P .
. DIMENSION TIME(150),EP(150),EQ(1S0),OELTAT(1S0),CQP(150),QHL 1(1S0),CQHL(150),CQTC(150),CQDP(150),CQCP(150)
DIMENSION ~TP(150),CPP(1S0),QTC(1S0),AVTP(150) DIMENSION . B6(20) REAO(2,500)(BB(I!),II=1,20) sao FORMAT(20A4) READ (2,23) A,B,CPR,OCPOV READ (2,24) CPS,CPT,OTH READ (2,2) HOIL
4 READ (2,5) VOS,VTOT,THETOT,OTHETX,TBATH READ (2,502) CT
C C
C
100 C
2002 C c
C C
1007
READ (2,1) SI,SF,EX,EY READ (2,501) N READ (2,2) (EP(I),! : 1,N)'
CALCULATION OF TITRANT DELIVERY RATE UBURET = VTOT/THETOT CALCULATION OF VOLUME OF TITRANT APPARENTLY ADDEO AT EACH POINT DO 100 I = 1,N TIME (I) = DTH* FLOAT(I) - OTHETX AVTP(I) = TIME(I)*USURET CALCULATION OF VOLUME OF TITRANT ACTUALLY ADDEO AT EACH POINT DO 2002 I : 1,N VTP (I) = DTH*FLOAT(I) * USURET CALCULATION OF ACTUAL HEAT CAPACITY AND TOTAL VOLUME TITRATED AT EACH POINT 00 1007 I =1,N CPP(I) = CPR + VOS*CPS+VTP(I)~CPT+OCPoV*VTP(!) CPPX=CPR+VOS*CPS+VTP(1)*CPT~DCPDV*VTP(1) CALCULATION OF GROSS HEAT CHANGE IN GOING FROM THE(N-1)TH TO THE NTH POINT 00 7 I=1,N IF (I -1) 1008,1008,1009
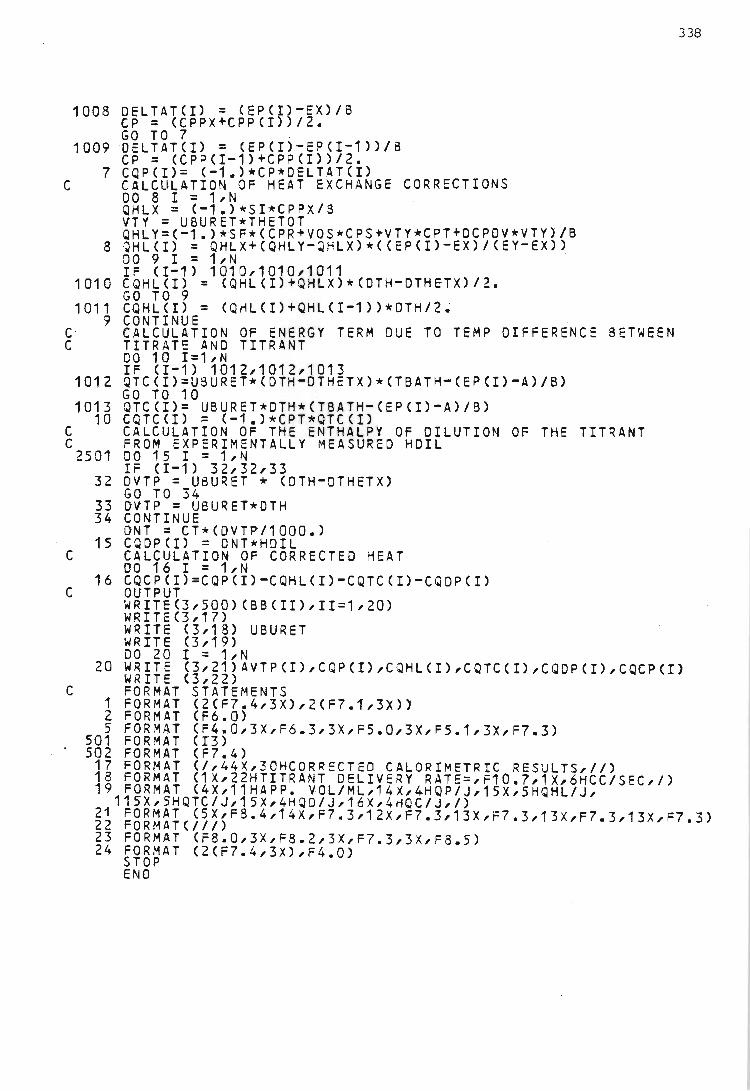
1008 DELTATCI) = (EP(I)-EX)/B CP = (CPPX+CPP(I»/2. GO TO 7 .
10090ELTAT(I) = (EP(I)-EPCI-1»/B CP = (CPP(I-1)+CPP(I»/2.
7 CQP(l)= (-1.)*CP*DELTATCI) C CALCULATION OF HEAT EXCHANGE CORRECTIONS
00 8 I = 1,N QHLX = (-1.)*SI*CPPX/3 VTY = UBURET*THETOT QHLY=(-1.)*SF*(CPR+VOS*CPS+VTY*CPT+DCPDV*VTY)/B
8 QHL(I) = QHLX+(QHLY-QHLX)*(CEP(I)-EX)/(EY-EX» DO 9 I = 1,N IF (I-1) 1010,1010,1011
1010 CQHL(I) = (QHL(I)+QHLX)*(OTH-DTHETX)/Z. GO TO 9
1011 CQHL(I) = (QHL(I)+QHL(I-1»*OTH/2~ 9 CONTINUE .
C CALCULATION OF ENERGY TERM DUE TO TEMP DIFFERENCE BETWEEN C TITRATE AND TITRANT
DO 10 I=1,N IF (I-1) 1012,1012,1013
1012 QTCCI)=U8URET*(OTH-DTHETX)*(TBATH-(EPCI)-A)fB) GO TO 10
1013 QTC(I)= UBURET*DTH*(TBATH-(EP(I)-A)/S) 10CQTC(I) = (-1.)*CPT*QTC(I)
C CALCULATION OF THE ENTHALPY OF DILUTION OF THE TITRANT C FROM EXPERIMENTALLY MEASURED HDIL
2501 DO 15 I = 1,N IF (I-1) 32,32,33
32 OVTP = USURET * (OTH-DTHETX) GO TO 34
33 OfTP = UBURET*DTH 34 CONTINUE
ONT = CT*(DVTP/1000.) 15 CQDP(I) = ONT*HOIL
C CALCULATION OF CORRECTED HEAT DO 16 I = 1,N .
16 CQCP(I)=CQP(I)-CQHLCI)-CQTC(I)-CQDP(I) C OUTPUT
WRITE(3,500)(BB(II),II=1,20) WRITE(3,17) WRITE (3,18) UBURET WRITE (3,19) DO 20 I = 1,N
338
20 WRITE (3,21)AVTP(I),CQP(I),CQHL(I),CQTC(I),CQDP(I),CQCP(I) WRITE (3,22)
C FORMAT STATEMENTS 1 FORMAT (2(F7.4,3X),2(F7.1,3X» 2 FORMAT (F6.0) 5 FORMAT (F4.0,3X,F6.3,3X,FS.0,3X,FS.1,3X,F7.3)
501 FORMAT (13) 502 FORMAT (F7.4)
17 FORMAT (/,44X,30HCORRECTED CALORIMETRIC RESULTS,I/) 18 FORMAT (1X,22HTITRANT OELIVERY RATE=,F10.7,1X,6HCC/SEC,/) 19 FORMAT (4X,11HAPP. ~OL/ML,14X,4HQP/J,1SX,5HQHL/J,
115X,SHQTC/J,1SX,4HQO/J,16X,4HQC/J,/) 21 FORMAT (SX,F8.4,14X,F7.3,12X,F7.3,13X,F7.3,13X,F7.3,13X,F7.3) 22 FORMATe/II) 23 FORMAT (F8.0,3X,F8.2,3X,F7.3,3X,F8.S) 24 FORMAT (2(F7.4,3X),F4.0)
STOP END
REfERENCES
1. (a) SILLEN, L~G . . and MARTELL, A~E ~ , 'Stabi.lity Constants of Metalion Complexes', 2nd edition, London, The Chemical Soc~ety, Special Publicati.on No. 17, 1964.
(b) SILLEN, L.G. and MARTELL, A~E ~ , 'Stability Constants of Metalion Complexes', London, The Chemical Society, Special Publication No. 25, 1971.
(c) HOGFELDT, E., 'Stability Constants of Metal-ion Complexes. Part A. Inorganic Ligands', IUPAC Chemical Data Series No. 21, Pergamon Press, 1982.
(d) PERRIN, D. D., 'Stability Constants of Metal-ion Complexes. Part B. Organic Ligands', IUPAC Chemi.cal Data Series No. 22, Pergamon Press, 1979.
(e) SERJEANT, E. P ~ and DEMPSEY, B., 'Ioni.zation Constants of Organic Acids in Aqueous Solution', IUPAC Chemical Data Series No. 23, Pergamon Press, 1979.
2. SMITH, R.M. and MARTELL, A. E., 'Cri.tical Stability Constants', Vols 1 - 4, New York, Plenum Press, 1974, 1975, 1977, 1976.
3. CHRISTENSEN, J.J., HANSEN, L.D. and IZATT, R.M., 'Handbook of Proton Ioni.zation Heats', New York, John Wiley and Sons, 1976.
4. CHRISTENSEN, J.J., EATOUGH, D.J. and IZATT, R. M., 'Handbook of Metal T:iigand Heats and Related Thermodynamic Quantities', 2nd edition, New York, Marcel Dekker, 1975.
5. HANCOCK, R.D. and MARSICANO, F., J. Chern. Soc. (Dalton), 1832 (1976).
6. MARSICANO, F. and HANCOCK, R.D., J. Chern .. Soc. (Dalton),228 (1978).
7. SCHWARZENBACH, G.,Helv. Chim. Acta, 12, 2344 (1952).
8. CIAMPOLINI, M., PAOLETTI, P. and SACCONI, L., J. Chern. Soc., 2994 (1961) .
9. SACCONI, L. , PAOLETTI., P.and CIAMPOLINI., M., J. Chern. Soc., 5115 (1961) .
10. PAOLETTI, P. and VACCA, A., J. Chern. Soc., 5051. (1964).
11. SACCONI, L~, PAOLETTI, P. and CIAMPOLINI, M., J. Chern. Soc., 5046 (1964) .
12. NANCOLLAS, G.H., Coord. Chern. Revs, 2, 379 (1970).
13. CALVIN, M. and BAILES, R.H., J. Amer. Chern. Soc., 68, 949 (1946).
14. SCHWARZENBACH, G., Advan. Inorg. Chern. and Radiochem., 2, 257 (1961).
15. (a) COTTON, F.A. and HARRIS, F.E., J. Phys. Chern., ~, 1203 (1955).
340
(b) ibid., 60, 1451 (1956).
16. ADAMSON, A.W., J. Amer. Chern. Soc., 76, 1578 (1954).
17. JONES, G.R.H. and HARROP, R., J. Inorg. Nucl. CheI)l .. , 35, 173 (1973).
18. BEECH, G., Q. Rev. Chern. Soc., ~, 410 (1969).
19. MARTELL, A.E., Advances in Chemistry Series, Vol. 62, Washington, DC, The American Chemical Society, 1967, p. 272.
20. MUNRO, D., Chern. Brit., ~,100 (1977).
21. AGTERDENBOS, J., J. Chern. Ed., i2, 230 (1968).
22. SIMMONS, E.L., J. Chern. Ed., 56, 578 (1979).
23. PRUE, J.E., J. Chern. Ed., i§., 1.2 (1969).
24. BJERRUM, N., Kgl. Danske Videnskab. Selskab, Mat.-Fys. Medd., 7, 9 (1926) .
25. FUOSS, R.M., J. Amer. Chern. Soc., 80, 5059 (1958).
26. EIGEN, M., Z. Phys. Chern. (Frankfurt), 1., 176 (1954).
27. ROSSEINSKY, D.R., J. Chern. Soc. (Dalton), 731 (1979).
28. HANCOCK, ,R.D. and MARSICANO, F., J. Chern. Soc. (Dalton), 1096 (1976).
29. HANCOCK, R.D., McDOUGALL, G.J. and t~SICANO, F., Inorg. Chern., 18, 2847 (1979).
30. HANCOCK, R.D. and MARSICANO, F., Inorg. Chern., 11, 560 (1978).
31. FRAUSTO DA SILVA, J.J.R., J. Chern. Ed., 60, 390 (1983).
32. MYERS, R.T., Inorg. Chern., ll, 952 (1978).
33. ATKINSON, G. and BAUMAN Jr., J.E., Inorg. Chern., l, 64 (1963).
34. (a) SPIKE, C.G. and PARRY, R.W., J. Amer. Chern. Soc., 75, 2726 (1953).
(b) ibid.,]2, 3770 (1953 ) .
35. RASMUSSEN, S.E., Acta Chern. Scand., lQ, 1279 (1956 ) .
36. ANDEREGG, G., Chern. Brit., ~, 437 (1977).
37. SANGER, A., Chern. Brit., ~, 242 (1977).
38. POWELL, H.K.J., Chern. Brit., ii, 220 ( 1978).
39. RODE, B.M., Chern. Phys. Lett., ~, 350 (1974).
40. IRVING, H., WILLIAMS, R.J.P., FER,RETT, D.J. and WILLIAMS, A .. E., J. Chern. Soc., 3494 (1954 ) .
341
41. WI.LLIAMS, R. J. P., J. Phys.. Chern., ~, 12.1 (1954).
42. PAOLETTI, P., FABBRIZZI, L. and BARBUCCI, R., Inorg. Chim. Acta Revs,
7, 43 (1973).
43. CIAMPOLINI, M., PAOLETTI, P. and SACCONI, L" J. Chern. Soc., 4553
(1960) .
44. ANDEREGG, G., Adv. Mol. Relaxation Interact. Processes, ~, 79 (1980).
45. BARBUCCI, R., FABBRIZZI, L. and PAOLETTI, P., Coord. Chern. Revs, 8, 31 (1972).
46. PAOLETTI, P., BIAGINI, S. and CANNAS, M., Chern. Corrm . .' 513 (1969).
47. McDOUGALL, G.J., HANCOCK, R.D. and BOEYENS, J.C.A., J. Chern. Soc. (Dalton), 1438 (1978).
48. BOEYENS, J.C.A., HANCOCK, R.D. and McDOUGALL, G.J., S. Afr. J. Chern., 32, 23 (1979) .
49. POWELL, K., Chern. N.Z., 40, 9 (1976).
50. PAOLETTI, P., 'Coordination Compounds. Structural Information from Calorimetry', in 'International Symposium on Calorimetry in Chemical and Biological Sciences', Guildford, September 1969, p. 87.
51. FABBRIZZI, L., PAOLETTI, P. and CLAY, R.M., Inorg. Chern., 12, 1042 (1978) .
52. HINZ, F.P. and MARGERUM, D;W., Inorg. Chern. , . 13, 2941 (1974).
53. HANCOCK, R.D. and McDOUGALL, G.J., J. Amer. Chern. Soc., 102, 6551 (1980) .
54. HANCOCK, R.D. and McDOUGALL, G.J., Adv. Mol. Relaxation Interact. Processes, l.§., 99 (1980).
55. BARBUCCI, R. and BARONE, V., J. Soln. Chern., ~, 427 (1979).
56. PAOLETTI, P., BARBUCCI, R. and VACCA, A., J. Chern. Soc. (Dalton), 2010 (1972).
57. DELFINI, M., SEGRE, A.L., CONTI, F., BARBUCCI, R., BARONE, V. and FERRUTI, P., J. Chern. Soc. (Perkin II), 900 ( 1980).
58. CHRISTENSEN, J.J., IZATT, R.M., WRATHALL, D.P. and HANSEN, L.D., J. Chern. Soc. (A), 1212 (1969) .
59. DEGISCHER, G. and NANCOLLAS, G.H., J. Chern. Soc. (A), 1125 ( 1970).
60. GURNEY, R.W., 'Ionic Processes in Solution', New York, McGraw-Hill, 1953.

61. MUNSON, M.S.B., J. Amer. Chem. Soc., ~, 2332 (1965).
62. JONES III, F .M. and ARNETT, E. M .. , Prog. Phys. Org. Chern. I .l!., 263 (197.4) .
63. DRAGO, R.S., VOGEL, G.C. and NEEDHAM, T~E., J~ Amer. Chern.. Soc., 93, 6014 (1971).
64. McMILLIN, D .R., DRAGO, R. S. and NUSZ, J .A., J. Amer. Chern. Soc., 98, 3120 (1976).
342
65. EVERHART, D. S., McKOWN, M.M. and EVILIA, R. F., J. Coord. Chem., 2., 185 (1979).
66. EVILIA, R.F., YOUNG, D.C. and REILLEY, C.N., J. Coord. Chem., 2' 17 (1973).
67. BRECKENRIDGE, J.G., Can. J. Research, 26B, 11 (1948).
68. HARVEY, J.L., TEWKSBURY, C.l. and HAENDLER, H.M., J. Amer. Chem. Soc., 71, 3641 (1949).
69. KELLER, R.N. and EDWARDS, L.J., J. Amer. Chem. Soc. 2±, 215 (1952).
70. DRINKARD, W.C., BAUER, H.F. and BAILAR, Jr., J.C., J. Amer. Chem. Soc., g, 2992 (1960).
71. DAS SARMA, B., TENNENHOUSE, G.J. and BAILAR, Jr., J.C., J. Amer. Chem. Soc., 90, 1362 (1968).
72. DAS SARMA, B. and BAILAR, Jr., · J.C., J. Amer. Chem. Soc., ~, 5958 (1969).
73. BASSETT, J., GRZESKOWIAK, R. and O'LEARY, B.L., J. Inorg. Nucl. Chem., 32, 3861 (1970).
74. BASSETT, J., GRZESKOWIAK, R. and O'LEARY, B.L., J. InQrg. Nucl. Chem., E, 3867 (1970).
75. RUSTAGI, S.C. and RAO, G.N., Current Science, ~, 351 (1973).
76. NASANEN, R., LEMMETTI, L. and ULMANEN, S., Suom. Kemistilehti, 42B, 266 (1969).
77. BARBUCCI, R., Inorg. Chim. Acta, ~, 113 (1975).
7S. BARBUCCI, R. and VACCA, A., J. Chem. Soc. (Dalton), 2363 (1974).
79. BECK, M.T., 'Chemistry of Complex Equilibria', London, Van Nostrand Reinhold, 1970, p. 27.
so. ROSSOTTI, F.J.C. and ROSSOTTI, H.S., 'The Determination of Stability Constants', New York, McGraw-Hill, 1961.
81. ROSSOTTI, H., 'The Study of Ionic Equilibria, An Introduction', London, Longman, 1975.
82.
83.
84.
85.
86.
87.
88.
89.
90.
91.
92.
93.
94.
95.
96.
97.
98.
99.
100.
343
ROSSOTTI, H.S., Talanta, ~, 809 (1974).
BECK, M. T., 'Dete!;1llination of S.tab.ility Constants of Metal Complexes', in 'Essays on Analytical Chemistry in Memory of Professor Anders Ringbom', Wanninen, E. (ed.), Oxford, Pergamon Press, 1977, p. 59.
ALBERT, A. and SERJEANT, E.P., 'The Determination of Ionization Constants', New York, Chapman and Hall, 1984.
CHRISTENSEN , J . J., IZATT, R.M., HANSEN, L.D. and PARTRIDGE, J.A., J. Phys. Chern., 70, 2003 (1966).
GRENTHE, I. and LEDEN, I., 'Calorimetric Titrations for the Study of Stepwise Equilibria in Solutions', in 'Proc. 8th Int . . Conf. Coord. Chern.', Gutmann, V. (ed.), New York, Springer, 1964, p. 332.
ARNEK, R., Acta Chern. Scand., ~, 1986 (1969).
BARTHEL, J., 'Thermometric Titrations', New York, John Wiley and Sons, 1975, p. 148.
CHRISTENSEN, J.J., RUCKMAN, J., EATOUGH, D.J. and IZATT, R.M., Thermochimica Acta, i, 203 (1972).
EATOUGH, D.J., CHRISTENSEN, J.J. and IZATT, R.M., Thermochimica Acta, 3, 219 (1972).
EATOUGH, D.J., IZATT, R.M. and CHRISTENSEN, J.J., The:r::mochimica Acta, i, 233 (1972).
EATOUGH, D.J., IZATT, R.M. and CHRISTENSEN, J.J., Comprehensi~e Analytical Chemistry, 12B, 3 . (1982).
HANSEN, L.D., IZATT, R.M. and CHRISTENSEN, J.J., 'Applications of Thermometric Titrimetry to Analytical Chemistry', in 'New Developments in Titrimetry', Jordan, J. (ed.), New York, Marcel Dekker, 1974, p.l.
VOGEL, A.I., 'A text-book of quantitative inorganic analysis including elementary instrumental analysis', 3rd edition, London, Longman, 1961, p. 238.
ibid., p. 241 (Procedure B).
ibid., p. 435.
MERCK, E., 'Complexometric Assay Methods with Titriplex' , 3rd edition, Darmstadt, p. 32.
VOGEL, A.I.~ 'A text-book of quantitative inorganic analysis including elementary ~nstrumental analysis', 3rd edition, London, Longman, 1961, p. 433.
'CRC Handbook of Chemistry and Physics', 65th edition, Boca Raton, CRC Press Inc., 1984, p. C-294.
POUCHERT, C.J., 'The Aldrich Library of Infrared Spectra', 3rd editi.on, Milwaukee, Aldrich Chemical Company, 1981, p. 204A.

344
101. SEGAL, L. and EGGERTON, F.V., Applied Spectroscopy, £,148 (1961).
102. 'Dictionary of Organic Compounds', Volume 2, 4th edition, . London, . Eyre and Spottiswoode, 1965, p. 865.
103. POUCHERT, C.J., 'The Aldrich Library of Infrared Spectra',3rd edition, Milwaukee, Aldrich Chemical Company, 1981, p. 200H.
104. KIPRIYANOV, A.I. and K1PRIYANOV, G.1., Journal of General Chemistry of the U.S.S.R., l, 585 (1932).
105. I.G. FARBENIND. A.-G., Nitriles and Derivatives, French Patent 730 760, Appl. 30 January 1932.
106. STEWART, F.H.C., Journal of Organic Chemistry, 2:2,687 (1962).
107. BENEDIKOVIC, I., RIECANSKA, E .. and MAJER, J., Acta Fac. Pharm. Univ. Comenianae, 26, 59 (1974)..
108. TAYLOR, D.A.H., Personal communication.
109. VOGEL, A.I., 'A Text-book of Macro and Semimicro Qualitative Inorganic Analysis', 4th edition, London, Longman, 1976, p. 340.
110. POUCHERT, C.J., 'The Aldrich Library of Infrared Spectra', 3rd edition, Milwaukee, Aldrich Chemical Company, 1981, p. 339D.
111. JANKOWSKI, K. and BERSE, C., Canadian Journal of Chemi.stry, 46, 1939 (1968).
112. TAKAGI, N., HSU, H.Y. and TAKEMOTO, T., Yakugaku Zasshi, 90, 899 (1970) cited in Chemical Abstracts, 73~ 127782u (1970) as-Well as 'Dictionary of Organic Comp:lUnds', Tenth and cumulativ.e supplement, 4th edition, London, Eyre and Spot.tiswoode, 1974, p. 779.
113. TlMAKOVA, L.M., YAROSHENKO, G .. F., LASTOVSKII., R.P., SIDORENKO, V.V., RYKOV, S.V. and SI.ZOV, V.V., N-(2-Hydroxyethyl)aminoacetic acid, U.S.S.R. Patent 681050, Appl. 17 March 1978, Acc. 25 August 1979, cited in Chemical Abstracts, 92: 22058b (1980).
114. LEI.MU, R. and JANSSON, J. I., Suomen Kemi.stilehti, 18B, 40 (1945).
115 . VIELES, P. and SEGUIN, J., Comptes Rendus, 234, 1980 (1952).
116. VIELES, P. and SEGUIN, J., Societe Chimique de France Bulletin, 287 (1953).
117 . HOPE, D. B. and HORNCASTLE, K. C., Bi.ochemical Journal, 102, 910 (1967).
118. LOWE, K., FORBES, A. W. and MARSI.CANO, F., 'The construction and tes ting of a precision calorimeter', Johannesburg, National Institute for Metallurgy, Report No. 1582, October 1973, 19 pp.
119. GRAN, G., Acta Chem. Scand., i, 559 (1950).
120. GRAN, G., Analyst, ]2, 661 (1952).
345
121. ROSSOTTI, F. J.C. and ROSSOTTI, H., J. Chern. Ed., 42, 375 '( 1965) .
122. INGMAN, F. and STILL, E., Talanta, 13, 1431 (1966).
123. MASCINI, M., Ion-Selective Electrode Rev., l' 17 (1980).
124. ROSSOTTI, F.J.C. and ROSSOTTI, H., J. Phys. Chern., 68, 3773 (1964).
125. BARTHEL, J., 'Thermometric Titrations', New York, John Wiley and Sons, 1975, p.24.
126.
127.
128.
129.
130.
131.
132.
133.
134.
135.
136.
137.
138.
139.
140.
141.
142.
143.
144.
145.
WILLIAMS, D.R., J. Chern. Ed., 48, 480 (1971).
WILLIAMS, D.R., J. Chern. Soc. (Dalton), 1064 (1973).
CORRIE, A.M. and WILLIAMS, D.R., Annali di Chimica, 68, 821 (1978).
INGRI, N., KAKOLOWICZ, W., SILLEN, L.G. and WARNQVIST, B., Talanta, li, 1261 (1967).
MAY, P.M., WILLIAMS, D.R., LINDER, P.W. and TORRINGTON, R.G., Talanta, 29 , 249 (1 982) .
SABATINI, A., VACCA, A. and GANS, P., Talanta, 21, 53 (1974).
LEGGETT, D .. J., Talanta, 24, 535 (1977).
GANS, P., SABATINI, A. and VACCA, A., Inorg. Chim. Acta, ~, 237 (1976) .
SABATINI, A. and VACCA, A., J. Chern. Soc. (Dalton), 1693 (1972).
MAY, P.M., MURRAY, K. and WILLIAMS, D.R., Talanta, 32, 483 (1985).
MURRAY, K. and MAY, P.M., 'Metal-Ligand Formation Constants by Potentiometric Titration/Computing Techniques' ,Lecture presented at Chelsea College, London on 5 April 1984.
KIELLAND, J., J. Amer. Chern. Soc., ~, 1675 (1937).
LINDER, P.W. and MURRAY, K., Talanta, ~, 377 (1982).
MURRAY, K. and MAY, P.M., 'ESTA Users Manual', 1984.
ARNEK, R., Arkiv Kemi, ~, 81 (1970). ,
SILLEN, L.G., Acta Chern. Scand., 18, 1085 (1964).
SILLEN, L.G., and WARNQVIST, B., Arkiv Kemi, ll, 341 (1969).
-MARKLUND, E., SJOBERG, s.and OHMAN, L., Acta Chern. Scand., A40, 367 (1986) .
VADASDI, K., J. Phys. Chern., 78, 816 (1974).
AVDEEF, A., Inorg. Chern., £, 3081 (1980).

346
146. VACCA A SABATINI, A. and GRISTINA, M.A., Coord. Chern. Rev., 8, , ., 45 (1972).
147. HAVEL, J. and MELOUN, M., Talanta, ~, 171 (1985).
148. GANS, P., Adv. Mol. Relaxation Interact. Processes, ~, 139 (1980).
149. JOHANSEN, E. S. and J¢NS, 0., Talanta, 2!..r 743 (1984).
150.' ROSSOTTI, H., 'The Study of Ionic Equilibria, An Introduction', London, Longman, 1978, p. 83.
151. ibid., p. 91.
152. ibid., p. 92.
153. ROS SOTT I , F.J.C. and ROSSOTTI, H.S., 'The Determination of Stability Constants', New York, McGraw-Hill, 1961, p. 145.
154. MULLA, F., M.Sc. Thesis, University of Natal, Durban, 1981, p. 65.
155. BIEDERMANN, G. and SILLEN, L.G., Arkiv Kemi, 5, 425 (1953).
156. ROSSOTTI, H.S., 'The Study of Ionic Equilibria, An Introduction', London, Longman, 1978, p. 85.
157. MOLINA, M., MELIOS, C., TOGNOLLI, J.O., LUCHIARI, L.C. and JAFELICCI Jr., M., J. Electroanal. Chern., 105,237 (1979).
158. LINDER, P.W. and TORRINGTON, R.G., Research Progress 'Report, University of Cape Town, July 1979 - June 1980, p. 23.
159. BOTTARI, E., et at., Annali di Chimica, 68, 813 (1978).
160. SMITH, R.M. and MARTELL, A.E., 'Critical Stability Constants, Vol. 4: Inorganic Complexes', New York, Plenum Press, 1976, p. 1.
161. LINDER, P.W. and TORRINGTON, R.G., Research Progress Report, University of Cape Town, July 1979 - June 1980, p. 24.
162. MARTELL, A.E. and SMITH, R.M., 'Critical Stability Constants, Vol. 3: Other Organic Ligands', New York, Plenum Press, 1977, p. 3.
163. LOWE, K., FORBES, A.W. and MARSICANO, F., 'The construction and testing of a precision calorimeter', Johannesburg, National Institute for Metallurgy, Report No. 1582, October 1973, pp. 9, 10.
164. ibid., p. 9.
165. ibid., p. 8.
166. 'Handbook of Chemistry and Physics', 53rd edition, Cleveland, The Chemical Rubber Company, 1972, pp. D-128, F-ll.
167. SMITH, R.M. and MARTELL, A.E., 'Critical Stability Constants, Vol. 2: Amines', New York, Plenum Press, 1975, p. 95.

168. SMITH, R.M. and MARTELL, A.E., 'Critical Stability Constants, Vol. 4: Inorganic Complexes', New York, Plenum Press, 1976, p. 6.
347
169. LOWE, K., FORBES, A.W. and MARSICANO, F., 'The construction and testing of a precision calorimeter', Johannesburg, National Institute for Metallurgy, Report No. 1582, October 1973, p. 6.
170. JONES, P.G., Chern. Brit., 12, 222 (1981).
171. WADE, P.W., M.Sc. Thesis, University of the Witwatersrand, Johannesburg, 1985.
172. SILLEN, L.G. and MARTELL, A.E., 'Stability Constants of Metal-ion Complexes', London, The Chemical Society, Special Publication No. 25, 1971, p. 24.
173. SMITH, R.M. and MARTELL, A.E., 'Critical Stability Constants, Vol. 4: Inorganic Complexes' ,New York, Plenum Press, 1976, p. 9.
174. DAVIES, C.W., 'Ion Association', London, Butterworth, 1962, pp. 39 - 43.
175. NASANEN, R., TILUS, P. and RINNE, A.-M., Suomen Kemistilehti, B39, 45 (1966).
176. HALL, J.L., JOSEPH, E., and GUM, M.B., J. Electroanal. Chern., li, 529 (1972).
177. HALL, J.L., Proc. W. Va. Acad. Sci., ~, 104 (1963).
178. CONDlKE, G.F. and MARTELL, A.E., J. Inorg. Nucl. Chern., ll, 2455 (1969) .
179. GUSTAFSON, R.L. and MARTELL, A.E., J. Amer. Chern. Soc., ~, 525 (1959).
180. EDWARDS, L.J., Diss., Univ. of Michigan, Ann Arbor, 1950.
181. KELLER, R.N. and EDWARDS, L. J., J. Amer. Chern. Soc., 74, 2931 (1952) .
-182. SILLEN, L.G. and MARTELL, A.E., 'Stability Constants of Metal-ion Complexes', 2nd edition, London, The Chemical Society, Special Publication No. 17, 1964, p. 437.
183. HALL, J.L., DEAN, W.E. and PACOFSKY, E.A., J. Amer. Chern. Soc., .§2, 3303 (1960).
184. MARTELL, A.E., CHABEREK Jr., S., COURTNEY, R.C., WESTERBACK, S. and HYYTIAlNEN, H., J. Amer. Chern. Soc., ~, 3036 (1957).
185. PAOLETTI, P., BARBUCCI, R., VACCA, A. and DEI, A., J. Chern. Soc. (A), 310 (1971).
186. SMITH, R.M. and MARTELL, A.E., 'Critical Stability Constants, Vol. 2: Amines' ,New York, Plenum Press, 1975, p. 83.
187. COVINGTON, A.K., Chern. Soc. Rev., !!, 265 (1985).
188. SMITH, R.M. and MARTELL, A.E., 'Critical Stability Constants, I Vol.2: Amines' ,New York, Plenurn Press, 1975, p. 58.
189. LOTZ, J.R., BLOCK, B.P. and FERNELIUS, W.C., J. Phys. Che~., 63, 541 (1959).
190. CABAN I , S., J. Chern. Soc., 5271 (1962).
191. AVDEEF, A., KEARNEY, D.L., BROWN, J.A. and CHEMOTTI Jr., A.R., Anal. Chern., 54, 2322 (1982).
348
192 . KELLER, R.N. and EDWARDS, L.J., Univ. Col. Studies, Ser. Chern. Pharrn. i, 1 (1961).
193. KARPEISKAYA, E.I., KUKUSHKIN, Yu. N., TROFIMOV, V.A., YAKOVLEV, I.P. and VLASOVA, R.A., Russ. J. Inorg. Chern., 12, 1411 (1972).
194. (a) AHRLAND, S., CHATT, J. and DAVIES, N.R., Quart. Revs Chem. Soc., l..!., 265 (1958).
(b) KLOPMAN, G., J. Amer. Chern. Soc., 90,223 (1968).
195. PAOLETl' I , P., NUZZI, F. and VACCA, A., J. Chern. Soc. (A), 1385 (1966).
196. HANCOCK, R.D. and MARSICANO, F., Inorg. Chem., 12, 560 (1978).
-197. THOM, V.J., SHAIKJEE, M.S. and HANCOCK, R.D., Inorg. Chem., 25, 2992 (1986).
198. GAUR, J.N., GUPTA, O.D. and GUPTA, K.D., Journal of Electrochemical Society of India, ~, 58 (1978).
-199. HANCOCK, R.D. and THOM, V.J., J. Amer. Chem. Soc., 104, 291 (1982).
200. HART, S.M., BOEYENS, J.C.A. and HANCOCK, R.D., Inorg. Chern., 22, 982 (1983).
201. HANCOCK, R.D. and NAKANI, B.S., S. Afr. J. Chern., ~, 153 (1982).
202. IRVING, H. and ROSSOTTI, H., Acta Chern. Scand., lQ, 72 (1956).
203. BIAGINI, S. and CANNAS, M., J. Chem. Soc. (A), 2398 (1970).
204. STEPHENS, F.S., J. Chem. Soc. (A), 883 (1969).
205. STEPHENS, F.S., J. Chem. Soc . (A ) , 2233 (1969).
206.
207.
208.
209.
COTTON, F.A. and ELDER, R.C., Inorg. Chern., i, 397 (1964).
COTTON, F.A. and WING, R.M., Inorg. Chern., i,314 (1965).
MURPHY, A., MULLANE, J. and HATHAWAY, B., Inorg. Nucl. Chem. Letters, l§., 129 (1980).
HODGSON, P.G. and PENFOLD, B.R., J . Chem. Soc. (Dalton), 1870 (1974) .
210. PAJUNEN, A. and NASAKKALA, M. , Suornen Kernistilehti, B45, 47 (1972) .
349
211. CHASTAIN Jr., R.V. and DOMINICK, T.L., Inorg. Chern., g, 2621 (1973).
212. ZIMMERMAN, D.N. and HALL, J.L., Inorg. Chern., g,2616 (1973).
213. FAVAS, M.C. and KEPERT, D.L., J. Chern. Soc. (Dalton), 793 (1978).
214. YOSHIKAWA, Y., KATO, N., KIMURA, Y., UTSUNO, S. and NATU, G.N., Bull. Chern. Soc. Jpn , ~, 2123 (1986).
215. THOM, V.J., BOEYENS, J.e.A., McDOUGALL, G.J. and HANCOCK, R.D., J. Amer. Chem. Soc., 106, 3198 (1984).
-216. THOM, V.J. and HANCOCK, R.D., Inorg. Chim. Acta, 22, L231 (1983).
-217. THOM, V.J. and HANCOCK, R.D., J. Chem. Soc. (Dalton), 1877 (1985).
218. TH<)M, V.J., HOSKEN, G.D. and HANCOCK, R.D., Inorg. Chem.,~, 3378 (1985).
219. HANCOCK, R.D., BHAVAN, R. , WAGNER, C.A. and HOSKEN, G.D., S. Afr. J. Chern., 22., 238 (1986).
220. HANCOCK, R.D., BHAVAN, R., SHAIKJEE, M.S., WADE, P.W. and HEARN, A., Inorg. Chim. Acta, 112, L23 (1986).
221. WADE, P.W. and HANCOCK, R.D., Inorg. Chim. Acta, 130, 251 (1987).