Photophysics of norharmane in solution phase: From homogeneous to microheterogeneous environments

Electronic Structure, Photophysics, and Relaxation Dynamics of Charge Transfer ExcitedStates in Boron-Nitrogen-Bridged Ferrocene-Donor Organic-Acceptor Compounds
M. D. Thomson, M. Novosel, and H. G. Roskos*Physikalisches Institut, Robert-Mayer-Strasse 2-4, Johann Wolfgang Goethe-UniVersitat,D-60054 Frankfurt am Main, Germany
T. Mu1 ller, M. Scheibitz, and M. WagnerInstitut fur Anorganische Chemie, Marie-Curie-Strasse 11, Johann Wolfgang Goethe-UniVersitat,D-60439 Frankfurt am Main, Germany
F. Fabrizi de Biani and P. ZanelloDipartimento di Chimica dell’UniVersita, Via Aldo Moro, I-53100 Siena, Italy
ReceiVed: October 9, 2003; In Final Form: December 21, 2003
We present a study of the electronic, photophysical, and picosecond excited-state relaxation characteristics ofa class of derivatives comprised of multiple bipyridylboronium acceptors covalently linked to a ferrocenedonor. These compounds exhibit a broad visible absorption band, which we attribute to a metal-to-ligandcharge transfer transition between the donor and the acceptor. A comparison of optical absorption,spectroelectrochemical, and theoretical results confirms the assignment of the band and provides informationon the degree of electron delocalization between the donor and the acceptor. Picosecond transient absorptionmeasurements reveal that the back-electron transfer relaxation is critically dependent on the structural flexibilityof the bridging bonds between the donor and the acceptor. In the case where the acceptor substituents arefree to rotate about the bridging bonds between the boron and the cyclopentadienyl rings of the ferrocene, asignificant portion of the excited state decays directly back to the ground state on a time scale of∼18 ps,whereas in the case where an additionalansa-bridge that connects acceptor substituents enforces a more rigidconformation, the ground-state recovery proceeds only on a∼800-ps time scale. This demonstrates theimportance of conformational degrees of freedom for the internal conversion and back-electron transfer inthese systems.
Introduction
Optically induced charge transfer (CT) has a central role inmany fundamental processes, such as those in biologicalsystems,1-3 as well as being a functional mechanism in variousareas of optoelectronics, such as solar cells,4,5 photoconductors6,7
and nonlinear optical devices.8 Of particular interest are materialsthat contain organometallic moieties, e.g., ferrocene (Fc), whichpossess desirable qualities because of their ability to exist indifferent stable oxidation and spin states,9 and the ability to tunetheir properties by a suitable choice of substituents.9-11 Severaldetailed studies exist on Fc-donor organic-acceptor metal-to-ligand charge transfer (MLCT) compounds in the context ofnonlinear materials, where the donor and the acceptor areconnected via conjugated bridges8,12,13 and both the highestoccupied molecular orbital (HOMO) and the lowest unoccupiedmolecular orbital (LUMO) are delocalized over the entirestructure. Although these studies have covered a large numberof various organic acceptors, as well as the use of other bridgingunits (e.g.,-CdN-14,15), there is still much scope for thedevelopment of new materials. Moreover, only very few studiesexist on the excited-state photophysics and relaxation of theMLCT states in Fc-donor organic-acceptor compounds,16,17
despite the fact that many interesting excited-state phenomenahave been observed in other organometallic CT compounds.18-22
In this paper, we present a study of novel organometallic CTcompounds that are composed of a Fc donor and multipleorganic (bipyridylboronium, B-bipy) acceptors, connected bybridging bonds between C atoms on the cyclopentadienyl (Cp)rings and the 4-coordinated B atom (see structures1-X, 2-X,and3-7 in Figure 1), which have previously been characterizedby NMR, electrochemical, and crystal structure analysis.23-25
The spontaneous formation of B-N bonds allows one to achievesophisticated target structures less readily accessible usingconventional organic methodologies. This approach has beensuccessfully applied in the synthesis ofansa-metallocenes26,27
and oligometallic complexes,28,29 which are related to theprototype monomers presented here. Because these compoundscan undergo reversible oxidation and multiple reduction steps,they potentially allow electronic switching of their (nonlinear)optical properties. We are interested in electronic interactionand optical excitation across the B-N bonds, especially in termsof their use as versatile linkers between electron donors andpolymers that exhibit strong electronic and magnetic correlationphenomena.30 The properties of B-N bonds when incorporatedinto molecular assemblies still are not fully understood, althoughthe basic properties of B-N bonds have attracted several recenttheoretical studies.31-35
* Author to whom correspondence should be addressed. E-mail ad-dress: [email protected].
3281J. Phys. Chem. A2004,108,3281-3291
10.1021/jp037044p CCC: $27.50 © 2004 American Chemical SocietyPublished on Web 03/19/2004

Here, we combine UV-Vis, spectroelectrochemical, andpicosecond transient absorption measurements with theoreticalcalculations, which confirm that the observed visible opticaltransition corresponds to a through-bond MLCT transitionbetween the Fc and B-bipy units. Comparison of the derivatives2-PF6, 5, and6 allows us to determine how the MLCT transitionand excited-state evolution are affected by certain structural andelectronic factors. For the compounds1-PF6 and2-PF6, NMRmeasurements23 indicate that the uncoupled acceptor groups arefree to rotate about the B-C(Cp) bridging bonds. In the caseof compounds5 and6, the CH3 groups at the B-sites have beenreplaced by an O atom that forms a bridge between the B atomsof each B-bipy acceptor group, such that the electronic environ-ment is relatively similar between the two compounds, asevidenced by cyclovoltammetry measurements.25 However,NMR measurements24,25 reveal that the rotational freedom ofthe B-C(Cp) bonds in theansa-form (5) is suppressed, whereasfor the diferrocene compound (6), this degree of freedom is stillretained. Electrochemical measurements for both derivatives5and624,25suggest a moderate amount of electronic communica-tion between the B-bipy groups across this bridge, so that thesecompounds allow the study of the effect of electronic couplingbetween acceptors on the CT states. A comparison of the two
compounds allows us to isolate the effect of structural rigidityof the bridging bonds between the donor and acceptor groups.
From the picosecond transient absorption measurements ofthe back-electron transfer (bET) dynamics for the derivatives2-PF6, 5, and 6, we find that the structural flexibility of thebridging bonds between the donor and the acceptor stronglyaffects the rate and mechanism for the bET. Specifically, in thecase of compound2-PF6, a significant fraction (∼45%) of theexcited ensemble relaxes directly back to the ground state witha time constant of 18 ps, whereas for compound5, the ground-state recovery occurs only on a much slower time scale(∼800 ps).
UV-Vis Absorption Spectra
Figure 2a shows the UV-Vis absorption spectra of1-Br andof ferrocene, 2,2′-bipyridine, and compound3 (all in CH3CN),for comparison. For1-Br, two dominant absorption bands canbe resolved: one is centered at 310 nm, and a broad visibleabsorption band with a peak near 500 nm is observed.Comparison with the spectra of 2,2′-bipyridine and3 showsthat this UV band at 310 nm corresponds to a modifiedπ-π*transition between states localized on the B-bipy substituent,with the absorption peak of1-Br and 3 red-shifted some 35nm (2900 cm-1), relative to 2,2′-bipyridine, because of themodification of theπ andπ* energy levels resulting from theincreased electronegativity of the boron-coordinated N atoms.
The origin of the broad visible band is attributed to anintramolecular MLCT transition from orbitals concentrated onthe Fc donor into those of the B-bipy acceptor, based on thefollowing observations. As shown in Figure 2b, the characterof the visible band is almost independent of the counteranion,and the absorption strength increases in proportion with thenumber of acceptor substituents (also confirmed for the case offour acceptor substituents,λmax ) 540 nm,εmax ) 1700 M-1
cm-1; see ref 23). Although this would be consistent with atransition localized on isolated B-bipy chromophores, this isruled out by the absence of any absorptive feature in the Visregion in the spectra of compound3. Moreover, previoussynthetic studies23 have shown that the visible transition is absentin compound4, where the C-C bond between the two pyridine
Figure 1. Ferrocene-donor bipyridylboronium-acceptor and controlcompounds under study here. (For compounds1-X and 2-X thecounteranion is X- ) PF6
-, or Br-. Note that, unless otherwisespecified, R) CH3 in the text.)
Figure 2. (a) UV-Vis absorption spectra of (s) 1-Br and isolatedfragment compounds, (- - -) ferrocene, (- - -) 2,2′-bipyridine, and(- ‚ -) 3 (in CH3CN). (b) Comparison ofn-X versus the number ofacceptor substituents (n ) 1.2 as indicated) and counteranionsX ) Br(solid) andX ) PF6
- (dashed).
3282 J. Phys. Chem. A, Vol. 108, No. 16, 2004 Thomson et al.

rings has been removed (which has the effect of stronglydegrading the electron-accepting quality of the substituentwithout posing any significant changes in the structural orelectronic environment seen by electronic states localized onthe Fc unit). This rules out the possibility that the transitiononly involves orbitals that are localized on the Fc unit.
Figure 3 shows the effect of solvent interaction on theabsorption spectra for1-Br, which shows a marked negativesolvatochromism in going from CH3CN to H2O (∆ν ) 780 cm-1
for 1-Br and∆ν ) 710 cm-1 for 2-Br). This behavior has beenobserved for CT transitions in similar cationic species,8,13
contrary to the typical positive solvatochromism of CT transi-tions in neutral species, and is to be expected, based on thefact that the ground state in these cationic species is actuallymore polar (and, hence, more strongly stabilized by polarsolvents) than the CT excited state. Moreover, the strength ofthe transition decreases as the solvent polarizability increases,which suggests that the solvent interaction causes a Stokes shiftbetween the ground state and the excited state, which affectsthe Franck-Condon factor for the transition. Given theseobservations, we also attribute the small red-shift of theabsorption band of compound2-X, relative to compound1-X(∆ν ) -349 cm-1 for X ) PF6
-), in Figure 2 to a reducedstabilization of the ground state in compound2-X, because ofthe reduction in polarity, which results from the symmetricpositions of the two acceptor groups.
To better resolve the MLCT band from the absorptiveshoulder on the blue side, we fit the low-energy portion of theband with a single Gaussian function,ε(ν),36 which, as shownin Figure 4, reproduces the resolvable portion of the bandexceptionally well, yielding a full width (at half-maximum) of∆νfwhm ) 6330 cm-1, and an estimate for the oscillator strengthof f ≈ 0.014.37 Subtracting this fitted Gaussian from the totalabsorption spectrum yields a physically acceptable residualabsorption profile (see Figure 4), which shows evidence foranother absorption band with an absorption maximum near 380nm that is partially resolvable from the onset of the 310-nmB-bipy UV absorption band. The fact that the low-energy portionof the MLCT band fits very closely to a single Gaussian functionsuggests that only a single electronic transition is involved,although the question arises as to the origin of the strong linebroadening (see below).
Figure 5 displays the absorption spectra for compounds2-PF6,5, and6 (in CH3CN), which all exhibit a similar MLCT band.As can be seen, the visible absorption band peaks of both
compound5 (λmax ) 532 nm) and compound6 (λmax ) 554nm) are red-shifted, relative to compound2-PF6 (∆ν ) -785cm-1 and∆ν ) -990 cm-1, respectively), which is indicativeof an increasing stabilization of the acceptor LUMO in thesecompounds, because of the aforementioned electronic com-munication between acceptors across the-O- bridge. We notethat the absorption band of a derivative of1-PF6 with R ) -OHis significantly less red-shifted (λmax ) 523 nm), which rulesout the possibility that the effect is purely due to the electron-withdrawing effects of the O atom. For compounds2-PF6 and6, the lower-energy side of the MLCT band is still very closelyGaussian, with fitted fwhm widths very similar to that of1-Br(∆νfwhm ) 6260 and 6240 cm-1 for compounds2-PF6 and6,respectively), whereas for the case of compound5, the fwhmis reduced by∼10%-15% (∆νfwhm ) 5500 cm-1) and slightdeviations from a Gaussian form are evident.
Three main mechanisms could be responsible for the broad,featureless MLCT band, which we discuss, in turn, in thefollowing.
(1) Given the significant rearrangement of the electroniccharge distribution upon excitation, a strong interaction between
Figure 3. MLCT absorption band for1-Br in various polar solvents((- - -) CH3CN, (- ‚ -) dimethylformamide (DMF), (s) H2O) dem-onstrating negative solvatochromism and decreasing absorption strengthwith solvent polarizability.
Figure 4. (- - -) Gaussian fit to MLCT band for (s) 1-Br (in CH3CN)and (- ‚ -) residual absorption. Inset uses a logarithmic vertical scale.
Figure 5. MLCT absorption spectra (solid lines) of (a)2-PF6, and theB-O-B bridged-acceptor compounds (b)5 and (c)6 (all in CH3CN)relevant to the electrochemistry and transient absorption measurements.Also shown are the single Gaussian curves fitted to (- - -) the low-energy side of the absorption band and (- ‚ -) the residual absorption.
B-N-Bridged Charge Transfer Compounds J. Phys. Chem. A, Vol. 108, No. 16, 20043283

the solute and the distribution of local polar solvent moleculescan lead to considerable line width broadening. To remove therole of polar solvation on the MLCT transition, we have alsoperformed measurements on thin polystyrene films that havebeen doped with compound7 (a close derivative of compound2-PF6, only with additional nonyl chains attached to the pyridinerings for improved solubility), which were drop-cast from atetrahydrofuran (THF) solution. The measured MLCT absorptionspectra are shown in Figure 6, both at room temperature (seeFigure 6a) and at 20 K (see Figure 6b). The MLCT absorptionband at 298 K is similar to that in solution, although somewhatblue-shifted (λmax ) 486 nm) and additionally broadened(∆νfwhm ) 7920 cm-1). Considering such modest changes uponswitching to the relatively nonpolar polymer environment, onecan rule out solvation as the key source of broadening. We alsonote that cooling the film to 20 K leads to only very smallchanges in the absorption spectrum (with the width of thespectrum actually increasing∼4%) and does not reveal anyresolvable structure. This suggests that the width of the spectrumis not associated with a thermal distribution of ground-statevibrational levels (at least for vibrational quanta>14 cm-1).
(2) In analogy tointermolecularCT between separate donorand acceptor molecules, a distribution of relative distances and/or orientations between the donor and the acceptor can resultin appreciable broadening in the transition energy.38,39This couldbe applicable for compounds1-X, 2-X, and 6, where theunhindered rotation about the B-C(Cp) bonds yields such aconformational distribution. However, this degree of freedomis strongly hindered for compound5 and, hence, is unlikely toaccount for the majority of broadening observed. To examinethis further, we have also performed absorption measurementson a thin crystalline sample of2-PF6 (Figure 6c), where allmolecules share the same fixed conformation. As can be seen,the MLCT band is even further blue-shifted and broadened(λmax ) 480 nm,∆νfwhm ) 8800 cm-1), ruling out the role ofa conformational distribution. Hence, we attribute the majorityof the line width to the final mechanism.
(3) A large displacement in the equilibria of certain modesbetween the ground and excited states results in a broad manifold
of closely spaced vibrational transitions with a Gaussianenvelope. Presumably, any residual structure is washed out byadditional broadening, because of rapid dephasing of the initialexcited state.40
Returning to Figure 5, we also note that, for compounds2-X,5, and6, the relative orientation (or distribution thereof) and,hence, through-space separation of the acceptor groups, relativeto the Fe core, vary significantly, whereas the through-bonddistances are relatively constant.23-25 The absorption characterand strength are comparable for these compounds, which leadsus to conclude that the MLCT is due to through-bond couplingbetween the donor and acceptor orbitals across the (Cp)C-B-Nnetwork, as opposed to through-space.
In terms of the relaxation of the MLCT excited states, wenote that no measurable luminescence in the range of 500-900 nm (i.e., a quantum efficiency of<0.05%) or photochem-istry was observed upon excitation of the MLCT band for allthe derivatives tested, which suggests that the relaxation occursthrough nonradiative photophysical pathways, which are ad-dressed in the section that presents the picosecond transientabsorption results.
Quantum Chemistry Calculations and ElectronicStructure
Gas-phase calculations were performed on the monocation1(with R ) H), to substantiate and better understand the originof the MLCT transition between the donor and the acceptor.Geometry optimizations were performed at the hybrid densityfunctional level of theory, using Becke’s three-parameterfunctional with the nonlocal correlation provided by the Perdew-86 equation (B3P86) in connection with the 6-31G(d) basis setfor carbon, boron, nitrogen, and hydrogen.41 For iron, the SDDpseudopotential was used, in combination with a DZP valencebasis set.42-44 This model has provided theoretical structuresfor ferrocene that are very close to those experimentallydetermined from gas-phase measurements.45 The UV-Vistransition energies were calculated with the time-dependent (TD)method,46 using a 6-31+G(d) basis set.
These density functional calculations predict a theoreticalstructure (see Figure 7) that is very close to the experimentallydetermined crystal structure for compound1-PF6.23 Even veryweak modes (for example, the conformation of the B-R bond,relative to the plane of the C5H5 ring of the ferrocenyl group)are reproduced by our computational model (i.e.,Θ(H1BC1C2)) 35° (theory), compared toΘ(MeBC1C2) ) 39.7° (experi-ment)23). This correspondence implies that certain distortionsof the structure of1-PF6 reported in ref 23 result because ofinternal molecular forces, as opposed to crystal packing forces.
Figure 6. MLCT absorption band and Gaussian fits for compound7in a drop-cast polystyrene film (∼10 µm thick) at (a) 298 K and (b) 20K (note that the modulation of the curves is due to multiple passinterference). (c) Corresponding absorption for the compound2-PF6
crystal sample.
Figure 7. Calculated gas-phase structure of compound1 (with R )H) (using B3P86/6-31G(d) for C, B, N, H and SDD for Fe). All bondlengths reported in picometers.
3284 J. Phys. Chem. A, Vol. 108, No. 16, 2004 Thomson et al.

An energy diagram of the calculated frontier orbitals (cal-culated at the B3P86/6-31+G(d) level) are shown in Figure 8,with selected orbitals being shown in Figure 9. The frontierorbitals can be divided into three groups: (i) relatively low-lying molecular orbitals with main contributions from thecyclopentadienyl substituent (HOMO[-3] and HOMO[-4]); (ii)metal-centered orbitals, essentially of nonbonding character,which are the highest occupied orbitals (HOMO[-2]-HO-MO[0]); and (iii) vacant orbitals of low energy (LUMO[0]-LUMO[+2]) that are centered on the bipyridine unit.
Transition energies and oscillator strengths from the TDcalculation are presented in Table 1. These results provideevidence that the lowest-energy optical transitions result fromexcitations from Fc-based occupied orbitals into unoccupiedorbitals located on the bipyridine unit. The predicted oscillatorstrengths are relatively small, most probably because of a small
spatial overlap between the donor and acceptor orbitals. Themost intense absorption, according to the calculations, resultsfrom excitations from the HOMO[-2], predominantly of Fe(dz2)character, into the LUMO[0]. This transition has a predictedoscillator strength off ) 0.0084 (which is of the same order ofmagnitude as the estimate of 0.014 that is extracted from theexperimental absorption spectra). Moreover, the fact that thetransition energy predicted from the gas-phase calculation(λmax ) 618 nm) is lower than the measured value in solutionis consistent with the negative solvatochromism reported in thelast section.
In addition to the model calculations for the monocation1(R ) H) discussed here, we also performed the correspondingground-state calculation for the dication (i.e., the same single-acceptor compound with one electron removed), to gain a betterunderstanding of the electronic changes to be expected uponelectrochemical oxidation of an electron from the Fc-centeredHOMO (discussed in the following sections). These resultsconfirm that electron removal strongly increases the bindingenergy of all molecular orbitals, with the frontier (Fc-centered)occupied molecular orbitals being more strongly stabilized thanthe B-Bipy-centered unoccupied MOs. This leads to an increasein the energy between the HOMO[-2] and LUMO[0] from 2.6eV for the monocation to 4.9 eV for the dication. Assumingthat the error due to approximating the optical transition energiesby HOMO/LUMO energy spacings is the same for the two redoxstates, this increase in energy suggests that the MLCT bandwould be blue-shifted some 2.3 eV, which corresponds to a peakwavelength of<300 nm (based on the experimental peak valuefor 1-Br in solution of∼500 nm).
Electrochemistry
Electrochemical measurements allow one to extract usefulcorrelations between the oxidized-donor and reduced-acceptorspecies (D+A and DA-) and those of a weakly coupled CTexcited state, which can often be well-represented as an excitedredox pair, (D+A-)*.47,48 By examining trends in the redoxpotentials versus the energy of the CT transitions for a set ofrelated compounds, one can estimate the degree of interactionbetween the relevant donor and acceptor molecular orbitals andreorganization energy upon CT,49 whereas UV-Vis spectro-electrochemistry data can provide details on the effect of CTon the frontier orbitals and suggest expected spectroscopicproperties of the excited MLCT state for comparison, e.g., withtransient excited-state absorption measurements.20 Generally, therange of compounds under study here readily undergo reversibleoxidation and reduction steps, allowing a relatively straightfor-ward interpretation of the redox measurements. From thesemeasurements, one can also gain insight into how the linearand nonlinear optical properties of the system (governed by theMLCT) may be reversibly switched by external electronicmeans.50,51
Figure 10a and b present typical cyclovoltammetry traces ofcompounds2-PF6 and5, respectively (reported previously23,24
but reprinted here for comparison). In both compounds, a singleone-electron (1-e-) oxidation peak is present, atE°′ox ) +0.43V (2-PF6) and+0.57 V (5) (denoted by “ox” in both graphs),which is derived from the removal of an electron centered onthe Fc unit (note thatE°′ox ) +0.49 V for ferrocene under thesame conditions), and testifies that the presence of the acceptorgroups attached to the Cp rings leads to only a small perturbationof the donor orbitals relevant to oxidation. At a negative cellpotential, compound2-PF6 exhibits two reduction waves(denoted “red,1” and “red,2”), each of which has been shown
Figure 8. Calculated energy diagram for the frontier orbitals ofcompound1 (R ) H).
Figure 9. Qualitative molecular orbital diagram for selected frontierorbitals consistent with MLCT transitions.
TABLE 1: Low-Energy Optical Transitions for 1 (R dH)and Corresponding Dominant Molecular Orbitals Predictedby the Time-Dependent Density Functional Theory(TD-DFT) Calculations
HOMO[m] LUMO[ n] Emax (eV) λmax (nm)oscillator strength,
f
0 0 1.17 1058 0.0006-1 0 1.21 1029 0.0028-2 0 2.01 618 0.0084
0 +1 2.08 598 0.0004-1 +1 2.11 589 0.0030
0 +2 2.26 548 0.0013-1 +2 2.28 544 0.0004-3/-4 0 2.49 499 0.0013-3/-4 0 2.52 492 0.0003
B-N-Bridged Charge Transfer Compounds J. Phys. Chem. A, Vol. 108, No. 16, 20043285
to involve the addition of two electrons (one electron peracceptor unit).23 In comparison with the cyclovoltammetry traceof compound 1-PF6 (which features two 1-e- reductionwaves),23 both reduction peaks are only slightly shifted andbroadened, because of the presence of the second acceptor unit(i.e., E°′red,1 ) -1.02 V for 1-PF6 and E°′red,1 ) -0.98 V for2-PF6), which implies only a weak interaction between theacceptor groups in compound2-PF6. In contrast, it is evidentin Figure 10b that, for compound5, the degeneracy betweenthe two electrons in each reduction step is lifted (e.g., for thefirst 2-e- reduction,E°′red,1a) -0.80 V, E°′red,1b ) -0.93 V),24
which indicates significant interaction between the acceptorunits. As mentioned previously, this interaction is most likelydue to a degree of through-bond communication across the-O-bridge, and the additional shift to less-negative potentials isconsistent with the red-shift seen in the UV absorption bandfor this compound.
To test the correspondence between the energy levels of theredox pairs and the observed CT bands, we plot the relevantredox potential data against the corresponding UV-Vis absorp-tion maxima of the MLCT bands in Figure 11 for compounds1-PF6, 2-PF6, 5, and 6. Figure 11a shows that the reductionpotential fits a linear trend fairly well (as shown); in this figure,the potential progresses to less-negative values (and, hence, theLUMO is increasingly stabilized) as the MLCT band transition
energy decreases, which is consistent with the hypothesis thatboth the first reduction and the MLCT transition involveLUMO[0]. In contrast, the oxidation potential (Figure 11b)shows only a weak correspondence with the MLCT transitionenergy. One possible explanation for this phenomenon refersto the predictions of the orbital calculations of the previoussection, where the results suggest that the observed MLCT bandresults not from the HOMO[0] located on the ferrocene, butrather between the HOMO[-2] and the LUMO[0] on theacceptor. Assuming that the observed oxidation (reduction)processes involve the removal (addition) of an electron from(into) the primary frontier orbitals (HOMO[0] and LUMO[0]),one should only expect a direct correlation of the CT transitionenergy with the observed reduction potentials.
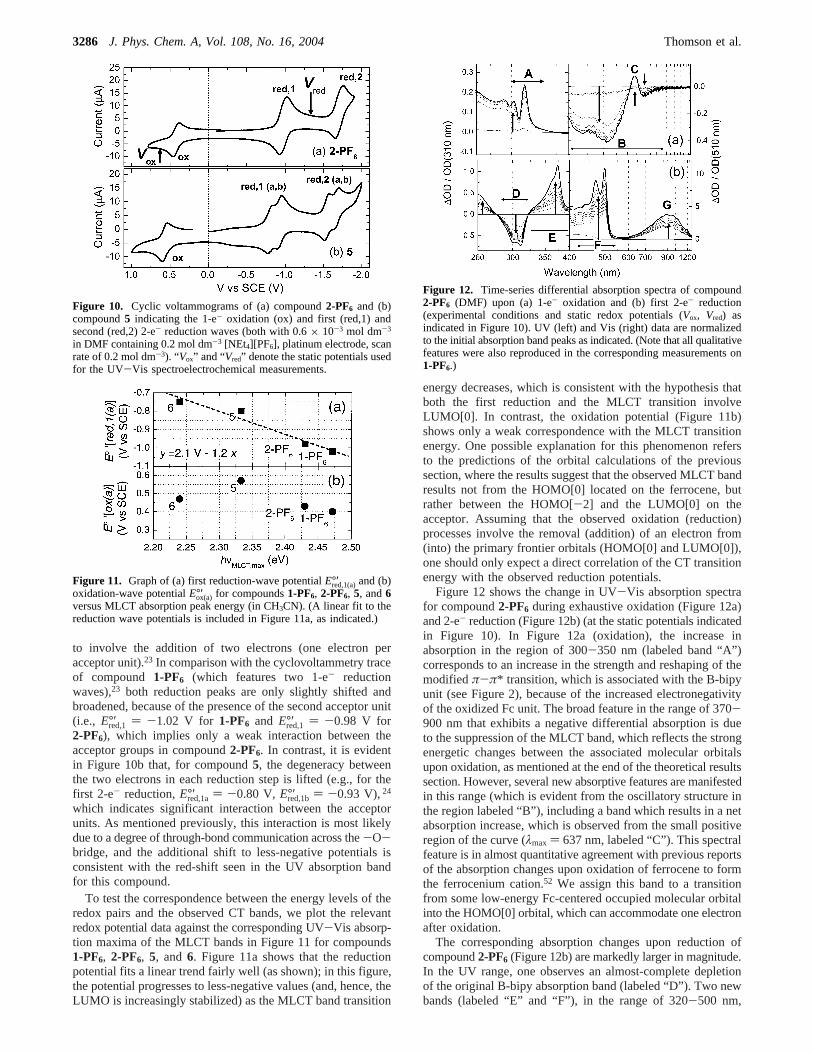
Figure 12 shows the change in UV-Vis absorption spectrafor compound2-PF6 during exhaustive oxidation (Figure 12a)and 2-e- reduction (Figure 12b) (at the static potentials indicatedin Figure 10). In Figure 12a (oxidation), the increase inabsorption in the region of 300-350 nm (labeled band “A”)corresponds to an increase in the strength and reshaping of themodifiedπ-π* transition, which is associated with the B-bipyunit (see Figure 2), because of the increased electronegativityof the oxidized Fc unit. The broad feature in the range of 370-900 nm that exhibits a negative differential absorption is dueto the suppression of the MLCT band, which reflects the strongenergetic changes between the associated molecular orbitalsupon oxidation, as mentioned at the end of the theoretical resultssection. However, several new absorptive features are manifestedin this range (which is evident from the oscillatory structure inthe region labeled “B”), including a band which results in a netabsorption increase, which is observed from the small positiveregion of the curve (λmax ) 637 nm, labeled “C”). This spectralfeature is in almost quantitative agreement with previous reportsof the absorption changes upon oxidation of ferrocene to formthe ferrocenium cation.52 We assign this band to a transitionfrom some low-energy Fc-centered occupied molecular orbitalinto the HOMO[0] orbital, which can accommodate one electronafter oxidation.
The corresponding absorption changes upon reduction ofcompound2-PF6 (Figure 12b) are markedly larger in magnitude.In the UV range, one observes an almost-complete depletionof the original B-bipy absorption band (labeled “D”). Two newbands (labeled “E” and “F”), in the range of 320-500 nm,
Figure 10. Cyclic voltammograms of (a) compound2-PF6 and (b)compound5 indicating the 1-e- oxidation (ox) and first (red,1) andsecond (red,2) 2-e- reduction waves (both with 0.6× 10⁻³ mol dm-3
in DMF containing 0.2 mol dm-3 [NEt4][PF6], platinum electrode, scanrate of 0.2 mol dm-3). “Vox” and “Vred” denote the static potentials usedfor the UV-Vis spectroelectrochemical measurements.
Figure 11. Graph of (a) first reduction-wave potentialE°′red,1(a)and (b)oxidation-wave potentialE°′ox(a) for compounds1-PF6, 2-PF6, 5, and6versus MLCT absorption peak energy (in CH3CN). (A linear fit to thereduction wave potentials is included in Figure 11a, as indicated.)
Figure 12. Time-series differential absorption spectra of compound2-PF6 (DMF) upon (a) 1-e- oxidation and (b) first 2-e- reduction(experimental conditions and static redox potentials (Vox, Vred) asindicated in Figure 10). UV (left) and Vis (right) data are normalizedto the initial absorption band peaks as indicated. (Note that all qualitativefeatures were also reproduced in the corresponding measurements on1-PF6.)
3286 J. Phys. Chem. A, Vol. 108, No. 16, 2004 Thomson et al.

appear: band E exhibits one clear maximum at 374 nm, whereasband F possesses a resolvable vibrational structure, with thefirst two lowest-energy peaks at 470 and 500 nm (∆ν ) 1260cm-1). These absorption bands have been reported53 for reduced[bipy-BR2]+ compounds (with aromatic or alicyclic substituentsattached to the 4-coordinated B atom); e.g., for compound3-PF6,the corresponding peak positions areλmax ) 378 nm (band E)and 463/494 nm (band F). However, ref 53 reported that, inthe case where electron-attracting O or F ligands are attachedto the B atom, band F is significantly blue-shifted (λmax ) 422/460 nm), whereas band E is relatively unaffected by the natureof the ligands. We will return briefly to this point in thefollowing section when interpreting the excited-state transientspectra. In the case of CT excitation (as opposed to solereduction of the acceptor), one would expect the Fc to becomemore electron-withdrawing and, hence, produce such a blue-shift of band F. The last feature is a broad Vis-NIR absorptionband (band “G”). This absorption band is unlikely to result fromCT transitions from Fc onto the acceptor, which should generallybe blue-shifted upon reduction of the acceptor. Hence, weattribute this new band to a transition localized on the reducedB-bipy units.
Several key results emerge from the electrochemistry datapresented here. The linear relationship between the peakabsorption energies and reduction potentials supports a MLCTtransition between the weakly coupled donor and acceptor,whereas the poor correlation with the oxidation potentials isconsistent with the theoretical prediction that the CT transitionoriginates from lower-lying occupied molecular orbitals. More-over, as will be shown in the next section, the UV-Visabsorption changes upon oxidation/reduction are in qualitativeagreement with the transient spectra and aid in the interpretationof the excited-state dynamics.
Transient Absorption Measurements
To understand the nonradiative relaxation dynamics of theMLCT state, we performed transient absorption measurements,using the femtosecond (fs) pump-probe technique. For theexcitation (pump) pulses, we used 30-fs pulses that were tunedto a center wavelength of 500 nm from a commercially obtainednoncollinear OPA (NOPA),54 which is pumped by a 1-kHz Ti:sapphire amplifier laser that produces 150-fs pulses with a centerwavelength of 775 nm (Clark-MXR CPA-2001). For thebroadband probe source, we used white-light continuumpulses55-57 that were generated by focusing a small fraction ofthe 775-nm light into a 3-mm-thick sapphire disk, producing ausable white-light spectrum from 450 nm to 770 nm. Tominimize temporal dispersion, an off-axis paraboloidal mirrorwith an effective focal length off ) 50 mm was used tocollimate the white-light probe beam. A second paraboloid(f ) 100 mm) was used to focus the noncollinear pump andprobe beams into the sample (a static 1-mm-thick cuvette,∼3.5 mM in CH3CN). This yielded an instrument response of∼100 fs (as determined from control measurements with arhodamine 6G sample, which was also used for determinationof the zero-delay position versus probe wavelength). In all thekinetic data presented, the temporal region about a zero delay,which exhibits a relatively strong coherent artifact (due tononlinear refraction that occurs in the cuvette and solvent58),has been removed. The pump-pulse energy used in theseexperiments was∼70 nJ. After the sample, the white-light probewas dispersed by a computer-controlled monochromator witha bandpass∼5 nm wide and was detected by a siliconphotodetector. A custom-built mechanical chopper was used
ahead of the sample to downsample the pump and probe pulsetrains to 333 and 500 Hz, respectively, which allows thedifferential transient absorption signal to be detected by a lock-in amplifier at the 166-Hz difference frequency (which alsorejected any uncontrolled stray pump light). Care was taken toensure that the shape of the measured signals was not dependenton the pump and probe fluences, and that the white-light probewas focused more tightly in the sample than the pump beam,to avoid measurement errors that are due to the radial spatialchirp of the white light.
Figure 13 shows the transient absorption spectra for com-pounds2-PF6 (Figure 13a) and5 (Figure 13b) (both in CH3CN),following excitation at 500 nm, for a set of selected delays inthe range of 1-1000 ps over the wavelength range of 450-770 nm, along with the relevant ground-state absorption andpump-pulse spectra in Figure 13c and the differential spectrathat results from electrochemical oxidation and reduction (Figure13d). Evident for both compounds is a negative-differentialabsorption band that extends from∼460 nm to 600 nm, wherethe saturation (bleach) of the MLCT absorption band dominates,whereas at wavelengths above a quasi-isosbestic point near 600nm, a region of dominant excited-state absorption (ESA) ispresent, which extends at least to the red edge of the measure-ment window at 770 nm. Comparison with Figure 13c indicatesthat, although the bleach band is no longer dominant atwavelengths of>600 nm, the strength of the ground-stateabsorption band at this wavelength is still∼50% of that of theabsorption maximum. Moreover, although the regions of bleachand ESA signals decay at clearly different rates for compound2-PF6 (discussed further below), the position of the zero-crossingof the transient spectra does not red-shift significantly with time.
Figure 13. Picosecond transient absorption spectra of (a) compound2-PF6 and (b) compound5 (λpump ) 500 nm,∼3.5 mM in CH3CN inboth cases) at selected pump-probe delays. (c) Ground-state absorptionand excitation spectra. (d) Differential spectra of compound2-PF6 uponelectrochemical oxidation and reduction.
B-N-Bridged Charge Transfer Compounds J. Phys. Chem. A, Vol. 108, No. 16, 20043287

One possible explanation is that the excitation at 500 nmaffects only a spectroscopically distinct portion of the ground-state molecules; i.e., hole burning of the ground-state absorptionbecause of an inhomogeneous broadening of the ensemble.59
However, given that no red-shifting of the bleach band isobserved over the full delay range, this would imply acharacteristic time scale for the broadening mechanism ofτ .1 ns. Although one could consider this for the case of compound2-PF6, where rotation about the B-C bonds between the donorand the acceptor might occur on such a time scale, this isunlikely to be the case for compound5, where the-O- bridgeshould enforce a much more rapid fluctuation in the relativeconformation of donor and acceptor.
Thus, to explain the reduced width of the bleach band, weare led to conclude that there are actually two distinct ESA bandsin the transient spectra of Figure 13: one band (ESA-I) that isdominant in the wavelength range of∼550-650 nm andsuppresses the bleach band in this region, and a second band(ESA-II) that dominates the signal in the wavelength range of>650 nm.
Concerning the origin of these ESA bands, it is interestingto consider certain features of the differential absorption spectraof compound2-PF6 upon oxidation and reduction (Figure 13d;refer to Figure 12 for the full spectral range). We note that,upon electrochemical oxidation of compound2-PF6, one alsodoes not observe a negative differential absorption of the sameshape as the ground-state absorption, mostly due to the fact thata new absorptive feature (labeled band C in Figure 12a) appears,which has a differential peak at 637 nm. Thus, we propose thatthe same transition is present in the transient spectra of Figure13, which we identify as the ESA-I band. Based on theassumption that a predominantly HOMO[-2] orbital is involvedin the CT transition, this implies that one electron in the higherHOMO[0] orbital relaxes rapidly into the HOMO[-2] vacancy,allowing the transition that corresponds to band C (whichcorresponds to a vacancy in the HOMO[0] orbital) to be active.The fact that the combined signal of the bleach and ESA-I band
does not change shape over the excited-state lifetime impliesthat the ESA-I band decays with the same kinetics as therecovery of the ground state. This is consistent with the assertionthat the transition is between electrons localized on the Fc unit.
Moreover, for the origin of the ESA-II band, we note that,upon reduction of the B-Bipy acceptors, a new absorption bandappears in the Vis-NIR region. Hence, we assign the presenceof the ESA-II band to the occupation of an initial excited stateof similar electronic character to that of the reduced species,which is consistent with the assertion that the orbitals occupiedby the excited electron are mostly localized on the B-bipy unit,as suggested by the calculated molecular orbitals. In referenceto the comment near the end of the last section, the absence ofthe absorptive feature in the range of∼450-500 nm that isobserved upon reduction (band F in Figure 12b) is not surprising,given that, in the excited state, the Fc unit is formally oxidizedand, hence, becomes more electron-withdrawing, such that thisband would be blue-shifted to the short-wavelength edge of themeasurement window. Interestingly, one observes some evi-dence for the onset of another ESA band at this edge in thetransient spectra.
To better quantify the relaxation dynamics, in Figure 14, wepresent the transient absorption kinetics for compounds2-PF6
(Figure 14a) and5 (Figure 14b) at three characteristic probewavelengths: (i)λprobe ) 470 nm (at the high-energy tail ofthe bleach band), (ii)λprobe ) 540 nm (on the low-energy sideof the bleach band), and (iii)λprobe ) 660 nm (ESA-II band).For both compounds, the kinetics exhibit three distinct timescales (<1 ps,∼5-20 ps, and∼800 ps), although the relativeweights of these components are dependent on the probewavelength. We fit the positive delay data using a multiexpo-nential fitting function,
with global values for the two longer time constantsτ2 andτ3,
Figure 14. Experimental pump-probe kinetics (points) and multiexponential fits (solid line) for (a) compound2-PF6 and (b) compound5 upon500-nm excitation at selected probe wavelengths: (i) 470 nm, (ii) 540 nm, and (iii) 660 nm.
∆A(t) ) ∑j)1
3
Aj exp(-t
τj)
3288 J. Phys. Chem. A, Vol. 108, No. 16, 2004 Thomson et al.

the results of which are listed in Table 2. To assess the relativeweight of each signal component, the amplitudes in Table 2are normalized by the combined amplitude of the two slowercomponents, i.e.,Aj f Aj/(|A2| + |A3|).
The kinetics forλprobe ) 540 nm represent the ground-staterecovery of the excited ensemble, which, in both compounds,is essentially complete after 1 ns. For compound2-PF6, the fitrequired an almost 1:1 (0.45:0.55) combination of both arelatively fast picosecond component and a nanosecond com-ponent (τ2 ) 17.8 ps,τ3 ) 810 ps), whereas for compound5,the ground-state recovery is essentially monoexponential (τ3 )774 ps), with the inclusion of a small additional femtoseconddecay component (τ1 ) 1.3 ps).
In contrast to the 540-nm data, this femtosecond componentis present as a relatively larger and positive absorption signalfor both compounds and bothλprobe) 470 nm andλprobe) 660nm, with time constants in the range of 0.4-1.1 ps. From controlmeasurements of pure solvents, it is unlikely that these femto-second transients occur because of pure solvent artifacts,especially given the fact that they are of almost-negligibleamplitude specifically in the region of the bleach band(λprobe ) 540 nm). Instead, we attribute these transients toultrafast intramolecular rearrangement and solvation of the initialexcited state, which are typically observed on this time scale.60,61
For λprobe ) 470 nm, after the initial femtosecond-inducedabsorption, the kinetics for compound2-PF6 are similar to thatof the 540-nm curve, with very similar relative weights for theτ2 and τ3 components (0.46:0.54) as for the 540-nm kinetics.The data for compound5 at 470 nm are also similar to thoseobtained at 540 nm, except that an additional picosecondtransient (τ2 ) 4.6 ps) is present, which indicates the onset ofother spectral features at the blue edge of the bleach band. Moststriking of all is the comparison of the ESA-II signals (λprobe)660 nm) between the two compounds. In the case of compound2-PF6, no signal component on the 810-ps ground-state recoverytime scale is observed, and the signal decays completely withthe 17.8-ps time constant. In contrast, a majority (0.55) of theESA-II signal for compound5 persists on the longer 774-pstime scale. These differences in the decay of the ESA-II signaland the ground-state recovery for both compounds implies theinvolvement of at least one intermediate electronic state in therelaxation pathway of both compounds (which is essentially“dark” in the probe wavelength range used here), or at least ashift of the reaction coordinates of the excited state away fromthe Franck-Condon region, where the ESA-II transition isallowed.
To understand the factors leading to these differences, wealso measured the kinetics for compound6 for λprobe ) 660nm, which is displayed in Figure 15 (with the multiexponentialfit data included in Table 2). As is evident, the decay of theESA-II signal for compound6 is very similar to that ofcompound2-PF6 (and not5), in that after an initial femtosecondrelaxation, the ESA-II signal decays completely with a timeconstant ofτ2 ) 31.2 ps, albeit some∼10 ps slower than thatobserved for compound2-PF6. As mentioned previously, theinclusion of compound6 in the comparison allows one todistinguish characteristic effects that result from the-O- bridgeat boron from the structural rigidity of the compounds. Giventhat the initial excited state is vacated on the same time scalein compounds2-PF6 and6, this leads us to conclude that thisrelaxation mechanism relies more on the structural flexibilityof the bridging bonds between the donor and the acceptor, whichpermits the excited state to reach a conformation where eitheran internal conversion is allowed (possibly involving a through-space bET) or where the Franck-Condon factor for the ESA-II transition becomes negligible. The fact that there is asignificant component (0.45) in the ground-state recovery forcompound2-PF6 on the same 17.8-ps time scale as the decayof the ESA-II signal implies that this portion of the excitedmolecules decays directly back to the ground state. Theremaining fraction of the ensemble branches into an intermediatestate with the far-slower (810-ps) ground-state recovery, pre-sumably because of the involvement of additional active modes.These conclusions are summarized in the simplified energydiagram in Figure 16a.
For the case of compound5, the appreciable component ofdecay in the 470-nm and 660-nm kinetics at 4.6 ps, which isabsent in the 540-nm data (which has a monoexponential decayof 774 ps), implies that the ground-state recovery of compound5 from the initial excited and intermediate states proceeds viaa similar pathway. However, if this 4.6-ps relaxation mechanismwas available to the entire excited ensemble, one would observea complete decay of the ESA-II signal on the same time scale.We rationalize this by proposing that this fast relaxation pathwayis only energetically available to a fraction of the compoundsthat have sufficient net excess energy to overcome a barrierbetween the initial excited and intermediate state (Figure 16b),
TABLE 2: Parameters from the Multiexponential Fits of theTransient Absorption Kinetics of Compounds 2-PF6 and 5(Shown in Figure 14) and Compound 6 (Shown in Figure15)a
compound τ1 (ps) A1b τ2 (ps) A2 τ3 (ps) A3
λprobe) 470 nm2-PF6 0.80 (0.03) +4.4 17.8 (1.3) -0.46 810 (33) -0.545 0.46 (0.02) +5.1 4.6 (1.3) -0.31 774 (19) -0.69
λprobe) 540 nm2-PF6 17.8 (1.3) -0.45 810 (33) -0.555 1.13 (0.25) -0.47 774 (19) -1
λprobe) 660 nm2-PF6 0.56 (0.07) +2.5 17.8 (1.3) +15 0.41 (0.06) +2.9 4.6 (1.3) +0.45 774 (19) +0.556 0.61 (0.04) +3.3 31.2 (2.4) +1
a Standard errors given in parentheses. Subscripts denote the timescale in increasing order. Missing values indicate that the additionalcomponent did not assist significantly in the fitting of the data.b Allamplitudes are normalized by|A2| + |A3|.
Figure 15. Transient absorption kinetics forλ ) 660 nm (ESA) forcompound6, with multiexponential fit (solid line).
Figure 16. Simplified Jablonksi diagrams for the relaxation of theMLCT states for (a) compound2-PF6 and (b) compound5.
B-N-Bridged Charge Transfer Compounds J. Phys. Chem. A, Vol. 108, No. 16, 20043289

possibly because of the relatively large bandwidth of theexcitation pulse.
Conclusion
We have provided an experimental basis to confirm and betterunderstand the origin of metal-to-ligand charge transfer (MLCT)transitions between donor and acceptor groups that incorporateB-N architecture. A comparison of the UV-Vis spectra forvarious derivatives and theoretical calculation provides strongevidence that the visible absorption band of the ferrocene-bipyridylboronium (Fc-B-Bipy) compounds studied here resultfrom a direct MLCT transition from Fc-centered orbitals intothose of the B-Bipy unit. The electrochemistry data show thatthe redox properties of the donor and the acceptor are onlymoderately perturbed from those of the isolated compounds,which is consistent with the localized nature of the theoreticallycalculated molecular orbitals, while the reduction potential ofthe acceptor has been shown to correlate with the MLCTtransition energy. The correspondence between the UV-Visspectra upon oxidation/reduction with the excited-state transientabsorption spectra also reflect that the initial excited state isqualitatively similar to a superposition of an oxidized-donor anda reduced-acceptor. Of key interest is the effect of structuralrigidity in the bridging bonds between the donor and theacceptor, which has been demonstrated to effect the rate andmechanism of the back-electron transfer (bET) strongly. In thecase where the acceptor group is free to rotate, relative to thedonor (e.g., compound2), the initially excited state decays onan∼18-ps time scale, with a significant portion of the ensemblereturning directly to the ground state. In the case where thisdegree of freedom is hindered (compound5), the entire ground-state recovery occurs on an∼800 ps time scale.
These results will greatly facilitate the rational design ofmacromolecular assemblies that use these building blocks toachieve efficient charge transfer for applications such as chargeinjectors for molecular electronics and nonlinear optics. Thepotential for reversible switching between multiple stable redoxstates, where the MLCT transition can be present or suppressed,allows the possibility for external electronic control of the linearand nonlinear optical properties of these compounds. Theimportant role of structural factors that affect the bET mecha-nisms motivates the design of more-rigid systems, to enhancethe excited-state lifetime and allow for improved performancein applications based on optically induced charge injection andmolecular-based memory storage.
Acknowledgment. The authors gratefully acknowledgefunding of this research program by the Deutsche For-schungsgemeinschaft via Forschergruppe 412, “Spin-undLadungskorrelationen in Niedrigdimensionalen Metallorgani-schen Festko¨rpern. P. Z. acknowledges the financial support ofthe University of Siena (PAR 2003).
References and Notes
(1) Huppman, P.; Arlt, T.; Penzkofer, H.; Schmidt, S.; Bibikova, M.;Dohse, B.; Oesterhelt, D.; Wachtveitl, J.; Zinth, Z.Biophys. J.2002, 82,3186.
(2) Book, L.; Ostafin, A.; Ponomarenko, N.; Norris, J.; Sherer, N.J.Phys. Chem. A2000, 104, 8295.
(3) Walker, G.; Maiti, S.; Cowen, B.; Moser, C.; Dutton, P.; Hoch-strasser, R.J. Phys. Chem.1994, 98, 5778.
(4) Shaheen, S.; Brabec, C.; Sariciftci, N.; Padinger, F.; Fromherz, T.;Hummelen, J.Appl. Phys. Lett.2001, 78, 841.
(5) Parisi, J.; Dyakonov, V.; Pientka, M.; Riedel, I.; Deibel, C.; Brabec,C.; Sariciftci, N.; Hummelen, J.Z. Naturforsch. A: Phys. Sci.2002, 57a,995.
(6) Tan, L.; Curtis, M.; Francis, A.Macromolecules2002, 35, 4628.
(7) Samok, M.; Williams, D.J. Chem. Phys.1983, 78, 1924.(8) Barlow, S.; Bunting, H.; Ringham, C.; Green, J.; Bublitz, G.; Boxer,
S.; Perry, J.; Marder, S.J. Am. Chem. Soc.1999, 121, 3715.(9) Togni, A., Hayashi, T., Eds.Ferrocenes; VCH Verlagsgesell-
schaft: Weinheim, Germany, 1995.(10) Yang, E.; Chan, M.; Wahl, A.J. Phys. Chem.1980, 84, 3094.(11) Thiel, W.; Priermeier, T.; Fiedler, D.; Bond, A.; Mattner, M.J.
Organomet. Chem.1996, 514, 137.(12) Calabrese, J.; Cheng, L.; Green, J.; Marder, S.; Tam, W.J. Am.
Chem. Soc.1991, 113, 7227.(13) Alain, V.; Fort, A.; Barzoukas, M.; Chen, C.; Blanchard-Desce,
M.; Marder, S.; Perry, J.Inorg. Chim. Acta1996, 242, 43.(14) Pal, S.; Krishnan, A.; Das, P.; Samuelson, A.J. Organomet. Chem.
2000, 604, 248.(15) Krishnan, A.; Pal, S.; Nandakumar, P.; Samuelson, A.; Das, P.
Chem. Phys.2001, 265, 313.(16) Gilch, P.; Po¨llinger-Dammer, F.; Musewald, C.; Michel-Beyerle,
M.; Steiner, U.Science1998, 281, 982.(17) Baigar, E.; Gilch, P.; Zinth, W.; Sto¨ckl, M.; Harter, P.; von
Feilitzsch, T.; Michel-Beyerle, M.Chem. Phys. Lett.2002, 352, 176.(18) Ruthkosky, M.; Kelly, C.; Zaros, M.; Meyer, G.J. Am. Chem. Soc.
1997, 119, 12004.(19) Abbott, L.; Arnold, C.; Ye, T.; Gordon, K.; Perutz, R.; Hester, R.;
Moore, J.J. Phys. Chem. A1998, 102, 1252.(20) Damrauer, N.; McCusker, J.J. Phys. Chem. A1999, 103, 8440.(21) Yeh, A.; Shank, C.; McCusker, J.Science2000, 289, 935.(22) Tyson, D.; Luman, C.; Zhou, X.; Castellano, F.Inorg. Chem.2001,
40, 4063.(23) Fabrizi de Biani, F.; Gmeinwieser, T.; Herdtweck, E.; Ja¨kle, F.;
Laschi, F.; Wagner, M.Organometallics1997, 16, 4776.(24) Ding, L.; Ma, K.; Fabrizi de Biani, F.; Bolte, M.; Zanello, P.;
Wagner, M.Organometallics2001, 20, 1041.(25) Ma, K.; Fabrizi de Biani, F.; Bolte, M.; Zanello, P.; Wagner, M.
Organometallics2002, 21, 3979.(26) Jakle, F.; Mattner, M.; Preiermeier, T.; Wagner, M.J. Organomet.
Chem.1995, 502, 123.(27) Herdtwerk, E.; Ja¨kle, F.; Opromolla, G.; Spiegler, M.; Wagner, M.;
Zanello, P.Organometallics1996, 15, 5524.(28) Jakle, F.; Priermeier, T.; Wagner, M.Chem. Ber.1995, 128, 1163.(29) Fabrizi de Biani, F.; Ja¨kle, F.; Spiegler, M.; Wagner, M.; Zanello,
P. Inorg. Chem.1997, 36, 2103.(30) Thomson, M.; Roskos, H.; Wagner, M.Appl. Phys. A2004, 78,
477.(31) Hirao, H.; Fujimoto, H.J. Phys. Chem. A2000, 104, 6649.(32) Fiacco, D.; Leopold, K.J. Phys. Chem. A2003, 107, 2808.(33) Anane, H.; Boutalib, A.; Toma´s, F.J. Phys. Chem. A1997, 101,
7879.(34) Anane, H.; Boutalib, A.; Nebot-Gil, I.; Toma´s, F.J. Phys. Chem.
A 1998, 102, 7070.(35) Anane, H.; Boutalib, A.; Nebot-Gil, I.; Toma´s, F.Chem. Phys. Lett.
1998, 287, 575.(36) ε(ν) ) εmax exp[-4 ln 2(ν - ν0)2/∆νfwhm
2 .(37) Using f ≈ 4.32 × 10⁻⁹∫ε(ν) dν, e.g., the relationship from
Klessinger, M.; Michl, J.Excited States and Photochemistry of OrganicMolecules; VCH Publishers: New York, 1995.
(38) Turro, N.Modern Molecular Photochemistry; University ScienceBooks: Mill Valley, CA, 1991.
(39) Birks, J.Photophysics of Aromatic Molecules; Wiley: New York,1970.
(40) Nagasawa, Y.; Passino, S.; Joo, T.; Fleming, G.J. Chem. Phys.1997, 106, 4840.
(41) All calculations were performed with Gaussian 98, Revisions A3-A9, Gaussian, Inc., Pittsburgh, PA, 1999.
(42) Becke, A.J. Chem. Phys.1993, 98, 5648.(43) Perdew, J.Phys. ReV. B 1986, 33, 8822.(44) Fuentealba, P.; von Szentpaly, L.; Preuss, H.; Stoll, H.J. Phys. B
1985, 18, 1287.(45) Using the method described for the isolated ferrocene molecule,
we obtainedr(CC) ) 142.2 pm andr(Fe-C) ) 204.9 pm), as compared tothe experimentally determined gas-phase values ofr(CC) ) 143.1 pm andr(Fe-C) ) 205.8 pm (from Bohn, R.; Haaland, A.J. Organomet. Chem.1966, 5, 470).
(46) Burke. K., Gross, E., Joubert, D., Eds.Lecture Notes in Physics;Springer: Heidelberg, 1998; Vol. 500.
(47) Seneviratne, D.; Uddin, J.; Swayambunathan, V.; Schlegel, H.;Endicott, J.Inorg. Chem.2002, 41, 1502.
(48) Gilch, P.; Po¨llinger-Dammer, F.; Steiner, U.; Michel-Beyerle, M.Chem. Phys. Lett.1997, 275, 339.
(49) Daub, J.; Engl, R.; Kurzawa, J.; Miller, S.; Schneider, S.; Stock-mann, A.; Wasielewski, M.J. Phys. Chem. A2001, 105, 5655.
(50) Zhu, Y.; Wolf, M. J. Am. Chem. Soc.2000, 122, 10121.(51) Malaun, M.; Reeves, Z.; Paul, R.; Jeffery, J.; McCleverty, J.; Ward,
M.; Asselberghs, I.; Clays, K.; Persoons, A.Chem. Commun.2001, 49.
3290 J. Phys. Chem. A, Vol. 108, No. 16, 2004 Thomson et al.

(52) Thander, A.; Mallik, B.Proc. Indian Acad. Sci. (Chem. Sci.)2000,112, 475.
(53) Hunig, S.; Wehner, I.Heterocycles1989, 28, 359.(54) Riedle, E.; Beutter, M.; Lochbrunner, S.; Piel, J.; Schenkl, S.;
Sporlein, S.; Zinth, W.Appl. Phys. B2000, 71, 457.(55) Fork, R.; Shank, C.; Hirlimann, C.; Yen, R.; Tomlinson, W.Opt.
Lett. 1983, 8, 1.(56) Reed, M.; Steiner-Shepard, M.; Armas, M.; Negus, D.J. Opt. Soc.
Am. B1995, 12, 2229.
(57) Huber, R.; Satzger, H.; Zinth, W.; Wachtveitl, J.Opt. Commun.2001, 194, 443.
(58) Ekvall, K.; van der Meulen, P.; Dhollande, C.; Berg, L.; Pommeret,S.; Naskrecki, R.; Mialocq, J.J. Appl. Phys.2000, 87, 2340.
(59) Brito Cruz, C.; Fork, R.; Knox, W.; Shank, C.Chem. Phys. Lett.1986, 132, 341.
(60) Fleming, G.; Cho, M.Annu. ReV. Chem.1996, 47, 109.(61) Kahlow, M.; Jarzeba, W.; Kang, T.; Barbara, P.J. Chem. Phys.
1989, 90, 151.
B-N-Bridged Charge Transfer Compounds J. Phys. Chem. A, Vol. 108, No. 16, 20043291
Copyright © 2022 FDOKUMEN


![Colorimetric Detection of Cu[II] Cation and Acetate, Benzoate, and Cyanide Anions by Cooperative Receptor Binding in New α,α‘-Bis-substituted Donor−Acceptor Ferrocene Sensors](https://static.fdokumen.com/doc/165x107/6316233c511772fe4510af34/colorimetric-detection-of-cuii-cation-and-acetate-benzoate-and-cyanide-anions.jpg)