Spatial distribution of Africanized honey bees in an urban landscape
Upload
khangminh22Category
view
0download
0
University of Alberta
The Influence of Landscape Structure on the Distribution of the Nonh American Red Squirrel. Tnmicrscir~nrs hrrdsoriic~ts. in a Heterogeneous Boreal Mosaic
Jason Thomas Fisher 0
A thesis submitted to the Friculty of Graduate Studies and Reseiirch in partiai fulfilment
of the requirements for the degree of Master of Science
in Environmental Biology and Ecology
Department of Biological Sciences
Edmonton, Alberta
Fall, 1999

National Library I*I of Canada Bibliothèque nationale du Canada
Acquisitions and Acquisitions et Bibliographic Services services bibliographiques
395 Wellington Street 395, nie Wellington Ottawa ON KI A ON4 OnawaON K1AON4 Canada Canada
The author has granted a non- exclusive licence dowing the National Library of Canada to reproduce, loan, distribute or sel copies of this thesis in microform, paper or electronic formats.
The author retains ownership of the copyright in this thesis. Neither the thesis nor substantial extracts fiom it may be printed or othewise reproduced without the author's permission.
L'auteur a accordé une licence non exclusive permettant à la Bibliothèque nationale du Canada de reproduire, prêter, distribuer ou vendre des copies de cette thèse sous la forme de micmfïche/fïlm, de reproduction sur papier ou sur format électronique.
L'auteur conserve la propriété du droit d'auteur qui protège cette thèse. Ni la thèse ni des extraits substantiels de celle-ci ne doivent être imprimés ou autrement reproduits sans son autonsation.

ABSTRACT
This study was conducted to determine whether naturally derived landscape
structure could predict animal distribution. The presence / absence of the red squirrel, a
conifer speciÿlist. was censused in three areas in the mixed-wood boreal forest of
northem Alberta: a Reference area, a Bumed area, and a Managed Area. Landscape
structure assessed at multiple spatial scales was a significant prediçtor of squirrel
presence. The significant variables changed with spatial scale and betwren the Bumed.
Reference. and ~Managed areas. Landscape structure was still significant when local
vegetation was accounted for: it significantly predicted squirrel presence at sites where
conifer trees were abundant but did not where conifer was scarce. The results show that
relationships between landscape structure and animai abundance can be dependent on
scale of quantification. yeru. local vegetation, and area. Extrapolation of landscape effects
from one area to another may not br possible without an understanding of the underlying
mechanisrns.

ACKNO WLEDGEMENTS
My supervisor, Stan Boutin. was the catalyst that pemitted this reaction to occur.
1 thank him for teaching me that not everything is as it seems. and that interpretation is a
pemanently open door. Susan Hannon provided the squirrel data that saved me from a
calamitous field season in 1997, and her expertise in conducting landscape-level research
in the tangled domain of the boreal forest. John Addicott and Fiona Schmieeelow
provided üdvice and reviews. Cindy McCallum and Tim Martin were instrumental in
completing the GIS work. Stan Boutin. Susan Hannon, Richard Moses. Jens Roland, Phi1
Taylor, and Marc-André Villard were responsible for sampling design and project
construction. The Department of Biological Sciences at the U of A provided financial and
logistical support. and more irnportantly, a fertile resrtirch environment. KD. hot dogs.
and beer were provided by a Natural Sciences and Engineering Research Council PGSA.
a Province of Alberta Graduate Scholarship. and a Biological Sciences Teaching
Assistantship. The research was funded by the Sustainable Forest Management Network
under the Landscape Structure and Biodiversity Project, and by the Canadian
Circurnpolar Institutr. Crissy Corkum, Jrff Hoyt. the 1 1 th tloor crrw. and the Stün Clan
generously contnbuted ideas. Ainsley Sykes helped in more ways than 1 can count.
Juanita Constible, my "girl in the field, made Owl River n sweet place to be. Stephen
Peterson and Mandrew Hamilton were great help there too. Mike Kroetsch was my left
arm and sometimes my right, and 1 thank him for being the best research piurner a guy
could hope for. Special thanks go to the 'Sanity 5-oh': Matt Wheat!ey. Carrie Mrlanson.
Shem Fownes, and Chris Schmidt provided sage wisdom. tnie friendship. and crazy good
times. Most of al1 I thank Tom, Jean, and Tobi JO Fisher for steering me through the
labyrinth, and Vashti Thornpson for ail her love. This one's for you!

TABLE OF CONTENTS Page
Chapter One . The Rationale for Natural Landscape Research .............................................................................................. 1 . 0 Introduction 1
1.1 Methods 1 . 1 . 1 S tudy area ................................................................................. 8 1.1.2 Sampiing design ........................................................................ 8
........................................................................................ 1.2 Literature Cited 1 1
Chapter Two . Using Foraging Range to Demarcate a Functionai Landscape 2.0 htroduction .............................................................................................. 16 2.1 Methods
2.1.1 Squirrel locations ................................................................... 19 2.1.2 Home range analysis ................................................................. 20
2.2 Results ..................................................... 2.2.1 Squirrel foraging range sizes 21
73 2.2.2 Squirrel use of stand types ..................................................... -- 2.3 Discussion
2.3.1 Assessment of accuracy and the 100% MCP ............................ 24 2.3.2 Spatial scale of landscape anaiysis ............................................ 25
.................................................... 2.3.3 Cornparison to other systerns 26 2.3.4 Territories and time frame ....................................................... 27 2.3.5 Matrix use by squirrels .............................................................. 28
2.4 Conclusions ............... ... .... .., ..................................................................... 29 2.5 Literature Cited ....................................................................................... 30
Chapter Three . Squirrel Responsr to Landscape Srructure at Mut t i plct Spatial Sctiles . .............................................................................................. 3.0 introduction 34
3.1 Methods 3.1 . 1 Squirrel presence ....................................................................... 38 3.1.2 Landscape classification ........................................................... 38 3.1.3 Areal composition ..................................................................... 42 . . ............................................................. 3.1.4 Landscape composition 42 3.1.5 Landscape configuration: Heterogeneity .................................. 43 3.1.6 Statistical analysis ..................................................................... 43
3.2 Results ......................................................... 3.2.1 The upland/Iowland grain 46
3.2.2 Forest cover: Composition of the study areas ........................... 46 3.2.3 Goodness of fit of the logistic mode1 ........................................ 50 3.2.4 Landscape structure and squirrel presence ............................ -50
3.3 Discussion .................................................... 3.3.1 The explanatory spatial scale 56
3.3.2 Explanatory variables differ between areas and scales ............. 58 ........................................................ 3.3.3 Differences between yeas 61 . . ........................................................ 3 .3.4 Management implications 6 2

............................................................................................. 3.4 Conclusions 63 3.5 Literature Cited ................................................................................. 64
Chapter Four . The Influence of Local Vegetation on Squirrel Response to Landscape Structure .
4.0 Introduction ............................................................................................ 69 4.1 Methods
4.1.1 Vegetation sampling ............................................................. 72 4.1.2 Building a forced logistic model ........................................... 73 4.1.3 Splitting the squirrel dataset ................................................. 73
4.2 Results 4.2.1 The forced mode1 .................................................................... 74 4.2.2 The split squirrel dataset ......................................................... 76
4.3 Discussion 43.1 The relative importance of habitat beyond the focal patch ...... 79 4.3.2 Two different responses to landscapr stnicture ....................... 82
............................................................................................. 4.4 Cor.clusions 84 ....................................................................................... 4.5 Literature Cited 85
Chapter Five . The Protean Nature of Landscape Effects . ............................................................................................ 5.0 Conclusions 58
............................................................. ................... 5.1 Literature Cited .. 93
............................................... Appendix 1 : The fit of the logistic regression modrl 95
Appendix 2: Output of logistic regression models (landscape only) ....................... 96
Appendix 3: Output of logistic regression models that include local vegetation ..... 97
Appendix 4: Output of logistic regression models using conifer-abundant si tes ...... 100

LIST OF TABLES Page
. . Table 2.1: Red squirrel foraging range statistics ...................................................... 73
Table 2.2: Relative sizes of squirrel foraging ranges (ha) with differing ................................................................................... conifer content 23
Table 3.1 : Reclassification protocol applied to Alberta Vegetation Index forest inventory maps to produce the landscape composition variables used in analysis ................................................................... 40
Table 3.2: FRAGSTATS landscape configuration variables chosen for use in analysis ................................................................................... 45

UST OF FIGURES Page
............................... Figure 1.1 : Location and design of the sampling system 10
............................. Figure 3.1. Landscape composition of the Managed Grid 47
................................ Figure 3.2. Landscape composition of the Burned Grid 48
Figure 3.3 : Landscape composition of the Reference Grid ............................ 49
Figure 3.4. 3.5. 3.6 : The deviance explained by multiple logistic regrrssion models in which squirrel presence was regressed against landscape structural variables .
Figure 3 . 4 ~ Managed Mega Grid 1996 .......................................... 52 Figure 3.4b. Managed Mega Grid 1997 ............................................. 52 Figure 3 . 5 ~ Managed Meso Gnd 1996 ............................................. 53
....................................... Figure 3.5b. Managed Meso Grid 1997 5 3 ..................................................... Figure 3 . 6 ~ Reference Mega Grid 54 ..................................................... Figure 3.6b. Reference Meso Grid 54
......................................................... Figure 3 . 7 ~ Bumed Mega Grid 55
......................................................... Figure 3.7b. Burned Meso Grid 55
Figure 4.1 : The relative effects of local vegetation and landscape structure .
............................................. Figure 4.1 a: Managed Mega Grid 1997 75 ........................................... . Figure 4 I b: Reference Mega Grid 1997 75
Figure 4.2: The influence of landscape structure at conifer-abundant sites .
............................................. Figure 1 . 2 ~ Managed Mega Grid 1997 78 ........................................... Figure 4.2b. Reference Mega Grid 1997 78

Chapter One --
The Rationale for Natural Landscape Research
1.0 INTRODUCTION
The patch has been the nucleus of ecological study. A patch - a relatively discrete.
homogeneous unit of simiiar intemal habitat and microclimatic attributes (Kotliar and
Wiens, 1990) - h a characteristics that influence population dynamics or individual
behaviour, the net result of which are to impede or facilitate its occupation by an animal
species. Typically patch characteristics are referred to by the nebulous epithet "habitat"
(Southwood. 1977). As a dictate of rigorous scientific design. habitat is controlled for and
then ignored in most ecological experiments. Those that deal with the explicit influence
of habitat in rnaintaining animal populations have focused on patches with one or two
disparate intrinsic characteristics and related these to organisms' survival, fecundity, or
behaviour (see Wiens. 1976 for review). However. it is intuitively obvious that a patch
must be influenced by its surroundings: i t follows that population processes w i thin that
patch must also be irnpacted by these surroundings. The milieu in which a patch exists
has been referred to a s a landscape.
If the definition of habitat is vague then that of the landscape can only be
described as amorphous. Urban et al. (1987) define a landscape as a "mosaic of
heterogeneous land f'onns. vegetation types. and land uses". Turner ( 1989) designates a
landscape as any spatially heterogeneous area typicaily several hectares to several square
kilometres in size. Dunning et al. ( 1992) describe i t as the rnosaic of patches in which the

focal patch of intrrest is ensconced. They acknowledge that the Iandscape is species-
speci fic; that is. responses to landscapr rlemrnts occur somew hcre between an
organisms' home range and its regional distribution. This organism-centric landscüpe is
sirnilar to the "ecoiogical neighbourhood" of Addicott et al. (1987). the size of which is
bounded by the spatial and temporal extent of a particular process. With the intent of
simplicity. I will define a landscape as rhr üren siirroiinding a focal piitçh. within 11
circuliir boundary of a givsn radius. The appropriüts niagnitudr u f thut radius is a marrer
for debate. and will be discussed in Chapter Two.
A Iandscape can be quantified in terms of composition - the relative amounts of
different patch types within its boundaries - and configuration or physiognomy - the
physical placement of those patch types in spx r . relative to one ünother (Dunning et al..
IW?). Toy lor et ;il. t 1993) hiive proposrd ;i third mriisiirr. connsctivity. ro descri be
functionül linkagrs within a Iandscüpe ( . s e ülso Baudry and klcrriam. 1988: Mrrriam.
1988. 199 1). Connectivity is species-sprcific. and often process-specific. and is difiicult
to detïnr without extensive empirical testing (cg . . Pither and Taylor. 1998: Tirbout and
Anderson. 1997) or using models of movement probabilities (Henein and Merriam. 1990:
Henein et al.. 1 %W. Composition und configuration remain the two most objective
rneasures of landscape heterogeneity: togrther the two drscribe what is rrferred to herein
as landscape structure.
Landscape structure has been shown to be a signitïcant predictor of organisms'
abundance and distribution. Most studies have bern conducted in agricultural or other
anthropogenically fragmented Iandscapes. The distance to nrürest habitat patch. the

presence of a suitüble linear comdor (Merriam and Lanoue, 1990: Bennett et al., 1994;
Andreassen et al., 1996: Schmiegelow et al.. 1997), composition of the matrix (Aberg et
al.. 1995; Donovan et al., 1997: Fitzgibbon. 1997). can al1 contribute to spatial
distribution of organisms. The mechanisrns behind this influence are numerous. Isolation
of habitat patches frorn others (by barriers or simple distance) çan prevent recoionisation
after local extinction (Kozakiewicz. 1993: S toufîèr and Bierregaard, 1995: Fitzgibbon,
1997: Wiens et al., 1997; Henein and Merriam 1998). The presence of linear corridors
rnay ameliorate this effect (Henderson et al.. 1985: Henein and Merriam, 1990: Bennett et
al.. 1994: Schmiegelow et ai.. l997 i . Lineiir corridors miiy iilso facilitate movement into
sink habitat patchrs where death riire rxçeeds birth rate. cind popultirion p w t h is zero
(Pulliam. 1988: Pulliam and Danielson. 199 1 : Danielson. 199 1. 1992). These procrssrs
in tluence distri bution by impeding or î'acilitating niovement by individucils into patchrs:
in other words; thry act on t hc: procrss of dispersal. Genr rall y landscape configuration
influences thrse procrssrs. and dors so tir i ü r p spatial scales.
Landscape composition may intlucnce an orgctnism's disrribution through its
differential response to the sizr, shape. or arringement of different habitat patches.
Intuitively, ri patch's s i x will affect its use by an individual or population. This can lead
to ephemeral extinction in small patches. as in the metapopulation mode1 suggested by
Levins ( 1970). Coupled with patch isolation. this u n rrsult in prolonged local extinction
(Fahrig and Merriam. 1994). Patch shape can irnpede or f~cilitate rnoveinent of
individuals in and out of the patch (Tamahazi. 1996: but see H q e r et al.. 1993). Shape
also influences the perimeter-area ratio of the patch and hence the extent of edge effects

(Stamps et al., 1987). deleteriously impacting "interior" spccirs and encouraging the
introduction of other plant or animal species (Forman, 1997).
The arrangement of patclies influences distribution through landscape
complernentation, landscape supplemrntation. iind neighbourhood rffects (Dunning et al..
1992). Complementation occurs whrn an organism uses several patch types for non-
substitutcible rcsources: rupplcment<ttion occurs uhcn the orynism iiscs othcr ptitch typcs
to supplement resources that are scarce in the focal patch. In either case. the juxtaposition
of different patch types affects the übundance of orpnisms that clin survive in the
immediate xea. Neighbourhood clfeçts - the proxirnity of patchrs and pemeability of
intrrpatch boundaries - mediate these processes. Final l y. what Dunning et al. ( 1997)
tenned "indirect Ilindscüpe rlfeçts" - the responsr to Itindsctipe srructurr by prediitors.
prey. cornpetitors. rnutualists, rrc. - will dso influence an orglinism's presrnce or absence
within a plitch. However. by considering landscape composition. one ücknowledgss that
the effects of landscüpe structure cire contextual. 3 crucial point that many studies have
M e d to consider.
The fundamental driver behind londscapr structure is hrterogenci ty. He tsrogenrity
is perceived differently by different species, or even iigelsrx classes within a species
(Kotliar and Wiens. 1990). Heterogeneity became a focus of interest in rcology under the
pseudonym of fragmentation. Like "landscapc". fragmentation hris mliny descriptions. but
is broadiy considered as an "unnaturd detaching or separation of expansive tracts [of
habitat] into spatialiy separated fragments" (Harris and Silva-Lopez. 1992). Agriculture
and forestry are two principal causes of fragmentation. Fragmentation can be intrusive,

with srnall pockets of disturbance in an undisturbrd matrix. or rnveloping. with patches
of natural habitat lrft in a matrix of anthropogenic patches (Harris and Silva-Lopez.
1997). The effects of fragmentation on animal populations are often considered to be
synonymous with habitat loss. although Andren ( 1994: 1996) suggests true fragmentation
effects occur when contiguity of nürurai landscape remnants is lost and patches become
isolated: the detrimental etTrcts on cinimal populiitions :ire preitrr than the rffects of
habitat loss done. It should bs nored in the preceding quotation thiit fragmentation is
synonymous w ith unnarural. or anthropogenis. ilisturbance. As of the timr of this writing
few. if any. studies have addresstrd the effects of natural or non-iinthropogenic
hrterogeneity on animai distribution: this will br üddressed in Chnpter Threr.
Despite the growing nwueness of the importance of Ilindsçapr rt'fects thüt has
emerged in the last two decadrs, few could deny that habitat plays a vital role in
determining the presrncehbsencr or abundancc of lin organism. The plant (or animal)
species composition within a pütch comprises the food base for an or,oanism: floristic
structure provides nesting sites and shelter from predators (Southwood. 1977). By this
token the ecological processes occurring within ri given pütch will be dictated by the
habitat within it: an organisrn may forage in one patch type. den in another. disperse
through yet another. As Iündscape effects are manifrsted by their influence on ecological
processes (Wiens et al.. 1993). it follows that iandscape cffects on animals within pütches
may v;uy with different local-scale vegetrition. The relative effects of local habitat and
landscape structure will be exarnined in Chapter Four.
Studies of the effects of landscape structure have used a wide range of taxa as

study subjects, including birds (Wegner and Mcrriam. 1979: Donovan et al.. 1997:
Stouffer and Bierregaard. 1997: Schmiegelow et al.. 1997); mamrnals (Kozakiewicz,
1993; Szacki et al.. 19931, and invertebrates (Middlrton and Merriam, 1983: Taylor and
Merriam. 1996; Jonsen and Fahrig. 1997; Roland and Taylor. 1997: Wirns et al.. 1997).
In most cases the study orgrintsms tire ones that rire known to rely un pritches that
comprise only n small part of the landscape; patches thar are set into n less suitable (or
completely unsuitable) matrix. Hence. the Iandscape is heterogeneous from the
organism's perspective. and the researcher may use known habitat prekrences to
extrapolate the nature of that heterogeneity (Andren et al.. 1997). In frügmented
landscüpes it is enough to choosr a specitis that is affiliated wirh remnant native habitats
and avoids novrl patch types. To g a g e the rffects of landscape structure in a naturally
heterogrneous area. 1 chose to study the North Americün red squirrel. Tmrii~lsci~tn<s
hlsor t i c u ~
T. Ii~rdsuriiais is a conifer speciülist. The sttrds found in the conrs of conifer trees
such as Abies. Piceci. and Piniis spp. are its prirnüry food source (Smith. 1968: Kemp and
Krith, 1970: Rusch and Reeder. 1975; Rirge. 199 1 ). Although red squirrels also feed on
rnushrooms. bemes. and nuts (Gurnell. 1983; Yahner. 1987). thry rely on conifer cones
for ovenvinter survival (Rusch and Reeder. 1978). Squirrels collect cones in the late
summed early Cal1 and cache them in middens (Hurly and Robertson. 1990: Dempsey and
Keppie. 1993). Large middens contain the decomposed brricts of previous yrars' cones
and provide ri food-hoarding location as wwrll as shelter for the squirrel. There may be
several middens on a single squirrel temtory.

Territories are relatively permanent entities (Rusch and Reeder. 1978 ) that are
heavily defended (Stuart-Smith and Boutin. 1994). The territorial d l . or rattle, denotes
the squirrel's home turf and wams potential intmdrrs of that area's occupation (Lair.
f 990). The size of these territories varies with location and habitat type (Smith. 1968;
Rusch and Reeder. 1978). There rire no differenciis in territory s i x between males and
fernales and no overlüp evists (Smith. 1965). Plales iire permitred ont0 a lemale's territory
only during a one-day oestrous. which is typically once a year (Lüir. 1985). Brerding
occurs in carly March to mid June and litters are born btttwcen April and Ju ly (Larsen.
1993: Becker sr al.. 1998). Young typically rnust tïnd thrir own territorirs. dthough some
evidence of bequrathal or shüring cxists (Pricr and Boutin. 1993). Squirrels without a
permanent territory and thus a reliüblr source of ovenvintering food have a low
probabili ty of survival ( Rusch and Reeder. 1978).
From thesr studies 1 post~ilüte thüt red squirrels prrcrive mixrd-wood boreiil
landscapes that contain ü mix of conifer and other stiind types as hrtrrogenrous; that such
a landscape is a rnosaic of suitable patchrs embrddrd in a lrss suitable rnatrix. Basrd on
this premise. the following chapters will riddress three questions:
1 ) What is the spatial scale at which wt: expect landscape structure to predict squirrel
presence?
2) Does landscape structure derived From natural hrterogeneity predict squirrel presence?
3) Does local vrgetation influence the relationship betwern landscape structure and
squirrel presence'?
Conservation biology carries with it an undeniable urgency that has spawned a

generation of fraspentation studies. The resiilts of thrsr studies have generared some
intriguing theoretical ecological questions about or_eanisms' response to the patterns of
spatial heterogeneity in which they are immersed. This thesis will attempt to address
some of these fundamental questions against the bückdrop of the mixed-wood borriil
forest of northern Alberta.
1.1 METHODS
1.1.1 Study Area
This study was conductrd nonh of Lac La Biche. Alberta. on the AlbertaPacific
Forest industries i AlPac) Forest Management A r a (FMAL This areii Iays within rhe
mixed-wood boreal forest. and is covered miiinly by b l ~ k spnicr b o p i Picro rrrciriror~i)
in hygric areris: aspen (Popirlrrs trr~~riiloitlrs) and bnlsiirn poplür (Popiiliis bolswiiferd
mixed sparsely with white spruce ( Picm g l t l r u ~ ) in rnesic areas: and jack pine (Piniis
banksicmcl) in xrric areas (Strong and Leggar. 1992). The rarly 1990's herüldrd the cutting
of aspen and some conifer stands iii small cutblocks from some townships.
1.12 Sampling Design
Threr areas had bren selectrd by the Sustainable Forestry Management Interstand
Dynamics Project. b s e d on general Iandscapr composition: a Managed. Burned. and
Reference Area. The Managed Area had experienced somr timber harvesting (ca. 9% of
area). It encompassed townships T69 R 13 W4 and T70 R 13 W4: central coordinate was
55"5' W 1 12'15' N (Figure 1. L ) . The Burned Area was situareci on townships T73 RI 1
WJ. T73 R 12 W4, T74 R 1 1 W4. and T74 R 12 W4, with centrai coordinate 55'30' W
I 12'OYN. The third area was not bumed and had experienced very slight (ca. 1%) timber
harvesting activity; we terrned this the Reference Area. It was located on T70 R 13 W4.
T7 t R I 3 W4. T70 R1J W4. and T7 1 RL4 W4. with central coordinate of 55" W t 13"309
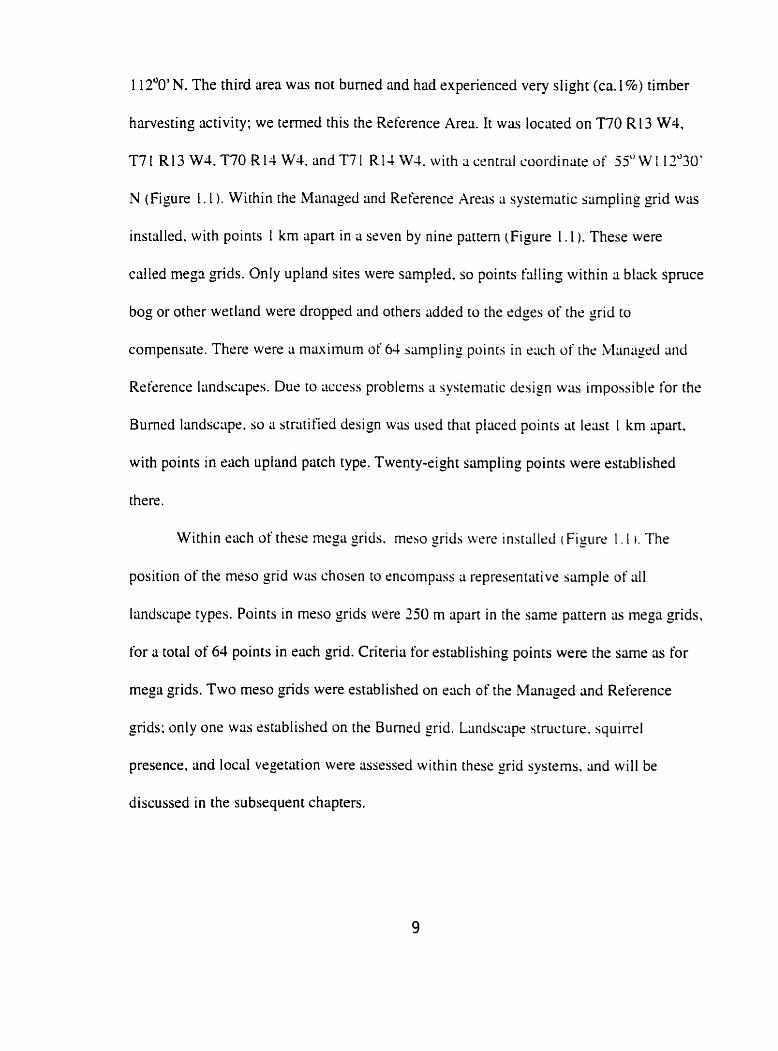
N (Figure 1.1 ). Within the iManüged and Referencr Areris ii sysremütic sompling grid was
installed. with points 1 km apart in a ssven by n inr pattern (Figure 1 . 1 ). These were
ccilled megs grids. Only upland sites were sampled. so points hlling within a bllick spruce
bog or other wetland were dropped and others added to the edges of rhr grid ro
compensate. Thrrr were a maximum of 64 siimplins points in eüch of rhé Miin@ and
Ret'srçncr landscaprs. Dur to Liccrss problcrns o systcmatic design was impossible for the
Burned landscapr. so a stratified design was used thiit placed points at Iwst 1 km apart,
with points in rach upland patch type. Twenty-eight sampling points were estÿblished
there.
Within each of these mcga grids. meso grids wrre instdlrd i F i p r r I . I 1. The
position of the mes0 grid wüs chosen to cncompass a representati v r slirnplr of al1
landscape types. Points in mrso gnds were 250 m üpart in the samr pattern as mega grids,
for a total of 64 points in each grid. Criteria for establishing points were the same as for
mega grids. Two meso gnds were establishrd on rach of the Managed and Reference
grids: only one was cstablishrd on the Bumrd grid. Landscnpr structure. squirrctl
presence. and local vegetûtion were tissrssed within these grid systrrns. and will be
discussed in the subsequent chapters.

Figure 1.1: Location and design of the snmpling system. The Reference mega and meso grids are shown. Circles indicate mrgû grid points. and squares represent mrso ;rid points. Distance br twr rn m z y y i d points is I km: betwrrn mrso srid points. 150 m.

Aberg, J., G. Jansson. J.E. Swcnson. anci P. An_oclstam. 1995. The effect of rnatrix on the occurrence of hue1 grouse (Boncisa bomsi~i) in isolated habitat fragments. Oecologia 103: 265-269.
Addicott, J.F., J.M. Aho. M.F. Antolin, D.K. Padilla, J.S. Richardson. and D.A. Soluk. 1987. Ecological neighbourhoods: scaling environmental patterns. Oikos 49: 340-346.
Andreassen. H.P.. S. Halle. and R.A. Irns. 1996. Optirniil width of movemrnt corridors for root voles: not too nanow and not too widc.. Journal of Applied Ecolopy 33: 63-70.
Andren. H. 1994. Elfects of habitat fragmentation on birds and rnamrnals in landscapes with different proportions of suitablr habitat: a review. Oikos 71: 355-366.
Andren. H. 1996. Population responses to habita: fragmentation: statistical power and the random sample hypothesis. Oi kos 76: 235-242.
Andren. H. A. Deliii. and A. Seiler. 1997. Population rrsponsr to Iiindsccipr changes depends on spccialization to different landsctipe clernents. Oikos SO( 1 ): 193- 196.
Baudry. J.. and G. Merriam. 1 Y 88. Connectivity and connectrdness: Functional vcrsus structural patterns in landscapes. In: Schreiber. K.-F. (rd.). Connectivity in landscape rcology. Proc.?nd Intrmationül Association for Landscüpe Ecology. Munstrrsche Geogr. Arbeiten 29. pp 23-28.
Becker. C.D.. S. Boutin. and K.W. Larsen. 1998. Constraints on first reproduction in North Amerîcan red squirrels. Oikos 81: 5 1-92.
Bennett. A., K. Henein. and G. Merririm. 1994. Corridor use and the elements of corridor quiility - chipmunks and fencerows in a farmliind mosaic. Biological Conservation 68: 155- 165.
Danielson. 199 1. Communities in a landscape: The influence of habitat heterogeneity on the interactions between sprcies. The Amencan Naturalist 138(5): 1 105-1 120.
Danielson. B.J. 1992. Habitat selection. interspecific interactions and landsclipe composition. Evolutionüry Ecology 6: 399-4 1 1.
Dempsey, J.A.. and D.M. Krppie. 1993. Foraging patterns of eastern red squirrels. Journal of Mammalogy 74(J): 1007- 10 13.

Donovan, T.iM., P.W. Jones, E.iM. Annand. and F.R. Thompson m. 1997. Variation in local-scale edge effects: mechanisms and Iandscape context. Ecology 78(7): 7064-3075.
Dunning, J.B.. B.J. Danielson. and H.R. Pulliüm. 1991. Ecological processes that affect populations in complex landscapes. Oikos 65: 169- 175.
Fahrig, L., and G. Merriam. 1994. Conservation of friigrnrnted populations. Conservation Biology 8( 1 ): 50-59.
Fitzgibbon, C.D. 1997. Smnll mammals in hm woodlots: rhr rffects of habitat. isolation and surrounding land-use patterns. Journal of Applied Ecology 34: 530-539.
Gumell. J. 1983. Squirrel nurnbers and the abundance of tree sreds. Mammal Review 13(2/3/4): 133- 1.18.
Harper. S.J.. E.K. B o l l i n p . and G.W. Barrett. i993. Efkcts of patch shape on populations dynamics of meadow voles (Micruru prtitisylvci>iicrrs). Journal of ~Mammalogy 74(4): 1045- 1055.
Harris. L.. and G. Silva-Lopez. 1992. Forest fragmentation and the conservation of biological diversity. Pp. 198-237 In Conservation Biolozv: The theorv and oractice of nature consrrvation. preservation. and management. P. Firdlrr and S. Jain, Eds. Chapman and Hall. London.
Henderson. M.T.. G. Merriam. and J. Wqner. 1982. Patchy rnvironmrnts and specirs survival: chipmunks in an cigricultural mosaic. Biological conservation 3 1: 95- 105.
Henein. K., and G . Merriam. 1990. The elements of connrctivity whrre corridor qudity is variable. Landscape Ecology 4: 1 57- 1 70.
Hurly, T.A.. and R.J. Robertson. 1990. Variation in the food hoardinz behaviour of red squirrels. Behaviourd Ecology and Sociobiology 16: 9 1 -97.
Kemp. GA.. and L.B. Kctith. 1970. Dynamics and regulation of red squirrel (Tmzicisciwris hudsonicus) populations. Ecology 510): 763-779.
Kotliar. N.B.. and J.A. Wiens. 1990. Multiple scalrs of patchiness and patch structure: a hierarchical framework for the study of heterogeneity. Oikos 59: 33-260.
Kozakiewicz, M. 1993. Habitat isolation and ecological barriers - the cffect on small marnmal populations and communities. Acta Theriologica 38( 1): 1-30.

Lair, H. 1985. Mating seasons and fertiiity of red squirrels in southern Quebec. Canadian Journal of Zoology 63: 3323-2377.
Lair, 1990. The calls of the red squirrel: a contextual analysis of function. Behaviour 115: 254-282.
Larsen. K.W. 1993. Female reproductive success in the North American red squirrel, T~~nriiisciun~s htrdsonicris. Pt1.D. Thrsis. University of Alberta. Edmonton.
Levins. R. 1970. Extinction. Pp. 77-20? In Lccturcs on mathematics in the life scicnccs. Vol. 2. M. Grrstenhaber. ed. American Mathematical Society. Providence. Ri.
Merriam, G. 1988. Landscape ccology: the ecology of heterogeneous systems. Pp. 43-50 In Landscape Ecolov and Management. M. Moss. ed. Polyscience Publications Inc.. Montreal.
merr ria m. G. 199 1. Corridors and connectivity: animal populations in heterogeneous rnvironmenrs. pp. 133- 142 Nature Conservation 2: The Rolr of Corridors. Edited by D.A. Süunders and R.J. Hobbs. Surrey Beatty and Sons Pty Ltd. Chipping Australia.
merr ria m. G.. and A. Lanour. 1990. Corridor use by small mümmals: field for three experimental types of Perurnyc~is leucopus. Landsçape Ecology 131.
Middleton. J.. and G. Merriam. 1983. Distribution of woodland species in woods. Journal of Applicd Ecology 20: 625-64.
Norton. NSW.
rneasurernent 1(2/3): 123-
Pither. J.. and P.D. Taylor. 19%. An sxperirnsntal assessrnent of landscape connrctivity. Oikos 83: 166-174.
Price, K., and S. Boutin. 1993. Territorial bequeathal by red squirrel mothers. Behavioural Ecology 4: 144- 1 50.
Pulliam. H.R. 1988. Sources. sinks. and population regulation. The Arnerican Naturalist 132(5): 652-66 1.
PuIlirim. H.R.. and B.J. Danielson. 199 1 . Sources. sinks, and habitat selection: a landscape perspective on population dynamics. The American Naturalist 137: S5-S66.
Riege, D.A. 1991. Habitat specialization and social factors in distribution of red and grey squirrels. Journal of Marnmalogy 72( 1): 152- 162.

Roland. J.. and P.D. Taylor. 1997. Insect parasitoid species respond to forest structure at different spatial scales. Nature 386: 7 10-7 13. Rusch, D.. and W. Reeder. 1978. Population ecology of Alberta red squirrels. Ecology 59(2): 400-420.
Schmiegelow, F.K.A., C.G. Machtans. and S.J. Hannon. 1997. Are boreal birds resilient to forest fragmentation? An rxperimental study of short-term community responses. Ecology 78(6): 19 14- 1937.
Smith, C.C. 1968. The ;idaptivc nature of social organization in the Grnus of three (sici squirrels Tomicisciitnu. Ecological Monogriiphs 38( 1 1: 3 1-63
Soutliwood. T.R.E. 1977. Habitat. the templet for ecological strategies? Journal of Animal Ecology 46: 332-365.
Stamps. I.A.. M. Buçchner. and V.V. Krishniin. 1987. The sffects of edge permeiibility and habitat geometry on emigration from patchrs of habitat. The Amrrican Naturiilist t29(4): 533-553.
Strong. W.. and K R . Leggiit. 1992. Ecoregions of Alberta. Prepcired for Albrna Forestry. Lands and Wildiik, Land Information Services Division, Resource Intonnation Branch. Publication Number T:245.
Stouffer. P.C.. and R.O. Birrregaard. Jr. 1995. Use of Amazoniün forest fragments by understory (sic) insectivorous birds. Ecology 76< 5): 2429-2445.
Stuart-Smith, K., and S. Boutin. 1994. Costs of escalated territorial dekncrr in red squirrels. Canadian Journal of Zoology 72: 1 162- 1 167.
Szacki. S., J. Babinska-Werka. and A. Liro. 1993. The influence of landscape spatial structure on small mammal movements. Acta Theriologica JS(2): 1 13- 123.
Tamlihazi. T. 1996. Effects of patch shiipr on the number of ogünisms. Landscape Ecology l l ( 5 ) : 299-306.
Taylor, P.D., L. Fahrig, K. Henein.. and G. Merriam. 1993. Connectivity is a vital element of landscape structure. Oikos 68: 57 1-573.
Taylor, P.D.. and G. Memam. L996. Habitat fragmentation and parasitisrn of a forest damseltly. Landscape Ecology 1 l ( 3 ) : 18 1 - 189.

Tiebout, H.M.. and R.A. Anderson. 1997. A cornplirison of corridors and intrinsic connectivity to promote dispersal in transient successional lündscapes. Conservation Biology l l ( 3 ) : 620-627.
Turner, M.G. 1989. Landscape ecology: the effect of pattern on process. Annual Review of Ecology and Systematics 20: 17 1 - 197.
Urban, D.L.. R.V. O'Neill, and H.H. Shugart. Jr. 1987. Landscape ecology: a hierarchical perspective can help scientists understand spatial patterns. Bioscirncr 3 7 ( 2 1 19- 127.
Wzgnér, J.F., und Ci. hlcrriam. 1979. Xlovcnirnts by birds anci rrnilll mcimmals btxwccn LI
wood and iidjoining farmland habitats. Journal of Applied Ecology 16: 349-357.
Wiens. J.A. 1976. Population responses to patchy environments. Annual Reviews in Ecology and Systematics 7: 8 1 - 170.
Wirns. J.A.. N.C. Stenseth. B. Van Horne. and R A . Ims. 1993. Eçological mechanisms and lundsclipe ecology. Oikos 66: 369-380.
Wirns. J.A., R.L. Schooley. and R.D. Werks. 1997. Ptitchy Iandscripes and animal movements: do beetles percolatr'? Oikos 78: 257-264.
Yahner. R.H. 1987. Frrding site use by ied squirrels. Tm~iïisci~lt-11s hi<dso)~iciu. in a marginal habitat in Pennsylvania. Canadian Field Naturalist 101(4): 586-589.

Chapter Two
Using Foraging Range to Demarcate a Functional Landscape
The cardinal consideration of any rcological study must be the identification of
the spatial scale most appropriate to the pattern or process under investigation (Wiens.
1989). In landscape ecology. this translates into definin; the patch and the landscape by
some critrria pertinent to the organism under consideration. and describin; a landscape
relevant to the mechanisms by which londscapr structure might intliirncr distribution
(Wiens et al.. 1993). Rècognizing rhiit pütchcs and landscüpes are not fixrd entities.
Kotliar and Wisns (, 1990) proposed a theoretic;il mode1 by which patchiness is arranged
in a hierarchy. A given "patch" might have internai heterogeneity (e.g.. in floral species
composition or physiognomy) but from the organisms' perspective during a given
iictivity, this variance is üverüged out so that it apprars horno,vrnrous. Pütches üggrepatr
to f o m larger functional units. which Addicotr et al. ( 1987) dubbed "rcological
nrighbourhoods". Ecologicül neighbourhoods are drfined by an ecological process. an
appropriate time scale, and an organism's activity. Therefore. what constitutes an
rcological neighbourhood or functional patch aggregate is not only specirs-specific. but
will Vary within a sprcirs depending on the procrss beins çonsidrred.
An organism's response to its surroundings may actually occur at several different
spatial scales (Morris. 1987, 1992; Urban et ai., 1987). The smüllest spatial scd r at which

a particular organism responds to patchiness is its "grain". while the largest scale that
influences an organism is its "extent" (Kotliar and Wirns. 1990). Grain and rxtrnt are
also process-specitic. as suggested by ecological nrighbourhoods. Howevrr the grain of
study is often a matter ot'convenience for researchers. a laiinching point limited by the
resolution of the data. It is assumed that below this grain. al1 things are equal. The extent,
as suggsstrd by the ecological neighbourhood (Addicott et ai.. 19873. will vüry depending
on the process undrr considrrtitioii: or alternütively. the dominant ccologiccil process thar
is effecting the rrsponse to hrterogeneity. To combine terminology. the grain c m b r
considered the patch. and the extent is the landscape.
Defining landscape rxtent (1 prion is a dangerous business i f done without proper
consideration of the relevant spatial and time scüles: this is ünalogous to conducting a
population scology study without first dclinrlitinp the population. Following the example
of ecologicd neighbourhoods. 1 definr the landscapr extent büsrd on the spatial scale at
which ecological processes occur to rfkct a response to landscape structure. This
demarcation is based on the prernise that there are two main mcchanisms influencing
patch occupancy by an organism: I ) it must get there, which is a dispersal phenornenon,
and 2 ) it must survive there. which is relateci to foraging. among other things. Obviously
there are many othrr fiictors involved. but I will limit my aryrnent to thesr two for the
sake of simplicity.
If an organism's distribution is dispersal-limited, aspects of the landscape beyond
the patch should predict its presence. Landscape configuration. in terms of patch isolation
(Fahrig and Merriam 1994). connrctivity (Taylor et al.. L993: Pithcr and Taylor, i 998).

and boundary permeability (Wiens et al., 1985) could play a role. So could composition.
in that a proximal expanse of suitable habitat may act as a source for dispersers (Pulliam
and Danielson. 199 1 ; Danielson, 199 1. 1992). In this scenario. landscape structure and a
species' rnovement patterns intrrüct to determine population distribution i Wirns sr ai..
1993). .Alternativrly. i f an organism is forage-limitçd. one would cxpect ti responsr to
landscape structure at smüller. foraging sçales. Lanclsciipr complrmzntation or
supplementation may facilitate occupation by an individual (Dunning et al., 1992). Patch
size. shape and composition may constrain occupation (Hiirper et al.. 1993: Tamahazi.
1996). tn this crise local-sçüle hrterogeneity would drive distribution and Iarger-scüle
phenornena would br Iess important.
Red squirrels are not behaviourally restricted to conifer and c m move through
deciduous habitats (Rusch and Reeder. 1978: Yahner. 1957). Given that the red squirrel is
dependent on conifer for overwinter survival (Gumefl 1987). and the areas in which L
conducted this study are conifer-depüupcirw (sa. 20-30'2 of the areal. 1 postulatecl thüt
red squirrels are forage-. not dispersal-limited. I trstrd the predictions thüt i rrd squirrels
are able to rnove through the matrix and thus are not dispersal-limited and 2) the response
to landscape structure exists at small scales. the ecoIogica1 neighbourhood of the foraging
range. The aim of this chapter is to test the first prediction. and to provide an estimate of
the foraging range of the red squirrel in the mixrd-wood boreal ecosystern. as a preludr to
the multiscalar landscape analysis in Chaptrr Thrrr thnt tests the second prediçrion. The
current chapter will also iissess squirrels' use of die matrix (non-conifer) patches, a
fundamental consideration when ascenaining whether larger-scale isolation could play a

role in squirrel distribution.
The territory size of the red squirrel has been well studied in a variety of high-
quality habitats. including white spruce in the Yukon (Price et al.. 1986). lodgepole pine
in Colorado (Gumell, 1984). and jack pine in Alberta (Larsen. 1993). Rusch and Reeder
( 1978) examinrd territory size in conifer stands in the southern mixed-wood boreal forest
of Alberta. However tlizre is no documentation of foraging range size (whish include
important extraterritorial movemcnts (,Don. 1983)) in the marginal squirrel habitat of the
rnixed-wood boreal of north-central Alberta. where deciduous stands f o m the matrix and
conifer is limiting.
To obtliin an rstimate of the foraging scale at which response to landscape
structure wiis expected. 1 uscd radio trlenietry to iissess the size and content of the
summer foraging range of red squirrrls in the study area. This information will be used in
subsequent çhapters as a benchmark for assessing the appropriate extent of Iündsclipe
analysis. a pivotal first step in cvaluating the effects of landscapc structure.
2.1 METHODS
2.1.2 Squirrel locations
To track squii-rels within jack pine stands, grid points from within the Reference
area were identified at which squirrel territorial calls had been recordrd. and which had
suitable access. Ten of these were selected randomly. For squirrels within
spruce/deciduous/cut stands, the same protocol was followed on the illanaged grid. Due
to low capture success on these latter ten sites three extra sites wrre added. identified on
19
the ground as containing spruce (adjacent to a deciduous stand or cutblock) and having a
resident squirrel present.
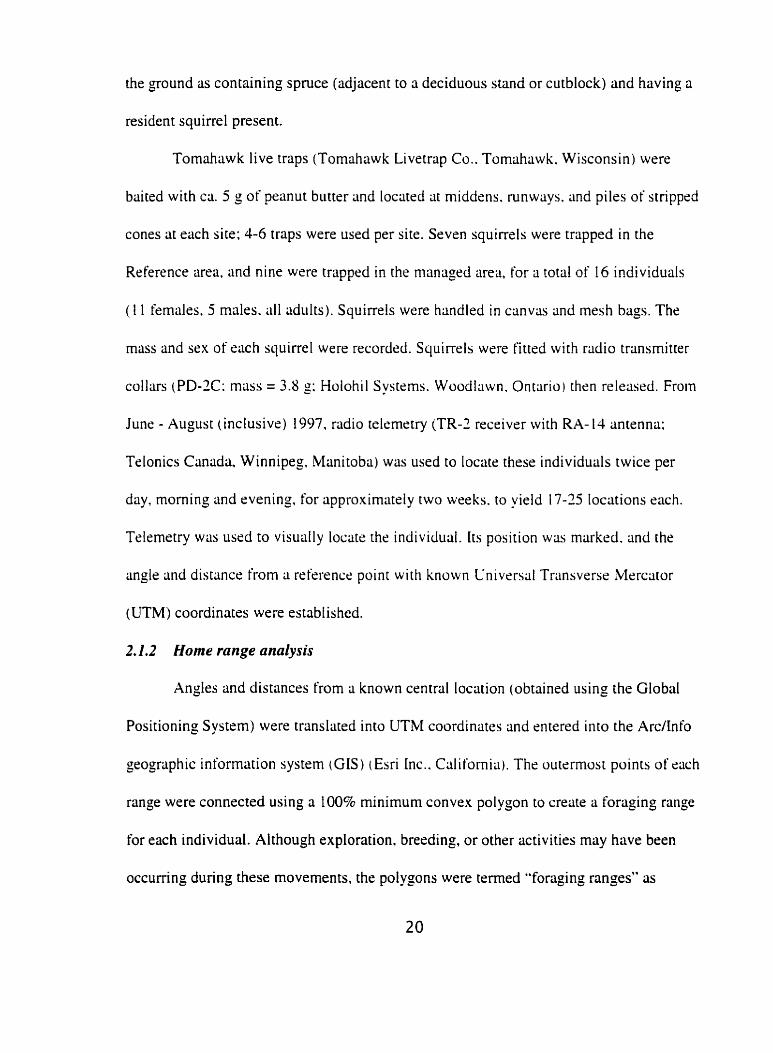
Tomahawk live traps (Tomahawk Livetrap Co.. Tomahawk. Wisconsin) were
baited with ca. 5 g of peanut butter and located at middens. runways. and piles of strippcd
cones at each site: 4-6 traps were used per site. Seven squirrels were trapped in the
Reference area. and nine were trapped in the mrinüged area, for a total of 16 individuals
( 1 1 females. 5 males. a11 adults). Squirrels were handled in canvas and mesh bag. The
mass and sex of cüch squirrel were recordrd. Squirrels were fitted with radio transmitter
collars (PD-ZC: mass = 3.8 g; Holohil Systrms. Woodlawn. Ontario) thrn released. Froin
Junr - August (inclusive) 1997. radio telrmrtry (TR-2 receiver with RA- 14 antenna:
Telonics Canada. Winnipeg. Manitoba) was used to locatr these individuals twice per
day, moming and evening. for approximately two wreks. to yield 17-75 locations each.
Trlemetry was usrd to visually loçatr the individual. ïts position wlis marked. and the
angle and distance from a referencr point with known Universal Transverse Mercator
(UTM) coordinates were established.
2.1.2 Home range analysis
Angles and distances from a known central location (obtained using the Global
Positioning System) were translated into UTM coordinates and entered into the ArdInfo
geographic information system (GIS) (Esri Lnc.. Colifornia). The outtrmost points of each
range were connected using a 100% minimum convex polygon to create a foraging range
for each individual. Although exploration. breeding, or other activities may have been
occurring dunng these movements, the polygons were temed "foraging ranges" as

foraging is a daily cictivity known to have consistently occurred during the tracking
period. The use of this term separates this range from home ranges, which typically
rncompass larger time-frames (q. v. ).
Ranges were overliiid on digital Alberta Vegetation Index ( AVI) forest inventory
coverages reclnssified to describe age and stand type (see Appendix 1 Ior reclassification
protocols). The size of the range. and landscape composition and configuration within
each. was quantified using FRAGSTATS (McGarigal and Marks. 1994). Tests for
differences between rnean range sizr by sen and by conifer content were perfomed using
the non-parümetric Rank Sum test (Ambrosr and Ambrosr. 1995) for low sample sizes
and non-normal data.
2.2 RESULTS
2.2.1 Sqzcirrel foragirtg range sizes
Thrre was some variability in squirrel forüging range size. with the Irirgrst bring 8.12 ha
in size and the srnaIIest 0.1 ha in size (Table 2.1 ). There w u no difference between male
(n=j) and female (n=I 1 ) foraging range sizes (Rank Sum test. p0.05). The percent of
conifer stands in the home range was defined by the landscape mnps and included pure
black spruce, white spruce. larch. and jack pine. as well mixed-deciduous stands in which
conifer constituted the majority of trees within the stand. There was a difference in size
between ranges with ~ 9 0 % conifer stands within them. (n=8) and >90% conifer stands
(n=8), as defined by landscape maps (Rank Sum test. pc0.05; Table 2.2).
>90% conifer within their boundaries were smaller than those containing
Ranges with
other elements,

which included pure- and mixed-deciduous stands. and clearcuts.
2.2.2 Squirrel use of stand types
Squirrels were radio-iocatcd in black spmce. white sprucc. jack pinr . cispen /
balsam poplar, and clearcuts. For those squirrels whose range included jack pine (n=7),
an average of 86% +/- 14 (standard deviation) of the locations were within the jack pine,
with the remainder falling in deciduous or deciduous/jack pine mix. Of the squirrels
whose ranges includrd spruce. distribution of radio locations was quite variable. Two of
the ranges did not incliidr ciny conifer stands. lis definrd by the AVI miips. Ground-
rruthing revealed the prescnce of a k w large cone-bexing white spruce trees within the
deciduous parch. One range, the smallest. was entirely within old white spruce. Of those
squirrels who used spruce nrxt to deciduous patches (n=3). 37.33% +/- 32.5 locations fell
within spruce: 62.67% +/- 32.5 fell within deciduous. Of those squirrels whose ranges
bordrred a clearcut (n=3). 70% +/- 22.9 frll within sprucr: 23.33% +/- 16.07 frli within
the cut. These results suggest that squirrels are not confined to conifer habitats and do
make use of the matrix.

Table 2.1 : Red squirrel foraging r ang statistics.
(n= 16) Foraging range size (ha) % conifer within range
mean
std dev
median
minimum O. 1 O
Table 1.2: Relative sizes of squirrel foraging ranges (lia) with difkring conifer content.
~ 9 0 % conifer 990% conifer
mean area (ha)
std dev
maximum
minimum

2.3 DISCUSSION
2.3.1 Assessment of accuracy and the 100% minimum convex polygon
As squirrels were visually located. there is no error polygon iissociated with rach
observation. of the kind that should be prrsentrd with triangulation data (Harris et al..
1990). For each squirrel, the relationship brtween sample size (number of locations
obtained) and the amount of m a measured is not linear but does not display a perfect
asymptote. This indicates rhar more locations per squirrel rnay have been required to
obtain a more complete foraging range size. This wns compensated for by usin2 a
relatively consistent nurnbcr of points per individual (,cil. 17-25) cind employing a non-
statistical home range estimator.
Statisticiil and non-statistical home-range estimators clin be used to analyse radio
location data (Harris et ai.. 1990). Statistical methods iisually focus on the seneration of
probability ellipses (Dixon and Chaprnan. 1980). Mrthods such as thrse attempt to
describe 'utilization distributions'. or the distribution of an animal's position in space
(Harris et cil.. 1990). The harmonic mean method. for cxample. is a statistical rstimator
that uses areal moments to calculate the most intensely used area. or 'centre of activity' as
indicated by density of radio locations (Dixon and Chiipman. 1980). Parametric methods
such as these are susceptible to problems with iiutocorrelation of location data and sample
size.
Non-panmetric statistical estirnators do not assume adherence to ii theoretical
distribution. Techniques include fixed and adaptive kemel methods (Worton. 1989)
which delineate areas of intense usage. using a non-parametric smoothing function.

However, these methods are quite sensitive to both skewness of location data and to the
type of smoothing parameters used. Harris et al. ( 1990) suggest that these methods are
more reliable for exarnininy relative range (habitat) use than total size.
The simplest non-statisrical home range estimator is the minimum convex
polygon (MCP) (Don, 1953). With the MCP ii researcher c m use either 1008 of the
points. as this study does. or restrict the nurnber in such (i w3y that outliers are omitted to
provide a more consrrvativr estimate of size. Whilr considered a more robust éstimator
than statistical methods when number of fixes is smltll (Harris et al., 1990), it is still
strongly ciffected by outliers and can include portions of habitat arw beyond the main areLi
of activity or chat aren't visitrd by the individual. The MICP wiis decmcd suitable for this
srudy as i t was not my intention to delineate core areas of habitat or determine the most
parsimonious riingr or territory sizr: the goal of this study was to determine al1
movrments by individuals. inçluding ail extra-territorial forays and movements off cure
areas. AI1 of the points were usrd ( 100% MCP) rather thün rmploying ri restricted
polygon, as longer movements within the forliging time frame wrre considerrd important
indicators of the scde of squirrels' areal use.
2.3.2 Spatial scnle of Zan dscape analysis
A mean foraging range sizr of 1.7 hri corresponds to a circular landscape extent
with a 73.6 m radius. The minimum and maximum-sized ranges correspond to 17.8 m
and 160.8 m radii. respectively. Given the variation in foraging range s i x and the
possibility that ranges are possibly underestimated. it is prudent to say that if squirrels rue
responding to landscape structure at the foraging scülr. then landscape structural variables

will becorne significant predictors of squirrel presence rit the 50 m or 100 m scales of
analysis. with less predictive power at the 250 m scale of andysis. If r i stronger response
occurs beyond these radii (250 m. 500 rn or 1 O00 ml thrn othrr large-sctilc processes.
processes, such as dispersai (natal or otherwise: Rusch and Reeder, 1978: Boutin et al.,
1 OF)?: Larsen and Boutin. 1994) may be responsible.
2.3.3 Coiriparisuri fo utlr er sys tem
Don ( 1983) in his review of tree squirrel home range sizes from difkrent studies
and geographicül arcas reportrd lin average size of approximatrly I ha. In white sprucr
forests in Kluanr. YT. squirrel territory size was 0.2-0.5 ha (Price et al.. 1986). In
subalpine lodgepolr pine in Colorado, Gume11 ( 1984) found an average homr range size
0.56 ha with a much less variable range (0.18 - 0.80 ha: n=9) than found herein. He also
noted extraterritorial forays in rxçess of 150 m. though did not quüntify thrir total cxtent.
in jack pinr stands in Alberta. Larsen ( 1993) meitsured ;i rneiin territory size of 0.65 ha.
Movements as h r as 500 m off territories were also reported for adults (Larsen and
Boutin. 1994). in the southern rnixed-wood b o r d of Alberta. Rusch and Reeder ( 1978)
reponed mean rerrirory sizr of 0.24 ha +/- 0.03 (SE: n=6) in white spruce: 0.35 ha +/-
0.02 (n=l I ) in mixed spruce: and 0.66 ha +/- O. 17 (n=7) in jack pinr. M u n movernents
ofca. 64 rn in spruce. 1 10 m in jack pine. and 185 m in rispen were nlso obsrrved (Rusch
and Rerder. 1978). Variability in territory or homr range size can be attributed to
differences in food availability (Smith. 1968), with larger ranses found in mixed
coniferlaspen habitats (Rusch and Reeder. 1978). However, ranges rneasured herein are
larger and much more variable than those previously reported. This should be noted with

caution. however. as problems with compxability arise that must br considered by those
who seek to use published home ranges to qulintify landscape rxtent. Utilization
distributions. kemels. or even territories are nor accurate sauges of the spatial scale of
local ( foraging) processes. nor of the influences of landscape structure upon them. In
these cases use of the matrix by the study animal may br overlookrd.
2.3. J Territories and time frame
Squirrels defend traditional territories al1 year (Smith. 1968: Kemp and Krith.
1970: Rusch and Reeder. 1978). Despite the cost of territoriülity (Stuart-Smith and
Boutin. 1991) defence is zealous. as maintaining a trrritory is critical foi overwinter
survival (Rusch and Reeder. 1978; Gurnell, 1987; Lrirsttn and Boutin. 1994).
Gurnrll ( 1984) distinguishes between the trrritory and the home range. rhe former
being ncstrd within the latter. As u much frequented and defended area. a territory more
çlosely approximatrs a high-density utilization distribution than a minimum convex
polygon. which includes al1 locations (Harris et al.. 1990). The ranges reponed here are
akin to the "domain" of Don ( 1983). which includrs long-distance foriiys as well ris
intensely utilised areas. Thesr lire not often reporteci in the literature. making home-range
cornpiirison difficult. As an additional note, the timr-frame in which my ranges and
published territory sizes were measured, differ. Harris et al. ( 1990) emphasise that the
timr period during which tracking occurs cm greatly influence the outcomr of the
observed home-range size. In this study locations were obtained only over a period of 2-3
weeks in June. July. and hugust. Thrrefore these ranges do iiot describe ii complete
(annual) home range size. nor demarcate temtory boundaries; they do create an index of

the spatial scale of summer !and use by these small marnmals. and determine the extent of
movements between conifer and rn~1tri.u habitats.
2.3.5 Matrixuse by squirrels
Frorn the data I can conclude that squirrels do make use of the deciduous 1
clearcut matrix. and are not conthed to conifer habitats. Fisher and Merriam (in press)
found that red squirrels in Ontario made use of an agricultural matrix when forriging. sven
whrn conifer habitats wrre within close proximity. In .Albsrt;t. Kcmp and Kcith ( 1970)
suggested that decidiious habitats containeci lightly deknded seasonal territories that
maintained juvenile populations until spmce territories brcame availüble. In the sarne
area. Rusch and Rreder ( 1975) reponed movements betwern spnice, jack pine. and aspen
habitats that ranged betwern 1 . 1 and 5.3 km. coinciding with spring shuftk and FdI
dispersal. Yahner ( 1987) t'ound red squirrcls mude use of m q i n u l deciduous habitats in
Pennsylvania where çonikr is limiting. The miitrix indisputobly is used by red squirrels
for movement and feeding.
The data suggest that squirrels may be using landscapr supplementation (Dunning
r t al.. 1992) to provide a substitutable resourcr. rspecilill y in mixrd sprucr/drciduous/cut
habitats. Berries, mushrooms. m i h;urslnutb u n be founci i n LItxidu~us st;inds m d
clearcuts (J. Fisher. unpubl. data). Alternative food sources such as these may br
important components of a squirrel's diet (see Gumell. 1983 for review). Since home
ranges are srnaller within contiguous conifer habitat than heterogeneous areas. i t is
possible that where conifer is limiting their srrds are used by squirrels mainly for
ovenvinter survival, while summrr forage is obiainrd frorn ridjoining patch types.

Temtorial rattles were often heard within both conikr and deciduous habitats, although
were never noted in clearcuts, despite the extensive amount of tirne spent there. I would
tentatively suggest that while deciduous habitat may be included within the boundaries of
defended territories. clearcut rnovements represent extra-territorial forays for
opportunistic foraging rather than ü defended resource. However. much more resèarch is
needed to test such a hypothesis. The data do reveal rhat North Amcrican red squirrels
enter the matnx quite readily. and are not behaviourally restricted from using the matrix.
This suggests that dispersal or other movements are lrss likely ro b r impedrd by iück of
connrctivity (Taylor et al.. 1993) unlikr Eurasian rrd squirrels (Verboom and van
Apeldoorn 1990: Andren and Delin. 1994: van Apeldoorn et al.. 1994: Celada et ai..
1993: Wauters et al.. 1994) and other habitat specialists in heterogenrous landscapes
(Wegner and Memam 1979: Henderson et al.. 1955: Merriüm et al.. 1989: Fitzgibbon.
1993. 1997: but see Szacki et al.. 1993: Wegner and Merriam. 1990).
2. J CONCL USIONS
In the mixed-wood boreal forest of northeast-central Alberta. 100% MCP's
obtained for seventeen squirrels show that these organisms have highly variable foraging
range sizes that exceed territorial esrimiires from other systerns and studirs. The mean
rcological neighbourhood of foraging corresponds ro an area 50 m to 100 m in radius.
Squirrels travel through several piitch types. suggesting that larger-scdr effects sternrning
from lack of connectivity may be less relevant than local-scale phenornena.

2.5 LITERATURE CITED
Addicott, J.F., J.M. Aho. M.F. Antoiin, D.K. Padillli. J.S. Richardson. and D A . Soluk. 1987. Ecolo_gical nrighbourhoods: scaling environmental patterns. Oi kos 49: 340-346.
Ambrose, H.W. DI, and K.P. Ambrose. 1995. A Handbook of Biological Investigation. 5th Edition. Hunter Textbooks Inc., NC.
Andren. K., and A. Delin. 1994. Habitat selection in the Eurasian red squirrel. Scilinis vrilgcuis. in relation to forest fr~gmentation. Oikos 70: 43-18.
van Apeldoorn. R., C. Crlada. and W. Niruwsnhuizrn. 1991. Distribution and dynÿmics of the red squirrel (Sciunis ~dyciris L. ) in n Iandscapti with fragmsnted habitat. Landscüpe Ecology 9(3): 227-235.
Boutin, S., Z. Tooze and K. Price. 1992. Post-breeding dispersa! by female red squirrels (T~nnirisci~inis Izudsonic~is): the effect of local vacüncies. Behavioural Ecology 4(2): 15 1 -
Crlüda, C.. G. Bogliani. A. Giiriboldi. anci A. Mnrxci. 1993. Occupmcy of isolüted woodlots by the red squirrel Scirirrrs vrr1,~ciris L. in Itcily. Biological Conserviition 69: 177- 153.
Danielson. 199 1. Communities in a landscapc: The influence of habitat hererogeneity on the interactions betwern spccies. The Arnrricün Naturalist 138(5): 1 105- 1 120.
Danielson. B.J. 1992. Habitat selection, interspeci fic interactions and landscape composition. Evolutionary Ecology 6: 399-4 1 1.
Dixon. KR.. and J.A. Chapman. 1980. Hürmonic niriin mrasure of animal activity arrcis. Ecology 61(5): 1040- 1 O U .
Don, B A C . Horne range characteristics and correlates in trer squirrels. Mammd Rrview 13 (3/3/4): 123- 132.
Dunning, J.B.. B.J. Danielson, and H.R. Pulliam. 1992. Ecological processes that affect populations in complex landscapes. Oikos 65: 169- 175.
Fahng, L.. and G. Memam. 1994. Conservation of frûgrnented populations. Conservation Biology 8( 1 ): 50-59.
Fitzgibbon, C.D. 1993. The distribution of grey squirrel dreys in f ~ m i woodiand: the intluence of wood area, isolation and management. Journal of Applied Ecology 30: 736-

Fitzgibbon. C.D. 1997. Small mammals in farm woodlots: the effects of habitat. isolation and surrounding land-use patterns. Journal of Applied Ecology 34: 530-539.
Gurnell. J. 1983. Squirrel numbers and the abundonce of trer seeds. Mammal Review 13(3/3/4): 1 33- 148.
Gurnell, J. 1984. Home rangel territoriality. caching behaviour and food supply of the red squirrel (Tmtiasci~inis h~rdsoniciis~keuionri) in a su bal pine lodgepole forest. Animal Behaviour 32: 1 1 19-1 13 t .
Gurnell. J. 1987. The Narural Historv of Squirrels. Chrisropher Helm. London.
H q e r . S.J.. E.K. Bollinger. and G.W. Btirrett. 1993. Effects of patch shape on populations dy mnics of meadow voles ( îVIi~wri is pr~i~iqlvlliticrrs 1. Journ;il of Mammalogy 74.1): 1045- 10%.
Harris. S.. W.J. Cresswell. P.G. Forde. W.J. Trewhellü. T. Woollard. and S. Wray. 1990. Home-range analysis using radio-tracking data - a revie w of problrms and techniques particularly as applied to the study of mammiils. iMammnl Rrvicw 20(1/3): 97- 173.
Kemp. G A . and L.B. Keith. 1970. Dynlimics and regulation of red squirrcl (T~~inicucirinis hriclso~liais) populations. Ecolo_ey j l ( 5 ) : 763-779.
Kotliar. N.B.. and J.A. Wiens. 1990. iMultiple sclilrs of patchiness and parch structure: a hierarchiclil frümework for the study of hrtrrogeneity. Oikos 59: 153-260.
Larsen, K.W. 1993. Female reproductive success in the North American red squirrel, Trimiuscirtnrs hurlsonicris. Ph.D. Thesis. University of Alberta. Edmonton.
Larsen. K.W., and S. Boutin. 1994. Movements. survival. and settlcment of red squirrel (Tmiictscirirru hirdsonicus) offspring. Ecology 75( 1 ): 11 4-223.
Merriam, G., iM. Kozakiewicz. E. Tsuchiya. and K. Haw ley. 1989. Barriers as boundarirs for metapopulations and demes of Perumycrrs lriicup~is in fmn landscapes. Landscape Ecology 2(4): 227-235.
McGarigal, K.. and B.J. Marks. 1994. FRAGSTATS - Spatial Pattern Analysis Program for Quantifying Landscape Structure. Version 2.0. Oregon State University. Corvallis, OR.
Moms, D.W. 1987. Ecological scale and habitat use. Ecology 68(2):362-369.
Morris, D. W. 1992. Scales and costs of habitat selection in heterogeneous landscapes. Evolutionary Ecology 6: 4 12-432.
Pither. J.. and P.D. Taylor. 1998. An experimental assessrnent of landscape connectivity. Oikos 83: 166- 174.
Price. K.. K. Broughton. S. Boutin. and A.R.E. Sinclair. 1956. Territory size and ownership in red squirrels: responsé to removals. Canadian Journal of Zoology 64: 1144- 1147.
Pulliam, H.R., and B.J. Danielson. 199 1 . Sources. sinks, and habitat selection: a landscape perspective on population dynarnics. The American Naturalis t 137: S5-S66.
Rusch. D.. and W. Reeder. 1978. Population ecology o f Alberta red squirrels. Ecology 59(3): 400-420.
Smith. C.C. 1968. The adiiptive nature of s o d orpnizatiun in the Grnus of thrcit: (sici squirrels Tmrticisciunrs. Ecological iLlonogrriphs 38( 1 ): 3 1 -63
Southwood. T.R.E. 1977. Habitat. the trrnplrt for ecologiçal strategirs? Journal of Animal Ecology 46: 332-365.
Stuart-Smith, K., and S. Boutin. 1994. Costs of escalated territorial del'ence in red squirrels. Canadian Journal of Zoology 72: 1 162- 1 167.
Szacki. I.. 1. Babinska-Wrrka. anci A. Liro. 1903. The influence of landscape spatial structure on srncill rniirnmal rnovemrnts. Act~i Thrriologicci 38( 2 1: 1 13- 123.
Tarnahazi. T. 1996. Effects of patch shape on the number of organisrns. Landscripr Ecology 1 l (5 ) : 299-306.
Taylor. P.D., L. Fahrig, K. Henein., and G. Merriam. 1993. Connectivity is a vital element of landscape structure. Oikos 68: 57 1-573.
Urban. D.L.. R.V. O'Neill. and H.H. Shugart. Jr. 1987. Landscape ecology: a himuchiciil perspective cün help scientists understand spatial patterns. Bioscisnce 37(2): 1 19- 127.
Verboom. B.. and R. van Apeldoorn. 1990. Effects of habitat fragmentation on the red squirrel. Scilints vulgcrris L. Landscape Ecology 4(1/3): 17 1 - 176.

Wwters, L., P. Casale, and A. Dhondt. 1994. S p x e use and dispersa1 of red squirrels in fragmented habitats. Oikos 69: 140- 146.
Wegner. J.F.. and G. Merriam. 1979. Movernents by birds and srnail mammÿls between a wood and adjoining farmland habitats. Journal of Applied Ecology 16: 349-357.
Wegner, J., and G. Merriam. 1990. Use of spatial tlements in a familand mosaic by a woodlmd rodent. Biological Conservation 54: 263-267.
Wiens, J.A. 1989. Spatial scltling in ecology. Functional Ecology 3: 385-3137.
Wiens. J.X.. C S . Crawford. and J.R. Gosz. 1985. Boundary dynamics: a conceptual framework for studying landscaps ecosystrms. Oikos 45: 42 1-427.
Wiens. J.A., N.C. Stznsech. B. Van Horne. and R A . tms. 1993. Ecologiccil mrchüiiisms and landscape ecology. Oikos 66: 369-330.
Worton, B.J. 1989. Kzrnel rnethods for cstimiiting the utiliziition distribution in home- range studies. Ecology 70( 1 ): 164- 168.
Yahner. R.H. 1987. Feeding site use by red sqiiirrels. Tmiictscirinls Irirdso~iicus. in ri marginal habitat in Pennsylvania. Canadian Field Naturalist 101(4): 586-589.

Chapter Three
Squirrel Response to Landscape Structure at Multiple Spatial Scales
3.0 INTRODUCTION
The relationship betwern landscape structure and animal abundance hiis been
frequently demonstrated in agicultural and other anthropognically rnodified landscapes.
In these systems fragmentation is extensive: few small patches of native habitat remain:
and organisms typicrilly prrceive considerable contrasr betwren the native and nov4
habitat patches. Insects (Jonsen and Fahri;, 1997: Pither and Taylor. 199s ). songbirds
(Wegner and Merriüm. 1979). [etriionids (Aberg et al.. 1993). and small mrtrnmals
(Wegner and Merriam. 1979: Hrnderson et 21.. 1985: Kozakiewicz. 1993: Bennett et al..
1994: Fitzgibbon. 1997: but see Wegner and Merriam 1990) have shown a response to
fragmented landscape structure. The possible mrchanisms dri ving th is response Vary. but
in general an afinity for some aspect of the landscripe - be i t proximity of remnünt
patches (Aberg et al.. 1993, corridors ( Wegner and Merriam. 1979: Hcndrrson et al..
1985; Memam, 1988, 199 1 ; Merriam and tanoue, 1990: Fitzgibbon. 1997). edge
(Donovan et al., 1997). diversity (Tapper and Bames. 1986; Jonsen and Fahrig, 1997). or
novel patches (Fisher and Merriam. in press) - coupled with a negative response to some
other aspect. results in a net increasr or decrease in abundiince in cornparison with a
native system.
Although pervasive in modem landscapes, anthropogenic habitat fragmentation is

not the sole fom of heterogeneity. Naturai processes also cause variation in landscape
pattern (see Wiens, 1976; Urban et al.. 1987 for reviews). In the Canüdian mixed-wood
boreal Forest. for example. relarively srnall topographic differences can cause marked
differences in the vegetation growing on a site. Fire. disease. pest outbreak. and
windthrow al1 contribute to the creation of a diverse mosaic of plant and animal life
(Hansson. 1997). While fragmentation bas becn the golden calf of landscape ecolog for
more than a drcade. very few studies hiive sxplored the possibility that landscapr
structure might inthence animal populations in nriturally lietero, aeneous tireas.
Natural landscapes are generally more cornplrx than anthropogenic ones. Incking
linear pattern and possessin~ higher fractül dimensions i Turner. 1 989). Native patch types
are generally contiguous except when rare in the Iündscape. Edges betwern native patches
(inherent edges) are generally more graduai than their anthropogenic coiinterparts
(inducrd rdges: Vollrr, 1998), and are generally characterised by gradua1 ecotones rather
than sharp edges (Hansson. 1994). Any existing :inthropogcniç frqrnrntation is intrusive
rather than enveloping (Harris and Silva-Loprz. 1992). An exümple of such a landscape is
the boreal mixed-wood forest of northern Alberta. In this region tirnber hürvest for pulp
has comrnenced within the Iast decade. creating small pockrts of anthropogenic early-
successional patches within the naturally heterogeneous matrix.
Like anthropogenic landscapes. perception of the degree of contrast betwern
different patch types in natural landscapes is species-specific (Wiens. 1976: Kotliar and
Wiens. 1990). By logical extension the intluence of landscape structure on animal
distribution is also species-specific, and depends on the oganisrn's specialization to

different pûtch types (Andren et al.. 1997). A behaviourülly tlexible (Wegner and
Merriam. 1990; Henein et al.. 1998: Pither and Taylor. 1998) or 'mosaic species'(sensn
Bright. 1993) would view the landscape as more homogeneous, or heterogeneously
undivided'(Addic0tt et al.. 1987) and would be able to use several patch types in the
mosaic. Alternatively. a behaviourally inflexible or sprcialist sprcies relies upon one or
two spscific pritch types. rendering othcr patdi types in the Iandscapz marginal or èven
unusable habitat (Bright. 1093: Andren et al.. 1997). For the latter species. if a required
patch type was sparsely distributrd within a mritrix of less suitable habitat. a naturally
heterogeneous Iandscape could pardlel an anthropogenicall y fragmentrd one. 1 postulated
that this was the case for North Amsrican r d squirrels.
In the rnixed-wood boreül Forest of northrrn Alberta where this study w;is
conducted. conifer is limitrd and occurs mainly in patchrs within the cispen matrix. This
suggesrs that red squirrels. as conifrr speciiilists (Smith. 1968: Kemp and Keith. 1970:
Rusch and Reeder. 1978: Riege. 199 1). would perceive i t as heterogeneous and would be
susceptible to the effects of Iündscape structure. I crnsusrd r a i squirrrls within threr
study areas. each with a different source of hrterogenrity: a Managed areri. a Burned areü.
and a Reference area. I tested the prediction that red squirrel presence or absence in these
areas was related to the composition and configuration of the landscape. measured at a
number of spatial scales.
The appropriate spatial s a l e at which ro quantify a landscape has becn n matter of
some debate. An organism's response to heterogeneity can occur at srveral spatia: scales
(Wiens, 1976, 1989; Morris, 1987). If habitat selection (either behavioural or functional)

is driving the response to landscape structure. thrn the integration of selection at several
nested hierarchies of patchiness will produce non-random distribution patterns at a given
scale (Kotliar and Wiens, 1990). For example. herbivores rnay respond to clurnps of food
plants within a stand. and stands within a landscape (Srnft et al.. 1987). Thiis. response to
landsciipe structure rnay occur at different grains, and different extents. and the relative
importance of these will diffcr. When exploring rhc possible influence of hndsciipe
structure on organisms'distribution. it is critical to investigtitc that relationship in the
context of an ecological process and the spatial s r i i l r tir which i t occurs.
In the absence of data tc suggest which eçologictil process might be the most
important in effecring the response to Iandscape heterogeneity. a prudent approach would
be to examine the Iandscape at several different spatial scales (Wicns. 1989). In this
chapter. I have quantifird the landscüpe üt fivr different cxtents and iit two different
grains. The five landscape rxtents wsre chnrncterised by circu lrir boundxies of di fferrnt
radii. The smallest radii (50 rn and 100 m) correspond to the scalr nt which red squirrel
foraging occurs (Chapter One): the largest radii purportedly correspond to the spatial
scalc ai which longer-range movements. such as thosr undertaken during dispersal. occur.
Regression analyses were performed to look for relritionships between red squirrel
presence and landscape s tructure as quanti tird iit thrsr di fferent spatial scülcs. The grain
of landscape analysis that yields significant predictors of squirrel presence should reveal
the level of patchiness that squirrels respond to. whereas the spatial extent at which
landscape structure becomes a significant predictor of squirrel presence should indicare
the ecological process driving red squirrels' response to natural heterogeneity in this

mixed-wood boreal sys tern.
3.1 METHODS
3.1.1 Squirrel presence
Presence 1 absence data for red squirrels were obtained through cal1 surveys.
Points were visited 4 times over the surnrners of 1996 (managrd grïd only) and 1997 (al1
grids except one Managed meso grid). The occurrence of red squirrel territorial calls over
a ten-minure period were noted tit rach visit: audible calls are assumed to originate from
squirrels within 100 m of the point. Squirrels were termed "presrnt" at a station where at
least one cal1 was henrd and "absent" where thry were not. within a given year. to yield n
binüry response variable.
3.1.2 Landscape classification
The study landscapes had bern mapprd using Alberta Vcgrtütion Index ( N I )
protocols and digitized using i\rc/Info grogrtiphic information systems i GIS ). Thrss
digital coverages. provided by Alberta-Pacific Forest Industries Ltd.. describe canopy
closure, dominant and subordinate stand types. and yeu of origin, for discrete stands
temed polygons. Polygons in these covr rages were reclüssi fied to describe the landscape
in two grains (sensu Kotliar and Wiens, 1990): FORCOV (forest cover) and UPLOW
(upland 1 lowland). The UPLOW reclassification described each polygon ris simply water.
lowland (wetlands and bogs) or upland (mesic to xenc areas with no standing water). The
FORCOV reclrissification (Table 3.1) was based on dominant stand types to yield ten
forest cover classes on the Managed and Reference grids. On the Bumed grid the
38

dominant tree species within the polygon was combined with burn information to
categorize the polygon as bumrd lowland (bumed SBLT or MARSH). drsignatrd
BULOW. bumed deciduous (BDEC). or bumed pine (BPINE).
The landscape structure around each grid point was quantified using
FRAGSTATS (McGarigal and Marks. 1994) at fivr spatial scales. To examine the effects
of scals. landscape boundaries of 50 m. 100 m. 150 ni. 500 m. and 1000-m radii were
created around rach mega grid point. Liindscapr structure wiis also and ysèd on the meso
urids at 50 m. 100 m. and 250 m. Landscaps configuration and compositionül variables at b
cach scalr. around rach point. wrre clilçulated for the FORCOV - reclassified coverages
and the UPLOW - reclassified covrrages.

Table 3.1: Reclassification protocol applied to Alberta Vegetation Index forest inventory maps to produce the landscape composition variables used in analysis. Variables printed in bold were transformed and included in regression analyses.
---
AVI Forest Cover Type Relative Amount Variable
CUT
DEC
anthropogrniç vrgetlitrd anthropogenic non-vrgetated
cut
trembling cispen balsam poplx birch
non-forest type
trernbling rispen birch balsam poplar
and jack pine lodgepole pine
trembling rispen birch balsam poplar
and white sprucr black spnice 1 arc h balsam Cir
pure oi mixed

Table 3.1 (cont.)
XVI Forest Cover Type Relative Amount Variable
SBLT
jack pine lodgepole pine
or jack pine lodgepole pinc
and l arc h black spruce white spruce lodgepole pine balsam f'ir jack pine
black spruce or larch or
black spruce l ;ire h
and jack pine lodgepole pine black spruce white spruce balsam tir lrirçh
white spruce baisam fir
or LV hite spruce balsam fir
and l arc h black spruce lodgepole pine jack pine balsam fir
pure
20-30%
pure
pure

3.1.3 Areal composition
In Arclinfo ii buffer was creüted that extrnded approximately 1 km out from the
outermost points on the klanaged. Reference. and Burned Areii mega ;ind rnsso grids. The
coverages were clipped. and these new digital covrragrs were imported into ArcView
GIS (Esri Inc., California. USA). In ArcView the total areas in square metres ofeach
FORCOV class type were calculated. to describe the overall composition of each study
rireri.
3.1.4 Lairdscape compositiorl
The diffrrent FORCOV cllissifications generated by our recliissification procedure
are listed in Table 3.1. However. many of thesr occurred in small amounts within each
radius landscape. leading to a Poisson distribution rather than a normal one. Variables
were selccted that did not have a large preponderancr of zero vtilues in the dataset: those
thlrt were included are printed in bold font in Tuble 3.1.
Thrsr variables were still not normülly distributrd ÿt smaller sçales (Kolmogorov-
Smirnov test for normality; p>0.05: SPSS Inc.. 1996) and so were transfomed usin; the
formula:
arcsin (square roottp) }
where p is the proportion of a @en habitat type within the landscape lit riny givrn scale
(Zar, 1996). All composition variables measured at al1 scales were transfomird using this
method. This resul ted in variables not significantly diFferent from a normal distribution
(Kolmogorov-Smimov test for normality; pc0.05; SPSS 1996), or variables that more
closely approximated normality.

3.1.5 Londscape configuration: Heterogeneity
Although FRAGSTATS output includes many configuration variables. only a few
were selected for analysis. based on limitations of our vector dataset and type of
information that the variables provide (Table 3 . 2 ) . l'hese indices are highly correlüted.
and provide much the same information. To condense thrrn inro ii single mrüsure of
Iündscape configuration. cdge densi ty (ED), largsst paich indss (LPI). mean parch size
(MPS), mean shape index (MSI). patch density (PD). patch richness density (PRD). and
Simon's rvenness index (SEI) were entered into a principle cornpoticnts analysis (PCA)
iising factor andysis by principlr componrnts in SPSS (SPSS Inc.. 1996). The PCA was
run for èach sclilr. within züch grid. within rach rireü. This analysis incorporated
information from each configuration variable into ii single componcnt thüt 1 termed
heterogeneity (HET). Essentially. as HET increiises. so does cdge density, mean shape
index. patch density. patch richness. and evenness: largest patch index and mean patch
size decrease. This HET variable was used to represent Ilindscüpr configuration in funher
analyses.
3.1.6 Stati.stical analysis
To look for differences in the explanatory power of Iandscape structure at
different scales. logistic regression analyses (Hosmer and Lrmeshow. 1989) were used to
search for relationships between squirrel presencdabsence and the landscape variables on
the Managed. Bumed. and Rrferewe mesa grids. A multiple logistic regression mode1
(SPSS inc.. 1996) regressed squirrel presence agüinst the composition variables listed i n
bold in Table 3.1 and HET, measured rit each scale. Also included were the interaction

terms between HET and those transformed composition variables that made up the Iargest
portions of the Iandscape. 1 transformed variables for a bsttèr mode1 f i t cilthough normiil
distribution of variables is not ÿs n r c r s s q for lo_oistiç regression us it is for linrtir
regression (Menard, 1995). A forward conditional selection procedure with a significance
for inclusion criterion of p=0.05 was used (SPSS Inc., 1996) as this method reveals those
prediçtor variables rhüc explüin the rnost variation in the rzsponsr variable (Hosmer and
Lemeshow. 1989: Menard. 1995).
Regressions were ccirried out for variables nitasureci Lit eüch s d e hcpariitely. For
the 1000 m-scale ünülysis adjacent points were dropped systematically to prevent overlap
and maintain independence between landscapes.
To augment the number of lirelis invrstigüied. rrgressions were also performed on
data from the !Mcinaged. Burned. and Rrfsrenci: meso srida. Adjxrnt points were
dropped systrrnatically ür the 250-m anaiysis on the meso grids to muintain st~itistical
independence. As the scale range was limited on these grids. and the number of data
points inciuded in analysis differed from the mega grids. this analysis was conducted only
to determine if the landsclipe variables predicting squirrel presence were the sarne as on
the mega grid systenis. not for sciiliir compürison.

Table 3.2: ERAGSTATS landscape configuration variables chosen for use in analysis. The relationship between each variable to the PCA component HET (heterogeneity) is shown. An increase in HET within a landscape indicates more edge, no large contiguous patches, srnall mean patch size, cornplex-shaped patchrs. a high density of ptitches and different patch types. and high landscape diversity.
Variable name Description Variable acronym
Con tribut ion to HET
ED
LPI
MPS
MSI
PD
PRD
S IEI
edge density
Iargest piitch index
mean pütch size
rnean shape index
patch density
patch richnrss density
SirnonS Evenness Index
A rneiisure of total edge + brtween al1 patch types in the Iandscape, per unit area.
The percçntage of total - landscape area cornprisrd by the liirgest patch.
The average patch size of al1 pütch types in the landscape.
Compares the shape of a patch + to a circular standard; averriges xross dl patchss in the landscape.
The numbcr of patches of al1 Iündscape types. per unit area.
The number of patch types present. per unî t riren.
The observed piitch divrrsity. dividrd by total possible diversity. while controlling for patch richness.
Multiple stepwise logistic regression milyses wrre repcitrd for vciriablrs
measured at each scalr, tit each Area. and within each year, separately. These analyses
were expected to reveal the important predictors of squirrel presence rit eiich scale. The
spatial scale at which the regression rnodel has the greatest deviance rxplained
(predictive power), as measured by the Nagelkerkr R' (Na_prlkerke' 199 1 ) should indicate

the spatial scale at which squirrels respond to Iündscape structure.
3.2 RESLILTS
3.2.1 The upland / lowland grain
The percent of upland in the study ürea did not predict squirrel presence at itny
scale in any area; nor did FRAGSTATS configuration variables derived h m these
reclassified landscapes. The remainder of the analyses focused on the forest cover
(FORCOV) reclassi fication.
3.2.2 Forest cover: Composition of the stiidy areas
Figure 3.1 depicts the composition of the ~Mantiged Area. DEC dominates the
landscape. covering 43% of the area. SBLT constitutes the next lurgest ürea iit 1 1%. PJ
(7%) and SW (2%) comprise the remaining conifer element. iMDS and MDP cover only
1% and 2% of the landscapr. respectively. Only 9% of the landscüpe lias bcen harvested
for timber (CUT): another 2 4 hlis been clrüred for roads. pipelines. anci agriculture ( A-
OPEN).
Figure 3.2 portrays the composition of the Burned Area. Ii is dorninated by
BULOW. which covers 34% of the areü. Unburned SBLT covers 10%: burned m d
unbumed pine cover 1 1 % luid 2%. respectively. Unbumed DEC comprises 1 2 8 and
bumed DEC another 7%. Salvage logging hüs occurred on 2% of the landscüpe.
Like the Managed Area. the Reference Area is dominated by DEC (40%) (Figure 3.3).
SBLT (21%) and PJ ( 18%) müke up the majority of conifer. MDP (3%) and MDS ( 1%) is
lirnited. as is SW (2%). Two percent of the area hüs been cur and another 1 % cleared for
roads and pipelines.

Figure 3.1 : Landscape composition of the Managed Grid.

Figure 3.2: Landscape composition of the Bumed Grid.

Figure 3.3: hdscape Composition of the Reference Grid.
?
'EN

3.2.3 Goodness of fit of the logistic model
The -2 log likrlihood (-ILL) cornputed in logistic regression approximates a X2
distribution and allows one to test if the model is significantly different from a logistic
function (Menard, 1995). Appendix 1 lists the -2LL's of each of the models and the p-
value associated with it (Zar, 1996). At every scale on the mega grids. the modrls created
do nor deviate significantly from a lo;istic funcrian. They do. howcvçr. drviate sli_ohtly
on the Maniigcd meso grids at 50 m and 100 m ( 1996). and on the Reierence rneso grids
at 50 m. In thest: cases the -2LL values of the models are very close to the ' X 2 values
associatrd with cc = 0.05. Therefore the logistic function is the best one to describe the
reliitionship betwern the Iiindscape variables and squirrel presence / absence.
3.2.4 Landscape striictiire and sqziirrel presertce
The predictive powzr of the regression models US niecisured by the Nagclkerke
R') changed with spatial scale. but did not do so consistently ücross grids. Different
landscape variables significantly predicted squirrel presence in each grid. and at each
scale within a grid. The attained statistical significance. the percentage of correctly
classified cases. and the number of cases frorn al1 modrls are listrd in Appendix 2.
On the Mnnaged Area rnega grid in 1996. the prrdictivr power of landscüpe
structure peaked at 100 m but was roughly similar iicross al1 scales except 1000 m. where
no variables predicted squirrel presence (Figure 3.4a). Heterogeneity and jack pine were
significant at 50 m: deciduous and black spruce. or interactions. were significant at larger
scales. On the Maniiged mes0 grid in 1996 deviançe rxplained peaked iit 150 m. with
deciduous and heterogeneity as significant predictors at different scdes (Figure 3%).
50

In 1997 on the Managed Area mega grid, R' decreased from 50 m to 250 m. then
increased from 250 m to 1000 rn (Figure 3.lb). At 50 m to 750 m. conifer composition
variables were significant. At 500 m and 1000 m. intrrction terms brtween çonifer
composition and hrterogeneity were ülso significant: interestingly. there is a nrgative
relationship betwcrn hsrsrogeneous black spruce and Irirch, and squirrel presence iit the
500-m scrile, unlike the positive rellitionships obsenrrd at other scslrs. On the Manliged
mes0 grid in 1997 only HET was significant. rxplaining a low rimorint of deviance (R'
~ 0 . 2 ) rit 50 rn and 100 m (Figure 3.5b). No vxiables were si@ïcrint at 750 m.
On the Rekrence Area mega srid. predictive power was greatrst at the 250-m
scalr (Figure 3.6a). Drciduoits wiis a significant ncgativi: prediçtor of squirrel presence
dong with marsh. at 50 m. Conifer composition variables were significant iit the 100 m
and 250 m scales. Deciduous was the only significant (negative) variable at 500 rn:
nothing wiis significant at 1000 m. On the Refsrenct: meso grid. deciduous nrgiitivrly
predicted squirrel presence at 5Om. whilr white spnicr and jack pine predictsd squirrel
prrscnce at 100 m. with greatrr deviance rxplüincd (Figure 3.6b). Nothing was significant
rit the 250-m scale.
On the Bumed Area mega grid. predictive power was highest at 50 m. with no
significant modeis at 250 m and 500 m (Figure 3 . 7 ~ ~ ) . Minsd deciduous-pine and the
heterogeneity-deciduous interaction were significant nt the 50-m scÿlr: the latter
negatively predicted squirrel presencr. Deciduous was a positive predictor at 100 m.
unlike the other Areas. On the Bumed meso grid predictive power is also greater ai 100
rn, but different variables are significant at each scale (Figure 3.7b).

Figure 3.4: The drviance explained by multiple logistic reyession models in which squirrel presence wns regressed against landsclipe structural variables. The significant variables (pc0.05 ) included using a forward selection procedure are listrd on top of the deviance bars in the order in which they rntered the model.
Managed Mega Grid 1996
HET APJ
ADEC*HET XSBLT -ADEC
ASBLT -ADEC ASBLT
Ltindsciipe Radius
Managed Mega Grid 1997
Lrindscapc: Radius

Figure 3.5: The deviance explained by multiple logistic regession models in which squirrel presznce was regressed ilgüinst landscape stnicturlil variables. The significant variables (p<0.05) included using LI forwtird selecrion procedure are listed on top of the deviance bus in the order in which they entered the model.
Managed Meso Grid 1996
50 100 25 O
Liindscrioti radius
Managed Meso Grid 1997
Ltindscape Radius

Figure 3.6: The deviance rxplained by multiple logistic regression models in which squirrel presence was regressed against landscape structural variables. The significant variables (pc0.05) included using a forward selection procedure are listed on top of the deviance bars in the order in which they entered the model.
Reference Mega Grid 1997
ASBLT APJ
APJ -AMDS
- . . . .
50 100 250 500 1000 Llindscape Radius
Reference Meso Grici 1997
1.0 ;
50 1 O0 250
Landscape Radius

Figure 3.7: The deviance explaincd by multiple logistic regession rnodels in which squirrel presence was regressrd agains t landscape structural variables. The significiint variables (pc0.05) included usin_o a forwcird selection procedure are Listcd on top of the deviance bars in the order in which they entered the model.
Burned Mega Grid 1997
AMDP ADEC
Burned Meso Grid 1997
XDEC -ABDEC .AhlIDP
XBuLOW*HET ABPINE*HET
Lrindscape Radius

3.3 DISCUSSION
3.3.1 The explanatory spatial scde
The reclassification of forest cover types into itpland or lowland proved too coarse
a grain to predict squirrel presence. The data suggest that squirrels are respondins to
patchiness that occurs at a finer resolution. Although this conclusion is intuitively
obvious from the known habitat preferences of red squirrels (Smith. 1968: Kemp and
Keith. 1970; Rusch and Reeder. 1978). this exsrcise serves to demonstrate the importance
of detrrmining the appropriate grain of anal ysis bcforr searc hing for urganisms' respnse
to landscape structure.
At the forest cover (FORCOV) grain. no one Iandscüpr cxtent consistently
predicted squirrel prescncr on any of the mega grids. On the Manngrd Area. more of the
deviünce was explainrd nt the 50 m scülr than the 100 rn or 250 m scales. as
hypothrsisrd. Howevrr the difkrence betwren scalés wcis marginal: drviançr explainrd
actually peaked at the 500 m and 1000 m scalrs. On the Burnrd mega grid. deviancr
rxplained peaked at 50 m. with nothing significant at scales beyond 100 m. On the
Rrference mega grid the 250 m scale brst predicted squirrel presence. although there
were significant rnodels üt al1 scüles. Clearly, a single spatial scalr at which landscapr
structure affects squirrels' distribution is not disccrniblr using this iipproach.
Response to patchiness at multiple landscapr rxtents (hereafter synon ymous with
spatial scale) has been observed in a host of othrr cross-scalar studies csee Wiens. 1989
for review). h a study very similar to this one. Monkkonen et al. ( L997) found that the
probability of patch occupation by flying squirrels in Finland was related to landscape

structure quantified at severai different landscape radii. including the presurned home
range radius of an individual and the 'local range' radius of srveral individuals. but not at
the population scair. Tree frog occupation of ponds in the Nethrrlands was found to be
related to landscape elernents at several concentric landscape extents. as well as local
factors (Vos and Stumpel. 1995). Rukkr and Midtgüiird ( l91)S) found that response of
fungivorous beetlès to spatial structure rneciliured iit local (babidiocarp) and largér (Forest
island) scales but not intermediate ones. Colony performance of Forest tent caterpillars in
Alberta (Rothman and Roland. 1998). as well lis rites of parasitoid infection (Roland and
Taylor. 1997) were dso predicted by fragrnrn tcd forest structure at srveral crncentric
spatial scales.
The scales of forüging range and dispersal might be the two rnost likely to
intluence patterns of animal distribution (Morris. 1992). but no evidence of a strong
response to eithcr was found in this study. Kotliar and Wiens ( 1990) suggçst that since
hrterogcneity occurs over a range of scales of patchiness. thrn responsr to that piitchiness
also has an integrated multidimensional property. For example. red squirrels rnay be
responding to iiggregations of conrs within ii trer. trees within stand. stands within a
stand aggregate. and aggregates within a landscape. The intluence of several different
patch levels in the hirrarchy interact to effcct the responsr obsrrved at any givrn spatial
scale (Urban et al.. 1987: Wirns et al.. 19931. Therefore the 'ecological neighbourhood'
(Addicott et al.. 1987) may be delimited by the spatial and temporal scale associated with
one particular ecological process. but it is likely that several processes operating
concurrently ultimately influence the probability of patch occupation by red squirrels. The

relative importance of each process might be context-specific. My data suggest that the
scale at which response is mont prominent (hishsst deviance explained) varies with areal
composition. This is aiso true of the landscapc stmctural variables thrmselves.
3.3.2 Explanatory variables differ betwern areas and scales
Naturaily derived heterogeneiry, as quantifird by landscape composition and
configuration. did predict red squirrel presence in a11 three study areas. The important
variables selected by the regression procedure changed with landscape radius.
Heterogeneity (HETI was often inçluded as (i positive signifiçant pixiiçtor of squirrel
presence on the Managcd and Reference grids ( 1997). Hetrrosencity ülonr wiis
signi ficant on the Managed meso grid: positive intertictions wi th conifer composition
were tound on the Mannged megii grid and both Burned grids. This interaction suggests
that whrn the relative amount of conirer W U low. hrtrrogeneity wiis important in
predicting squirrel presence. Small piitches of çonifer with I q e r arnounts of edgé habitat.
juxtaposed with othrr marginal habitat types (deciduous). hüd highrr probübility of
occupation. Whrre the relative iimount of conifer in the lnndscapr increased. the
importance of heterogeneity decreased; probability of occupation was higher in
contiguous conifer tracts than in t'ragmented (naturally or otherwise) patches. A
contradiction occurred at the 500 rn scale on the Managed mrga g id ( 19971. whrre
heterogeneous conifer negatively predicted squirrel presence once conti_euous coni fer
entered the model. in contrast. heterogeneity did not predict squirrel presence at any scale
on the Reference mega or meso grids. This area is characterised by luge contiguous tracts
of conifer (Figure 3.3), which may explain why heterogeneity failed to predict (positively

or negatively) squirrel presence.
The relative importance of contiguous versus patchy conifcrous merits further
investigation. A source-sink dynamic rnay be operating (Pullirim. 1988: Danielson, 1992).
wherein srnall sink patches of conifer set into a deciduous matrix can support individuals
that 'overtlow' from larger contiguous source patchcs. but whrre mortality rxcrrds
natality. This is suggested by the habitat-spccifis dernogriiphic data of Kcmp and Keith
(1970) and Rusch and Rrrder ( 1978). Such ovrrtlow systems can be important in
inaintaining a population of territorial animals where juveniles may have to wait until a
temtory suitable for reproduction becornes avriilable ( i .r . . ideal pre-rmptive distribution:
Pulliarn and Danielson. 199 1 ). This supposition is supported by the nrgative intluence of
heterogeneity at larger scales. which wouid be exprcted to effectively 'draw' individuals
awiiy from a site rathrr than contribute to occup;ition probability. h more involved
investigation is required to test this hypothesis however: this study providrs information
on patch occupancy. but habitat- and landscape-specific demographic rates are needed to
provide more insight into the mechanisms behind the distribution patterns obsrrvrd.
In terms of landsciipe composition. the amount of conifer (black spruce. white
spruce. jack pine. and mixed conifedasprn) was positivrly. and the amount of deciduous
negatively. related to squirrel presence on the Managed and Rrferencr Grids. This
occurred at the local scale and at larger scales. The relative importance of e x h patch type
in the mode1 changed with scaie and with grid. The importance of conifer in general was
obviously expected. as squirrels rely on conifer for ovenvinter survivd (Smith. 1968:
Kemp and Keith, 1970: Rusch and Reeder. 1978: Riege. 199 1 ). It is interesting to note

that the presence of conifer beyond the patch - at radii of 500 m and 1000 m - also
predicted squirrel presence, often with variables dissimilu from those that at smaller
scales. This suggests that there is a cross-sçalar association btltwern differen t patch types
within the mosaic. Deprnding on local frequency. somr pcitch types ( c g . black spruce)
may be important for squirrel presence iocally, in conjunction with other patch types (e.y.
jack pine) within the largtr landscape. X sirnilar situation was discovered by Monkkonen
et al. ( 1997); thry found that nlthough open habitats nrgatively predictrd tlying squirrel
presence üt larger scales. ni the scdr of individual mowmrnt the prescncr of open
habitats positive1 y predic ted squirrel prrsrncr. Local-scdr Iieterogenei t y hvoured
squirrel presence through the juxtaposition of pÿtch types and the presence of rdge.
although at larger scales open habitats sirnply represented non-preferred habitat. A cross-
scliliir patch-type interaction. or a shift in the direction of ü rrlationship with sçalr. has
rarely brrn considered and htis sipnificünt implication5 for rculogisth iind thoe \crkin_r ro
manage wildlife habitat.
Also of vital importance is the iden that the çontrxt in which the landsclipe is
situated is a critical component of the overall rffect of landscape structure. On the Bumed
grid. for rxamplr. the amount of deciduous cover positive1 y predic ted scpirrel presence
(mega and meso grids) contrary to results frorn the Mtinaged and Referencr cireas and
known red squirrel habitat preferences. In the Burned area whrre little mast remains. a
few mature conifer trees located in stands classified by AVI maps as unbumed deciduous
are possibly important habitat for the population. Context-dependency was noted by
Andren ( 1994, 1996, 1999) who suggested that in areas where large tracts of contiguous

suitable habitat are present. landscape composition would be the driving influence of
animal distribution. In areas where suitable habitat is rare, then configuration is more
important. Investigation of the importance of Iandscape context in mediating response to
landscape structure has been addressed in few studies and mainly as a periphçral issue
@.y., Aberg et al.. 1995: Delattre et al.. 1996: Donovnn et al.. 1997: Hansson. 1998). The
problem becomes especially cornplcx when one considers that the response ro landscapr
structure diffus not only across space. but iicross time iis well.
3.3.3 Di/fereences betwecn years
The differences between regression models drawn from 1996 and 1997 data rire
marked, urspite the Fact that from one yrar to the next. only the amount harvestsd (and
conversrly the amount of deciduous habitat) changed slightly. Noncthelrss the relative
predictive power of tach scale changed between years: in 1 996 landscape structure at
1000 m radius failed entirely to predict squirrel presrncr. but i n 1997 most of the
deviance was explainrd at this scale. The interaction brtween heterogenrity and
deciduous was important at the small sçalrs in 1996: in 1997 the hrtrrogeneity -jack pinr
interaction was significant üt large scalcs. These results indicüte a large amount of
temporal variability in squ irrels' responsr to landscape structure in this system.
Patchy distributions of organisms are often speculiited to be the product of tïtness
differentials among patch types: ti tacit assumption of this is thüt there is no temporal
relaxation of selection pressure to occupy prime habitat (Wiens. 1976). This assurnption
is often violated in heterogeneous habitats throiighout the year. Population dynamics are
often adapted to the degree of temporal variübility in a system, especially in systems

where natural disturbance is frequent (Wiens. 1976) such 3s the boreal forest (Hansson.
1992). Red squirrels may br rspeciiilly prons to temporal tluctuations in habitat quality,
as the cone crop produced by conifers (white spruce and black spruce. but not necrssarily
jack pine) varies dramatically over time. and red squirrel survival, immigration. and
hencc density are known to fluctuate in response to cone crops (Wheatley. 1999). Habitat-
dependent variability in demography and density wcluld have a signifisant effect on a
source-sink dynamic if i t were operating in this systrm. and would iiccounr for the
striking change in the relative cffects of landscapr structure ovsr rime. This temporal
variability should be alÿrming to most landscape ecologists, as many studies are
conducted within the space of only one year. The next genrration of landscape ecology
studies should focus on the causes of this temporal variation. (is this may shed light on the
al!-to-oftrn ignored mechrinisms brhind orgcinisrns' responsc to Iiindscapr structure.
3.3.4 Manageme~t implications
This study was rnandated undrr the Sustainable Forestry Management Network of
Centres of Excellence to determine the importance of landscapr structure in detemining
animal übundance in the hopes of creating management plans thüt would minimise the
impact of tirnber huvcsting on wildlik. The percent of the Iündscitpr ciit (CCT) was not
a significant predictor of squirrel presrnce in the Manliged A r a This may bc because
only 9% of the landscape was harvested (Figure 3.1). The radio tracking data (Chapter
One) show that squirrels are found in the cutblocks and are not behaviourally restricted
from travelling or foraging in them. Extrapolation of these results to landscapes with
more extensive modification is not possible: evrn extrapolation brtwrrn similar naturall y

heterogeneous areas is untenable. Given the high degree of variability in the patterns
detected it is impossible to create a universal harvest management plan. For example, one
may conjecture thot where black spruce is scarce in the landscapr removal of the aspen
habitat may exliggerate effects of isolation (sre Andren 1994. although there rnay be
little impact in areas where spmce patches are contiguous. A better understanding of the
rnechanisms driving distribution. rrither than pattern-seeking, is required before sound
management recornrnendations can be made. These müy have to be made on a case-by-
case basis: as it stands no single variable or spatial scale hüs been shown to bs
consistently important. The only sound conclusion is rhat Iandscapr structure dors
intluence the distribution of red sqiiirrels in this area and that planning should occur on
the landscape Irvrl. as red squirrels are influenced by large-scalr landscape structure.
3.4 CONCLUSIONS
Nütural (non-anthropogrnic) landscape composition and configuration did predict
squirrel prrscncr. txplriining up to 70% of the drviance in the sq~iirrel dataset. indicüting
that response to Iündscape structure is not an artefact of anthropogenic fragmentation. but
is a naturally occumng phenornenon. The scale at which this response occurred varied
with landscape context. with different scales dominating on the Burned. Managed, and
Reference grids. It also vaned between yecirs on the Managed grid. There is no evidence
to suggest that response to landscape structure is associatrd mainiy with local-scülc
processes such as foragin; or alternatively with Iÿrger-scde processes such as dispersal. It
is possible that a variety of processes interact to generate the observed distribution pattern

of red squirrels.
The variables that predictrd squirrel presence varisd with spatial scale and
Iandscape context. They also changed between years within the iManaged grid. In general.
increased heterogenei ty and conifer was positive1 y associated w i th squirrel presence,
while contiguous deciduous forest predicted sqiiirrel absence. The shift in relative
importance of Ilindscrtpr vtirirtblrs ma' br î function of the fluctu:itions of resource use
by squirrels in response to habitat qmlity (çonr crop). A shift in ernphüsis from pattem-
seeking to hypothesis testing is required to rstablish the mechanisms causing the multi-
faceted response to heterogeneity observed in this study.
3.5 LITERA TURE CITED
Abcrg. J.. G. Jansson. J.E. Swenson. and P. A n @ m n 1995. The rfkct of matrix on the occurrence of hazel grouse (Bo)i<rs<~ bomrsi<c) in isolatrd habi trit fragments. Oecologiü 103: 265-269.
Addicott, J.F., J.M. Aho, M.F. Antolin, D.K. Padilla, J.S. Richardson, and D.A. Soluk. 1987. Ecological neighbourhoods: scalinp environmental patterns. Oikos 49: 340-346.
Andren. H. 1994. Effects of habitat fragmentation on birds and mtimrniils in landscapes with different proportions of suitablr habitat: a revirw. Oikos 71: 355-366.
Andren. H. 1996. Population responses to habitat fragmentation: statistical powrr and the random sample hypothesis. Oikos 76: 735-242.
Andren. H. 1999. Habitat fragmentation. the random sample hypothesis and critical thresholds. Oikos 84(2): 306-308.
Andren. H, A. Delin, and A. Seiler. 1997. Population response to landscape changes depends on special ization to different landscape elrments. Oikos 80( 1 ): 1 93- 1 96.
Bright. P.W. 1993. Habitat fragmentation - problrms and prrdictiuns for British mammals. Mammal Review 23(3/4): 10 1 - 1 1 1.

Danielson, 199 1. Communities in a landscape: The influence of habitat heterogeneity on the interactions between species. The Americlin Naturalist 138(5): 1 105-1 120.
Danielson. B.J. 1992. Habitat selrction. intrrspecifiç interactions and landsctipe composition. Evolutionary Ecology 6: 399-4 1 1.
Delattre, P., P. Giraudoux, J. Baudry, J.P. Quéré. and E. Fichet. 1996. Effect of Iandscape structure on Common Vole (klicrotrrs c ind i s ) distribution and abundance at severai spatial scalrs. Landscape Ecology 1 l(3: 279-288.
Donovan. TM.. P.W. Jones. E.M. Annand. and F.R. Thompson m. 1997. Variation in local-scale edge effrcts: mrchanisms and landscape contcxt. Ecology 7th 7): 1064-2075.
Dunning, J.B.. B.J. Danielson. and H.R. PuIliam. 1992. Ecological processes that affect populations in cornplrx landsçapes. Oikos 65: 16% 175.
Fisher. J.T.. and G. Merriam. In press. Resourcr patch array use by two squirsel sprcies in an agricul tural mosaic. Liindscape Ecology.
Fitzgibbon. C.D. 1997. Small mammals in î'arm woodlots: the effects of habitat. isolation and surrounding land-use patterns. Journal of Applied Ecology 34: 530-539.
Hansson. L. 1992. Landscape ecology of b o r d forests. Trends in Ecology and Evolution 7(9): 399-332.
Hansson. L. 1994. Vertebratr distributions relative to cleiircut rdges in a boreal forrst landscape. Landscapr Ecology Y(2): 105- I 15.
Harris, L., and G. Silva-Lopez. 1992. Forest fragmentation and the conservation of biological divrrsity. Pp. 198-237 In Conservation Biolow The theorv and ~ractice of nature conservation. preservation. and management. P. Fiedlcr and S. Jain. Eds. Chapman and Hall. London.
Henderson. M.T.. G. Merriom. and J. Wrgner. 1985. Patchy environments and species survival: chiprnunks in an agriculturül mosaic. Biologicül Conservation 31: 95- 105.
Hosmer, D.W. Jr.. and S. Lemeshow. 1989. &olied Logistic Regression. Wiley. New York.
Jonsen, I.D.. and L. Fahrig. L997. Response of generalist and specialist insect herbivores to landscape spatial structure. Landscapr Ecology 12: 185- 197.

Kemp. G.A.. and L.B. Krith. 1970. Dynamics and regulation of red squirrel (Tmticlscinnu hridsonicus) populations. Ecology 51 (5): 763-779.
Kotliar. N.B.. and J.A. Wiens. 1990. Multiple scales of patchiness and patch structure: a hierarchical framework for the study of hetrrogeneity. Oikos 59: 253-260.
Kozakiewicz, M. 1993. Habitat isolation and ecological barriers - the effect on small mrirnmal populations and communities. Acta Theriologica 38( 1 ): 1-30.
McGürigal, K.. and B.J. Marks. 1994. FRAGSTATS - Spatial Pattern Analysis Progam for Quantifying Landscapr S tructurr. Versiun 2.0. Oregon Statr Lniversity. Corvaliia. OR.
Menard. S.W. 1995. Applied Looistic - Reeression Analvsis. Sage Publications. Thousand Oaks, California, USA.
Merriam. G. 1988. Landscape ecology: rhe rcology of hçterogeiieous systems. Pp. 43-50 In Landscaor Ecologv - - and Management. M. Moss. rd. Polysciencr Publications Inc.. Montreal.
Mrrriam. G. 199 1 . Corridors alid connsctivity: animal populations in heterogeneous rnvironments. pp. 133- 142 Nature Conservation 2: The Role of Corridors. Editrd by D.A. Saunders and R.J. Hobbs. Surrey Beatty and Sons Pty Ltd. Chipping Nonon. NSW. Australia.
Mrrriam, G.. and A. Lanoue. 1990. Corridor use by small mamrnals: field measurement for three experimental types of Peromyscus Ieucopiis. Ltindscape Ecology 4(7/3): 123- 13 1 .
Middleton. J.. and G. Merriam. 1983. Distribution of woodland spscies in farrnland woods. Journal of Applied Ecology 20: 625-644.
Monkkonen, M.. P. Reunanen. A. Nikula. J. Lnkeroinen. and J. Forsman. 1997. Landscape chancteristics associated with the occurrence of the tlying squirrel Pferomys vokins in old-growth forests of northem Finland. Ecography 20: 634-642.
Morris. D.W. 1987. Ecologicd scale and habitat use. Ecology 68(2):362-369.
Morris. D. W. 1992. Scriles and costs of habitat sr lection in hetrrogeneous Iündscapes. Evolutionary Ecology 6: 11 2-432.
Nagelkerke, R.J.D. 199 1. A note on a general definition of the coefficient of determination. Biometrika 78: 69 1-692.

Pither. J., and P.D. Taylor. L998. An experimental assessment of landscape connectivity. Oikos 83: 166- 174.
Pulliam, H.R.. and B.J. Danielson. 1991. Sources. sinks. and habitat selection: a landscape perspective on population dynamics. The American Naturniist 137: S5-S66.
Riege, D.A. 199 1. Habitat specialization and social hctors in distribution of red and grey squirrels. Journal of Mammalogy 72( 1 ): 152- 162.
Roland. J.. and P.D. Taylor. 1997. Insect parasitoid species respond to forest structure i i r Jifkmnt spatial scales. Nature 386: 7 10-7 13.
Rothmün. L.D.. and 1. Roland. 19%. Forest fragmentation and colony performance of forest tent caterpillar. Ecozraphy 21: 353-39 1 .
Rukke. B.A.. and F. Midtgaard. 1998. The importance of scale and spatial variables for the fungivorous beetle Bolitophagiis reticiilints (Coleoptera. Tenebrionidar) in a Ragmented iorest landscape. Ecography 21 : 56 1-37?.
Rusch. D.. and W. Rreder. 1978. Population ecology of Alberta red squirrels. Ecology 59(2): 300-420.
Senft. R.L.. M.B. Coughrnour. D.W. Bailry. L.R. Rittrnhousr. O.E. Sda. ~ind D M . Swift. 1 987, Large herbivore forriging and ecologicai hieniarchies. B ioscience 37( 1 1 ): 789-799.
Smith, C.C. 1968. The adaptive nature of social organization in the Gçnus of thrcr (sic) squirrels Tmnir~sciurirs. Ecologicül Monographs 38( 1 ): 3 1 -63
SPSS Inc. 1996. SPSS Version 7.5. Chicago. IL.
Strong, W.. and K.R. Lrggat. 1992. Ecoregions of Alberta. Prepared for Alberta Forestry. Lands and Wildlife. Land Inlotmation Services Division, Resource [nforrnation Branch. Publication Number T:245.
Tapper., S.C.. and R.F.W. Bmes . 1986. Influence of farming practice on the ecology of the brown hare (Lepus r~tropaeris). Journal of Applied Ecology 23: 39-52.
Turner. M.G. 1989. Landscape ecology: the effect of pattern on process. Annual Review of Ecology and Systematics 20: 17 1 - 197.
Urban, D.L.. R.V. O'Neill. and H.H. S hugart. Ir. 1987. Landscape ecology: a hierarchical perspective c m help scientists understand spatial patterns. Bioscience 37(2): 1 19- 127.

Voller, J. 1998. Managing for edge effects. pp. 3 15-233 In Conservation Biology: Principles for Forested Landscapes. J. Voller and S. Harrison. Eds. BC Ministry of Forests, UBC Press, Vancouver, BC.
Vos, C.C.. and A.H.P. Stumpel. 1995. Cornparison of habitat-isolation parameters in relation to fragmented distribution patterns in the tree frog ( H y l i cirboren). Landscape Ecology 11(4): 703-2 14.
Wegner, J.F., and G. Merriam. 1979. Movcrnents by birds and small miirnmals between a wood and ridjoining f m l a n d habitats. Journal of Applird Ecology 16: 349457.
Wegner, J.. and G. Merriam. 1990. Use of spatial elrments in ii hrmland mosaic by a woodland rodent. Biological Conservation 54: 263-267.
Wheatlry, MT. 1999. Does Density Reflrct Habitat Quality ïor Red Squirrels During a Spruce Conr Failure:' M S c . Thesis. University of Alberta. Edmonton. AB.
Wiens, J.A. 1976. Population responsrs to patchy rnvironments. Anniial Revirws in Ecology and Systcmatics 7: 5 1 - 120.
Wiens, J.A. 1989. Spatial scaling in ecology. Functioniil Ecology 3: 385-397.
Wiens, J.A.. N.C. Stenseth. B. Van Horne. and R A . Irns. 1993. Ecological mechiinisms and landscape rcology. Oikos 66: 369-380.
Ziir. J.H. 1996. Biostatisticül Analvsis. Third Edition. Prentice Hall. New Jersey.

Chapter Four
The Influence of Local Vegetation on Squirrel Response tu Landscape Structure
%O INTRODUCTION
Context sets the stage for any ccological process. The srarch for general laws or a
unifying theory in rcology has only substantiüted the importance of variability in defining
system function (Allen and Hoekstra. 1992: Lawton. 1999). In an (ironic) attempt to
organise and classi fy ecological inconsistêncies. hierarchy throry wüs implemented.
Implicit in hierarchy throry is the notion thüt ';cale. both spatial and temporal. is variable.
and chat patch characteristics change dcpending on the way in which they are virwed
(Allen and Starr. 1982: Allen and Wyleto. 1983). Traditionaily patches cire considered
internally homogeneous, as they have bcen in this study. Grain. the lowest level of
resolution. has been set as the forest srand type as definrd by Alberta Vegetlition Index
(AVI) data. Howevrr. CI priuri üssumptions of grain ignore the friçt that intemal
heterogeneity within a patch does exist (Kotliar and Wiens. 1990). Whiie apparently
interna11 y homogenous at some scale of anal ysis. reduc in; the scale (increasing
resolution) of analysis of the patch reveals interna1 heterogeneity (Wiens. 1989). This
heterogeneity may exhibit rither randorn or clurnped dispersion, low or high contrast.
Elements with high contrüst and aggregtion form patches wirhin the contrxt of the larger
patch. This hierarchy of patchiness progresses as one decreases scale. Alternatively. the
areas we have defined as patches can aggregate to f o m patches on a larger scale (Wiens,
1989; Kotliar and Wiens, 1990).
69

Becnuse processes at any scale ore iiggregarrs of thosc occurring at several lower
levels in the hierarchy (Pickett et al., 1989: Senft et al.. 19871. a correlation betwern some
independent variables measured at a pre-defined grain, and the response variable, cannot
always be detected even if a relationship does exist. In the scnse that response to
landscape structure rnay change as the observer changes txtrnt (Cliiiptrr Three). response
to structure rnay also change as one changes grain. Siniply sratcd. the intsrnal
composition of a patch may alter the dstectability of landscape effects oprrating on
organisms within it. In this chüpter 1 endeiivour to iinswer the qliestion: Does the apparent
relationship between landscape structure and red squirrel presrnce change when the
effects of local vegetation within the patch hiive been xcounted for'?
As previously reported. the Norrh Amsrican red sqiiirrel is a conifer spscialisr.
relying on Ahirs. Pirirts. and Pice~i seeds to ovrrwinter (Smith. 1965: Kemp and Keith.
1970: Rusch and Rrcdrr. 1975: Riege. 199 1 ) . It also tëeds on mushroorns. berries. nuts.
and other ephemeral foods opponunistically (Giirnrll. 1983; Yahnrr. 1987). Therefore.
one may expect that in the summer nionths (iMny-August). sqiiirrels may be hund in
association with a varirty of vegetation types. They probably do nor rstüblish territories in
non-conifer habitats (Smith. 1968: Kemp and Kcith. 1970). but do use thern to feed.
luvenilrs disperse through them in search of an cmpty territory. Squirrels' use of the
landscape, and hrnce the effects of structure. may Vary depending on the context in which
a squirrel is found.
The Alberta Vegetation Index (AVI) data from which the landscape structure data
originate are derived from air photo interpretation. Forested stands are classified by

species, age of origin, and canopy closure. Although gound-tmthed for consistency. fine-
scale d e t d is missed or averaged nway in such a coarse-seale analysis. In this study (and
many, perhaps al], others) a patch as drfined by the caveiit of internal homogeneity is not
always a patch in the truest sense. Interna1 heterogeneity - local vegetation - may guide
processes that confound (or exaggeratr) our ability to detect the effects of landscape
structure.
Other researchrrs investigating landscape effects have included in thrir ünalysis
variables descnbing local vegetation. ml thrse variables are often the onrs that exp!ain
= some the most devinnce in the response variables. with landscape qtructure explainin,
iiddi tional drvirince rifter the îict (Verboom and van Apeldoorn. 1 Y !JO: Fi tzgi bbon. 1993:
van Apeldoorn et al.. 1994; Vos and Stumpel. 1995: McGarigal and iMcComb. 1995: but
see Celada et al.. 1994. whrre vegetation w3s not significant). To determine if red
squirrels in the mixrd-wood boreal show ü similar relative rcsponse to vegrtation and
landscape structure. the regrrssion models of Chapter Three have brrn modifird to
includr internal patch characteristics: that is. ü variable dsscribing the number of conifer
trees within plots at ü site. I predict that 1 ) the number of conifer trees at a site will be a
significant predictor of squirrel presence and that 2) landscape structure will be a
significant predictor of presence after trer number has bren üccountrd for. Given the
disparity of the responses to Iandscape structure displayed in Chapter Three. I also predict
that 3) the relative influence of vegetation and landscape structure will differ between the
Mrinaged. Bumed. and Reference mega grids.
Most landscape studies of this nature have chosen study sites priori based on

known habitat preferences of the animal and thus have a low range of variation in their
patch characteristic (vegetation) datasets ( e-g. Monkonnen et al., 1997: Fisher and
Memam, in press). No studies were uncovered that have addressed the possibility that
response to landscape may xtually differ deprnding on the local habitat: thar is.
organisms in patches with one set of vegetational charticteristics may have a different
relationship with Iiindscape structure than rhose in patches with a different set of
chriracteristics. In terrns of hierarchy theory, srlection occurring at lower hierarchical
lrvels may alter the effects of selrction observed at higher levels.
To address this question. 1 dividrd the red squirrel data into two subsrts: sites with
conifer trees present. and sites üt which çonifrr trers wrre scarcr. L then reprtitcd the
landscape ancilysis as previousl y describrd on èach su bset sepürately. to determine i f the
relationship between landscape structure and squirrel presence changed with local
vegetation. Disparity between the two analyses would suggest that diffrrent mechrinisms
operatr within eüch subset of patch types. Pattern-serking nt different cxtents has
rrvealed varying influence of Iandscape structure lit eüçh: by rlir same roken pattern-
seeking at different grains may begin to reveal potential mechanisms thar genrrate the
obsrrved patterns of animal distribution.
4.1 METHODS
4. I . 1 Vegetation Sampling
The vegetntion ai rach prid point was assayed in the summers of 1996 and 1997.
Three IO-m by 20-m plots were surveyed at each site: one at the point and two at
72

randomly selected bisected cardinal directions. The Iatrrr two were placrd 65 in out from
the point and it was therefore assumed that vegetütion survryed would be representative
of an 85-rn radius around each point. The species and number of conifer trees (Piceri
glmicci, Picen marinno, Pinus bnnksinntr, Abics bnlsmnea. and Lnrix lriricincz), was
recorded and averaged across plots ro obtain ü single abundance value per species per
point. Thess abundance values were surnrned ticross species to yirld the variable
SUMCON. The squirrel presence / absence dataset was collrcted as described in Chapter
Three. To üscenain the relative importance of Iandscape structure and local (within-
patch) vegetation. two approaçhes were employed.
41.2 Building a forced logistic rnodel
Ln the first approach. a multiple logistic regression model wns built in blocks
(SPSS Inc.. 19961. In the first block. squirrcl prrsencr was regressrd ~igainst SUMCON
using a standard 'enter' model (SPSS Inc.. 1996). In the second block. aII of the landscape
structural variables used in Chapter 3 were included in a multiple 'forward conditional'
logistic regression procedure with an inclusion criterion of p = 0.05. This model thus
tested for a relationship between squirrel presence and SUMCON: if sigificmt. i t
retainrd this model with its explainrd deviançe and searched for Iiindscüpe variables that
might explain further drviancr in the 1997 sqiiirrrl datüset. This analysis was repeated for
the Managed, Reference. and Burned Mega grids iit e x h scale.
4.1.3 Splitting the squirrel dataset
Each site was designated 'conifer-abundant' or 'conifer-poor based on the average
number of trees per point. Those sites wirh 1 or lrss conifer trers prr point were
considered 'conifer-poor'. Those with more than 2 were denoted 'conifer-abundant'. The
squirrel dataset was then divided into subsets based on each site's conifer designation.
This division is somewhat arbitrary but was designrd to split the daraset into roughly
equal parts. Given our vrgetation sarnpling design. zero conifer fo'ound within plots iit ü
sire does not necessarily imply that çonifer are coinplrtely absent frorn that site. so
splitting the set using zero conifer per plot would also b r somewhat arbitrary.
Data from the Mmaged and Reference areas were used. as the Bumrd area had a
low number of squirrel presencrs thiit did no[ lend itself to dütasrt division. Only
variables rneasured at the four lowesr scüles were used. due to low siirnplr size at the
su bsarnplcd IOOU-m scals. Analysing each su bset srparatel y. squirrel presrncr wüs
regressrd iigainst landscape structural variables using a multiple 'forward conditional'
logistic regression analysis (SPSS Inc.. 1996). using the same variables and inclusion
criteria outlinrd in Chapter Three. This analysis wns enprctrd ro show Jiffrrrncc
response to landscapr structure by red squirrcls living in conifer-poor and conifer-
ribundanr habitats.
4.2 RESULTS
42.2 The forced mode1
The SUMCON variable. representing the average number of conifer trres per
point summed across al1 conifer species. significiintly predicted red squirrel presence on
the Managed mrga gnd (n= 58) (Figure 4. la; see also Appendix 3). The R' of these
regressions was 0.295.

Figure 4.1: The relative effects of local ve_oetation and landscape stnicture. The deviance explained in squirrel presence by the number of conifers ar a site is presented in black bars. Further deviance explained by landscape structure at each extent is illustrated in grey bars. The significant variables in the final model. and direction of the relationship. are listed on top of the deviance bars.
50 100 150 500 I O 0 0
Llindscape Radius

The 1000-m radius, which had a lower n ( 16) because adjacent points were dropped. had
a higher R' (0.699). After local conifer was accounted for. landscape structure explained
iùrther deviance at al1 scules rxcept the 1000-m radius. The amount of bluck spmcr /
larch explained ca. 10% of the deviance at 50 r n and 100 m. There wris a negative
relationship with the amount of cut area at 750 m and 500 m. The most variation
explained by landsciipr occurred at 500 m. with block spruce positively and cutblocks
negatively predicting squirrel presence. SUMCON fiiiléd to predict squirrel presence on
the meso grids.
On the Rrference mrga grid. SUMCON also significantly predicted squirrel
presence at nll scales (Figure 4.1 b). The devilince rxplained for the 50 - 500 m scales ( R ~
=0.303: n = 63) was sirnilar to that for the Managed grid üt these scales. but waï less
thün the Miinaged üt the 1000 m scale (R' = 0.394: n = 18). Interesringly. once local
conifer trres were accountrd for. furthrr drviiincr w u cxplained by landscüpç: struct~irr
only at the 250-m scalr. Blück sprucr / Iarch positivrly. and mixrd deciduous spruce
negativel y, predicted squirrel presence.
On the Bumed are3 the relationship between SUMCON and squirrel presence was
not significant at the p = 0.05 level. Funher analysis of the block of Iiindscapr variables
was therefore not pursued.
42.2 The split squirrel dataset
Within the Managed Area, landscape structure hiled to predict squirrel presence
at the sires designated conifer-poor. At the conifer-abundant sites the deviance explained
by landscape structure again vuied with scale. peaking at 100 m and again at 500 rn at cri.

708 explained (Figure 4.2a; see also Appendix 4). Black spnice positively predicted
presence at the smaller scales. CUT was again a negative predictor at 500 m. but
interestingly so was white spruce. At al1 scales oniy composition was significant:
configuration or interactions fai lrd to enter the rnodel.
On the Reference area. landscape structure was not significant iit the conifer-poor
sites except at 250 rn (-ASBLT*HET: R' = 260: n = 26). At the conifer-abundant sites
landscape structure predicted squirrel presence at the 50 and 100 m scales but not at
larger scales (Figure 4.2b). R' at each su i e was low (O. 1 J6 to 0.271). peaking at the 50 m
scale. MARSH nrgativrly predicted presencr at 50 and 100 m. Hrterogrneous black
spruce nrgatively predictrd presençr Iir the 250-m sccile. Therr were no positive
significanr predictors of squirrel presrncr on the Reference gnd.

Figure 4.2: The influence of landscape structure at conifer-abundant sites. The deviance explained in squirrel presence by landscape structure tit each extent is illustrated in grey bars. The significrint variables in the final model. and direction of the relationship. are listed on top of the devilince bars.
Managed Mega Grid 1997 (coni fer-abundan t si tes)
XSBLT -hhfXRSH
r 1
x 0.0 4 1 .AS BLT
Lrindscripe Radius

4.3 DISCUSSION
4.3.1 The relative importance uf habitat beyond the focal patch
As one might rxpect from known habitat preferences of red squirrels. the number
of conifers at a site positively prrdicted squirrel presrnce on the Münüged and Reference
mega grids with a relatively high amount deviance rxplained. but did not on the Burned
grid. This emphasises the importance of context when sreking relritionships between
animal abundance and habitat use. As well, including local vegetation in the mode1
changed the patterns sren in Chapter Three (compare Figures 4. Ia and 3.4b: 4.1 b and
3.6a).
In the Burnrd areü. mnny live conifers that were recorded were jack pine sredlings
re-tstablishing themselves from serotinous cones after the forest fire in 1989 and were not
y r t mature mut-beciring trers capable of supplying cones to squirrels. Ln the othrr üreiis.
mature mast-braring conifers were cornmon and therefore strongly associatrd with
squirrel presence. As landscape was a significant predictor on the Burncd grid (Figure
3.7), i t appelirs that the proximity to stands skipped by t'ire (i.a.. unburned deciduous! was
more important to site occupation than the local presencr of conifer. On the Evlanaged
grid. once local vegetation was accounted for the proximity of black spnicr in the
immediate and larger landscapes. and the absence of cutblocks in the larger landscapes.
were significant predictors. On the Reference grid vegetation was of sole importance at
al1 scales except at 250 m. where the absence of heterogeneous black spruce patches was
important. The unique patterns observed between the three g i d s show that the relative
effects of vegetation and landscape are context-dependent. similar to the strictly

landscape effects iri Chapter Three. Because no replication of Areas was possible 1 cannot
conclude what caused the disparity in response between the threr Areas. but tentatively
attribute i t to differences in areal composition. The relative importance of dominant stand
types (spruce. pine. and iispen) for squirrels is possibly different in each area.
On the Managed Grid. the importance of black spruce at the smaller radii. which
are witliin the summer forüging range of the red squirrel (Chapter One). suggcst that
landscape supplementation is ocçurring (Dunning et al.. 1992). With high squirrel
densities the relative amount of conifer within each territory in bliick spnice patchrs may
be limited. If so, squirrels in thrse netirby stands miiy have travelled io the focal sires to
obtain substitutable resources. as suggested by Iÿrger foraging ranges in conifer-limited
areas (Chapter One). On the Reference grid where jiick pine is more dominant and stands
are larger and more contiguous, supplementation may not have brrn neçessary.
The importance of black spnicr at Iiirger radii on the Managed Grid suggests a
source-sink population dynamic (Pulliam. 1988; Pulliüm iind Danielson. 199 1 ) as in
Chapter Thrrr. For a patch to be colonised i t is important to have conifer present (for
overwinter survivül). but proximity to large amounts of black spruce is also consequential
as a source for dispersers. The source-sink hypothrsis. unlikr the supplrmentation
hypothesis. implies that the individuals recorded at a site are permanent residcnts and not
ephemeral occupants. A study that tracks the movement, mortality. and fecundity of
individuals at di fferent sites is required to test these two hypotheses.
The negative intluence of cutblocks on squirrel distribution in the Managed Area
is interesting, as only 9% of the area has been harvested for timber (Fiy 3.1 ). As red

;quine1 individuals do use cutblocks (Chapter One). and behaviour and survival are
apparently are not greatly affected by anthropogenic edges (Elizabeth Anderson. unpubl.
data). this raises somr interesting ecological questions. Are squirrels attractrd away from
conifer trees to summer forage at cutblocks, a scrnario predicted by landscape
supplementation (Dunning et al., 1 EU)'? Or are more indirect processes (Dunning et al.,
1992) operating, such as increased pressure from prcdators artractcd CO thcsc open high-
divrrsity areas (Andren er al.. 1955: Hansson. 1989. 1994) 7 If this is tme. why are the
çt'frcts seen only at the largrr scales. rather than rhe smaller ones? A risorous test for
these mechanisms would illuminate the large void in our knowledge of spatial dynarnics
in naturally heterogeneous systems. While rxtensively pontificiitrd (Levin. 1970: Pulliam.
1988). there is little empirical evidence for the existence of supplrrnentütion. source-sink
dynümics. or related processes. Whütrver the mechanism. it çan br concluded thiit in this
heterogeneous area landscape structure does intlurnct: the probübil i ty of patch occupation
by red squirrels. over and above the influences of local vegetcition. and that this
relationship is context-dependent.
Similar results have been shown for other specirs in othrr systems. Vos and
Stumpel ( 1995) found tree frog occupation of ponds was predicted by distance to the
neiirest occupird pond once the chemical conditions with the pond were accountrd for.
Verboom and van Apeldoorn ( 1990) and van Apeldoorn et al. ( 1994) showed that the
proximity to large "source" stands. and hedgerow connections to them. predicted
occupation of woodlots by Eurasian rrd squirrels once conifrr within the patch had
entered the model. and that this relationship changed over time. The latter authors

proposed that this relationship was due to a source-sink model: that small woodlots were
occupied by excess individuals from larger stands in years when those stands reached
maximum capacity. Fitzgibbon ( 1993) found similar results for grey squirrels. In contrast
Celada et al. ( 1994) found that local vegetiition characteristics wrre not significant; only
patch xea predicted squirrel presence in one study area. while proximity to source ueas
predicted presence in another study rirea. The. dso invokcd the source-sink model to
rxplain these distribution patterns, although conceded that landscape supplemrntation
müy also be occurring among severül small patchcs.
My results support the classic tenets of Ilindscape rcology - that landsciipe
rlements beyond the local patch tire significant intluences on the distribution of
organisrns. While many authors have indirect1 y acknow lcdged the i mportancr of interna1
patch heterogeneity in mediating the rrsponse to Iündscape stnicture. the nature of thrse
effects has bren largely ignored in Favour of the search for broad-sçalr patterns. This
drreliction may lrad to misleading results. Combining sites of differing quality causes
one to overlook the possibility that individuals living within different patch types may
respond to landscape structure differently. This is a fundamental assumption of sourco-
sink dynamics and relütrd rnechanisms such as idral pre-emptive distribution but is nrver
explicitly addressrd.
4.3.2 Two differmt responses to landscape structure
The relationship between landscape structure and squirrel presence was markedly
different between the conifer-poor and conifer-abundant sites. There wris a single scale on
the Reference grid where landscape was a significant predictor in the conikr-poor subset.

In the conifer-abundant sites on the Managed Gnd, the deviance explained by landscape
was generally higher than the same regression performed on the entire set of grid points
(Figure 3.4b). although this was not true of the Rrferencr grid (Figure 3.6a). Stiitistically.
this disparity in response indicates that combining the two site types into a single analysis
increases random error m o n g experimen ta1 uni ts. reducin; the sensitivity of the
statistical test (Hurlben. 1984). rlitreby obscuring tlis detestion of existing patterns.
Ecologically. the striking contrasr between the two conifer designations indicares that
there are (at least) two different processes at work ciffecting sqiiirrel presrncr in this
system. On those sites where one would assume the probübility of squirrel survival is
hi& - the conifrr-übundant sites - black spruce posi tivrl y predicted squirrel presence.
Deciduous. white spnice. cutblocks (Manageci Area). marsh. and hrtrrogeeneous black
spmce (Rrference Areal negatively predicted it. This suggests thüt piitch occupation at
these sites areas is affected by proximity to other patch types in the Ilindscape. possibly as
sources of dispersing individuals or sources of cornpetitors and predators at the larger
scales. and juxtaposed patch types ai smiiller scüles (Dunning et al.. lW2). In contrast. at
the conifer-poor sites where one would exprct survivd to be low. landscüpe structure is
apparently not important. There are a several possible txplünations for this disparity.
This survey was conducted in the late spring and early sumrnrr of 1997. a time
when young squirrels aie dispersing to find their own territories (Kemp and Keith. 1970).
It is possible that the individuals survryed in the conifer-poor sites were summer
tnnsients without a defended winter food supply (conifer cones) searching for a territory.
Although Larsen and Boutin ( 1995) found that adult squirrels don't redistnbute to better

vacant temtories within jack pine. data from Klenner ( 1 990) and Whr;itley < 1999 i
suggsts that this might occur in habitats where territory quülity (food iivailnbility) is
more highly contrasted. The lack of landscape effects found here indicates that the
location of these individuals is not influenced by proximity to preferred conifer habitat as
one might expect. Factors not measured here may contribute to an sphemrrd distribution.
or it rnay in fact be random. Although othcr studics ( 2 . r. Smith. 196s: Kcrnp and Kcith.
1970) have established the existence of individuals without tsrritorics (rhüt rnay ücquirr
one later on) no studies have exiimined the processes driving their distribution in a
heterogenrous mosoic. If these are individuals withour temtories waiting to acquire one.
and are as important to population dynamics as Pulliam 1 1988) and Pulliam and
Danielson ( 199 I ) suggest. rhen this segment of the popiilotion and the effects of hribitric
and Iündscripe stnicture upon its distribution mcrit furthrr investigation.
Nonrthrless I c m safely conclude thüt thrre is an interaction brtwern local
vegetiition and landscape structure and their influence on red squirrel distribution. The
data strongly suggest that the response to landscape structure is local habitat-dependent.
The processes operating on individuiils iit one site may bc: quite differenr froni thosr
oprriiting at another. resulting in diffrrent probübilities of occupation and hcncr disparate
patterns of abundance.
4.4 CONCLUSIONS
Local habitat accounted for some deviance in squirrel presence on the Mnnaged
and Reference areas but not the Burned area. Landscape stnicture accounted for further
deviance on the Managed Grid at several scales but only one on the Reference Grid.

Different variables were important at each. When sites were separated into conifer-poor
and conifer-rich categories different responses to structure were observed at cach. The
results are important in that 1 ) Iündscape structural éffects are nor restrictcd to
anthropogenically fragmented landscapes; 7) context-deprndency indicates Iündscape
studirs limitsd to one area cannot be txtrapolatrd to another: 3) combining sites of
differing qudity in these studies may obscure detection of existing patterns: and 4) the
interaction between local vegetation and landscape structure supports the idea that
different mrchanisms rffect the response to landscaps structiire in diifcrent piitch types.
4.5 LITERA TURE ClTED
Allen. T.F.H.. and T.W. Hoekstra. 1992. Toward a unified ecologv. Columbia University Press. New York.
Allen. T.F.H.. and T.B. Starr. 1982. Hirrarchv: Prrspcçtivrs fur Ecoloiçal Cornpltxitv. The University of Chicago Press. Chicago.
Allen. T.F.H.. and E.P. Wylero. 1983. A hicrürchical mode1 for the complrxity of plant cornmuniries. Journal of Theoretical Biology 101: 529-540.
Andren. H., P. Angelstarn. E. Lindstrom. and P. W i d h 1985. Differences in predation pressure in relation to habitat fragmentation: an experiment. Oikos 45(2): 273-377.
van Apeldoorn. R.. C. Celada, and W. Nieuwenhuizen. 1994. Distribution and dynamics of the red squirrel (Scilinrs vttlgcrris L. ) in a landscape with frqmented habitat. Landscape Ecology 9(3): 127-135.
Celada. C . . G. Bogliani, A. Garibaldi. and A. Maracci. 1994. Occupüncy of isolated woodlots by the red squirrel Sciiirits viifgaris L. in Italy. Biolo_eical Conservation 69: 177- L83.
Dunning, J.B., B.J. Danielson, and H.R. Pulliarn. 1992. Ecological processes that affect populations in complex landscapes. Oi kos 65: 169- 175.

Fisher, I.T., and G. merr ria m. In press. Resource patch array use by two squirrel specirs in an agricultural mosaic. Landscape Ecology .
Fitzgibbon. C.D. 1993. The distribution of grey squirrel dreys in farm woodland: the influence of wood area, isolation and management. Journal of Applied Ecology 30: 736- 742.
Gurnrll. 1. 1983. Squirrel numbers and the abiindünce of trse stteds. blvliirnmal Review 13(2/3/4): 133- 148.
Hansson. L. 1989. Predation in heterogeneous liindscapes: how to èvaluate total impact? Oikos 54(l): 117-1 19.
Hansson. L. 1994. Vertebrate distributions relative to cleiircut rdges in a boreal forest landscape. Landscape Ecology 9(2): 105- 1 15.
Hurlben. S.H. 1984. Pseudoreplication and the design of ecologicd field cxpçriments. Ecological Monogriiphs 54(2): 187-2 1 1.
Kemp. G.A.. and L.B. Krith. 1970. Dynamiçs and replation of r d squirrel (T~initcisciitrrrs hdsoriiccis) populations. Ecology 5 l ( 5 ): 763-779.
Klenner. W. 1990. The effect of food übundancr and territorial behnviour on population dynamics of the red squirrel. Ph.D. Thesis. University of British Columbia, Vancouver. BC.
Kotliar. N.B.. and I.A. Wiens. 1990. iMultiple scdes of patchiness and patch structure: ri hierarchiclil framewvrk for the study of hcterogrnrity. Oikos 59: 253-160.
Larsen. K.W.. and S. Boutin. 1994. Movemrnts. survivttl. and settlttment uf r d squirrel (Ttrmicisciurns h~itlsuriiars) offspring. Ecology 75( 1 ): 2 14-223.
Larsen, K.W., and S. Boutin. 1995. Exploring territory quality in the Nonh American red squirrel through removal experiments. Canadian Journal of Zoology 73: 1 1 15- 1 122.
Lawton, J. 1999. Are there general laws in ecology'? Oikos 84: 177- 192.
Levins, R. 1970. Extinction. Pp. 77-107 In Lectures on mathematics in the life sciences. Vol. 2. M. Gerstenhaber. ed. American Mathernriticril Society. Providence. RI.
McGarigal. K.. and W. McComb. 1995. Relationships betweeo landscape structure and breeding birds in the Oregon Coast Range. Ecological Monographs 65(3): 235-260.

Monkkonen, M.. P. Reunanen. A. Nikula. J. Inkeroinen. and J. Forsman. 1997. Landscape characterisrics associated with the occurrence of the tl ying squirrel Pteroniy volans in old-growth forests of northem Finland. Ecography 20: 634-642.
Pickett. S.T.A.. J. Kolasa, J.J. Armesto. and S.L. Collins. 1989. The ecological concept of disturbance and its expression at various hierarchiciil levels. Oikos 54: 129- 136.
Pulliam. H.R. 1988. Sources. sinks. and population regulation. The American Nuturalist 132(5): 652-66 1.
Pulliam, H.R.. and B.J. Danielson. 1991. Sources. sinks. and habitat selection: a landscape perspective on population dynamics. The Xmerican Naturiilisr 137: S5-S66.
Rirge. DA. 199 1. Habitat specializlition and social factors in distribution of red and grey squirrels. Journal of Mammrilogy 72( 1 ): 152- 162.
Rusch. D.. and W. Rteder. 1978. Population rcology of Alberta red squirrels. Ecology 59(3): 400-420.
SenR. R.L.. M.B. Coughenour. D.W. Bailey. L.R. Rittenhouse. O.E. Sala. and D.M. Swift. 1987. Large herbivore foraging and rçological hierarchics. Biosciencc 37( 1 1 ): 759- 799.
Smith. C.C. 1968. The adaptive nature of social orpnization in the Genus of three (sic) squirrels T~zmicis~iurus. Ecological Monopphs 38( 1 ): 3 1-63
SPSS Inc. 1996. SPSS Version 7.5. Chicago. L.
Verboom. B., and R. van Apeldoorn. 1990. Effects of habitat fragmentation on the red squirrel. Sci~tnts vuignris L. Landscape Ecology 4(2/3 ): 1 7 1 - 1 76.
Vos. C.C.. and A.H.P. Stumprl. 1995. Cornparison of habitat-isolation parümrters in relation to fragmented distribution patterns in the trec frog ( f i l u m-bowtr). Lnndscape Ecology 1 l(4): 203-2 14.
Wheatley. M.T. 1999. Does Density Retlect Habitat Quality for Red Squinels During a Spruce Cone Failure? M.Sc. Thesis. University of Alberta. Edmonton. AB.
Wiens, LA. 1989. Spatial scaling in ecology. Functional Ecology 3: 385-397.
Yahner. R.H. 1987. Feeding site use by red squirreis, Tcirninsciiirus Izrrdsonic~ts. in a marginal habitat in Pennsy lvania. Canadian Field Naturilist 101(4): 586-589.

Chapter 5
The Protean Nature of Landscape Effects
5. O CONCL US1 O I S
The rarliest Imdscapc ecology resrarch rrvealed thtit the observeci influences of
structure on animal distribution were species-dcpendent (see for exarnple Wegner and
Merriam, 1979; Middleton and klerriam. 1983). This specificity is often attributed to
behavioural differencrs. degree of specialization. or varying levels of adaptive tlexibility
(Bright. 1993: Andrrn. 1994: Andren et al.. 1997: Henrin et al.. 1998). As well.
differences in body s i x influence how heteroyeity i i pcrceived. with Iürger vagilr
organisms perceiving more a fine-grain mosaic than smaller less vagile ones. More
technically. the response to heterogeneity differs depending on how many hierarchical
lrvels of heterogeneity between the organism's grain and rxtent are percrived (Kotliar
and Wiens. 1990) and the spatial and tirne scale of the procrss thiit is rffecting thlit
responsr to hcteropeity for an or_oanisrn i hddicott et al.. 1987).
Landscape structural effects have been demonstratrd almost exclusively in
anthropogenicall y fragmen ted landscapes. This thesis has revealed that landscape
structural effects are not lirnited to thesr areas but also exist in naturally heterogeneous
landscapes with minimal anthropogenic impact. More imponantly. it also reveals thiit the
reliitionship between Iandscape structure and red squirrel distribution is dependent on a
number of factors beyond specîes-speci fici ty.

Tirne-dependent: The relationship between squirrel presence and landscape structure
changed brtween the sunimers of 1996 and 1997 on the Manoged area. As a prescriptive
conclusion, landscape ecology studies should be conducted over a number of years in
order to compensate for temporal variability in the system. This may be especially
important in 'rphemeral' Iandscaprs such as agricultural environments where matrix
pntch types (crops) change bctween ycm or cven selisons (Szacki et 21.. 1993). or in
boreal forests where fluctuations in pütch chiiractrristics may profoundly influence
dynamics within thein (Hansson. 1993). The obvious theoretical conclusion is that the
mechanism driving the response to heterogenrity rnay change between years. In the case
of red squirrels. the arnount of forage and hence quülity of a pütch (ii stand of some tree
species) rnay change with time (Wheatlry. 1999). thus changing the relative importance
of Inndscape composition and configuration and hrncr squirrel distribution patterns.
Detrcting temporal variability may be as important as spatial variability in çonstructing
plausible hypothesis regrirding distribution patterns.
Scale-dependent: The response of red squirrel presence to landscape structure occurred at
a number of different spatial extents. including small scales corresponding to the sumrner
foraging range (Chapter One) and to larger scalrs. It also çhanged drpcndin_r on the scale
of squirrel sampling, i.r.. betwern the mega grids and the meso grids within the same area
(Chapter Three). This suggests that more than one mechanism was responsible for the
observed pattern in distribution. The response to heterogeneity at small scales. squirrels'
use of several different patch types, and the existence of larger ranges where conifer is
limiting, al1 suggest that landscape supplementation (Dunning et al., 1992) rnay be

occurring. The response to structure at larger scales indicates that processes
encompassing larger areas, such as dispersal, are involved. The positive relationship with
large homogeneous black spruce tracts. and negative association with marginal deciduous
stands and cutblocks. suggest that a source-sink dynamic (Pulliarn. 1988: Pulliarn and
Danielson. 199 1 ) exists that ( in pan) causes the obsrrved pattern of distribution. I can
conclude that the vliriliblrs thiit predict squirrel distribution change depending on the
scale of landscape quantification. This conclusion is not really innovative (see Wiens.
1989). However what is provocative is that the relative importance of e x h scale changes
between areas or contexts.
Context-dependent: The deviance explaineci at rüch sciile was different brtwern the
Burned. Managed. and Referencr areas. The landscapr variables that significantly
predicted squirrel presencr lilso varird brtwcrn the three cireas. These inconsistencies
strongly suggest that different rnechanisrns drive the responsr to heterogeneity in different
rireas. Smaller-scale mrchanisms such üs çornplementation mny be more important in
somr areas w hile Iarger-scde procrssrs such as source-si nk dynümics müy dominatr in
others. The net result of a particular rnechanism may also differ: in burnrd areas tracts of
unburned deciduous may be important as 'sources' whereas on the Managed and Burned
areas these were most likely sinks. The rnechanisms effecting the response to
heterogeneity can only be hypothesised üt this tirne. but the Finding that landscape effects
differ by area is a criticai one. Few studies have analysed several different areas
independently, and combining points in different areas into a single andysis could yield
spurious results (Hurlbert. 1984). To extrapolate specific iandscape effects from one area

to another would be erroneous.
While this pattern-seeking approach has revealed that there are different responses
in the different areas. why this is so is completely open ro debate. The areas have different
compositions. and hence different ranges of vüriability in the independent datnset. so
statistically it is expected that dissimilar variables would become important within each.
Statistical reasons aside, the ecological importance of patch types rnay change between
areas. For example heterogeneity (HET) rnay be beneficial for squirrels in one nrea. at one
scale, but detrimental in another area or at another scale. To claim that deciduous is a
vital landscapr rlzrnrnt for squirrels basrd a study conducrêd on the Burnrd m a . evcn
with a fair sample size (30-50 points). would be spurious if ripplicd to the Managed or
Referencr areas. Instead of yielding müny answers. this thesis instrad poses a crucial
question: Under what circumstances are certain landscape structures important elements
of animal occupation'? I can conclude rhat these effects are context-specific. but the nature
of that specificiry remüins the salirnt ecolo_pical issue.
Local habitai-dependent: The relative influence of liindscape structure is dso local-
habitat-dependent. The number of conifer trers üt a site is an important predictor of
squirrel presence in the non-burned areas. but landscüpe structure still explains more
deviÿnce once this has been accounted for. How it does so differs between landscape
extents and areas. More interestingly. the importance of landscape strucrure shifts from
being insignifiant in conifer-poor patches. to hijhly significant in conifer-abundant
patches. Pooling these patch types into a single analysis obscures the detection of
processes dnving distribution. While conifer-abundmt sites may be subject to source-sink

dynamics (Pulliam. 1988: Pulliam and Danielson. 199 11, neighbourhood or indirect
effects (Dunning et al.. 1992). a metapopulation mode1 (Levins. 1970) or any other
number of processes that are heavily influrnced by Iiindscapz structure. conitèr-poor sites
appear unaffected by any of these. These results brg the sarnr question proposrd in the
last paragraph, but framed in a slightly different context: Under whüt circumstances are
csnain landscape structures important clzmrnts of animal occupation within a specific
habitat typeb?
Thüt landscape structure p l a y a rolr in inHurncing animal distribution is
incontrovertible. Xlthough landscape ecology is firmly entrenchrd in conservation-
oriented studies of anthropogenic systems (ser for enample Forman. 1997) we now know
that the intluence of structure is a naturally oçcurring phenornenon in hrterogeneous
areas. We dso know that the nature of these effects are not easily extrcipolated from one
year. habitat type. or area. to the next. The setirch for processes to explain thrse
inconsistencies will require a mariage of landscape ecology and population ecology - a
dernographic study that explicitly considers landscape structure lis ii treatment effect. As
scientists we ciin then p i n insights into the diversity of processes that shape the observed
patterns. As managers we can then make predictions about the effects of landscape
alteration (cg. timber harvest) on animal populations. If nothing rlse. we will be one strp
closer to understanding the protean nature of ecological systrms. and the role of
stochasticity in shaping those patterns we thought to be concrete.

5.1 LITERA TURE CITED
Addicott, J.F., J.M. Aho, M.F. Antolin, D.K. Padillri, J.S. Richardson, and D.A. Soluk. 1987. Ecological neighbourhoods: scaling environmental patterns. Oikos 19: 340-346.
Andren. H. 1994. Effects of habitat fragmentation on birds and rnrimmals in landscapes with different proportions of suitable habitat: a revirw. Oikos 71: 355-366.
Andren, H, A. Delin. and .A. Srilrr. 1997. Population response to Iündsciipe changes depends on specialization to different landscape elrrnents. Oikos 80( 1 ): 193- 196.
Bright, P. W. 1993. Habitat fragmentation - problems and predictions t'or British mammals. Mammal Review 23(3/4): 10 1 - 1 1 1.
Dunning. J.B.. B.J. Danielson. and H.R. Pulliiim. 1992. Ecologicül processes that affect populations in complrx Iandscapes. Oikos 65: 169- 175.
Fonan. R.T.T. 1997. Land Mosaics: The crçolorv of Irindscapes and rerions. Cambridge University Press, UK.
Hansson. L. 1992. Landscape ecology of boreal forests. Trends in Ecology and Evolution 7(9): 299-232.
Henein, K.. J. Wrgner. and G. Merriam. 1998. Population effects of Iandscape mode1 manipulation on two behaviourally diffsrent woodland small mümmals. Oikos 81: 168- 186.
Kotliar. N.B.. and J.A. Wiens. 1990. Multiple scales of patchiness and pritch structure: a hierarchical framrwork for the study of hrterogrnriry. Oikos 59: 153-260.
Lrvins. R. 1970. Extinction. Pp. 77-207 In Lectures on mathematics in the life sciences. Vol. 2. M. Grrstenhaber. ed. American Mtithrmaticül Society. Providence. RI.
Pulliam, H.R. 1988. Sources, sinks. and population regulation. The .4merican Naturalist L32(5): 652-66 1 .
Puliiarn, KR., and B.J. Danielson. 199 1. Sources, sinks, and habitat selection: a landscape perspective on population dynamics. The American Naturalist 137: S5-S66.
Szacki, J.. J . Babinskli-Werka, and A. Liro. 1993. The intluence of landscape spatial structure on srnall mamrnal movrments. Acta Thenologica 38(2): 1 13- 123.

Wegner, J.F.. and G. Merriam. 1979. Movements by birds and srnaIl rnamrnrils between a wood and adjoining farrnland habitats. Journal of Applied Ecology 16: 349-357.
Whcatley. M.T. 1999. Doss Density Retlect Hübitar Quality for Red Squirrels During a Spmce Conç Failure'? M.Sç. Thesis. University of Al berta. Edmonton. m.
Wiens. J.A. 1989. Spatial scaling in ecology. Functional Ecology 3: 385-397.

Appendix 1: The fit of the logistic regession model. -2 log Iikelihood values of the significant multiple logistic regression models obtained at each spatial scale. grid. and area are tested for significant deviation from a X2 distribution given the number of samples in each regression ( n ) and the number of parameters in the regression model (pr). The degrees of Freédom tquals n-pr. The u = 0.05.
Area Grid Scale n - pr -2LL diffirent frorn X' Managed ( 1996) mega
yes y es no
Managed ( 1997) rnqü
Burned
Re ference mega
meso 50 100
yes no

Appendix 7: Output of logistic regession modèls. Squirrel presençe was regresscd against landscape composition itnd configuration variables: the significant variables sclected by the forwnrd selection procedure. the p value. and fit of the final mode1 are listed for each landscapr scale at each grid.
scale significant p(mode1) N Naglkerke overall variables R ' %correct
50 APJ 0.0001 b4 O.-? 13 67. 19 HET
100 ASBLT O. 0000 64 0.4 12 73.44 ADECPHET
250 -ADEC 0.000 1 64 0.355 7 1.88 ASBLT
500 -ADEC 0.0000 64 0.362 70.3 1 ASBLT
b) Manageci Mrga Grill 1997
scale significant p( mode]) N Nagel kerke %correct variables R~
50 AMDP 0.000 1 58 0.400 74.14 AlMDS APJ ASBLT
APJ ASBLT
APJ ASBLT
APJ ASBLT -ASBLT*HET

C ) Milnaged Meso Grid 1996
scale significant p(mode1) N Nagelkerke %correct variables R:
-ADEC 0.0002 127 O. 17 1 67.72 HET
HET 0.000 1 -AMARSH
250 HET 0.00 15 34 0.342 73.53
d) Managed Meso Grid 1997
SC& signitïcanr p( mudel Y N q e l ksrke %correct variables R:
50 HET 0.004 1 64
1 O0 HET 0.0073 64
350 none I S
e) Referencc Mega Grid 1997
Nage1 kerkr %correct RI
scrile significtint p(modrli Y variables
-ADEC 0.0006 MARSH
MJ ASBLT
ASBLT - M D S APJ
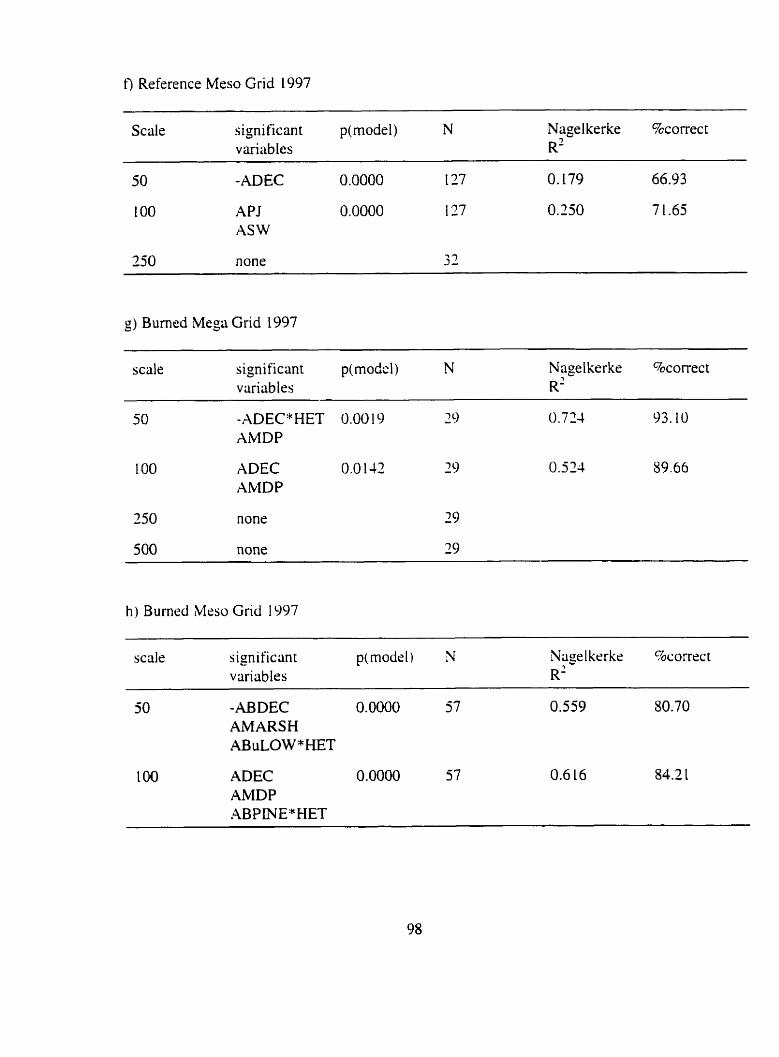
ti) Reference Meso Grid 1997
Scale significant p(modr1) N Nagel kerke %correct variables R'
APJ ASW
g) Bumed iMega Gnd 1997
scale significant p(modc1) N variables
Nagelkerke %correct R '
-ADEC:'HET 0.00 19 AMDP
ADEC AMDP
h) Burned Meso Grid 1997
scale significmt ptrnodel) N variables
-ABDEC 0.0000 57 AMARSH ABuLOW*HET
ADEC AMDP ABPINE*HET

Appendix 3: Output of logistic regression models that includr local vegetation. Squirrel presence wiis regressrd against nrimbcr of conikr trees at a sire: then Iandscape composition and configuration variables wsrr iil!owed to enter the mode]. The significant landscape variables srlrctsd by the forword srlection procedure. the p value, and fit of the final mode1 are lisred for each Iündscüpe scalr at rach grid.
a) Managed Mega Grid 1997
scde signi fïcant p(mode1) N Nagel kerke overall variables R' %correct
50 CON-TREES 0.000 1 58 0.374 70.69 ASBLT
100 CON-TREES 0.0000 5s 0.390 70.69 ASBLT
350 CON-TREES 0.000 1 58 0.375 72.4 1 -ACUT
500 CON-TREES 0.0000 58 0.459 77.59 -ACUT ASBLT
1 O00 CON-TREES 0.0007 16 0.699 87.50
b) Reference Mrga Grid 1997
scale significant p(mode1) N Nagel kerke %correct variables R'
50 CON-TREES 0.000 1 63 0.303 65.08
1 O0 CON-TREES 0.000 1 63 0.303 65.05
250 CON-TREES 0.0000 63 0.474 73 .O3 - M D S ASBLT
500 CON-TREES 0.000 1 63 0.303 65.08
1000 CON-TREES 0.0 L 23 18 0.394 77.78
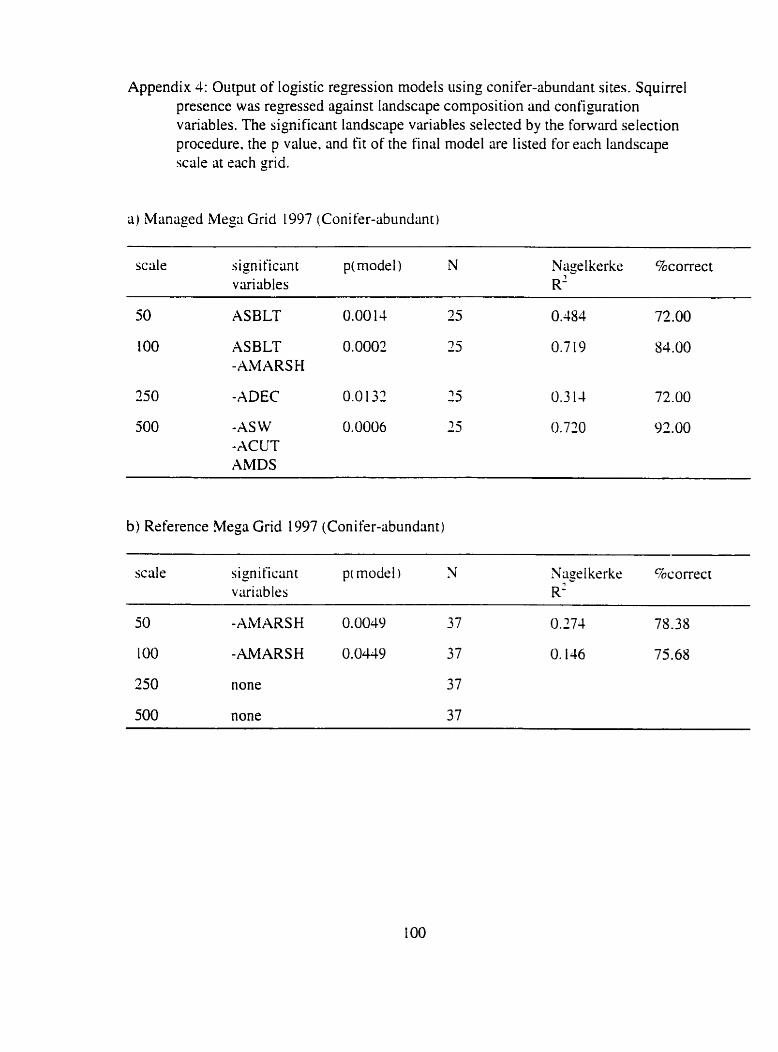
Appendix 4: Output of logistic regression rnodels using conifer-abundant sites. Squirrel presence was regressed against landscape composition and configuration variables. The significant landscape variables selected by the fonvard selection procedure, the p value. and fit of the final mode1 are listed for each landscape scale at sach grid.
a) iManaged Mega Grid 1997 (Conikr-abundant)
scale significünt p(model ) N Nagelkerke %correct variables R'
---
50 ASBLT 0.00 14 25 0.484 72.00
1 O0 ASBLT O. 0002 25 0.719 34.00 -NMARSH
5 0 0 -AS W O. 0006 25 0.730 92.00 -ACUT AMDS
b) Rrference Mega Grid 1997 (Conifer-abundlint)
scale significanr pi modd ) N variables

scale significlint p(mode 1) N variables
Nagel kerke %correct R'
Copyright © 2022 FDOKUMEN