Spatial distribution of Africanized honey bees in an urban landscape
10
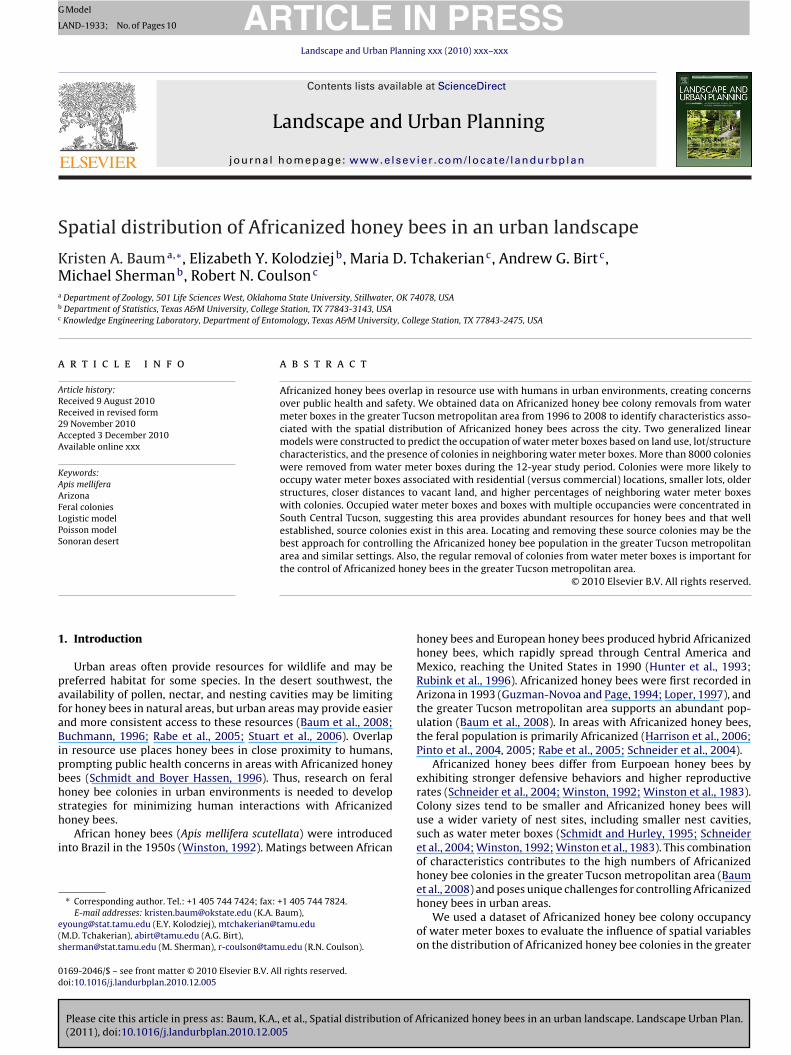
Please cite this article in press as: Baum, K.A., et al., Spatial distribution of Africanized honey bees in an urban landscape. Landscape Urban Plan. (2011), doi:10.1016/j.landurbplan.2010.12.005 ARTICLE IN PRESS G Model LAND-1933; No. of Pages 10 Landscape and Urban Planning xxx (2010) xxx–xxx Contents lists available at ScienceDirect Landscape and Urban Planning journal homepage: www.elsevier.com/locate/landurbplan Spatial distribution of Africanized honey bees in an urban landscape Kristen A. Baum a,∗ , Elizabeth Y. Kolodziej b , Maria D. Tchakerian c , Andrew G. Birt c , Michael Sherman b , Robert N. Coulson c a Department of Zoology, 501 Life Sciences West, Oklahoma State University, Stillwater, OK 74078, USA b Department of Statistics, Texas A&M University, College Station, TX 77843-3143, USA c Knowledge Engineering Laboratory, Department of Entomology, Texas A&M University, College Station, TX 77843-2475, USA article info Article history: Received 9 August 2010 Received in revised form 29 November 2010 Accepted 3 December 2010 Available online xxx Keywords: Apis mellifera Arizona Feral colonies Logistic model Poisson model Sonoran desert abstract Africanized honey bees overlap in resource use with humans in urban environments, creating concerns over public health and safety. We obtained data on Africanized honey bee colony removals from water meter boxes in the greater Tucson metropolitan area from 1996 to 2008 to identify characteristics asso- ciated with the spatial distribution of Africanized honey bees across the city. Two generalized linear models were constructed to predict the occupation of water meter boxes based on land use, lot/structure characteristics, and the presence of colonies in neighboring water meter boxes. More than 8000 colonies were removed from water meter boxes during the 12-year study period. Colonies were more likely to occupy water meter boxes associated with residential (versus commercial) locations, smaller lots, older structures, closer distances to vacant land, and higher percentages of neighboring water meter boxes with colonies. Occupied water meter boxes and boxes with multiple occupancies were concentrated in South Central Tucson, suggesting this area provides abundant resources for honey bees and that well established, source colonies exist in this area. Locating and removing these source colonies may be the best approach for controlling the Africanized honey bee population in the greater Tucson metropolitan area and similar settings. Also, the regular removal of colonies from water meter boxes is important for the control of Africanized honey bees in the greater Tucson metropolitan area. © 2010 Elsevier B.V. All rights reserved. 1. Introduction Urban areas often provide resources for wildlife and may be preferred habitat for some species. In the desert southwest, the availability of pollen, nectar, and nesting cavities may be limiting for honey bees in natural areas, but urban areas may provide easier and more consistent access to these resources (Baum et al., 2008; Buchmann, 1996; Rabe et al., 2005; Stuart et al., 2006). Overlap in resource use places honey bees in close proximity to humans, prompting public health concerns in areas with Africanized honey bees (Schmidt and Boyer Hassen, 1996). Thus, research on feral honey bee colonies in urban environments is needed to develop strategies for minimizing human interactions with Africanized honey bees. African honey bees (Apis mellifera scutellata) were introduced into Brazil in the 1950s (Winston, 1992). Matings between African ∗ Corresponding author. Tel.: +1 405 744 7424; fax: +1 405 744 7824. E-mail addresses: [email protected] (K.A. Baum), [email protected] (E.Y. Kolodziej), [email protected] (M.D. Tchakerian), [email protected] (A.G. Birt), [email protected] (M. Sherman), [email protected] (R.N. Coulson). honey bees and European honey bees produced hybrid Africanized honey bees, which rapidly spread through Central America and Mexico, reaching the United States in 1990 (Hunter et al., 1993; Rubink et al., 1996). Africanized honey bees were first recorded in Arizona in 1993 (Guzman-Novoa and Page, 1994; Loper, 1997), and the greater Tucson metropolitan area supports an abundant pop- ulation (Baum et al., 2008). In areas with Africanized honey bees, the feral population is primarily Africanized (Harrison et al., 2006; Pinto et al., 2004, 2005; Rabe et al., 2005; Schneider et al., 2004). Africanized honey bees differ from Eurpoean honey bees by exhibiting stronger defensive behaviors and higher reproductive rates (Schneider et al., 2004; Winston, 1992; Winston et al., 1983). Colony sizes tend to be smaller and Africanized honey bees will use a wider variety of nest sites, including smaller nest cavities, such as water meter boxes (Schmidt and Hurley, 1995; Schneider et al., 2004; Winston, 1992; Winston et al., 1983). This combination of characteristics contributes to the high numbers of Africanized honey bee colonies in the greater Tucson metropolitan area (Baum et al., 2008) and poses unique challenges for controlling Africanized honey bees in urban areas. We used a dataset of Africanized honey bee colony occupancy of water meter boxes to evaluate the influence of spatial variables on the distribution of Africanized honey bee colonies in the greater 0169-2046/$ – see front matter © 2010 Elsevier B.V. All rights reserved. doi:10.1016/j.landurbplan.2010.12.005
Transcript of Spatial distribution of Africanized honey bees in an urban landscape
G
L
S
KMa
b
c
a
ARR2AA
KAAFLPS
1
pafaBipbhsh
i
e(s
0d
ARTICLE IN PRESSModel
AND-1933; No. of Pages 10
Landscape and Urban Planning xxx (2010) xxx–xxx
Contents lists available at ScienceDirect
Landscape and Urban Planning
journa l homepage: www.e lsev ier .com/ locate / landurbplan
patial distribution of Africanized honey bees in an urban landscape
risten A. Bauma,∗, Elizabeth Y. Kolodziejb, Maria D. Tchakerianc, Andrew G. Birt c,ichael Shermanb, Robert N. Coulsonc
Department of Zoology, 501 Life Sciences West, Oklahoma State University, Stillwater, OK 74078, USADepartment of Statistics, Texas A&M University, College Station, TX 77843-3143, USAKnowledge Engineering Laboratory, Department of Entomology, Texas A&M University, College Station, TX 77843-2475, USA
r t i c l e i n f o
rticle history:eceived 9 August 2010eceived in revised form9 November 2010ccepted 3 December 2010vailable online xxx
eywords:pis mellifera
a b s t r a c t
Africanized honey bees overlap in resource use with humans in urban environments, creating concernsover public health and safety. We obtained data on Africanized honey bee colony removals from watermeter boxes in the greater Tucson metropolitan area from 1996 to 2008 to identify characteristics asso-ciated with the spatial distribution of Africanized honey bees across the city. Two generalized linearmodels were constructed to predict the occupation of water meter boxes based on land use, lot/structurecharacteristics, and the presence of colonies in neighboring water meter boxes. More than 8000 colonieswere removed from water meter boxes during the 12-year study period. Colonies were more likely tooccupy water meter boxes associated with residential (versus commercial) locations, smaller lots, older
rizonaeral coloniesogistic modeloisson modelonoran desert
structures, closer distances to vacant land, and higher percentages of neighboring water meter boxeswith colonies. Occupied water meter boxes and boxes with multiple occupancies were concentrated inSouth Central Tucson, suggesting this area provides abundant resources for honey bees and that wellestablished, source colonies exist in this area. Locating and removing these source colonies may be thebest approach for controlling the Africanized honey bee population in the greater Tucson metropolitanarea and similar settings. Also, the regular removal of colonies from water meter boxes is important for
hone
the control of Africanized. Introduction
Urban areas often provide resources for wildlife and may bereferred habitat for some species. In the desert southwest, thevailability of pollen, nectar, and nesting cavities may be limitingor honey bees in natural areas, but urban areas may provide easiernd more consistent access to these resources (Baum et al., 2008;uchmann, 1996; Rabe et al., 2005; Stuart et al., 2006). Overlap
n resource use places honey bees in close proximity to humans,rompting public health concerns in areas with Africanized honeyees (Schmidt and Boyer Hassen, 1996). Thus, research on feraloney bee colonies in urban environments is needed to develop
Please cite this article in press as: Baum, K.A., et al., Spatial distribution of A(2011), doi:10.1016/j.landurbplan.2010.12.005
trategies for minimizing human interactions with Africanizedoney bees.
African honey bees (Apis mellifera scutellata) were introducednto Brazil in the 1950s (Winston, 1992). Matings between African
∗ Corresponding author. Tel.: +1 405 744 7424; fax: +1 405 744 7824.E-mail addresses: [email protected] (K.A. Baum),
[email protected] (E.Y. Kolodziej), [email protected]. Tchakerian), [email protected] (A.G. Birt),[email protected] (M. Sherman), [email protected] (R.N. Coulson).
169-2046/$ – see front matter © 2010 Elsevier B.V. All rights reserved.oi:10.1016/j.landurbplan.2010.12.005
y bees in the greater Tucson metropolitan area.© 2010 Elsevier B.V. All rights reserved.
honey bees and European honey bees produced hybrid Africanizedhoney bees, which rapidly spread through Central America andMexico, reaching the United States in 1990 (Hunter et al., 1993;Rubink et al., 1996). Africanized honey bees were first recorded inArizona in 1993 (Guzman-Novoa and Page, 1994; Loper, 1997), andthe greater Tucson metropolitan area supports an abundant pop-ulation (Baum et al., 2008). In areas with Africanized honey bees,the feral population is primarily Africanized (Harrison et al., 2006;Pinto et al., 2004, 2005; Rabe et al., 2005; Schneider et al., 2004).
Africanized honey bees differ from Eurpoean honey bees byexhibiting stronger defensive behaviors and higher reproductiverates (Schneider et al., 2004; Winston, 1992; Winston et al., 1983).Colony sizes tend to be smaller and Africanized honey bees willuse a wider variety of nest sites, including smaller nest cavities,such as water meter boxes (Schmidt and Hurley, 1995; Schneideret al., 2004; Winston, 1992; Winston et al., 1983). This combinationof characteristics contributes to the high numbers of Africanizedhoney bee colonies in the greater Tucson metropolitan area (Baum
fricanized honey bees in an urban landscape. Landscape Urban Plan.
et al., 2008) and poses unique challenges for controlling Africanizedhoney bees in urban areas.
We used a dataset of Africanized honey bee colony occupancyof water meter boxes to evaluate the influence of spatial variableson the distribution of Africanized honey bee colonies in the greater

ARTICLE IN PRESSG Model
LAND-1933; No. of Pages 10
2 K.A. Baum et al. / Landscape and Urban Planning xxx (2010) xxx–xxx
Table 1Explanatory variables used in the logistic and Poisson models, including a description of how the variable was measured at each water meter box, and associated means andstandard deviations.
Variable name Mean Standard deviation Variable description
Percent neighbors with colonies 2.46 2.47 The percent of neighboring water meter boxes within 0.8 km that hadbeen occupied during the 12-year study period for each water meter box
Construction year 1976 18.73 The year the structure associated with a water meter box was builtLot size (ha) 0.466 2.27 The land area of a parcel of land associated with a water meter boxDistance from “water” (km)a 1.42 1.27 Distances calculated as the distance from the center of the lot associated
with each water meter box to the nearest edge of the given land use typeDistance from recreational land (km) 3.73 3.74Distance from natural land (km) 2.42 2.51Distance from vacant land (km) 1.44 1.67Distance from agricultural land (km) 10.92 6.90Distance from transportation land (km) 1.36 1.70Indicator of pool within 0.8 km 0.737 0.440 Indicator variable for a pool within 0.8 km (i.e., 1 indicates a pool is present
and 0 indicates no pool is present). The mean is the percentage of watermeter boxes with a pool within 0.8 km
Indicator of residential location 0.821 0.383 Indicator variable for residential location (i.e., 1 indicates a residentiallocation and 0 indicates a nonresidential location). The mean is the
e were
Tewphsto
2
2
Peaiat1tSwTamrmbrctm
AwTwabwda
a Most of the lots classified as water did not hold water for most of the year; som
ucson metropolitan area. We developed logistic and Poisson mod-ls to identify factors that influence and predict the occupancy ofater meter boxes by Africanized honey bee colonies. These datarovide a unique perspective on the distribution of Africanizedoney bees because water meter boxes form a network of similarlyized and located sites across the entire greater Tucson metropoli-an area that are checked regularly (i.e., monthly) for the presencef colonies.
. Methods
.1. Study site and dataset
Tucson (32◦08′N Latitude; 110◦57′W Longitude) is located inima County in southeastern Arizona in the Sonoran Desert at anlevation of approximately 750 m above sea level, where averagennual rainfall is 29.7 cm, average annual maximum temperatures 27 ◦C, and average annual minimum temperature is 12 ◦C. Therea is characterized by flushes of nectar and pollen availability inhe spring and late summer/fall (Dimmit, 2000; O’Neal and Waller,984). Urban landscaping and irrigation, however, likely extendhese flowering periods in the greater Tucson metropolitan area.ources of nest cavities are relatively uncommon in natural areas,ith colonies frequently utilizing rock crevices (Loper et al., 2006;
aber, 1979), but man-made cavities, such as water meter boxesnd openings in buildings, are abundant in the greater Tucsonetropolitan area (Baum et al., 2008). The city of Tucson began
ecording the removal of Africanized honey bee colonies from watereter boxes in April 1996. Each time a water meter was checked for
illing purposes, occupancy by Africanized honey bee colonies wasecorded and colonies were flagged for removal. The resulting dataover a period from April 1996 to May 2008, where each record inhe database consists of a date when a colony was found in a water
eter box and the address of the location.Because the database only provides information for where
fricanized honey bee colonies were found (i.e., positive counts),e also obtained a large set of records from the Pima County
ax Assessor’s Office to acquire absence data (i.e., locations ofater meters without Africanized honey bee colonies). These data
Please cite this article in press as: Baum, K.A., et al., Spatial distribution of A(2011), doi:10.1016/j.landurbplan.2010.12.005
llowed occupancies to be placed in the context of water meterox availability. We used the year a structure was built to deducehen a water meter box became available and was included in ourataset. Since a large majority of the water meter data matchedstructure (i.e., parcel of land) described in the Tax Assessor’s
percentage of water meter boxes that were in residential locations
washes which fill with water only during the monsoon season (Shaw et al., 1998).
dataset, and we assumed that any missing data were Missing Com-pletely at Random (MCAR) (Little and Rubin, 2002), any bias causedby missing data appears to be minimal.
We converted the street address of each water meter to geo-graphic coordinates (longitude and latitude) using a commercialGIS product (ArcGIS® v. 9.3). These points were then used withother GIS layers to quantify variables (Table 1) associated with eachwater meter. A parcel layer obtained from the Pima County Depart-ment of Transportation, Geographic Information Services Division,contained the size of each parcel. Parcels of land without structures(and thus no water meters) were removed from the dataset. Amongcommercial properties, only information on improved propertieswas available and included in our dataset. Data from the PimaCounty Tax Assessor’s Office was used to determine the construc-tion date and presence of a swimming pool for each propertyrepresented by a water meter. The presence of a swimming poolrepresents a water source for honey bee colonies and the avail-ability of water sources can influence cavity selection by honey beecolonies. We used the land use classification for urban and suburbanareas developed by Shaw et al. (1998) to identify areas of Tucson asresidential, commercial, recreational, natural, vacant, agricultural,transportation, and watercourses (Table 1, Fig. 1). We measureddistance from each water meter box to the nearest edge of eachland use type using ArcGIS® v. 9.3. We also calculated the percentoccupancy of neighboring water meter boxes based on the typicalforaging radius and swarm dispersal distance of honey bee colonies.The distance that honey bees forage from the colony varies with thedistribution and abundance of resources, but ranges from severalmeters to over 10,000 m (Beekman and Ratnieks, 2000; Schneiderand Hall, 1997; Visscher and Seeley, 1982; Waddington et al., 1994).We assumed that honey bees typically forage within 0.8 km of theircolony because resources are relatively abundant in the greaterTucson metropolitan area (Beekman et al., 2004). Swarm disper-sal distances are also variable, but most swarms typically disperse200–600 m from the parental nest (Lindauer, 1955; Schmidt, 1995;Schmidt and Thoenes, 1990; Seeley and Morse, 1977), althoughSchneider (1995) identified longer dispersal distances for Africanand hybrid honey bee colonies in Costa Rica. Thus, we defined a“neighbor” to be a water meter box within 0.8 km of a given water
fricanized honey bees in an urban landscape. Landscape Urban Plan.
meter. The number of water meter boxes within 0.8 km of anygiven water meter that had been occupied at least once duringthe 12-year study period was calculated and expressed as a per-centage of the total number of water meter boxes within the samearea.

ARTICLE IN PRESSG Model
LAND-1933; No. of Pages 10
K.A. Baum et al. / Landscape and Urban Planning xxx (2010) xxx–xxx 3
ea foll
2
awtmtms1soa
eiwinAAbctwca
Fig. 1. Land use for the greater Tucson metropolitan ar
.2. Model building
We developed models that use landscape and lot/structure char-cteristics as explanatory variables to predict the occupancy of theater meter boxes. We used a logistic regression model to predict
he presence or absence of Africanized honey bee colonies in watereter boxes over the 12-year study period based on the explana-
ory variables (Table 1). Of the 275,877 parcels, only 5640 watereter boxes had been occupied at least once during the 12-year
tudy period, so occupancy rates were generally low. However,350 water meter boxes were occupied more than once during thetudy period. To model this behavior, a second model was devel-ped that regressed the number of times a location was occupiedgainst the explanatory variables.
Several assumptions were made when developing these mod-ls. First, we assumed the water meter dataset was complete. Thats, colonies were removed only by the water company and removals
ere always recorded. We also assumed that for every month,f there was no record of a colony in a water meter box, thenone were present. Secondly, some records showed the presence offricanized honey bee colonies within two weeks of one another.lthough the city usually checks water meters once a month forilling purposes, checks may be made more frequently in someases. To address these irregularities, we selected 30 days as the
Please cite this article in press as: Baum, K.A., et al., Spatial distribution of A(2011), doi:10.1016/j.landurbplan.2010.12.005
ime required for a new colony to become established (i.e., neworkers emerging; Gerig and Imdorf, 1984). Records showing a
olony in the same water meter box less than 30 days apart weressumed to be the same colony that had not yet been removed. Con-
owing a classification developed by Shaw et al. (1998).
versely, if the records were more than 30 days apart, we assumedthere were two separate colonies (i.e., one colony was removedand replaced by another colony the next month). Third, althoughrecords contained the construction date for a building, it is possi-ble that water meters were turned off (and therefore not checked)at times during the study period. Similarly, although water metersof new buildings were included in the sample from the year theywere built onward, it is possible there were differences betweenthe build date and the date the water meter became active (i.e., theowners of the property take residence). Finally, we assumed therewas a linear relationship between the variables and the log oddsof having a colony in a water meter box for the logistic regressionmodel, and also a linear relationship between the log of the meannumber of times a water meter box was occupied and the othervariables for the Poisson regression model.
The logistic model ln(�s/(1 − �s)) =∑k
j=1ˇjxsj was used tomodel the presence or absence of a colony during the 12-year studyperiod. The parameter �s denotes the probability that a colony everoccupies location s. The explanatory variables, x1,. . .,xk, include theyear the structure corresponding to the water meter was built,whether or not a pool was present, lot size (ha), distance fromeach land use type (km), and the proportion of the locations within0.8 km radius that were occupied by a colony at least once (Table 1).
fricanized honey bees in an urban landscape. Landscape Urban Plan.
The ˇs are the parameter values. For example, if x2 denotes landarea, a fitted positive parameter estimate ˆ̌ 2 would indicate thatwater meter boxes on larger parcels of land were predicted tohave a higher probability of colony occupation. An indicator vari-able is a variable which takes on the value 1 when the item being

ARTICLE IN PRESSG Model
LAND-1933; No. of Pages 10
4 K.A. Baum et al. / Landscape and Urban Planning xxx (2010) xxx–xxx
F e mapl nstruc
dcwahn
omnttmc(iam
o1wtoedi
ig. 2. Spatial distribution of selected explanatory variables used in the models. Thot size, (B) distance to vacant land, (C) percent neighbors with colonies, and (D) co
escribed is present and 0 when it is absent. For example, the indi-ator variable for swimming pools is 1 for those water meter boxesith a swimming pool within 0.8 km. The average of indicator vari-
bles is a percentage, and a positive parameter estimate indicates aigher probability of colony occupation when a swimming pool isearby.
To explain the number of times a water meter box had beenccupied during the 12-year study period, we used the Poissonodel: ln(�s) =
∑kj=1ˇjxsj . The mean, �s, denotes the expected
umber of times a colony occurred at location s. The explana-ory variables were defined as for the logistic model, whilehe parameter estimate ˆ̌ 2 now has the interpretation for this
odel that larger parcels of land were predicted to have moreolony occupations. Because of the high zero count of the datai.e., there were many locations that never had colonies), wencluded an over-dispersion parameter that accounted for the meannd variance not being equal as they are in the usual Poissonodel.To find parameter estimates for both models, the default method
f Iterative Reweighted Least Squares (Scales and Gersztenkorn,988) for generalized linear models was used. All calculationsere done using R v. 2.9.2. After estimating the ˇ parameters for
Please cite this article in press as: Baum, K.A., et al., Spatial distribution of A(2011), doi:10.1016/j.landurbplan.2010.12.005
he Poisson model, the final parameter to be estimated was thever-dispersion parameter, ϕ. When the mean and variance arequal, as is the case for the usual Poisson distribution, the over-ispersion parameter is equal to 1. When data are over-dispersed, ϕ
s greater than 1. To estimate ϕ, McCullaugh and Nelder (1989) were
s show, for every water meter box in the greater Tucson metropolitan area, the (A)tion year.
followed:
ϕ̂ = 1n − p
n∑
s=1
(Ys − �̂s)2
�̂s
where n is the sample size, p is the number of variables, Ys is theobserved number of times a colony had been built at location s,�̂s is exp(
∑jˆ̌
jxjs), and xjs is the value of explanatory variable jcorresponding to location s.
Due to spatial correlations for water meter boxes close to oneanother, variances of parameter estimates derived under inde-pendence are likely not appropriate. For this reason, we used ablock resampling technique to estimate variances of the param-eters, Var( ˆ̌ ), as in Heagerty and Lumley (2000). P-values werethen obtained from 2P(T > tobs), where tobs = ( ˆ̌ /se( ˆ̌ )), and se( ˆ̌ ) =√
Var( ˆ̌ ).
3. Results
On average, about 2.46% of the water meter boxes within 0.8 kmof any water meter box were occupied by an Africanized honey beecolony (Table 1), and they tended to be concentrated in South Cen-
fricanized honey bees in an urban landscape. Landscape Urban Plan.
tral Tucson (Fig. 2C). The mean year for housing construction was1976, with the oldest house being built in 1875 and older housestending to be clustered in South Central Tucson (Table 1, Fig. 2D).The average lot size was 0.466 ha (Table 1, Fig. 2A). Lot size tended tobe largest and water meter box density lowest around the periph-

ARTICLE IN PRESSG Model
LAND-1933; No. of Pages 10
K.A. Baum et al. / Landscape and Urban Planning xxx (2010) xxx–xxx 5
rough
ebrt(tfod3al(
i
TNf
Fig. 3. The density of water meter boxes th
ry of the city (Figs. 2A and 3). Seventy-four percent of water meteroxes were within 0.8 km of a swimming pool and 82% were inesidential locations (Table 1). Colonies were on average closesto transportation land (1.36 km), water (1.42 km), and vacant land1.44 km), and farthest from agricultural land (10.92 km; Table 1). Aotal of 8211 colonies were removed from 5640 water meter boxesrom April 1996 through May 2008 (Table 2). Eighty-seven percentf these removed colonies were from water meter boxes in resi-ential areas, 6.2% from commercial/industrial/institutional areas,.1% from graded vacant land (Fig. 2B), and 2.6% from natural open
Please cite this article in press as: Baum, K.A., et al., Spatial distribution of A(2011), doi:10.1016/j.landurbplan.2010.12.005
reas (Table 2). On average, colonies had access to almost all theand use types in less than 3.73 km, except for agricultural landTable 1).
The percentage of neighboring water meter boxes with coloniesn the past 12 years was a significant predictor variable in both
able 2umber of Africanized honey bee colonies removed from water meter boxes, number of
or each land use type in the greater Tucson metropolitan area.
Land use type # colonies removed # water mete
Residential 7116 4860Commercial and public facilities 510 330Recreation 29 22Watercourses and ponds 70 49Natural open space 211 165Graded vacant land 253 199Agricultural land 16 10Transportation 6 5
out the greater Tucson metropolitan area.
the logistic and Poisson models (Tables 3 and 4). The occupancyof a water meter box by a colony was a relatively rare event. How-ever, the probability of a particular water meter box being occupiedwas significantly greater when neighboring water meter boxes(within 0.8 km) had been occupied. Construction year, lot size, dis-tance from vacant land, and whether the location was classified asresidential were also significant in both models. High occupancyprobabilities were clustered in South Central Tucson and severalisolated residential suburbs away from the city center (e.g., Ranchodel Cerro, Tucson Estates; Fig. 4). High multiple occupancy prob-
fricanized honey bees in an urban landscape. Landscape Urban Plan.
abilities were primarily clustered in South Central Tucson (Fig. 5).In both models, because of the large sample size, power was suf-ficient to detect important deviations from zero slope, and it isunlikely that a larger sample size would change our conclusionsabout model parameters.
water meter boxes with colonies, number of water meter boxes available, and area
r boxes with colonies # water meter boxes available Area (ha)
165,040 38,76111,744 5901
2659 38,3682329 5465
23,765 60,71818,335 6806
839 1449389 5122
ARTICLE IN PRESSG Model
LAND-1933; No. of Pages 10
6 K.A. Baum et al. / Landscape and Urban Planning xxx (2010) xxx–xxx
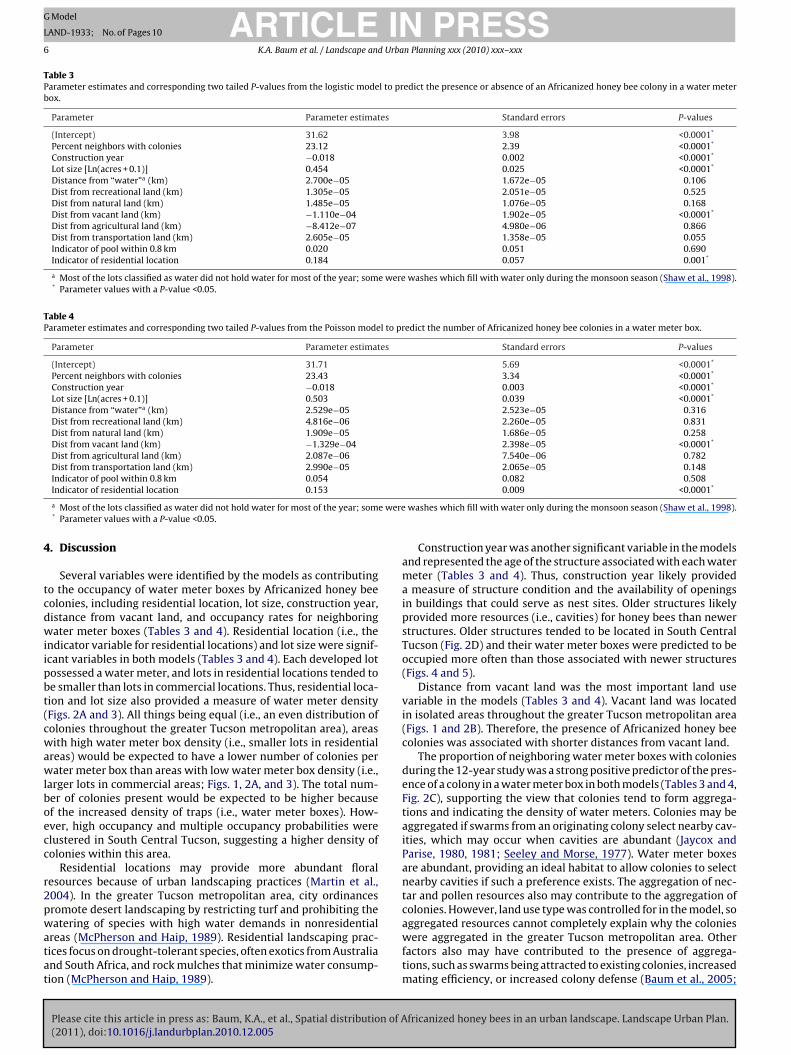
Table 3Parameter estimates and corresponding two tailed P-values from the logistic model to predict the presence or absence of an Africanized honey bee colony in a water meterbox.
Parameter Parameter estimates Standard errors P-values
(Intercept) 31.62 3.98 <0.0001*
Percent neighbors with colonies 23.12 2.39 <0.0001*
Construction year −0.018 0.002 <0.0001*
Lot size [Ln(acres + 0.1)] 0.454 0.025 <0.0001*
Distance from “water”a (km) 2.700e−05 1.672e−05 0.106Dist from recreational land (km) 1.305e−05 2.051e−05 0.525Dist from natural land (km) 1.485e−05 1.076e−05 0.168Dist from vacant land (km) −1.110e−04 1.902e−05 <0.0001*
Dist from agricultural land (km) −8.412e−07 4.980e−06 0.866Dist from transportation land (km) 2.605e−05 1.358e−05 0.055Indicator of pool within 0.8 km 0.020 0.051 0.690Indicator of residential location 0.184 0.057 0.001*
a Most of the lots classified as water did not hold water for most of the year; some were washes which fill with water only during the monsoon season (Shaw et al., 1998).* Parameter values with a P-value <0.05.
Table 4Parameter estimates and corresponding two tailed P-values from the Poisson model to predict the number of Africanized honey bee colonies in a water meter box.
Parameter Parameter estimates Standard errors P-values
(Intercept) 31.71 5.69 <0.0001*
Percent neighbors with colonies 23.43 3.34 <0.0001*
Construction year −0.018 0.003 <0.0001*
Lot size [Ln(acres + 0.1)] 0.503 0.039 <0.0001*
Distance from “water”a (km) 2.529e−05 2.523e−05 0.316Dist from recreational land (km) 4.816e−06 2.260e−05 0.831Dist from natural land (km) 1.909e−05 1.686e−05 0.258Dist from vacant land (km) −1.329e−04 2.398e−05 <0.0001*
Dist from agricultural land (km) 2.087e−06 7.540e−06 0.782Dist from transportation land (km) 2.990e−05 2.065e−05 0.148
e were
4
tcdwiipbt(cwawlboecc
r2pwatat
Indicator of pool within 0.8 km 0.054Indicator of residential location 0.153
a Most of the lots classified as water did not hold water for most of the year; som* Parameter values with a P-value <0.05.
. Discussion
Several variables were identified by the models as contributingo the occupancy of water meter boxes by Africanized honey beeolonies, including residential location, lot size, construction year,istance from vacant land, and occupancy rates for neighboringater meter boxes (Tables 3 and 4). Residential location (i.e., the
ndicator variable for residential locations) and lot size were signif-cant variables in both models (Tables 3 and 4). Each developed lotossessed a water meter, and lots in residential locations tended toe smaller than lots in commercial locations. Thus, residential loca-ion and lot size also provided a measure of water meter densityFigs. 2A and 3). All things being equal (i.e., an even distribution ofolonies throughout the greater Tucson metropolitan area), areasith high water meter box density (i.e., smaller lots in residential
reas) would be expected to have a lower number of colonies perater meter box than areas with low water meter box density (i.e.,
arger lots in commercial areas; Figs. 1, 2A, and 3). The total num-er of colonies present would be expected to be higher becausef the increased density of traps (i.e., water meter boxes). How-ver, high occupancy and multiple occupancy probabilities werelustered in South Central Tucson, suggesting a higher density ofolonies within this area.
Residential locations may provide more abundant floralesources because of urban landscaping practices (Martin et al.,004). In the greater Tucson metropolitan area, city ordinancesromote desert landscaping by restricting turf and prohibiting the
Please cite this article in press as: Baum, K.A., et al., Spatial distribution of A(2011), doi:10.1016/j.landurbplan.2010.12.005
atering of species with high water demands in nonresidentialreas (McPherson and Haip, 1989). Residential landscaping prac-ices focus on drought-tolerant species, often exotics from Australiand South Africa, and rock mulches that minimize water consump-ion (McPherson and Haip, 1989).
0.082 0.5080.009 <0.0001*
washes which fill with water only during the monsoon season (Shaw et al., 1998).
Construction year was another significant variable in the modelsand represented the age of the structure associated with each watermeter (Tables 3 and 4). Thus, construction year likely provideda measure of structure condition and the availability of openingsin buildings that could serve as nest sites. Older structures likelyprovided more resources (i.e., cavities) for honey bees than newerstructures. Older structures tended to be located in South CentralTucson (Fig. 2D) and their water meter boxes were predicted to beoccupied more often than those associated with newer structures(Figs. 4 and 5).
Distance from vacant land was the most important land usevariable in the models (Tables 3 and 4). Vacant land was locatedin isolated areas throughout the greater Tucson metropolitan area(Figs. 1 and 2B). Therefore, the presence of Africanized honey beecolonies was associated with shorter distances from vacant land.
The proportion of neighboring water meter boxes with coloniesduring the 12-year study was a strong positive predictor of the pres-ence of a colony in a water meter box in both models (Tables 3 and 4,Fig. 2C), supporting the view that colonies tend to form aggrega-tions and indicating the density of water meters. Colonies may beaggregated if swarms from an originating colony select nearby cav-ities, which may occur when cavities are abundant (Jaycox andParise, 1980, 1981; Seeley and Morse, 1977). Water meter boxesare abundant, providing an ideal habitat to allow colonies to selectnearby cavities if such a preference exists. The aggregation of nec-tar and pollen resources also may contribute to the aggregation ofcolonies. However, land use type was controlled for in the model, so
fricanized honey bees in an urban landscape. Landscape Urban Plan.
aggregated resources cannot completely explain why the colonieswere aggregated in the greater Tucson metropolitan area. Otherfactors also may have contributed to the presence of aggrega-tions, such as swarms being attracted to existing colonies, increasedmating efficiency, or increased colony defense (Baum et al., 2005;

ARTICLE IN PRESSG Model
LAND-1933; No. of Pages 10
K.A. Baum et al. / Landscape and Urban Planning xxx (2010) xxx–xxx 7
F es prem the li to the
M1namwt
cl(teteCstmtetna
we
ig. 4. Spatial distribution of Africanized honey bee colony occupancy probabilitietropolitan area predicted to have high occupancy rates based on the results of
nterpretation of the references to color in this figure legend, the reader is referred
cNally and Schneider, 1996; Oldroyd et al., 1995; Seeley et al.,982). Perhaps the most plausible explanation is the presence ofearby, well established colonies in some other type of cavity, suchs an opening in a building or a tree cavity, which was not checkedonthly for the presence of an Africanized honey bee colony. Theseell established colonies would produce swarms regularly, and
hese swarms may colonize nearby water meter boxes.The indicator variable for swimming pools was not signifi-
ant for either model, suggesting sources of water were likely notimiting for honey bees in the greater Tucson metropolitan areaTables 3 and 4). Distances to recreational, natural, agricultural, andransportation land also were not important predictors in the mod-ls. Recreational land was concentrated in large expanses outsidehe greater Tucson metropolitan area (e.g., Coronado National For-st, Saguaro National Park, Catalina State Park, Tucson Mountainounty Park, etc.) and limited to smaller, isolated areas within thetudy area (Fig. 1). Distance from natural land was related to dis-ance from the center of Tucson (i.e., natural land use types were
ore often located in the outskirts of the greater Tucson metropoli-an area). Agricultural land (e.g., orchards, vineyards, cattle ranches,tc.) was uncommon and restricted to a few isolated areas aroundhe outskirts of the study area (Fig. 1). Transportation land would
Please cite this article in press as: Baum, K.A., et al., Spatial distribution of A(2011), doi:10.1016/j.landurbplan.2010.12.005
ot provide resources for honey bees and the associated noise andctivity could be disruptive to Africanized honey bee colonies.
Africanized honey bee colony occupancies of water meter boxesere concentrated in South Central Tucson (Fig. 4), suggesting that
ither a denser population of honey bees occurred in this area or
dicted by the logistic model. Brown/dark areas show parts of the greater Tucsonogistic model. Yellow/light areas are predicted to have low occupancy rates. (Forweb version of this article.)
that more colonies were utilizing water meter boxes as cavitiesin this area (the opposite would be expected for areas with fewcolony occupancies). Because we do not expect cavities (i.e., watermeters or other types of cavities) to be limiting in the greater Tucsonmetropolitan area, we assume the former explanation is more rea-sonable. Africanized honey bees use many different types of cavitiesin urban areas, including tree hollows, openings in buildings, trashcans, tires, and other spaces of adequate size (Baum et al., 2008).Water meter boxes in residential areas are, on average, the samesize and shape (i.e., approx. 31.115 cm W × 48.26 cm L × 20.32 cm H)and are usually composed of concrete, although a few may be castiron. Water meter boxes for large apartment complexes and com-mercial buildings may be larger to accommodate multiple watermeters within the same box. If water meter boxes and other cav-ities are relatively constant in quality and colonies do not exhibita preference for water meter boxes or other cavities, then basedon a random-encounter model, we would expect water meter boxoccupancy to be positively related to the availability of water meterboxes relative to other types of cavities. Because we expect otherurban sources of cavities to be relatively abundant throughout thegreater Tucson metropolitan area (Baum et al., 2008), locationswith higher occupancy rates likely represent areas with a denser
fricanized honey bees in an urban landscape. Landscape Urban Plan.
population of Africanized honey bees. However, there are likelymicroclimatic differences among water meter boxes which couldinfluence suitability for honey bee colonies, such as exposure tosunlight which could melt comb and cause honey bees to rejectwater meter boxes located in full sun.

ARTICLE IN PRESSG Model
LAND-1933; No. of Pages 10
8 K.A. Baum et al. / Landscape and Urban Planning xxx (2010) xxx–xxx
F obabiT n theo the re
hsscstSspwc
ctwtbiaiAthi
F
ig. 5. Spatial distribution of Africanized honey bee colony multiple occupancy prucson metropolitan area predicted to have high multiple occupancy rates based occupancy rates. (For interpretation of the references to color in this figure legend,
Multiple occupancies of water meter boxes by Africanizedoney bee colonies also were concentrated in South Central Tuc-on (Fig. 5). Honey bee colonies are likely to reuse cavities foreveral reasons. First, colonies likely use similar criteria to selectavities, so a cavity selected by one colony is also likely to beelected by other colonies when it is unoccupied. Second, coloniesend to form aggregations (Baum et al., 2005, 2008; McNally andchneider, 1996; Oldroyd et al., 1995; Seeley et al., 1982; see discus-ion above). Lastly, colonies are attracted to and may even preferreviously occupied cavities (Seeley and Morse, 1978), which ishy pest control companies usually fill cavities with foam after a
olony is removed.The interpretation of model results is constrained by potential
hallenges and sources of bias associated with the dataset. Explana-ory variables were selected from existing spatial data layers andere not specifically designed to quantify ecologically impor-
ant landscape characteristics, although these layers were selectedecause they are good approximations of landscape characteristics
mportant to honey bees. For example, the age of a structure may bessociated with structure condition and the availability of openingsn buildings that could serve as nest sites for honey bee colonies.lthough relationships exist between the quantities measured in
Please cite this article in press as: Baum, K.A., et al., Spatial distribution of A(2011), doi:10.1016/j.landurbplan.2010.12.005
he spatial data layers and factors of direct ecological relevance tooney bees, these relationships have not been quantified and the
nfluence of these variables must be carefully interpreted.The dataset also may possess patterns of socio-economic bias.
or example, more affluent residential areas may provide more flo-
lities predicted by the Poisson model. Brown/dark areas show parts of the greaterresults of the Poisson model. Yellow/light areas are predicted to have low multipleader is referred to the web version of this article.)
ral resources for bees, as perennial plant species richness typicallyincreases with median family income (Martin et al., 2004). At thesame time, the source population of Africanized honey bees (i.e.,colonies located in other types of cavities that are not removedon a monthly basis) may be smaller in more affluent residentialareas because residents may be more likely to request and pay forpest removal services (Baum et al., 2008). Some of this bias maybe controlled for by lot size, as larger lots may be associated withlarger median family incomes. Any bias is likely small comparedto data collected from pest control companies, which are based onthe ability/willingness of residents to pay for pest removal services(e.g., Baum et al., 2008).
A potential challenge is that water meters are not evenly spacedthroughout the greater Tucson metropolitan area (i.e., water meterdensity ranges from approximately 0–179 per ha; Fig. 3), so sam-pling effort was variable throughout the study area. However, thisissue was resolved by using the appropriate logistic and Poissonregression models that included both presence and absence data(i.e., when modeling occupancy of neighboring water meter boxes,we used the percent of neighbors that had been occupied ratherthan a count of the number of neighbors that had been occupied).
This extensive dataset provides a unique perspective on the
fricanized honey bees in an urban landscape. Landscape Urban Plan.
ecology of Africanized honey bees in urban areas. The expanse ofthe dataset is large (i.e., 275,877 water meter boxes spread acrossthe study area that were checked monthly for billing purposes)compared to the number of sampling locations and frequency ofsampling that would be logistically possible with any experiment

ING
L
Urba
whwloam
iaace(teciaocTAdwb
spblrdovcgstdm
A
nDwettC
R
B
B
B
B
B
ARTICLEModel
AND-1933; No. of Pages 10
K.A. Baum et al. / Landscape and
e could have designed to evaluate the distribution of Africanizedoney bees across the greater Tucson metropolitan area. A commoneakness of such large data sets is that models identify meaning-
ess deviations in slope from zero as being significant. However,ur models did not identify any multiplicative factors between 0.9nd 1.1 as being significant for the odds of occupancy in the logisticodel or expected number of occupancies in the Poisson model.The 12-year dataset highlights areas that were consistently high
n Africanized honey bee colony occupancy, suggesting these areasre extremely attractive to Africanized honey bees (i.e., containbundant nectar, pollen, and cavity resources) and/or that sourceolonies exist nearby. The areas of highest occupancy and high-st multiple occupancy are located within South Central TucsonFigs. 4 and 5). Thus, it is likely that resource availability is high inhis area and that a source population of well established coloniesxists in this area. Locating and removing these well establishedolonies may be the best approach for controlling the African-zed honey bee population in the greater Tucson metropolitan areand similar settings. Our dataset also emphasizes the importancef the monthly removal of colonies from water meter boxes forontrol of the Africanized honey bee population in the greaterucson metropolitan area. Without access to water meter boxes,fricanized honey bee colonies would nest in other locations whereetection and removal would likely not occur on a monthly basis,hich could lead to an increase in the size of the Africanized honey
ee population.An evaluation of honey bee colony removals from multiple
ources (e.g., water companies, pest control companies, etc.) wouldrovide additional insight into the ecology of Africanized honeyees in urban areas. Comparing different types of spatial data (e.g.,
attice/grid data represented by water meter boxes, point dataepresented by removals by pest control companies, etc.) withifferent limitations/constraints would expand our understandingf how Africanized honey bees respond to spatial and temporalariability in the environment. Furthermore, a detailed analysis ofavity use in different land use types could lead to improved strate-ies for controlling Africanized honey bees in urban areas. Thistudy also identifies and uses data from a nontraditional sourceo address an important issue in urban ecology, suggesting a newirection for future landscape level research in urban environ-ents.
cknowledgments
V. Chen, A. Bunting, J. Yu and S. Kim provided valuable tech-ical assistance throughout this project. Ms. Bryn Enright (GISatabase Administrator, Tucson Water, Tucson, AZ) provided theater meter database used in this study. Four anonymous review-
rs provided valuable comments on the manuscript. Funding forhis project was provided by the Texas Legislative Initiative: Pro-ection and Management of Honey Bees—Pollinators of Agriculturalrops, Orchards, and Natural Landscapes.
eferences
aum, K.A., Rubink, W.L., Pinto, M.A., Coulson, R.N., 2005. Spatial and temporaldistribution and nest site characteristics of feral honey bee (Hymenoptera:Apidae) colonies in a coastal prairie landscape. Environ. Entomol. 34, 610–618.
aum, K.A., Tchakerian, M.D., Thoenes, S.C., Coulson, R.N., 2008. Africanized honeybees in urban environments: a spatio-temporal analysis. Landscape Urban Plann.85, 123–132.
eekman, M., Ratnieks, F.L.W., 2000. Long range foraging by the honey-bee, Apis
Please cite this article in press as: Baum, K.A., et al., Spatial distribution of A(2011), doi:10.1016/j.landurbplan.2010.12.005
mellifera L. Funct. Ecol. 14, 490–496.eekman, M., Sumpter, D.J.T., Seraphides, N., Ratnieks, F.L.W., 2004. Comparing for-
aging behaviour of small and large honey-bee colonies by decoding waggledances made by foragers. Funct. Ecol. 18, 829–835.
uchmann, S.L., 1996. Competition between honey bees and native bees in the Sono-ran Desert and global bee conservation issue. In: Matheson, A., Buchmann, S.L.,
PRESSn Planning xxx (2010) xxx–xxx 9
O’Toole, C., Westrich, P., Williams, I.H. (Eds.), The Conservation of Bees. AcademicPress, New York, pp. 125–142.
Dimmit, M.A., 2000. Plant ecology of the Sonoran Desert region. In: Phillips,S.J., Comus, P.W. (Eds.), A Natural History of the Sonoran Desert. Arizona-Sonoran Desert Museum Press/University of California Press, Tucson/Berkeley,pp. 129–151.
Gerig, L., Imdorf, A., 1984. Development of the bee population in twoswarming colonies and their swarms. Schweiz. Bienen-Zeitung 107, 309–313.
Guzman-Novoa, E., Page Jr., R.E., 1994. The impact of Africanized bees on Mexicanbeekeeping. Am. Bee J. 134, 101–106.
Harrison, J.F., Fewell, J.H., Anderson, K.E., Loper, G.M., 2006. Environmental physi-ology of the invasion of the Americas by Africanized honeybees. Integr. Comp.Biol. 46, 1110–1122.
Heagerty, P.J., Lumley, T., 2000. Window subsampling of estimating functions withapplication to regression models. J. Am. Stat. Assoc. 95, 197–211.
Hunter, L.A., Jackman, J.A., Sugden, E.A., 1993. Detection records of Africanized honeybees in Texas during 1990, 1991, and 1992. Southwest. Entomol. 18, 79–89.
Jaycox, E.R., Parise, S.G., 1980. Homesite selection by Italian honey bee swarmsApis mellifera ligustica (Hymenoptera: Apidae). J. Kans. Entomol. Soc. 53,171–178.
Jaycox, E.R., Parise, S.G., 1981. Homesite selection by swarms of black-bodied hon-eybees, Apis mellifera caucasica and A. m. carnica (Hymenoptera: Apidae). J. Kans.Entomol. Soc. 54, 697–703.
Lindauer, M., 1955. Schwarmbienen auf wohnungssuche. Z. Vergl. Physiol. 37,263–324.
Little, R.J.A., Rubin, D.B., 2002. Statistical Analysis with Missing Data, second ed.Wiley, Hoboken, NJ.
Loper, G.M., 1997. Genetic evidence of the Africanization of feral colonies in S Arizonabetween 1993 and 1995. Am. Bee J. 137, 669–671.
Loper, G.M., Sammataro, D., Finley, H., Cole, J., 2006. Feral honey bees in southernArizona 10 years after Varroa infestation. Am. Bee J. 146, 521–524.
Martin, C.A., Warren, P.S., Kinzig, A.P., 2004. Neighborhood socioeconomic status is auseful predictor of perennial landscape vegetation in residential neighborhoodsand embedded small parks of Phoenix, AZ. Landscape Urban Plann. 69, 355–368.
McCullaugh, P., Nelder, J.A., 1989. Generalized Linear Models, second ed. Chapmanand Hall, New York.
McNally, L.C., Schneider, S.S., 1996. Spatial distribution and nesting biology ofcolonies of the African honey bee Apis mellifera scutellata (Hymenoptera: Apidae)in Botswana, Africa. Environ. Entomol. 25, 643–652.
McPherson, E.G., Haip, R.A., 1989. Emerging desert landscape in Tucson. Geogr. Rev.79, 435–449.
Oldroyd, B., Smolenski, A., Lawler, S., Estoup, A., Crozier, R., 1995. Colony aggrega-tions in Apis mellifera L. Apidologie 26, 119–130.
O’Neal, R.J., Waller, G.D., 1984. On the pollen harvest by the honey bee (Apis melliferaL.) near Tucson Arizona (1976–1981). Desert Plants 6, 81–109.
Pinto, M.A., Rubink, W.L., Coulson, R.N., Patton, J.C., Johnston, J.S., 2004. Temporalpattern of Africanization in a feral honeybee population from Texas inferredfrom mitochondrial DNA. Evolution 58, 1047–1055.
Pinto, M.A., Rubink, W.L., Patton, J.C., Coulson, R.N., Johnston, J.S., 2005. African-ization in the United States: replacement of feral European honey bees (Apismellifera L.) by an African hybrid swarm. Genetics 170, 1653–1665.
Rabe, M.J., Rosenstock, S.S., Nielsen, D.I., 2005. Feral Africanized honey bees (Apismellifera) in Sonoran desert habitats of southwestern Arizona. Southwest. Nat.50, 307–311.
Rubink, W.L., Leuvano-Martinez, P., Sugden, E.A., Wilson, W.T., Collins, A.M., 1996.Subtropical Apis mellifera (Hymenoptera: Apidae) swarming dynamics andAfricanization rates in northeastern Mexico and southern Texas. Ann. Entomol.Soc. Am. 89, 243–251.
Scales, J.A., Gersztenkorn, A., 1988. Robust methods in inverse theory. Inverse Probl.4, 1071–1091.
Schmidt, J.O., 1995. Dispersal distance and direction of reproductive European honeybee swarms (Hymenoptera: Apidae). J. Kans. Entomol. Soc. 68, 320–325.
Schmidt, J.O., Boyer Hassen, L.V., 1996. When Africanized bees attack: what you andyour clients should know. Vet. Med. 91, 923–928.
Schmidt, J.O., Hurley, R., 1995. Selection of nest cavities by Africanized and Europeanhoney bees. Apidologie 26, 467–475.
Schmidt, J.O., Thoenes, S.C., 1990. The efficiency of swarm traps: what percentof swarms are captured and at what distance from the hive. Am. Bee J. 130,811–812.
Schneider, S.S., 1995. Swarm movement patterns inferred from waggle danceactivity of the neotropical African honey bee in Costa Rica. Apidologie 26,395–406.
Schneider, S.S., DeGrandi-Hoffman, G., Smith, D.R., 2004. The African honey bee:factors contributing to a successful biological invasion. Ann. Rev. Entomol. 49,351–376.
Schneider, S.S., Hall, H.G., 1997. Diet selection and foraging distances of Africanand European-African hybrid honey bee colonies in Costa Rica. Insect. Soc. 44,171–187.
fricanized honey bees in an urban landscape. Landscape Urban Plan.
Seeley, T.D., Morse, R.A., 1977. Dispersal behavior of honey bee swarms. Psyche 83,199–209.
Seeley, T.D., Morse, R.A., 1978. Nest site selection by the honey bee. Insect. Soc. 25,323–337.
Seeley, T.D., Seeley, R.H., Akratanakul, P., 1982. Colony defense strategies of thehoneybees in Thailand. Ecol. Monogr. 52, 43–63.

ING
L
1 d Urba
S
S
TV
ARTICLEModel
AND-1933; No. of Pages 10
0 K.A. Baum et al. / Landscape an
haw, W.W., Harris, L.K., Livingston, M., 1998. Vegetative characteristics of urbanland covers in metropolitan Tucson. Urban Ecosyst. 2, 65–73.
Please cite this article in press as: Baum, K.A., et al., Spatial distribution of A(2011), doi:10.1016/j.landurbplan.2010.12.005
tuart, G., Gries, C., Hope, D., 2006. The relationship between pollen and extantvegetation across an arid urban ecosystem and surrounding desert in SouthwestUSA. J. Biogeogr. 33, 573–591.
aber III, S., 1979. A population of feral honey bee colonies. Am. Bee J. 118, 842–847.isscher, P.K., Seeley, T.D., 1982. Foraging strategy of honeybee colonies in a tem-
perate deciduous forest. Ecology 63, 1790–1801.
PRESSn Planning xxx (2010) xxx–xxx
Waddington, K.D., Visscher, P.K., Herbert, T.J., Raveret Richter, M., 1994. Compar-isons of forager distributions from matched honey bee colonies in suburban
fricanized honey bees in an urban landscape. Landscape Urban Plan.
environments. Behav. Ecol. Sociobiol. 35, 423–429.Winston, M.L., 1992. The biology and management of Africanized honey bees. Ann.
Rev. Entomol. 37, 173–193.Winston, M.L., Taylor, O.R., Otis, G.W., 1983. Some differences between temperate
European and tropical African and South American honey bees. Bee World 64,12–21.