Mapping sleeping bees within their nest: spatial and temporal analysis of worker honey bee sleep
11
Mapping Sleeping Bees within Their Nest: Spatial and Temporal Analysis of Worker Honey Bee Sleep Barrett Anthony Klein 1 *, Martin Stiegler 2 , Arno Klein 3 , Ju ¨ rgen Tautz 2 1 The University of Wisconsin – La Crosse, Department of Biology, La Crosse, Wisconsin, United States of America, 2 University of Wu ¨ rzburg, BEEgroup, Biozentrum, Wu ¨ rzburg, Germany, 3 Sage Bionetworks, Seattle, Washington, United States of America Abstract Patterns of behavior within societies have long been visualized and interpreted using maps. Mapping the occurrence of sleep across individuals within a society could offer clues as to functional aspects of sleep. In spite of this, a detailed spatial analysis of sleep has never been conducted on an invertebrate society. We introduce the concept of mapping sleep across an insect society, and provide an empirical example, mapping sleep patterns within colonies of European honey bees (Apis mellifera L.). Honey bees face variables such as temperature and position of resources within their colony’s nest that may impact their sleep. We mapped sleep behavior and temperature of worker bees and produced maps of their nest’s comb contents as the colony grew and contents changed. By following marked bees, we discovered that individuals slept in many locations, but bees of different worker castes slept in different areas of the nest relative to position of the brood and surrounding temperature. Older worker bees generally slept outside cells, closer to the perimeter of the nest, in colder regions, and away from uncapped brood. Younger worker bees generally slept inside cells and closer to the center of the nest, and spent more time asleep than awake when surrounded by uncapped brood. The average surface temperature of sleeping foragers was lower than the surface temperature of their surroundings, offering a possible indicator of sleep for this caste. We propose mechanisms that could generate caste-dependent sleep patterns and discuss functional significance of these patterns. Citation: Klein BA, Stiegler M, Klein A, Tautz J (2014) Mapping Sleeping Bees within Their Nest: Spatial and Temporal Analysis of Worker Honey Bee Sleep. PLoS ONE 9(7): e102316. doi:10.1371/journal.pone.0102316 Editor: Wulfila Gronenberg, University of Arizona, United States of America Received April 19, 2014; Accepted June 17, 2014; Published July 16, 2014 Copyright: ß 2014 Klein et al. This is an open-access article distributed under the terms of the Creative Commons Attribution License, which permits unrestricted use, distribution, and reproduction in any medium, provided the original author and source are credited. Data Availability: The authors confirm that all data underlying the findings are fully available without restriction. All relevant data are within the paper and its Supporting Information files. Funding: BAK received the following funding: Doctoral Dissertation Improvement Grant #0710142, National Science Foundation (http://www.nsf.gov). Deutscher Akademischer Austausch Dienst #A0670415 (https://www.daad.org). Environmental Science Institute, The University of Texas at Austin (no number; http://www.esi.utexas.edu). Bienenforschung Wu ¨ rzburg e.V. (no number; http://www.bienenforschung.biozentrum.uni-wuerzburg.de/bienenforschung_ wuerzburg_ev/). The funders had no role in study design, data collection and analysis, decision to publish, or preparation of the manuscript. Competing Interests: The authors have declared that no competing interests exist. * Email: [email protected] Introduction Maps help to integrate data in ways that clarify patterns or relationships in the lives of organisms. Mapping social phenomena can reveal the spread of disease [1], routes of migration [2], foraging paths [3], organization with respect to division of labor [4] or brood sorting [5], spatial segregation of individuals within a colony [6], or spatial dynamics of competing colonies [7]. Social insect colonies, and honey bee (Apis mellifera L.) colonies in particular, lend themselves well to mapping of behavior. Honey bee activity has been visualized outside the nest with respect to flight paths [8,9], simulated flight paths relative to landmarks [10], and inside the nest for spatial organization of waggle dance information [11] and patterns generated by removal rates of comb contents [12]. Seeley [13] created maps depicting twelve of the most commonly performed tasks within a nest of honey bees. Conspicuously absent, however, are maps depicting where bees reside when not performing tasks. Sleep is a behavior that has never been mapped extensively across an invertebrate society, in spite of its potential ecological and evolutionary significance. Studies mapping sleep of invertebrates are limited to measurements of individual inactivity, usually within highly artificial settings (e.g., fruit fly stasis within test tubes, [14]). This is in contrast with the more extensive literature devoted to the study of vertebrate sleep sites, which has offered insight as to some functional implications of sleeping socially, especially with respect to vigilance and predator avoidance [15,16,17]. Sleep is defined behaviorally by a suite of characters [18,19,20] that have been identified in honey bees [21,22] (Fig. 1; see Materials & Methods for operational definition). Honey bee workers typically progress through a chronological sequence of task-based castes, beginning adulthood as cell cleaners [23,24,25], later tending brood and queen as nurse bees, then receiving and storing nectar as food storers [26], and ultimately serving as the colony’s foragers [13]. Because the different worker castes engage in tasks that have some spatial component, we hypothesized that bees belonging to different worker castes would sleep in different areas of the nest, depending in part on distance from the bustling brood comb. By sleeping while exposed to an incessantly working mass of siblings cleaning cells and tending the brood, bees could face frequent disturbance and sleep fragmentation. Following Kaiser’s [21] observations of unknown caste members sleeping near the perimeter of the comb and Klein et al’s [27] observations of a single forager over 24 h, we predicted that foragers sleep PLOS ONE | www.plosone.org 1 July 2014 | Volume 9 | Issue 7 | e102316
Transcript of Mapping sleeping bees within their nest: spatial and temporal analysis of worker honey bee sleep

Mapping Sleeping Bees within Their Nest: Spatial andTemporal Analysis of Worker Honey Bee SleepBarrett Anthony Klein1*, Martin Stiegler2, Arno Klein3, Jurgen Tautz2
1 The University of Wisconsin – La Crosse, Department of Biology, La Crosse, Wisconsin, United States of America, 2 University of Wurzburg, BEEgroup, Biozentrum,
Wurzburg, Germany, 3 Sage Bionetworks, Seattle, Washington, United States of America
Abstract
Patterns of behavior within societies have long been visualized and interpreted using maps. Mapping the occurrence ofsleep across individuals within a society could offer clues as to functional aspects of sleep. In spite of this, a detailed spatialanalysis of sleep has never been conducted on an invertebrate society. We introduce the concept of mapping sleep acrossan insect society, and provide an empirical example, mapping sleep patterns within colonies of European honey bees (Apismellifera L.). Honey bees face variables such as temperature and position of resources within their colony’s nest that mayimpact their sleep. We mapped sleep behavior and temperature of worker bees and produced maps of their nest’s combcontents as the colony grew and contents changed. By following marked bees, we discovered that individuals slept in manylocations, but bees of different worker castes slept in different areas of the nest relative to position of the brood andsurrounding temperature. Older worker bees generally slept outside cells, closer to the perimeter of the nest, in colderregions, and away from uncapped brood. Younger worker bees generally slept inside cells and closer to the center of thenest, and spent more time asleep than awake when surrounded by uncapped brood. The average surface temperature ofsleeping foragers was lower than the surface temperature of their surroundings, offering a possible indicator of sleep forthis caste. We propose mechanisms that could generate caste-dependent sleep patterns and discuss functional significanceof these patterns.
Citation: Klein BA, Stiegler M, Klein A, Tautz J (2014) Mapping Sleeping Bees within Their Nest: Spatial and Temporal Analysis of Worker Honey Bee Sleep. PLoSONE 9(7): e102316. doi:10.1371/journal.pone.0102316
Editor: Wulfila Gronenberg, University of Arizona, United States of America
Received April 19, 2014; Accepted June 17, 2014; Published July 16, 2014
Copyright: � 2014 Klein et al. This is an open-access article distributed under the terms of the Creative Commons Attribution License, which permitsunrestricted use, distribution, and reproduction in any medium, provided the original author and source are credited.
Data Availability: The authors confirm that all data underlying the findings are fully available without restriction. All relevant data are within the paper and itsSupporting Information files.
Funding: BAK received the following funding: Doctoral Dissertation Improvement Grant #0710142, National Science Foundation (http://www.nsf.gov).Deutscher Akademischer Austausch Dienst #A0670415 (https://www.daad.org). Environmental Science Institute, The University of Texas at Austin (no number;http://www.esi.utexas.edu). Bienenforschung Wurzburg e.V. (no number; http://www.bienenforschung.biozentrum.uni-wuerzburg.de/bienenforschung_wuerzburg_ev/). The funders had no role in study design, data collection and analysis, decision to publish, or preparation of the manuscript.
Competing Interests: The authors have declared that no competing interests exist.
* Email: [email protected]
Introduction
Maps help to integrate data in ways that clarify patterns or
relationships in the lives of organisms. Mapping social phenomena
can reveal the spread of disease [1], routes of migration [2],
foraging paths [3], organization with respect to division of labor
[4] or brood sorting [5], spatial segregation of individuals within a
colony [6], or spatial dynamics of competing colonies [7]. Social
insect colonies, and honey bee (Apis mellifera L.) colonies in
particular, lend themselves well to mapping of behavior. Honey
bee activity has been visualized outside the nest with respect to
flight paths [8,9], simulated flight paths relative to landmarks [10],
and inside the nest for spatial organization of waggle dance
information [11] and patterns generated by removal rates of comb
contents [12]. Seeley [13] created maps depicting twelve of the
most commonly performed tasks within a nest of honey bees.
Conspicuously absent, however, are maps depicting where bees
reside when not performing tasks. Sleep is a behavior that has never
been mapped extensively across an invertebrate society, in spite of
its potential ecological and evolutionary significance. Studies
mapping sleep of invertebrates are limited to measurements of
individual inactivity, usually within highly artificial settings (e.g.,
fruit fly stasis within test tubes, [14]). This is in contrast with the
more extensive literature devoted to the study of vertebrate sleep
sites, which has offered insight as to some functional implications
of sleeping socially, especially with respect to vigilance and
predator avoidance [15,16,17].
Sleep is defined behaviorally by a suite of characters [18,19,20]
that have been identified in honey bees [21,22] (Fig. 1; see
Materials & Methods for operational definition). Honey bee
workers typically progress through a chronological sequence of
task-based castes, beginning adulthood as cell cleaners [23,24,25],
later tending brood and queen as nurse bees, then receiving and
storing nectar as food storers [26], and ultimately serving as the
colony’s foragers [13]. Because the different worker castes engage
in tasks that have some spatial component, we hypothesized that
bees belonging to different worker castes would sleep in different
areas of the nest, depending in part on distance from the bustling
brood comb. By sleeping while exposed to an incessantly working
mass of siblings cleaning cells and tending the brood, bees could
face frequent disturbance and sleep fragmentation. Following
Kaiser’s [21] observations of unknown caste members sleeping
near the perimeter of the comb and Klein et al’s [27] observations
of a single forager over 24 h, we predicted that foragers sleep
PLOS ONE | www.plosone.org 1 July 2014 | Volume 9 | Issue 7 | e102316

closer to the perimeter of the comb and away from uncapped
brood cells (brood cells not yet capped by the juveniles’ older
sisters). In contrast, we predicted that younger castes sleep inside
cells within the brood comb area.
Investigating the spatial patterns of sleep in colonies of honey
bees could benefit from a visualization technique that distinguishes
sleeping from non-sleeping individuals. Honey bees of unknown
caste have been reported to sleep at ambient temperature at the
perimeter of their nest [21] or when resting inside cells [28], and
foragers have been reported to sleep within a certain range of
ambient temperatures when isolated [21,29,30] or in unreported
locations of the nest [30]. If honey bees of different worker castes
sleep in different areas of the nest, is temperature, alone or in
combination with nest landmarks, a good predictor for determin-
ing which honey bees are asleep? We hypothesized that
ontogenetic changes and caste-dependent demands of aging honey
bees would result in predictable thermal and sleep patterns across
a colony’s nest. We applied remote sensing thermography to map
caste-dependent sleep by individually marking newly eclosed
honey bees and recording their behaviors at different stages of
their adult lives. Our aim was to uncover caste-dependent sleep
patterns with respect to a bee’s location in the nest. We identified
spatial patterns among sleeping bees within their nest, and propose
a possible role of thermography in further mapping sleep behavior
in honey bees.
Materials & Methods
We studied the sleep behavior, location, and surface temper-
atures associated with Carniolan worker honey bees (A. mellifera
carnica Pollman, 1879) shortly after eclosion and during subsequent
periods of their adult lives as the bees changed castes. We observed
two colonies in separate years; differences between the studies of
Colony 1 (2006) and Colony 2 (2008) are noted throughout. First,
we installed a two-frame observation hive [31] in a temperature-
controlled room at the bee research facility of the University of
Wurzburg (Wurzburg, Germany, 49u469470N, 9u589310E), and
allowed the hive of bees unrestricted access to the outdoors, where
bees freely foraged during the day. We introduced 49 recently
eclosed, individually-marked worker bees to Colony 1 on 2 June
2006 and 49 to Colony 2 on 14 August 2008. The bees had been
extracted within hours of eclosing from a brood comb placed in a
35uC incubator (Colony 1), or had been extracted directly from six
different outdoor hives (Colony 2). We individually marked the
dorsal mesosoma (referred elsewhere as thorax), and dorsal and
ventral metasoma (referred elsewhere as abdomen) of the bees
using either model paints (Games Workshop, Nottingham, UK;
Colony 1) or oil-based markers (Sharpie, Oak Brook, IL, USA;
Colony 2). Neither marking method notably affected surface
temperature readings in preliminary tests. Further preparations for
surface temperature recordings included replacing the observation
hives’ glass windows with transparent polypropylene giftwrap (pbs-
factory, Artikel 00347, Rheinland-Pfalz, Germany) and adjusting
thermal camera settings (emissivity of honey bees 0.97–1.0,
transmissivity of polypropylene 0.89). The giftwrap produced a
nonlinear error when recording temperature as temperature
increased, so absolute temperature measurements reported in this
study have been adjusted. We calculated error by recording
thermal images of a bee corpse through giftwrap and again
without giftwrap, incrementally adjusting the bee’s temperature by
inserting a carbon film resistor within the body and controlling
voltage with a transformer.
String stretched across both sides of the hive created a grid that
was visible relative to the nest when thermally photographed. We
mounted a thermal camera (FLIR S40 for Colony 1, FLIR SC660
for Colony 2, FLIR Systems Inc., Boston, MA, USA; accuracy 6
1uC or 1% of reading) on an adjustable, rolling monopod. We
moved the camera from section to section of the grid and recorded
data for each marked bee. We lined the hive and feet of our
observation chair with dense foam to reduce substrate-borne
vibrations. We also eliminated all ambient light. The hives were
Figure 1. Infrared images of sleeping honey bees. (A) A sleepinghoney bee outside of a cell is relatively immobile, typically hangs in thedirection of gravity (in this case she hung horizontally, facing right), anddiscontinuously ventilates, pumping her abdomen (metasoma) in theanterior-posterior direction. This bee was exhibiting deep sleep, withextended bouts of antennal immobility. (B) Sleeping bees are affectedby surrounding temperature, as with the bee on the perimeter of thehot brood comb (upper right) and the inverted bee, hanging (lower left)on the plastic window a short distance from the brood comb. Forcomparison, note the mobile bee at lower right with the relatively hotthorax (arrowhead). (C) Bees also slept inside cells, primarily when theywere young adults. Here, framed by the bracket, is the abdomen of asleeping bee slightly protruding from a cell (leg of neighboring beeresting on the distal tip of her abdomen), distinguished as sleeping byher discontinuous ventilatory movements. Temperatures of beessleeping inside cells were not recorded. B.A.K. took all images withFLIR thermal cameras on non-experiment days under different ambienttemperature conditions; uC temperature scale only relevant for (B), andvalues were adjusted for thermal camera settings (see Materials andMethods).doi:10.1371/journal.pone.0102316.g001
Mapping Sleeping Honey Bees within Their Nest
PLOS ONE | www.plosone.org 2 July 2014 | Volume 9 | Issue 7 | e102316

perpetually lit on each side with a desk lamp (Colony 1: 25 W,
230 V; Colony 2: Megaman, Compact 2000HPF 30 W, 4000 K)
covered with red acetate filters (Colony 2: #27 Medium Red,
transparency = 4%, peak at 670 nm, Supergel by Rosco, Stam-
ford, CT, USA). Closer examination of behaviors was facilitated
with a headlamp, also covered with the same red filter, selected
because honey bees are reported to be less sensitive to frequencies
beyond 600 nm [32] or 650 nm [33]. Although a preliminary test
showed that bees could detect the filtered light sources, their
behavior did not noticeably change if the bees were exposed to
gradual changes in light intensity.
ObservationsFifteen hours and 20 h after we collected bees for Colony 1 and
2 (3 h and 8.5 h after introduction into the hive, respectively), the
bees were integrated into the colony, with no signs of aggression by
other bees and no abnormal grooming. B.A.K. and M.S.
systematically scanned for marked bees one section of the nest at
a time, surveying bees every hour. As cell cleaners aged and
became foragers, we recorded data for 24 consecutive hours
during each of these two caste periods for Colony 1 (2 and 24 June
2006). As cell cleaners aged and became nurse bees, then food
storers, we recorded data for 6 daytime hours and 6 nighttime
hours during each of these three caste periods for Colony 2 (1000–
1600 h and 2200–0400 h; 15, 18, and 26 August 2008). We began
monitoring cell cleaners on the 1st day after they eclosed, nurse
bees on the 4th day, food storers on the 12th day and foragers on
the 23rd day (Fig. S1). We selected dates based on typical age-
related caste determination in workers [34,35].
We recorded thermal images of marked bees by pointing at
each bee with soft forceps (marked with a pointer on one end to
distinguish orientation of the head) as the thermal camera
automatically recorded images every second. We verbally record-
ed each bee’s behavior and identity (Olympus VN-4100PC Digital
Voice Recorder, or audio track of Sony Handycam DCR-HC65,
Tokyo, Japan), and confirmed identity of bees with a dim,
handheld LED light. Due to temporary camera malfunction, we
were unable to report data for nurse bees or food storers in Colony
1. To supplement the declining number of marked workers as
Colony 1’s bees became foragers, we captured and marked ten
additional foragers of unknown age returning to the entrance of
the hive.
We transcribed bee caste, individual identity, and behavior data
from voice-recorded notes. Behavior included different sleep
states, distinguished from wakeful activity by a bee’s relaxed
immobility and discontinuously ventilating abdomen. We exam-
ined each bee for 3–5 sec to determine her behavior. If she was
potentially asleep inside or outside a cell we examined her for
discontinuous ventilation, marked by a minimum of ten seconds
without visible anterior-posterior abdominal pumping motions.
Our ten-second pause between abdominal pumping bouts was
based on measurements of honey bees inside cells made by
Kleinhenz et al. [28], which appear to be shorter than the average
respiratory pause measured by Kovac et al. [36] in isolated bees in
metabolic chambers. If outside a cell, we reported antennae as
immobile (deep sleep), or exhibiting swaying motions or minute
twitches (light sleep) [27,37,38]. Reduced antennal mobility
correlates with higher response thresholds, and antennal immo-
bility for extended periods may be suggestive of a deeper sleep
state [21].
We transcribed a bee’s location, or calculated it from thermal
images. Infrared images were relayed to a computer and analyzed
using camera-specific software (FLIR Systems ThermaCAM
Researcher Professional software version 2.9). We recorded the
average surface temperature of a bee’s thorax (Tth) and the
average surface temperature of her surroundings (Tsurr), taken as
the average temperature within a circle with the radius of one bee
body length (Fig. 2). We report the difference of the two to indicate
the temperature of the bee relative to the surface temperature of
her surroundings (Tdiff). Tsurr included the surface temperature of
wax comb with a range of contents, wood from the hive frames, or
bees; when calculating Tsurr, we did not exclude the area in which
the examined bee appears. We also mapped the contents of comb
cells for Colony 1 within 24 h of each census (5 and 25 June 2006)
so that we could analyze bee behavior and temperature with
respect to placement in the nest, particularly with respect to
uncapped brood. We manually labeled cell contents on hive
windows, removed and scanned these windows, and colored the
discreet comb contents with different colors in Adobe Photoshop
v.7.0 (Adobe Systems, San Jose, CA, USA).
Over the course of the study, Colony 1 grew from 1500 to 2800
individuals. Colony 2 housed about 2000 bees, and apparently
lacked brood. Room air temperature varied moderately during
study recording sessions (2006: 25.9uC, range = 24.7–26.6uC;
2008: 28.2uC, range = 24.6–28.4uC). The sun rose ca. 0510–
0554 h and set ca. 2045–2130 h (CEST). For purposes of this
study, daytime is defined as 0600–2200 h and nighttime as 2200–
0600 h (CEST) to approximate ambient light (sunrise to sunset)
conditions. No bees were observed to prematurely forage and by
Figure 2. Collection of temperature data from a sequence ofinfrared images. The forceps were held open to encompass the heat-generating thorax of the bee (top) and camera software computed theaverage temperature within the selected region, represented by a circlein the inset image. For recording the surface temperature surrounding abee (Tsurr), forceps were removed (bottom) so as not to influence themeasurement, taken as the average temperature within the larger circle(radius = bee body length). Tdiff is the difference of the averagetemperature within the large circle (Tsurr) from the average temperaturein the smaller circle (Tth). Temperature scale values (uC) were adjustedfor thermal camera settings.doi:10.1371/journal.pone.0102316.g002
Mapping Sleeping Honey Bees within Their Nest
PLOS ONE | www.plosone.org 3 July 2014 | Volume 9 | Issue 7 | e102316
observing cell contents, we confirmed caste identity of several
nurse bees and food storers.
AnalysisAll analyses are based on a total of 84 h of audio data and 78 h
of thermal data (cell cleaners: 32 h, nurse bees: 12 h, food storers:
10 h, foragers: 24 h). Data include bee identity, behavior, position
relative to the nest’s perimeter (x, y coordinates), cell contents
below bee, Tth, and Tsurr (Raw Data S1). Analyses computing
placement in the nest were conducted using Python (version 2.6,
http://www.python.org). Results from tests using continuous
response variables and behavior as a categorical, independent
variable are products of linear mixed-effects models, programmed
in R [39], with bee group (caste), Tsurr, Tdiff, and position in the
nest as fixed effects, and individual bee identity as a random factor
(i.e., observations were nested within bee; Models S1). Linear
mixed-effects models were fit using the lmer function in the lme4
package [40]. We used the multcomp package to perform
likelihood-ratio tests to distinguish between competing models
[41]; because of the complicated and unbalanced nature of the
data (e.g. missing data, correlated covariates), we could not run
standard likelihood-ratio tests [42]. We performed binary logistic
regression using R, with Tsurr as continuous predictor and
behavior as the dependent variable. Means 6 standard error
means (s.e.m.) reported throughout the text and figure legends
were calculated from averaged values, one value per bee. We set
alpha at 0.05 and report two-tailed P-values for all tests.
Results
Honey bees belonging to all worker castes exhibited sleep (see
Materials & Methods for operational definition). Cell cleaners slept
inside cells, while each subsequent age caste slept less and less
inside cells, with foragers having slept exclusively outside of cells
(Table 1). Individual bees slept in many different areas over the
course of a 24-h period (Fig. 3), but different worker castes
consistently slept in different areas of the nest relative to position of
brood comb and surrounding temperature, Tsurr (see below). The
only caste to clearly exhibit day-night periodicity with regard to
their sleep was the foraging caste, with more total sleep at night
(z = 26.05, P,0.00001; Fig. 4) and more deep sleep at night than
during the day (z = 22.32, P = 0.038; n = 199 observations, 32
bees).
Sleep and proximity to the perimeter of nestOur first objective was to calculate a bee’s position relative to
the perimeter of the comb and correlate this distance to a bee’s
behavior. Worker bees could position themselves anywhere
between the perimeter of the comb (0 cm) and the center of the
comb (22.25 cm from the nearest edge), the center being where
brood are typically tended.
When worker bees slept inside cells, they tended to be at the
same distance from the perimeter as when awake (e.g., Colony 2
cell cleaners: z = 1.41, P = 0.20, n = 158 observations of 44 bees),
although cell cleaners in Colony 1 may have been slightly closer to
the perimeter when asleep than when awake (z = 2.10, P = 0.050,
n = 413 observations, 47 bees) (Fig. 5, S2).
When worker bees slept outside of comb cells, they tended to do
so closer to the perimeter of the nest than when awake or sleeping
inside cells (Fig. 5). Nurse bees exhibited light sleep at the same
distance from the perimeter of the nest as when they were awake
or sleeping inside cells, but they exhibited deep sleep when they
were closer to the perimeter of the nest (z = 3.94, P = 0.0001;
n = 469 observations, 47 bees) (Fig. 5, S2), and when nurse bees
became food storers, both light and deep sleep were exhibited
closer to the perimeter than when they were awake or sleeping
Figure 3. Sleep positions of individual foragers with respect totemperatures Tth and Tsurr. Unique shapes (including uniquelyoriented shapes) distinguish different foragers (e.g., every trianglefacing down represents data from one individual at different times,while every triangle facing up represents data from a differentindividual, squares = a third individual, etc.). Shapes represent Tth
(inner shape) and Tsurr (outer shape) for each observation of a marked,sleeping forager over 24 h on the entrance side of the hive (she mayhave also slept on the reverse side of the hive, as pictured in Fig. S3).Temperatures (uC) correspond with the color scale (white = no data,represented by diamond at lower left). Hive entrance/exit is indicatedby arrowhead, and was restricted to one side of the hive. All relevantforager data are included in graph (n = 11 bees), but we treated forageras a random factor in mixed effects analyses to statistically cope withrepeated measures of individuals. See Figs. S2 and S3 for differencesacross behaviors and worker castes.doi:10.1371/journal.pone.0102316.g003
Figure 4. Proportion of observations bees of different workercastes were asleep during the day and night. Younger castesslept with no distinction between day and night. The clearest statisticaldistinction (signified with an asterisk, applying a linear mixed-effectsmodel) appeared in foragers, with more time spent asleep during thenight.doi:10.1371/journal.pone.0102316.g004
Mapping Sleeping Honey Bees within Their Nest
PLOS ONE | www.plosone.org 4 July 2014 | Volume 9 | Issue 7 | e102316

inside cells (z = 4.43, P,0.00001; n = 332 observations, 43 bees)
(Fig. 5, S3). Unexpectedly, foragers were not closer to the nest’s
perimeter when asleep than when awake. See possible explana-
tions for this in the Discussion. Food storers and foragers spent
more time both asleep and awake closer to the perimeter of the
nest than younger castes (asleep: F3,158 = 27.87, P,0.0001; awake:
F3,204 = 19.77, P,0.0001, ANOVA of pooled data), but no caste
spent time closer to the perimeter with respect to day vs. night.
Sleep position relative to surrounding temperatureTemperatures, particularly away from brood comb, fluctuate in
regions of the nest, so we investigated the thermal position of bees
with respect to day vs. night, as well as with regard to behavior.
Our objective was to determine if differing thermal environments
within the nest could serve as a predictor of a bee’s behavior. We
performed a binary logistic regression analysis to test the
probability of predicting a bee’s behavior by her Tsurr.
When cell cleaners and nurse bees were asleep inside cells, they
were in warmer regions of the nest than when they were awake
(cell cleaners: 34.960.1uC vs. 34.360.1uC, n = 68 & 189,
respectively; z = 22.89, P = 0.004). Nurse bees occasionally slept
outside cells, and did so in regions not significantly thermally
different from the regions they were in when awake (inside:
33.460.4uC, outside: 32.260.5uC vs. awake: 32.560.1uC, n = 51
& 115). The regions in which food storers slept were colder than
the regions in which they were awake (asleep 31.660.2uC vs.
awake 32.260.1uC, n = 31 & 63; z = 2.82, P = 0.005), but only
when sleeping outside cells (31.560.2uC), not when sleeping inside
cells (31.860.3uC). Likewise, the regions in which foragers slept
(always outside cells) were colder than the regions in which
Ta
ble
1.
Pe
rce
nt
and
tota
ln
um
be
ro
fo
bse
rvat
ion
sh
on
ey
be
es
of
dif
fere
nt
wo
rke
rca
ste
se
ng
age
din
wak
efu
lne
ssan
dsl
ee
p.
Wo
rke
rca
ste
s
Be
ha
vio
rC
ell
cle
an
ers
( n=
95
be
es)
Nu
rse
be
es
(n=
47
be
es)
Fo
od
sto
rers
(n=
43
be
es)
Fo
rag
ers
(n=
32
be
es)
Lig
ht
sle
ep
0.0
%0
6.4
%3
28
.6%
31
12
.0%
24
De
ep
sle
ep
0.1
%1
6.8
%3
42
3.9
%8
61
4.6
%2
9
Sle
ep
insi
de
cells
21
.9%
19
61
9.5
%9
77
.5%
27
0.0
%0
To
tal
sle
ep
22
.0%
19
73
2.7
%1
63
40
.0%
14
42
6.6
%5
3
Aw
ake
78
.0%
69
76
7.3
%3
35
60
.0%
21
67
3.4
%1
46
To
tal
10
0%
89
41
00
%4
98
10
0%
36
01
00
%1
99
Pe
rce
nt
of
sle
ep
insi
de
cells
de
cre
ase
dw
ith
age
and
cast
e(9
9.5
%o
fsl
ee
pfo
rce
llcl
ean
ers
,59
.5%
for
nu
rse
be
es,
18
.8%
for
foo
dst
ore
rs,a
nd
0%
for
fora
ge
rs;n
um
be
rsin
tab
lere
pre
sen
tp
erc
en
to
fto
talo
bse
rvat
ion
s,in
clu
din
gw
he
nb
ee
sw
ere
awak
e).
All
ob
serv
atio
ns
for
eac
hb
ee
are
incl
ud
ed
.d
oi:1
0.1
37
1/j
ou
rnal
.po
ne
.01
02
31
6.t
00
1
Figure 5. Distance from the nest’s perimeter with respect tobehavior and caste. Younger castes (cell cleaners and nurse bees)slept closer to the center of the nest (i.e., farther from the perimeter)than older castes (food storers and foragers). Bees slept outside cellscloser to the perimeter of the nest than when they slept inside cells orwere awake, except in the case of foragers, who were active during theday near the nest entrance. Cell cleaners did not sleep outside cells andforagers did not sleep inside cells, hence the absence of relevant bars.These data represent averages for castes calculated from average valuesper bee (6 s.e.m.). Asterisks signify statistically significant differenceswithin castes.doi:10.1371/journal.pone.0102316.g005
Mapping Sleeping Honey Bees within Their Nest
PLOS ONE | www.plosone.org 5 July 2014 | Volume 9 | Issue 7 | e102316

foragers were awake (asleep 33.960.2uC vs. awake 35.160.1uC,
n = 53 & 145; z = 5.03, P,0.00001) (Fig. 6).
Applying the same binary logistic regression analysis, we
examined Tsurr’s ability to predict if a bee was observed during
the day or night. Cell cleaners and nurse bees spent more time
with warmer surroundings during the night than during the day
(cell cleaners: 34.860.1uC vs. day 33.960.2uC, z = 4.47, P,
0.00001; nurse bees: 33.060.2uC vs. day 29.460.5uC, z = 4.80,
P,0.00001). Food storers, however, did not spend more time in
colder or warmer regions of the nest (31.960.2uC vs. day
32.160.1uC, z = 20.95, P = 0.34) and foragers spent more time
in colder regions of the nest at night than during the day
(34.060.1uC vs. 35.360.1uC, n = 77 & 121; z = 25.72, P,
0.00001).
Sleep temperatureWe recorded the average temperature of the dorsal surface of a
bee’s thorax (Tth) and took the difference of Tsurr from Tth as a
measure of a bee’s temperature relative to her surroundings (Tdiff)
to test if variation in Tth or Tdiff is explained by a bee’s behavior.
All data were extracted from bees when they were exposed (i.e.,
not inside cells).
Food storers were colder when in deep sleep than when awake
(31.660.2uC vs. 32.360.1uC; deep: z = 23.22, P = 0.004; light:
z = 22.25, P = 0.070; n = 83 observations, 36 bees). Likewise,
foragers were colder when in either light sleep (33.060.28uC,
z = 26.55, P,0.00001) or deep sleep than when awake
(33.460.1uC vs. 35.060.1uC, z = 25.55, P,0.00001, n = 199
observations, 32 bees). But in nurse bees, Tth did not differ
between light and deep sleep than when awake (z = 20.73 & 0.30,
P = 0.84 & 0.99, light & deep sleep, respectively; n = 133
observations, 42 bees) (Fig. 7A).
Day and night had an effect on some of the bees’ Tth. Nurse
bees were warmer at night than during the day (32.860.2uC vs.
29.760.5uC, z = 5.89, P,0.00001; n = 133 obs., 42 bees). Food
storers’ Tth did not differ between day and night (32.260.1uC vs.
31.960.2uC, z = 21.36, P = 0.29; n = 83 obs., 36 bees) (Fig. 7B).
Foragers were colder at night than during the day (33.660.1uC vs.
35.160.1uC, z = 28.08, P,0.00001; n = 199 obs., 32 bees). Day
or night, foragers were colder (i.e., Tth was lower) when asleep
than when awake (day: z = 4.87, P,0.00001, n = 121 obs., 27 bees;
night: z = 3.54, P = 0.0008, n = 78 obs., 24 bees), and this colder
sleeping temperature did not significantly differ between day and
night (z = 21.58, P = 0.19; n = 53 obs., 16 bees). Sleeping food
storers also showed no difference between day and night (z = 0.50,
P = 0.81; n = 22 obs., 18 bees). In contrast, sleeping nurse bees
were colder during the day than at night (z = 2.39, P = 0.023;
n = 22 obs., 9 bees) (Fig. 8).
The only caste for which Tdiff differed between sleeping and
awake bees was the foragers. A sleeping forager’s Tdiff was more
pronounced than an awake forager’s (20.6660.06uC vs. 2
0.1660.06uC, z = 24.08, P,0.001; n = 198 obs., 32 bees),
particularly during deep sleep (20.7460.07uC) (Fig. 7C). Exam-
ples of Tdiff in which Tth , Tsurr are visible in Figs. 3 and S3.
All bees outside of cells were colder when situated closer to the
perimeter of the nest, although foragers were colder specifically
at night when closer to the perimeter of the nest (T,day/
night*proximity to perimeter; z = 2.79, P = 0.017; n = 199 obser-
vations, 32 bees). We could not examine sleep by cell cleaners with
respect to their Tth or Tdiff because cell cleaners slept inside cells,
but awake cell cleaners’ Tth and Tdiff did not differ day vs. night
(Fig. 8).
Figure 6. Surface temperature surrounding foragers as a continuous predictor of foragers’ behavior. When Tsurr was lower, foragerstended to be asleep; when Tsurr was higher, foragers tended to be awake. Temperatures represent bins of +/20.25uC (e.g., 29.75uC = 29.50–29.99uC;the unlabeled 30.25uC = 30.00–30.49uC). All data were collected from foragers outside cells. Food storers also exhibited lower Tsurr when asleep thanwhen awake.doi:10.1371/journal.pone.0102316.g006
Mapping Sleeping Honey Bees within Their Nest
PLOS ONE | www.plosone.org 6 July 2014 | Volume 9 | Issue 7 | e102316

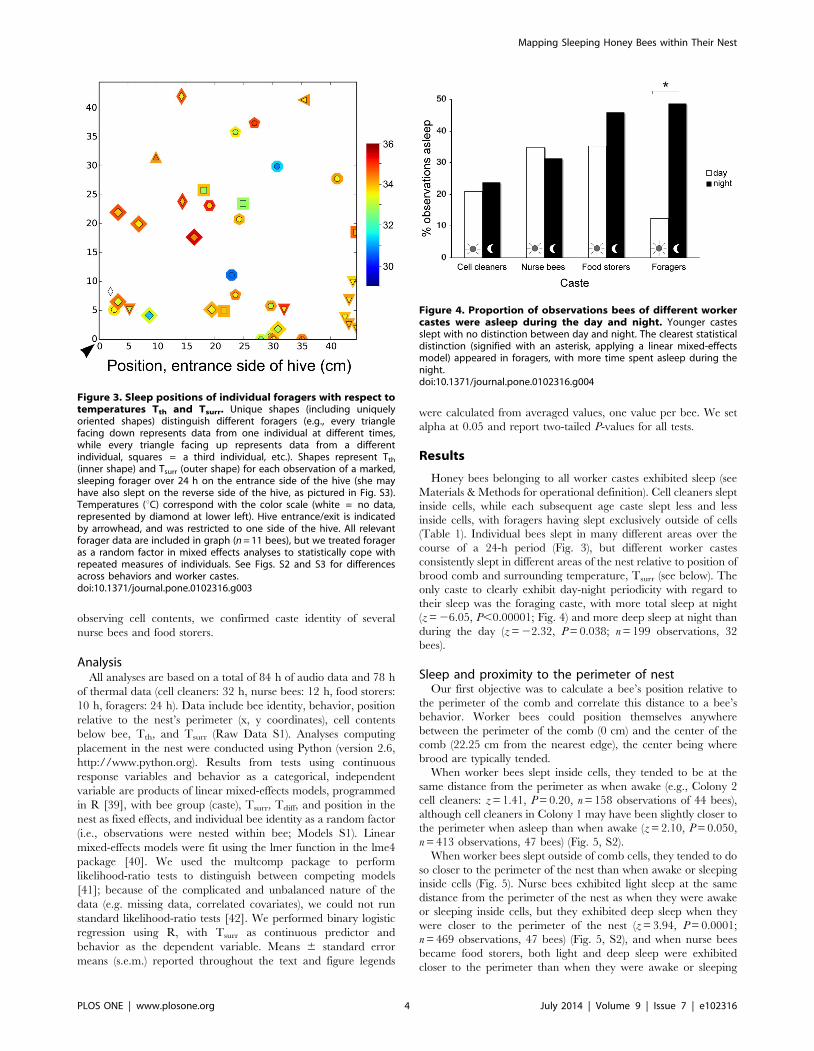
Sleep relative to position of brood combCell cleaners were more likely to be asleep than awake as the
proportion of cells in their vicinity increasingly consisted of
uncapped brood (surrounded by 32.2760.03% vs. 22.5660.03%
uncapped brood, t83 = 2.14, P = 0.036; with trend in mixed effects
model: z = 21.79, P = 0.074; n = 413 observations, 47 bees from
Colony 1). After cell cleaners eventually developed into foragers,
they were more likely to be awake than engaged in deep sleep as
the proportion of cells in their vicinity increasingly consisted of
uncapped brood (surrounded by 43.1160.05% vs. 23.9660.08%
uncapped brood, z = 2.45, P = 0.027; n = 199 observations, 32
bees) (Fig. 9). We did not record cell contents for nurse bee and
food storer stages.
Discussion
Our objective was to describe caste-dependent sleep patterns in
a honey bee colony, to produce ‘‘sleep maps’’ that reveal these
patterns, and to discuss the patterns’ functional significance. Sleep-
site fidelity did not occur in individuals, contrary to what Clark
and Gillingham [43] reported in anole lizards. However, spatial
sleep patterns did occur among worker castes. The youngest
workers (cell cleaners) were more often asleep than awake when
surrounded by uncapped brood, while the opposite was true in the
eldest workers (foragers) (Fig. 9). Workers slept less and less inside
cells as they aged. Bees asleep inside cells were at the same distance
from the perimeter of the nest as bees that were awake, while bees
that slept outside cells did so closer to the perimeter of the nest
than bees awake or asleep inside cells. Foragers appeared to sleep,
and especially to exhibit deep sleep, on the periphery of the nest
(Fig. S3), but two behaviors confounded this result: activity near
the hive entrance (causing many awake bees to be near the
perimeter), and sleep on wood frames running through the center
of the nest. A two-frame observation hive is composed of one
frame sitting above a second frame, creating an artificial break in
the comb running through the center of the nest. Some bees were
found sleeping on these centrally-located wood frames. Were
proximity to the nest perimeter to be used to predict worker sleep
in the future, forager activity near the hive entrance should be
accounted for and all nest areas without comb (i.e., frames) should
be treated as perimeters.
Why do honey bees sleep inside cells, why does this differ
temporally among castes, and why is there a spatial distinction
between sleep inside and outside cells within the same caste of
bees? Sleep outside cells exposes bees to the arousing interactions
of wakeful, mobile siblings ([27], supplementary video) and the
greater density of bees found in the brood comb area could mean
more frequent arousals and more fragmented sleep. By sleeping
closer to the perimeter of the nest, exposed bees may increase their
sleep. Consistent with this hypothesis, Klein et al. [27] reported
increasing durations of uninterrupted sleep outside cells as bees
aged/changed castes. Sleep inside cells may constitute an adaptive
response to avoiding sleep fragmentation within the busy brood
comb area. Younger bees slept more frequently inside cells than
older bees and this could be the result of differential cell vacancy
Figure 7. Average thoracic surface temperature of workerhoney bees (Tth) with regard to caste, behavior, day vs. night,or Tsurr. All measurements were taken from worker bees outside ofcells; cell cleaners slept exclusively inside cells, so are excluded. Datarepresent averages for castes (6 s.e.m.). Asterisks signify statisticallysignificant differences within castes. (A) Average thoracic surfacetemperature of bees (Tth) awake vs. asleep, (B) day vs. night, and (C)awake vs. asleep relative to surrounding surface temperatures (Tdiff).doi:10.1371/journal.pone.0102316.g007
Mapping Sleeping Honey Bees within Their Nest
PLOS ONE | www.plosone.org 7 July 2014 | Volume 9 | Issue 7 | e102316

rates, with empty cells less frequently available in the brood comb,
and more readily inhabited by bees already working in the brood
comb area and within actual comb cells. Older bees may sleep less
(food storers) or not at all (foragers) inside cells closer to the
perimeter of the nest because they do not face the same degree of
disturbance as they would if exposed in the brood comb. Sleep
away from the brood comb may be a result of either learned or
instinctual avoidance, or simple displacement due to repeated
disturbance in the brood comb.
The temperature of a bee, of her surroundings, and the
difference between the two appear to correlate with sleep
behavior, offering specific opportunities for using temperature
when identifying sleep across a colony of bees. We tested the
probability of predicting a worker bee’s behavior by her Tsurr and
found that sleep inside cells occurred either in areas as warm as
when the bees were awake (nurse bees and food storers) or even
warmer areas than when awake (cell cleaners). Sleep outside of
cells occurred in colder regions than when awake (food storers and
foragers), except in our small sample involving nurse bees. A bee
can impact Tsurr, as best demonstrated by the actions of heater
bees [28,44]. A resting bee can be weakly endothermic [36],
although when not heating, the effect of a bee’s body on Tsurr is
less dramatic, or insignificant (Fig. 1A–C). It is worth noting that
surrounding surface temperature can differ from ambient temper-
ature experienced by a bee. This may account for the difference
between our measure of Tsurr encircling the average sleeping
forager (33.860.2uC) and the preferred ambient temperature
of sleep, as reported by Kaiser et al. [29] in isolated foragers
Figure 8. Average thoracic surface temperature of honey bee workers (Tth) over the course of 24 h with respect to caste andbehavior. An observation of an awake bee is represented by o with dashed lines fitting the data; an observation of a sleeping bee is represented byx with solid lines fitting the data. Gray backdrop represents nighttime and colors correspond with the temperature scale on y-axes and with Figs. 3,S2, and S3. Average Tth is reported per bee per census period and, although all bee data are included in these graphs, we treated bee as a randomfactor in mixed effects analyses. All measures were taken from bees outside of cells; no data exist for cell cleaners sleeping outside cells, hence theabsence of x in the cell cleaner graph.doi:10.1371/journal.pone.0102316.g008
Mapping Sleeping Honey Bees within Their Nest
PLOS ONE | www.plosone.org 8 July 2014 | Volume 9 | Issue 7 | e102316
(23–26uC, with extremes of 21 and 29uC) and Schmolz et al. [30]
in isolated foragers (28uC, range: 26–29uC) and foragers within a
nest (27.9uC, range: 23.8–30.8uC), or of worker Bombus atratus
bumblebees [45]. On the other hand, our average measure of a
forager’s Tth during deep sleep (33.460.2uC) was congruent with
measurements of resting bees inside cells (32.760.1–33.460.3uC)
[28], and our lowest Tsurr recordings are commonplace inside
nests away from the brood area [21,46].
We tested if Tth or Tdiff is explained by a bee’s behavior. Tth is
lower when food storers and foragers are asleep than when they
are awake and this lower Tth is statistically indistinguishable
between day and night (Fig. 8). A relatively static lower sleeping
temperature for the older castes is a consequence of sleeping closer
to the colder periphery of the nest, although this correlation was
confounded in foragers by their activity near the nest entrance. Tth
of sleeping nurse bees did not differ from their wakeful Tth due
either to insufficient sample size of nurse bees sleeping outside
cells, or because sleep bouts are shorter in nurse bees than in older
workers [27], not allowing for Tth to significantly decrease. Cell
cleaners’ Tth did not vary significantly when awake, likely due to
the consistent warmth of the brood comb area within which cell
cleaners in Colony 1 worked.
Brood comb is warmer and the bees are typically more active
than in other regions of the nest, setting the stage for brood comb
location to impact sleep positioning. We found the proportion of
uncapped brood comb in the vicinity of cell cleaners and foragers
correlated with behavior: cell cleaners in Colony 1 (Colony 2 had
no brood) tended to be asleep more often and foragers less often
when surrounded by uncapped brood. Brood comb is often
centrally located, but can vary across observation hives
(Fig. 10A,B), and the organization of brood comb and of thermal
microclimates in an observation hive will differ from that of the
three-dimensional hive box [47,48] or architecture of a feral
colony’s nest. Observation hives are typically two-sided, but they
are not as three-dimensional as natural nests, which consist of a
series of parallel combs (Fig. 10C). Recording undisturbed
behavior between the parallel combs of a more naturalistic hive
(e.g., www.hobos.de), would be necessary to establish any
similarities or differences between what we observed in observa-
tion hives and what may be occurring in more natural, three-
dimensional nests.
Caste-dependent sleep patterns may be the consequence of
selection pressures for sleeping in warmer or cooler areas. For
example, honey bees may experience a trade-off between the
benefits of warmth and obtaining unfragmented sleep, with more
heat lost when alone [49]. By sleeping in colder areas, food storers
and foragers may conserve energy, and by sleeping in warmer
areas, cell cleaners may increase neural development or facilitate
consolidation of memories. Schmolz et al. [30] reported that
foragers sleep ectothermically and hypothesized that foragers
select cool, but not maximally cool regions to sleep for the purpose
of conserving energy while still promoting regenerative processes
during sleep. Stabentheiner et al. [50] reported that ectothermy is
most common in the youngest bees (0 to ,2 d) and proposed that
visitation to warm cells within the brood comb serves to increase
flight muscle development. Additional explanations could include
reduction of pathogen spread by segregation of sleeping castes, or
an increased protection of younger, less expendable bees at the
center of the nest. Alternatively, an awake bee may simply fall
asleep without changing her location, or change location due to
non-sleep-related reasons.
Figure 9. Caste-dependent maps of behavior with regard to comb cell contents. Cell cleaners (Colony 1 pictured) were awake (o) andasleep (inside cells; triangles) primarily in the brood comb area, spending more time asleep than awake with uncapped brood in their midst. Foragers,on the other hand, spent more time awake (o) than asleep (x = deep sleep, + = light sleep) near uncapped brood comb. White = uncapped brood,red = capped brood, yellow = pollen cells, blue = uncapped nectar, green = capped honey, brown = empty comb, gray = no comb. Nestentrance/exit is indicated by an arrowhead, and was restricted to one side of the nest.doi:10.1371/journal.pone.0102316.g009
Mapping Sleeping Honey Bees within Their Nest
PLOS ONE | www.plosone.org 9 July 2014 | Volume 9 | Issue 7 | e102316

The observed caste-dependent patterns of sleep were consistent
with previous studies of honey bees, including sleep inside and
outside of cells [27], day-night periodicity of sleep in foragers
[21,27,51] and the absence of periodicity in the younger castes
(cell cleaners and nurse bees) [27,52,53,54]. Food storers did not
exhibit day-night periodicity in this study, but have previously
been reported to exhibit either circadian sleep [27] or, in the case
of a single subject, ultradian periodicity (12 h sleep-wake cycles)
[52]. Future investigations, including testing our predictions to
map spatial and temporal sleep behavior in colonies of honey bees,
may add insight about functional attributes of sleep in a social
setting.
Supporting Information
Figure S1 Timeline of data collection (black bars ontimelines) for both Colony 1 and Colony 2. We scheduled
census times to fall within periods distinguishing the age-based
worker castes. The beginning of the timeline represents eclosion,
or the start of adulthood.
(TIF)
Figure S2 Position of cell cleaners and nurse bees withrespect to behavior and temperatures Tth and Tsurr.Concentric circles represent Tth (inner circle) and Tsurr (outer halo)
for each honey bee observation. Temperatures (uC) correspond
with the color scale at lower right (white = no data). Hive
entrance/exit is indicated by an arrowhead, and was restricted to
one side of the hive. All bee data are included in these graphs, but
we treated bee as a random factor in mixed effects analyses to
statistically cope with repeated measures of individual bees. Note
that cell cleaners slept exclusively inside cells, so no Tth data were
available for sleeping bees.
(TIF)
Figure S3 Position of food storers and foragers withrespect to behavior and temperatures Tth and Tsurr.Concentric circles represent Tth (inner circle) and Tsurr (outer halo)
for each honey bee observation. Temperatures (uC) correspond
with the color scale at lower left (white = no data). Hive entrance/
exit is indicated by an arrowhead, and was restricted to one side of
the hive. All bee data are included in these graphs, but we treated
bee as a random factor in mixed effects analyses to statistically
cope with repeated measures of individual bees. Note that foragers
exhibited wakeful activity near hive entrance, which eliminated
average wake-sleep differences in distance from the nest perimeter.
For a more focused look at the changing sleep sites of foragers, see
Fig. 3.
(TIF)
Raw Data S1 Raw data, used for analyses in R. Caste: c
= cell cleaner, n = nurse bee, fs = food storer, f = forager.
Newforager: yes = forager added to supplement dwindling sample
of foragers in Colony 1; this category was not used in analyses.
d_n: d = day, n = night. Behav = a more specific set of
behavioral categories than Beh. cm_edge = position of bee, in cm
from edge of hive. UnderColor = the color of the hive map on
which the bee is positioned (e.g., white signifies the region of the
comb in which cells contain uncapped brood).
(CSV)
Models S1 Models used in statistical analyses. Models
are written for analysis in R.
(R)
Acknowledgments
We thank the University of Wurzburg and all members of the BEEgroup
for facilitating our research. Dirk Ahrens-Lagast was instrumental as our
skilled and creative beekeeper. Hartmut Vierle, Sven Mayer, Rebecca
Figure 10. Infrared images revealing thermal activity acrossbeehives. (A) Sequence of colony-scale changes across the entranceside of Colony 1. In clockwise order from the upper left corner, 1700,0400, 0900 and 1500 h, respectively. Entrance/exit is in the lower leftcorner of the hive, leading out tube at left of each image. Brood comb ismost easily seen as the glowing warm area at 0400 h. (B) Observationhive containing Colony 2, with filter-covered lamp at upper right, andbees visibly exiting hive tunnel at lower right. (C) Exposed nestcomposed of parallel sheets of comb, set up by Dirk Ahrens-Lagast toinduce bees to construct a more natural nest architecture; not used instudy. B.A.K. took all images with FLIR thermal cameras on non-experiment days under different ambient temperature conditions.Temperature scale values (uC) were adjusted for thermal camerasettings (see Materials and Methods).doi:10.1371/journal.pone.0102316.g010
Mapping Sleeping Honey Bees within Their Nest
PLOS ONE | www.plosone.org 10 July 2014 | Volume 9 | Issue 7 | e102316

Basile, Marco Kleinhenz, and Christian Lutsch offered assistance and
guidance, and Walter Kaiser paid a special visit to discuss our research.
Uma Bhat, Kathryn Busby, Clairissa Dewstow and Laura Still helped
transcribe data. Melissa Bingham of the Statistical Consulting Center at
UW–La Crosse, Samuel Scarpino, and Sabrina Amador-Vargas assisted
with statistical advice, however any errors of fact or interpretation remain
the sole responsibility of the authors. B.A.K. also thanks the Section of
Integrative Biology at the University of Texas at Austin, Jon und Hanna
Ahrens-Lagast for translation assistance, Anja Weidenmuller, Christoph
Kleineidam, and the honey bees. Thomas Seeley, Walter Kaiser, Rebecca
Basile, the Mueller lab, and four anonymous reviewers kindly critiqued
earlier versions of this paper.
Author Contributions
Conceived and designed the experiments: BAK. Performed the experi-
ments: BAK MS. Analyzed the data: BAK AK. Contributed reagents/
materials/analysis tools: AK JT. Contributed to the writing of the
manuscript: BAK AK MS JT.
References
1. Hay SI, Guerra CA, Gething PW, Patil AP, Tatem AJ, et al. (2009) A world
malaria map: Plasmodium falciparum endemicity in 2007. PLoS Medicine 6: 286–302.
2. Witteveen BH, Worthy GAJ, Roth JD (2009) Tracing migratory movements of
breeding North Pacific humpback whales using stable isotope analysis. MarineEcology-Progress Series 393: 173–183.
3. Noser R, Byrne RW (2010) How do wild baboons (Papio ursinus) plan theirroutes? Travel among multiple high-quality food sources with inter-group
competition. Anim Cogn 13: 145–155.
4. Jandt JM, Dornhaus A (2009) Spatial organization and division of labour in thebumblebee Bombus impatiens. Anim Behav 77: 641–651.
5. Franks NR, Sendova-Franks AB (1992) Brood sorting by ants: distributing the
workload over the work-surface. Behav Ecol Sociobiol 30: 109–123.
6. Baracchi D, Zaccaroni M, Cervo R, Turillazzi S (2010) Home range analysis in
the study of spatial organization on the comb in the paper wasp Polistes dominulus.Ethology 116: 579–587.
7. Adams ES, Tschinkel WR (1995) Spatial dynamics of colony interactions in
young populations of the fire ant Solenopsis invicta. Oecologia 102: 156–163.
8. Menzel R, Greggers U, Smith A, Berger S, Brandt R, et al. (2005) Honey bees
navigate according to a map-like spatial memory. P Natl Acad Sci USA 102:
3040–3045.
9. Riley JR, Greggers U, Smith AD, Reynolds DR, Menzel R (2005) The flight
paths of honeybees recruited by the waggle dance. Nature. 435: 205–207.
10. Cartwright BA, Collett TS (1987) Landmark maps for honeybees. Biol Cybern57: 85–93.
11. von Frisch K (1967) The Dance Language and Orientation of Bees. Cambridge:The Belknap Press.
12. Camazine S (1991) Self-Organizing Pattern Formation on the Combs of Honey
Bee Colonies. Behav Ecol Sociobiol 28: 61–76.
13. Seeley TD (1982) Adaptive significance of the age polyethism schedule in
honeybee colonies. Behav Ecol Sociobiol 11: 287–293.
14. Hendricks JC, Finn SM, Panckeri KA, Chavkin J, Williams JA, et al. (2000) Restin Drosophila is a sleep-like state. Neuron 25: 129–138.
15. Anderson JR (1998) Sleep, sleeping sites, and sleep-related activities: awakening
to their significance. Am J Primatol 46: 63–75.
16. Rattenborg NC, Lima SL, Amlaner CJ (1999) Half-awake to the risk of
predation. Nature. 397: 397–398.
17. Anderson JR (2000) Sleep-related behavioural adaptations in free-ranginganthropoid primates. Sleep Med Rev 4: 355–373.
18. Pieron H (1913) Le Probleme Physiologique du Sommeil. Paris: Masson.
19. Flanigan WF, Wilcox RH, Rechtschaffen A (1973) The EEG and behavioralcontinuum of the crocodilian, Caimen sclerops. Electroencephalogr Clin
Neurophysiol 34: 521–538.
20. Tobler I (1985) Deprivation of sleep and rest in vertebrates and invertebrates. In:
Inoue S, Borbely AA, editors. Endogenous Sleep Substances and Sleep
Regulation (Taniguchi Symposia, series no. 8). Utrecht: VNU Science Press.pp. 57–66.
21. Kaiser W (1988) Busy bees need rest, too: Behavioural and electromyographicalsleep signs in honeybees. J Comp Physiol A 163: 565–584.
22. Sauer S, Herrmann E, Kaiser W (2004) Sleep deprivation in honey bees. J Sleep
Res 13: 145–152.
23. Seeley TD, Kolmes SA (1991) Age polyethism for hive duties in honey bees–
illusion or reality? Ethology 87: 284–297.
24. Moore D, Angel JE, Cheeseman IM, Fahrbach SE, Robinson GE (1998)Timekeeping in the honey bee colony: integration of circadian rhythms and
division of labor. Behav Ecol Sociobiol 43: 147–160.
25. Moore D (2001) Honey bee circadian clocks: behavioral control from individualworkers to whole-colony rhythms. J Insect Physiol 47: 843–857.
26. Johnson BR (2008) With-in nest temporal polyethism in the honey bee. BehavEcol Sociobiol 62: 777–784.
27. Klein BA, Olzsowy KM, Klein A, Saunders KM, Seeley TD (2008) Caste-
dependent sleep of worker honey bees. J Exper Biol 211: 3028–3040.doi:10.1242/jeb.017426
28. Kleinhenz M, Bujok B, Fuchs S, Tautz J (2003) Hot bees in empty broodnest
cells: heating from within. J Exp Biol 206: 4217–4231.
29. Kaiser W, Faltin T, Bayer G (2002) Sleep in a temperature gradient–behaviouralrecordings from forager honey bees. J Sleep Res 11 (suppl.): 115–116.
30. Schmolz E, Hoffmeister D, Lamprecht I (2002) Calorimetric investigations onmetabolic rates and thermoregulation of sleeping honeybees (Apis mellifera carnica).
Thermochim Acta 383: 221–227.
31. Seeley TD (1995) The Wisdom of the Hive: The Social Physiology of Honey BeeColonies. Cambridge: Harvard University Press.
32. von Frisch K, Lindauer M, Inst Wiss Film (1977) Nachweis des Farbensehens beider Honigbiene. Film C 1263 des IWF, Gottingen. Publication of Lindauer M,
Publ Wiss Film, Sekt Biol, Ser. 14: Nr. 23/C 1263 (1981), 8 S.33. Dustmann JH, Geffcken H (2000) Bienen konnen Farben unterscheiden.
Nieders. Landesinstitut fur Bienenkunde (Verleger), Celle.
34. Sakagami SF (1953) Untersuchungen uber die Arbeitsteilung in einemZwergvolk der Honigbiene. Beitrage zur Biologie des Bienenvolkes, Apis mellifera
L. I. Jpn J Zool 11: 117–185.35. Seeley TD (1985) Honeybee Ecology: A Study of Adaptation in Social Life.
Princeton: Princeton University Press.
36. Kovac H, Stabentheiner A, Hetz SK, Petz M, Crailsheim K (2007) Respirationof resting honeybees. J Insect Physiol 53: 1250–1261.
37. Klein BA, Klein A, Wray MK, Mueller UG, Seeley TD (2010) SleepDeprivation impairs precision of waggle dance signaling in honey bees. P Natl
Acad Sci USA 107: 22705–22709. doi:10.1073/pnas.100943910838. Klein BA, Seeley TD (2011) Work or sleep? Honeybee foragers opportunistically
nap during the day when forage is not available. Anim Behav 82: 77–83.
doi:10.1016/j.anbehav.2011.03.02639. R Development Core Team (2005) R: A language and environment for
statistical computing. R Foundation for Statistical Computing, Vienna, Austria.isbn 3-900051-07-0, online.
40. Bates D, Sarkar D (2006) The lme4 Package, http://cran.r-project.org/src/
contrib/Descriptions/lme4.html.41. Hothorn T, Bretz F, Westfall P (2008) Simultaneous inference in general
parametric models. Biometrical J 50: 346–363.42. Pinheiro J, Bates D (2002) Mixed-Effects Models in S and S-PLUS. New York:
Springer. pp. 83–92.43. Clark DL, Gillingham JC (1990) Sleep-site fidelity in two Puerto Rican lizards.
Anim Behav 39: 1138–1148.
44. Bujok B, Kleinhenz M, Fuchs S, Tautz J (2002) Hot spots in the bee hive.Naturwissenschaften 89: 299–301.
45. Vega L, Torres A, Hoffmann W, Lamprecht I (2011) Thermal investigationsassociated with the behaviour patterns of resting workers of Bombus atratus
(Hymenoptera: Apidae). J Therm Anal Calorim 104: 233–237.
46. Hess WR (1926) Die Temperaturregulierung im Bienenvolk. Z Vergl Physiol 4:465–487.
47. Szabo TI (1985) The thermology of wintering honeybee colonies in 4-colonypacks as affected by various hive entrances. J Apicultural Res 24: 27–37.
48. Humphrey JAC, Dykes ES (2008) Thermal energy conduction in a honey beecomb due to cell-heating bees. J Theor Biol 250: 194–208.
49. Fahrenholz L, Lamprecht I, Schricker B (1989) Thermal investigations of a
honey bee colony: thermoregulation of the hive during summer and winter andheat production of members of different bee castes. J Comp Physiol B 159: 551–
560.50. Stabentheiner A, Kovac H, Brodschneider R (2010) Honeybee colony
thermoregulation – regulatory mechanisms and contribution of individuals in
dependence on age, location and thermal stress. PLoS One 5: 1–13.51. Sauer S, Kinkelin M, Herrmann E, Kaiser W (2003) The dynamics of sleep-like
behaviour in honey bees. J Comp Physiol A 189: 599–607.52. Sauer S, Menna-Barreto L, Kaiser W (1998) The temporal organization of rest
and activity in newly emerged honey bees kept in isolation – initial results.
Apidologie 29: 445–447.53. Sauer S, Happel U, Neubecker R, Menna-Barreto L, Herrmann E, Kaiser W
(1999) Ontogeny of the circadian rest-activity cycle in honey bees kept inisolation. In: Elsner N, Eysel U. Proceedings of the 1st Gottingen Conference of
the German Neuroscience Society, vol. II: 27th Gottingen NeurobiologyConference. Stuttgart: Georg Thieme Verlag. p. 241.
54. Eban-Rothschild AD, Bloch G (2008) Differences in the sleep architecture of
forager and young honeybees (Apis mellifera). J Exper Biol 211: 2408–2416.
Mapping Sleeping Honey Bees within Their Nest
PLOS ONE | www.plosone.org 11 July 2014 | Volume 9 | Issue 7 | e102316