Linking small desert mammal distribution to habitat structure in a protected and grazed landscape of...
11
Original article Linking small desert mammal distribution to habitat structure in a protected and grazed landscape of the Monte, Argentina Solana Tabeni a, *, Leandro Mastrantonio b , Ricardo A. Ojeda a a Biodiversity Research Group (GiB), National Council for Science & Technology of Argentina (CONICET) and the Institute for Aridland Research (IADIZA), Av. A. Ruiz Leal s/n, CC 507, C.P. 5500 Mendoza, Argentina b Department of Agrarian Engineering, National University of Cuyo, Mendoza, Argentina article info Article history: Received 28 March 2006 Accepted 22 November 2006 Published online - Keywords: Grazing Spatial pattern Scales Logistic model abstract Interpretation of landscape patterns from the perspective of different species allows know- ing the way in which they perceive landscape, and how their perception varies with scale. We examined distribution of four small mammal species at different scales over a land- scape including protected and grazed areas, and associated species distribution with land- scape structure. The study was conducted in the central Monte Desert (Reserve of N ˜ acun ˜a ´ n). Trap grids were set in both areas at two scales, varying their grain and extent. To determine whether spatial patterns are random, clumped or regular, we used a point pattern analysis. Logistic regressions were performed to relate the presence-absence of small mammals to environmental variables. Intensity of the point pattern was not con- stant, either in the Reserve or the grazed area. Small mammal abundance exhibited a het- erogeneous distribution, and the existence of a first-order effect was detected for all species. No second-order effects were detected, the point pattern was random for all spe- cies in both areas. Both areas were differently perceived by rodent species. Habitat struc- ture in both conditions and its variations with scale appear to be important factors affecting distribution patterns. ª 2006 Elsevier Masson SAS. All rights reserved. 1. Introduction Natural and anthropic disturbances have been acknowledged as important generators of landscape heterogeneity, as they produce complex patterns where some areas are more affected than others, and where severity of the disturbance varies con- siderably even within the affected area (Turner et al., 2002). Grazing by domestic herbivores is one of the most common dis- turbance agents in arid and semiarid ecosystems, and its ef- fects are likely to induce changes in the spatial pattern of landscape and alteration of multiple ecological processes by loss of natural habitats and biodiversity (Fleischner, 1994). Depending on the scale examined, heterogeneity caused by grazing is in some cases increased and reduced in others * Corresponding author. Tel.: þ54 261 428 7995; fax: þ54 261 428 0080. E-mail addresses: [email protected], [email protected] (S. Tabeni), [email protected] (L. Mastrantonio), [email protected] (R.A. Ojeda). available at www.sciencedirect.com journal homepage: www.elsevier.com/locate/actoec ARTICLE IN PRESS 1146-609X/$ – see front matter ª 2006 Elsevier Masson SAS. All rights reserved. doi:10.1016/j.actao.2006.11.002 acta oecologica xxx (2007) 1–11 Please cite this article in press as: Tabeni, S. et al., Linking small desert mammal distribution to habitat structure in a protected and grazed landscape of the Monte, Argentina, Acta Oecolo. (2007), doi:10.1016/j.actao.2006.11.002
Transcript of Linking small desert mammal distribution to habitat structure in a protected and grazed landscape of...

ava i lab le at www.sc ienced i rec t . com
journa l homepage : www. e lsev ier . com/ loca te /ac toec
ARTICLE IN PRESSa c t a o e c o l o g i c a x x x ( 2 0 0 7 ) 1 – 1 1
Original article
Linking small desert mammal distribution to habitatstructure in a protected and grazed landscapeof the Monte, Argentina
Solana Tabenia,*, Leandro Mastrantoniob, Ricardo A. Ojedaa
aBiodiversity Research Group (GiB), National Council for Science & Technology of Argentina (CONICET) and the Institute for Aridland
Research (IADIZA), Av. A. Ruiz Leal s/n, CC 507, C.P. 5500 Mendoza, ArgentinabDepartment of Agrarian Engineering, National University of Cuyo, Mendoza, Argentina
a r t i c l e i n f o
Article history:
Received 28 March 2006
Accepted 22 November 2006
Published online -
Keywords:
Grazing
Spatial pattern
Scales
Logistic model
a b s t r a c t
Interpretation of landscape patterns from the perspective of different species allows know-
ing the way in which they perceive landscape, and how their perception varies with scale.
We examined distribution of four small mammal species at different scales over a land-
scape including protected and grazed areas, and associated species distribution with land-
scape structure. The study was conducted in the central Monte Desert (Reserve of
Nacunan). Trap grids were set in both areas at two scales, varying their grain and extent.
To determine whether spatial patterns are random, clumped or regular, we used a point
pattern analysis. Logistic regressions were performed to relate the presence-absence of
small mammals to environmental variables. Intensity of the point pattern was not con-
stant, either in the Reserve or the grazed area. Small mammal abundance exhibited a het-
erogeneous distribution, and the existence of a first-order effect was detected for all
species. No second-order effects were detected, the point pattern was random for all spe-
cies in both areas. Both areas were differently perceived by rodent species. Habitat struc-
ture in both conditions and its variations with scale appear to be important factors
affecting distribution patterns.
ª 2006 Elsevier Masson SAS. All rights reserved.
1. Introduction
Natural and anthropic disturbances have been acknowledged
as important generators of landscape heterogeneity, as they
produce complex patterns where some areas are more affected
than others, and where severity of the disturbance varies con-
siderably even within the affected area (Turner et al., 2002).
1146-609X/$ – see front matter ª 2006 Elsevier Masson SAS. All rigdoi:10.1016/j.actao.2006.11.002
Please cite this article in press as: Tabeni, S. et al., Linking smaland grazed landscape of the Monte, Argentina, Acta Oecolo. (2
Grazing by domestic herbivores is one of the most common dis-
turbance agents in arid and semiarid ecosystems, and its ef-
fects are likely to induce changes in the spatial pattern of
landscape and alteration of multiple ecological processes by
loss of natural habitats and biodiversity (Fleischner, 1994).
Depending on the scale examined, heterogeneity caused by
grazing is in some cases increased and reduced in others
* Corresponding author. Tel.: þ54 261 428 7995; fax: þ54 261 428 0080.E-mail addresses: [email protected], [email protected] (S. Tabeni), [email protected] (L. Mastrantonio),
[email protected] (R.A. Ojeda).
hts reserved.
l desert mammal distribution to habitat structure in a protected007), doi:10.1016/j.actao.2006.11.002

a c t a o e c o l o g i c a x x x ( 2 0 0 7 ) 1 – 1 12
ARTICLE IN PRESS
(Adler et al., 2001). In the central part of the Monte Desert in
Argentina, heterogeneity may be higher in grazed habitats
than in the same type of habitat patches in ungrazed areas
(Tabeni and Ojeda, 2005). If this disturbance generates varying
heterogeneity levels on different scales, the response of each
species might be variable depending on perception by each or-
ganism and on habitat requirements (Orrock et al., 2000).
In the case of small mammals, there is plenty of literature
reporting the effects of cattle raising on these species, mostly
due to changes in habitat structure (Tabeni and Ojeda, 2003).
Nonetheless, as pointed out by Adler and Lauenroth (2000),
most ecological studies focus on the manner in which a treat-
ment affects the mean value of a variable, and rarely address
changes in the spatial distribution of such variable.
Behavioral responses of organisms to environmental
structure produce movements of individuals within patches,
which translates into different organism abundances among
patches across the landscape (Wiens, 1999). The spatial and
temporal patterns across a range of scales have been largely
reported for mammals (Krohne and Burgin, 1990; Amarase-
kare, 1994; Bowman et al., 2000, 2001; Klaas et al., 2000;
Mackinnon et al., 2001; Williams et al., 2001; Keitt et al.,
2002), but few studies explore these patterns in areas dis-
turbed by grazing (Keesing and Crawford, 2001; Schooley
and Wiens, 2001).
In the central area of the Monte Desert in Argentina, re-
sponses of small mammals to the impact of domestic
herbivores have been studied, comparing their diversity,
richness and abundance between disturbed and undisturbed
areas (Maldonado Curti 1990; Gonnet, 1998; Tabeni and
Ojeda, 2005). At broad level, comparisons between both
types of area indicate a decline in diversity and richness
of small mammals in grazed areas (Gonnet, 1998), but on
considering heterogeneity of each area, small mammal
species respond quite differently to grazing depending on
habitat type.
The presence of a particular pattern is often associated
with the operation of ecosystem-specific processes that serve
to structure the community in a non-random manner (Caylor
et al., 2003). Spatial distribution patterns in mammals can be
related to two main causes: intraspecific and interspecific
interactionsdsuch as competition, predation and reproduc-
tiondand environmental heterogeneity (Amarasekare, 1994;
Bowman et al., 2000; Schooley and Wiens, 2001). Point data
analysis can provide an insight into the scale of patchiness
and determine whether there are hierarchies of scale, and
whether spatial distribution is random, aggregated or uniform
(Gustafson, 1998).
In the present study we address the issue of how much of
the spatial patterns detected for four small mammal species
can be explained by environmental heterogeneity. Our gen-
eral goal is to analyze how these species are distributed in
space considering their eco-morphological attributes and the
heterogeneous matrix in which they occur. We hypothesized
that protected and grazed areas determine different use of
space by all four species, and we propose two objectives: (1)
analyze the spatial distribution of four small mammal species
between grazed and protected areas and habitat type, on dif-
ferent scales, and (2) relate species distribution to landscape
structure.
Please cite this article in press as: Tabeni, S. et al., Linking smaland grazed landscape of the Monte, Argentina, Acta Oecolo. (2
2. Materials and methods
2.1. Study area
The study was carried out in the MaB Reserve of Nacunan
(34�020 S, 67�580 W), located in the central part of the temperate
Monte Desert, Argentina (Morello, 1958) (Fig. 1). The climate is
semiarid and markedly seasonal, with cold dry winters (mean
temperature<10 �C) and warm rainy summers (mean temper-
ature >20 �C). Average annual rainfall is 329.4 mm (Estrella
et al., 2001).
At the beginning of the 19th century, the area of Nacunan
suffered severe exploitation from indiscriminate logging of
Prosopis woodlands, and its growing impoverishment led to in-
tensified cattle raising. The Reserve of Nacunan was created in
1961 to protect the woodlands of P. flexuosa, one of the most
conspicuous habitat types in the area. In 1986 the Reserve
was incorporated into the UNESCO Man and Biosphere Re-
serve Network (Ojeda et al., 1998) and for over 40 years cattle
have remained excluded from the area.
In this study we compared the Reserve of Nacunan with
one adjacent area under cattle grazing. The grazed field is un-
der a continuous grazing system and also presents other re-
lated activities (firewood extraction, subsistence hunting,
establishment of watering points, fences, roads and human
settlements).
The major plant communities in this area are open wood-
lands of Prosopis flexuosa that make up the tree layer along
with specimens of chanar (Geoffroea decorticans), a shrub layer
of jarilla (Larrea divaricata and Larrea cuneifolia) and piquillın
(Condalia microphylla), and a grass and herb layer. Besides,
there are Larrea shrublands, plant communities with low
tree density and dominance of jarilla and grasses (Trichloris cri-
nita, Scleropogon brevifolius and Baccharis pingraea). To a lesser
degree, there are also areas with high proportion of bare soil
and low plant cover: sand dunes (sparse woody and herba-
ceous plants) and peladal (habitat with high amounts of clay
and bare soil, with extremely scarce plant cover consisting
mostly of stunted L. cuneifolia) (Roig, 1971).
2.2. Sampling and data collection
Four small mammal species (less than 100 g) were studied: the
silky mouse (Eligmodontia typus), the gray leaf-eared mouse
(Graomys griseoflavus), the grass mouse (Akodon molinae) and
the vesper mouse (Calomys musculinus) (Rodentia, Cricetidae).
Samplings of small mammals were made using trapping
grids set up on two scales. Scale is the spatial or temporal di-
mension of an object or process (Turner et al., 1989), and in-
volves two elements: grain or resolution (size of individual
units of observation) and extent (size of the area studied) (For-
man, 1995; Gustafson, 1998).
We examined two scales of perception of habitat in a hier-
archical form, based on environmental heterogeneity and on
evidence that it can be perceived by small mammals at differ-
ent habitat levels (i.e. ‘‘microhabitat’’, ‘‘macrohabitat’’) (Gon-
net and Ojeda, 1998; Corbalan and Ojeda, 2004; Corbalan,
2006; Corbalan and Debandi, 2006): (1) at small scale we
attempted to represent the environmental heterogeneity
l desert mammal distribution to habitat structure in a protected007), doi:10.1016/j.actao.2006.11.002

a c t a o e c o l o g i c a x x x ( 2 0 0 7 ) 1 – 1 1 3
ARTICLE IN PRESS
Monte Desert biome
Ñacuñán Reserve
0 400 Km
Fig. 1 – Location of the study area (MaB Reserve of Nacunan) in the Monte Desert biome, Argentina.
inside the habitats, this resolution considers the available in-
formation on spatial use by these species at microhabitat
level, (2) at coarse scale the purpose was to include the differ-
ent landscape units within both areas. Although there is pre-
vious evidence of species habitat selection at macrohabitat
level, it comes from studies of fine grain. Here we assess
how small mammal species perceive the environmental con-
trast at coarse resolution, not considered thus far.
Please cite this article in press as: Tabeni, S. et al., Linking smalland grazed landscape of the Monte, Argentina, Acta Oecolo. (20
On these grounds, the coarse scale consisted of two grids of
75 ha (extent) set up in both the protected and grazed areas,
with 75 trapping stations 100 m apart (grain ¼ 1 ha). To maxi-
mize captures at each station, four traps were placed in each
cardinal direction, separated 10 m from one another. The
small scale consisted of grids of 0.25 ha (extent) each, with
25 trapping stations 10 m apart (grain ¼ 0.01 ha). Four trapping
grids were set up in each of the three main habitat types
desert mammal distribution to habitat structure in a protected07), doi:10.1016/j.actao.2006.11.002

a c t a o e c o l o g i c a x x x ( 2 0 0 7 ) 1 – 1 14
ARTICLE IN PRESS
(Prosopis woodland, Larrea shrubland, and sand dunes) in both
grazed and protected areas totaling 300 trapping stations per
area.
The trapping session for the coarse scale was conducted in
May 2003, operational reasons prevented us from replicating
this sampling. For the small scale, 8 trapping sessions were
carried out over 2 years: February 2001 and 2002 (summer),
May 2001 and 2002 (autumn), August 2001 and 2002 (winter),
October 2001 and 2002 (spring). For both scales each sampling
period consisted of 5 consecutive nights. Sherman live traps
were used, baited with rolled oats and peanut butter. Traps
were checked in the morning, captured animals were marked,
and their weight, sex, and reproductive condition recorded
(male: testes scrotal or abdominal, female: vulva perforate or
imperforate, pregnant or lactating).
At small scale, in order to correlate species spatial struc-
ture and environmental structure, vegetation samplings
were made within the trapping grids in each of the three
main habitat types in the Reserve and in the grazed area. A
4 by 4 m square was centered at each trapping station from
where percentages of plant cover and bare soil were visually
estimated. A total of 300 squares were established in the Re-
serve and another 300 in the grazed area.
At coarse scale we determined types of landscape
unit (cover classes) using a satellite image (Landsat 7
ETMþ231_84_10-March-2003_4x_FF) of the study area. The
scene analyzed corresponds to the same season where sam-
pling of small mammals was made at this scale. A land
cover map was derived from a supervised classification us-
ing the Minimum Distance method (Chuvieco, 1996). TM 4-
3 and 2 bands were used in the classification, with regions
of interest or training sites defined in homogeneous areas.
Verification of these sites was based on both vegetation
map (Roig and Rossi, 2001) and field data. At the post-classi-
fication stage, a confusion matrix was used to assess the ac-
curacy of the classification, by comparison with the data
recorded in the field.
2.3. Data analysis
For verifying whether different plant layers recorded at small
scale (bare soil, trees, shrubs, herbs and grasses) vary between
habitats inside and outside the Reserve, they were compared
with a Mann–Whitney test (Zar, 1999).
Data on small mammals are point pattern-like spatial data
(Cressie, 1993). A number of methods have been used for
quantifying the characteristics of a point pattern. First-order
statistics describe the intensity l of a point pattern in the
study region, a typical approach is to use the mean point-to-
point distance to derive a mean area per point as in nearest-
neighbor methods. In contrast, the second-order property of
a point pattern is related to the joint density of the occurrence
of two points at a given distance, and describes the small-
scale spatial correlation structure of the point pattern (Peliss-
ier and Goreaud, 2001; Wiegand and Moloney, 2004). Some of
the second-order statistics such as the O-ring statistics or
Ripley’s K function describe characteristics of point processes
at many distance scales. These statistics characterize the
number of points encountered in the neighborhood of a ring
or circle, respectively, of radius r centered on an arbitrary
Please cite this article in press as: Tabeni, S. et al., Linking smalland grazed landscape of the Monte, Argentina, Acta Oecolo. (20
point of the pattern, allowing to interpret spatial structure in
terms of interaction processes (aggregation, inhibition etc.)
(Pelissier and Goreaud, 2001; Wiegand and Moloney, 2004).
The O-ring statistic O(r) is a scale-dependent neighborhood
density and can be defined as the expected density of points
of the pattern within a distance r from an arbitrary point of
the pattern.
To determine whether spatial patterns of the small
mammals were random, clumped, or regular, we conducted
a series of univariate O-ring analyses. The total number of
individuals captured in each trap (without recaptures) was
used in this analysis as value of the pattern in the grid
cell of the trap. From our analyses we expect first-order ef-
fects in the spatial distribution of small mammals due to
environmental heterogeneity. To factor out the first-order
effects, and thereby study the second-order effects of
interest, we used a heterogeneous Poisson null model that
distributes random points in accordance with the non-
constant first-order intensity (Wiegand and Moloney, 2004).
To construct the first order-intensity l we used a circular
moving window estimator of l with radius r ¼ 1, 2 or 3 cells,
which are the scales where we expected second-order ef-
fects. At either scale, small or coarse, analyses were con-
ducted separately for the Reserve and the grazed area. The
significant departure from the null model was tested by con-
structing confidence envelopes using 99 Monte Carlo simula-
tions of the heterogeneous Poisson null model (Wiegand and
Moloney, 2004).
Logistic regressions were performed to relate the presence-
absence of small mammals with environmental variables at
different scales.
At small scale, variables used in the regression were treat-
ment (Reserve and grazed area), habitats (Prosopis woodland,
Larrea shrubland and sand dunes), and the proportion of
each type of layer (trees, shrubs, grasses, herbs and bare
soil). At coarse scale, variables used were treatment and cover
classes.
Colinearity among explanatory variables was determined
by the Pearson correlation matrix, and only uncorrelated vari-
ables were entered into a logistic regression at 0.05 level of sig-
nificance. The minimum model that best explained the
dependent variable without including unnecessary explana-
tory variables was found by applying the stepwise procedure
using backward elimination until all remaining predictors
were significant at the 0.05 level.
Contingency tables of data observed vs. values predicted
by the model were constructed for different cut-off values.
Percentages of correctly classified occurrences (sensitivity)
and of correctly classified absences (specificity) were esti-
mated. The least error cut-off value was determined for
each model, thus maximizing sensitivity and specificity.
We also used the receiver operating characteristic (ROC) as
a threshold or cut-off independent measure of model accu-
racy. A ROC was obtained by plotting the true positive pro-
portion of correctly predicted occurrences (sensitivity) on
the y-axis against the false positive proportion of correctly
predicted absences (specificity) on the x-axis. The area under
the ROC curve (AUC) was used to test for greater significance
than the area under a random model, with AUC ¼ 0.5
(Schadt et al., 2002).
desert mammal distribution to habitat structure in a protected07), doi:10.1016/j.actao.2006.11.002
a c t a o e c o l o g i c a x x x ( 2 0 0 7 ) 1 – 1 1 5
ARTICLE IN PRESS
3. Results
3.1. Habitat variables
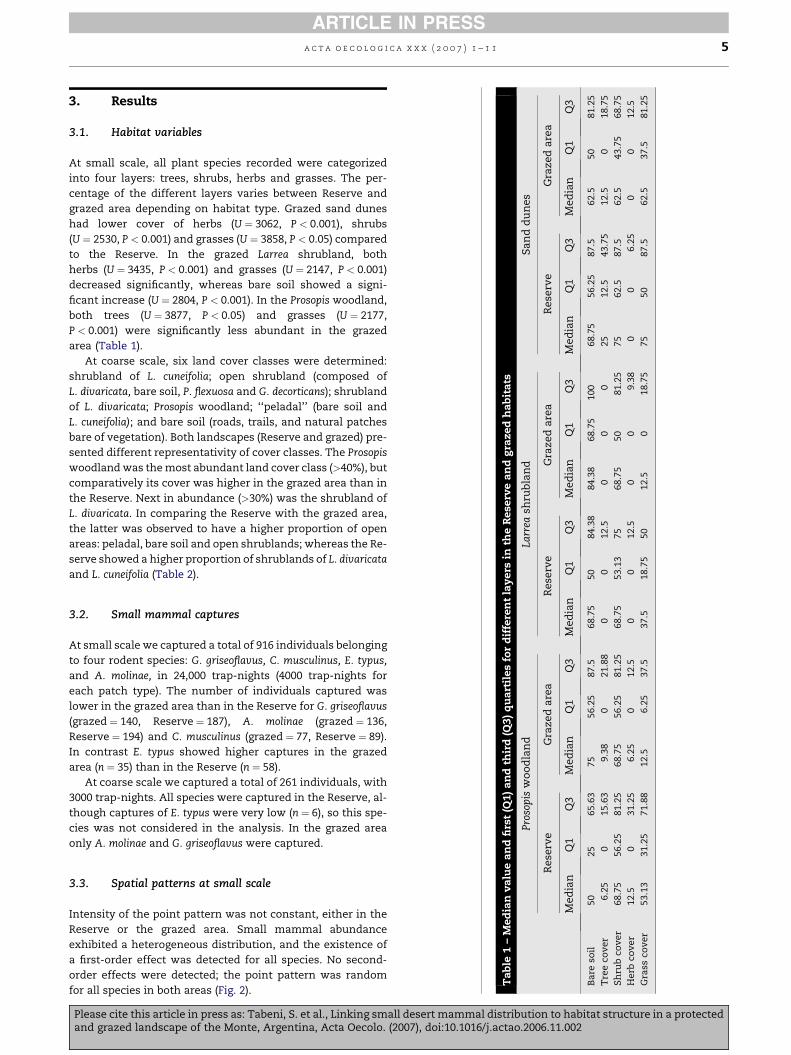
At small scale, all plant species recorded were categorized
into four layers: trees, shrubs, herbs and grasses. The per-
centage of the different layers varies between Reserve and
grazed area depending on habitat type. Grazed sand dunes
had lower cover of herbs (U ¼ 3062, P < 0.001), shrubs
(U ¼ 2530, P < 0.001) and grasses (U ¼ 3858, P < 0.05) compared
to the Reserve. In the grazed Larrea shrubland, both
herbs (U ¼ 3435, P < 0.001) and grasses (U ¼ 2147, P < 0.001)
decreased significantly, whereas bare soil showed a signi-
ficant increase (U ¼ 2804, P < 0.001). In the Prosopis woodland,
both trees (U ¼ 3877, P < 0.05) and grasses (U ¼ 2177,
P < 0.001) were significantly less abundant in the grazed
area (Table 1).
At coarse scale, six land cover classes were determined:
shrubland of L. cuneifolia; open shrubland (composed of
L. divaricata, bare soil, P. flexuosa and G. decorticans); shrubland
of L. divaricata; Prosopis woodland; ‘‘peladal’’ (bare soil and
L. cuneifolia); and bare soil (roads, trails, and natural patches
bare of vegetation). Both landscapes (Reserve and grazed) pre-
sented different representativity of cover classes. The Prosopis
woodland was the most abundant land cover class (>40%), but
comparatively its cover was higher in the grazed area than in
the Reserve. Next in abundance (>30%) was the shrubland of
L. divaricata. In comparing the Reserve with the grazed area,
the latter was observed to have a higher proportion of open
areas: peladal, bare soil and open shrublands; whereas the Re-
serve showed a higher proportion of shrublands of L. divaricata
and L. cuneifolia (Table 2).
3.2. Small mammal captures
At small scale we captured a total of 916 individuals belonging
to four rodent species: G. griseoflavus, C. musculinus, E. typus,
and A. molinae, in 24,000 trap-nights (4000 trap-nights for
each patch type). The number of individuals captured was
lower in the grazed area than in the Reserve for G. griseoflavus
(grazed ¼ 140, Reserve ¼ 187), A. molinae (grazed ¼ 136,
Reserve ¼ 194) and C. musculinus (grazed ¼ 77, Reserve ¼ 89).
In contrast E. typus showed higher captures in the grazed
area (n ¼ 35) than in the Reserve (n ¼ 58).
At coarse scale we captured a total of 261 individuals, with
3000 trap-nights. All species were captured in the Reserve, al-
though captures of E. typus were very low (n ¼ 6), so this spe-
cies was not considered in the analysis. In the grazed area
only A. molinae and G. griseoflavus were captured.
3.3. Spatial patterns at small scale
Intensity of the point pattern was not constant, either in the
Reserve or the grazed area. Small mammal abundance
exhibited a heterogeneous distribution, and the existence of
a first-order effect was detected for all species. No second-
order effects were detected; the point pattern was random
for all species in both areas (Fig. 2).
Please cite this article in press as: Tabeni, S. et al., Linking small desertand grazed landscape of the Monte, Argentina, Acta Oecolo. (2007), do
Ta
ble
1–
Med
ian
va
lue
an
dfi
rst
(Q1
)a
nd
thir
d(Q
3)
qu
art
iles
for
dif
fere
nt
lay
ers
inth
eR
ese
rve
an
dg
raze
dh
ab
ita
ts
Pro
sopis
wo
od
lan
dLa
rrea
shru
bla
nd
Sa
nd
du
nes
Rese
rve
Gra
zed
are
aR
ese
rve
Gra
zed
are
aR
ese
rve
Gra
zed
are
a
Med
ian
Q1
Q3
Med
ian
Q1
Q3
Med
ian
Q1
Q3
Med
ian
Q1
Q3
Med
ian
Q1
Q3
Med
ian
Q1
Q3
Ba
reso
il50
25
65.6
375
56.2
587.5
68.7
550
84.3
884.3
868.7
5100
68.7
556.2
587.5
62.5
50
81.2
5
Tre
eco
ver
6.2
50
15.6
39.3
80
21.8
80
012.5
00
025
12.5
43.7
512.5
018.7
5
Sh
rub
cov
er
68.7
556.2
581.2
568.7
556.2
581.2
568.7
553.1
375
68.7
550
81.2
575
62.5
87.5
62.5
43.7
568.7
5
Herb
cov
er
12.5
031.2
56.2
50
12.5
00
12.5
00
9.3
80
06.2
50
012.5
Gra
ssco
ver
53.1
331.2
571.8
812.5
6.2
537.5
37.5
18.7
550
12.5
018.7
575
50
87.5
62.5
37.5
81.2
5
mammal distribution to habitat structure in a protectedi:10.1016/j.actao.2006.11.002

a c t a o e c o l o g i c a x x x ( 2 0 0 7 ) 1 – 1 16
ARTICLE IN PRESS
Table 2 – Representativity of different cover classes at coarse scale between the Reserve and grazed area
Cover classes Area (ha) Area (%) Patch number
Reserve Grazed area Reserve Grazed area Reserve Grazed area
Shrubland of L. cuneifolia 980.46 806.85 8.28 6.81 916 814
Open shrubland of
L. divaricata
1299.33 1818.18 10.97 15.35 1582 2056
Shrubland of L. divaricata 4548.42 3620.16 38.41 30.57 1442 1897
Prosopis woodland 4867.92 5301.72 41.19 44.78 1497 1396
Peladal 16.29 47.25 0.13 0.39 31 44
Bare soil 126.54 244.80 1.06 2.06 248 629
The density of points varied for each species depending on
the environmental heterogeneity present in each area. For
A. molinae, the logistic regression showed correspondence be-
tween the presence of this species and habitat patches with
dense plant cover. Within the Reserve, the Larrea shrubland
and grass and shrub layers were the variables that better
explained the presence of this species. In contrast, in the
Please cite this article in press as: Tabeni, S. et al., Linking smalland grazed landscape of the Monte, Argentina, Acta Oecolo. (20
grazed area clumps of this species occurred in the Prosopis
woodland, habitat in which tree and grass layers were the sig-
nificant variables (Table 3).
C. musculinus was more related to the Larrea shrubland and
grass and shrub layers in either treatment, and for E. typus re-
gressions showed that the overall habitat rather than a partic-
ular layer was the best predictor of this species presence. The
A.molinae
Reserve Grazed area
C. musculinus
Reserve Grazed area
Grazed area G. griseoflavus
Reserve
E. typus
Reserve Grazed area
Fig. 2 – Point pattern analysis at small scale for each species showing the O-ring statistic (bold lines) with confidence
envelopes (solid lines) at small scale (a) and Reserve (b) grazed area.
desert mammal distribution to habitat structure in a protected07), doi:10.1016/j.actao.2006.11.002

a c t a o e c o l o g i c a x x x ( 2 0 0 7 ) 1 – 1 1 7
ARTICLE IN PRESS
Table 3 – Results of logistic regression models at small scale. Models with an area under the curve (ROC), between 0.7 and0.9 indicate higher discriminatory ability. Sensitivity and specificity refer to the percentage of occurrences and absencescorrectly classified. b is the coefficient allocated to each independent variable during the regression, and b0 is the intercept
Species Treatment Habitat n P > c2 Model information Model parameters
Least errorcut-off value
Sensitivity/Specificity
Area underROC curve
Variable b SE P
Akodon molinae Reserve Larrea
shrubland
287 0.014 0.90 0.63 0.73 Shrub 4.16 1.80 0.021
Grass 5.29 2.10 0.012
b0 �0.22 0.90 0.808
Grazed Prosopis
woodland
214 0.000 0.70 0.78 0.88 Tree 6.54 2.67 0.014
Grass 15.04 2.70 0.000
b0 �1.03 0.32 0.001
Calomys
musculinus
671 0.000 0.35 0.68 0.72 Grass 3.20 0.76 0.000
Shrub 2.46 0.80 0.002
Larrea shrubland 1.79 0.20 0.000
b0 �2.86 0.45 0.000
Eligmodontia
typus
Reserve 312 0.000 0.25 0.62 0.64 Sand dunes 1.18 0.32 0.000
b0 �2.21 0.24 0.000
Grazed 319 0.000 0.24 0.62 0.69 Sand dunes 1.16 0.26 0.000
Tree �6.70 2.34 0.004
b0 �1.18 0.19 0.000
Graomys
griseoflavus
Reserve 446 0.006 0.73 0.54 0.59 Herbs 4.91 1.84 0.008
b0 0.77 0.15 0.000
Grazed Prosopis
woodland
156 0.000 0.52 0.78 0.86 Grass 12.77 2.31 0.000
Tree 5.58 2.39 0.020
b0 �1.48 0.34 0.000
most sensitive models included the sand dune habitat in both
the Reserve and grazed area, although in the latter a negative
association with the tree layer was observed (Table 3).
In G. griseoflavus the logistic regression showed no signifi-
cantly related variable in the Reserve, but in the grazed area
it was positively correlated with the Prosopis woodland, and
within this habitat with trees and grasses (Table 3).
3.4. Spatial patterns at coarse scale
All of the species showed a heterogeneous distribution in both
the Reserve and the grazed area, but no second-order effects
were observed. The distribution of A. molinae was correlated
with the Larrea shrubland in the Reserve and with the Prosopis
woodland in the grazed area (Table 4).
The distribution of C. musculinus in the Reserve exhibited
a significant association with the shrubland of L. cuneifolia,
however the discriminatory ability of the model was low
(<0.7). G. griseoflavus was heterogeneously distributed in
both the Reserve and the grazed field The variable retained
by the model in the Reserve was the shrubland of L. cuneifolia,
and in the grazed area the open shrubland of L. divaricata and
bare soil. In all cases association was negative, indicating
a higher probability of absence of this species when these
cover classes occur (Table 4).
4. Discussion
In deserts, where variations in climate, topography, soil and
vegetation create a high interpatch variability (Wiens, 1985;
Please cite this article in press as: Tabeni, S. et al., Linking smaland grazed landscape of the Monte, Argentina, Acta Oecolo. (2
Polis, 1991), population structure is mostly determined by
this spatial and temporal heterogeneity. The role of habitat
structure in desert mammal communities has been widely
documented (Rosenzweig and Winakur, 1969; Holbrook,
1978; Price, 1986). The distribution of patch mosaics provides
animals with different refuges against predators, food compo-
sition and distribution, as well as diverse types of layers that
affect their locomotion (Shenbrot et al., 1999).
Our prediction that species would present different distri-
butions between the Reserve and grazed area is only true for
some species and depends on the scale. Moreover, differing
responses are observed if distribution is considered through-
out the study area (first-order statistics) or if only the distribu-
tion of distances of pairs of points (second-order statistics) is
considered. In the first case, protected and grazed areas, at
the two resolutions studied, are structurally heterogeneous,
which is also perceived by small mammal species. Overall,
species were non-randomly distributed, forming clumps and
using specific habitat patches, layers or cover classes in both
areas according to their ecological requirements.
The few studies reporting distribution patterns of rodents
in grazed and ungrazed areas (Keesing and Crawford, 2001;
Schooley and Wiens, 2001) have found that, at high densities,
spatial patterns tend to be uniform and more equitably dis-
tributed across space, high rodent densities are reached only
in plots where ungulates have been excluded. In the presence
of ungulates, low densities tend to be grouped, reflecting ei-
ther presence of favorable microsites or vegetation contrasts.
A previous research in our study area reports that only two
species showed significant differences in abundance between
protected and grazed areas, the grass mouse with higher
l desert mammal distribution to habitat structure in a protected007), doi:10.1016/j.actao.2006.11.002

a c t a o e c o l o g i c a x x x ( 2 0 0 7 ) 1 – 1 18
ARTICLE IN PRESS
Table 4 – Results of logistic regression models at coarse scale. Models with an area under the curve (ROC), between 0.7 and0.9 indicate higher discriminatory ability. Sensitivity and specificity refer to the percentage of occurrences and absencescorrectly classified. b is the coefficient allocated to each independent variable during the regression, and b0 is the intercept
Species Area n P > c2 Model information Model parameters
Least errorcut-off value
Sensitivity/Specificity
Area underROC curve
Variable b SE P
Akodon molinae Reserve 103 0.0000 0.28 0.63 0.71 Shrubland of
L. cuneifolia
3.87 0.96 0.000
b0 �0.92 0.26 0.000
Grazed 81 0.0001 0.14 0.80 0.87 Prosopis woodland 8.39 2.76 0
b0 �6.15 1.67 0.000
Calomys
musculinus
Reserve 75 0.0207 0.06 0.55 0.62 Shrubland of
L. cuneifolia
3.55 1.47 0.016
b0 �2.87 0.55 0.000
Graomys
griseoflavus
Reserve 168 0.0887 0.90 0.60 0.63 Shrubland of
L. cuneifolia
�1.97 1.08 0.068
b0 2.25 0.28 0.000
Grazed 114 0.0388 0.74 0.60 0.63 Open shrubland
of L. divaricata
�1.21 0.68 0.076
Bare soil �6.88 3.95 0.082
b0 1.48 0.37 0.000
abundance inside the Reserve, and the silky mouse in the
grazed area (Tabeni and Ojeda, 2005). However we found
that density was not constant for all species in either treat-
ment, which showed a contrast between suitable and unsuit-
able habitats.
Patterns of spatial use by these small mammals have been
addressed at macrohabitat and microhabitat levels (Gonnet
and Ojeda, 1998; Corbalan and Ojeda, 2004; Corbalan, 2006;
Corbalan and Debandi, 2006). It has been proven that species
can distinguish among the three major habitat types. Habitat
preferences at macrohabitat level reported for A. molinae in
this area indicate a close association with densely vegetated
patches, specifically Larrea shrublands with high grass cover
(Corbalan and Ojeda, 2004). Besides, across its geographic
range, this species has been trapped in grass clumps near wa-
tercourses Contreras (1968). The coarse scale used in our study
is coincident with former results that indicate that this
species perceives contrasts in the landscape, and is closely
related to patches with high plant cover. However habitat
alterations cause changes in its use of space, while in the
Reserve high density areas correspond to Larrea shrublands,
in the grazed area these clumps are found in some parts of
the Prosopis woodland. In this woodland, vegetation patches
not visited by cattle contain a sufficiently high grass density
that would act as a refuge for A. molinae, probably reducing
its vulnerability to predation.
For G. griseoflavus, the explanatory ability of the model at
coarse scale was low, but it was possible to observe that this
species shows a tendency to avoid complex landscape units
(Shrubland of L. cuneifolia) in the Reserve, and open sites in
the grazed area. This result is not in agreement with earlier
studies reporting a higher association with complex macroha-
bitats inside the Reserve (Corbalan and Ojeda, 2004). Such
a difference can likely be attributed to the grain used, since
in those studies the same fine grain was used to elucidate
the use of space at different habitat levels.
The absence of data for some species such as C. musculinus
or E. typus at coarse scale can be attributed to the fact that as
Please cite this article in press as: Tabeni, S. et al., Linking smaland grazed landscape of the Monte, Argentina, Acta Oecolo. (2
grain size increases, species widely scattered in small patches
are less likely to be recorded than if they are highly aggregated
(Wiens, 1989). Although it is advisable to define grain and ex-
tent from an organism-centered perspective (Kotliar and
Wiens, 1990) this is not very pragmatic because of technical
limitations, and because in many cases we ignore the resolu-
tions at which organisms perceive the habitat (McGarigal and
Marks, 1995). In fact, in our study these results might be
regarded as a first approach to the grain and extent perceived
by these species.
At small resolution, records on the area indicate that hab-
itat selection by small mammals is weak, suggesting that
a combination of multiple factors (morphology, escape behav-
ior and diet) allows them to use different microhabitats in
a opportunistic fashion (Corbalan, 2006). As Jorgensen (2004)
pointed out, the appropriate spatial scale for microhabitats
is worth further discussion, and other habitat components,
not only habitat structure (i.e. food amount and quality, ther-
moregulation), can be important at this selection level (Gon-
net and Ojeda, 1998; Corbalan, 2006).
At a sampling scale of 15 m, A. molinae shows an associa-
tion with litter cover (Corbalan, 2006). However, at this scale
we found important predictors of the presence of this species,
such as grasses, trees and shrubs. Preference for vegetated
sites, from coarse to fine grain, suggest that this species se-
lects habitats equally at any scale, even under different eco-
logical conditions (ungrazed/grazed).
For the other species, our results are partially coincident
with previous studies. G. griseoflavus utilizes closed, shrubby
microhabitats in the Andean foothills (Gonnet and Ojeda,
1998), and subshrubs, shrubs, and trees in the Nacunan Re-
serve (Corbalan, 2006). Use of these vegetation layers is asso-
ciated with its ability to climb (Mares, 1977). Our results
show that it perceives the Reserve as homogeneous but the
model yielded a low discrimination. The weak association be-
tween some small mammal species and the microhabitat sup-
ports interpretations that these species might have very
generalized habitat requirements (Coppeto et al., 2006).
l desert mammal distribution to habitat structure in a protected007), doi:10.1016/j.actao.2006.11.002

a c t a o e c o l o g i c a x x x ( 2 0 0 7 ) 1 – 1 1 9
ARTICLE IN PRESS
Although G. griseoflavus has been characterized as a generalist
with great plasticity to occupy different types of environment,
such as xeric habitats, cultivated fields, sandy areas with
rocks, and riparian forests (Redford and Eisenberg, 1992; Gon-
net and Ojeda, 1998), it strongly relates to patches having tree
and grass layers in the grazed area.
Distribution at small scale in E. typus indicates that this
species is associated with sand dune habitats in both areas,
but no variable within these clumps was more explanatory
than the entire habitat. Its morphological characteristics al-
low it to exploit open and sandy habitats (Mares, 1975; Ojeda,
1989; Corbalan, 2004), and its abundance is significantly higher
in grazed areas (Tabeni and Ojeda, 2005). It occurs in areas that
on other continents are occupied by kangaroo rats and gerbils
(Redford and Eisenberg, 1992; Mares, 1975; Shenbrot et al.,
1999) where open microhabitats may allow more unimpeded
mobility, increasing their efficiency in gathering food or re-
ducing their vulnerability to raptors (Waser and Ayers, 2003).
E. typus displays behavioral strategies like foraging close to
cover where predation risk would be lower rather than at
open sites. Because of its lack of cheek pouches, it runs
a greater risk of predation when carrying food; this risk de-
creases when they recover the harvested seeds they have
stored under shrubs (Giannoni et al., 2001).
On comparing the pattern of habitat use in both areas
(ungrazed/grazed), we found that E. typus has similar ecomor-
phological attributes to species occurring in grazed areas in
other deserts, such as Gerbillus paeba (Eccar et al., 2000), Gerbil-
lus gleadowi (Wada et al., 1995), Dipodomys merriami and D. ordii
(Jones and Longland, 1999; Jones et al., 2003; Valone and
Sauter, 2005). In contrast, small mammals associated with
dense cover like A. molinae, and like Perognathus spp. and Chae-
todipus spp. in North America (Jones and Longland, 1999), oc-
cupy undisturbed areas.
Population structure in many vertebrates can respond to
habitat heterogeneity or be independent of it, i.e. be patchily
distributed but not occupy discrete habitat patches (Amarase-
kare, 1994). Our results show that distribution of the studied
species can, to a great extent, be accounted for by environ-
mental heterogeneity. Klaas et al. (2000) found that topo-
graphic variability may be related to the patterns of
distribution of gopher mounds. Other studies, instead, suggest
that part of the demographic variability occurs independently
of habitat structure (Bowman et al., 2000), and that spatial
structure, e.g. in Dipodomys spectabilis, seems not to result
from habitat heterogeneity per se, but from the interaction be-
tween habitat and capacity of dispersal (Amarasekare, 1994).
In our study, part of the variability not explained in the pat-
terns found requires further assessment of factors affecting
the population structure of these species, such as predation,
dispersal and behavior.
In sum, environmental heterogeneity was significant for all
species, and distribution patterns seem to be restricted to hab-
itat availability. Even though population abundance affords
important information on species responses to disturbed
environments, analyses of point patterns reveal a different
type of information that can be used to predict the impact of
disturbances on the native fauna. For example, even those
species that tend to avoid grazed areas find in them suitable
patches available, and although the Reserve provides effective
Please cite this article in press as: Tabeni, S. et al., Linking smaand grazed landscape of the Monte, Argentina, Acta Oecolo. (2
protection to some species, others find their ecological re-
quirements outside.
The two scales analyzed allowed us to detect critical levels
for assessing distribution patterns. We found that, depending
on the species considered, both coarse and fine grain variables
account for the relationship of small mammals with the
environments.
Despite the increased documentation on spatial patterns,
which contributes to the understanding of organism re-
sponses to landscape features, numerous aspects of the natu-
ral history of these species remain poorly studied. These
issues are essential to elucidate the processes producing the
patterns observed, specifically in disturbed environments.
Acknowledgments
Special thanks to Benjamin Bender for helping us do the field-
work and drawing the map, to Nelly Horak for the English ver-
sion of the manuscript, and to Thorsten Wiegand for his
valuable suggestions and critical reading of the manuscript.
This study was partially supported by the SETCyP and CONI-
CET Research Grants PICT 03281 and PIP 02884.
r e f e r e n c e s
Adler, P.B., Lauenroth, W.K., 2000. Livestock exclusion increasesthe spatial heterogeneity of vegetation in Colorado shortgrasssteppe. Appl. Veg. Sci. 3, 213–222.
Adler, P.B., Raff, D.A., Lauenroth, W.K., 2001. The effect of grazingon the spatial heterogeneity of vegetation. Oecologia 128, 465–479.
Amarasekare, P., 1994. Spatial population structure in the banner-tailed kangaroo rat, Dipodomys spectabilis. Oecologia 100, 166–176.
Bowman, J., Forbes, G.J., Dilworth, T.G., 2000. The spatial scale ofvariability in small-mammal populations. Ecography 23, 328–334.
Bowman, J., Forbes, G.J., Dilworth, T.G., 2001. Spatial andtemporal patterns of an irrupting population of deer mice. J.Mammal. 82, 567–572.
Caylor, K.K., Shugart, H.H., Dowty, P.R., Smith, T.M., 2003. Treespacing along the Kalahari transect in southern Africa. J. AridEnviron. 54, 281–296.
Chuvieco, E., 1996. Fundamentos de teledeteccion espacial.Ediciones Rialp, Madrid, Spain.
Contreras, J.R., 1968. Akodon molinae una nueva especie de ratonde campo del sur de la provincia de Buenos Aires. ZoologıaPlatense 1, 9–12.
Coppeto, S.A., Kelt, D.A., Van Vuren, D.D., Wilson, J.A., Bigelow, S.,2006. Habitat associations of small mammals at two spatialscales in the northern Sierra Nevada. J. Mammal. 87, 402–413.
Corbalan, V., 2004. Uso de habitat y ecologıa poblacional de pe-quenos mamıferos del Desierto del Monte central, Mendoza,Argentina. Ph. D. Thesis, Universidad Nacional de La Plata: LaPlata, Buenos Aires, Argentina, 179 pp.
Corbalan, V., 2006. Microhabitat selection by murid rodents in theMonte desert of Argentina. J. Arid Environ. 65, 102–110.
Corbalan, V., Debandi, G., 2006. Microhabitat use by Eligmodontiatypus (Rodentia: Muridae) in the Monte Desert (Argentina).Mamm. Biol. 71, 124–127.
ll desert mammal distribution to habitat structure in a protected007), doi:10.1016/j.actao.2006.11.002

a c t a o e c o l o g i c a x x x ( 2 0 0 7 ) 1 – 1 110
ARTICLE IN PRESS
Corbalan, V., Ojeda, R., 2004. Spatial and temporal organisation ofsmall mammal communities in the Monte desert, Argentina.Mammalia 68, 5–14.
Cressie, N., 1993. Statistics for Spatial Data. John Wiley and Sons,New York, USA.
Eccar, J.A., Walther, R.B., Milton, S.J., 2000. How livestock grazingaffects vegetation structures and small mammal distributionin the semi-arid Karoo. J. Arid Environ. 46, 103–106.
Estrella, H., Boshoven, J., Tognelli, M., 2001. Caracterısticas delclima regional y de la Reserva de Nacunan, in: Claver, S., Roig-Junent, S. (Eds.), El desierto del Monte: La reserva de Biosferade Nacunan. Mendoza, Argentina, pp. 25–33.
Fleischner, T.L., 1994. Ecological cost of livestock grazing inWestern North America. Cons. Biol. 8, 629–644.
Forman, R.T.T., 1995. Land mosaics. The Ecology of Landscapesand Regions. Cambridge University Press.
Giannoni, S.M., Dacar, M., Taraborelli, P., Borghi, C.E., 2001. Seedhoarding by rodents of the Monte Desert, Argentina. Austral.Ecol. 26, 259–263.
Gonnet, J.M., 1998. Impacto del pastoreo sobre poblaciones deaves y mamıferos hervıboros en la region de la Reserva de laBiosfera Nacunan, Mendoza, Argentina. Ph. D. UniversidadNacional de Cordoba, Argentina, 166 pp.
Gonnet, J.M., Ojeda, R.A., 1998. Habitat use by small mammals inthe arid Andean foothills of the Monte Desert of Mendoza,Argentina. J. Arid Environ. 38, 349–357.
Gustafson, E.J., 1998. Quantifying landscape spatial pattern: whatis the state of the art? Ecosystems 1, 143–156.
Holbrook, S.J., 1978. Habitat relationships and coexistence of foursympatric species of Peromyscus in Northwestern New Mexico.J. Mammal. 59, 18–26.
Jones, A.L., Longland, W.S., 1999. Effects of cattle grazing on saltdesert rodent communities. Am. Midl. Nat. 141, 1–11.
Jones, Z.F., Bock, C.E., Bock, J.H., 2003. Rodent communities ina grazed and ungrazed Arizona grassland, and a model ofhabitat relationships among rodents in southwestern grass/shrublands. Am. Midl. Nat. 149, 384–394.
Jorgensen, E.E., 2004. Small mammal use of microhabitat re-viewed. J. Mammal. 85, 531–539.
Keesing, F., Crawford, T., 2001. Impacts of density and largemammals on space use by the pouched mouse (Saccostomusmearnsi) in central Kenya. J. Trop. Ecol. 17, 465–472.
Keitt, T.H., Bjørnstad, O.N., Dixon, P.M., Citron-Pousty, S., 2002.Accounting for spatial pattern when modeling organism-environment interactions. Ecography 25, 616–625.
Klaas, B.A., Moloney, K.A., Danielson, B.J., 2000. The tempo andmode of gopher mound production in a tallgrass prairie rem-nant. Ecography 23, 246–256.
Kotliar, N.B., Wiens, J.A., 1990. Multiple scales of patchiness andpatch structure: a hierarchical framework for the study ofheterogeneity. Oikos 59, 253–260.
Krohne, D.T., Burgin, A.B., 1990. The scale of demographic het-erogeneity in a population of Peromyscus leucopus. Oecologia82, 97–101.
McGarigal, K., Marks, B.J., 1995. FRAGSTATS: spatial patternanalysis program for quantifying landscape structure. USDAFor. Serv. Gen. Tech. Rep. PNW-351.
Mackinnon, J.L., Petty, S.J., Elston, D.A., Thomas, C.J., Sherratt, T.N., Lambin, X., 2001. Scale invariant spatio-temporal patternsof field vole density. J. Anim. Ecol. 70, 101–111.
Maldonado Curti, S., 1990. Impacto del pastoreo sobre microma-mıferos: un estudio comparativo en ambientes semiaridos. MSThesis, Facultad de Ciencias, Universidad de Chile, Chile,101 pp.
Mares, M.A., 1975. South American mammal zoogeography:evidence from convergent evolution in desert rodents. Proc.Natl. Acad. Sci. USA 72, 1702–1706.
Please cite this article in press as: Tabeni, S. et al., Linking smalland grazed landscape of the Monte, Argentina, Acta Oecolo. (2
Mares, M.A., 1977. Water balance and other ecological observa-tions on three species of Phyllotis in north-western Argentina.J. Mammal. 58, 514–520.
Morello, J., 1958. La provincia fitogeografica del Monte. OperaLilloana 2, 1–155.
Ojeda, R.A., 1989. Small mammal responses to fire in the MonteDesert, Argentina. J. Mammal. 70, 416–420.
Ojeda, R.A., Campos, C.M., Gonnet, J.M., Borghi, C.E., Roig, V., 1998.The MaB Reserve of Nacunan, Argentina: its role in under-standing the Monte Desert biome. J. Arid Environ. 39, 299–313.
Orrock, J.L., Pagels, J.F., McShea, W.J., Harper, E.K., 2000. Predict-ing presence and abundance of small mammal species: theeffect of scale and resolution. Ecol. Appl. 10, 1356–1366.
Pelissier, R., Goreaud, F., 2001. A practical approach to the studyof spatial structure in simple cases of heterogeneous vegeta-tion. J. Veg. Sci. 12, 99–108.
Polis, G.A., 1991. Desert communities: an overview of patternsand processes. In: Polis, G.A. (Ed.), The Ecology of DesertCommunities. University of Arizona Press, Tucson, AZ, USA,pp. 1–26.
Price, M.V., 1986. Structure of desert rodent communities: a criti-cal review of questions and approaches. Am. Zool. 26, 39–49.
Redford, K.H., Eisenberg, J.F., 1992. Mammals of the Neotropics.The Southern Cone, Volume 2, Chile, Argentina, Uruguay,Paraguay. University of Chicago Press, Chicago.
Roig, V., 1971. Aportes al inventario de los Recursos NaturalesRenovables de la provincia de Mendoza: La Reserva Forestal deNacunan. Deserta 1, 1–239.
Roig, F.A., Rossi, B., 2001. Flora y vegetacion de la reserva. In:Claver, S., Roig-Junent, S. (Eds.), El desierto del Monte. La res-erva de Biosfera de Nacunan, Mendoza, Argentina, pp. 41–75.
Rosenzweig, M.L., Winakur, J., 1969. Population ecology of desertrodent communities: habitats and environmental complexity.Ecology 50, 558–572.
Schadt, S., Revilla, E., Wiegand, T., Knauer, F., Kaczensky, P.,Breitenmoser, U., Bufka, L., �Cerveny, J., Koubek, P., Huber, T.,Stanisa, C., Trepl, L., 2002. Assessing the suitability of centralEuropean landscapes for the reintroduction of Eurasian linx.J. Appl. Ecol. 39, 189–203.
Shenbrot, G.I., Krasnov, B.R., Rogovin, K.A., 1999. Spatial ecologyof desert rodent communities. Springer, Berlin.
Schooley, R.L., Wiens, J.A., 2001. Dispersion of kangaroo ratmounds at multiple scales in New Mexico, USA. LandscapeEcol. 16, 267–277.
Tabeni, S., Ojeda, R.A., 2003. Assessing mammal responses toperturbations in temperate aridlands of Argentina. J. AridEnviron. 55, 715–726.
Tabeni, S., Ojeda, R.A., 2005. Ecology of the Monte Desert smallmammals in disturbed and undisturbed habitats. J. AridEnviron. 63, 244–255.
Turner, M.G., O’Neil, R.V., Gardner, R.H., Milne, B.T., 1989. Effectsof changing spatial scales on the analysis of landscape pat-tern. Landscape Ecol. 3, 153–162.
Turner, M.G., Tinker, D.B., Gergel, S.E., Chapin, F.S., 2002. Land-scape disturbance. Location, pattern, and dynamics. In:Gergel, S.E., Turner, M.G. (Eds.), Learning Landscape Ecology. APractical Guide to Concepts and Techniques. Springer, NewYork, USA, pp. 147–165.
Valone, T.J., Sauter, P., 2005. Effects of long-term cattle exclosureon vegetation and rodents at a desertified arid grassland site.J. Arid Environ. 61, 161–170.
Wada, N., Narita, K., Kumar, S., Furukawa, A., 1995. Impact ofovergrazing on seed predation by rodents in the Thar desertnorthwestern India. Ecol. Res. 10, 217–221.
Waser, P.M., Ayers, J.M., 2003. Microhabitat use and populationdecline in banner-tailed kangaroo rats. J. Mammal. 84, 1031–1043.
desert mammal distribution to habitat structure in a protected007), doi:10.1016/j.actao.2006.11.002
a c t a o e c o l o g i c a x x x ( 2 0 0 7 ) 1 – 1 1 11
ARTICLE IN PRESS
Wiegand, T., Moloney, K.A., 2004. Rings, circles, and null-modelsfor point pattern analysis in ecology. Oikos 104, 209–229.
Wiens, J.A., 1985. Vertebrate responses to environmental patchi-ness in arid and semiarid ecosystems. In: Pickett, S.T.A.,White, P.S. (Eds.), The Ecology and Natural Disturbance andPatch Dynamics. Academic Press, New York, pp. 169–193.
Wiens, J.A., 1989. Spatial Scaling in Ecology. Funct. Ecol. 4,385–397.
Please cite this article in press as: Tabeni, S. et al., Linking smalland grazed landscape of the Monte, Argentina, Acta Oecolo. (20
Wiens, J.A., 1999. Landscape ecology: scaling from mechanisms tomanagement. In: Farina, A. (Ed.), Perspectives in Ecology.Backhuys Publishers, Leiden, pp. 13–24.
Williams, S.E., Marsh, H., Winter, J., 2001. Spatial scale, speciesdiversity, and habitat structure: small mammals in Australiantropical rain forest. Ecology 83, 1317–1329.
Zar, J.H., 1999. Biostatistical Analysis. Prentice Hall, Upper SaddleRiver, NJ, USA.
desert mammal distribution to habitat structure in a protected07), doi:10.1016/j.actao.2006.11.002