The IMPORTANT framework for analyzing the Impact of Mobility on Performance Of RouTing protocols for...
21
The IMPORTANT framework for analyzing the Impact of Mobility on Performance Of RouTing protocols for Adhoc NeTworks Fan Bai a, * , Narayanan Sadagopan b , Ahmed Helmy a a Department of Electrical Engineering, University of Southern California, Los Angeles, CA 90089, USA b Department of Computer Science, University of Southern California, Los Angeles, CA 90089, USA Abstract A Mobile Ad hoc Network (MANET) is a collection of wireless mobile nodes forming a temporary network without using any existing infrastructure. Since not many MANETs are currently deployed, research in this area is mostly simulation based. Random Waypoint is the commonly used mobility model in these simulations. Random Waypoint is a simple model that may be applicable to some scenarios. However, we believe that it is not sufficient to capture some important mobility characteristics of scenarios in which MANETs may be deployed. Our framework aims to evaluate the impact of different mobility models on the performance of MANET routing protocols. We propose various protocol independent metrics to capture interesting mobility characteristics, including spatial and temporal dependence and geographic restrictions. In addition, a rich set of parameterized mobility models is introduced including Random Waypoint, Group Mobility, Freeway and Manhattan models. Based on these models several Ôtest-suiteÕ scenarios are chosen carefully to span the metric space. We demonstrate the utility of our test-suite by evaluating various MANET routing protocols, including DSR, AODV and DSDV. Our results show that the protocol performance may vary drastically across mobility models and performance rankings of protocols may vary with the mobility models used. This effect can be explained by the interaction of the mobility characteristics with the connectivity graph properties. Finally, we attempt to decompose the reactive routing protocols into mechanistic ‘‘building blocks’’ to gain a deeper insight into the performance variations across protocols in the face of mobility. Ó 2003 Elsevier B.V. All rights reserved. Keywords: Mobile ad hoc network; Performance; Mobility; Routing protocols 1. Introduction A Mobile Ad hoc NETwork (MANET) is a collection of wireless nodes communicating with each other in the absence of any infrastructure. Classrooms, battlefields and disaster relief activi- ties are a few scenarios where MANETs can be used. MANET research is gaining ground due to the ubiquity of small, inexpensive wireless com- municating devices. Since, not many MANETs have been deployed, most of this research is sim- ulation based. These simulations have several pa- rameters including the mobility model and the communicating traffic pattern. In this paper, we * Corresponding author. Tel.: +1-213-740-2685; fax: +1-213- 740-9803. E-mail addresses: [email protected] (F. Bai), [email protected] (N. Sadagopan), [email protected] (A. Helmy). 1570-8705/$ - see front matter Ó 2003 Elsevier B.V. All rights reserved. doi:10.1016/S1570-8705(03)00040-4 Ad Hoc Networks 1 (2003) 383–403 www.elsevier.com/locate/adhoc
-
Upload
independent -
Category
Documents
-
view
0 -
download
0
Transcript of The IMPORTANT framework for analyzing the Impact of Mobility on Performance Of RouTing protocols for...

Ad Hoc Networks 1 (2003) 383–403
www.elsevier.com/locate/adhoc
The IMPORTANT framework for analyzing the Impactof Mobility on Performance Of RouTing protocols
for Adhoc NeTworks
Fan Bai a,*, Narayanan Sadagopan b, Ahmed Helmy a
a Department of Electrical Engineering, University of Southern California, Los Angeles, CA 90089, USAb Department of Computer Science, University of Southern California, Los Angeles, CA 90089, USA
Abstract
AMobile Ad hoc Network (MANET) is a collection of wireless mobile nodes forming a temporary network without
using any existing infrastructure. Since not many MANETs are currently deployed, research in this area is mostly
simulation based. Random Waypoint is the commonly used mobility model in these simulations. Random Waypoint is
a simple model that may be applicable to some scenarios. However, we believe that it is not sufficient to capture some
important mobility characteristics of scenarios in which MANETs may be deployed. Our framework aims to evaluate
the impact of different mobility models on the performance of MANET routing protocols. We propose various protocol
independent metrics to capture interesting mobility characteristics, including spatial and temporal dependence and
geographic restrictions. In addition, a rich set of parameterized mobility models is introduced including Random
Waypoint, Group Mobility, Freeway and Manhattan models. Based on these models several �test-suite� scenarios arechosen carefully to span the metric space. We demonstrate the utility of our test-suite by evaluating various MANET
routing protocols, including DSR, AODV and DSDV. Our results show that the protocol performance may vary
drastically across mobility models and performance rankings of protocols may vary with the mobility models used. This
effect can be explained by the interaction of the mobility characteristics with the connectivity graph properties. Finally,
we attempt to decompose the reactive routing protocols into mechanistic ‘‘building blocks’’ to gain a deeper insight into
the performance variations across protocols in the face of mobility.
� 2003 Elsevier B.V. All rights reserved.
Keywords: Mobile ad hoc network; Performance; Mobility; Routing protocols
1. Introduction
A Mobile Ad hoc NETwork (MANET) is a
collection of wireless nodes communicating with
* Corresponding author. Tel.: +1-213-740-2685; fax: +1-213-
740-9803.
E-mail addresses: [email protected] (F. Bai), [email protected]
(N. Sadagopan), [email protected] (A. Helmy).
1570-8705/$ - see front matter � 2003 Elsevier B.V. All rights reserv
doi:10.1016/S1570-8705(03)00040-4
each other in the absence of any infrastructure.
Classrooms, battlefields and disaster relief activi-
ties are a few scenarios where MANETs can be
used. MANET research is gaining ground due to
the ubiquity of small, inexpensive wireless com-municating devices. Since, not many MANETs
have been deployed, most of this research is sim-
ulation based. These simulations have several pa-
rameters including the mobility model and the
communicating traffic pattern. In this paper, we
ed.
384 F. Bai et al. / Ad Hoc Networks 1 (2003) 383–403
focus on the impact of mobility models on the
performance of MANET routing protocols. We
acknowledge that the communicating traffic pat-
tern also has a significant impact on the routing
protocol performance and merits a study on its
own. However, as in most studies in this area, inorder to isolate the effect of mobility, we fix the
communicating traffic pattern to consist of ran-
domly chosen source–destination pairs with long
enough session times.
Mobility pattern, in many previous studies was
assumed to be Random Waypoint. In the current
network simulator (ns-2) distribution, the imple-
mentation of this mobility model is as follows: atevery instant, a node randomly chooses a desti-
nation and moves towards it with a velocity chosen
uniformly randomly from ½0; Vmax�, where Vmax isthe maximum allowable velocity for every mobile
node [1]. Most of the simulations using the Ran-
dom Waypoint model are based on this standard
implementation. For the rest of the paper, we refer
to this basic implementation as the RandomWaypoint model.
In the future, MANETs are expected to be de-
ployed in myriads of scenarios having complex
node mobility and connectivity dynamics. For
example, in a MANET on a battlefield, the move-
ment of the soldiers will be influenced by the
commander. In a city-wide MANET, the node
movement is restricted by obstacles or maps. Thenode mobility characteristics are very application
specific. Widely varying mobility characteristics
are expected to have a significant impact on the
performance of the routing protocols like DSR [5],
DSDV [6] and AODV [7]. Random Waypoint is a
well-designed and commonly used mobility model,
but we find it is insufficient to capture those
characteristics, such as
1. Spatial dependence of movement among nodes.
2. Temporal dependence of movement of a node
over time.
3. Existence of barriers or obstacles constraining
mobility.
In this study, we focus on the impact of theabove-mentioned mobility characteristics on pro-
tocol performance. While doing so, we propose a
generic framework to systematically analyze the
impact of mobility on the performance of routing
protocols for MANETs. This analysis attempts to
answer the following questions:
1. Whether and to what degree mobility affectsrouting protocol performance?
2. If the answer to 1 is yes, why?
3. If the answer to 1 is yes, how?
To answer Whether, the framework evaluates
the performance of these routing protocols over
different mobility patterns that capture some of the
characteristics listed above. The mobility modelsused in our study include the Random Waypoint,
Group Mobility [8], Freeway and Manhattan. To
answer Why, we propose some protocol indepen-
dent metrics such as mobility metrics and con-
nectivity graph metrics. Mobility metrics aim to
capture some of the aforementioned mobility
characteristics. Connectivity graph metrics aim to
study the effect of different mobility patterns onthe connectivity graph of the mobile nodes. It has
also been observed in previous studies that under a
given mobility pattern, routing protocols like
DSR, DSDV and AODV perform differently [9–
11]. This is possibly because each protocol differs
in the basic mechanisms or ‘‘building blocks’’ it
uses. For example, DSR uses route discovery,
while DSDV uses periodic updates. To answerHow, we want to investigate the effect of mobility
on some of these ‘‘building blocks’’ and how they
impact the protocol performance as a ‘‘whole’’.
In order to conduct our research and answer the
above questions systematically, we propose a
framework for analyzing the Impact of Mobility
on the Performance Of RouTing protocols in
Adhoc NeTworks (IMPORTANT). Through thisframework we illustrate how modeling mobility is
important in affecting routing performance and
understanding the mechanism of ad hoc routing
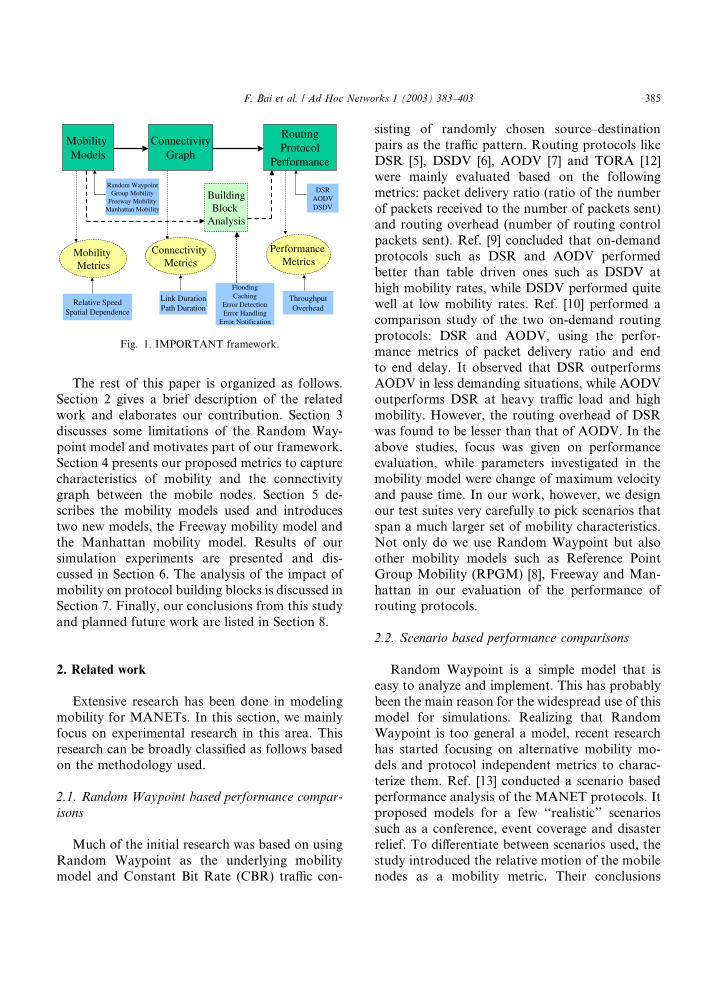
protocols. As shown in Fig. 1, our framework
focuses on the following aspects: mobility models,
the metrics for mobility and connectivity graph
characteristics, the potential relationship between
mobility and routing performance and the analysisof impact of mobility on building blocks of ad hoc
routing protocols.
MobilityModels
MobilityMetrics
ConnectivityGraph
ConnectivityMetrics
Performance Metrics
RoutingProtocol
Performance
Random WaypointGroup Mobility
Freeway MobilityManhattan Mobility
DSRAODVDSDV
Relative SpeedSpatial Dependence
Link DurationPath Duration
ThroughputOverhead
BuildingBlock
Analysis
FloodingCaching
Error DetectionError Handling
Error Notification
Fig. 1. IMPORTANT framework.
F. Bai et al. / Ad Hoc Networks 1 (2003) 383–403 385
The rest of this paper is organized as follows.
Section 2 gives a brief description of the related
work and elaborates our contribution. Section 3
discusses some limitations of the Random Way-
point model and motivates part of our framework.
Section 4 presents our proposed metrics to capture
characteristics of mobility and the connectivity
graph between the mobile nodes. Section 5 de-scribes the mobility models used and introduces
two new models, the Freeway mobility model and
the Manhattan mobility model. Results of our
simulation experiments are presented and dis-
cussed in Section 6. The analysis of the impact of
mobility on protocol building blocks is discussed in
Section 7. Finally, our conclusions from this study
and planned future work are listed in Section 8.
2. Related work
Extensive research has been done in modeling
mobility for MANETs. In this section, we mainly
focus on experimental research in this area. This
research can be broadly classified as follows basedon the methodology used.
2.1. Random Waypoint based performance compar-
isons
Much of the initial research was based on using
Random Waypoint as the underlying mobility
model and Constant Bit Rate (CBR) traffic con-
sisting of randomly chosen source–destination
pairs as the traffic pattern. Routing protocols like
DSR [5], DSDV [6], AODV [7] and TORA [12]
were mainly evaluated based on the following
metrics: packet delivery ratio (ratio of the number
of packets received to the number of packets sent)and routing overhead (number of routing control
packets sent). Ref. [9] concluded that on-demand
protocols such as DSR and AODV performed
better than table driven ones such as DSDV at
high mobility rates, while DSDV performed quite
well at low mobility rates. Ref. [10] performed a
comparison study of the two on-demand routing
protocols: DSR and AODV, using the perfor-mance metrics of packet delivery ratio and end
to end delay. It observed that DSR outperforms
AODV in less demanding situations, while AODV
outperforms DSR at heavy traffic load and high
mobility. However, the routing overhead of DSR
was found to be lesser than that of AODV. In the
above studies, focus was given on performance
evaluation, while parameters investigated in themobility model were change of maximum velocity
and pause time. In our work, however, we design
our test suites very carefully to pick scenarios that
span a much larger set of mobility characteristics.
Not only do we use Random Waypoint but also
other mobility models such as Reference Point
Group Mobility (RPGM) [8], Freeway and Man-
hattan in our evaluation of the performance ofrouting protocols.
2.2. Scenario based performance comparisons
Random Waypoint is a simple model that is
easy to analyze and implement. This has probably
been the main reason for the widespread use of this
model for simulations. Realizing that RandomWaypoint is too general a model, recent research
has started focusing on alternative mobility mo-
dels and protocol independent metrics to charac-
terize them. Ref. [13] conducted a scenario based
performance analysis of the MANET protocols. It
proposed models for a few ‘‘realistic’’ scenarios
such as a conference, event coverage and disaster
relief. To differentiate between scenarios used, thestudy introduced the relative motion of the mobile
nodes as a mobility metric. Their conclusions

386 F. Bai et al. / Ad Hoc Networks 1 (2003) 383–403
about the performance of proactive and reactive
protocols were similar to [9]. Ref. [11] used a
mobility model in which each node computes its
next position based on a probability distribution.
This model does not allow significant changes in
direction between successive instants. It concludedthat proactive protocols perform better than re-
active ones in terms of packet delivery ratio and
end-to-end delay. However, reactive protocols
were seen to incur a lower routing overhead. Ref.
[8] introduced the RPGM model, which is one of
the mobility models used in this study. Rate of link
changes was used to characterize a few group
mobility patterns as well as Random Waypoint. Itobserved that the rate of link change for Random
Waypoint was higher than that for RPGM. From
experiments, it observed that protocols like
AODV, DSDV and HSR [14] perform worse with
Random Waypoint than with RPGM. Thus, it
concluded that mobility models do matter and it is
not sufficient to simulate protocols with only the
‘‘Random Walk’’ like models. Ref. [15] proposed amobility framework that consisted of a Mobility
Vector model which can be used to generate ‘‘re-
alistic’’ movement patterns used in several varied
applications. It proposed the Displacement Mea-
sure that is a normalization of the actual distance
traveled by the geographic displacement as a
metric to evaluate the different movement patterns
including those generated by Random Waypoint,Random Walk, RPGM and Mobility Vector
models. By experiments, it observed that Random
Waypoint and Random Walk produced higher
Displacement Measure as compared to the Mo-
bility Vector model. It studied the effect of trans-
mission range on throughput across different
mobility models and concluded that as the trans-
mission range is increased, the rate of link changesdecreased and the throughput for all protocols
increased. However, the link change rate does not
seem to vary greatly across the different mobility
models. As far as routing overhead was concerned,
Mobility Vector was seen to produce a worse
overhead than Random Waypoint. Our study is
also framework based. However, we do not aim
to provide a generic mobility model from whichall ‘‘realistic’’ mobility patterns can be derived.
Rather, our framework aims at systematically
studying the effect of mobility per se on perfor-
mance of MANET routing protocols. The contri-
butions of our proposed framework are threefold:
1. Focus on mobility characteristics such as spatial
dependence, geographic restrictions and tempo-ral dependence. Define mobility metrics that
capture these characteristics. Choose mobility
models that span the metric space and use them
to evaluate the performance of routing proto-
cols.
2. Define connectivity graph metrics. Study the in-
teraction of mobility metrics and connectivity
graph metrics and its effect on protocol perfor-mance.
3. Analyze the reasons for the differences in proto-
col performance as a ‘‘whole’’ by investigating
the effect of mobility on ‘‘parts’’ that build the
protocol.
3. Limitations of Random Waypoint
Random Waypoint model was introduced in [9]
and is among the most commonly used mobility
models in the MANET research community. In
this model, at every instant, each mobile node
chooses a random destination and moves towards
it with a speed uniformly distributed in ½0; Vmax�,where Vmax is the maximum allowable speed for anode. After reaching the destination, the node
stops for a duration defined by the ‘‘pause time’’
parameter. After this duration, it again chooses a
random destination and repeats the whole process
again until the simulation ends.
The Random Waypoint model is widely ac-
cepted mainly due to its simplicity of implemen-
tation and analysis. However, we observe that thebasic Random Waypoint model as used in most of
the simulations is insufficient to capture the fol-
lowing mobility characteristics:
1. Temporal dependency: Due to physical con-
straints of the mobile entity itself, the velocity
of mobile node will change continuously and
gently instead of abruptly, i.e. the current veloc-ity is dependent on the previous velocity. How-
ever, intuitively, the velocities at two different

F. Bai et al. / Ad Hoc Networks 1 (2003) 383–403 387
time slots are independent in the Random Way-
point model.
2. Spatial dependency: The movement pattern of a
mobile node may be influenced by and corre-
lated with nodes in its neighborhood. In Ran-dom Waypoint, each mobile node moves
independently of others.
3. Geographic restrictions: In many cases, the
movement of a mobile node may be restricted
along the street or a freeway. A geographic
map may define these boundaries.
In our study, we focus on the above-mentionedcharacteristics. In the next section, we formally
define metrics to capture some of these character-
istics.
4. Metrics
To quantitatively and qualitatively analyze theimpact of mobility on routing protocol perfor-
mance, we make use of several protocol indepen-
dent metrics and protocol performance metrics.
The protocol independent metrics attempt to ex-
tract the characteristics of mobility and the con-
nectivity graph between the mobile nodes. These
metrics are then used to explain the impact of
mobility on the protocol performance metrics.Those metrics can be broadly classified as
1. Mobility metrics.
2. Connectivity graph metrics.
3. Protocol performance metrics.
4.1. Terminology
Before formally defining the metrics, we intro-
duce some basic terminology that will be used later
in the paper:
1. Vi!ðtÞ: velocity vector of node i at time t.
2. jVi!ðtÞj: speed of node i at time t.
3. hiðtÞ: angle made by Vi!ðtÞ at time t with the X -
axis.4. ai!ðtÞ: acceleration vector of node i at time t.5. xiðtÞ: X co-ordinate of node i at time t.6. yiðtÞ: Y co-ordinate of node i at time t.
7. Di;jðtÞ: Euclidean distance between nodes i andj at time t.
8. RDð~aaðtÞ;~bbðt0ÞÞ: relative direction (RD) (or
cosine of the angle) between the two vectors
~aaðtÞ, ~bbðt0Þ is given by ~aaðtÞ�~bbðt0Þj~aaðtÞjj~bbðt0Þj.
9. SRð~aaðtÞ;~bbðt0ÞÞ: speed ratio (SR) between the
two vectors ~aaðtÞ, ~bbðt0Þ is given by min j~aaðtÞj;j~bbðt0Þjmax j~aaðtÞj;j~bbðt0Þj.
10. R: transmission range of a mobile node.11. N : number of mobile nodes.12. T : simulation time.13. randomð Þ: returns a value uniformly distrib-
uted in the interval [)1, 1].
4.2. Mobility metrics
We propose these metrics to differentiate the
various mobility patterns used in our study. The
basis of differentiation is the extent to which a
given mobility pattern captures the characteristics
of spatial dependence, temporal dependence andgeographic restrictions. In addition to these me-
trics, we also use the relative speed metric that
differentiates mobility patterns based on relative
motion. This metric was proposed in [13].
1. Degree of spatial dependence: It is a measure of
the extent of similarity of the velocities of two
nodes that are not too far apart. Formally,
Dspatialði; j; tÞ ¼ RDð vi!ðtÞ; vj!ðtÞÞ SRð vi!ðtÞ; vj!ðtÞÞ:
The value of Dspatialði; j; tÞ is high when thenodes i and j travel in more or less the samedirection and at almost similar speeds. How-
ever, Dspatialði; j; tÞ decreases if the relative di-rection or the speed ratio decreases.
As it is rare for a node�s motion to be spatiallydependent on a far off node, we add the con-
dition that
Di;jðtÞ > c1 R ) Dspatialði; j; tÞ ¼ 0;
where c1 > 0 is a constant which will be deter-
mined during our experiments in 6.
Average degree of spatial dependence: It is the
value of Dspatialði; j; tÞ averaged over node pairsand time instants satisfying certain condition.
Formally,

388 F. Bai et al. / Ad Hoc Networks 1 (2003) 383–403
Dspatial ¼PT
t¼1PN
i¼1PN
j¼iþ1 Dspatialði; j; tÞP
;
where P is the number of tuples ði; j; tÞ such thatDspatialði; j; tÞ 6¼ 0. Thus, if mobile nodes move
independently of one another, then the mobility
pattern is expected to have a smaller value for
Dspatial. On the other hand, if the node move-ment is co-ordinated by a central entity, or in-
fluenced by nodes in its neighborhood, such
that they move in similar directions and at
similar speeds, then the mobility pattern is ex-
pected to have a higher value for Dspatial.
2. Degree of temporal dependence: It is a measure
of the extent of similarity of the velocities of a
node at two time slots that are not too far apart.It is a function of the acceleration of the mobile
node and the geographic restrictions. Formally,
Dtemporalði; t; t0Þ ¼ RDð vi!ðtÞ; vi!ðt0ÞÞ SRð vi!ðtÞ; vi!ðt0ÞÞ:
The value of Dtemporalði; t; t0Þ is high when the
node travels in more or less the same direction
and almost at the same speed over a certain
time interval that can be defined. However,
Dtemporalði; t; t0Þ decreases if the relative directionor the speed ratio decreases.
Arguing in a way similar to that forDspatialði; j; tÞ, we have the following conditionjt � t0j > c2 ) Dtemporalði; t; t0Þ ¼ 0;
where c2 > 0 is a constant which will be deter-
mined during our experiments in Section 6.
Average degree of temporal dependence: It is the
value of Dtemporalði; t; t0Þ averaged over nodesand time instants satisfying certain condition.
Formally,
Dtemporal ¼PN
i¼1PT
t¼1PT
t0¼1 Dtemporalði; t; t0ÞP
;
where P is the number of tuples ði; t; t0Þ suchthat Dtemporalði; t; t0Þ 6¼ 0 Thus, if the current ve-locity of a node is completely independent of its
velocity at some previous time step, then the
mobility pattern is expected to have a smaller
value for Dtemporal. However, if the current ve-
locity is strongly dependent on the velocity at
some previous time step, then the mobility
pattern is expected to have a higher value for
Dtemporal.
3. Relative speed (RS): We use the standard defi-
nition from physics, i.e.
RSði; j; tÞ ¼ jVi!ðtÞ � VjðtÞ
��!j:
As in the case of Dspatialði; j; tÞ, we add the fol-lowing condition:
Di;jðtÞ > c3 R ) RSði; j; tÞ ¼ 0;
where c3 > 0 is a constant which will be deter-
mined during our experiments in 6.
Average relative speed: It is the value of
RSði; j; tÞ averaged over node pairs and timeinstants satisfying certain condition. Formally,
RS ¼PN
i¼1PN
j¼1PT
t¼1 RSði; j; tÞP
;
where P is the number of tuples ði; j; tÞ such thatRSði; j; tÞ 6¼ 0.
4. Geographic restrictions: For this metric, we de-
veloped the notion of degree of freedom of
points on a map. Degree of freedom of a point
is the number of directions a node can go after
reaching that point, but currently we do nothave a good way of quantitatively aggregating
this definition for the whole map. Thus, we do
not quantitatively define the geographic restric-
tions, but we qualitatively include it in our
study as will be seen in Section 5.
4.3. Connectivity graph metrics
Since routing protocol performance is in gen-
eral affected by the network topology dynamics,
we feel that it is useful to have metrics to analyze
the effect of mobility on the connectivity graph
between the mobile nodes. The connectivity graph
metrics aim to study this effect. These metrics
might also help in relating mobility metrics with
protocol performance, which will be shown inSection 6.
The connectivity graph is the graph G ¼ ðV ;EÞ,such that jV j ¼ N and at time t, a link ði; jÞ 2 E iffDi;jðtÞ6R. Let X ði; j; tÞ be an indicator random
variable which has a value 1 iff there is a link be-
tween nodes i and j at time t. X ði; jÞ ¼ maxTt¼1

F. Bai et al. / Ad Hoc Networks 1 (2003) 383–403 389
X ði; j; tÞ be an indicator random variable which is
1 if a link existed between nodes i and j at any timeduring the simulation, 0 otherwise.
1. Number of link changes: Number of link
changes for a pair of nodes i and j is the numberof times the link between them transitions from
‘‘down’’ to ‘‘up’’. Formally,
LCði; jÞ ¼XTt¼1
Cði; j; tÞ;
where Cði; j; tÞ is an indicator random variable
such that Cði; j; tÞ ¼ 1 iff X ði; j; t � 1Þ ¼ 0 andX ði; j; tÞ ¼ 1 i.e. if the link between nodes i andj is down at time t � 1, but comes up at time t.Average number of link changes: It is the value
of LCði; jÞ averaged over node pairs satisfyingcertain condition. Formally,
LC ¼PN
i¼1PN
j¼iþ1 LCði; jÞP
;
where P is the number of pairs i, j such thatX ði; jÞ 6¼ 0.
2. Link duration: For two nodes i and j, at time t1,duration of the link ði; jÞ is the length of the
longest time interval ½t1; t2� during which the
two nodes are within the transmission range
of each other. Moreover these two nodes are
not within the transmission range at time
t1 � � and time t2 þ � for � > 0. Formally,
LDði; j; t1Þ ¼ t2 � t1
iff 8t t16 t6 t2, � > 0 : X ði; j; tÞ ¼ 1 and
X ði; j; t1 � �Þ ¼ 0 and X ði; j; t2 þ �Þ ¼ 0. Other-
wise, LDði; j; t1Þ ¼ 0.
Average link duration: It is the value of LDði; jÞaveraged over all existing links for node pairs
satisfying certain condition. Formally,
LD ¼PT
t1¼0PN
i¼1PN
j¼iþ1 LDði; j; t1ÞP
;
where P is the number of tuples ði; j; t1Þ suchthat LDði; j; t1Þ 6¼ 0.
3. Path duration: For a path P ¼ fn1; n2; . . . nkg,consisting of k nodes, at time t1, path durationis the length of the longest time interval ½t1; t2�,during which each of the k � 1 links between
the nodes exist. Moreover, at time t1 � � and
time t2 þ �, � > 0, at least one of the k links doesnot exist. Thus, path duration is limited by the
duration of the links along its path. Specifically,
at time t1, path duration is the minimum of the
durations of the k � 1 links ðn1; n2Þ; ðn2; n3Þ; . . . ;ðnk�1; nkÞ at time t1. Formally,PDðn1; nk; t1Þ ¼ min
16 z6 k�1LDðnz; nzþ1; t1Þ;
that is, PDðn1; nk; t1Þ is the shortest path dura-tion between node n1 and node nk at time t1.Average path duration: It is the value of
PDðn1; nk; t1Þ averaged over all existing paths
for node pairs satisfying certain condition.Formally,
PD ¼PT
t1¼0PN
n1¼1PN
nk¼n1þ1 PDðn1; nk; t1ÞP
;
where P is the number of tuples ðn1; nk; t1Þ suchthat PDðn1; nk; t1Þ 6¼ 0.
4. Path availability: It is the fraction of time dur-
ing which a path is available between two nodes
i and j. The node pairs of interest are the onesthat have communication traffic between them.
Formally,
PAði; jÞ ¼PT
t¼startði;jÞAði;j;tÞ
T�startði;jÞ if T � startði; jÞ> 0;
0 otherwise;
(
ð1Þwhere Aði; j; tÞ is an indicator random variable
which has a value 1 if a path is available from
node i to node j at time t, and has a value 0otherwise. startði; jÞ is the time at which the
communication traffic between nodes i and jstarts.
Average path availability: It is the value of
PAði; jÞ averaged over node pairs satisfyingcertain condition. Formally,
PA ¼PN
i¼1PN
j¼iþ1 PAði; jÞP
;
where P is the number of pairs i, j such thatT � startði; jÞ > 0.
4.4. Protocol performance metrics
We evaluate the performance of the MANET
routing protocols using the metrics of throughput
390 F. Bai et al. / Ad Hoc Networks 1 (2003) 383–403
(ratio of the number of packets delivered to
the number of packets sent) and routing over-
head (number of routing control packets sent) as
done in several previous studies in this area of
research.
(a)
(b)
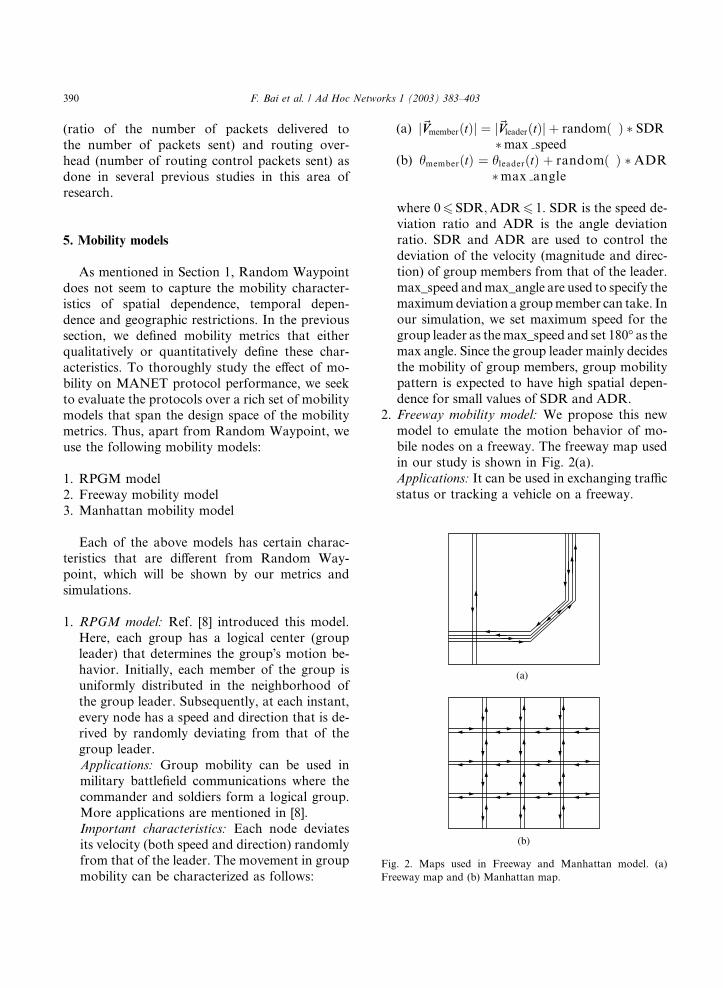
Fig. 2. Maps used in Freeway and Manhattan model. (a)
Freeway map and (b) Manhattan map.
5. Mobility models
As mentioned in Section 1, Random Waypoint
does not seem to capture the mobility character-
istics of spatial dependence, temporal depen-
dence and geographic restrictions. In the previous
section, we defined mobility metrics that eitherqualitatively or quantitatively define these char-
acteristics. To thoroughly study the effect of mo-
bility on MANET protocol performance, we seek
to evaluate the protocols over a rich set of mobility
models that span the design space of the mobility
metrics. Thus, apart from Random Waypoint, we
use the following mobility models:
1. RPGM model
2. Freeway mobility model
3. Manhattan mobility model
Each of the above models has certain charac-
teristics that are different from Random Way-
point, which will be shown by our metrics and
simulations.
1. RPGM model: Ref. [8] introduced this model.
Here, each group has a logical center (group
leader) that determines the group�s motion be-havior. Initially, each member of the group is
uniformly distributed in the neighborhood of
the group leader. Subsequently, at each instant,
every node has a speed and direction that is de-rived by randomly deviating from that of the
group leader.
Applications: Group mobility can be used in
military battlefield communications where the
commander and soldiers form a logical group.
More applications are mentioned in [8].
Important characteristics: Each node deviates
its velocity (both speed and direction) randomlyfrom that of the leader. The movement in group
mobility can be characterized as follows:
(a) j~VVmemberðtÞj ¼ j~VVleaderðtÞj þ randomð Þ SDRmax speed
(b) hmemberðtÞ ¼ hleaderðtÞ þ randomð Þ ADRmax angle
where 06 SDR;ADR6 1. SDR is the speed de-
viation ratio and ADR is the angle deviation
ratio. SDR and ADR are used to control the
deviation of the velocity (magnitude and direc-
tion) of group members from that of the leader.
max_speed andmax_angle are used to specify the
maximumdeviation a groupmember can take. In
our simulation, we set maximum speed for thegroup leader as themax_speed and set 180� as themax angle. Since the group leader mainly decides
the mobility of group members, group mobility
pattern is expected to have high spatial depen-
dence for small values of SDR and ADR.
2. Freeway mobility model: We propose this new
model to emulate the motion behavior of mo-
bile nodes on a freeway. The freeway map usedin our study is shown in Fig. 2(a).
Applications: It can be used in exchanging traffic
status or tracking a vehicle on a freeway.
F. Bai et al. / Ad Hoc Networks 1 (2003) 383–403 391
Important characteristics: In this model we use
maps. There are several freeways on the map
and each freeway has lanes in both directions.
The differences between Random Waypoint and
Freeway are the following:
(a) Each mobile node is restricted to its lane on
the freeway.
(b) The velocity of mobile node is temporally
dependent on its previous velocity.
(c) If two mobile nodes on the same freeway
lane are within the safety distance (SD),
the velocity of the following node cannot
exceed the velocity of preceding node.
The inter-node and intra-node relationships
involved are:
(a) jVi!ðt þ 1Þj ¼ jVi
!ðtÞj þ randomð Þ jai!ðtÞj(b) 8i; 8j; 8t Di;jðtÞ6 SD) jVi
!ðtÞj6 jVj!ðtÞj, if j
is ahead of i in its lane.
Due to the above relationships, the Freewaymobility pattern is expected to have spatial de-
pendence and high temporal dependence. It also
imposes strict geographic restrictions on the
node movement by not allowing a node to
change its lane.
3. Manhattan mobility model: We introduce the
Manhattan model to emulate the movement
pattern of mobile nodes on streets defined bymaps. The Manhattan map used in our study
is shown in Fig. 2(b).
Applications: It can be useful in modeling
movement in an urban area where a pervasive
computing service between portable devices is
provided.
Important characteristics: Maps are used in this
model too. The map is composed of a numberof horizontal and vertical streets. Each street
has two lanes for each direction (north and
south direction for vertical streets, east and
west for horizontal streets). The mobile node is
allowed to move along the grid of horizontal
and vertical streets on the map. At an inter-
section of a horizontal and a vertical street, the
mobile node can turn left, right or go straight.This choice is probabilistic: the probability of
moving on the same street is 0.5, the probability
of turning left is 0.25 and the probability of
turning right is 0.25.
The velocity of a mobile node at a time slot is
dependent on its velocity at the previous timeslot. Also, a node�s velocity is restricted by thevelocity of the node preceding it on the same
lane of the street. The inter-node and intra-
node relationships involved are the same as in
the Freeway model.
Thus, the Manhattan mobility model is also
expected to have high spatial dependence and
high temporal dependence. It too imposesgeographic restrictions on node mobility.
However, it differs from the Freeway model
in giving a node some freedom to change its
direction.
Most of the mobility models mentioned above
are parameterized. E.g. SDR and ADR are some
of the parameters used in RPGM, while maps areimportant parameters in the Freeway and Man-
hattan models. Although we did not quantitatively
define geographic restrictions in Section 4, we
qualitatively include them in our study by using
the Freeway and Manhattan models. Using a pa-
rameterized approach, we aim to get a good cov-
erage of the design space of the proposed mobility
metrics by producing a rich set of mobility pat-terns that can be used as a ‘‘test-suite’’ for further
research.
6. Experiments
As a first step, we wanted to validate if our
proposed metrics differentiate the mobility models.Once this was done, we focused on answering
the following questions: Whether mobility affects
protocol performance?, if yes, we attempt to an-
swer the questions Why? and How? mentioned in
Section 1.
6.1. Validating the mobility metrics
Our mobility scenario generator produced the
different mobility patterns following the RPGM,
Freeway and Manhattan models according to the

392 F. Bai et al. / Ad Hoc Networks 1 (2003) 383–403
format required by ns-2. In all these patterns, 40
mobile nodes moved in an area of 1000 m · 1000 mfor a period of 900 s. Random Waypoint mobility
pattern was generated using the setdest tool which
is a part of the ns-2 distribution. For RPGM, we
used two different mobility scenarios: single groupof 40 nodes and four groups of 10 nodes each
moving independently of each other and in an
overlapping fashion. Both speed deviation ratio
(SDR) and angle deviation ratio (ADR) were set
to 0.1. For the Freeway and Manhattan models,
the nodes were placed on the freeway lanes or local
streets randomly in both directions initially. Their
movement was controlled as per the specificationsof the models. If a node moves beyond the
boundary of the area it is re-inserted at the be-
ginning position in a randomly chosen lane in the
area. The maximum speed Vmax was set to 1, 5, 10,20, 30, 40, 50 and 60 m/s to generate different
movement patterns for the same mobility model.
On evaluating these patterns with our mobility
metrics, we observed that some of the metrics wereable to differentiate between the mobility patterns
based on the characteristics we focused on, while
the others failed.
Average relative speed (RS): We experimentedwith different values of the constant c3 mentionedin Section 4. For the value of c3 ¼ 2, RS could
differentiate between the different mobility pat-
terns very clearly. As seen in Fig. 3, RS has thelowest value for RPGM (single group and multiple
0 10 20 30 40 50 60Maximum Speed (m/sec)
0
10
20
30
40
50
Ave
rage
Rel
ativ
e Sp
eed
(m/s
ec)
Random WaypointRPGM (Single Group)RPGM (4 Groups)FreewayManhattan
Fig. 3. Average relative speed.
group mobility) as the nodes move together in a
co-ordinated fashion with little deviation, while it
has a medium value for Random Waypoint. Its
value for the Freeway and Manhattan mobility
patterns is the highest and almost twice that for
Random Waypoint. This high value is because ofthe movement in opposite direction for both
Freeway and Manhattan mobility patterns.
Average degree of spatial dependence (Dspatial):
We experimented with different values of the
constant c1 mentioned in Section 4. For the valueof c1 ¼ 2, Dspatial could differentiate between the
different mobility patterns very clearly. As seen in
Fig. 4, Dspatial has a higher value for single groupmobility (around 0.5) than that of multiple group
mobility (about 0.35). However, for the Random
Waypoint, Manhattan and Freeway, its value is
almost 0. Intuitively, in RPGM, the group leader
controls the movement of the mobile node and
thus the mobility pattern has a high spatial de-
pendence. Initially, we expected the Freeway and
Manhattan mobility patterns to have a high spatialdependence as a node�s movement is influenced bynodes before it in the lane. Due to the use of lanes
in opposite directions in the map, the positive de-
gree of spatial dependence of a node with nodes in
the same direction cancels the negative degree of
spatial dependence of the node with nodes travel-
ing in the opposite direction.
Average degree of temporal dependence
(Dtemporal): This metric could not differentiate be-
0 10 20 30 40 50 60Maximum Speed (m/sec)
0
0.05
0.1
0.15
0.2
0.25
0.3
0.35
0.4
0.45
0.5
0.55
Ave
rage
Deg
ree
of S
patia
l Dep
ende
nce
Random WaypointRPGM (Single Group)RPGM (4 groups)FreewayManhattan
Fig. 4. Average degree of spatial dependence.

F. Bai et al. / Ad Hoc Networks 1 (2003) 383–403 393
tween the various mobility patterns used in our
study. The usefulness of this metric is still under
investigation.
In summary, RS and Dspatial are found to be
useful mobility metrics in our study. Figs. 3 and 4
show that for each of these metrics, we had sce-narios with relatively low values, medium values
and relatively high values. Similarly, for geo-
graphic restrictions, the Freeway does not allow a
node to change directions as freely as the Man-
hattan model. So, we believe that our ‘‘test-suite’’
has given a reasonably good coverage of the mo-
bility metric space.
6.2. Validating the connectivity graph metrics
To study the effect of mobility on the connec-
tivity graph, we evaluated the connectivity graphs
resulting from the mobility patterns used in Sec-
tion 6.1. We had the following observations about
the connectivity graph metrics:
Average link duration (LD): As seen in Fig. 5,LD has a higher value for single group and mul-
tiple groups than Random Waypoint. For the
Freeway and Manhattan its value is similar to
RandomWaypoint or even worse. Since nodes in a
group move at velocities that are deviated by a
small fraction from the group leader, an already
existing link between two nodes is expected to have
a higher duration. The low value for the Freewayand Manhattan may be because of the opposite
direction of motion and high relative speeds.
0 10 20 30 40 50 60Maximum Speed (m/sec)
0
200
400
600
800
1000
Ave
rage
Lin
k D
urat
ion
(sec
)
Random WaypointRPGM (Single Group)RPGM (Multiple Groups)FreewayManhattan
Fig. 5. Average link duration.
Average path duration (PD): The path durationis counted as the interval between the time when
the path is set up and the time when the path is
broken. However, there can be potentially expo-
nential paths between any specific source–desti-
nation pair. Analyzing the duration of all thesepaths might not be feasible. As a reasonable ap-
proximation, we define the path duration as the
duration of the shortest path. The shortest path
between the source and the destination is com-
puted by the Breadth First Search (BFS) algorithm
[19]. Similar to LD, as shown in Fig. 6, RPGM
(single group and multiple groups) has a higher
PD value than Random Waypoint. The PD valuesfor Manhattan and Freeway are similar to or
slightly lower than Random Waypoint. Since each
path is composed of several links, it is likely that
the behavior of path duration will be determined
by the behavior of link duration.
Average number of link changes (LC): Thismetric was not able to differentiate between the
several mobility patterns used in our study.Average path availability (PA): We use the BFS
algorithm [19] on the snapshots of the network to
calculate whether a path between a specific source–
destination pair exists. For RPGM (single group),
RPGM (mutiple group), Random Waypoint,
Freeway and Manhattan models, PA is found to
be around 100%, 92%, 97%, 99% and 95% re-
spectively. In most cases, a path is available atleast 95% of the time. Thus, the difference across
the models was too small to be of any help.
0 10 20 30 40 50 60Maximum Speed (m/sec)
0
200
400
600
800
1000
Ave
rage
Pat
h D
urat
ion
(sec
)
Random WaypointRPGM(single group)RPGM(multiple groups)FreewayManhattan
Fig. 6. Average path duration.
0 10 20 30 40 50 60
Maximum Speed (m/sec)
50
60
70
80
90
100
Thr
ough
put (
%)
Random WaypointRPGM (Single Group)RPGM (4 Groups)FreewayManhattan
0
20000
40000
60000
80000
Rou
ting
Ove
rhea
d (p
acke
ts)
Random WaypointRPGM (Single Group)RPGM (4 Groups)FreewayManhattan
0 10 20 30 40 50 60Maximum Speed (m/sec)
(a)
(b)
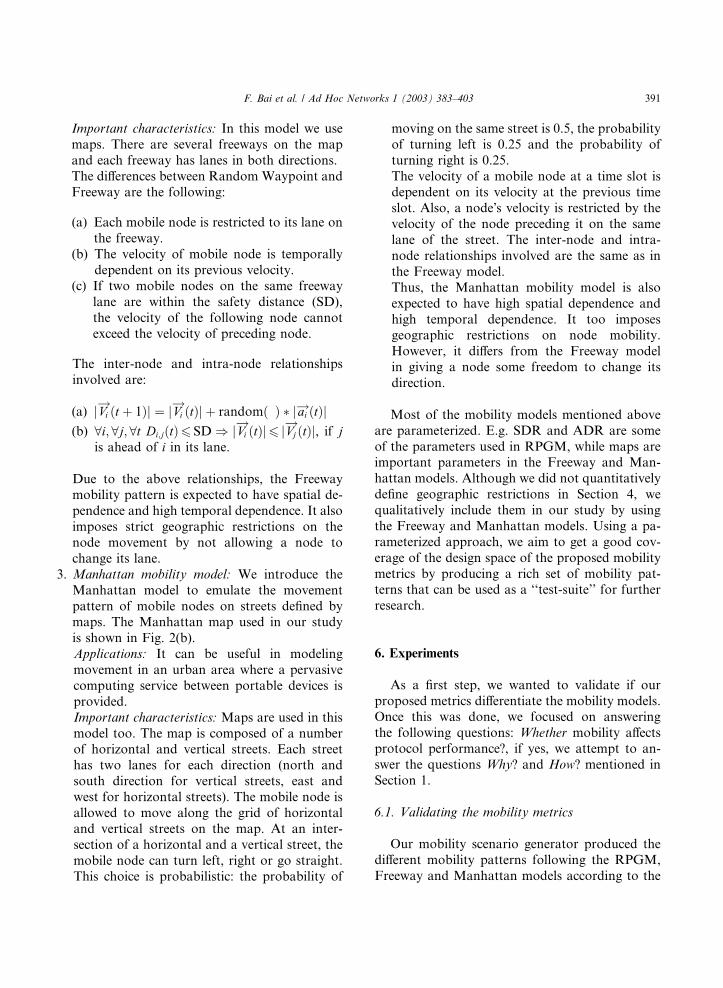
Fig. 7. DSR protocol performance across mobility models.
(a) Throughput and (b) routing overhead.
394 F. Bai et al. / Ad Hoc Networks 1 (2003) 383–403
In summary, LD and PD are found to be useful
metrics to differentiate the connectivity graph
arising from the different mobility patterns used in
our study.
6.3. Whether mobility affects protocol performance?
To evaluate the effect of mobility on the per-
formance of protocols, we carried out simulations
in the network simulator (ns-2) environment with
the CMU Wireless Ad Hoc networking extension.
The transmission range of the nodes was 250 m.
The mobility patterns used were the same as those
used to Section 6.1. The traffic pattern was gen-erated by the cbrgen tool that is part of ns-2 dis-
tribution. The traffic consisted of 20 CBR sources
and 30 connections. The source–destination pairs
were chosen at random. The data rate used was 4
packets/s and the packet size was 64 bytes.
To remove any effects due to randomness of the
traffic pattern, we used different random seeds to
generate three different traffic patterns having thesame number of sources and connections. The re-
sults for each model (for a given Vmax) are averagedover simulation runs using these three different
traffic patterns.
We evaluated the performance of DSR, AODV
and DSDV across this rich set of mobility models
and observed that the mobility models may dras-
tically affect protocol performance. We use DSRas an illustrative example.
DSR shows a difference of almost 40% in
throughput from Manhattan to the RPGM (single
group) model as seen from Fig. 7(a).
Also, there is an order of magnitude difference in
the routing overhead of DSR across the various
models as shown by Fig. 7(b). Similar performance
differences were observed for other protocols usedin our study. We observed that DSR, DSDV and
AODV achieve the highest throughput and the
least overhead with RPGM and incur high over-
head and low throughput with both Freeway and
Manhattan models. This is consistent with the
observations made in [8] which evaluated the pro-
tocols using Random Waypoint and several other
group mobility applications. However, we take astep further and attempt to analyze the reason for
this performance difference in Section 6.4.
Relative performance of protocols across mobility
models: In this part, we investigated the effect of
mobility on relative rankings of protocol perfor-
mance.As shown inFigs. 8(a), 9(a), 10(a), 11(a), and
12(a), DSR seems to produce the highest through-
put inmost cases, whileAODVseems to outperformDSR (by almost 31%) in the Manhattan model. As
seen from Figs. 9(a) and 12(a), the relative ranking
of AODV and DSDV in terms of throughput seems
to depend on the underlying mobility model.
Also, DSR incurs the least routing overhead in
most cases, while DSDV has a lower overhead
than DSR in the Freeway and Manhattan models
as shown in Figs. 11(b) and 12(b). The relativeranking of DSR and DSDV in terms of routing
overhead seems to depend on the underlying mo-
bility model as shown in Figs. 8(b), 9(b), 10(b),
11(b), and 12(b).
0 10 20 30 40 50 60Maximum Speed (m/sec)
50
60
70
80
90
100
Thr
ough
put (
%)
DSDVAODVDSR
0 10 20 30 40 50 60Maximum Speed (m/sec)
0
25000
50000
75000
1e+05
1.25e+05
1.5e+05
Rou
ting
Ove
rhea
d (p
acke
ts) DSDV
AODVDSR
(a)
(b)
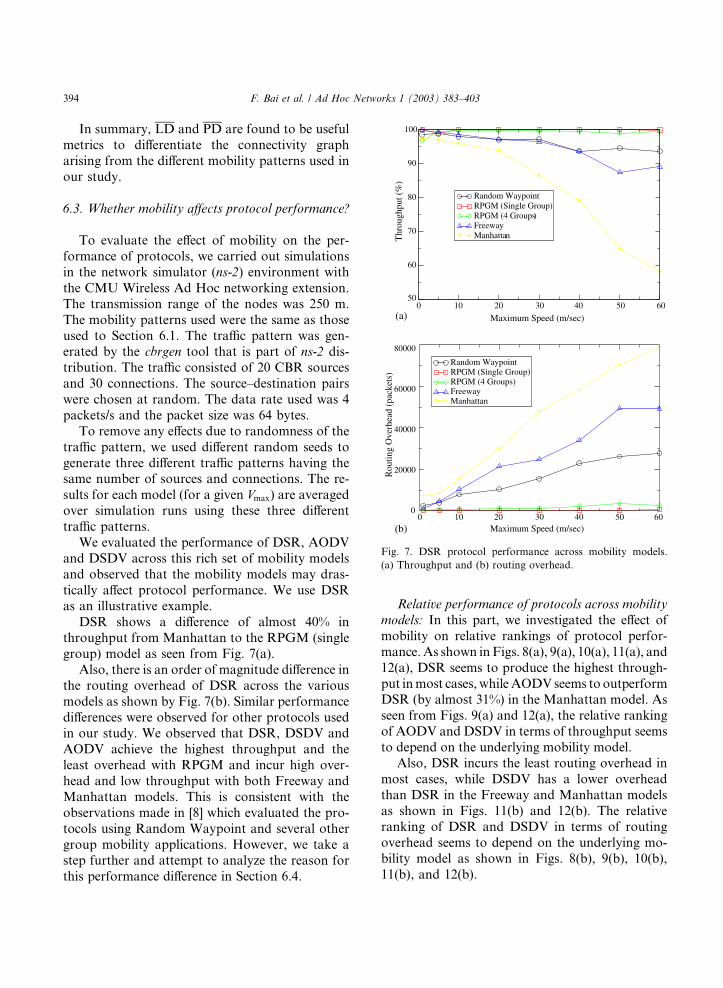
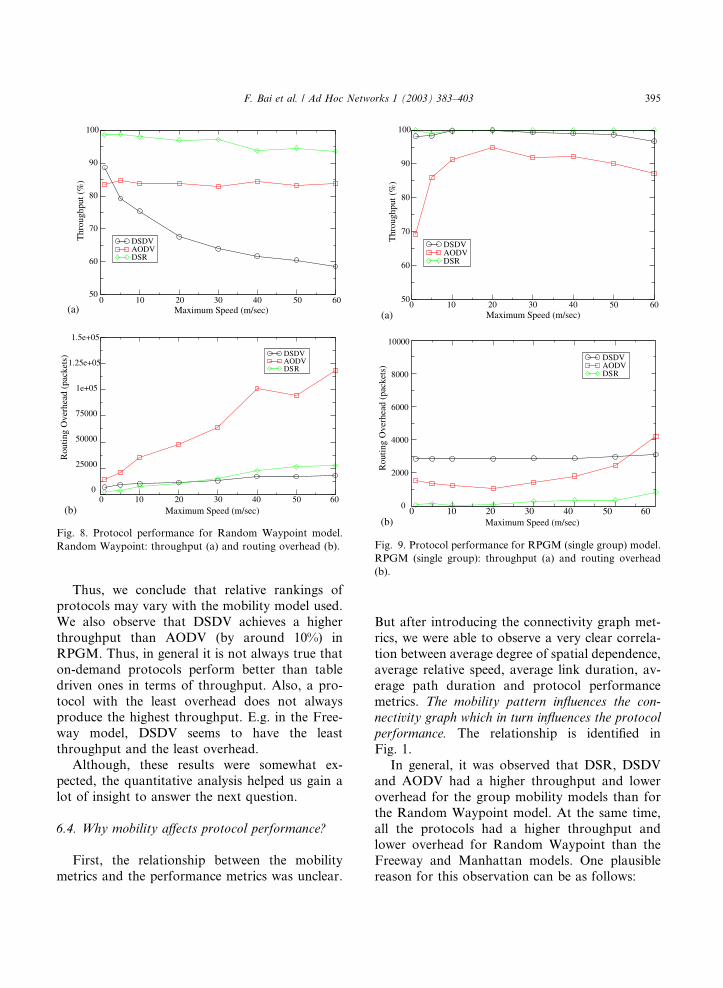
Fig. 8. Protocol performance for Random Waypoint model.
Random Waypoint: throughput (a) and routing overhead (b).
0 10 20 30 40 50 60Maximum Speed (m/sec)
50
60
70
80
90
100
Thr
ough
put (
%)
DSDVAODVDSR
0
2000
4000
6000
8000
10000
Rou
ting
Ove
rhea
d (p
acke
ts)
DSDVAODVDSR
0 10 20 30 40 50 60Maximum Speed (m/sec)
(a)
(b)
Fig. 9. Protocol performance for RPGM (single group) model.
RPGM (single group): throughput (a) and routing overhead
(b).
F. Bai et al. / Ad Hoc Networks 1 (2003) 383–403 395
Thus, we conclude that relative rankings of
protocols may vary with the mobility model used.
We also observe that DSDV achieves a higher
throughput than AODV (by around 10%) in
RPGM. Thus, in general it is not always true that
on-demand protocols perform better than table
driven ones in terms of throughput. Also, a pro-
tocol with the least overhead does not alwaysproduce the highest throughput. E.g. in the Free-
way model, DSDV seems to have the least
throughput and the least overhead.
Although, these results were somewhat ex-
pected, the quantitative analysis helped us gain a
lot of insight to answer the next question.
6.4. Why mobility affects protocol performance?
First, the relationship between the mobility
metrics and the performance metrics was unclear.
But after introducing the connectivity graph met-
rics, we were able to observe a very clear correla-
tion between average degree of spatial dependence,
average relative speed, average link duration, av-
erage path duration and protocol performance
metrics. The mobility pattern influences the con-
nectivity graph which in turn influences the protocol
performance. The relationship is identified inFig. 1.
In general, it was observed that DSR, DSDV
and AODV had a higher throughput and lower
overhead for the group mobility models than for
the Random Waypoint model. At the same time,
all the protocols had a higher throughput and
lower overhead for Random Waypoint than the
Freeway and Manhattan models. One plausiblereason for this observation can be as follows:
0 10 20 30 40 50 60Maximum Speed (m/sec)
50
60
70
80
90
100
Thr
ough
put (
%)
DSDVAODVDSR
0 10 20 30 40 50 60Maximum Speed (m/sec)
0
2000
4000
6000
8000
10000
Rou
ting
Ove
rhea
d (p
acke
ts)
DSDVAODVDSR
(a)
(b)
Fig. 10. Protocol performance for RPGM (four groups) model.
RPGM (four groups): throughput (a) and routing overhead (b).
0 10 20 30 40 50 60Maximum Speed (m/sec)
50
60
70
80
90
100
Thr
ough
put (
%)
DSDVAODVDSR
0 10 20 30 40 50 60Maximum Speed (m/sec)
0
25000
50000
75000
1e+05
1.25e+05
1.5e+05
Rou
ting
Ove
rhea
d (p
acke
ts)
DSDVAODVDSR
(a)
(b)
Fig. 11. Protocol performance for Freeway model. Freeway:
throughput (a) and routing overhead (b).
396 F. Bai et al. / Ad Hoc Networks 1 (2003) 383–403
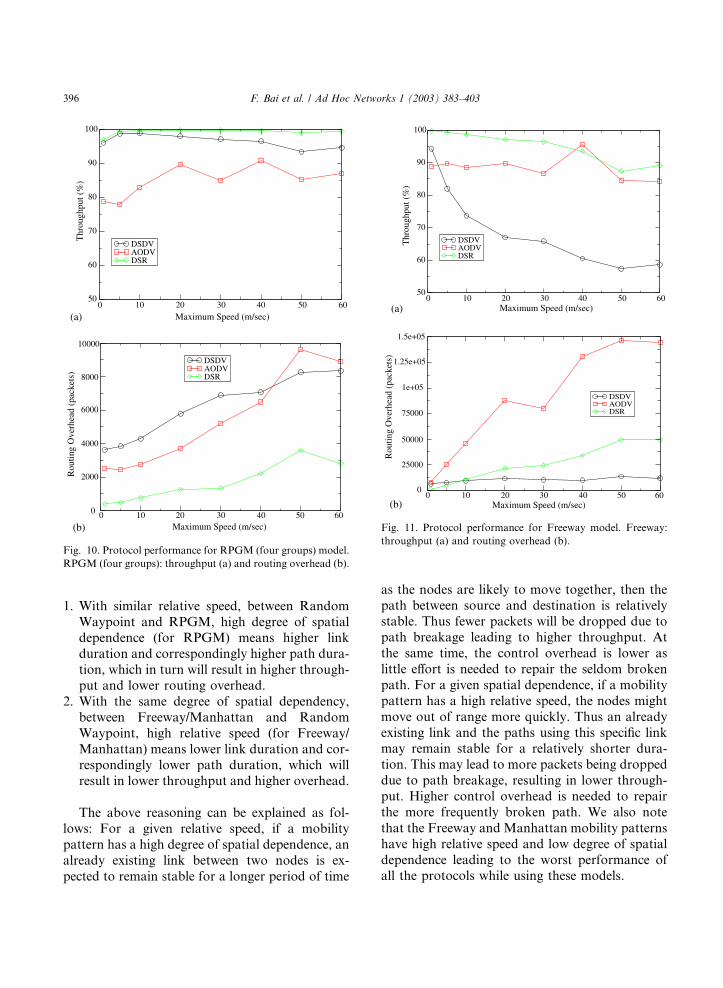
1. With similar relative speed, between Random
Waypoint and RPGM, high degree of spatialdependence (for RPGM) means higher link
duration and correspondingly higher path dura-
tion, which in turn will result in higher through-
put and lower routing overhead.
2. With the same degree of spatial dependency,
between Freeway/Manhattan and Random
Waypoint, high relative speed (for Freeway/
Manhattan) means lower link duration and cor-respondingly lower path duration, which will
result in lower throughput and higher overhead.
The above reasoning can be explained as fol-
lows: For a given relative speed, if a mobility
pattern has a high degree of spatial dependence, an
already existing link between two nodes is ex-
pected to remain stable for a longer period of time
as the nodes are likely to move together, then the
path between source and destination is relativelystable. Thus fewer packets will be dropped due to
path breakage leading to higher throughput. At
the same time, the control overhead is lower as
little effort is needed to repair the seldom broken
path. For a given spatial dependence, if a mobility
pattern has a high relative speed, the nodes might
move out of range more quickly. Thus an already
existing link and the paths using this specific linkmay remain stable for a relatively shorter dura-
tion. This may lead to more packets being dropped
due to path breakage, resulting in lower through-
put. Higher control overhead is needed to repair
the more frequently broken path. We also note
that the Freeway and Manhattan mobility patterns
have high relative speed and low degree of spatial
dependence leading to the worst performance ofall the protocols while using these models.

0 10 20 30 40 50 60Maximum Speed (m/sec)
50
60
70
80
90
100
Thr
ough
put (
%)
DSDVAODVDSR
DSDVAODVDSR
0 10 20 30 40 50 60Maximum Speed (m/sec)
0
25000
50000
75000
1e+05
1.25e+05
1.5e+05
Rou
ting
Ove
rhea
d (p
acke
ts)
(a)
(b)
Fig. 12. Protocol performance for Manhattan model. Man-
hattan: throughput (a) and routing overhead (b).
1 Current AODV implementation in ns-2 (version ns-2.1b8a)
and IETF specification adopt the expanding ring search for
query flooding, localized rediscovery for error handling and
source-specific error notification, which may be different with
the original AODV paper. In our study, if not particularly
specified, we refer the implementation in ns-2 (version ns-
2.1b8a) as the standard AODV mechanism.
F. Bai et al. / Ad Hoc Networks 1 (2003) 383–403 397
7. How mobility affects protocol performance?
Analysis of building blocks
Unlike the conventional evaluation studies [16–18], we pursue our analysis beyond the ‘‘whole
protocol’’ level and attempt to answer How mo-
bility affects protocol performance by looking into
the ‘‘parts’’ that constitute the MANET routing
protocols. We propose an approach to systemati-
cally decompose a protocol into its functional
mechanistic ‘‘building blocks’’. Each building
block can be thought of as a parameterized ‘‘blackbox’’. The parameter settings define the behavior
of each block, while the behavior of building
blocks and the nature of interaction between the
building blocks defines the behavior of the proto-
col as a ‘‘whole’’. We use the analysis of reactive
protocols as an example to illustrate this ap-
proach. In this section, we carry out a preliminary
analysis of the impact of mobility on two reactive
routing protocols after identifying the basic
building blocks of MANET reactive routing pro-
tocols and their parameter setting. Thus we can
extract the relative merits of different parametersettings and achieve a better understanding of
various building blocks of MANET routing pro-
tocols, which will serve as a solid cornerstone for
development of more efficient MANET routing
protocols.
Fig. 13(a) and (b) shows the building block
architecture for DSR and AODV respectively, Fig.
13(c) shows a generalized building block architec-ture for reactive MANET protocols.
7.1. Design choices of building blocks for DSR and
AODV
First we discuss the design choices (parameter
settings) of the identified building blocks of reac-
tive MANET routing protocols and specific pa-rameter settings for DSR and AODV. We pose
some questions about the utility of the various
design choices made by these protocols. In Section
7.2, we attempt to answer these questions.
The mechanism of reactive MANET routing
protocols such as DSR and AODV 1 is composed
of two major phases.
7.1.1. Route setup phase
Route discovery is the major mechanism in this
phase. It is initiated if there is no cached route
available to the destination. This mechanism con-
sists of the following building blocks:
1. Flooding building block: The flooding building
block takes responsibility to distribute the routerequest messages within the network. Here, the
key parameter is the range of flooding, generally

DSR AODV
Local Inquiry & Global Flooding
CacheManagement
Link Monitoring
Salvaging
Error Notification
Expanding Ring Search & Global
Flooding
CacheManagement
Link Monitoring
Localized Rediscovery
Error Broadcast
(a) (b)
Route Setup
Route Maintenance
Flooding Caching
Range of FloodingCaching Style
Expiration Timer
Error Detection
Error Handling
Error Notification
DetectionMethod
Handling Mode
Recipient
Route Request
Add Route Cache
Route Reply
Link Breaks Notify
Route Invalidate
Localized/Non-localized method
Notify
Generalization of Error Handling
(c)
Generalization of Error Handling
Generalization of Flooding
Generalization of Flooding
Fig. 13. Diagram of building block framework for reactive protocols.
398 F. Bai et al. / Ad Hoc Networks 1 (2003) 383–403
described by TTL field in the IP header. If the
TTL is set to the network diameter, a global
flooding is done. One optimization is to imple-ment the localized controlled flooding before
global flooding. This may be useful if the prob-
ability of finding an appropriate cache in the
neighborhood is high.
For the range of flooding, both DSR and
AODV use the two-step controlled flooding.
DSR conducts a non-propagating direct-
neighborhood inquiry (TTL ¼ 1) before theglobal flooding (TTL ¼ D, D is network diame-
ter). Similarly, AODV uses the expanding ring
search (TTL ¼ 1; 3; 5; 7) before the global
flooding is initiated. Here, we want to answer
the following question: How useful are non-
propogating route requests?
2. Caching building block: The caching building
block helps to efficiently and promptly providethe route to the destination without referring
to the destination every time. Several parame-
ters affect the behavior of the caching building
block. One of those parameters is whether ag-
gressive caching is allowed, i.e. whether multiple
cache entries are allowed for the same destina-
tion and whether a node can cache the route in-formation it overhears? Generally speaking,
aggressive caching scheme increases the possi-
bility of finding an appropriate route without
re-initiating a route discovery.
DSR uses aggressive caching, while AODV does
not. For caching, we are interested in the fol-
lowing questions: How useful is caching? and Is
aggressive caching better than non-aggressive
caching?
7.1.2. Route maintenance phase
Route maintenance phase takes the responsi-
bility of detecting broken links and repairing the
corresponding routes. This phase is made up of the
following building blocks:
1. Error detection building block: It is used to mon-
itor the status of the link of a node with its im-
mediate neighbors. Several methods to monitor
the link status between neighbors can be used:

0 10 20 30 40 50 60Maximum Speed (m/sec)
0
0.2
0.4
0.6
0.8
# of
Non
-Pro
poga
ting
Rou
te R
eqs.
/ To
tal #
of R
oute
Req
s.
Random WaypointManhattanFreewayRPGM (Single Group)
0
0.1
0.2
0.3
0.4
Random WaypointManhattanFreewayRPGM (1 Group)RPGM (4 Groups)
0 10 20 30 40 50 60Maximum Speed (m/sec)#
of N
on-P
ropo
gatin
g R
oute
Req
s. /
Tota
l # o
f Rou
te R
eqs.
(a)
(b)
Fig. 14. Ratio of non-propogating route requests to total
number of route requests. (a) DSR and (b) AODV.
F. Bai et al. / Ad Hoc Networks 1 (2003) 383–403 399
MAC level acknowledgement, network-layer
explicit Hello message or network-layer passive
overhearing scheme. Here, the parameter is the
mode of error detection used.
For mode of error detection, both DSR andAODV can use either of the three choices.
Since all these schemes are very similar, we do
not investigate this building block in our ana-
lysis.
2. Error handling building block: It finds alterna-
tive routes to replace an invalid route after a
broken link is detected. One of the parameters
to this block is what recovery scheme should be
used. In a localized recovery, the node detecting
the broken link will attempt to find an alterna-
tive route in its own cache or do a localized
flooding before asking the source to re-initiate
the route discovery.
For localized recovery, in DSR, on detecting a
broken link, the upstream node will first search
its cache to replace the invalid route (thisscheme is called salvaging), although the found
alternative route may also be invalid in some
scenarios. While in AODV, the upstream node
detecting the broken link will initiate a localized
flooding to find the route to the destination.
For this building block, we are interested in the
following question:Which is a better scheme for
localized error handling: cache lookup or local-
ized flooding?
3. Error notification building block: It is used to
notify the nodes in the network about invalid
routes. The key parameter to this building block
is the recipient of the error message. Either only
the source is notified or the entire network is
notified.
For recepient of error notification, both DSRand AODV notify the error to the source. Since
both DSR and AODV use the same parameter
setting, we do not investigate this block during
our simulations.
Besides these three questions about the design
choices, we are also interested at the plausible ex-
planation for the observation we made in Section6: DSR outperforms AODV in most mobility
scenarios except the Freeway and Manhattan
model with high mobility.
7.2. Performance evaluation
We identified parts of the network simulator
(ns-2) code [1] which implement these building
blocks and profiled them during our simulations.The simulation setting is exactly the same as Sec-
tion 6.
7.2.1. Flooding
Fig. 14(a) and (b) shows the ratio of non-prop-
agating route requests to the total number of route
requests issued by the DSR and AODV respec-
tively. This metric measures the likelihood offinding a route to the destination from the source�sneighborhood. The result shows that non-propa-
gating route request is frequently used (more than
30% for DSR and more than 10% for AODV in
most scenarios).
0 10 20 30 40 50 60Maximum Speed (m/sec)
0
0.2
0.4
0.6
0.8
1
# R
oute
Rep
lies
from
Cac
he /
Tota
l # o
f Rou
te R
eplie
s
Random WaypointManhattanFreewayRPGM (Single Group)RPGM (4 Groups)
0.2
0.4
0.6
0.8
1
# of
Rou
te R
eplie
s fro
m th
e C
ache
/ To
tal #
of R
oute
Rep
lies
Random WaypointManhattanFreewayRPGM (Single Group)RPGM (4 Groups)
(a)
0 10 20 30 40 50 60Maximum Speed (m/sec)(b)
Fig. 15. Ratio of the number of route replies from the cache to
the total number of route replies. (a) DSR and (b) AODV.
0 10 20 30 40 50 60Maximum Speed (m/sec)
0
0.2
0.4
0.6
0.8
1
# of
Inva
lid C
ache
Rep
lies
/ Tot
al #
of C
ache
Rep
lies
Random WaypointManhattanFreewayRPGM (Single Group)RPGM (Multiple Groups)
Fig. 16. Ratio of the number of invalid route replies from the
cache to the total number of route replies from the cache.
400 F. Bai et al. / Ad Hoc Networks 1 (2003) 383–403
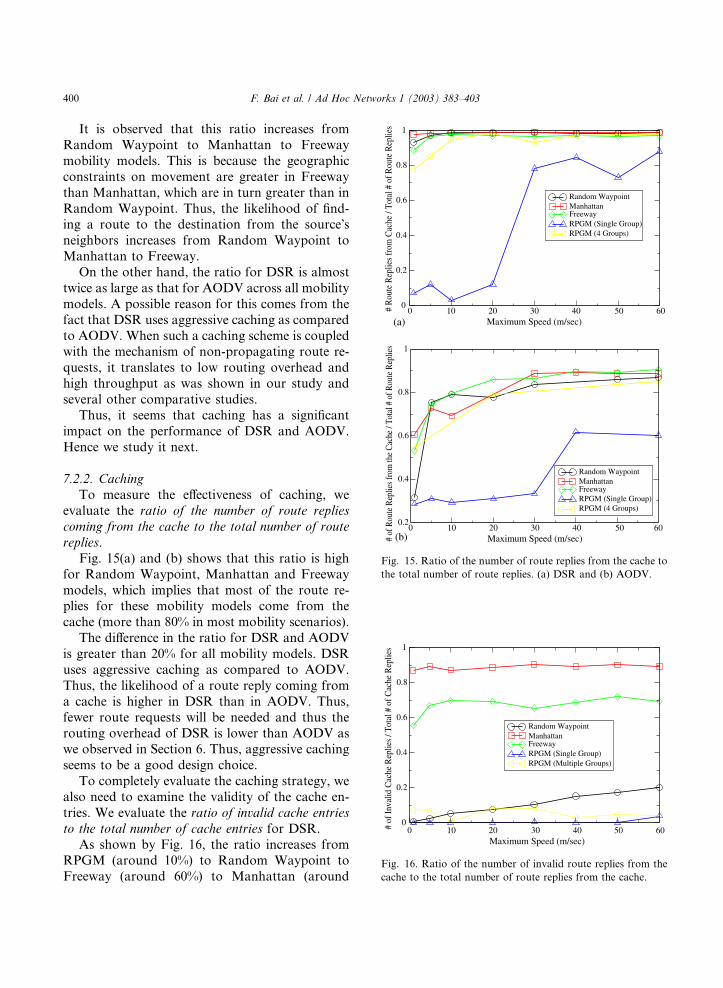
It is observed that this ratio increases from
Random Waypoint to Manhattan to Freeway
mobility models. This is because the geographic
constraints on movement are greater in Freeway
than Manhattan, which are in turn greater than in
Random Waypoint. Thus, the likelihood of find-ing a route to the destination from the source�sneighbors increases from Random Waypoint to
Manhattan to Freeway.
On the other hand, the ratio for DSR is almost
twice as large as that for AODV across all mobility
models. A possible reason for this comes from the
fact that DSR uses aggressive caching as compared
to AODV. When such a caching scheme is coupledwith the mechanism of non-propagating route re-
quests, it translates to low routing overhead and
high throughput as was shown in our study and
several other comparative studies.
Thus, it seems that caching has a significant
impact on the performance of DSR and AODV.
Hence we study it next.
7.2.2. Caching
To measure the effectiveness of caching, we
evaluate the ratio of the number of route replies
coming from the cache to the total number of route
replies.
Fig. 15(a) and (b) shows that this ratio is high
for Random Waypoint, Manhattan and Freeway
models, which implies that most of the route re-plies for these mobility models come from the
cache (more than 80% in most mobility scenarios).
The difference in the ratio for DSR and AODV
is greater than 20% for all mobility models. DSR
uses aggressive caching as compared to AODV.
Thus, the likelihood of a route reply coming from
a cache is higher in DSR than in AODV. Thus,
fewer route requests will be needed and thus therouting overhead of DSR is lower than AODV as
we observed in Section 6. Thus, aggressive caching
seems to be a good design choice.
To completely evaluate the caching strategy, we
also need to examine the validity of the cache en-
tries. We evaluate the ratio of invalid cache entries
to the total number of cache entries for DSR.
As shown by Fig. 16, the ratio increases fromRPGM (around 10%) to Random Waypoint to
Freeway (around 60%) to Manhattan (around

0 10 20 30 40 50 60Maximum Speed (m/sec)
0
0.1
0.2
0.3
0.4
0.5
# of
Loc
aliz
ed R
oute
Req
uest
s / T
otal
# o
f R
oute
Err
ors
Random WaypointManhattanFreewayRPGM (Single Group)RPGM (4 Groups)
Fig. 17. Ratio of the number of localized route recovery
requests to the total number of route errors for AODV.
F. Bai et al. / Ad Hoc Networks 1 (2003) 383–403 401
80%) mobility models. Thus caching may have
adverse effects in mobility models with a high rel-
ative speed which may lead to cache invalidation.
Packets may be sent on invalid routes which might
lead to packets being dropped and route request
retries. This leads to a lower throughput andhigher overhead for DSR for the Freeway and
Manhattan models as was shown in our study.
On the other hand, in mobility models with very
high relative speed like Manhattan and Freeway,
AODV seems to achieve as good a throughput as
DSR (and sometimes better). AODV does not use
aggressive caching, thus the ratio of the number of
route replies coming from the cache to the totalnumber of route replies is lesser for AODV than
DSR. Thus, the likelihood of getting invalid routes
from the cache is lesser for AODV than for DSR.
This may explain why AODV outperforms DSR
in Freeway and Manhattan models with high
mobility.
Moreover, at high relative speeds, the number
of routes broken is greater. Thus, a protocol whichhas a better error handling mechanism at higher
relative speeds might perform better in such situ-
ations. This line of reasoning leads us to evaluate
the next building block of interest––error han-
dling.
7.2.3. Error handling
To study the effectiveness of error handling, wefocus on localized error handling. We evaluate the
ratio of the number of localized error handling to the
total number of route errors for both DSR and
AODV. For DSR, we notice that salvaging ac-
counts for less than 2% of the total number of
route errors. Moreover, if we take invalid cache
entries into account, the effect of salvaging on the
protocol performance is further lowered. On theother hand, in AODV, a route request is initiated
by the upstream node which detects the broken
link if it is closer to the destination. As Fig. 17
shows, the ratio is between 40% and 50% for
Freeway and Manhattan models. Moreover the
routes obtained by this mechanism are more up to
date than those from the cache salvaging in DSR.
This is another factor which explains the betterperformance of AODV as compared to DSR in the
Freeway and Manhattan models.
7.3. Discussion
The above study of the building blocks hasgiven us greater insight into the design of the re-
active routing protocols for MANETs. Decom-
posing a protocol into building blocks and
evaluating these building blocks have shown us the
scenarios in which the chosen parameters can give
a better performance. From the above study, we
learnt the following principles of protocol design:
1. Caching helps reduce the protocol overhead.
However, whether aggressive caching should
be used depends on the scenarios in which the
protocol will be deployed. For low mobility sce-
narios, aggressive caching might be useful,
while for higher mobility scenarios, the more
stale cache entries incurred by aggressive cach-
ing might affect the protocol throughput.2. Non-propogating route requests, when com-
bined with caching also reduce the protocol
overhead. If caching is widely done in the net-
work, it may be more advantageous to do
non-propagating route requests (or expanding
ring search) than globally flooding the route re-
quest. In DSR, due to aggressive caching, it
may be more useful to do expanding ring search(from the source) on a route error than doing
a global flooding (from the source). Again
this might work well only for low mobility
scenarios.

402 F. Bai et al. / Ad Hoc Networks 1 (2003) 383–403
3. The nature of localized error handling also has
a significant impact on protocol performance.
Re-initiating a route request from an intermedi-
ate node can be more advantageous than doing
a local cache lookup in high mobility scenarios,while a cache lookup might be more advanta-
geous for low mobility scenarios.
Thus, no particular parameter setting of these
building blocks is the most optimal for all sce-
narios. This further strengthens our conclusion
that there is no clear winner among the protocols
across all mobility scenarios.
8. Conclusions and future work
In this paper, we proposed a framework to
analyze the impact of mobility pattern on routing
performance of mobile ad hoc network in a sys-
tematic manner. In our study, we observe that themobility pattern does influence the performance of
MANET routing protocols. This conclusion is
consistent with the observation of previous stud-
ies. But unlike previous studies that compared
different ad hoc routing protocols, there is no clear
winner among the protocols in our case, since
different mobility patterns seem to give different
performance rankings of the protocols. We hopethat our ‘‘test-suite’’ of mobility models can be
incorporated into the current scenarios used to test
the MANET routing protocols.
Moreover, we observe that the mobility pattern
influences the connectivity graph that in turn in-
fluences the protocol performance. In addition, we
did a preliminary investigation of the common
building blocks of MANET routing protocols, theeffect of mobility on these building blocks and how
they influence the protocol as a ‘‘whole’’.
In the future, we plan to study the impact of our
‘‘test-suite’’ on the performance of other ad hoc
network protocols like multicast ad hoc, geo-
graphic routing protocols. This study would help
us understand the impact of mobility more deeply
and clearly. We believe that several parameterssuch as traffic patterns, node density and initial
placement pattern of nodes may affect the routing
performance and need to investigate them further.
9. Uncited references
[2–4].
References
[1] L. Breslau, D. Estrin, K. Fall, S. Floyd, J. Heidemann, A.
Helmy, P. Huang, S. McCanne, K. Varadhan, Y. Xu, H.
Yu, Advances in network simulation, IEEE Computer 33
(5) (2000) 59–67.
[2] F. Bai, N. Sadagopan, A. Helmy, Important: a framework
to systematically analyze the impact of mobility on
performance of routing protocols for adhoc networks, in:
INFOCOM 2003, April 2003.
[3] N. Sadagopan, F. Bai, B. Krishnamachari, A. Helmy,
Paths: analysis of path duration statistics and their impact
on reactive manet routing protocols, in: MobiHoc 2003,
June 2003.
[4] F. Bai, N. Sadagopan, A. Helmy, Brics: a building-block
approach for analyzing routing protocols in ad hoc
networks––a case study of reactive routing protocols, in:
USC-CS-TR-02-775, November 2002.
[5] D.B. Johnson, D.A. Maltz, J. Broch, DSR: the dynamic
source routing protocol for multi-hop wireless ad hoc
networks, in: C. Perkins (Ed.), Ad Hoc Networking,
Addison-Wesley, Reading, MA, 2001, pp. 139–172.
[6] C.E. Perkins, P. Bhagwat, Highly dynamic destination
sequenced distance vector routing (DSDV) for mobile
computers, in: ACM SIGCOMM, 1994, pp. 234–244.
[7] C. Perkins, Ad hoc on demand distance vector (AODV)
routing, internet draft, draft-ietf-manet-aodv-00.txt.
[8] X. Hong, M. Gerla, G. Pei, C.-C. Chiang, A group
mobility model for ad hoc wireless networks, in: ACM/
IEEE MSWiM, August 1999.
[9] J. Broch, D.A. Maltz, D.B. Johnson, Y.-C. Hu, J. Jetcheva,
A performance comparison of multi-hop wireless ad hoc
network routing protocols, in: Proceedings of the Fourth
Annual ACM/IEEE International Conference on Mobile
Computing and Networking, ACM, October 1998.
[10] S.R. Das, C.E. Perkins, E.M. Royer, Performance com-
parison of two on-demand routing protocols for ad hoc
networks, in: INFOCOM, March 2000.
[11] S.R. Das, R. Castaneda, J. Yan, R. Sengupta, Compara-
tive performance evaluation of routing protocols
for mobile, ad hoc networks, October 1998, pp. 153–
161.
[12] V.D. Park, M.S. Corson, Temporally-ordered routing
algorithm (TORA) version 1: functional specification,
internet-draft, draft-ietf-manet-tora-spec-01.txt, August
1998.
[13] P. Johansson, T. Larsson, N. Hedman, B. Mielczarek,
M. Degermark, Scenario-based performance analysis of
routing protocols for mobile ad-hoc networks, in: Inter-
national Conference on Mobile Computing and Network-
ing (MobiCom�99), 1999, pp. 195–206.
F. Bai et al. / Ad Hoc Networks 1 (2003) 383–403 403
[14] G. Pei, M. Gerla, X. Hong, C.-C. Chiang, A wireless
hierarchical protocol with group mobility, in: IEEE
WCNC, September 1999.
[15] X. Hong, T. Kwon, M. Gerla, D. Gu, G. Pei, A mobility
framework for ad hoc wireless networks, in: ACM Second
International Conference on Mobile Data Management
(MDM), January 2001.
[16] D.A. Maltz, J. Broch, J. Jetcheva, D.B. Johnson, The
effects of on-demand behavior in routing protocols for
multi-hop wireless ad hoc networks, IEEE Journal on
Selected Areas in Communications, Special Issue on
Mobile and Wireless Networks, 17 (8) (1999) 1439–1453.
[17] W. Su, S.-J. Lee, M. Gerla, Mobility prediction in wireless
networks, in: IEEE MILCOM, October 2000.
[18] S.-J. Lee, M. Gerla, C.-K. Toh, A simulation study of
table-driven and on-demand routing protocols for mobile
ad hoc networks, IEEE Network 13 (4) (1999) 48–54.
[19] T.H. Cormen, C.E. Leiserson, R.L. Rivest, C. Stein,
Introduction to Algorithms, McGraw-Hill, New York,
1998.
Fan Bai received B.S. in AutomationEngineering from Tsinghua Univer-sity, Beijing, China in 1999. Since1999, he has been pursuing the Ph.D.degree at Department of ElectricalEngineering at University of SouthernCalifornia, California.His current research interests in-
clude protocol design for mobile adhoc network and wireless sensor net-work. URL: http://www-scf.usc.edu/~fbai.
Narayanan Sadagopan is a Ph.D. stu-dent in the Computer Science Depart-ment at the University of SouthernCalifornia (USC) since Summer 2001.He completed his M.S. in ComputerScience at USC (2001) and B.E. inComputer Science and Engineeringfrom National Institute of Technology(NIT), Trichy, India (1998).He is interested in mathematical
modeling and algorithms. Currently, heis applying these techniques to routingin adhoc and sensor networks. URL:http://www-scf.usc.edu/~nsadagop.
Ahmed Helmy received his Ph.D. inComputer Science (1999), M.S. inElectrical Engineering (1995) from theUniversity of Southern California,M.S. in Engineering Mathematics(1994) and B.S. in Electronics andCommunications Engineering (1992)from Cairo University, Egypt.Since 1999, he has been an Assistant
Professor of Electrical Engineering atthe University of Southern California.In 2002, Dr. Helmy received theNational Science Foundation (NSF)CAREER Award, in 2000 he received
the USC Zumberge Award, and in 2002 he received the bestpaper award from the IEEE/IFIP International Conference onManagement of Multimedia Networks and Services (MMNS).In 2000, he founded––and is currently directing––the wirelessnetworking laboratory at USC. His current research interests liein the areas of protocol design and analysis for mobile ad hocand sensor networks, mobility modeling, design and testing ofmulticast protocols, IP micro-mobility, and network simula-tion. URL: http://ceng.usc.edu/~helmy.