Analyzing Toxicity Through Electrophilicity
13
Molecular Diversity (2006) 10: 119–131 DOI: 10.1007/s11030-005-9009-x c Springer 2006 Full-length paper Analyzing toxicity through electrophilicity D. R. Roy 1 , U. Sarkar 1 , P. K. Chattaraj 1,∗ , A. Mitra 2 , J. Padmanabhan 1,3 , R. Parthasarathi 3 , V. Subramanian 3,∗ , S. Van Damme 4 & P. Bultinck 4,∗ 1 Department of Chemistry, Indian Institute of Technology, Kharagpur 721302, India; 2 B. C. Roy Technology Hospital, Indian Institute of Technology, Kharagpur 721302, India; 3 Chemical Laboratory, Central Leather Research Institute, Adyar, Chennai 600 020, India; 4 Department of Inorganic and Physical Chemistry, Ghent University, Krijgslaan 281, B-9000 Gent, Belgium ( ∗ Author for correspondence, E-mail: [email protected], [email protected], [email protected]) Received 25 August 2005; Accepted 20 December 2005 Key words: toxicity, polychlorinated dibenzofurans, DFT, electrophilicity, charge transfer, QSAR Summary The toxicological structure-activity relationships are investigated using conceptual DFT based descriptors like global and local electrophilicities. In the present work the usefulness of electrophilicity in predicting toxicity of several polyaromatic hydrocarbons (PAH) is assessed. The toxicity is expressed through biological activity data (pIC 50 ) defined as molar concentration of those chemicals necessary to displace 50% of radiolabeled tetrachlorodibenzo-p-dioxin (TCDD) from the arylhydrocarbon (Ah) receptor. The experimental toxicity values (pIC 50 ) for the electron acceptor toxin like polychlorinated dibenzofurans (PCDF) are taken as dependent variables and the DFT based global descriptor electrophilicity index (ω) is taken as independent variable in the training set. The same model is then tested on a test set of polychlorinated biphenyls (PCB). A good correlation is obtained which vindicates the importance of these descriptors in the QSAR studies on toxins. These toxins act as electron acceptors in the presence of biomolecules whereas aliphatic amines behave as electron donors some of which are also taken into account for the present work. The toxicity values of the aliphatic amines in terms of the 50% inhibitory growth concentration (IGC 50 ) towards ciliate fresh-water protozoa Tetrahymena pyriformis are considered. Since there is no global nucleophilicity we apply local nucleophilicity (ω + max ) as the descriptor in this case of training set. The same regression model is then applied to a test set of amino alcohols. Although the correlation is very good the statistical analysis reflects some cross validation problem. As a further check the amines and amino alcohols are used together to form both the training and the test sets to provide good correlation. It is demonstrated that the toxicity of several toxins (both electron donors and acceptors) in the gas and solution phases can be adequately explained in terms of global and local electrophilicities. Amount of charge transfer between the toxin and the biosystem, simulated as nucleic acid bases and DNA base pairs, indicates the importance of charge transfer in the observed toxicity. The major strength of the present analysis vis-` a-vis the existing ones rests on the fact that it requires only one descriptor having a direct relationship with toxicity to provide a better correlation. Importance of using the information from both the toxin and the biosystem is also analyzed. Abbreviations: DFT, Density Functional Theory; PCDF, polychlorinated dibenzofuran; PCB, polychlorinated biphenyl; PCDD, polychlorinated dibenzo- p-dioxin; QSAR, quantitative structure activity relationship. Introduction Various quantum chemical descriptors like charges, orbital energies, frontier orbital densities, polarizabilities, dipole moments etc. have been used in developing different quan- titative structure activity relationships (QSARs) for predict- ing reactivity in terms of the structure and physicochemi- cal properties of molecules. Density functional theory (DFT) provides a number of global reactivity descriptors such as electronegativity (χ ), chemical potential (μ), hardness (η), polarizability (α) and softness (S) as well as local reactivity descriptors like Fukui function (FF) and local softness, which have been used in the development of QSARs [1–5]. Global electrophilic power of a molecule is quantified in terms of an electrophilicity index (ω) [6] which has been shown to be related to the rates of reactions [7]. A local version of this has also been proposed [8]. The power of the elec- trophilicity and other related quantities has been analyzed in the context of QSAR [9, 10] and also in describing the toxicity of polychlorinated biphenyls [11, 12] and benzidine
-
Upload
independent -
Category
Documents
-
view
0 -
download
0
Transcript of Analyzing Toxicity Through Electrophilicity

Molecular Diversity (2006) 10: 119–131DOI: 10.1007/s11030-005-9009-x c© Springer 2006
Full-length paper
Analyzing toxicity through electrophilicity
D. R. Roy1, U. Sarkar1, P. K. Chattaraj1,∗, A. Mitra2, J. Padmanabhan1,3, R. Parthasarathi3,V. Subramanian3,∗, S. Van Damme4 & P. Bultinck4,∗1Department of Chemistry, Indian Institute of Technology, Kharagpur 721302, India; 2B. C. Roy Technology Hospital, IndianInstitute of Technology, Kharagpur 721302, India; 3Chemical Laboratory, Central Leather Research Institute, Adyar, Chennai600 020, India; 4Department of Inorganic and Physical Chemistry, Ghent University, Krijgslaan 281, B-9000 Gent, Belgium(∗Author for correspondence, E-mail: [email protected], [email protected], [email protected])
Received 25 August 2005; Accepted 20 December 2005
Key words: toxicity, polychlorinated dibenzofurans, DFT, electrophilicity, charge transfer, QSAR
Summary
The toxicological structure-activity relationships are investigated using conceptual DFT based descriptors like global andlocal electrophilicities. In the present work the usefulness of electrophilicity in predicting toxicity of several polyaromatichydrocarbons (PAH) is assessed. The toxicity is expressed through biological activity data (pIC50) defined as molar concentrationof those chemicals necessary to displace 50% of radiolabeled tetrachlorodibenzo-p-dioxin (TCDD) from the arylhydrocarbon(Ah) receptor. The experimental toxicity values (pIC50) for the electron acceptor toxin like polychlorinated dibenzofurans(PCDF) are taken as dependent variables and the DFT based global descriptor electrophilicity index (ω) is taken as independentvariable in the training set. The same model is then tested on a test set of polychlorinated biphenyls (PCB). A good correlationis obtained which vindicates the importance of these descriptors in the QSAR studies on toxins. These toxins act as electronacceptors in the presence of biomolecules whereas aliphatic amines behave as electron donors some of which are also taken intoaccount for the present work. The toxicity values of the aliphatic amines in terms of the 50% inhibitory growth concentration(IGC50) towards ciliate fresh-water protozoa Tetrahymena pyriformis are considered. Since there is no global nucleophilicitywe apply local nucleophilicity (ω+
max) as the descriptor in this case of training set. The same regression model is then applied toa test set of amino alcohols. Although the correlation is very good the statistical analysis reflects some cross validation problem.As a further check the amines and amino alcohols are used together to form both the training and the test sets to provide goodcorrelation. It is demonstrated that the toxicity of several toxins (both electron donors and acceptors) in the gas and solutionphases can be adequately explained in terms of global and local electrophilicities. Amount of charge transfer between the toxinand the biosystem, simulated as nucleic acid bases and DNA base pairs, indicates the importance of charge transfer in theobserved toxicity. The major strength of the present analysis vis-a-vis the existing ones rests on the fact that it requires only onedescriptor having a direct relationship with toxicity to provide a better correlation. Importance of using the information fromboth the toxin and the biosystem is also analyzed.
Abbreviations: DFT, Density Functional Theory; PCDF, polychlorinated dibenzofuran; PCB, polychlorinated biphenyl; PCDD,polychlorinated dibenzo-p-dioxin; QSAR, quantitative structure activity relationship.
Introduction
Various quantum chemical descriptors like charges, orbitalenergies, frontier orbital densities, polarizabilities, dipolemoments etc. have been used in developing different quan-titative structure activity relationships (QSARs) for predict-ing reactivity in terms of the structure and physicochemi-cal properties of molecules. Density functional theory (DFT)provides a number of global reactivity descriptors such aselectronegativity (χ ), chemical potential (μ), hardness (η),
polarizability (α) and softness (S) as well as local reactivitydescriptors like Fukui function (FF) and local softness, whichhave been used in the development of QSARs [1–5]. Globalelectrophilic power of a molecule is quantified in terms ofan electrophilicity index (ω) [6] which has been shown tobe related to the rates of reactions [7]. A local version ofthis has also been proposed [8]. The power of the elec-trophilicity and other related quantities has been analyzedin the context of QSAR [9, 10] and also in describing thetoxicity of polychlorinated biphenyls [11, 12] and benzidine

120
[12] wherein the conformational flexibility of toxins ishighlighted.
Polychlorinated dibenzofurans (PCDFs), and polychlori-nated biphenyls (PCBs) are chemicals of concern becauseof their elevated concentrations, wide distribution and tox-icity. Biochemical and pathological studies on aquatic or-ganisms have consistently revealed that the lateral sub-stituted congeners are more potent than the non-lateralcongeners [13–15]. Polychlorinated dibenzofurans (PCDFs)are ubiquitous contaminants, which are present in variousenvironmental systems and biota [16]. PCDFs are releaseddirectly into the atmosphere from a variety of combustionsources and manufacturing processes, such as municipal solidwaste incinerators [17], automobile emissions [18] and chem-ical production processes [16]. They are mainly transportedover long distances and/or deposited to the terrestrial andaquatic ecosystems through dry or wet deposition. There-fore, atmospheric transport and deposition constitute the pri-mary distribution pathway in moving PCDFs from numerousemission sources to the environmental compartments [19].
Toxicity of polychlorinated biphenyls (PCB) has seen anupsurge of interest in recent years [20–24]. These compoundsexhibit toxicity similar to that of polychlorinated dibenzo-p-dioxin (PCDD). This information on PCB has promptedseveral investigators to understand the toxic nature of PCBand their interaction with cellular components [25]. The ma-rine aquatic contamination leads to increased concentrationof these toxic compounds in sea-fish and others. The edi-ble varieties accumulate the toxicities in different cells andproduce contaminated fish oils and products and subsequenthealth hazards, instead of health benefits of uptake. Further,accumulation of these health hazardous toxic products maylead to various diseases including increased incidence of car-cinogenesis particularly involving urinary bladder and otherorgans [13]. The origin of toxicity of PCDDs in living cellshas been attributed to the electron accepting nature in chargetransfer complex formalism with a receptor [26]. Hence, elec-tron affinity of PCDDs/PCBs is used as an important quan-tity in understanding their toxic effects. Due to their extremetoxicity and the existence of many isomers, experimental in-vestigations on toxic PCDDs are difficult.
In the present work, an attempt has been made to ex-plore the uses of DFT based reactivity descriptors to in-vestigate the structure-activity relationship in the series ofPCDFs, and PCBs. All the previously determined biologi-cal activity data [27], that is the negative of the log of mo-lar concentration of chemical necessary to displace 50% ofradiolabeled TCDD from Ah receptor (pIC50), are utilizedfor this purpose. Experimental biological activity (pIC50) forPCDFs and PCBs are correlated with their correspondingcalculated pIC50 values determined using one parameter re-gression analysis in gas phase using Mulliken PopulationAnalysis (MPA), Natural Population Analysis (NPA) and Hir-shfeld Population Analysis (HPA) (Stockholder partitioningscheme) schemes. Sets of aliphatic amines and amino alco-hols, which act as electron donors in their interaction with
biomolecules have also been studied for their toxicity val-ues in terms of 50% inhibitory growth concentration (IGC50)towards tear-drop shaped, unicellular, fresh water protozoaTetrahymena pyriformis [28] using one parameter regressionanalysis in gas phase using the NPA scheme. The amount ofcharge transfer between a toxin and nucleic acid bases/DNAbase pairs is also calculated to gain insights into the originof toxicity vis-a-vis the charge transfer between a toxin anda biosystem.
Theoretical background
Electronegativity (χ ) and hardness (η) are defined within theconceptual DFT framework as [2, 29]
χ = −μ = −(
∂ E
∂ N
)v(�r )
(1)
and
η = 1
2
(∂2 E
∂ N 2
)v(�r )
= 1
2
(∂μ
∂ N
)v(�r )
(2)
where E and v(�r ) are respectively the total energy and theexternal potential of an N - electron system with chemicalpotential [30], μ, which is the Lagrange multiplier associatedwith the normalization constraint of DFT.
Operational definitions for χ and η may be written [2]using a finite difference approximation in terms of the ion-ization potential (I) and electron affinity (A) as
χ = I + A
2(3)
and
η = I − A
2(4)
which may be further approximated by using Koopmans’theorem as
χ = −∈H + ∈L
2(5)
and
η = ∈L − ∈H
2(6)
where ∈L and ∈H are energies of the lowest unoccupied andhighest occupied orbitals respectively.
Parr et al. [6] introduced the global electrophilicity index(ω) as follows
ω = μ2
2η(7)

121
The Fukui function is a local reactivity descriptor defined as[31, 32]
f (�r ) =(
∂ρ(�r )
∂ N
)v(�r )
=(
δμ
δv(�r )
)N
(8)
which may be approximated as follows [33–35] due to thediscontinuities in the above derivatives
f +(�r ) = ρN+1(�r ) − ρN (�r ) for nucleophilic attack (9a)
f −(�r ) = ρN (�r ) − ρN−1(�r ) for electrophilic attack (9b)
f 0(�r ) = (ρN+1(�r ) − ρN−1(�r ))/2 for radical attack (9c)
The concept of a generalized philicity has been developed[8] which can tackle the electrophilic, nucleophilic and rad-ical reactions. The condensed-to-atom philicity at atom k ina molecule may be written as [8]
ωαk = ω. f α
k (10)
where f αk (α = +, − and 0 refer to nucleophilic, electrophilic
and radical attacks respectively) is the condensed Fukui func-tion for the atom k.
The fractional number of electrons transferred from a sys-tem A to a system B is given by [36]
N = μB − μA
2 (ηA + ηB )(11)
which is an important quantity in analyzing the global in-teractions between the AHH receptors and NA bases/DNAbase pairs. Flow of electrons can also be predicted by usingthe Sanderson’s electronegativity equalization principle [37]which dictates that the electron will flow from the moleculewith lower electronegativity to that with higher electronega-tivity.
In order to check the effects of both the donor and theacceptor in analyzing toxicity we define a type of quantumdissimilarity as follows:
i jω = (
ω+max(i)(electrophile) − ω−
max( j)(nucleophile))2
(12)
For the set of electron acceptor toxins like PCDFs and PCBs,the corresponding nucleophile is taken to be guanine andfor the set of electron donor toxins like aliphatic amine, theelectrophile is taken to be uracil. The ω−
max( j) of guanine
is calculated at the N-center whereas the ω+max(i) for uracil
is calculated at the C-center. The philicity based quantity(Equation 12) is known to serve better than its local softnessvariant [38]. The smaller the value of ω
i j the stronger theelectrophile-nucleophile interaction will be.
Computational details
The geometries of polychlorinated dibenzofurans (PCDFs)and polychlorinated biphenyls (PCBs) are optimized using6–31G∗ basis set in the framework of B3LYP theory com-prising Becke’s three–parameter hybrid exchange and LYPcorrelation functionals whereas the geometries of aliphaticamines are minimized at the Hartree-Fock (HF) level using6-311G∗∗ basis set in gas phase [39, 40]. All calculationsare performed using the G98W & G03W suites of programs[41]. The atomic charges for all the above molecules are ob-tained in the framework of B3LYP theory using MPA [42]and NPA schemes [43, 44]. Also Hirshfeld population scheme[45] as implemented in the DMOL3 package [46] employingBLYP/DND method is used to obtain atomic charges for allmolecules studied in the present work. Since it provides neg-ative charges on H-atoms in some cases it is ultimately notused. One parameter QSAR is performed [47] using the leastsquare error estimation method to predict the toxicity values.The N values are calculated using eq. 11 in which μ (-χ )and η of both the toxins and NA bases/DNA base pairs arecalculated using Equations 5 and 6 respectively.
Results and discussion
The structural templates of PCDFs, and PCBs with requiredatom numbering are presented in Tables 1 and 2 respectivelyalongwith the identity (ID) of the molecules with substitutionpattern. Previous studies [11–13] have revealed the fact thatPCDFs, and PCBs are electron acceptors in their interactionwith biomolecules. Hence for regression analysis, the atomwith the maximum value of local electrophilic power (ω+
max)in a molecule alongwith the electrophilicity index (ω) havebeen considered as independent variables.
Charge transfer analysis (N)
The global interactions between the constituents of selectedsystems namely, PCDFs, PCBs and amines (A) and NAbases/DNA base pairs (B) have been determined using theparameter N , which represents the fractional number ofelectrons, transferred from a system A to a system B. Chargetransfer data between PCDFs, PCBs and amines (A) andNA bases/DNA base pairs (B) are presented in Tables 3–5.Generally, electron flows from less electronegative system tomore electronegative and this fact along with the definition ofN clearly shows that charge transfer values are positive forPCDFs and PCBs representing them as electron acceptors andfor amines N is negative showing them as electron donors.
In the case of interaction with PCDFs and PCBs, Guanineand GCWC donate maximum charge among the selectedbases and base pairs respectively and Uracil (base) andATH (base pair), the minimum (Tables 3 and 4). Figure 1Ashows the correlation between the amount of charge transfer

122
Table 1. Polychlorinated dibenzofurans with identity
number (ID) representing the substitution pattern.
X
X
X X
3
4
X
X
9
O
X
6
7
8
X2 1
ID X1 X2 X3 X4 X6 X7 X8 X9
1 H Cl H H H H H H2 H H H Cl H H H H3 H Cl H H Cl H H H4 H Cl H H H H Cl H5 Cl H Cl H Cl H H H6 Cl H Cl H H H Cl H7 H Cl Cl Cl H H H H8 H Cl Cl H H H Cl H9 H Cl H H Cl Cl H H
10 H Cl Cl Cl Cl H H H11 H Cl Cl Cl H H Cl H12 H Cl Cl H H Cl Cl H13 Cl Cl H Cl Cl Cl H H14 Cl Cl Cl Cl H H Cl H15 Cl Cl Cl H H Cl Cl H16 H Cl Cl Cl H Cl Cl H17 Cl Cl Cl Cl H Cl Cl H18 H Cl Cl Cl Cl Cl Cl H19 H Cl Cl H Cl H Cl H20 Cl Cl Cl H Cl H H H21 Cl Cl Cl H H Cl H H22 Cl H Cl Cl H Cl Cl H23 H Cl Cl Cl H Cl H Cl24 Cl Cl Cl H H Cl H Cl25 Cl Cl Cl H H Cl H H26 Cl H Cl Cl H Cl Cl H27 H Cl Cl Cl H Cl H Cl
Table 2. Polychlorinated biphenyls with identity number (ID) rep-
resenting the substitution pattern.
X
X
X X X X
X
XX2
5 6 2' 3'
4'
5'6'X3
4
ID X2 X3 X4 X5 X6 X X X X X28 Cl H H H H H Cl Cl Cl H29 Cl Cl Cl H H H Cl Cl H H30 Cl H Cl Cl H H Cl Cl H H31 Cl Cl Cl Cl H H Cl Cl H H32 Cl H Cl H H Cl H Cl H H33 Cl H Cl H Cl H Cl Cl Cl H
, , , , ,
computed as N (see Table 3) and the electrophilicity in-dex. A good linear relationship is found with correlation co-efficient R = 0.991. Figure 1B shows the correlation ob-tained between the experimental biological activity (pIC50)(see Table 5) of polychlorinated dibenzo furans with the
Table 3. Charge transfer (N ) between different polychlorinated dibenzo-
furans and nucleic acid bases/base pairs in gas phase.
ID Adenine Thymine Guanine Cytosine Uracil GCWC ATH
1 0.0570 0.0021 0.0984 0.0324 −0.0190 0.0756 0.0454
2 0.0550 0.0005 0.0961 0.0305 −0.0200 0.0730 0.0433
3 0.0845 0.0290 0.1258 0.0601 0.0074 0.1084 0.0746
4 0.0799 0.0244 0.1213 0.0554 0.0029 0.1029 0.0697
5 0.0905 0.0349 0.1317 0.0661 0.0132 0.1155 0.0810
6 0.0906 0.0345 0.1323 0.066 0.0126 0.1159 0.0810
7 0.0877 0.0321 0.1291 0.0633 0.0104 0.1123 0.0781
8 0.0950 0.0390 0.1365 0.0705 0.0171 0.1211 0.0857
9 0.1095 0.0533 0.1510 0.0852 0.0312 0.1384 0.1012
10 0.1043 0.0483 0.1457 0.0800 0.0262 0.1322 0.0957
11 0.1079 0.0516 0.1494 0.0835 0.0294 0.1365 0.0994
12 0.1070 0.0502 0.1489 0.0823 0.0279 0.1357 0.0984
13 0.1195 0.0632 0.1607 0.0952 0.0409 0.1502 0.1118
14 0.1162 0.0592 0.1580 0.0916 0.0368 0.1467 0.1082
15 0.1174 0.0603 0.1593 0.0928 0.0378 0.1483 0.1095
16 0.1205 0.0635 0.1622 0.0959 0.04100 0.1518 0.1128
17 0.1293 0.0719 0.1712 0.1047 0.0491 0.1626 0.1221
18 0.1331 0.0760 0.1747 0.1087 0.0534 0.1669 0.1262
19 0.1128 0.0566 0.1542 0.0885 0.0344 0.1423 0.1047
20 0.1035 0.0475 0.1449 0.0792 0.0255 0.1312 0.0948
21 0.1007 0.0440 0.1426 0.076 0.0218 0.1281 0.0917
22 0.1163 0.0592 0.1583 0.0917 0.0367 0.1470 0.1083
23 0.1178 0.0609 0.1595 0.0933 0.0385 0.1486 0.1100
24 0.1178 0.0607 0.1597 0.0932 0.0382 0.1487 0.1099
25 0.1007 0.0440 0.1426 0.076 0.0218 0.1281 0.0917
26 0.1163 0.0592 0.1583 0.0917 0.0367 0.1470 0.1083
27 0.1178 0.0609 0.1595 0.0933 0.0385 0.1486 0.1100
Table 4. Charge transfer (N ) between different polychlorinated biphenyls
and nucleic acid bases/base pairs in gas phase.
ID Adenine Thymine Guanine Cytosine Uracil GCWC ATH
28 0.0932 0.0380 0.1341 0.0690 0.0165 0.1184 0.0840
29 0.1089 0.0535 0.1497 0.0849 0.0317 0.1371 0.1006
30 0.0879 0.0345 0.1276 0.0645 0.0137 0.1113 0.0787
31 0.0975 0.0435 0.1375 0.0739 0.0223 0.1229 0.0887
32 0.1012 0.0469 0.1414 0.0776 0.0255 0.1275 0.0927
33 0.1111 0.0567 0.1512 0.0876 0.0353 0.1391 0.1032
amount of charge transfer between the toxin and Guanine.A correlation coefficient R of 0.881 is obtained. Figure 1Creports the correlation obtained between the experimental ac-tivity and that obtained from the linear equation using chargetransfer and electrophilicity. A fair correlation is found withR = 0.892. For the interaction of PCDFs with GCWC pairs,the analogous correlations give R = 0.991, 0.880 and 0.892(Figure 2) respectively. A good correlation is obtained fromabove studies showing the significance of the charge transferin toxicity analysis on PCDFs. It may, however, be mentionedthat N is an intermolecular descriptor because it possesses

123
Table 5. Experimental and calculated biological activity (pIC50) in gas phase
for the training set of polychlorinated dibenzofurans.
ω+max Observed Calculated
ID ω (eV) (NPA) (eV) pIC50 pIC50
1 2.763 0.888 4.061 3.800
2 2.699 0.720 3.429 3.583
3 3.101 0.883 4.125 4.947
4 3.180 0.893 4.103 5.216
5 3.366 1.306 6.123 5.847
6 3.425 1.007 4.653 6.047
7 3.331 1.156 5.396 5.728
8 3.486 1.488 6.858 6.254
9 3.659 1.551 7.255 6.841
10 3.748 1.551 7.379 7.144
11 3.769 1.633 7.657 7.215
12 3.785 1.824 8.444 7.269
13 3.952 1.717 8.194 7.836
14 3.967 1.683 7.911 7.887
15 4.005 1.756 8.147 8.016
16 4.046 1.902 8.943 8.155
17 4.263 1.612 7.587 8.892
18 4.293 1.756 8.376 8.994
19 3.828 1.621 7.610 7.415
20 3.642 1.57 7.379 6.784
21 3.657 1.718 7.954 6.835
22 3.989 1.629 7.657 7.962
23 3.988 1.629 7.657 7.958
24 4.010 1.575 7.313 8.033
25 3.657 1.718 7.954 6.835
26 3.989 1.621 7.623 7.962
27 3.988 1.622 7.623 7.958
Table 6. Experimental and predicted biological activity (pIC50) in gas
phase for the test set of polychlorinated biphenyls.
ID ω ω+max(NPA) (eV) Observed pIC50 Calculated pIC50
28 3.109 0.476 5.584 4.975
29 3.329 0.432 6.134 5.721
30 3.424 0.440 5.762 6.044
31 3.597 0.461 6.057 6.631
32 2.866 0.318 4.442 4.150
33 3.112 0.406 4.577 4.985
information regarding both the toxin and the biosystem. Fig-ures 1C and 2C refer to 2-descriptor models with possiblecollinearity. They are included because of the suggestionmade by the referee.
For interaction with amines, Uracil (base) and ATH (basepair) accept maximum charges among respectively the basesand base pairs considered here and Guanine and GCWC ac-cept the minimum (Table 7).
QSAR analysis
Initially for carrying out QSAR analysis on different sets ofmolecules, the given data set is divided into a training set anda test set. Regression analyses are carried out on the trainingset and the developed model is used to predict the compoundsin the test set.
Polychlorinated dibenzofurans (PCDFs)
The gas phase data of the set of 27 PCDFs are used as thetraining set. Linear regression analysis is carried out on thetraining set and the results are presented in Table 8. Themodel obtained is then applied to the test set comprising 6polychlorinated biphenyls (PCBs). The observed along withcalculated values of pIC50 for the training set of PCDFs arepresented in Table 5 and observed and predicted pIC50 valuesof the test set of PCBs are presented in Table 6. The ω valuesare capable of providing (Figure 3) a correlation R for thetraining (test) set equal to 0.891 (0.834). This QSAR modelis used to predict the pIC50values of molecules in the test set.
For the set of 27 PCDFs, a relatively good correlation wasfound, characterized by R = 0.891. The adjusted R2 equals0.7864 for the equation pIC50 = 3.3944∗(0.3451)ω – 5.5788(1.2804) where values between brackets indicate standarderrors. Both variables, ω and the constant were found to besignificant by a t-test. The standard error of the estimate wasfound to be 0.7206. As an internal measure of validation, aleave 25% out Q2 value was computed (note: 7 values wereleft out) and the value of 0.7559 suggests that the modelhas good predictive capacity. The F-ratio was found to be96.7427, which is very good compared to the value of F forthe given number of parameters and data points. In order tocheck that the correlation is not due to chance, the probabilitythat a random distribution of the points would yield the samecorrelation coefficient was computed in the way proposed byPonec et al [48]. The probability was found to be less than10−6 meaning that the correlation is not a chance correlation.
Although the ω along with ω+max values provide a much
better correlation (R = 0.99, Q2 = 0.99) we refrain fromusing that in order to avoid possible collinearity and overfit-ting [49].
Polychlorinated biphenyls (PCB)
The gas phase data of the test set of PCBs are used for thelinear regression analysis using the QSAR model developedfor the training set of PCDFs. The observed along with calcu-lated values of pIC50 are presented in Table 6. The ω valuesprovide a correlation (R) of 0.834.
This external test set does reveal that indeed the correla-tion above can be used as a prediction model. The correlationequation y = 1.0034x − 0.0268 is indeed relatively close toy = x .
The quantum dissimilarity, ωi j , for both PCDFs (Fig-
ure 3C) and PCBs (Figure 3D) correlates well with pIC50.

124
Figure 1. Variation of charge transfer with (A) electrophilicity index (ω), (B) the experimental biological activity (pIC50) during interaction of polychlorinated
dibenzo furan with guanine and (C) Observed versus calculated pIC50 values of polychlorinated dibenzo furan using electrophilicity index (ω) and N with
guanine.
Greater interactions (smaller ωi j ) between the toxin and the
biosystem leads to a more toxic behavior of the toxin. Notethe intermolecular nature of this descriptor.
A comparison of the descriptors used in the present studywith those reported elsewhere for describing the toxicity ofthe same type of molecule is in order. This will bring outthe strength and weakness of the descriptors used in thepresent study and that of others. In line with this idea, wefirst consider the work carried out by Arulmozhiraja et al[50] in the toxicity prediction of PCDFs. In that study, theyhave selected a set of 33 PCDFs alongwith their experimentalbinding affinities (BA) for aryl hydrocarbon receptors (AhR),aryl hydrocarbon hydroxylase (AHH) and ethoxyresorufinO-deethylase (EROD) induction potencies [log (1/EC50)].They have taken DFT based descriptors such as global soft-ness (S), electronegativity (χ ) and electrophilicity index (ω)separately as independent variables and have obtained a cor-
relation, R of 0.732, 0.687 and 0.694 respectively with BAof PCDFs with rat hepatic cytosol Ah receptor. Almost asimilar correlation has been seen with AHH induction po-tencies of PCDFs in rat hepatoma H-4-II E cells and ERODinduction potencies of PCDFs in rat cells. In our case usingelectrophilicity index (ω) for a set of 27 PCDFs, we get cor-relation coefficients of 0.891 with the toxicity (pIC50) valuesin gas phase. Similar results are obtained for the descriptorsof PCDFs studied in the solvent phase. Further Arulmozhi-raja et al have also tried in the same paper two and threeparameter QSARs using a combination of DFT based de-scriptors (S, χ , ω) alongwith a hydrophobic term (log P) anda topological parameter, Lmax defined as the greatest inter-atomic distance in PCDFs. They have obtained correlationcoefficients in the range of 0.794 to 0.881, lower than thatobtained using only DFT based one parameter QSARs in thepresent study. The electrophilicity index (ω), tells us about

125
Figure 2. Variation of charge transfer with (A) electrophilicity index (ω), (B) the experimental biological activity (pIC50) during interaction of polychlorinated
dibenzo furan with GCWC base pair and (C) Observed versus calculated pIC50values of polychlorinated dibenzo furan using electrophilicity index (ω) and
N with GCWC base pair.
the global reactivity of the selected molecules thereby hav-ing a direct relationship with toxicity unlike other parameters.Thus with only one descriptor we are able to get a better cor-relation with the experimental toxicity values. Further inter-relationship among the selected descriptors is good enoughcompared to their descriptors. This shows the significance ofthe selected descriptor in the toxicity analyses on PCDFs andPCBs.
Waller et al [27] have also carried out QSAR analysis ondioxins and dioxin like compounds using comparative molec-ular field analysis (CoMFA), a three dimensional QSARparadigm, to explore the physico-chemical requirements forbinding to the Ah (dioxin) receptor. The relative successor failure of any CoMFA/QSAR model is dependent onthe procedure adopted for the alignment or superposition,of molecules in the data set. The working hypothesis for
them has been that there might be a stacking interactionoperating in the molecular recognition event in which themost highly halogenated ring would be considered to bethe preferred stacking plane for unsymmetrically substitutedmolecules. They have obtained partial atomic charges at AM1level of calculation, whose reliability is itself questionablecompared to MPA/NPA/HPA derived charges obtained byus at B3LYP/6–31G∗ level DFT calculations. They have ob-tained a correlation coefficient (R = 0.950) using a combinedset of dioxins, furans and biphenyls through the related toxic-ity (pIC50) values. Using only one parameter electrophilicityindex (ω) obtained correlation is sufficiently high for the setof 27 PCDFs (0.891) which is used as the training set andfor the set of PCBs (0.834) which is used as the test set ofthe PCDFs. Similar trend is obtained also in solvent phaseoptimized descriptors with pIC50values for the combined set

126
Table 7. Charge transfer (N ) between different amines and nucleic acid bases/base pairs in gas phase.
S.No. Molecule Adenine Thymine Guanine Cytosine Uracil GCWC ATH
1 Propylamine −0.0808 −0.1213 −0.0484 −0.1005 −0.1360 −0.0857 −0.0960
2 Butylamine −0.0811 −0.1215 −0.0487 −0.1008 −0.1363 −0.0860 −0.0962
3 N-Methylpropylamine −0.0979 −0.1392 −0.0646 −0.1182 −0.1541 −0.1053 −0.1143
4 Amylamine −0.0815 −0.1225 −0.0486 −0.1015 −0.1375 −0.0865 −0.0969
5 N–Methylbutylamine −0.1000 −0.1411 −0.0668 −0.1203 −0.156 −0.1076 −0.1164
6 N,N–Dimethylethylamine −0.1067 −0.1487 −0.0728 −0.1275 −0.1638 −0.1155 −0.1238
7 (+/−)-sec-Butylamine −0.0729 −0.1139 −0.0401 −0.0928 −0.1290 −0.0768 −0.0878
8 Isoamylamine −0.0801 −0.1206 −0.0476 −0.0998 −0.1354 −0.0849 −0.0952
9 1–Methylbutylamine −0.0733 −0.1144 −0.0405 −0.0932 −0.1294 −0.0773 −0.0883
10 1–Ethylpropylamine −0.0759 −0.1169 −0.0431 −0.0958 −0.1319 −0.0802 −0.0910
11 N,N-Diethylmethylamine −0.1076 −0.1495 −0.0736 −0.1283 −0.1646 −0.1164 −0.1247
12 tert–Amylamine −0.0659 −0.1077 −0.0326 −0.0860 −0.1230 −0.0689 −0.0807
13 (+/−)-1,2–Dimethylpropylamine −0.0742 −0.1156 −0.0411 −0.0943 −0.1308 −0.0783 −0.0894
14 Propargylamine −0.0260 −0.0690 0.0077 −0.0462 −0.0851 −0.0235 −0.0392
15 N–Methylpropargylamine −0.0478 −0.0921 −0.0128 −0.0690 −0.1085 −0.0484 −0.0627
16 2–Methoxyethylamine −0.0696 −0.1104 −0.0371 −0.0894 −0.1254 −0.0731 −0.0843
17 3–Methoxypropylamine −0.0746 −0.1157 −0.0418 −0.0945 −0.1307 −0.0788 −0.0897
18 3–Ethoxypropylamine −0.0752 −0.1162 −0.0423 −0.0951 −0.1312 −0.0794 −0.0902
Table 8. Regression models, correlation coefficient (R) and the standard
deviations (SD) for the polychlorinated dibenzo furans and aliphatic amines
in gas phase for the training set using NPA.
System Method Regression Equation N R SD
PCDFs pIC50 = 3.3944 ∗ ω – 5.5788 27 0.891 0.642
Amines NPA pIC50 = 2.1252 ∗ ω−N max –1.6828 18 0.936 0.140
of PCDFs and PCBs. Since the charge transfer process playsa vital role in toxicity analysis, electrophilicity (ω) valuesshould have a direct relation with toxicity. Thus with lessnumber of descriptors, reliable DFT based parameters, goodcontribution from individual descriptors to toxicity and goodinterrelationship among descriptors, have made our selectionof descriptors better for the toxicity analysis of PCDFs andPCBs.
Tysklind et al [51] have analyzed the ethoxyresorufin O-deethylase (EROD) induction of polychlorinated dibenzofu-rans (PCDFs) in the H4IIE rat hepatoma cell bioassay. In or-der to establish a quantitative structure-activity relationship(QSAR) for the toxic equivalency factor (TEF) values, sev-eral physicochemical descriptor variables have been used bythem to chemically characterize the tetra- to octachlorinatedPCDFs. The predicted TEF indicates that a large numberof congeners are potent EROD inducers. But the advantagein our present study over the above analysis is that usingonly one descriptor we are able to get good correlation forthe selected sets of PCDFs and PCBs when compared to 37descriptors used by them, which induces computational diffi-culties and the existence of very low individual contributionsand a virtually no direct relationship of each descriptor withthe toxicity.
Aliphatic amines
Aliphatic amines are known [52] to be electron donors in theirinteraction with biomolecules. Hence for the regression anal-ysis, the ω−
max of the atom with the maximum value of local
Table 9. Experimental and calculated biological activity (pIC50) in gas
phase for the training set of aliphatic amines.
Sl ω−max Observeda Calculated
No. Molecules ω (NPA) log(IGC−150 ) log(IGC−1
50 )
1 Propylamine 0.636 0.459 −0.708 −0.673
2 Butylamine 0.634 0.457 −0.574 −0.678
3 N–Methylpropylamine 0.546 0.363 −0.809 −0.886
4 Amylamine 0.622 0.452 −0.485 −0.689
5 N-Methylbutylamine 0.542 0.359 −0.678 −0.895
6 N,N-Dimethylethylamine 0.477 0.294 −0.908 −1.039
7 (±)–sec-Butylamine 0.663 0.478 −0.671 −0.631
8 Isoamylamine 0.651 0.469 −0.577 −0.651
9 1–Methylbutylamine 0.655 0.471 −0.685 −0.647
10 1–Ethylpropylamine 0.631 0.456 −0.813 −0.680
11 N,N–Diethylmethylamine 0.489 0.303 −0.756 −1.019
12 tert–Amylamine 0.700 0.503 −0.698 −0.576
13 (+/−)-1, 0.637 0.458 −0.710 −0.676
2-Dimethylpropylamine
14 Propargylamine 0.690 0.495 −0.826 −0.594
15 N-Methylpropargylamine 0.636 0.419 −0.982 −0.762
16 2-Methoxyethylamine 0.659 0.002 −1.790 −1.685
17 3-Methoxypropylamine 0.661 0.003 −1.773 −1.683
18 3-Ethoxypropylamine 0.660 0.003 −1.703 −1.683
a Experimental data as given in reference [27].

127
Figure 3. (A) Calculated versus observed values of biological activity (pIC50) for training set of PCDFs, (B) Predicted versus observed values of biological
activity (pIC50) for test set of PCBs in gas phase. Calculated versus observed biological activity (pIC50) values using MPA derived ωi j between guanine and
(C) PCDFs and (D) PCBs.
nucleophilicity (ω−max) at the nitrogen (N) site in a molecule
is considered as an independent variable because there is noglobal nucleophilicity index.
The gas phase data (Table 9) of the training set of aliphaticamines are used for the linear regression analysis (Table 8).The observed along with calculated log(IGC−1
50 ) values arepresented in Table 9. The NPA derived ω−
maxvalues are capa-ble of providing a correlation (R) of 0.936.
In this case the QSAR equation becomes:
pIC50 = 2.2137 (0.2076)∗ω−N max –1.6895 (+0.0822)
N = 18, SE = 0.1493, R = 0.9363, R2adj = 0.8689
t-tests reveal again the significance of the constant and the co-efficient of ω−
N max. The F-ratio was found to be 113.7066,
a high value compared to F (0.01; 1; 17) = 8.4. Q2 leav-ing out 5 points was found to be 0.8243, a high value. Theprobability that the correlation is merely a chance correla-
tion is 0.18 × 10⁻⁵, indicating that a random distribution ofthe points is very unlikely to yield the computed correlationcoefficient.
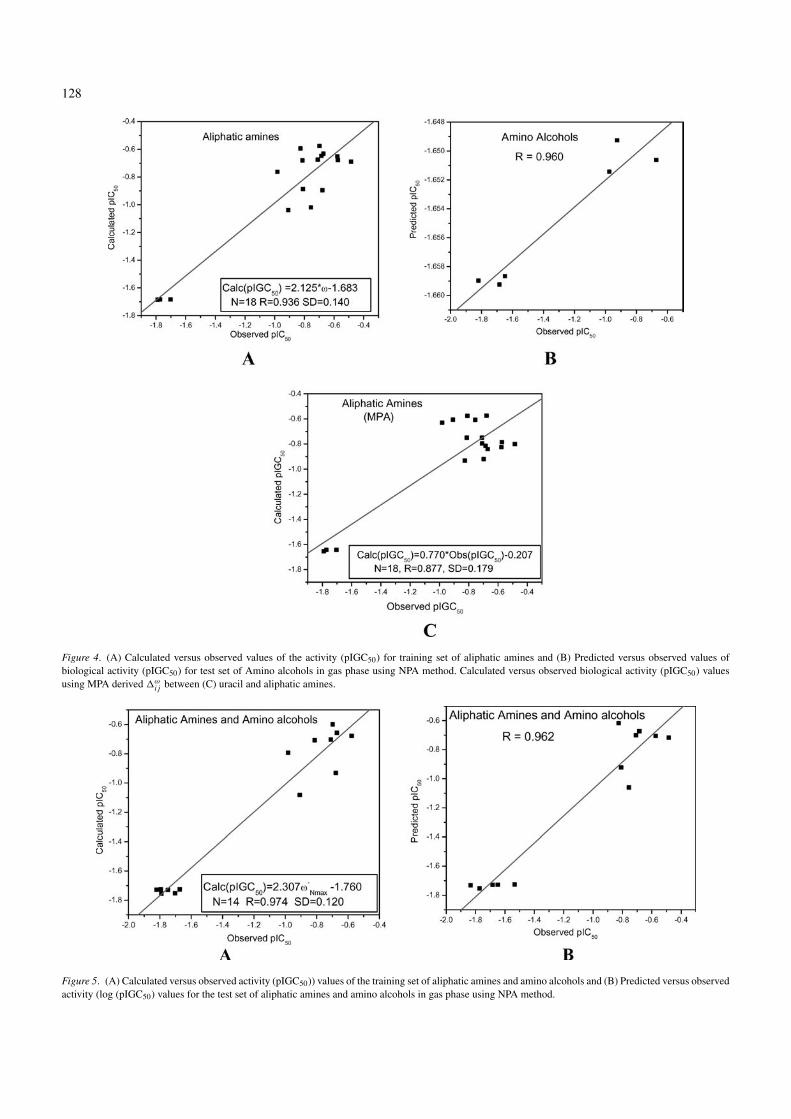
This QSAR model is used to predict the pIC50values ofmolecules in the test set of amino alcohols. Figure 4B showsthe correlation obtained between the experimental activitiesand the ones predicted for the test set using the above QSARequation.
Here R looks good, but the equation is y = 0.0094x −1.6427, which is too far from y = x . Looking at the dis-tribution of the points, it looks more or less like just two“spots”. The high Q squared reported above indicates goodinternal validation, but it is well-known that internal crossvalidation can only decisively point out if a model has badpredictive capacities. A high Q2 does not automatically in-fer high predicitive capacity for an external test set. Maybe more than one descriptor is needed for donor type tox-ins especially with more than one active sites and/or thereis a possibility that two reaction mechanisms play a role. It
128
Figure 4. (A) Calculated versus observed values of the activity (pIGC50) for training set of aliphatic amines and (B) Predicted versus observed values of
biological activity (pIGC50) for test set of Amino alcohols in gas phase using NPA method. Calculated versus observed biological activity (pIGC50) values
using MPA derived ωi j between (C) uracil and aliphatic amines.
Figure 5. (A) Calculated versus observed activity (pIGC50)) values of the training set of aliphatic amines and amino alcohols and (B) Predicted versus observed
activity (log (pIGC50) values for the test set of aliphatic amines and amino alcohols in gas phase using NPA method.

129
Table 10. Experimental and predicted biological activity (pIC50) in gas
phase for the test set of amino alcohols.
ω−N max Observed Calculated
No. Molecules ω (NPA) pIGC50 pIGC50
1 2-(methylamino)ethanol 0.5611 0.0138 −1.8202 −1.6590
2 4-amino-1-butanol 0.6562 0.0172 −0.9752 −1.6514
3 2-(ethylamino)ethanol 0.5658 0.0139 −1.6491 −1.6587
4 2-Propylaminoethanol 0.5548 0.0137 −1.6842 −1.6592
5 DL-2-amino-1-pentanol 0.6623 0.0176 −0.6718 −1.6506
6 3-amino-2, 0.6792 0.0182 −0.9246 −1.6493
2-dimethyl-1-propanol
Table 11a. Experimental and calculated biological activity (pIC50) in gas
phase for the training set of aliphatic amines and amino alcohols.
ω−N max Obs Calc.
No. Molecule ω (NPA) pIGC50 pIGC50
1 2-Methoxyethylamine 0.659 0.002 −1.790 −1.755
2 3-Ethoxypropylamine 0.660 0.003 −1.703 −1.753
3 triethanolamine 0.560 0.013 −1.7488 −1.73
4 2-(methylamino)ethanol 0.561 0.0138 −1.8202 −1.728
5 2-(tert.butylamino)ethano 0.586 0.0145 −1.673 −1.726
6 diethanolamine 0.588 0.0146 −1.7941 −1.726
7 N,N–Dimethylethylamine 0.477 0.294 −0.908 −1.081
8 N–Methylbutylamine 0.542 0.359 −0.678 −0.931
9 N–Methylpropargylamine 0.636 0.419 −0.982 −0.793
10 1–Ethylpropylamine 0.631 0.456 −0.813 −0.707
11 (+/−)-1, 0.637 0.458 −0.710 −0.703
2–Dimethylpropylamine
12 Isoamylamine 0.651 0.469 −0.577 −0.677
13 (+/−)-sec-Butylamine 0.663 0.478 −0.671 −0.657
14 tert-Amylamine 0.700 0.503 −0.698 −0.599
Table 11b. Experimental and predicted biological activity (pIC50) in gas
phase for the test set of aliphatic amines and amino alcohols.
ω−N max Obs Calc.
No. Molecule ω (NPA) pIGC50 pIGC50
1 3-Methoxypropylamine 0.661 0.003 −1.773 −1.7527
2 N-methyldiethanol amine 0.531 0.0122 −1.8338 −1.7315
3 2-Propylaminoethanol 0.555 0.0137 −1.6842 −1.728
4 2-(ethylamino)ethanol 0.566 0.0139 −1.6491 −1.7276
5 3-(methylamino)–1, 0.594 0.0145 −1.5341 −1.7262
2–propanediol
6 N,N–Diethylmethylamine 0.489 0.303 −0.756 −1.0605
7 N–Methylpropylamine 0.546 0.363 −0.809 −0.922
8 Amylamine 0.622 0.452 −0.485 −0.7167
9 Butylamine 0.634 0.457 −0.574 −0.7051
10 Propylamine 0.636 0.459 −0.708 −0.7005
11 1–Methylbutylamine 0.655 0.471 −0.685 −0.6728
12 Propargylamine 0.690 0.495 −0.826 −0.6175
deserves a careful scrutiny. The correlation between ωi j of
amines and uracil (Figure 4C) and the related pIC50 valuesis reasonably well. Toxicity is inversely related to ω
i j , asexpected.
For further cross-validation [53] we have amalgamatedthe training and test sets and generated new sets (Table 11and Figure 5). As usual the correlation is very good. For atraining set (Table 11a and Figure 5a) we have the QSARequation as Y = 2.3074 ∗ X − 1.7596 (both parameters arerelevant as dictated by the t-test), N = 14 (point number 8 is apossible outlier), R = 0.9743, R2
adj = 0.9451, SE = 0.1229,
Q2 = 0.9329, F = 224.5973. This QSAR equation is thenapplied on the test set (Table 11b, Figure 5b) resulting inR = 0.9620 for N = 12. A 2-descriptor correlation analysisis currently underway in our laboratory.
Conclusions
Experimental biological activities (pIC50) of different pol-yaromatic hydrocarbons (PAH) namely polychlorinateddibenzofurans (PCDF) and polychlorinated biphenyls (PCB)are correlated with their corresponding activity (pIC50values)calculated/ predicted using the electrophilicity index throughregression analysis in gas phase. Also in the case of aliphaticamines and amino alcohols local philicity (ω−
max) is shown to
be capable of explaining the activity (log (IGC−150 )) in an ele-
gant manner albeit with slight cross-validation problem. ThePAHs behave as electron acceptors during their interactionswith biosystems, while the aliphatic amines act as electrondonors. A reasonably good correlation has been obtained forall the systems showing the significance of the selected con-ceptual DFT based descriptors in the prediction of toxicitywith similar trends originating from the NPA scheme. Rea-sonably good correlation of the amount of charge transferwith toxicity implies that the charge transfer plays a crucialrole in the observed toxic behavior of PAHs and amines. Rea-sonably well correlations are obtained betweenω
i j and pIC50
values for both electron donor and acceptor type toxins.
Acknowledgments
One of us (P.K.C.) would like to thank Dr. Kunal Roy forkindly inviting him to contribute in this special issue andDrs. Subash C. Basak, Jacques Chertian and R. Natarajan forhelpful discussion. We are thankful to CSIR, New Delhi forfinancial assistance and to Dr. T. Ramasami, Director, CLRI,for his interest and encouragement. One of the authors (J.P.) thanks the Center for Theoretical Studies, I. I. T. Kharag-pur for sponsoring his travel as well as his stay at Kharag-pur. P.B. acknowledges the Fund for Scientific Research-Flanders (FWO-Vlaanderen) for continuous support for hisgroup. SVD acknowledges the Institute for the Promotionof Innovation through Science and Technology in Flanders(IWT-Vlaanderen) for a bursary.
References
1. Parr, R.G. and Yang, W., Density Functional theory of Atoms andMolecules (Oxford University Press: New York) (1989).

130
2. Chermette, H., Chemical reactivity indexes in density functional theory,
J. Comp. Chem., 20 (1999) 129–154.
3. Geerlings, P., De Proft, F. and Langenaeker, W., Conceptual densityfunctional theory, Chem. Rev., 103 (2003) 1793–1874.
4. Chattaraj, P.K., Nath, S. and Maiti, B., “Reactivity descriptors” inComputational Medicinal Chemistry and Drug Discovery. Eds., Tol-
lenaere, J., Bultinck, P., Winter, H. D., and Langenaeker, W. (Marcel
Dekker: New York), Chapter 11, 2003, pp. 295–322.
5. Karelson, M., “Quantum-Chemical descriptors in QSAR” in Compu-tational medicinal chemistry and drug discovery. Eds., Tollenaere, J.,
Bultinck, P., Winter, H. D., and Langenaeker, W. (Marcel Dekker: New
York), Chapter 11, 2004, pp. 641–668.
6. Parr, R.G., Szentpaly, L.V. and Liu, S., Electrophilicity index, J. Am.
Chem. Soc., 121 (1999) 1922–1924.
7. Maynard, A.T. and Covell, D.G., Reactivity of zinc finger cores: Anal-ysis of protein packing and electrostatic screening, J. Am. Chem. Soc.,
123 (2001) 1047–1058.
8. Chattaraj, P.K., Maiti, B. and Sarkar, U., Philicity: A unified treatmentof chemical reactivity and selectivity, J. Phys. Chem. A., 107 (2003)
4973–4975.
9. Thanikaivelan, P., Subramanian, V., Raghava Rao, J. and Nair, B.U.,
Application of quantum chemical descriptor in quantitative structureactivity and structure property relationship, Chem. Phys. Lett., 323
(2000) 59–70.
10. Parthasarathi, R., Subramanian, V., Roy, D.R. and Chattaraj, P.K., Elec-trophilicity index as a possible descriptor of biological activity, Bioorg.
Med. Chem., 12 (2004) 5533–5543.
11. Parthasarathi, R., Padmanabhan, J., Subramanian, V., Maiti, B. and
Chattaraj, P.K., Chemical reactivity profiles of two selected polychlo-rinated biphenyls, J. Phys. Chem. A., 107 (2003) 10346–10352.
12. Parthasarathi, R., Padmanabhan, J., Subramanian, V., Maiti, B. and
Chattaraj, P.K., Toxicity analysis of 33′44′5 – pentachloro biphenylthrough chemical reactivity and selectivity profiles, Current Sci., 86
(2004) 535–542. Parthasarathi, R., Padmanabhan, J., Subramanian, V.,
Sarkar, U., Maiti, B. and Chattaraj, P.K., Toxicity analysis of benzidinethrough chemical reactivity and selectivity profiles: A DFT approach,
Internet Electron J. Mol. Des., 2 (2003) 798–813.
13. Bailey and Love’s ‘Short Practice of Surgery’, Russell, R.C.G., Willi-
ums, N.S., Bulstrode, C., J.K. (eds.), 23rd Edition (Arnold: London),
2000, pp. 1227–1228.
14. Walker, M.K. and Peterson, R.E., Potencies of polychlorinateddibenzo-p-dioxin, dibenzofuran, and biphenyl congeners, relative to2,3,7,8-tetrachlorodibenzo-p-dioxin, for producing early life stagemortality in rainbow trout (Oncorhynchus mykiss), Aquat. Toxicol,
21 (1991) 219–237.
15. Zabel, E.W., Cook, P.M. and Peterson, R.E., Toxic equivalency fac-tors of polychlorinated dibenzo-p-dioxin, dibenzofuran and biphenylcongeners based on early life stage mortality in rainbow trout (On-corhynchus mykiss), Aquat. Toxicol., 31 (1995) 315–328.
16. Hutzinger, O., Blumich, M.J., Berg, M.V.D. and Olie, K., Sources andfate of PCDDs and PCDFs: an overview, Chemosphere, 14 (1985)
581–600.
17. Olie, K., Vermeulen, P.L. and Hutzinger, O., Chlorodibenzo-p-dioxinsand chlorodibenzofurans are trace components of fly ash and flue gasof some municipal incinerators in the Netherlands, Chemosphere, 6
(1977) 455–459.
18. Marklund, S., Rappe, C., Tsyklind, M. and Egeback, K.E., Identifi-cation of polychlorinated dibenzofurans and dioxins in exhausts fromcars run on leaded gasoline, Chemosphere, 16 (1987) 29–36.
19. Lohmann, R. and Jones, K.C., Dioxins and furans in air and deposition:A review of levels, behaviour and processes, Sci. Total Environ., 219
(1998) 53–81.
20. Safe, S.H., Polychlorinated biphenyls (PCBs): Environmental impact,biochemical and toxic responses, and implications for risk assessment,Crit. Rev. Toxicol., 24 (1994) 87–149.
21. Van den Berg, M., Birnbaum, L., Bosveld, A.T., Brunstrom, B., Cook,
P., Feeley, M., Giesy, J.P., Hanberg, A., Hasegawa, R., Kennedy,
S.W., Kubiak, T., Larsen, J.C., van Leeuwen, F.X., Liem, A.K., Nolt,
C., Peterson, R.E., Poellinger, L., Safe, S., Schrenk, D., Tillitt, D.,
Tysklind, M., Younes, M., Waern, F. and Zacharewski, T., Toxic equiv-alency factors (TEFs) for PCBs, PCDDs, PCDFs for humans andwildlife, Environ. Health. Perspet., 106 (1998) 775–792.
22. Oakley, G.G., Devanaboyina, U.S., Robertson, L.W. and Gupta, R.C.,
Oxidative DNA damage induced by activation of polychlorinatedbiphenyls (PCBs): Implications for PCB-Induced oxidative stress inbreast cancer, Chem. Res. Toxicol, 9 (1996) 1285–1292.
23. Erickson, M.D., Analytical Chemistry of PCBs (Butterworth Publish-
ers, Boston) (1986).
24. Silberhorn, E.M., Glauert, H.P. and Robertson, L.W., Carcinogenicityof polyhalogenated biphenyls: PCBs and PBBs, Crit. Rev. Toxicol., 20
(1990) 439–496.
25. Miller, G., Sontum, S. and Crosby, D.G., Electron-acceptor propertiesof chlorinated dibenzo-p-dioxins, Bull. Environ. Contam. Toxicol, 18
(1977) 611–616.
26. Poland, A., Palen, D., and Glover, E., Tumour promotion by TCDD inskin of HRS/J hairless mice, Nature, 300 (1982) 271–273.
27. Waller, C.L. and McKinney, J.D., Three-dimensional quantitativestructure-activity relationships of dioxins and dioxin-like compounds:Model validation and ah receptor characterization, Chem. Res. Toxi-
col. 8 (1995) 847–858.
28. Schultz, T.W., Tetratox: Tetrahymena pyriformis population growthimpairment endpoint-a surrogate for fish lethality, Toxicol, Methods,
7 (1997) 289–309.
29. Pearson, R.G., Chemical hardness – Applications from molecules tosolids (VCH-Wiley: Weinheim) (1997).
30. Parr, R.G., Donnelly, R.A., Levy, M. and Palke, W.E., Electronega-tivity: The density functional viewpoint, J. Chem. Phys., 68 (1978)
3801–3807.
31. Parr, R.G. and Yang, W., Density functional approach to the frontier-electron theory of chemical reactivity, J. Am. Chem. Soc., 106 (1984)
4049.
32. Fukui, K., Role of Frontier Orbitals in Chemical Reactions, Science,
218 (1987) 747–754.
33. Yang, W. and Mortier, W.J., The use of global and local molecularparameters for the analysis of the gas-phase basicity of amines, J. Am.
Chem. Soc., 108 (1986) 5708–5711.
34. Lee, C., Yang, W. and Parr, R.G., Local softness and chemical reactivityin the molecules CO, SCN−and H2CO, J. Mol. Struct. (Theochem),
163 (1988) 305.
35. Cioslowski, J., Martinov, M. and Mixon, S.T., Atomic Fukui indexesfrom the topological theory of atoms in molecules applied to Hartree-Fock and correlated electron densities, J. Phys. Chem, 97 (1993)
10948–10951.
36. Parr, R.G. and Pearson, R.G., Absolute hardness: Companion parame-ter to absolute electronegativity, J. Am. Chem. Soc., 105 (1983) 7512–
7516.
37. Sanderson, R. T., An interpretation of bond lengths and a classificationof bonds, Science, 114 (1951) 670.
38. Espinosa, A., Frontera, A., Garcıa, R., Soler, M.A. and Tarraga, A.,
Electrophilic behavior of 3-methyl-2-methylthio-1,3,4-thiadiazoliumsalts: A multimodal theoretical approach, ARKIVOC, (ix) (2005) 415–
437.
39. Becke, A.D., Density-functional exchange-energy approximation withcorrect asymptotic behavior, Phys. Rev. A., 38 (1998) 3098–3100.
Hariharan, P. C. and Pople, J. A., Theor. Chim. Acta., 28 (1973) 213.
40. Lee, C., Yang, W. and Parr, R.G., Development of the Colle-Salvetticorrelation-energy formula into a functional of the electron density,
Phys. Rev. B., 37 (1988) 785–789.
41. Gaussian 03 & Gaussian 98, Revision B.03; Gaussian, Inc.: Pittsburgh,
PA.
42. Mulliken, R. S., Electronic population analysis on LCAO–MO molec-ular wave functions, I , J. Chem. Phys., 23 (1955) 1833–1840.
43. Reed, A.E. and Weinhold, F., Natural bond orbital analysis of near-Hartree-Fock water dimmer, J Chem Phys., 78 (1983) 4066–4073.

131
44. Reed, A.E., Weinstock, R.B. and Weinhold, F., Natural populationanalysis, J. Chem. Phys., 83 (1985) 735–746.
45. Hirshfeld, F.L., Bonded-atom fragments for describing molecularcharge densities, Theor. Chim. Acta., 44 (1977) 129–138.
46. DMOL3, Accelrys, Inc. San Diego, California.
47. MATLAB, The Math Works (Inc.: Natick, U.S.A), (1999).
48. Pecka, J. and Ponec, R., Simple analytical method for evaluation ofstatistical importance of correlations in QSAR studies, J. Math. Chem.,
27 (2000) 13–22.
49. Basak, S.C., Chertian, J., Natarajan, R.; Private communication.
50. Arulmozhiraja, S. and Morita, M., Structure-activity relationshipsfor the toxicity of polychlorinated dibenzofurans: Approach through
density functional theory-based descriptors, Chem. Res. Toxicol., 17
(2004) 348–356.
51. Tysklind, M., Tillitt, D., Eriksson, L., Lundgren, K. and
Rappe, C., A toxic equivalency factor scale for polychlori-nated dibenzofurans, Fundam. Appl. Toxicol., 22 (1994) 277–
285.
52. Roy, D.R., Parthasarathi, R., Maiti, B., Subramanian, V. and Chattaraj,
P.K., Electrophilicity as a possible descriptor for toxicity prediction,
Bioorg. Med. Chem., 13 (2005) 3405–3412.
53. Hawkins, D.M., Basak, S.C. and Mills, D., Assessing modelfit by cross-validation, J. Chem. Inf. Comput. Sci., 43 (2003)
579–586.