ANALYZING EFFECTS OF AIRDECKS ON FRAGMENTATION ...
201
ANALYZING EFFECTS OF AIRDECKS ON FRAGMENTATION AND ECONOMICS OF BENCH BLASTING Submitted by Shahab Saqib 2007-PhD-MIN-02 Supervisor Prof. Dr. Syed Muhammad Tariq Co-Supervisor Dr. Zulfiqar Ali Department of Mining Engineering University of Engineering and Technology Lahore, Pakistan (2016)
-
Upload
khangminh22 -
Category
Documents
-
view
2 -
download
0
Transcript of ANALYZING EFFECTS OF AIRDECKS ON FRAGMENTATION ...

ANALYZING EFFECTS OF AIRDECKS ON FRAGMENTATION AND
ECONOMICS OF BENCH BLASTING
Submitted by
Shahab Saqib
2007-PhD-MIN-02
Supervisor
Prof. Dr. Syed Muhammad Tariq
Co-Supervisor
Dr. Zulfiqar Ali
Department of Mining Engineering
University of Engineering and Technology
Lahore, Pakistan
(2016)
i
ii
DECLARATION
I ―Shahab Saqib‖ declare that the thesis entitled: ―ANALYZING EFFECTS
OF AIRDECKS ON FRAGMENTATION AND ECONOMICS OF BENCH
BLASTING” is my own research wok and is being submitted for the partial
fulfilment for the degree of PhD in Mining Engineering. The thesis contains no
material that has been accepted and published for the award of any degree.
___________________
Signature
iii
External Examiners:
From Aboard:
i) Dr. Paul N. Worsey,
Professor,
Department of Mining & Nuclear Engineering, Missouri University of Science &
Technology, Rolla Missouri, USA.
ii) Dr. Zacharias G. Agioutantis,
Professor,
Department of Mining Engineering, University of Kentucky, Lexington, USA.
iii) Dr. Steven J.Schafrik,
Associate Professor,
Department of Mining and Minerals Engineering, Virginia Polytechnic Institute and
State University, Blacksburg, V A, USA.
From Pakistan:
Dr. F. A. K. Kirmani,
Professor ®
Mining Engineering Department, University of Engineering & Technology,
Lahore.
Internal Examiner:
Prof.(R) Dr. Syed Muhammad Tariq (Supervisor)
Dr. Zulfiqar Ali (Co-Supervisor)
Mining Engineering Department,
University of Engineering and Technology, Lahore
iv
ABSTRACT
The airdeck blasting technique has been used in the past to reduce the
explosive charge and to improve the rock fragmentation. However, the mining and
construction industry of Pakistan has always been reluctant to use airdecks in their
blasting operations. This is due to the fact that researchers and practitioners have a
divided opinion about the efficiency of this technique. In fact, several attempts in the
past have been made to find out the best position and optimum length of airdeck for
better fragmentation. Since, in the previous studies most of experiments were carried
out under varying geological conditions, it was very difficult to suggest the best
possible location and optimum length for airdeck in an explosive column for better
fragmentation.
In order to find out the best position of airdeck in explosive column that yields
better fragmentation, it was necessary to carry out all experiments on homogeneous
material and in controlled geological conditions. So that research findings indicate a
correlation between the concerned variables only and a benchmark research could be
established. Therefore, special homogeneous concrete blocks were designed for this
research. These concrete blocks eliminated the heterogeneity and anisotropy of rock
material, such as the fractures, folds, faults and joints of rock. Such factors have been
found to play a very crucial role in the size of debris produced from the blasted rock
material. This research will address two fundamental questions; the technical and the
economic efficiency of the airdeck blasting technique.
All the blasting experiments in this study were carried out in two phases. In
the first phase, a series of small scale experiments was conducted using homogeneous
concrete blocks. In order to find out the proper position and optimized length of the
airdeck, it was ensured that the concrete blocks had almost the same uniaxial
compressive strength. More than 40 tests with concrete blocks were performed for
this purpose. The evaluation of fragmentation by sieve analysis revealed that an
improved rock fragmentation was achieved when the airdeck was placed in the center
of the explosive column. Moreover, it was also observed that the mean blasted rock
fragment size increased with the increase in airdeck size and the best results were
achieved at 20% airdeck length.
v
In the second phase of this research, the results of experimentation on concrete
blocks were validated on relatively homogeneous limestone at two cement quarries:
DG. Cement Chakwal and Askari Cement Nizampur. Several test blasts were carried
out with full column charge without airdeck and with 20% airdeck length placed at
middle of explosive column. The analysis of fragmentation for the benches after blast
was done using Split Desktop software. Subsequently it was deciphered that at both
the cement quarries, better fragmentation was achieved by placing airdeck at middle
of explosive column as compared to when there was no airdeck in the full column
charge. This research work also includes the use of multiple airdeck lengths placed at
middle position of explosive column for the limestone quarry and the results indicate
improved fragmentation.
The results of this research work clearly indicate that airdeck, when placed at
middle position of an explosive column produce more uniform blasted rock size
distribution compared to that at other positions. Moreover, the optimum length of
airdeck is 20% of the total length of explosive column and it improves environmental
factors like fly rocks, air blast, ground vibrations etc. The underlying reason behind
this is that the airdeck at middle position results in multiple impacts of shock wave
that leads to an efficient transfer of explosive energy in the surrounding rocks.
Economic analysis of explosive cost at both quarries was also conducted in
this study. From economic analysis at DG Cement Chakwal, it was observed that up
to 2.5 rupees per tonne of explosive cost could be saved by adopting 20% mid-airdeck
length in the explosive column as compared to the cost incurred for conventional
blasting techniques. By using above mentioned technique, saving per tonne can be
increased by 16% and rupees 750,000 can be saved at the DG. Cement quarry
monthly assuring an annual saving of rupees 9 million.
Similarly, the economic analysis conducted from the results of blasting at
Askari Cement Nizampur, it was observed that 2.6 rupees per tonne of explosive cost
can be saved by adopting 20% mid-airdeck length in the explosive column to enhance
the fragments as compared to the cost incurred for conventional blasting techniques.
Therefore, using 20% mid-airdeck length in explosive column, saving per tonne can

vi
be increased by 10.4% and rupees 468,000 can be saved at the Askari Cement quarry
monthly assuring an annual saving of 5.6 million rupees.
By using 20% airdeck lengths in explosive column, Rs. 44.33 million can be
saved annually for explosive used by Punjab, province of Pakistan. This amount can
be calculated for other provinces of the Pakistan as well. There are many other
minerals is Pakistan which require blasting for their production. If we could use the
improved airdeck blasting technique for the production of those minerals, billions of
rupees can be saved annually. Moreover, by incorporating the effect of even
fragmentation from blasting on downstream processes like crushing, milling etc.
millions of rupees can be saved.
It is anticipated that this study will provide answers and guide lines to
researchers and practitioners who were confused about best location and optimum
length of airdeck to be used in explosive column for achieving the optimum
fragmentation.
Keywords: Mining; Quarry; Concrete Block; Explosive; Airdeck; Blasting
vii
ACKNOWLEDGEMENTS
All praises and thanks to Almighty Allah (SWT),who blessed me and made
me capable to complete my PhD work. Peace and all blessings be upon his beloved
Holy prophet, Hazrat Muhammad (PBUH), whose guidance paved the way of humans
to civilization and saved humanity from the life of ignorance. He (PBUH) taught us
the way to live and be successful not only in this materialistic world but also in the
immortal life hereafter.
I feel privileged to offer my sincerest gratitude to my supervisor, Prof. Dr.
Syed Muhammad Tariq, and co-supervisor Dr. Zulfiqar Ali who have supported me
throughout my thesis with their guidance and knowledge whilst allowing me to
research in my own way under their guidance to achieve the destination. I attribute the
level of my PhD. degree to their encouragement and efforts and without their
supervision this thesis, too, would not have been completed.
I am thankful to the each member of Mining Engineering department who
helped me complete my research work. I am thankful to Dr. Zaka Emad and Mirza
Muhammad Zaid for their sincere help and encouragement during the whole time that
I have spent to do my humble work and to do something better for the mining, in an
effort to give some benefits to humanity. I am also paying my gratitude to the lab staff
of Mining & and Civil Engineering department who sincerely worked to pave my way
towards practical applications of my work.
My special thanks to University of Engineering and Technology because the
institution has always been proud for me and I always feel happy to do my research
work and put my efforts to pay tribute to my alma mater, which provided me this
prestigious opportunity. I am also thankful to M/S DG. Cement Chakwal and M/S
Askari Cement Nizampur who have helped me without any conditions for the
practical applications of my research work.
Last but not the least, I am thankful to my parents who brought me up and
made me capable to get the most esteemed degree of education. My special thanks to

viii
my wife and children because their help and smiling face always encouraged me to do
something best for them.
Shahab Saqib
ix
TABLE OF CONTENTS
Chapter Description Page No.
ACKNOWLEDGEMENTS ....................................................................................... VII
TABLE OF CONTENTS ............................................................................................ IX
LIST OF FIGURES ................................................................................................ XXII
CHAPTER 1. INTRODUCTION .............................................................................1
1.1 GENERAL ....................................................................................................1
1.2 PROBLEM STATEMENT ...........................................................................2
1.3 OBJECTIVES ...............................................................................................3
1.4 SCOPE ...........................................................................................................3
1.5 THESIS ORGANIZATION ..........................................................................3
CHAPTER 2. REVIEW OF LITERATURE ............................................................5
2.1 EXPLOSIVES AND BLASTING .................................................................5
2.1.1 Blasting Theories and Rock Breakage .........................................................5
2.1.1.1 Reflection theory (reflected stress waves) .......................................... 6
2.1.1.2 Gas expansion theory ......................................................................... 6
2.1.1.3 Flexural rupture ................................................................................. 6
2.1.1.4 Stress waves and gas expansion theory ............................................. 7
2.1.1.5 Stress waves, gas expansion and stress wave/flaw theory ................. 7
2.1.1.6 Nuclei or stress wave/flaw theory ...................................................... 8
2.1.1.7 Torque theory ..................................................................................... 9
2.1.1.8 Cratering theory ................................................................................. 9
2.1.1.8.1 Cratering mechanism ......................................................................... 9
2.2 DIFFERENT METHODS TO IMPROVE FRAGMENTATION ..............10
ABSTRACT ............................................................................. ................................ IV

x
2.2.1 Effect of Timing on Blast Fragmentation...................................................11
2.2.2 New Work with Reference to Blast Fragmentation ....................................12
2.3 AIRDECK BLASTING TECHNIQUE .......................................................14
2.3.1 Understanding the Mechanism of Airdeck Blasting ..................................19
2.3.2 Airdeck Location ........................................................................................19
2.3.3 Airdeck Length ...........................................................................................20
2.3.4 Plugging Devices for Airdecking ...............................................................23
2.3.5 Effect of Airdecking on Fragmentation......................................................25
2.3.6 Economics of Airdeck Blasting ..................................................................26
2.4 METHODS FOR DETERMINING FRAGMENT SIZE DISTRIBUTION ...
.....................................................................................................................29
2.4.1 Sieving ........................................................................................................29
2.4.2 Digital Image Analysis ...............................................................................29
2.5 IMPORTANCE OF BLAST FRAGMENTATION ....................................30
2.5.1 Effects of Blast Fragmentation on Downstream Processes .......................31
2.5.1.1 Loading and hauling ........................................................................ 32
2.5.1.2 Crushing and grinding ..................................................................... 33
2.5.2 Effects of Blast Fragments on Energy Consumption in Crushing and
Grinding .....................................................................................................33
2.5.3 Effects of Blast Fragments from Mine to Mill ...........................................34
CHAPTER 3.LABORATORY SCALE EXPERIMENTATION AND RESULTS ....37
3.1 BACKGROUND .........................................................................................37
3.2 MODEL MATERIAL .................................................................................37
3.2.1 Dimensions of Blocks .................................................................................38

xi
3.3 EXPERIMENTAL SETUP .........................................................................39
3.3.1 Casting of Concrete Block .........................................................................39
3.3.2 Blast Design of Concrete Block .................................................................44
3.4 EXPERIMENTAL PROGRAM ..................................................................45
3.4.1 Different Steps Involved in Charging of Block ..........................................46
3.4.2 Blasting Testing .........................................................................................47
3.5 CONVENTIONAL BLASTING WITH FULL COLUMN CHARGE .....48
3.5.1 Charge Loading .........................................................................................48
3.6 MODIFIED BLASTING WITH AIRDECK AT DIFFERENT POSITIONS
OF EXPLOSIVE COLUMN ...........................................................................50
3.6.1 Airdeck Location ........................................................................................50
3.6.1.1 Concrete blocks with 20% airdeck length at top of explosive column
......................................................................................................... 50
3.6.1.1.1 Charge loading in case of 20% top airdeck blast ............................ 51
3.6.1.2 Concrete blocks with 20% airdeck length at mid of explosive column
......................................................................................................... 52
3.6.1.2.1 Charge loading in case of 20%mid-airdeck blast ............................ 53
3.6.1.3 Concrete blocks with 20% airdeck at bottom of explosive column . 55
3.6.1.3.1 Charge loading in case of 20% bottom airdeck blast ...................... 55
3.6.1.4 Results and discussion ..................................................................... 56
3.6.2 Optimum Airdeck Length ...........................................................................61
3.6.2.1 Concrete blocks with 10% airdeck length at the middle of the
explosive column ............................................................................. 61
3.6.2.1.1 Charge loading in case of 10% mid-airdeck blast........................... 61
3.6.2.2 Concrete blocks with 20% airdeck length at mid of explosive column
......................................................................................................... 63
xii
3.6.2.2.1 Charge loading in case of 20% mid-airdeck blast........................... 63
3.6.2.3 Concrete blocks with 30% airdeck length at mid of explosive column
......................................................................................................... 65
3.6.2.3.1 Charge loading in case of 30% mid-airdeck blast........................... 65
3.6.2.4 Concrete blocks with 40% airdeck length at the middle of the
explosive column ............................................................................. 67
3.6.2.4.1 Charge loading in case of 40% mid-airdeck blast........................... 67
3.6.2.5 Concrete blocks with 50% airdeck length at mid of explosive column
......................................................................................................... 69
3.6.2.5.1 Charge loading in case of 50% mid-airdeck blast........................... 69
3.6.2.6 Results and discussion ..................................................................... 71
CHAPTER 4. VALIDATION AT DG.CEMENT CHAKWAL .............................74
4.1 DG.CEMENT CHAKWAL ........................................................................74
4.1.1 Geology of Study Area ...............................................................................74
4.1.1.1 Limestone deposits at the site .......................................................... 75
4.1.1.2 Sakesar formation ............................................................................ 75
4.1.2 Current Blasting Practices at DG. Cement Chakwal ................................76
4.1.2.1 Drilling ............................................................................................. 76
4.1.2.2 Drilling pattern ................................................................................ 76
4.1.2.3 Blasting ............................................................................................ 77
4.1.2.4 Explosives ........................................................................................ 77
4.1.2.5 Initiation system ............................................................................... 77
4.1.2.6 Blast design ...................................................................................... 77
4.1.2.7 Charging scheme ............................................................................. 78
4.1.2.8 Particle size distribution of conventional blast rock fragmentation 78
4.2 FULL SCALE FIELD EXPERIMENTATION AND RESULTS ..............80
xiii
4.2.1 Conventional Blasting with Full Column Charge at Bench Number-1 .....80
4.2.1.1 Charge loading ................................................................................ 81
4.2.1.2 Conventional blast design parameters at bench number-1 ............. 81
4.2.1.3 Drilling pattern of full column charge holes at bench number-1 .... 82
4.2.1.4 Firing pattern of full column charge holes at bench number-1 ....... 82
4.2.2 Assessment of Blast Performance by Split Desktop ...................................84
4.1.2.1 Introduction of software ................................................................... 84
4.1.2.2 How it works .................................................................................... 85
4.1.2.3 Digital fragmentation analysis ........................................................ 86
4.2.3 Cost Per Tonne of Limestone Extracted by Conventional Blasting with Full
Column Charge at Bench Number-1..........................................................86
4.2.4 Modified Blast using 20% Airdeck Length at the Middle of Explosive
Column at Bench Number-1 .......................................................................87
4.2.4.1 Charge loading ................................................................................ 88
4.2.4.2 Design parameters of each hole for 20% airdeck blast at bench
number-1 ......................................................................................... 89
4.2.4.3 Drilling pattern of blastholes with 20% airdeck length at mid of
explosive column, at bench number-1 ............................................. 90
4.2.4.4 Firing pattern of blastholes with 20% airdeck length at mid of
explosive column, at bench number-1 ............................................. 90
4.2.4.5 Digital fragmentation analysis ........................................................ 92
4.2.4.6 Cost per tonne of limestone extracted by modified blasting method,
using 20% mid-airdeck length of explosive column at bench
number-1 ......................................................................................... 93
4.2.5 Modified Blast using 20% Airdeck Length at the Top of Explosive Column
at Bench Number-1 ....................................................................................94
xiv
4.2.5.1 Charge Loading ............................................................................... 94
4.2.5.2 Drilling pattern of 20% top airdeck blast at bench number-1......... 95
4.2.5.3 Firing pattern of 20% top airdeck blast at bench number-1 ........... 96
4.2.5.4 Fragmentation analysis ................................................................... 96
4.2.6 Modified Blast using 20% Airdeck Length at the Bottom of Explosive
Column at Bench Number-1 .......................................................................97
4.2.6.1 Charge loading ................................................................................ 97
4.2.6.2 Drilling pattern of 20% bottom airdeck blast at bench number-1... 98
4.2.6.3 Firing pattern of 20% bottom airdeck blast at bench number-1. .... 98
4.2.6.4 Fragmentation analysis ................................................................... 99
4.2.7 Comparison of Blast Performance of all the Shots Fired at Bench
Number-1 .................................................................................................100
4.2.7.1 % age reduction in fragment size with respect to FXO series by
using 20% airdeck length in explosive column at bench number-1
....................................................................................................... 100
4.3 FULL SCALE BLASTS ...........................................................................103
4.3.1 Full Scale Conventional Blast with Full Column Charge at Bench
Number-2 .................................................................................................104
4.3.1.1 Conventional blast design parameters at bench number-2 ........... 105
4.3.1.2 Loading scheme of each hole in case of full scale conventional blast
with full column charge at bench number-2 .................................. 105
4.3.1.3 Drilling pattern of conventional blast with full column charge at
bench number- 2 ............................................................................ 106
4.3.1.4 Firing pattern of full scale conventional blast at bench .............
number-2 ............................................................................... 107
4.3.1.5 Fragmentation analysis ................................................................. 108

xv
4.3.1.6 Cost per tonne of limestone extracted by conventional blasting with
full column charge at bench number-2 .......................................... 109
4.3.2 Modified Full Scale Blast using 20% Airdeck Length at the Middle of
Explosive Column at Bench Number-2 ....................................................110
4.3.2.1 Design parameters of full scale 20% mid-airdeck blast at bench
number-2 ....................................................................................... 110
4.3.2.2 Loading scheme of each blasthole in case of full scale 20% mid-
airdeck blast at bench number-2 ................................................... 111
4.3.2.3 Drilling pattern of full scale 20%mid-airdeck blast at bench
number-2 ....................................................................................... 112
4.3.2.4 Firing pattern of full scale 20% mid-airdeck blast at bench
number-2 ....................................................................................... 112
4.3.2.5 Fragmentation analysis of 20% mid-airdeck blast at bench
number-2 ....................................................................................... 114
4.3.2.6 Cost per tonne of limestone extracted by modified blasting method
with 20% airdeck length at mid of explosive column at bench
number-2 ....................................................................................... 115
4.3.3 Comparison of Blast Performance of all Blasts Fired at Bench Number-2
..................................................................................................................116
4.3.3.1 %age reduction in fragment size with respect to FXO Series by
using 20% mid airdeck length in explosive column at bench
number-2 ....................................................................................... 116
4.3.3.2 Muckpile displacement at bench number -2 .................................. 118
4.3.3.3 Over break at bench number -2 ..................................................... 118
4.3.3.4 Level of floor at bench number-2 ................................................... 119
4.4 USE OF MULTIPLE AIRDECKS IN THE BLAST HOLE ....................119
4.4.1 Conventional Blasting with Full Column Charge at Bench Number-3 ..119
4.4.1.1 Conventional blast design parameters at bench number -3 .......... 119
xvi
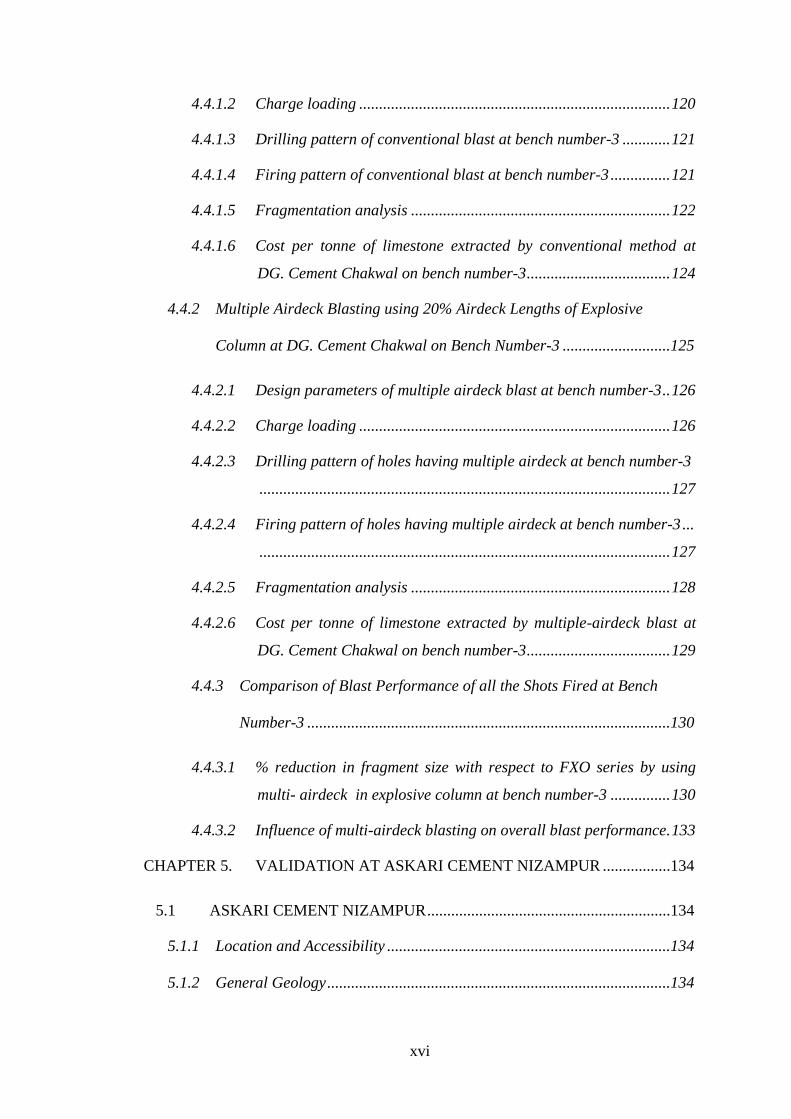
4.4.1.2 Charge loading .............................................................................. 120
4.4.1.3 Drilling pattern of conventional blast at bench number-3 ............ 121
4.4.1.4 Firing pattern of conventional blast at bench number-3 ............... 121
4.4.1.5 Fragmentation analysis ................................................................. 122
4.4.1.6 Cost per tonne of limestone extracted by conventional method at
DG. Cement Chakwal on bench number-3 .................................... 124
4.4.2 Multiple Airdeck Blasting using 20% Airdeck Lengths of Explosive
Column at DG. Cement Chakwal on Bench Number-3 ...........................125
4.4.2.1 Design parameters of multiple airdeck blast at bench number-3 .. 126
4.4.2.2 Charge loading .............................................................................. 126
4.4.2.3 Drilling pattern of holes having multiple airdeck at bench number-3
....................................................................................................... 127
4.4.2.4 Firing pattern of holes having multiple airdeck at bench number-3 ...
....................................................................................................... 127
4.4.2.5 Fragmentation analysis ................................................................. 128
4.4.2.6 Cost per tonne of limestone extracted by multiple-airdeck blast at
DG. Cement Chakwal on bench number-3 .................................... 129
4.4.3 Comparison of Blast Performance of all the Shots Fired at Bench
Number-3 ...........................................................................................130
4.4.3.1 % reduction in fragment size with respect to FXO series by using
multi- airdeck in explosive column at bench number-3 ............... 130
4.4.3.2 Influence of multi-airdeck blasting on overall blast performance. 133
CHAPTER 5. VALIDATION AT ASKARI CEMENT NIZAMPUR .................134
5.1 ASKARI CEMENT NIZAMPUR .............................................................134
5.1.1 Location and Accessibility .......................................................................134
5.1.2 General Geology ......................................................................................134
xvii
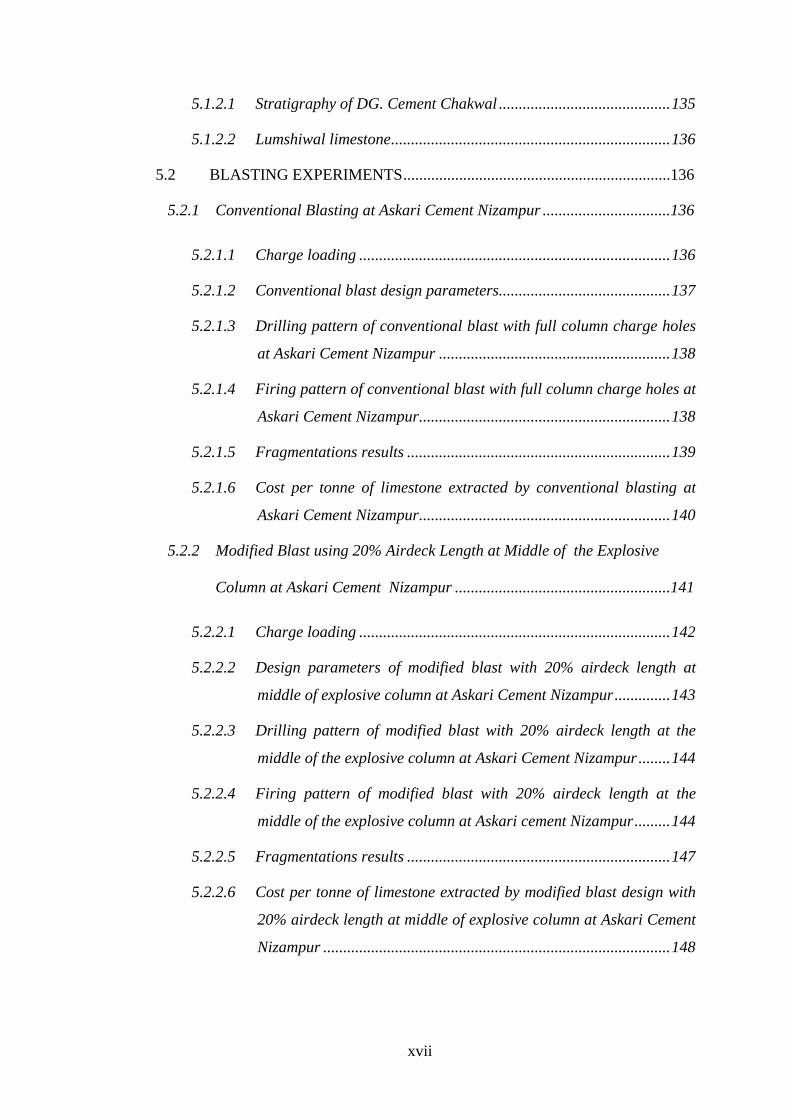
5.1.2.1 Stratigraphy of DG. Cement Chakwal ........................................... 135
5.1.2.2 Lumshiwal limestone ...................................................................... 136
5.2 BLASTING EXPERIMENTS ...................................................................136
5.2.1 Conventional Blasting at Askari Cement Nizampur ................................136
5.2.1.1 Charge loading .............................................................................. 136
5.2.1.2 Conventional blast design parameters........................................... 137
5.2.1.3 Drilling pattern of conventional blast with full column charge holes
at Askari Cement Nizampur .......................................................... 138
5.2.1.4 Firing pattern of conventional blast with full column charge holes at
Askari Cement Nizampur ............................................................... 138
5.2.1.5 Fragmentations results .................................................................. 139
5.2.1.6 Cost per tonne of limestone extracted by conventional blasting at
Askari Cement Nizampur ............................................................... 140
5.2.2 Modified Blast using 20% Airdeck Length at Middle of the Explosive
Column at Askari Cement Nizampur ......................................................141
5.2.2.1 Charge loading .............................................................................. 142
5.2.2.2 Design parameters of modified blast with 20% airdeck length at
middle of explosive column at Askari Cement Nizampur .............. 143
5.2.2.3 Drilling pattern of modified blast with 20% airdeck length at the
middle of the explosive column at Askari Cement Nizampur ........ 144
5.2.2.4 Firing pattern of modified blast with 20% airdeck length at the
middle of the explosive column at Askari cement Nizampur ......... 144
5.2.2.5 Fragmentations results .................................................................. 147
5.2.2.6 Cost per tonne of limestone extracted by modified blast design with
20% airdeck length at middle of explosive column at Askari Cement
Nizampur ....................................................................................... 148
xviii
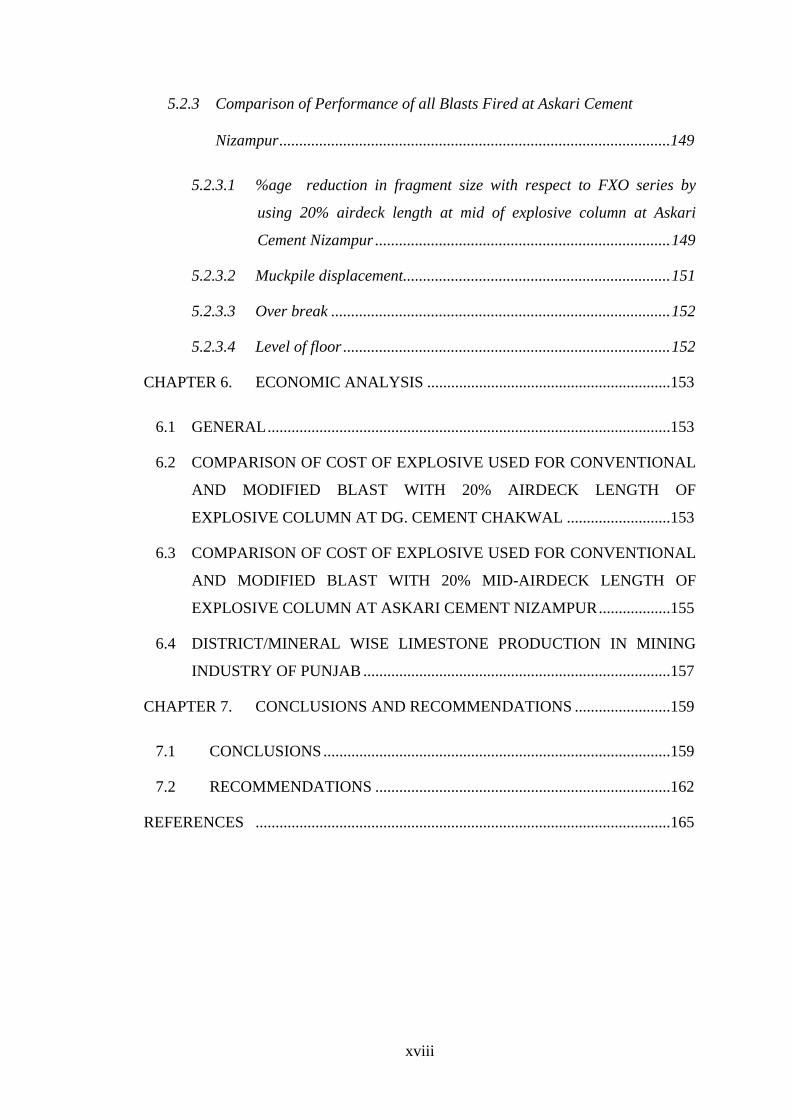
5.2.3 Comparison of Performance of all Blasts Fired at Askari Cement
Nizampur ..................................................................................................149
5.2.3.1 %age reduction in fragment size with respect to FXO series by
using 20% airdeck length at mid of explosive column at Askari
Cement Nizampur .......................................................................... 149
5.2.3.2 Muckpile displacement................................................................... 151
5.2.3.3 Over break ..................................................................................... 152
5.2.3.4 Level of floor .................................................................................. 152
CHAPTER 6. ECONOMIC ANALYSIS .............................................................153
6.1 GENERAL .....................................................................................................153
6.2 COMPARISON OF COST OF EXPLOSIVE USED FOR CONVENTIONAL
AND MODIFIED BLAST WITH 20% AIRDECK LENGTH OF
EXPLOSIVE COLUMN AT DG. CEMENT CHAKWAL ..........................153
6.3 COMPARISON OF COST OF EXPLOSIVE USED FOR CONVENTIONAL
AND MODIFIED BLAST WITH 20% MID-AIRDECK LENGTH OF
EXPLOSIVE COLUMN AT ASKARI CEMENT NIZAMPUR ..................155
6.4 DISTRICT/MINERAL WISE LIMESTONE PRODUCTION IN MINING
INDUSTRY OF PUNJAB .............................................................................157
CHAPTER 7. CONCLUSIONS AND RECOMMENDATIONS ........................159
7.1 CONCLUSIONS .......................................................................................159
7.2 RECOMMENDATIONS ..........................................................................162
REFERENCES ........................................................................................................165
xix
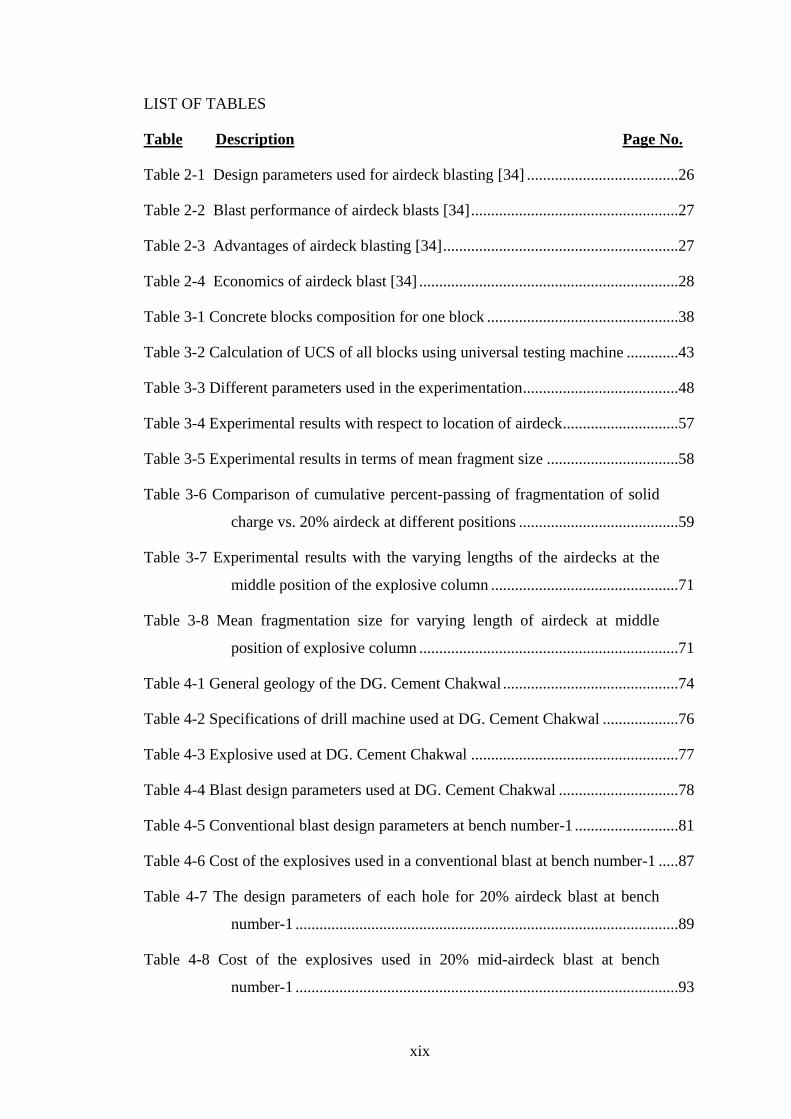
LIST OF TABLES
Table Description Page No.
Table 2-1 Design parameters used for airdeck blasting [34] ......................................26
Table 2-2 Blast performance of airdeck blasts [34] ....................................................27
Table 2-3 Advantages of airdeck blasting [34] ...........................................................27
Table 2-4 Economics of airdeck blast [34] .................................................................28
Table 3-1 Concrete blocks composition for one block ................................................38
Table 3-2 Calculation of UCS of all blocks using universal testing machine .............43
Table 3-3 Different parameters used in the experimentation .......................................48
Table 3-4 Experimental results with respect to location of airdeck .............................57
Table 3-5 Experimental results in terms of mean fragment size .................................58
Table 3-6 Comparison of cumulative percent-passing of fragmentation of solid
charge vs. 20% airdeck at different positions ........................................59
Table 3-7 Experimental results with the varying lengths of the airdecks at the
middle position of the explosive column ...............................................71
Table 3-8 Mean fragmentation size for varying length of airdeck at middle
position of explosive column .................................................................71
Table 4-1 General geology of the DG. Cement Chakwal ............................................74
Table 4-2 Specifications of drill machine used at DG. Cement Chakwal ...................76
Table 4-3 Explosive used at DG. Cement Chakwal ....................................................77
Table 4-4 Blast design parameters used at DG. Cement Chakwal ..............................78
Table 4-5 Conventional blast design parameters at bench number-1 ..........................81
Table 4-6 Cost of the explosives used in a conventional blast at bench number-1 .....87
Table 4-7 The design parameters of each hole for 20% airdeck blast at bench
number-1 ................................................................................................89
Table 4-8 Cost of the explosives used in 20% mid-airdeck blast at bench
number-1 ................................................................................................93
xx
Table 4-9 Fragmentation results of conventional, 20% mid,20% top and 20%
bottom airdeck blasts at bench number-1 ............................................101
Table 4-10 Full scale conventional blast design parameters at bench number-2 ......105
Table 4-11 Cost of the explosive used in full scale conventional blast with full
column charge at bench number-2 .......................................................109
Table 4-12 Blast design parameters of full scale 20% mid-airdeck blast at bench
number-2 ..............................................................................................111
Table 4-13 Cost of the explosive used for full scale 20% mid-airdeck blast at
bench number-2....................................................................................115
Table 4-14 Fragmentation results of full scale conventional and 20% mid-
airdeck blast at bench number-2 ..........................................................116
Table 4-15 Muckpile distances ..................................................................................118
Table 4-16 Design parameters for conventional blast with full column charge at
DG. Cement Chakwal on bench number-3 ..........................................120
Table 4-17 Cumulative percentage passing of fragments of conventional blast at
DG. Cement Chakwal on bench number-3 ..........................................123
Table 4-18 Total quantity and cost of the explosive used per hole in
conventional blast with full column charge at DG. Cement
Chakwal on bench number-3 ...............................................................124
Table 4-19 Design parameters of multiple airdeck blast at bench number-3 ............126
Table 4-20 Cumulative percentage passing verses sieve sizes for fragments of
multi- airdeck blast...............................................................................128
Table 4-21 Total quantity and cost of the explosive used per hole in multi-
airdeck blast at bench number-3 ..........................................................129
Table 4-22 Comparison of percentage passing of conventional and multi-airdeck
blast for different sieve sizes at bench number-3 .................................131
Table 4-23 Cost comparison of conventional and multi-airdeck blast at bench
number-3 ..............................................................................................132
Table 4-24 Blast performance of multi-airdecked blast at bench number-3 .............133

xxi
Table 5-1 Stratigraphical sequence of the site at Askari Cement Nizampur .............135
Table 5-2 Conventional blast design parameters with full column charge at
Askari Cement Nizampur.....................................................................137
Table 5-3 Total quantity and cost of the explosive used in conventional blast
with full column charge at Askari Cement Nizampur .........................140
Table 5-4 Modified blast design parameters with 20% airdeck length at middle
of explosive column at Askari Cement Nizampur ...............................143
Table 5-5 Total quantity and cost of the explosive used in the blast with 20%
airdeck length at middle of explosive column at Askari Cement
Nizampur ..............................................................................................148
Table 5-6 Fragmentation results of conventional and 20% mid-airdeck blast at
Askari Cement Nizampur.....................................................................150
Table 5-7 Muckpile distances ....................................................................................152
Table 6-1 Comparison of cost of explosive used for conventional and modified
blast with 20% airdeck length of explosive column at DG. Cement
Chakwal ...............................................................................................153
Table 6-2 Cost per tonne of full scale conventional and modified blast with
20% airdeck length at mid of explosive column at DG. Cement
Chakwal ...............................................................................................155
Table 6-3 Comparison of cost of explosive used for conventional and modified
blast with 20% airdeck length of explosive column at Askari
Cement Nizampur ................................................................................156
Table 6-4 Cost/tonne of conventional and modified blast with 20% mid-airdeck
length of explosive column at Askari Cement Nizampur ....................157
Table 6-5 District/Mineral wise limestone production in mining industry of the
Punjab ..................................................................................................158
xxii
LIST OF FIGURES
Figure Description Page No.
Figure 2.1 Oscillogram, showing displacement speeds of medium in case of
conventional blasting [27] ......................................................................15
Figure 2.2 Oscillogram, showing displacement speeds of medium in case of air
gap [27] ..................................................................................................15
Figure 2.3 The developing crack networks in Plexiglas under the influence of an
air-decked explosive charge [28] ...........................................................16
Figure 2.4 Fracture and stress profiles resulting from different charge
geometries and distribution [30] ............................................................18
Figure 2.5 Relationship between angle (β) at 00-45
0, average fragment size and
discontinuity spacing [40] ......................................................................22
Figure 2.6 Wooden spacer for airdecking [33] ............................................................23
Figure 2.7 Adjustable plastic plug for airdecking [31] ................................................24
Figure 2.8 Stem lock gas bag [39] ...............................................................................24
Figure 2.9 Wooden plug for airdecking in boulders [42] ............................................25
Figure 2.10 Wooden plug for airdecking .....................................................................25
Figure 3.1 Three dimensional sketch of a concrete block with dimensions and
hole to be blasted....................................................................................38
Figure 3.2 Wooden mould with built in hole assembly ...............................................39
Figure 3.3 Mechanical mixer for uniform mixing of concrete ....................................40
Figure 3.4 Mechanical vibrator ....................................................................................40
Figure 3.5 Concrete block inside the wooden mould with a built-in hole
assembly .................................................................................................41
Figure 3.6 Smaller concrete blocks along with model blocks for UCS testing ...........41
Figure 3.7 Curing of concrete blocks in curing tanks ..................................................42
Figure 3.8 Universal testing machine ..........................................................................42
Figure 3.9 Dimensions of concrete block and location of hole ...................................44
xxiii
Figure 3.10 Metallic blasting chamber with reinforced rubber walls ..........................46
Figure 3.11 Explosive cartridges of different sizes .....................................................46
Figure 3.12 Watergel cartridge .......................................................................................... 47
Figure 3.13 Weighing the cartridge on digital balance ................................................47
Figure 3.14 Concrete blocks in field ready for loading ...............................................47
Figure 3.15 Charge loading of concrete block .............................................................47
Figure 3.16 Loading scheme of blasthole with full column charge .............................48
Figure 3.17 Block number-1, full column charge before blasting ...............................49
Figure 3.18 Block number-1, full column charge, fragmentation after blasting .........49
Figure 3.19 Wooden spacers used to give airdeck in the explosive column ...............51
Figure 3.20 Loading scheme of blasthole with 20% airdeck length at the top of
explosive column ...................................................................................51
Figure 3.21 Block number-14 with 20% airdeck length at top of explosive
column, before blasting ..........................................................................52
Figure 3.22 Block number-14 with 20% airdeck length at top of explosive
column, after blasting .............................................................................52
Figure 3.23 Loading scheme of blasthole with 20% airdeck length at mid of
explosive column ...................................................................................53
Figure 3.24 Block number-21 with 20% airdeck length at mid of explosive
column, before blasting ..........................................................................54
Figure 3.25 Block number-21 with 20% airdeck length at mid of explosive
column, after blasting .............................................................................54
Figure 3.26 Loading scheme of blasthole with 20% airdeck length at bottom of
explosive column ...................................................................................55
Figure 3.27 Block number-16 with 20% airdeck length at bottom of explosive
column, before blasting ..........................................................................56
Figure 3.28 Block number-16 with 20% airdeck length at bottom of explosive
column, after blast ..................................................................................56

xxiv
Figure 3.29 Sieves of different sizes used for analysis ................................................57
Figure 3.30 Fragmentation of concrete blocks after blast (a) full-column charge
(b) 20% middle airdeck (c) 20% bottom airdeck (d) 20% top
airdeck for comparison ...........................................................................58
Figure 3.31 Comparison between full charges versus 20 % airdeck at different
positions .................................................................................................60
Figure 3.32 Comparison of cumulative percent-passing of fragmentation
between solid charge and 20% airdeck length at different positions
of explosive column against each sieve size ..........................................61
Figure 3.33 Loading scheme of blasthole with 10% airdeck length at mid of
explosive column ...................................................................................62
Figure 3.34 Block number-8 with 10% airdeck length at the middle of explosive
column, before blasting ..........................................................................62
Figure 3.35 Block number-8 with 10% airdeck length at the middle of explosive
column, after blasting .............................................................................63
Figure 3.36 Loading scheme of blasthole with 20% airdeck length at mid of
explosive column ...................................................................................64
Figure 3.37 Block number-3 with 20% airdeck length at mid of explosive
column, before blasting ..........................................................................64
Figure 3.38 Block number-3 with 20% airdeck length at mid of explosive
column, after blasting .............................................................................65
Figure 3.39 Loading scheme of blasthole with 30% airdeck length at the middle
of the explosive column .........................................................................66
Figure 3.40 Block number-25 with 30% airdeck length at mid of explosive
column, before blasting ..........................................................................66
Figure 3.41 Block number-25 with 30% airdeck length at mid of explosive
column, after blasting .............................................................................67
Figure 3.42 Loading scheme of blasthole with 40% airdeck length at the mid of
explosive column ...................................................................................68
xxv
Figure 3.43 Block number-7 with 20% airdeck length at mid of explosive
column, before blasting ..........................................................................68
Figure 3.44 Block number-7 with 40% airdeck length at mid of explosive
column, after blasting .............................................................................69
Figure 3.45 Loading scheme of blasthole with 50% airdeck length at the middle
of the explosive column .........................................................................70
Figure 3.46 Block number-10 with 50% airdeck length at mid of explosive
column, before blasting ..........................................................................70
Figure 3.47 Block number-10 with 50% airdeck length at the middle of
explosive column, after blasting ............................................................70
Figure 3.48 Percentage passing plot, comparing different airdeck lengths at
middle position of explosive column .....................................................72
Figure 3.49 Effect of increasing airdeck size on mean fragment size .........................72
Figure 4.1 Conventional charging scheme ...................................................................78
Figure 4.2 Fragmentation of conventional blast at DG. Cement Chakwal ..................79
Figure 4.3 Size distribution of fragments of conventional blast at DG. Cement
plant ........................................................................................................79
Figure 4.4 Bench number-1 at DG. Cement showing thirty two holes in a single
row .........................................................................................................80
Figure 4.5 Loading scheme of full column charge blastholes at bench number-1 ......82
Figure 4.6 Drilling pattern of full column charge holes at bench number-1 ...............82
Figure 4.7 Firing pattern of full column charge holes at bench number-1 ..................82
Figure 4.8 Front view of bench -1 before blast ............................................................83
Figure 4.9 Plan view of bench-1 before blast showing 32 drill holes in a single
row .........................................................................................................83
Figure 4.10 Measuring the burden distance at bench-1 ...............................................83
Figure 4.11 Measuring the length of Watergel cartridge at bench -1 ..........................83

xxvi
Figure 4.12 Loading of dynamite cartridge at bench-1 Figure 4.13 Loading of
ANFO at bench -1 ..................................................................................83
Figure 4.14 Fragmentation of full column charge holes after blast at bench
number-1 ................................................................................................84
Figure 4.15 Split desktop process stages .....................................................................85
Figure 4.16 Size distribution of fragments of conventional blast at bench
number-1 ................................................................................................86
Figure 4.17 Wooden plug used to give airdeck ...........................................................88
Figure 4.18 Loading scheme of each 20% mid-airdeck blasthole at bench
number-1 ................................................................................................90
Figure 4.19 Drilling pattern of 20% middle airdeck blast at bench number-1 ............90
Figure 4.20 Firing pattern of 20% middle airdeck blast at bench number-1 ...............91
Figure 4.21 Loading of Watergel cartridge as a primer in case of mid-airdeck
blast ........................................................................................................91
Figure 4.22 Loading of wooden plug as an airdeck in the blasthole ...........................91
Figure 4.23 Nonel detonators having same time-delay used in one of the mid-
airdeck blasthole ....................................................................................92
Figure 4.24 Fragmentation of 20% mid-airdeck blast at bench number-1 ..................92
Figure 4.25 Size distribution of fragments of 20% mid-airdeck blast at bench
number-1 ................................................................................................93
Figure 4.26 Loading scheme of 20% top airdeck blasthole at bench number-1 ..........95
Figure 4.27 Drilling pattern of 20% top airdeck blast at bench number-1 ..................95
Figure 4.28 Firing pattern of 20% top airdeck blast at bench number-1 .....................96
Figure 4.29 Fragmentation of 20% top airdeck blast at bench number-1 ....................96
Figure 4.30 Size distribution of fragments of top airdeck blast at bench
number-1 ................................................................................................97
Figure 4.31Loading scheme of 20% bottom airdeck blasthole at bench number-1 .....98
Figure 4.32 Drilling pattern of 20% bottom airdeck blast at bench number-1. ...........98
xxvii
Figure 4.33 Firing pattern of 20% bottom airdeck blast at bench number-1 ...............99
Figure 4.34 Fragmentation of 20% bottom airdeck blast at bench number-1 .............99
Figure 4.35 Size distribution of fragments of bottom airdeck blast at bench
number-1 ..............................................................................................100
Figure 4.36 Comparison of %age passing size of conventional versus 20 %
airdeck length at different positions of explosive column ...................102
Figure 4.37 Inside wall of one of the blasthole showing homogeneity .....................104
Figure 4.38 Loading scheme of full column charge blasthole at bench number-2 ....106
Figure 4.39 Drilling pattern of full scale conventional blast bench number-2 ..........106
Figure 4.40 Firing pattern of conventional blast with full column charge at
bench number-2....................................................................................107
Figure 4.41 Plane view of full scale 20 blastholes at bench number-2 ......................107
Figure 4.42 Front view of bench number-2 before full scale conventional blast ......108
Figure 4.43 Fragmentation after blast of full scale conventional shot at bench
number-2 ..............................................................................................108
Figure 4.44 Size distribution of fragments of full scale conventional blast with
full column charge at bench number-2 ................................................109
Figure 4.45 Loading scheme of each blasthole with 20% airdeck length at mid
of explosive at bench number-2 ...........................................................111
Figure 4.46 Drilling pattern of full scale mid-airdeck blast bench number-2 ...........112
Figure 4.47 Firing pattern of 20% mid-airdeck blast at bench number-2 ..................112
Figure 4.48 Bench number-2 before 20% mid-airdeck blast .....................................112
Figure 4.49 DTH, working at bench number-2..........................................................113
Figure 4.50 Wooden plugs used at bench-number-2 .................................................... 113
Figure 4.51 Loading of mid airdeck at bench number-2 ...........................................113
Figure 4.52 Nonel detonators of same delay ................................................................. 113
Figure 4.53 Network of nonel initiation system ........................................................113

xxviii
Figure 4.54 Fragmentationof full scale 20% mid-airdeck blast at bench
number-2 ..............................................................................................114
Figure 4.55 Size distribution of fragments of full scale 20% mid-airdeck blast at
bench number-2....................................................................................114
Figure 4.56 Comparison of %age passing between full scale conventional and
20 % mid-airdeck blast at bench number-2 .........................................117
Figure 4.57 Back crack produced due to full scale conventional blast at bench
number-2 ..............................................................................................118
Figure 4.58 16 holes in a single row at DG. Cement Chakwal at bench number-3 ...119
Figure 4.59 Loading scheme of the holes fired with conventional blast at bench
number-3 ..............................................................................................121
Figure 4.60: Drilling pattern of Conventional blast at bench no 3 ...........................121
Figure 4.61 Firing pattern of conventional blast at bench number-3 .........................121
Figure 4.62 Bench number-3 at DG. Cement Chakwal before blast .........................122
Figure 4.63 Bench number-3 at DG. Cement Chakwal after blast ............................122
Figure 4.64 Bench number-3 at DG. Cement Chakwal after conventional blast ......123
Figure 4.65 Cumulative percentage passing graph for conventional blast at
bench number-3....................................................................................124
Figure 4.66 Wooden airdeck used at bench number-3 ..............................................125
Figure 4.67 Loading scheme of multi-airdeck blasthole at bench number-3 ............127
Figure 4.68 Drilling pattern of holes with multi-airdeck at bench number-3 ............127
Figure 4.69 Firing pattern of holes with multi-airdeck at bench number-3 ...............127
Figure 4.70 Fragmentation after blast for multi-airdeck blast at bench number-3 ....128
Figure 4.71 Cumulative percentage passing graph for holes having multiple
airdeck at bench number-3 ...................................................................129
Figure 4.72 Comparison of percentage passing of fragmentation of conventional
and multi-airdeck blast for different sieve sizes at bench number-3 ...131
xxix
Figure 4.73 Cost comparison of explosive used for conventional and multi-
airdeck blast for a single hole at bench number-3 ...............................132
Figure 5.1 Limestone bench at Askari Cement Nizampur having 32 blastholes in
a single row ..........................................................................................136
Figure 5.2 Loading scheme of each blasthole with full Column Charge at Askari
Cement Nizampur ................................................................................138
Figure 5.3 Drilling pattern of conventional blast with full column charge holes
at Askari Cement Nizampur .................................................................138
Figure 5.4 Firing pattern of conventional blast with full column charge holes at
Askari Cement Nizampur.....................................................................139
Figure 5.5 Bench before conventional blast at Askari Cement Nizampur ................139
Figure 5.6 Fragmentation of bench after conventional blast at Askari Cement
Nizampur ..............................................................................................139
Figure 5.7 Size distribution of fragmentation of a conventional blast with full
column charge at Askari Cement Nizampur ........................................140
Figure 5.8 Wooden plug used for airdecking at Askari Cement Nizampur ...............142
Figure 5.9 Loading scheme of each blasthole with 20% airdeck length at mid of
explosive column at Askari Cement Nizampur ...................................144
Figure 5.10 Drilling pattern of modified blast with 20% airdeck length at mid of
explosive column at Askari cement Nizampur ....................................144
Figure 5.11 Firing pattern of modified blast with 20% airdeck length at mid of
explosive column at Askari cement Nizampur ....................................145
Figure 5.12 Bench before mid-airdeck blast at Askari Cement Nizampur ................145
Figure 5.13 Measuring hole depth ................................................................................... 145
Figure 5.14 Measuring burden distance .....................................................................145
Figure 5.15 Measuring spacing between the holes ....................................................... 146
Figure 5.16 Loading of Dynamite cartridge as primer ..............................................146
Figure 5.17 Loading of Watergel at Askari Cement ................................................... 146
xxx
Figure 5.18 Loading of ANFO at Askari Cement ......................................................146
Figure 5.19 Loading of wooden plug at Askari Cement ...........................................146
Figure 5.20 Firing circuit at Askari Cement ..............................................................146
Figure 5.21 Surface delay detonator at Askari Cement .............................................147
Figure 5.22 Fragmentation after blast with mid-airdeck at Askari Cement
Nizampur ..............................................................................................147
Figure 5.23 Size distribution of fragmentations of 20% mid-airdeck blast at
Askari Cement......................................................................................148
Figure 5.24 Comparison of %age passing of fragmentation between
conventional and 20% mid-airdeck blast at Askari Cement
Nizampur ..............................................................................................150
Figure 5.25 Muckpile profile of 20% mid-airdeck blast at Askari Cement
Nizampur ..............................................................................................151
Figure 5.26 Back crack due to conventional blast .....................................................152
Figure 6.1 Comparison of cost of full scale conventional and modified blast with
20% airdeck length of explosive column at DG. Cement Chakwal ....154
Figure 6.2 Comparison of cost of conventional and modified blast with 20%
airdeck length at Askari Cement Nizampur .........................................156
1
CHAPTER 1.
INTRODUCTION
1.1 GENERAL
Blasting is one of the vital operations in mining and construction industry. Despite the
advancements in mechanical rock excavators, explosives remain highly concentrated and
cheap source for surface and underground mine development and mineral production. In the
past, a number of blasting theories and methods have been developed and exercised to
optimize the blasting operations. Despite continuing efforts of researchers, advancements in
explosive engineering, numerous laboratory scale experiments and field investigations, a
considerable gap still exists in application of these blasting theories. Important factors that
influence the blasting operations include properties of the rock mass, geology, properties of
the explosive and the blast geometry.
In mining projects, one of the key objectives is to get maximum production at
minimum cost without sacrificing the quality and safety requirements. Minimization of
production blasting cost is one of the factors that ensure economic feasibility of the mining
projects. A precise blast design should produce optimal fragmentation with controlled throw
that can be easily handled with available loading and hauling equipments. The other outcome
of good blast is to produce micro fractures within the fragments [1].These fractures make the
fragments weak and easy to break thus increasing productivity and decreasing energy
consumption and wear of machinery. It has been observed that blasting results do affect the
economic efficiency of crushing and grinding circuits [2-5].
In general, poor blast design, lack of necessary theoretical background, and poor or
little information about the geology of the area to be blasted, often produce undesired
fragmentation with large number of boulders and excessive fines. Undesired coarser
fragments need secondary blasting before they can be easily handled by loading and hauling
equipments. The secondary blasting of the boulders not only increases the cost of blasting but
also increases the environmental hazards. The environmental hazards associated with
secondary blasting include fly rocks, excessive blast vibrations and air blast, and the
production of additional dust. On the other hand finer fragments of the blasted rock indicate
excessive use of explosive energy.

2
Poor fragmentation increases the wear and tear of loading and hauling equipments. It
also decreases the efficiency of crushing, grinding and milling circuits.
Thus there is a need to investigate such blasting methodology that not only controls
the improper rock fragmentation, but also economizes the whole blasting operation.
In earlier techniques blast design parameters like spacing, burden, stemming, diameter
of blasthole, sub-drilling etc. were optimized by different researchers and practitioners to get
the desired results of fragmentation. They have shown that the rock structure, rock strength,
frequency, spacing and orientation of joints within the rock mass, type of explosive, specific
charge, degree of confinement, explosive distribution within the rock mass, MS delays and
initiation sequence for multi-row blasting are the major factors effecting fragmentation.
Special techniques like slab holes, satellite holes, stemplug and deck charges have also been
used to get better fragmentation. Airdeck blasting technique is one the unique method to
solve all blast related problems.
In airdeck blasting technique an air space is introduced in the explosive column of
blasthole which is called airdeck. If airdeck is properly located and has optimum length it can
improve fragmentation and reduce air blast, vibrations and fly rocks.
1.2 PROBLEM STATEMENT
The effectiveness of airdeck blasting technique depends upon the position of the
airdeck and its appropriate length in the explosive column. A number of studies have been
carried out in the past to investigate the best position and optimum length of airdeck in the
explosive column for better fragmentation. Although individual researchers have contributed
valuable information under given geological conditions but a simple plug-in-type formula for
predicting best position and optimum length of airdeck in explosive column for improved
fragmentation is yet to emerge. Researchers have different opinions regarding the best
location of airdeck in explosive column. Similarly the length of airdeck which is being used
in the world generally varies from 10 to 35% of explosive column. There is no standardized
practice regarding best position and optimum length of airdeck to be used in explosive
column for better fragmentation. So in order to establish some bench mark for improved
3
fragmentation regarding airdeck blasting technique, detailed experimentation are conducted
in this research work.
1.3 OBJECTIVES
The main objective of this research work is to optimize blasting in terms of fragment
size by using airdeck blasting technique. Another objective of this study is to establish the
optimum length and best position of airdeck in the blasthole for achieving a good
fragmentation. Other objectives of this study are as follows:
1. Introduction of airdeck blasting technique in Pakistan for production blasting.
2. To compare fragmentation performance of airdecks placed at different positions
in explosive column.
3. Design an economical, convenient and commercial plug which could be
manufactured locally to give airdecks in the blastholes for production blasting.
4. Cost analysis to predict the annual savings which a quarry can make by adopting
airdeck blasting technique.
1.4 SCOPE
The scope of this thesis is focused on bench blasting operations for relatively
homogeneous limestone in cement quarries of Punjab, Pakistan.
1.5 THESIS ORGANIZATION
The thesis starts with an abstract and Table of contents, followed by list of Figures
and list of Tables in the thesis. The first Chapter Introduction presents a introduction to the
problem under study, research objectives, scope and thesis organization. Chapter 2 literature
Review is the detailed review of blasting theories, mechanism of airdeck blasting, model
scale and full scale airdeck blasting practices, importance of blast fragmentation and their
effect on downstream processes. Chapter 3 Laboratory Scale Experimentations and Results
deals with the detailed laboratory scale experiments on concrete blocks to find out the best
location and optimum length of airdeck. Chapter 4 Validation at DG. Cement Chakwal and
chapter 5 Validation at Askari Cement Nizampur describes the results of full scale field

4
experimentations using airdeck at DG. Cement Chakwal and at Askari Cement Nizampur
respectively. These chapters compare the conventional blasting practice practiced at DG
Cement factory and Askari Cement factory with the blasting practice by using airdeck
technique. In chapter 6 Economic Analysis of the conventional and airdeck blasting practice
is presented. Chapter 7 Conclusions and Recommendations summarizes the conclusions,
limitations and recommendations for future work. References cited in this study are added at
the end of the thesis.
5
CHAPTER 2.
REVIEW OF LITERATURE
2.1 EXPLOSIVES AND BLASTING
Mining and agriculture are two of the oldest industries known to mankind; both of
them pertain to the mother earth. Agriculture is mainly practiced in soil and soft clays and
does not require hard and abrasive tools. It is unlike mining, where there is constant
interaction of man with hard rocks. Perhaps a reason why man had to form and invent
‗mining machinery‘. But the repeated interaction with much harder rocks prompted man to
use explosives.
The use of explosives in mining goes back to the year 1627 [6], when gunpowder
was first used in place of mechanical tools in the Hungarian (now Slovakian) town of Banská
Štiavnica. The innovation spread quickly throughout Europe and America. With the passage
of time evolution in the explosive's industry became prominent which led to the discovery of
dynamite, ANFO, slurries, emulsions and the much newer, advanced and modern- RDX and
the like.
2.1.1 Blasting Theories and Rock Breakage
The topic of blasting theories has always been a controversial one in rock
excavation. Not a single theory is there which can completely explain the mechanism of rock
breakage in every situation. The list of blasting theories presented here is not exhaustive. The
theories are:
Reflection theory (Reflected stress waves)
Gas expansion theory
Flexural rupture
Stress waves and gas expansion theory
Stress waves, gas expansion and stress wave/flaw theory
Nuclei or stress wave/flaw theory
Torque theory
6
Cratering theory
2.1.1.1 Reflection theory (reflected stress waves)
The first ever theory presented on this topic was the reflection theory and was
founded on the simple fact that rock is always resistant to breakage in compression rather
than in tension. When an explosive charge is detonated within the blasthole near to the free
face a compression strain wave is generated due to detonation of the explosive column which
travels through the rock mass with supersonic velocity in all directions with decaying
amplitude. After reflection from the free face this compressional wave transforms into a
tensile and shear wave. Since the rocks are weakest under tension, they break at the free face
in the form of spalling [7-8].
2.1.1.2 Gas expansion theory
The pressure on the walls of a blasthole immediately after detonation is about one
half of the explosion pressure and traverse outward in the rock in the form of shock wave.
The material of the rock between shock front and borehole is compressed. This will produce
radial cracks next to the hole at about 2 hole radii and propagate radially inward as well as
outward. The frequent presence of these cracks is mainly next to the borehole, but a few
originate distantly. In the absence of free face some of the small cracks turn into larger ones.
When the shock wave reaches the free face, radial crack lengths formed are less
than one quarter of this distance. At this time, the longest of the cracks have extended inward
and arrive at the borehole wall. If the gas pressure is high enough it can enter the cracks and
widen them. The returning tensile wave will also assist the cracks to reach at free face. The
surplus energy of gas inside the cracks will be able to displace the rock [9-11].
2.1.1.3 Flexural rupture
After the detonation of explosive inside the borehole two noticeable pressures are
found: one from detonation itself and other from explosive products or highly heated gases
acting on borehole walls. Gaseous pressure sustained for a longer time period as compared
to the detonation pressure which stays only momentarily. Almost all of the energy required to
7
fragment the rock comes from gaseous pressure. So the gaseous pressure is responsible for
90% of the energy needed for rock fragmentation or flexural rupture.
Radial cracks form only in planes parallel to borehole axis. The reflected strain
waves are only responsible for elongation or widening of the cracks and not for breakage.
Gas pressure compels the radially produced cracks through the burden to the free face and
displaces rock through bending and in the direction of least resistance, generally following
naturally occurring planes of weakness. Rock fragmentation occurs at this point. Breaking of
rock is similar to the bending and breaking of a beam [12].
2.1.1.4 Stress waves and gas expansion theory
In 1971 Kutter and Fairhurst after doing experimentation on homogeneous
Plexiglas and rock models came to the following conclusions:
After detonation of a blasthole the high pressure wave is transmitted into the rock
mass by the rapidly expanding high pressure gases. The gas pressure was assumed to be one
half to one quarter of the detonation pressure. Due to expansion of cavity around the blasthole
the gas pressure decays exponentially but sufficient enough to put pressure against rock mass
for a longer period. This pressure wave first forms radial cracks around the expanding
blasthole cavity then followed by rings of widely spaced radial cracks. The compressional
wave is strong enough to cause breakage. Strain wave- induced fracturing and gas pressure
are the two main components responsible for rock fracturing. Neither the gas pressure nor the
strain wave alone is responsible for rock breakage. Gas pressure contributes more in rock
breakage than the strain wave [13].
2.1.1.5 Stress waves, gas expansion and stress wave/flaw theory
Stage 1
When an explosive is detonated, the region around the blasthole is shattered due to
high pressure. The shock waves traverse outward at 9000-17000 ft/second create tangential
stresses that form radial fractures in the region of the blasthole. First radial cracks occur in
1-2 msec [14].
8
Stage 2
The pressure of the shock wave travelling outward from the blasthole is positive but
as soon as it reaches the free face it reflects and its pressure is reduced suddenly and becomes
negative to form a tensile wave. As the rock mass is more prone to breakage in tension than
in compression, initial cracks will appear. If the tensile stresses are significant enough they
may cause scabbing or spalling at free face [14].
Stage 3
The real breakage of rock is a slow process. Due to the sufficiently intense pressure
of explosive gases the initial cracks will widen by the combined effect of tensile stress
induced by radial compression and by pneumatic wedging [14].The mass of rock in front of
blasthole yields and move outwards, the high compressive stresses within the rock mass
unload itself and this unloading effect induces high tension stresses in the rock mass that
breaks the rock and complete the breaking process [14].
2.1.1.6 Nuclei or stress wave/flaw theory
According to this theory stress waves are responsible for fragmentation process and
induced large amount of cracks initiation at areas which are distant from the blasthole. The
gas pressure does not contribute significantly in the fragmentation process. The theory was
formulated after conducting experimentation at University of Maryland in the fracture
mechanism laboratory on Homolite models both flawed and unflawed. The flawed models
contained joints, fractures, bedding planes and other discontinuities.
In case of unflawed material only 8-12 dominant radial cracks were formed around
the blasthole. Although these cracks grow and covered a significant distance from the
blasthole but they alone are not capable of giving good fragmentation.
The test results in case of flawed model material showed that these discontinuities
act as nuclei for crack formation, development or extension. After forming the cracks around
discontinuities, when these stress waves strike the free face they are reflected back as tensile
wave to meet the out coming stress waves. At this stage there is constructive interference
which produced further cracks or extension of previously formed cracks. This new stress
9
wave dominated mechanism of fragmentation is referred as nuclei theory [15].
2.1.1.7 Torque theory
This theory has a limitation of accurate timing of initiators. As two contiguous
explosive columns are initiated simultaneously from opposite ends, a compressional shock
wave from each explosive column is generated. These compressional waves travel parallel
but opposite in direction. The greatest stress and primary shock front are always normal to
each other. This stress is also supposed to be greatest at the detonation head and decays as it
moves away from the detonation head. When the blastholes are initiated simultaneously but
in different directions a non-uniform division of stress occurs. Following this, the broken
rock will likely be tossed between the explosive columns in an anti-clockwise direction. This
action will produce uniform fragmentation without any tight muckpile.
2.1.1.8 Cratering theory
The concept of the cratering theory was originally proposed by C.W. Livingston and
later modified by others such as Lang and Bauer. It involves a spherical charge of length to
diameter ratio of less than equal to 6:1, detonated at an empirically determined distance
beneath the surface to optimize the greatest volume of permanently fragmented material
between the charge and free surface. According to this theory for a given specific explosive
and rock material, there exist a burden distance between the charge and free surface which
yields the largest crater. This burden is referred to as optimum burden. Similarly, there exists
another burden distance referred to as the critical distance, which is too far below the surface
to result in any crater or expulsion of material at the surface, other than minor radial cracks.
This is the point at which material at the surface just begins to show evidence of failure [16].
2.1.1.8.1 Cratering mechanism
As the high pressure explosive gases expand against the medium immediately
surrounding the explosion, a spherical shock wave is generated causing crushing. As the
shock front moves outward in a spherically diverging shell, the medium behind the shock
front is put into radial compression and tangential tension. These results in the formation of
radial cracks directed outward from the cavity. The peak pressure in the shock front reduces

10
due to spherical divergence and the expenditure of energy in the medium. For shock
pressures above the dynamic crushing strength of the medium the material is crushed, heated
and physically displaced, forming a cavity. In regions outside this limit, the shock wave will
produce permanent deformation by plastic flow, until the peak pressure in the shock front has
decreased to a value equal to the plastic limit of the medium. This is the boundary between
the elastic and plastic zones [17].
When the compressive shock front strikes the free face, it results in generation of
negative or rarefaction wave which moves back into the medium as tensile wave and causes
the medium to break. As the distance from the free face increases the pressure of negative or
rarefaction wave decreases until it no longer exceeds the tensile strength of the medium. The
process explained so far is a short term and takes only few milliseconds. The gas expansion
mechanism after that is a long lasting that imparts acceleration to the medium around
detonation by expansion of gas trapped in the explosion formed cavity.
2.2 DIFFERENT METHODS TO IMPROVE FRAGMENTATION
In earlier techniques blast design parameters like spacing, burden, stemming,
diameter of blasthole, sub drilling etc. were optimized by different researchers and
practitioners to get the desired results of fragmentation. They have shown that the rock
structure, rock strength, orientation of joints within the rock mass, type of explosive, specific
charge, degree of confinement, explosive distribution within the rock mass, MS delays and
initiation sequence for multi-row blasting are the major factors effecting fragmentation.
Special techniques like slab holes, satellite holes, stemplug and deck charges have also been
used to get better fragmentation. The airdeck blasting technique is a unique method to solve
all blast related problems.
Chiappetta in 1998 [18] after performing a number of experiments to improve blast
fragments came to the conclusions that specific charge, explosive distribution within the rock
mass, type of explosive, delay timing and joint system and its orientation with respect to blast
direction are the major factors in order of influence to affect the fragmentation in competent
rock. For soft, weak or highly fractured rock the order of influence changes to joint sets and
its orientation with respect to blast direction, type of explosive, specific charge, explosive
distribution within the rock mass and delay timing.

11
Chiappetta in 1998 [18] also discussed the importance of different initiation design
patterns for multi-row blasting. He observed that a deep V-blast pattern generally gives good
fragmentation with tight and high muckpile which is difficult to dig. The row by row blasting
pattern on the other hand needs higher specific charge for good fragmentation and it gives
low and loose muck which is easy to dig. Further he added that if scatter in firing time is
smaller, the shorter delays between the holes in a row give improved fragmentation.
Moreover the stemming and sub-drill areas of drill hole are one of the main sources of
oversized blasted rock material and stab and pilot holes are the best options to deal with such
type of problems.
Hagen in 1979 [19-20], after doing detailed experimentation to improve blasted
rock fragmentation and to reduce the amount of fines presented the following conclusions:
There should be impedance matching between explosive and rock type.
Explosives in blastholes should be avoided especially in weak strata in order to
control fines.
More fines are generated when there is increase in blasthole diameter, burden and
sub-drilling and decrease in spacing between the holes and stemming length.
Deep V-blast pattern gives more fines than row by row.
Inadequately small delays between the rows and increase in number of rows often
generate more fines.
Use lightly charged stab holes instead of increased column charge length in main
blastholes to minimize fines.
2.2.1 Effect of Timing on Blast Fragmentation
Winzer et al. (1983) [21] and Stagg and Rholl (1987) [22] conducted two
instrumented blast tests in 2-3 m high limestone and 15 m high granite benches. They used
seismic detonators which have high initiation accuracy as ± 0.02 and 80% passing size x80 for
the blasted material as the main source of the resulting fragmentation.
Dynamite cartridges of diameter 12.5 mm in holes having diameter 19 mm with
0.46 m spacing were used in limestone tests. The inert-hole delay interval varied between 1
and 27 ms per meter of spacing. The limestone test showed a sharp decrease in x80 from
12
1-3 ms/m with a little change thereafter when the delay was increased to 20 ms/m. They
observed a reduction in both oversize and fine material with the increase of inter hole delay.
In granite tests blasts they used Atlas powder, Apex 260, in holes of diameter 89
mm on 3 m spacing. Delays of 10,20,30,40 and 60 ms were used in the experimentation. The
results of the test blasts have shown that the best overall fragmentation was generally
obtained for a 20 ms delay i.e. at 2 ms/ft or 7 ms/m. Moreover when the bench face is divided
into massive and a fractured part, the delay for the fractured parts was shifted to the 40 ms
delay [20].
Stagg and Rholl [22] also conducted the instrumented fragmentation tests at the US
Bureau of Mines with 6 single row blasts in 7 m benches in limestone. The holes of diameter
of 64 mm were charged with sticks of dynamite of 50 mm diameter. The 1.8 m burden and
2.1 m spacing gave the specific charge of about 0.59 kg/m3. Delays of 2, 6, 12, 24(twice) or
48 ms between the holes were tried with the accuracy of seismic caps ± 0.11. Each 4-hole
blasted about 270 tons of rock.
Stagg and Rholl concluded that "Most of the finer material was apparently
produced by a process in the region around the blast-holes, while the coarse material came
from the region between the blast-holes and near the free face".
They screened four blasts completely and parts of remaining ones and used x30, x50
and x80 as the main measures of the resulting fragmentation. The main conclusion of their
experiments was that blast-hole delay had no effect on the finer fragment sizes. Their plot of
x30 and x50 were pretty flat.
They used their strain and pressure recordings as indications that the improvement
of fragmentation was due to an interaction of blast-hole stress wave mechanism with the
previously detonated blast-holes‘ late failure processes [22].
2.2.2 New Work with Reference to Blast Fragmentation
Elliot et al. (1999) [23] and Ethier at al. (1999) [24] performed a number of
experiments to improve fragmentation. The rock consists of limestone and dolomite with a
13
density of 2600 kg/m3.
The tests blasts were consisted of 4 two round with 85 mm explosive diameter
charged in holes of 102 mm diameter with burden and spacing of 3 and 3.5 m respectively.
They used alternating pattern with 1m sub-drilling and 2 m stemming. Fragpak SD ANFO
was used in the collar and after two rounds, Tovan Super 4 having length 2 m and 90 mm
diameter was used as bottom charge and specific charge increased to 0.7 kg/m3.
Toe movement was improved due to the presence of bottom charge. In these rounds
2 m decks of Tovite Plus were also used to reduce the back break. There was no positive
effect; hence the conclusion drawn was that back break was effectively governed by the
length of the fractured collar part of the sub-drill layer.
The delays used were 25 ms in row and 66, 75 or 92 ms between the rows, the in
row delay corresponds to 7 ms/m of spacing, which agrees with optimum value from Winzer
et al. (1983) [21]. The between row delay had no significant effect on the fragmentation. The
source of the coarser materials was mainly from the collar layer and the back break zones of
the round. There was also a measuring swelling of the bench behind the crest.
Most of the rock passed straight through the primary crusher‘s output opening of
150 mm. As a result secondary crusher‘s product flow increased 16% i.e. from 995 to 1150
tons/h and the power consumption dropped to 30%.
For the fragmentation analysis Winfrag system was used. Each curve was a result of
merging more than 30 photos per blast. Elliot et al. [23] reported the following results;
A much steeper fragmentation curve was obtained. The undersize x90 decreased from
0.63 m to less than 0.2 m.
The 50% passing fragmentation x50, decreased from 0.15 m to 0.90 m
The -20 mm fines decreased from 4% to 1.5%.
The capacity gain of the system (secondary crusher) was 15-16%. 2 above.
An Engineering approach is the Tmin concept used by Chiappetta [18]. Tmin is the
minimum response time of the burden mass or the delay between charge initiation and
14
appreciable movement of the bench face.
He recommends that "if the application calls for maximizing fragmentation with
minimal movement, inter i.e. between-row delay times less than Tmin should be chosen. If it
calls for maximizing material movement and easy digging between –row delays of 1.5-3.0
Tmin should be chosen". The objective of the latter case to displace the rock material by about
1m apart before the next row is initiated to allow swell and to minimize the inter-row
collisions without jeopardizing the confining pressure [18].
Onoderra and Esen (2003) extract the following philosophy. "In row delay times
should be ≤ Tmin to promote and fragmentation interaction and between–row delay times
should be 1.5-3.0 to promote material movement and easy digging" [25].
Another technique which is already being used in the world to reduce the amount of
oversize and fines is called airdeck blasting technique. In airdeck blasting technique an air
space is introduced in the explosive column of blasthole which is called airdeck. If the
airdeck is properly located and has an optimum length it can improve fragmentation and
reduce all blast related problems like air blast, vibrations and fly rocks, etc.
2.3 AIRDECK BLASTING TECHNIQUE
When a continuous cylindrical explosive charge in a blasthole is detonated, the
blasthole enlarges by crushing the walls of the blasthole due to high pressure. A shock wave
with a high peak pressure propagates outwards in all directions as a compressive stress wave
[26]. The compressive stress wave also produces radial cracks in the strata. At the free face,
this compressive stress wave reflects back as a tensile stress wave. The tensile strength of the
rock is much smaller than its compressive strength, thus the rock mass breaks at the point
where effective tension exceeds the tensile strength of the rock [26]. The gas produced by
explosive detonation penetrates into cracks and expands, resulting in enlargement of cracks
and crushing around the bore hole. In this case the medium comes to static equilibrium soon
after the compression wave has passed and there is no further transfer of energy to the
medium. The following oscillogram in Figure 2.1 shows displacement speeds of the medium
in case of conventional blasting.

15
Figure 2.1 Oscillogram, showing displacement speeds of medium in case of conventional
blasting [27]
On the other hand according to Mel‘nikov and Marchenko, [27] the explosive
column with airdecks develops additional compressional shock waves after the main
compression wave produced in the rock mass due to blasting as shown in displacement speed
oscillogram in Figure 2.2.
Figure 2.2 Oscillogram, showing displacement speeds of medium in case of air gap [27]
This additional compressional wave is produced as a result of collision between the
two gas streams in the center of the air gape. The collision of the gases not only generates
great pressure at the meeting point, but also the gases are reflected back and penetrate in the
fissures thus aiding fragmentation.
Mel‘nikov and Marchenko [27] also found that when an airdeck is placed in the
explosive column, the peak bore hole pressure reduces due to wave collision in the air gap.
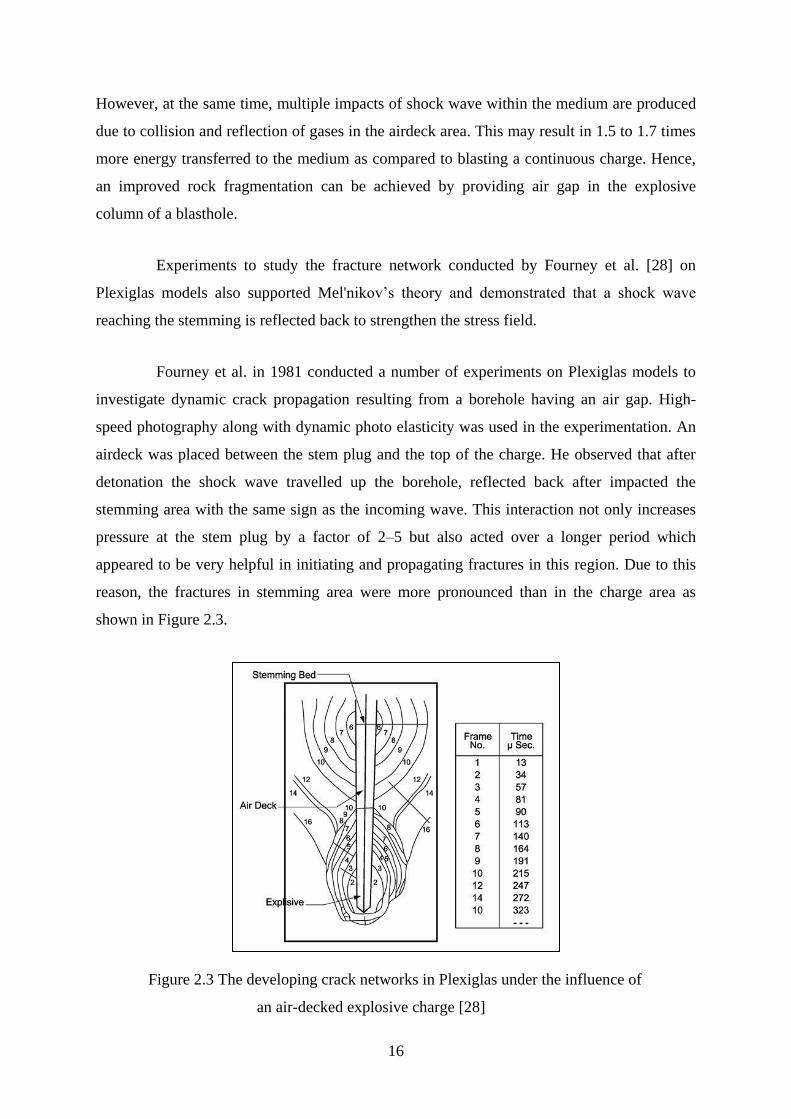
16
However, at the same time, multiple impacts of shock wave within the medium are produced
due to collision and reflection of gases in the airdeck area. This may result in 1.5 to 1.7 times
more energy transferred to the medium as compared to blasting a continuous charge. Hence,
an improved rock fragmentation can be achieved by providing air gap in the explosive
column of a blasthole.
Experiments to study the fracture network conducted by Fourney et al. [28] on
Plexiglas models also supported Mel'nikov‘s theory and demonstrated that a shock wave
reaching the stemming is reflected back to strengthen the stress field.
Fourney et al. in 1981 conducted a number of experiments on Plexiglas models to
investigate dynamic crack propagation resulting from a borehole having an air gap. High-
speed photography along with dynamic photo elasticity was used in the experimentation. An
airdeck was placed between the stem plug and the top of the charge. He observed that after
detonation the shock wave travelled up the borehole, reflected back after impacted the
stemming area with the same sign as the incoming wave. This interaction not only increases
pressure at the stem plug by a factor of 2–5 but also acted over a longer period which
appeared to be very helpful in initiating and propagating fractures in this region. Due to this
reason, the fractures in stemming area were more pronounced than in the charge area as
shown in Figure 2.3.
Figure 2.3 The developing crack networks in Plexiglas under the influence of
an air-decked explosive charge [28]

17
High pressures were observed at the interface between stemming and air-deck along
with the near explosive area and extended up into the stemming region. The impact involved
a larger region even though the fractures in this area were not as intense as that in the
explosive area.
A significant reduction in crushing of rock near charge was observed by Marchenko
(1982) [29], and he concluded that it was due to reduced stresses in the region near air-
decked charges, as compared what was produced in the case of solid charges. He reported
that due to airdeck in explosive column about 25% increase in stresses in the farther regions
are observed, which accounted for 50% increase in the utilization of explosive energy for
breakage and improvement of the degree of fragmentation.
Chiappetta and Memmele (1987) [30] reported that an explosive with full column
charge generates a high pressure impulse into the medium that creates many micro-fractures,
but it acts for a very short period and decays quickly. He also suggested that additional stress
waves are required to pass through the medium and enlarge the micro fractures. Moreover, as
the air-deck tends to generate smaller, but repeated production of shock waves, which acts for
a longer time period, there is a tendency for the fragmentation to improve. An air-deck placed
between two explosive charges does the job of an energy accumulator, which first stored the
energy and later released it in the form of additional stress waves to enhance fragmentation.
Chiappetta [31] stated that the bottom airdeck could be used more effectively as compared to
the cylindrical charges because when it is practiced in the right manner, it produces 2 to 7
times more pressure at the bottom of the hole. The fracture and stress profiles produced as a
result from different charge geometries and distributions are shown in Figure 2.4 (Chiappetta
and Memmele 1987).
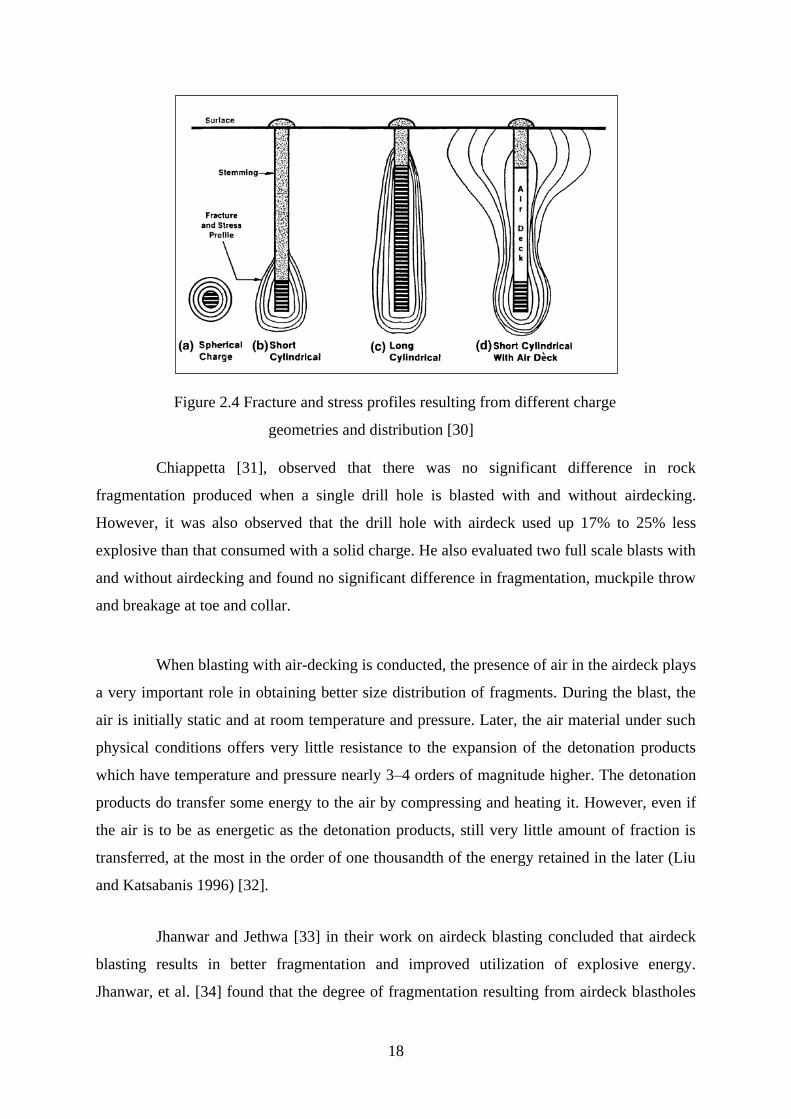
18
Figure 2.4 Fracture and stress profiles resulting from different charge
geometries and distribution [30]
Chiappetta [31], observed that there was no significant difference in rock
fragmentation produced when a single drill hole is blasted with and without airdecking.
However, it was also observed that the drill hole with airdeck used up 17% to 25% less
explosive than that consumed with a solid charge. He also evaluated two full scale blasts with
and without airdecking and found no significant difference in fragmentation, muckpile throw
and breakage at toe and collar.
When blasting with air-decking is conducted, the presence of air in the airdeck plays
a very important role in obtaining better size distribution of fragments. During the blast, the
air is initially static and at room temperature and pressure. Later, the air material under such
physical conditions offers very little resistance to the expansion of the detonation products
which have temperature and pressure nearly 3–4 orders of magnitude higher. The detonation
products do transfer some energy to the air by compressing and heating it. However, even if
the air is to be as energetic as the detonation products, still very little amount of fraction is
transferred, at the most in the order of one thousandth of the energy retained in the later (Liu
and Katsabanis 1996) [32].
Jhanwar and Jethwa [33] in their work on airdeck blasting concluded that airdeck
blasting results in better fragmentation and improved utilization of explosive energy.
Jhanwar, et al. [34] found that the degree of fragmentation resulting from airdeck blastholes

19
is better than that of produced by conventional blastholes in which solid decks are used.
Moreover, airdeck blasting was also found to be more effective in very low to low strength
moderately jointed rocks as compared to medium strength highly jointed rocks.
Another series of experiments conducted by Thote and Singh (2000) showed that
the powder factor increased from 7.46 t/kg to 8.96 t/kg by using airdeck blasting technique
[35].
In 2003 Lu and Hustrulid [36] did numerical simulation and theoretical analysis to
study the effect of airdeck in an explosive column. They used the theory of shock tube to
investigate the physical process of blasting with a top airdeck and found that the pressure
unloading process caused by the propagation of rarefaction waves and reflected rarefaction
waves in the detonation products plays a vital role to improve fragmentation. They also
proposed the airdeck ratio which was in general agreement to those proposed by Melnikov et
al. in 1979, and Moxon et al. in 1993.
According to Moxon et al. [37] no significant effect on the degree of fragmentation
was observed with the airdecks which occupy 40% or less of the maximum volume of
explosive. He concluded that the maximum length of the airdeck depended upon the structure
and strength of the material to be blasted.
2.3.1 Understanding the Mechanism of Airdeck Blasting
A number of studies have been carried out by different researchers but the
mechanism of airdeck blasting they proposed still does not explain what is actually
happening under field conditions [36].
2.3.2 Airdeck Location
Three types of airdeck positions are commonly used by researchers and
practitioners i.e., top, middle and bottom of the explosive column. Generally, an airdeck
when placed at the top of the explosive column of the blasthole produced a good rock
breakage in the stemming area [38]. Jhanwar et al. [34] suggested that the airdecks were most
effective if placed at the middle position of an explosive column. Jhanwar [38] also observed
20
that bottom airdeck can only be used for blasting of holes with softer bottoms. Moxon et al.
[37] also had the similar point of view and concluded that the middle position of the airdeck
resulted in an improved rock fragmentation due to the interaction of two simultaneous shock
wave fronts from the top and bottom of an explosive charge. Whereas, Chiappetta [31] stated
that the bottom airdeck could be used more effectively than continuous cylindrical charges
because it produces 2 to 7 times more pressure at the bottom of the hole when properly
practiced. Contrary to that, Liu and Katsabanis [32] suggested that only the top position of
airdeck improved the rock fragmentation than that of other two positions.
A bottom airdeck was successfully used by Blast Dynamics Inc. at a gold mine in
Northern Nevada without affecting fragmentation and excavator productivity. Moreover, no
toe problem was encountered [39].
2.3.3 Airdeck Length
In 1979 Mel'nikov et al. developed empirical correlations of airdeck lengths as
shown in the following equations.
La,d = k1Lt(K1= 0.15-0.35)
La,d = k2d (K2= 8-12)
Where, La,d is the air-deck length (m), Lt is the total charge length including air-deck
(m), d is the charge diameter (m) and K1 and K2 are the rock factors.
The results of studies conducted by Moxon et al. (1993) suggest that, relative to the
full column charge there was no significant effect on the degree of fragmentation was
observed with the airdecks which occupy 40% or less of the maximum volume of explosive.
He concluded that maximum length of the airdeck was depending upon the structure and
strength of the material to be blasted.
In 2003 Lu and Hustrulid performed a number of site experiments to find out the
airdeck length for different rock masses and suggested the best airdeck ratio for ANFO.
According to them the airdeck ratio from 0.13 to 0.4 develops the maximum pressure in the
airdecked part of the blasthole. This pressure is due to reflection shock waves. They defined
21
the airdecking ratio, as the ratio between the length of the airdeck and the total length of the
explosive column including the airdeck as follows.
Ra = Le/La+Le
Where Ra is the airdecking ratio, La is the length of the airdeck and Le is the length
of the explosive column [36].
According to Jhanwar et al. (1999), the critical length for an airdeck varies from 15
to 30% of original charge length . However, the general airdeck length varies from 0.1 to 0.35
times the original charge length [34].
The airdecking factor (ADF) is given as
ADF=ADL/OCL
Where ADL is Airdeck length and OCL is Original charge length. It was observed
that when the Airdecking factor (ADF) was kept below 0.35, good to excellent fragment size
distribution was produced. Also, ADF ranges from 0.1 to 0.35. The lower value was found
suitable for blocky rocks and higher value for softer rocks [33].
According to Lu and Hustrulid (2003) the most important parameter during airdeck
blasting is the "Air-Deck Ratio". He theoretically derived the airdeck ratio as between 0.13-
0.39 which was in close agreement with those suggested by Mel'niKov in 1979 and Moxon in
1993.The value of airdeck ratio proposed by Mel'niKov is 0.15-0.35 based on field
experimentations and those proposed by Moxon is 0.30-0.35 based on experimentation on
concrete model.
Rommayawes and Leelasukseree in 2011 [40] performed a number of experiments
to provide guide lines for use of airdeck length in explosive column. Experiments were
performed at two different quarries EGAT and INSEE. The RMR rating for rocks at EGAT
and INSEE quarries was calculated and was found to be 61 and 57 respectively. At EGAT
quarry discontinuity spacing between 3 to 0.1 m was observed, while at INSEE quarry
spacing from 2.2 to 0.05 m was measured. From data collected by field experimentation, a
relationship was established between average fragment size, angle (β) at 00—45
0 and
22
discontinuity spacing, where (β) is the angle between the strike of a particular discontinuity
and strike of free face. This relationship is presented in Figure 2.5.
Figure 2.5 Relationship between angle (β) at 00-45
0, average fragment size
and discontinuity spacing [40]
By using Figure 2.5, one can find the airdeck length for a desired rock fragment size
distribution, provided the discontinuity spacing is known. It was also observed that on
increasing airdeck length the average rock fragmented size was increased. The length of
airdeck for a desired size of rock fragmentation was found to depend upon rock type and
blasting application.
Suttithep Rommayawes et al. in 2013 [41] performed a series of experiments to
determine the optimum airdeck length for suitable fragmentation. In their research work 30
different airdeck blasts were executed with airdeck length between 15 to 65% of explosive
column. They also incorporated the maximum joint spacing and blasting orientation in their
work. The results of test blasts signified that the average fragmentation size increases with
increase of airdeck length, joint spacing and unfavourable blast direction. The relationship
between average fragmentation size and air-deck length was portrayed on a graph for
simplicity of uses.
They also concluded that small to medium opening feed size of a normal primary
23
crusher may vary between 93cm (37inches) to 112cm (44inches) so an air-deck length
between 20-30% of the charge length can be used with a high possibility that the average
fragmentation size will be less than 100cm. With favourable parameters, an air-deck length of
up to 40% can be used in the quarry without scarifying the fragmentation.
2.3.4 Plugging Devices for Airdecking
Different types of airdecking devices have been used by researchers and blasting
experts. The airdeck devices used by Jhanwar and Jethwa, in 2000 [33] were made of wood
and each had the following specifications as shown in Figure 2.6.
Figure 2.6 Wooden spacer for airdecking [33]
Chiappetta in 2004 [31] used the adjustable plastic plug with a wooden stake to
produce airdeck at the bottom of the explosive column. The plug used is shown in the Figure
2.7.
24
Figure 2.7 Adjustable plastic plug for airdecking [31]
Stemlock patent # 4846278 has been used for airdecking in presplit blasting as
shown in Figure 2.8.
Figure 2.8 Stem lock gas bag [39]
Tariq and Zeshan in 2008 [42] used the airdeck in secondary boulder blasting to
mitigate air blast and fly rocks. The plug used by them for airdecking in the boulders is given
in Figure 2.9.
25
Figure 2.9 Wooden plug for airdecking in boulders [42]
In the current study wooden plug as shown in Figure 2.10 was used to give air gap
in an explosive column as it was convenient to use in pilot scale testing.
Figure 2.10 Wooden plug for airdecking
2.3.5 Effect of Airdecking on Fragmentation
Improved utilization of explosive energy in airdeck blasting results in better
fragmentation [34].
According to single hole tests with and without airdeck in an explosive column
resulted in similar fragmentation, while hole with airdeck used 17% less explosive [31].
26
Airdeck blasting has been seen to increase powder factor (t/kg) from 7.46 to 8.96
and still fragmentation was seen to improve [35].
In 1993 Moxon et al. [37] found that as airdeck length was increased the degree of
fragmentation decreased in comparison to a full column charge. He also noted that this
reduction was very small up to a critical length of the airdeck, after that critical length the
fragmentation results were adversely affected. He found that critical length was dependent
upon the structure and strength of the material to be blasted.
2.3.6 Economics of Airdeck Blasting
At an Indian mine, near Nagpur, mining manganese ore, blasts conducted their
present very relevant learnings; blasts were carried out first by placing decks made of drill
cuttings at the middle of the explosive column. Decks of length 2m were used for benches of
height 6-7m, while decks of length 3-3.5m were used for benches with height 10-11m. The
charge used for these blasts ranged from 0.3 to 0.45 kg/m3.
Once the conventional blasts were completed, blasting was carried out on the same
site using airdecks at the middle of the explosive column. The design parameters used for
airdeck blasting are given in the following Table 2-1.
Table 2-1 Design parameters used for airdeck blasting [34]
Blast
No.
Date Location
Bench
height
(m)
Hole
depth
(m)
No. of
holes
Spacing
X burden
(m x m)
Type and
sequence of
detonation
Charge
per
hole
(kg)
Maximum
charge
per delay
(kg)
Airdeck
numbers
and length
1 28Sept.
1995
146'L, Ch.
1097 m 6.0 6 9 1.8 X 2.0
Electric
short delay 11.12 55.60 One, 0.9 m
2 15Feb.
1996
145'L, Ch.
1036 m 7.0 7 6 2.5 X 2.0
Electric
short delay 25.56 76.75 One, 0.9 m
3 16 Feb.
1996
145'L, Ch.
1006 m 8.7 7 11 2.3 X 2.0
Electric
short delay 34.56 207.36 One, 1.35m
4 18 Feb.
1996
130'L, Ch.
1006 m 10.2 10.7 11 2.5 X 2.0
Electric
short delay 39.56 197.80
Two each
of 0.9m
5 10 Apr.
1996
160'L, Ch.
1036 m 6.0 5.5 7 2.75 X 2.0
Electric
short delay 18.65 93.28 One, 0.6 m
6 11 Apr.
1996
130'L, Ch.
1189 m 11.0 10.75 6 3.0 X 2.0
Electric
short delay 34.6 104.00
Two each
of 1.2 m
27
The blast performance of these airdeck blasts is given in the Table 2-2.
Table 2-2 Blast performance of airdeck blasts [34]
Blast
No.
Specific
charge
(kg m-3
)
Fragmentation Over
break Throw Toe
Vibration
(mmS-1
)
Explosive
type
1 0.45 Gooda Almost nil 6-7 m in
front Nil Negligible Slurry
2 0.73 Very gooda 0.15-0.2
Maximum
up to 8-9
m on one
side
Nil 25 mms-1 at 40
m distance ANFO
3 0.89 Gooda Nil, clean,
intact face 15 m Nil
24.51 mms-1 at
25 m distance ANFO
4 0.70 Poora
Clean face,
back break
of 0.5 m
on one side
18.5 m Nil
27.9 mms-1 at
25-30 m
distance
ANFO
5 0.62 Excellent, ideal
muckpilea 0.2-0.3 m
4-5 m,
well
contained
tight muck
pile
Nil
7.87 mms-1 at
100 m
distance28.35
mm s-1 at 25 m
distance
ANFO
6 0.56 Very gooda
2.5 m,
extension
of back
break from
previous
blast
5-7 m,
contained
within the
bench
width
Nil
18.98 mms-1 at
75 m distance
14.00 mm s-1 at
80 m distance
ANFO
The airdecks were placed at the mid of the explosive column. The advantages of the
airdeck blasting in comparison to conventional blasting are listed below in Table 2-3.
Table 2-3 Advantages of airdeck blasting [34]
Advantages of airdeck blasting over blasting without airdecks
Sr. No. Parameter Improvement
1
Fragmentation
MFS Close to the optimum size
Secondary blasting Almost eliminated
Shovel loading efficiency Improved by 50–60%
2 Ground vibration Reduced by 44%
3 Over break Reduced by 60–70%
4 Toe Almost eliminated
5 Throw Reduced by 65–85%
The use of airdecks proved to be very beneficial with respect to economics as
28
shown by the results given in Table 2-4.
Table 2-4 Economics of airdeck blast [34]
Cost reductions by airdeck blasting
Sr.
No. Item
Cost-benefit
Saving per m3 of
overburden
(INRb)
Savings
per year
(INRb)
Per cent
saving
1 Explosive cost 0.95 285 00 31.60
2 Loading cost
(operating)
1.47 441 00 36.30
3 Transportation
cost (operating)
0.08 24 00 24.60
4 Total 2.50 750 00 32.88
a On the basis of yearly overburden handling of 300 000 m
3.
b Indian rupees [34].
It was thereafter established that the use of airdecks in sandstone rocks at an open
pit coal mine instead of solid airdecks resulted in explosive savings of 15kg to 40kg in each
hole, varying a little with the depth of hole and rock formation. Annual savings at this mine
can be projected to 4.46 million Indian rupees. It was also expected to lower powder factor
from 0.35kg/m3 to 0.25kg/m
3 with better fragmentation achieved in comparison to that
achieved with conventional blasting [34].
Moreover, two 30-holes full scale shots were carried out on a quarry. For one of the
shots, the bore holes were loaded with full continuous column of explosive and for the other,
the bore holes were loaded with three feet airdeck at the bottom of the holes. In addition to
that, the holes containing airdeck were drilled with low sub grade that is 3 to 4 feet less
drilling, while all others design factors were maintained. From the analysis of shot results it
was established that airdeck holes in spite of using 16% less explosive than normal shots
achieved relatively better fragmentation, thus reducing explosive cost effectively [31].
Furthermore, in Indian mines the use of airdecking has been reported to effectively
reduce explosive consumption by 15-20% whilst improving the fragmentation [35].
In a study conducted at a gold mine in northern Nevada [39], it was concluded by
29
the blast dynamics company that by using airdeck at the bottom of the 48 feet long hole
following benefits could be achieved.
A reduction of 144,000 feet could be achieved by simply reducing the sub drilling
requirement from 8 feet to 4 feet. This reduction in drilling requirement can bring about a
saving up to $183,240. Furthermore, with the airdeck replacing the explosive at the bottom 4
feet of the balsthole and also reducing the drilling requirement up to 4 feet, an explosive
consumption could be reduced by 8,128,000 lb. This reduction in explosive requirement
allowed the mine management to save up to $1,080,000 annually. Overall, the mine was able
to save $966,240 annually by using airdecks at the bottom of the holes, after adjusting for the
cost of airdecks. Although, less amount of explosive was used as compared to that used for
the conventional blast, the floor was found to be even by GPS survey, also the excavator
productivity was not affected [39].
2.4 METHODS FOR DETERMINING FRAGMENT SIZE DISTRIBUTION
Sieving is an accurate method for size analysis but for larger material digital image
analysis is being used worldwide [31].
2.4.1 Sieving
Sieving of fragmentations of full scale production blast in thousands of tons is
extremely time consuming and expensive method. The sieving procedure usually consists of
loading, hauling, sieving and weighing and then again loading and hauling of the fragmented
rock material. Gynnemo in 1996 [43] sieved 5000 tons of material while Olsson and
Bergqvist in 2002 [44] sieved up to 400 tons of blasted material and came to the conclusion
that sieving should be used for samples only.
2.4.2 Digital Image Analysis
Digital image analysis technique to determine the fragment size distribution of
blasted rock material emerged as an alternative and is being widely used. Carlsson and
Nyberg (1983) [45] were one of the first user of automatic digital image analysis technique to
estimate the fragment size distribution of the blasted rock material. They made the following
rules.
30
I. The size of the largest fragment should be 20 times larger than the smallest fragment.
II. The size of the smallest fragment should be 3 times larger than the resolution.
Cunningham in 1996 gave a review of Digital image analysis technique of assessing
fragment size distribution and found that ―Evaluation of digital images of blast muckpile is
particularly difficult due to its size, depth and internal variation‖. He further added that if we
are looking at the surface only and a major portion of fragments is hidden below the surface,
the assessment will be biased unless the uniformity index is extremely high. This indicates
the major problem in this technique which is mainly due to fine material concealed below
surface.
Liu and Tran (1996) [46] and Katsabanis (1999) [47] indicated the need of
incorporating fines corrections in the image analysis technique. Wipfrag and Split desktop
have incorporated the fine correction in their systems and raised the accuracy of analyzing
data within the narrow range of resolution and also made it possible to extrapolate it outside
this range. Kemeny et al. in 1999 [48] also worked on fines correction for Split desktop
system and defined the procedure of their correctness. Several validation studies have been
conducted using calibration procedure given by Kemeny et al. on muckpiles. The difference
found by sieved distribution and fines corrected split distribution was much smaller. It is
therefore the digital image analysis technique for determining rock fragment size distribution
is being widely used in the world because it provides fast estimates without interfering with
the other production processes. This technique though very fast and easy but have certain
inherent flows and the only alternate is the sieving which is used only in exceptional
conditions.
2.5 IMPORTANCE OF BLAST FRAGMENTATION
Generally, blasting is used in the mining industry to break and fragment the rock
mass. The blast is considered good when it produces fragmentation which is fine and loose
enough to permit the efficient digging and loading operation. This approach does not give
much importance to the downstream operations. In fact blasting is the first step in the
comminution process and plays more vital role than just fragment the rock mass. The effect
of this process can be calculated in some measureable quantity that is connected with cost or
revenue. It varies with the geological conditions and may also vary with the seasonal climate.
31
A positive effect of the blasting process may consist of :
A larger throughput in crusher and mills.
A lower total energy expenditure in the processes.
Smaller volumes of worthless or cost prone fractions like fines and oversize and a
higher quality of the end product.
A higher ore concentration grade or mineral recovery.
An improved or least maintained fragmentation with a lower explosives consumption.
The Swedish Cement Factory production of crushed aggregate rock is about 40
Mton annually. About 2/3 of this consist of product 0-32 mm base gravel. About 4-6 Mton of
the 0-4 mm material produced is unsalable and become an economic and environmental
burden in the quarry‘s operation [49].
Another example is lumps limestone producers. Nordkalk Storugns has the largest
production of 2.5-3 million tons annually. The -25mm fines are in most cases a worthless or
low price product and about 25% of the plant‘s production is fines [49].
The improvement of the fragmentation can cause many benefits if the blasting is
done more carefully and with a controlled technique with less scatter in the outcome.
Whereas the scatter is largely due to deflections in geological conditions and also due to the
poor process control in staking out, drilling and charging.
Societal needs for a sustainable supply of natural resources requires improved yield
from blasting, crushing and grinding, less transport cost and a minimal amount of easily
handled non-toxic waste [50].
2.5.1 Effects of Blast Fragmentation on Downstream Processes
There are two very important effects of blasting on fragmentation; the first is the
size distribution of fragments of the blasted muckpile. A qualitative estimate can be obtained
by visual observation of the blasted muckpile directly as good or poor. Nowadays the image
analysis techniques can also be used to calculate it quantitatively.
The second important effect of the blasting is the crack generation within the

32
fragments of muckpile. These fractures can be of different size as may be macro-fractures or
micro-fractures. Micro cracks can only be seen by microscope. Because of these micro-cracks
mineral grains tend to soften and break easier. Hence this leads to potential benefits towards
productivity, energy expenditures and wear and tear of consumable item.
It is not adequate to only know about the size distribution of the blasted muckpile
but also the effect of blasting on individual fragments like internal fracturing which greatly
affects the downstream processes. While the first factor is now measureable directly, the
second must be assessed through a study of production, energy consumption and supply cost.
The size distribution of the blast fragments and the internal softening of individual
fragments by blasting can greatly affect the efficiency of all downstream processes [3]. The
fragmentation resulting from blasting operation effects two main downstream operations:
Loading and Hauling
Crushing and Grinding
2.5.1.1 Loading and hauling
Poor fragmentation is not only a nuisance in handling processes but hampers the
natural flow of other processes. A good blast produces an even sized yield and also reduced
number of boulders. This expedites the loading and hauling operations of the blasted
material. Less percentage of boulders means no crowding time and an overall even
fragmentation means a smaller cycle time. The reduced cycle time has a great impact on the
cost effectiveness of hauling operations. Moreover, it also decreases the consumption of
power required to haul the same amount of material when it is even-sized. This lower intake
of power is mirrored in the improved efficiency of haulage equipment as damage to machine
parts due to aggravated load curtails. The power requirement dwindles conserving millions
of rupees in the context of lower fuel intake. Wear and tear to the machines by the excessive
number of boulders is also diminished. In short the better fragmentation leads to an increased
life cycle of machines and recurrent maintenance sessions of equipment can correspondingly
be declined.
33
2.5.1.2 Crushing and grinding
The blasted size distribution introduced to the primary crusher will affect the feed
size distribution throughout the crushing stages. Poor fragmentation leads to energy losses at
the secondary and tertiary crushing stages and increases the load at these stages.
Boulders can cause serious damage and disfigure the body of the hopper when
dumped. In the crushing phase, these boulders impede the smooth flow of the crushing
operation and can sometimes cause choking. Damage to hammers of the crusher are
aggravated substantially and require frequent replacements resulting in substantial
expenditure. Enhanced fragmentation not only smoothes out the process but also depresses
the cost of auxiliary hammers as their life cycle is increased due lesser wear and tear.
Boulders in the crusher adversely increase the vibration and temperature of crusher parts thus
decreasing the life expectancy of parts and can cause a great pestering. Improved
fragmentation is the answer to all the problems. An important factor is mineral liberation in
considering the effectiveness of downstream processes. Greater liberation means improved
downstream recovery. A currently unanswered question is whether blasting that creates more
micro-fractures around or through mineral grain will improve liberation and recovery [50].
However, the studies undertaken in the last decade have shown that the micro-
crakes produced in blast fragments have a measurable impact on crushing and grinding not
only in terms of operational efficiency but also in terms of associated cost [51, 52, 53].
2.5.2 Effects of Blast Fragments on Energy Consumption in Crushing and Grinding
Most of the energy is utilised for the grinding purposes of the material. Therefore, it
can be safely said that changes in the properties of the blasted rock fragments that carry
through to the grinding stage, if conducive could result in large savings.
Workman and Eloranta (2003) [54] talk about an increase in specific charge q from
0.33 to 0.45 kg/ton. This is believed to lower the x80 of the blasted muckpile from 0.4 to 0.3m
and energy consumption of the primary crusher goes down to 0.194 kwh/ton and the cost to
0.136 SEK/ton. Therefore, the explosive cost goes up from 0.87 SEK/ton to 1.19 SEK/ton
and consequently the drilling costs also rise etc. Unless there are other incentives such a
34
change would not be advantageous [54].
Kojovic et al. (1995) [55] presented a case for a quarry and restricted its scope to
only crushing stages, where a raise in the powder factor from q = 0.5 to 0.6 kg/m3 had a
positive and desirable overall impact. Factors such as the improved digging of the muckpile
and less boulders to handle saved 4.0 SEK/ton in extraction costs and an increase in the
crushers‘ bypass flows from 10 to 14% saved another 3.0 SEK/ton.
There are other benefits as well apart from the lower energy costs and increased
productivity in crushing and grinding to be had from improving the blasting.
Lower wear in downstream processes i.e. crushing, grinding, loading and hauling.
Increase in shovel efficiency and low energy utilization during loading.
A chance to use lighter equipment, smaller shovels, trucks and primary crushers e.g
with smaller capital costs and energy consumption [55].
Paley and Kojovic (2001) [3] presented ways to increase the throughput of SAG
(Semi-Autogenous Grinding) mill at the Red Dog lead and zinc mine. The SAG mill is
connected directly from a primary crusher. From the experiment conducted by them it can be
concluded that the mining industry could achieve a net benefit of 30 M$/year from an
increased concentrate production by just increasing the powder factor form 0.29 kg/ton to
0.72 kg/ton. Their greatest achievement included the identification of an important factor,
best mine fragmentation, which optimizes the mill‘s performance [3].
2.5.3 Effects of Blast Fragments from Mine to Mill
The potential areas that could bear the impact of blast fragments from Mine to Mill
include:
1. It has been observed that the productivity of loader/excavators through muckpile
digability is increased and also the bucket and truck fill factors are increased.
2. Crusher throughput is increased due to changes in ROM (run of the mine) pad
material size distribution.
35
3. The energy consumption for downstream processing and per ton of processed ore is
reduced.
4. Damage caused by blast is reduced and ore dilution resulting in increased final
product (or metal).
5. Increased liberation of valuables is obtained, increasing the mill recovery.
According to Grundstrom et al. (2001) [56] the following procedure could be
adopted to achieve optimization:
Scoping, to be precise by defining the goal of the optimization.
Auditing; finding out the blasting of rock, its comminution characteristics, how the
drilling and blasting is done in practice, the fragmentation and how the mills work.
Modeling and simulation of fragmentation by blasting, crushing and grinding and the
equipment capacities.
Mine to mill simulations that are simulations of the whole system when for example
the blast design is changed.
Validation phase that is checking that the simulation results accuracy. A 5%
agreement is given as an example.
Implementation phase in which the new designs and plant settings are introduced.
Grunstrom et al. (2001)[56] worked on a gold mine with hornblende diorite and an
in-situ block size of 0.5-0.6m. They achieved a 25% increase throughput in SAG mills by
going from a blasting pattern with burden: Spacing = 5.3:6.3m with holes of diameter = 200
mm to a pattern with burden: Spacing = 4.5:5.5m with holes of diameter = 229mm. The
specific charge was increased from 0.66 to 0.85 kg/m3 [56].
Craig Imrie (2003) [57] has reviewed a couple of case studies in which he cites
common figures of improvement as 2-5% for recovery, 2% for concentrate grade and 5-10%
for mill throughput. Two crucial factors involved are a flow-sheet model of the process
system from geology to customer and a compatible systematic information management.
He also observed regarding the states that benefit and these come in two steps. The
first comes from the improved understanding of the process system that the model and data
give. The second comes from the data and the model which are put into advance use [57].
36
Eloranta published a number of papers regarding the effect of blasting on crushing
and grinding (1995, 1997, 2001, 2002) [58, 59, 60]. Much of this material and findings are
contained in Workman and Eloranta (2003). They draw the following conclusions:
1. The greatest energy savings come from grinding due to the large change in and the
subsequent particle size achieved.
2. Improvements pertaining to blasting in grinding depend primarily on the degree of
micro-fracturing achieved, as it is these cracks that will survive earlier stages of
crushing.
3. Large savings in cost can be achieved.
4. The use of greater energy input in the blasting unit operation will often be less costly
than expending the energy downstream.
5. However, there were still some unanswered questions about drill-to-mill (mine-to-
mill) optimization.
The large cost savings projected, and in some cases seen in actual practice make
research in this field an urgent priority for mining cost minimization.
37
CHAPTER 3.
LABORATORY SCALE EXPERIMENTATION AND RESULTS
3.1 BACKGROUND
Since the theory of airdecking has been proposed by Mel‘nikov and Marchenko
(1971) [9], a number of studies and practical applications have been carried out to find its
effectiveness by different researchers. Researchers are divided on the idea of the location of
the airdeck in explosive column and the optimum length of airdeck. Three types of airdeck
positions are commonly used by researchers and practitioners that is, top, middle and bottom
of the explosive column.
Jhanwar et al. [10] suggested that the airdecks were most effective if placed at the
middle position of an explosive column. Jhanwar [11] also observed that bottom airdeck can
only be used for blasting of holes with softer bottoms. Moxon et.al [12] also had a similar
point of view and concluded that the middle position of the airdeck resulted in an improved
rock fragmentation due to the interaction of two simultaneous shock wave fronts from the top
and bottom of an explosive charge. However Chiappetta [7] stated that the bottom airdeck
can be used more effectively than continuous cylindrical charges because it produces 2 to 7
times more pressure at the bottom of the hole when properly practiced. In contrary to that Liu
and Katsabanis [13] suggested that only the top position of airdeck improved the rock
fragmentation than that of other two positions.
Since most of the experiments in the past were carried out under varying geological
conditions, it was very difficult to suggest the best possible location for airdeck in an
explosive column for better fragmentation. In order to find out the proper position of airdeck
it was decided to carry out all experiments on homogeneous material so that a bench mark
could be established. The details of laboratory scale experimentation are shown below.
3.2 MODEL MATERIAL
Research work performed at the University of Maryland [15] and at SveDeFo [16]
demonstrated that concrete is the most suitable material for this type of research study. Thus,
in the current research work, all the blasting experiments were conducted on concrete blocks.

38
On one hand concrete blocks eliminate the heterogeneity and anisotropy of rock material, and
on the other hand it also removes the effects of geological uncertainties and irregularities
such as fractures, folds, faults and joints on blasting.
3.2.1 Dimensions of Blocks
First of all wooden block model of size 2 meter cube was made to assess the
handling and workability of concrete block. The above purposed concrete block of size 2
meter cube was rejected for two reasons. Firstly, it was very difficult to handle such a huge
and heavy concrete block and secondly large numbers of blocks were required for
experimentation. So keeping in view the convenience, it was decided to use smaller blocks
with dimensions 350 mm × 350 mm × 300 mm as shown in Figure 3.1.
Figure 3.1 Three dimensional sketch of a concrete block with
dimensions and hole to be blasted
The ratio of ingredients per block as shown in Table 3-1 was maintained throughout
the research.
Table 3-1 Concrete blocks composition for one block
Ingredients Weight (kgs)
Ordinary Portland cement 25
Sand 24
Coarse aggregate (12.7 mm) 48
Water 3.6
Chemrite NN 0.6
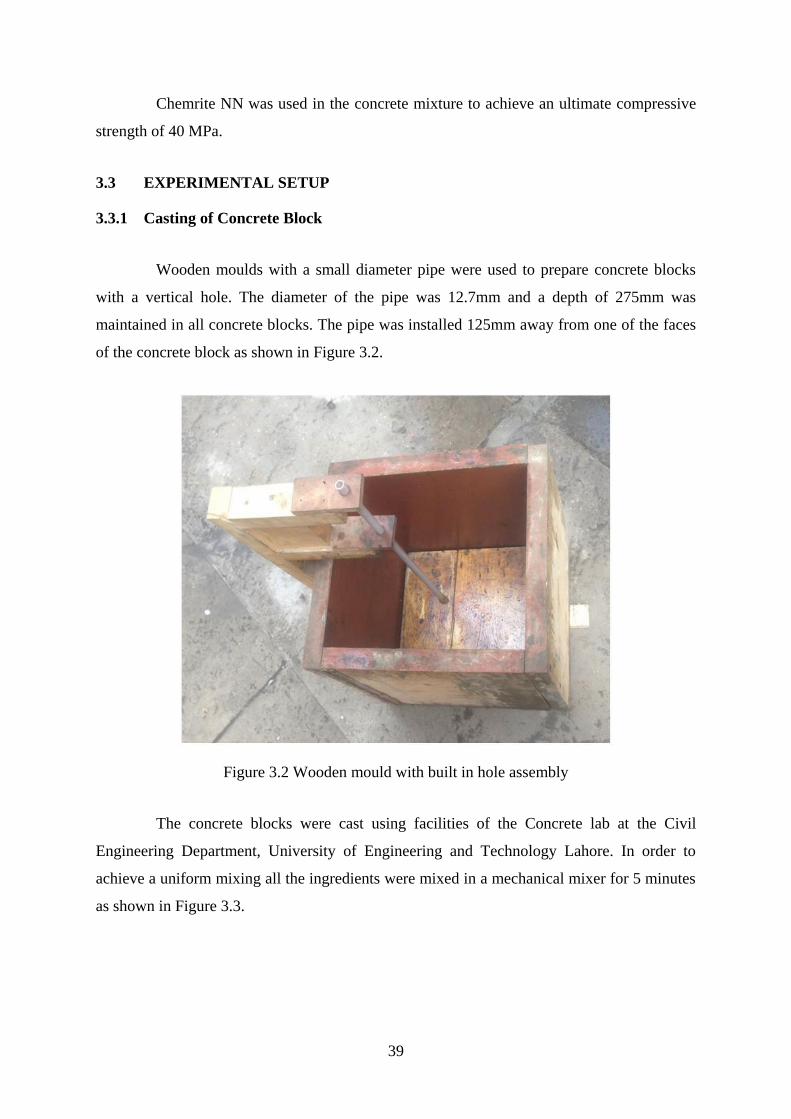
39
Chemrite NN was used in the concrete mixture to achieve an ultimate compressive
strength of 40 MPa.
3.3 EXPERIMENTAL SETUP
3.3.1 Casting of Concrete Block
Wooden moulds with a small diameter pipe were used to prepare concrete blocks
with a vertical hole. The diameter of the pipe was 12.7mm and a depth of 275mm was
maintained in all concrete blocks. The pipe was installed 125mm away from one of the faces
of the concrete block as shown in Figure 3.2.
Figure 3.2 Wooden mould with built in hole assembly
The concrete blocks were cast using facilities of the Concrete lab at the Civil
Engineering Department, University of Engineering and Technology Lahore. In order to
achieve a uniform mixing all the ingredients were mixed in a mechanical mixer for 5 minutes
as shown in Figure 3.3.
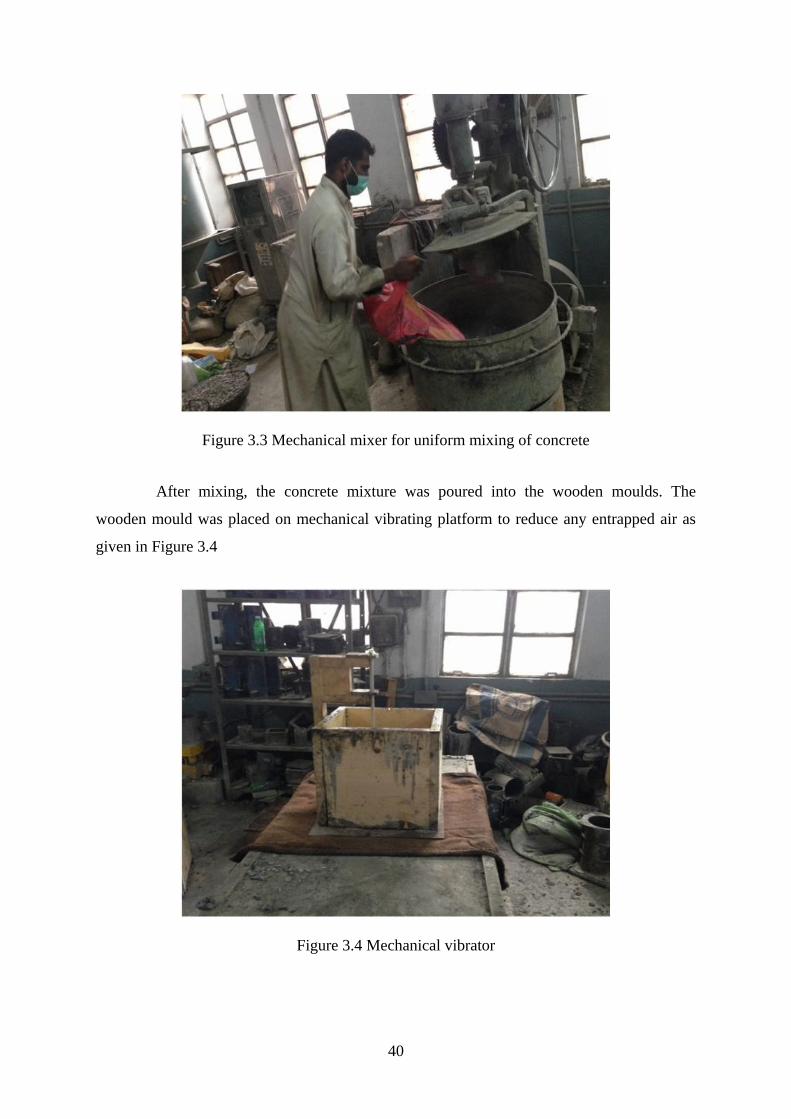
40
Figure 3.3 Mechanical mixer for uniform mixing of concrete
After mixing, the concrete mixture was poured into the wooden moulds. The
wooden mould was placed on mechanical vibrating platform to reduce any entrapped air as
given in Figure 3.4
Figure 3.4 Mechanical vibrator
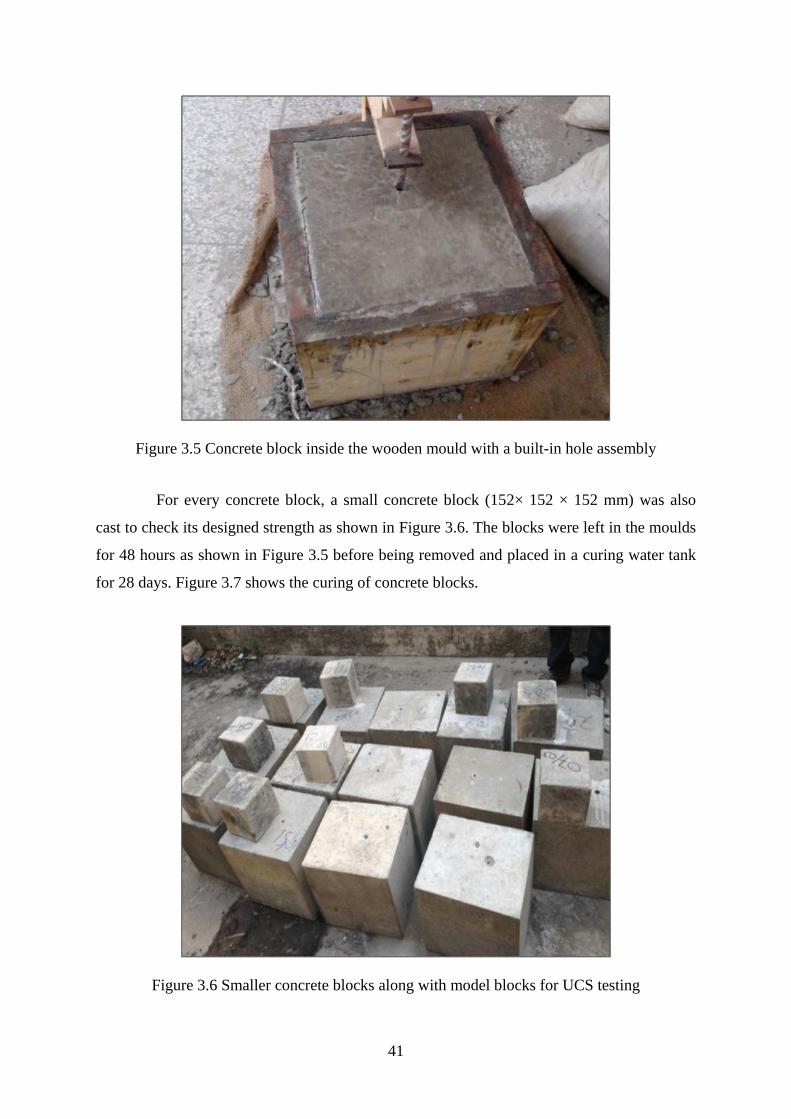
41
Figure 3.5 Concrete block inside the wooden mould with a built-in hole assembly
For every concrete block, a small concrete block (152× 152 × 152 mm) was also
cast to check its designed strength as shown in Figure 3.6. The blocks were left in the moulds
for 48 hours as shown in Figure 3.5 before being removed and placed in a curing water tank
for 28 days. Figure 3.7 shows the curing of concrete blocks.
Figure 3.6 Smaller concrete blocks along with model blocks for UCS testing
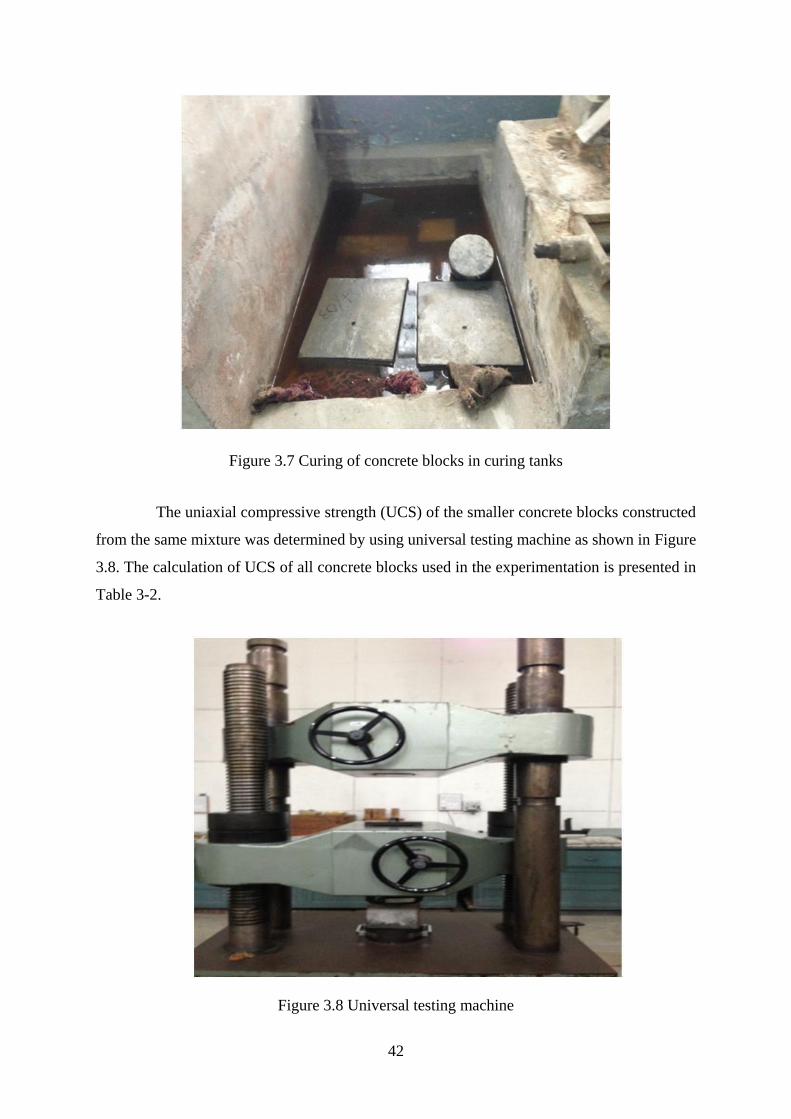
42
Figure 3.7 Curing of concrete blocks in curing tanks
The uniaxial compressive strength (UCS) of the smaller concrete blocks constructed
from the same mixture was determined by using universal testing machine as shown in Figure
3.8. The calculation of UCS of all concrete blocks used in the experimentation is presented in
Table 3-2.
Figure 3.8 Universal testing machine

43
Table 3-2 Calculation of UCS of all blocks using universal testing machine
Sample Width of block
Length
of block Height
of block Area Load
Max
Bearing
Load (N)
UCS
(cm) (cm) (cm) (m2) (kgf) (MPa)
1 15.6 15.5 15.4 0.02418 97400 954520 39.5
2 15.7 15.5 15.3 0.02433 97800 958440 39.4
3 15.8 15.5 15.4 0.02449 98000 960400 39.2
4 15.5 15.4 15.5 0.02387 97000 950600 39.8
5 15.4 15.4 15.5 0.02372 96800 948640 40.0
6 15.6 15.4 15.3 0.02402 96600 946680 39.4
7 15.5 15.5 15.6 0.02403 96800 948640 39.4
8 15.4 15.6 15.4 0.02402 98200 962360 40.1
9 15.6 15.4 15.5 0.02402 99400 974120 40.1
10 15.5 15.5 15.6 0.02403 99800 978040 40.7
11 15.5 15.5 15.4 0.02403 96800 948640 39.4
12 15.5 15.5 15.4 0.02403 99800 978040 40.1
13 15.6 15.4 15.6 0.02402 99600 976080 40.6
14 15.5 15.5 15.4 0.02403 99600 976080 40.6
15 15.5 15.4 15.5 0.02402 97400 954520 39.7
16 15.6 15.5 15.4 0.02418 97400 954520 39.5
17 15.5 15.5 15.6 0.02403 96800 948640 39.4
18 15.4 15.6 15.4 0.02402 98200 962360 40.1
95 15.6 15.4 15.3 0.02402 96600 946680 39.4
02 15.5 15.5 15.6 0.02403 96800 948640 39.4
09 15.4 15.6 15.4 0.02402 98200 962360 40.1
00 15.6 15.4 15.5 0.02402 99400 974120 40.1
02 15.5 15.5 15.6 0.02403 99800 978040 40.7
02 15.5 15.5 15.4 0.02403 96800 948640 39.4
02 15.5 15.5 15.4 0.02403 99800 978040 40.1
02 15.6 15.5 15.4 0.02418 97400 954520 39.5
27 15.7 15.5 15.3 0.02433 97800 958440 39.4
04 15.8 15.5 15.4 0.02449 98000 960400 39.2
05 15.5 15.4 15.5 0.02387 97000 950600 39.8
22 15.4 15.4 15.5 0.02372 96800 948640 40.0
29 15.6 15.4 15.6 0.02402 99600 976080 40.6
20 15.5 15.5 15.4 0.02403 99600 976080 40.6
22 15.5 15.4 15.5 0.02402 97400 954520 39.7
22 15.6 15.5 15.4 0.02418 97400 954520 39.5
22 15.5 15.5 15.6 0.02403 96800 948640 39.4
22 15.4 15.6 15.4 0.02402 98200 962360 40.1
23 15.5 15.5 15.4 0.02403 96800 948640 39.4
24 15.5 15.5 15.4 0.02403 99800 978040 40.1
25 15.6 15.4 15.6 0.02402 99600 976080 40.6
22 15.5 15.5 15.4 0.02403 99600 976080 40.6
Average 39.9

44
The average UCS of all concrete blocks was found to be almost 40 Mpa. The
stemming, explosive and airdeck length in the blocks were painted with different colours as
shown in Figure 3.9. Watergel explosive (Blaster) manufactured by Biafo Industries was used
in all the experiments. The density of the Blaster was 1.15 g/cc with velocity of detonation as
4500 m/s. Nonel initiation system was used for all experiments.
Figure 3.9 Dimensions of concrete block and location of hole
3.3.2 Blast Design of Concrete Block
Blast design parameters used in the experimentation are given by the following
formulas:
Burden factor, kb = 30[SGe/1.3]1/3
[160/dr] 1/3
Where,
dr = density of rock ,lbs/ft3
Burden distance, B = kb (De/12) ft
Stemming length, T = (2/3 B) ft
Sub-drilling, J = 1/3xB ft
Depth of hole H = (L+J) ft
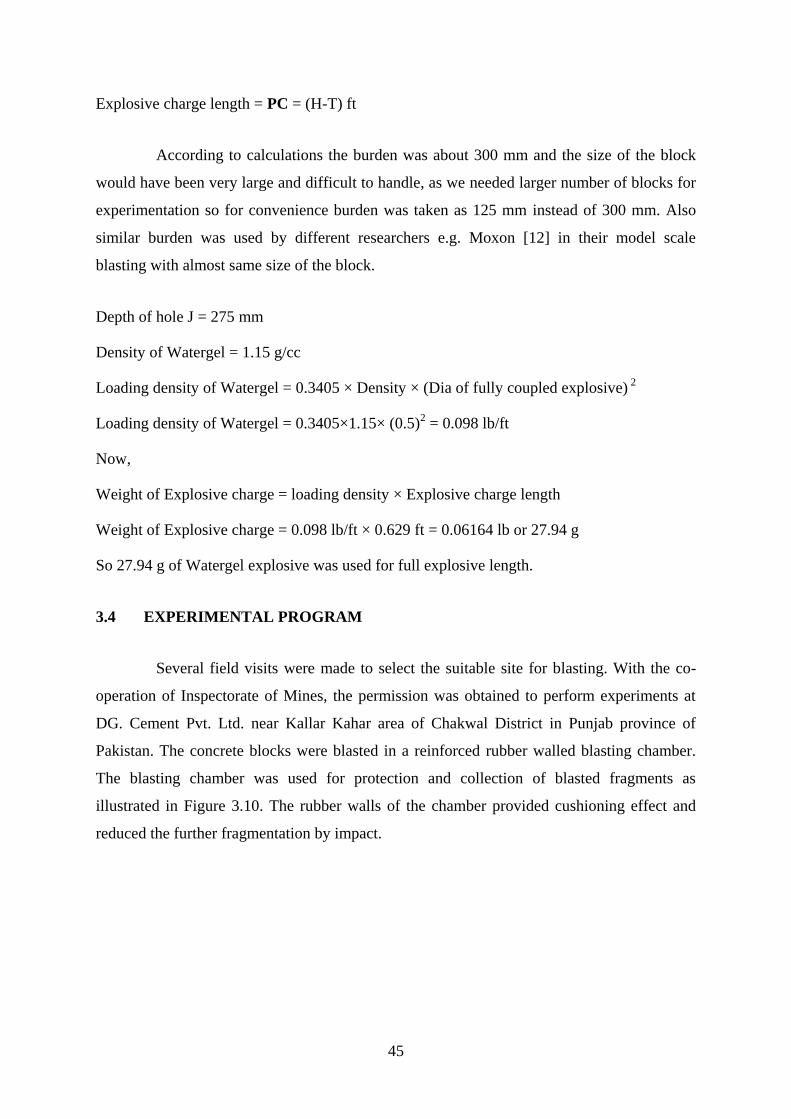
45
Explosive charge length = PC = (H-T) ft
According to calculations the burden was about 300 mm and the size of the block
would have been very large and difficult to handle, as we needed larger number of blocks for
experimentation so for convenience burden was taken as 125 mm instead of 300 mm. Also
similar burden was used by different researchers e.g. Moxon [12] in their model scale
blasting with almost same size of the block.
Depth of hole J = 275 mm
Density of Watergel = 1.15 g/cc
Loading density of Watergel = 0.3405 × Density × (Dia of fully coupled explosive) 2
Loading density of Watergel = 0.3405×1.15× (0.5)2 = 0.098 lb/ft
Now,
Weight of Explosive charge = loading density × Explosive charge length
Weight of Explosive charge = 0.098 lb/ft × 0.629 ft = 0.06164 lb or 27.94 g
So 27.94 g of Watergel explosive was used for full explosive length.
3.4 EXPERIMENTAL PROGRAM
Several field visits were made to select the suitable site for blasting. With the co-
operation of Inspectorate of Mines, the permission was obtained to perform experiments at
DG. Cement Pvt. Ltd. near Kallar Kahar area of Chakwal District in Punjab province of
Pakistan. The concrete blocks were blasted in a reinforced rubber walled blasting chamber.
The blasting chamber was used for protection and collection of blasted fragments as
illustrated in Figure 3.10. The rubber walls of the chamber provided cushioning effect and
reduced the further fragmentation by impact.

46
Figure 3.10 Metallic blasting chamber with reinforced rubber walls
3.4.1 Different Steps Involved in Charging of Block
Special small cartridges as shown in Figure 3.11 were prepared with water proof
paper material in which Watergel was loaded to the designed weight and length. Figure 3.11
to Figure 3.15 presents the different steps involved in charging of concrete blocks.
Figure 3.11 Explosive cartridges of different sizes

47
Figure 3.12 Watergel cartridge Figure 3.13 Weighing the cartridge on digital balance
Figure 3.14 Concrete blocks in field ready for loading Figure 3.15 Charge loading of concrete block
3.4.2 Blasting Testing
Two series of blasting experiments were performed in this phase. The first test
series consisted of baseline blasting experiments with full column charge, six blocks were
blasted in this case. The second test series was performed to find out the most appropriate
position of airdeck in the explosive column.
During baseline testing, six concrete blocks were blasted individually with full
column charge without any airdecking. Table 3-3 shows the different experimental
parameters used in this research work.
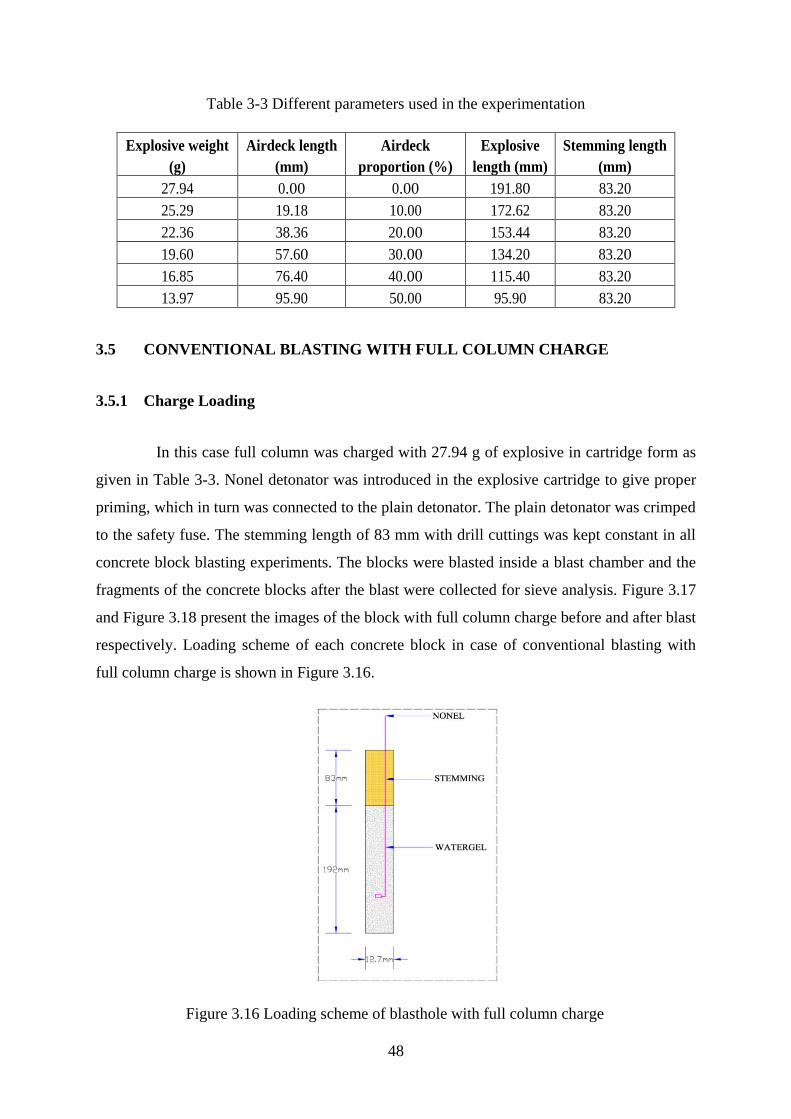
48
Table 3-3 Different parameters used in the experimentation
Explosive weight
(g)
Airdeck length
(mm)
Airdeck
proportion (%)
Explosive
length (mm)
Stemming length
(mm)
27.94 0.00 0.00 191.80 83.20
25.29 19.18 10.00 172.62 83.20
22.36 38.36 20.00 153.44 83.20
19.60 57.60 30.00 134.20 83.20
16.85 76.40 40.00 115.40 83.20
13.97 95.90 50.00 95.90 83.20
3.5 CONVENTIONAL BLASTING WITH FULL COLUMN CHARGE
3.5.1 Charge Loading
In this case full column was charged with 27.94 g of explosive in cartridge form as
given in Table 3-3. Nonel detonator was introduced in the explosive cartridge to give proper
priming, which in turn was connected to the plain detonator. The plain detonator was crimped
to the safety fuse. The stemming length of 83 mm with drill cuttings was kept constant in all
concrete block blasting experiments. The blocks were blasted inside a blast chamber and the
fragments of the concrete blocks after the blast were collected for sieve analysis. Figure 3.17
and Figure 3.18 present the images of the block with full column charge before and after blast
respectively. Loading scheme of each concrete block in case of conventional blasting with
full column charge is shown in Figure 3.16.
Figure 3.16 Loading scheme of blasthole with full column charge
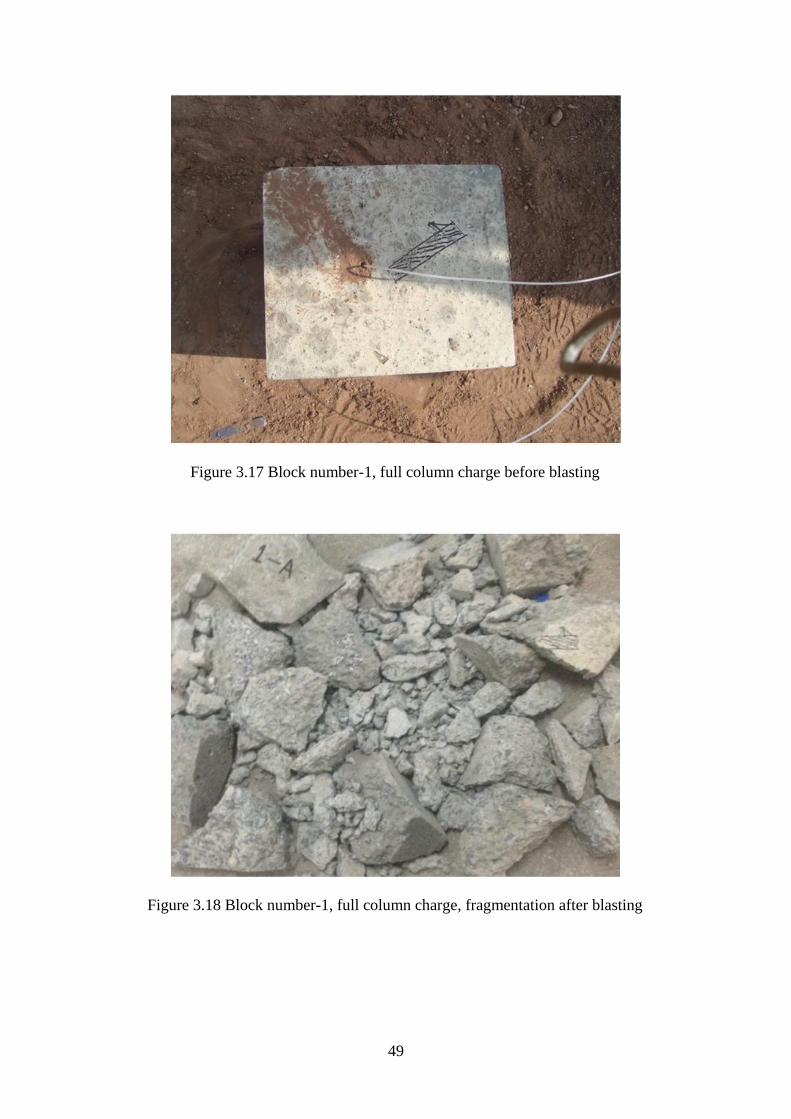
49
Figure 3.17 Block number-1, full column charge before blasting
Figure 3.18 Block number-1, full column charge, fragmentation after blasting
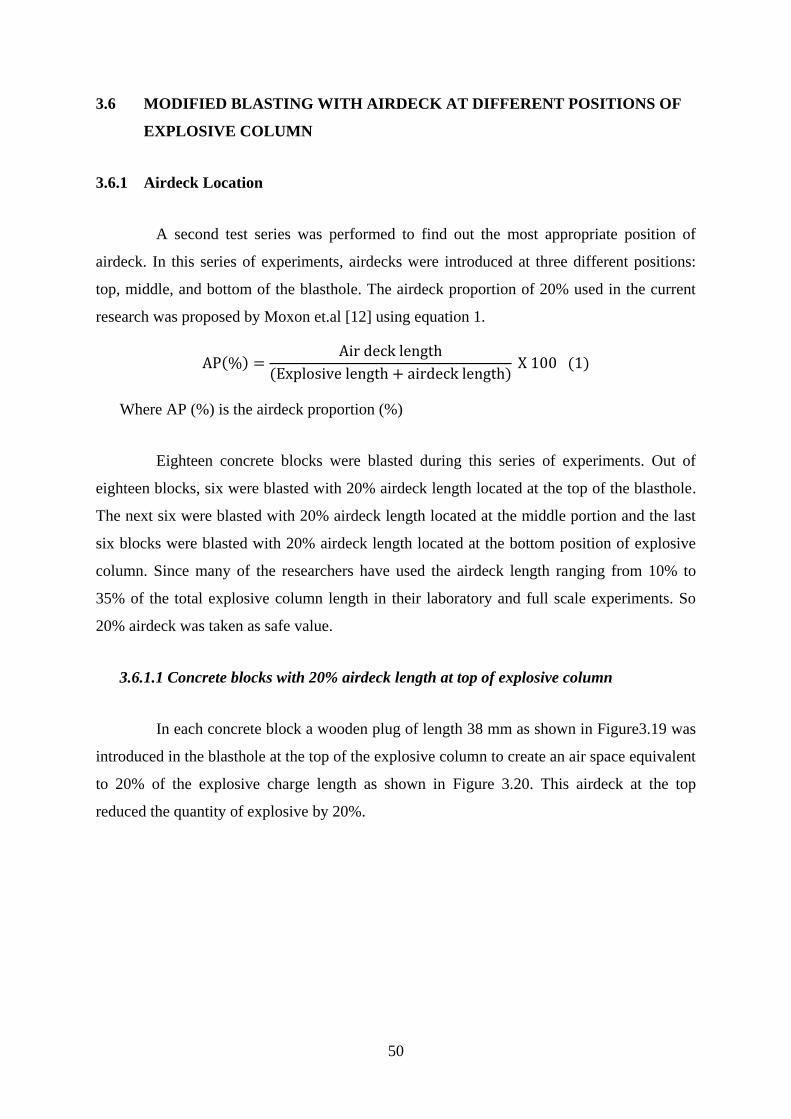
50
3.6 MODIFIED BLASTING WITH AIRDECK AT DIFFERENT POSITIONS OF
EXPLOSIVE COLUMN
3.6.1 Airdeck Location
A second test series was performed to find out the most appropriate position of
airdeck. In this series of experiments, airdecks were introduced at three different positions:
top, middle, and bottom of the blasthole. The airdeck proportion of 20% used in the current
research was proposed by Moxon et.al [12] using equation 1.
( )
( ) ( )
Where AP (%) is the airdeck proportion (%)
Eighteen concrete blocks were blasted during this series of experiments. Out of
eighteen blocks, six were blasted with 20% airdeck length located at the top of the blasthole.
The next six were blasted with 20% airdeck length located at the middle portion and the last
six blocks were blasted with 20% airdeck length located at the bottom position of explosive
column. Since many of the researchers have used the airdeck length ranging from 10% to
35% of the total explosive column length in their laboratory and full scale experiments. So
20% airdeck was taken as safe value.
3.6.1.1 Concrete blocks with 20% airdeck length at top of explosive column
In each concrete block a wooden plug of length 38 mm as shown in Figure3.19 was
introduced in the blasthole at the top of the explosive column to create an air space equivalent
to 20% of the explosive charge length as shown in Figure 3.20. This airdeck at the top
reduced the quantity of explosive by 20%.
51
Figure 3.19 Wooden spacers used to give airdeck in the explosive column
3.6.1.1.1 Charge loading in case of 20% top airdeck blast
Loading scheme of each blasthole with 20% airdeck length at top of explosive
column is shown in Figure 3.20. The blocks were blasted in a blast chamber and the
fragmentations of the concrete blocks after blast were collected for sieve analysis. The Figure
3.21 and Figure 3.22 represent the images of block with 20% airdeck length at top of
explosive column before and after blast respectively.
Figure 3.20 Loading scheme of blasthole with 20% airdeck length at the top of
explosive column

52
Figure 3.21 Block number-14 with 20% airdeck length at top of explosive
column, before blasting
Figure 3.22 Block number-14 with 20% airdeck length at top of explosive
column, after blasting
3.6.1.2 Concrete blocks with 20% airdeck length at mid of explosive column
In this case, in each blasthole a wooden plug of length 38 mm was introduced at the
mid of the explosive column to create an air space equivalent to 20% of explosive charge
53
length as shown in Figure 3.23.
. The consumption of explosive was reduced 20% by using airdeck at middle
location of the explosive column.
3.6.1.2.1 Charge loading in case of 20%mid-airdeck blast
The loading configuration of the each blasthole with 20% airdeck at the middle of
the explosive column is shown in Figure 3.23. Top and bottom priming was used in each
blasthole, with airdeck at the middle position of explosive column. It is very important to
note here that the nonel detonators used for top and bottom priming in each single blasthole
in case of mid-airdeck were of same delay. Moreover the amount, type and sequence of
explosive above and below the airdeck was kept same for each mid-airdeck blasthole as
shown inFigure 3.23.The blocks as shown in Figure 3.24 were blasted in a blast chamber and
the fragments of the concrete blocks after blast were collected for sieve analysis as shown in
Figure 3.25.
Figure 3.23 Loading scheme of blasthole with 20% airdeck length
at mid of explosive column
54
Figure 3.24 Block number-21 with 20% airdeck length at mid of explosive
column, before blasting
Figure 3.25 Block number-21 with 20% airdeck length at mid of explosive
column, after blasting

55
3.6.1.3 Concrete blocks with 20% airdeck at bottom of explosive column
A wooden plug of 38 mm length was kept at the bottom of the explosive column to
create an air space equal to 20% of explosive charge length as given in Figure 3.26.This
airdeck at the bottom of the explosive column reduced the consumption of explosive by 20%.
3.6.1.3.1 Charge loading in case of 20% bottom airdeck blast
The charging sequence of each blasthole with 20% airdeck length at bottom of
explosive column is shown in Figure 3.26.The blocks were blasted in a blast chamber and the
fragments of the concrete blocks after blast were collected for sieve analysis. Figure 3.27 and
Figure 3.28 show the images of the blocks before and after blast respectively.
Figure 3.26 Loading scheme of blasthole with 20% airdeck length at bottom
of explosive column

56
Figure 3.27 Block number-16 with 20% airdeck length at bottom of explosive
column, before blasting
Figure 3.28 Block number-16 with 20% airdeck length at bottom of explosive
column, after blast
3.6.1.4 Results and discussion
After blasting, the fragments of each concrete block were collected for sieve
analysis. The sieves used for size analysis (in mm) are 128, 64, 32, 16, 8, 4, 2, and 1 as shown
in Figure 3.29.
57
Figure 3.29 Sieves of different sizes used for analysis
The results of sieve analysis are shown in Table 3-4.
Table 3-4 Experimental results with respect to location of airdeck
Fraction
Size
(mm)
Solid Charge
mean values
20% Airdeck – mean values
(kg)
Top (kg)
Middle
(kg)
Bottom
(kg)
+128 29.77 39.81 19.29 54.45
-128+64 25.23 29.90 22.74 18.93
-64+32 16.80 8.51 21.51 7.54
-32+16 7.44 3.82 12.23 2.39
-16+8 3.45 1.32 5.92 0.84
-8+4 1.18 0.49 1.60 0.25
-4+2 0.40 0.38 0.70 0.12
-2+1 0.30 0.23 0.53 0.09
Total 84.56 84.45 84.52 84.60
It may be inferred from the results shown in the Table 3-4 that the size distribution
of blasted block fragments when airdeck was located at the middle position of explosive
column were more uniform as compared to when solid charge was used or when airdeck was
placed at top and bottom positions of explosive column as shown in Figure 3.30.

58
(a) ( b)
(c) (d)
Figure 3.30 Fragmentation of concrete blocks after blast (a) full-column charge (b)
20% middle airdeck (c) 20% bottom airdeck (d) 20% top airdeck for comparison
The mean size of the blasted block fragments of solid charge and 20% airdeck at
different positions is tabulated in Table 3-5.
Table 3-5 Experimental results in terms of mean fragment size
Fraction Solid
Charge
20% Airdeck
Top Middle Bottom
Mean Fragment
Size (mm) 98.6 117.5 79.9 132.1

59
It is evident from the results that mid column airdeck produced smaller mean
fragment size as compared to that produced in the case of full column explosive charge and
airdeck at top and bottom positions of explosive column. The mean size of the blasted block
fragments was calculated by using the following formula [12].
( ) ∑
( )
Where MFS (mm) is the mean fragment size in mm.
Table 3-6 shows the comparison of cumulative percent-passing of the blasted block
fragments against each sieve size for all the experiments in this phase.
Table 3-6 Comparison of cumulative percent-passing of fragmentation of
solid charge vs. 20% airdeck at different positions
Sieve
Size
(mm)
Cumulative Percentage Passing
Solid
Charge
20% Top
Airdeck
20% Mid-
Airdeck
20%
Bottom
Airdeck
128 64.79% 52.86% 77.18% 35.64%
64 34.96% 17.46% 50.28% 13.27%
32 15.10% 7.38% 24.82% 4.36%
16 6.30% 2.86% 10.35% 1.53%
8 2.22% 1.30% 3.34% 0.54%
4 0.82% 0.72% 1.45% 0.25%
2 0.35% 0.27% 0.63% 0.10%
1 0.00% 0.00% 0.00% 0.00%
0 0.00% 0.00% 0.00% 0.00%
Figure 3.31 shows the cumulative percent-passing plot for the blasted block
fragments for all the experiments in this phase.
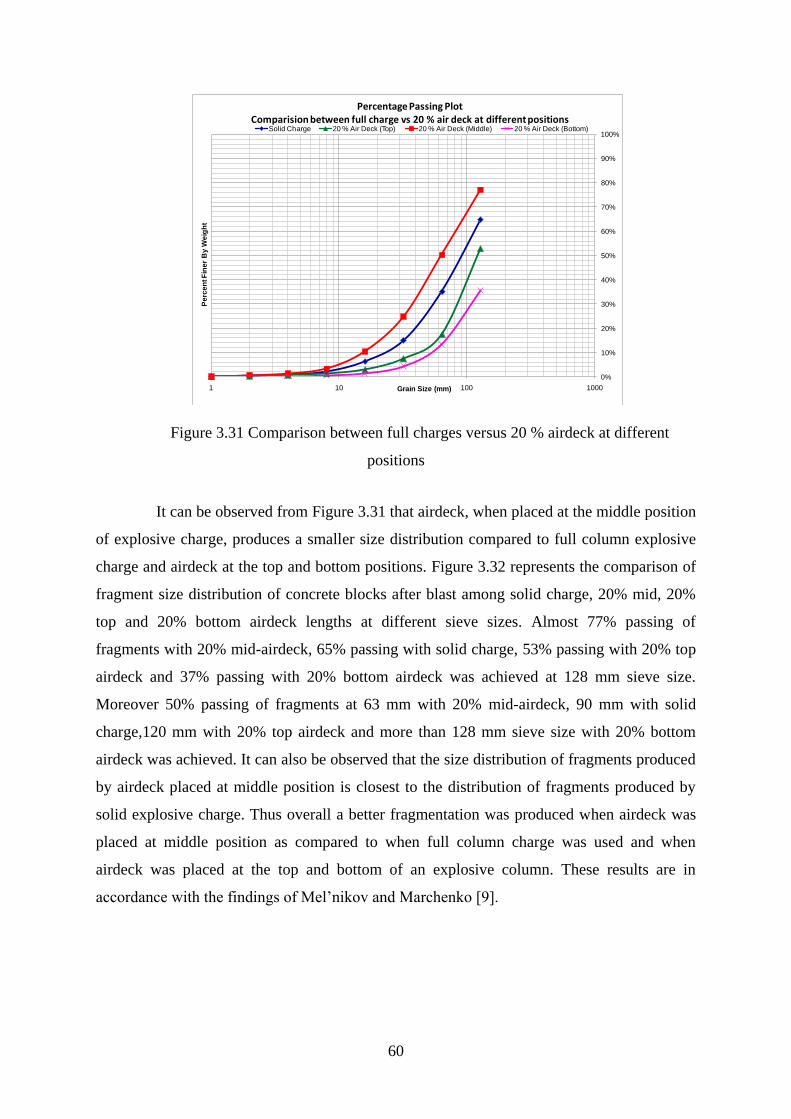
60
Figure 3.31 Comparison between full charges versus 20 % airdeck at different
positions
It can be observed from Figure 3.31 that airdeck, when placed at the middle position
of explosive charge, produces a smaller size distribution compared to full column explosive
charge and airdeck at the top and bottom positions. Figure 3.32 represents the comparison of
fragment size distribution of concrete blocks after blast among solid charge, 20% mid, 20%
top and 20% bottom airdeck lengths at different sieve sizes. Almost 77% passing of
fragments with 20% mid-airdeck, 65% passing with solid charge, 53% passing with 20% top
airdeck and 37% passing with 20% bottom airdeck was achieved at 128 mm sieve size.
Moreover 50% passing of fragments at 63 mm with 20% mid-airdeck, 90 mm with solid
charge,120 mm with 20% top airdeck and more than 128 mm sieve size with 20% bottom
airdeck was achieved. It can also be observed that the size distribution of fragments produced
by airdeck placed at middle position is closest to the distribution of fragments produced by
solid explosive charge. Thus overall a better fragmentation was produced when airdeck was
placed at middle position as compared to when full column charge was used and when
airdeck was placed at the top and bottom of an explosive column. These results are in
accordance with the findings of Mel‘nikov and Marchenko [9].
0%
10%
20%
30%
40%
50%
60%
70%
80%
90%
100%
1 10 100 1000
Pe
rce
nt F
ine
r B
y W
eig
ht
Grain Size (mm)
Percentage Passing PlotComparision between full charge vs 20 % air deck at different positions
Solid Charge 20 % Air Deck (Top) 20 % Air Deck (Middle) 20 % Air Deck (Bottom)
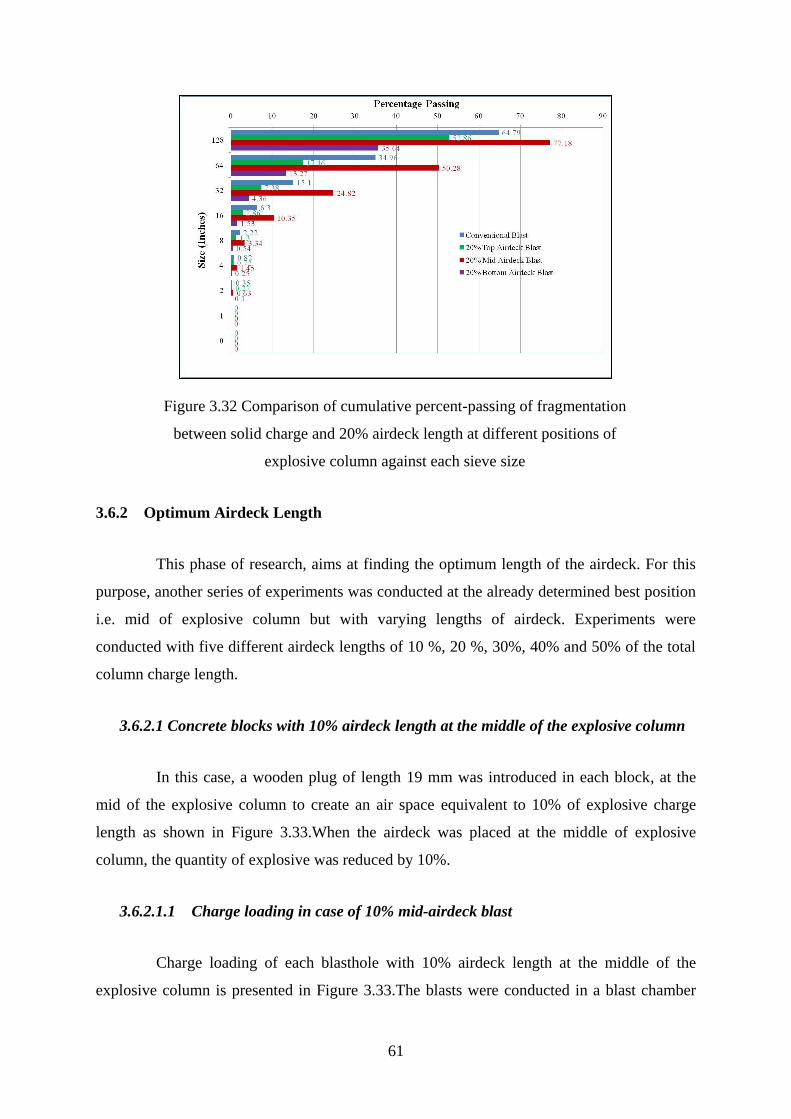
61
Figure 3.32 Comparison of cumulative percent-passing of fragmentation
between solid charge and 20% airdeck length at different positions of
explosive column against each sieve size
3.6.2 Optimum Airdeck Length
This phase of research, aims at finding the optimum length of the airdeck. For this
purpose, another series of experiments was conducted at the already determined best position
i.e. mid of explosive column but with varying lengths of airdeck. Experiments were
conducted with five different airdeck lengths of 10 %, 20 %, 30%, 40% and 50% of the total
column charge length.
3.6.2.1 Concrete blocks with 10% airdeck length at the middle of the explosive column
In this case, a wooden plug of length 19 mm was introduced in each block, at the
mid of the explosive column to create an air space equivalent to 10% of explosive charge
length as shown in Figure 3.33.When the airdeck was placed at the middle of explosive
column, the quantity of explosive was reduced by 10%.
3.6.2.1.1 Charge loading in case of 10% mid-airdeck blast
Charge loading of each blasthole with 10% airdeck length at the middle of the
explosive column is presented in Figure 3.33.The blasts were conducted in a blast chamber
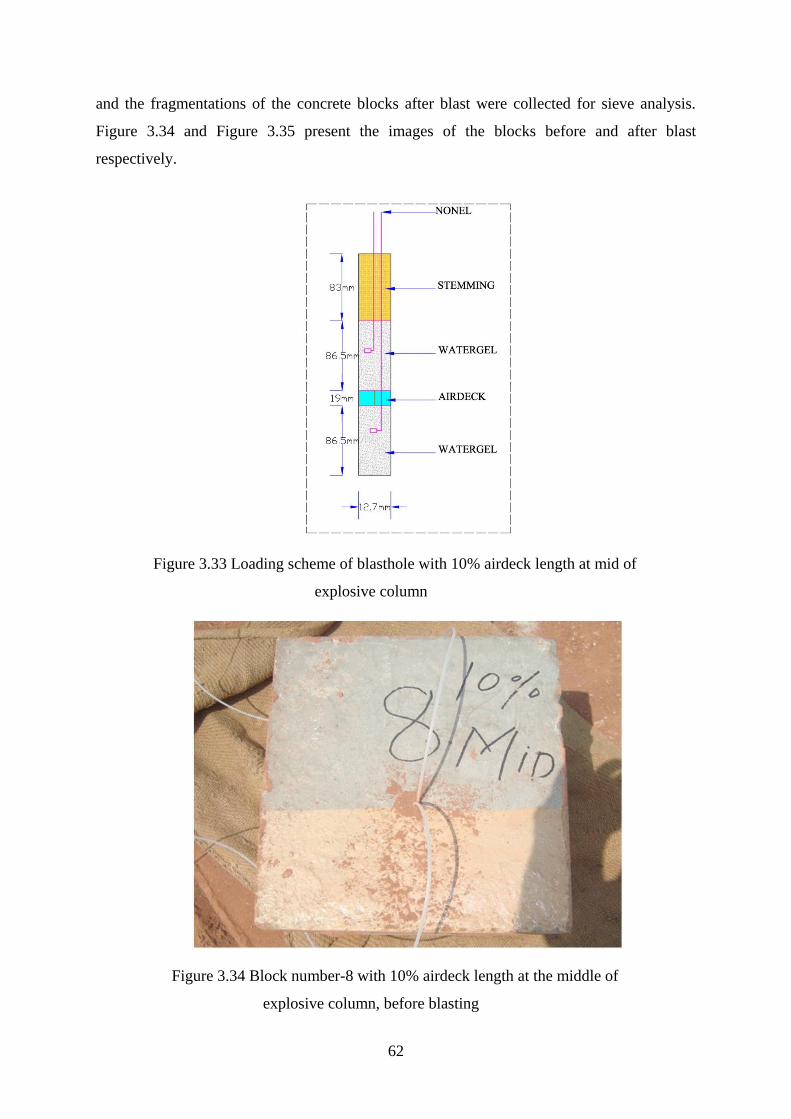
62
and the fragmentations of the concrete blocks after blast were collected for sieve analysis.
Figure 3.34 and Figure 3.35 present the images of the blocks before and after blast
respectively.
Figure 3.33 Loading scheme of blasthole with 10% airdeck length at mid of
explosive column
Figure 3.34 Block number-8 with 10% airdeck length at the middle of
explosive column, before blasting
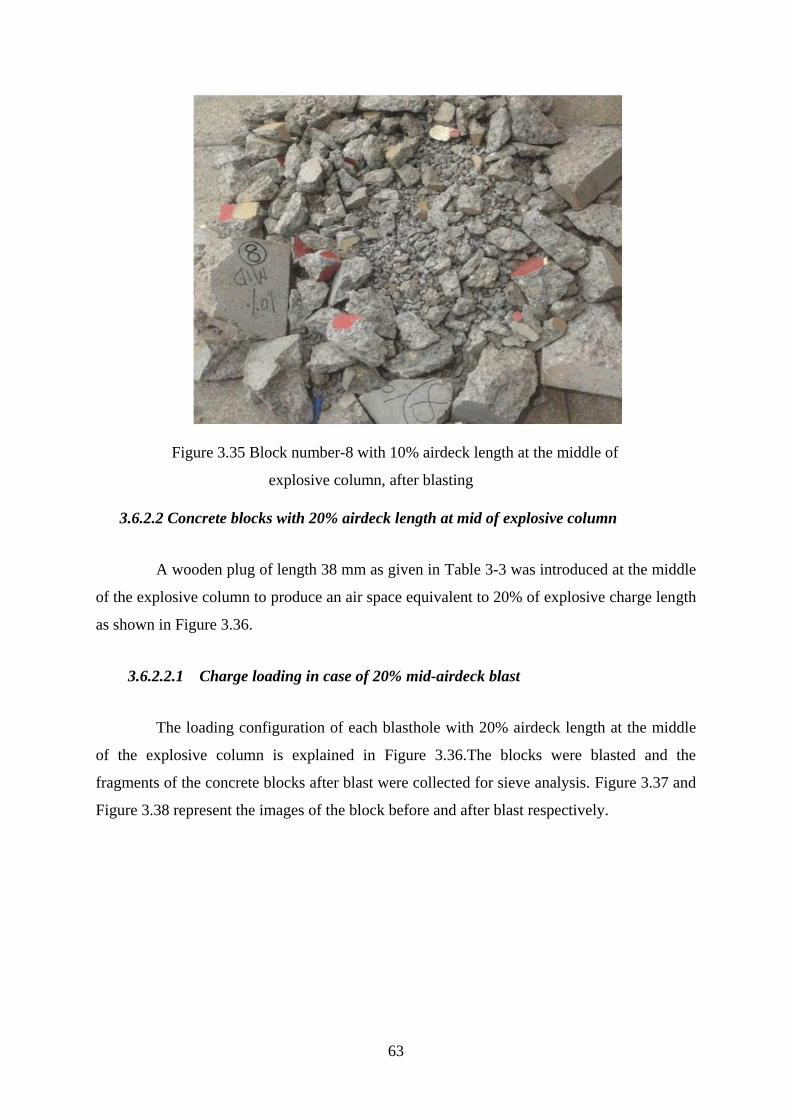
63
Figure 3.35 Block number-8 with 10% airdeck length at the middle of
explosive column, after blasting
3.6.2.2 Concrete blocks with 20% airdeck length at mid of explosive column
A wooden plug of length 38 mm as given in Table 3-3 was introduced at the middle
of the explosive column to produce an air space equivalent to 20% of explosive charge length
as shown in Figure 3.36.
3.6.2.2.1 Charge loading in case of 20% mid-airdeck blast
The loading configuration of each blasthole with 20% airdeck length at the middle
of the explosive column is explained in Figure 3.36.The blocks were blasted and the
fragments of the concrete blocks after blast were collected for sieve analysis. Figure 3.37 and
Figure 3.38 represent the images of the block before and after blast respectively.
64
Figure 3.36 Loading scheme of blasthole with 20% airdeck length at
mid of explosive column
Figure 3.37 Block number-3 with 20% airdeck length at mid of explosive
column, before blasting

65
Figure 3.38 Block number-3 with 20% airdeck length at mid of explosive
column, after blasting
3.6.2.3 Concrete blocks with 30% airdeck length at mid of explosive column
A wooden plug of length 58 mm as given in Table 3-3 was loaded at the mid of the
explosive column to generate an air space equivalent to 30% of explosive charge length as
shown in Figure 3.39.
3.6.2.3.1 Charge loading in case of 30% mid-airdeck blast
Figure 3.39 explains the loading configuration of blasthole with 30% airdeck length
at mid of the explosive column. Blocks were blasted and fragments after blast were collected
for size analysis. Figure 3.40 and Figure 3.41 give the view of the block before and after blast
respectively.

66
Figure 3.39 Loading scheme of blasthole with 30% airdeck length at the
middle of the explosive column
Figure 3.40 Block number-25 with 30% airdeck length at mid of explosive
column, before blasting
67
Figure 3.41 Block number-25 with 30% airdeck length at mid of explosive
column, after blasting
3.6.2.4 Concrete blocks with 40% airdeck length at the middle of the explosive column
In this case, in each blasthole a wooden plug of length 72 mm was introduced in the
blasthole at the mid of the explosive column to create an air space equivalent to 40% of
explosive charge length as shown in Figure 3.42.This airdeck at the mid reduced the
consumption of explosive by 40%.
3.6.2.4.1 Charge loading in case of 40% mid-airdeck blast
Loading scheme of each blasthole with 40% airdeck length at mid of the explosive
column is shown in Figure 3.42. The blocks were blasted in a blast chamber and the
fragmentations of the concrete blocks after blast were collected for sieve analysis Figure 3.43
and Figure 3.44 present the view of the block before and after blast respectively.

68
Figure 3.42 Loading scheme of blasthole with 40% airdeck length at the mid
of explosive column
Figure 3.43 Block number-7 with 20% airdeck length at mid of explosive
column, before blasting
69
Figure 3.44 Block number-7 with 40% airdeck length at mid of explosive
column, after blasting
3.6.2.5 Concrete blocks with 50% airdeck length at mid of explosive column
In this case, a wooden plug of length 96 mm was introduced in each blasthole, at the
middle of the explosive column to create an air space equivalent to 50% of explosive charge
length as shown in Figure 3.45.This airdeck at the middle of the explosive column reduced
the consumption of explosive by 50%.
3.6.2.5.1 Charge loading in case of 50% mid-airdeck blast
Loading scheme of each blasthole with 50% airdeck length at mid of the explosive
column is shown in Figure 3.45. The blocks were blasted in a blast chamber and the
fragmentations of the concrete blocks after blast were collected for sieve analysis Figure
3.46andFigure 3.47 represent the view of the block before and after blast respectively.

70
Figure 3.45 Loading scheme of blasthole with 50% airdeck length at the
middle of the explosive column
Figure 3.46 Block number-10 with 50% airdeck length at mid of explosive
column, before blasting
Figure 3.47 Block number-10 with 50% airdeck length at the middle of
explosive column, after blasting
71
3.6.2.6 Results and discussion
The sieve analysis was performed on each collected fraction. The results of sieve
analysis are shown in Table 3-7. These results suggested that airdeck length equivalent to 20
% of total column charge produced the best fragmentation. Figure 3.48 shows the cumulative
percentage passing plot for the blasted block fragments for all the experiments in this phase.
The mean fragment size for the blasted block was calculated and can be seen in Table 3-8. It
was established that the mean fragment size decreases gradually with the increase in airdeck
size from 0 to 20% and then increases with increasing airdeck size as shown in Figure
3.49.The Figure 3.48 shows that 20% airdeck produces the smallest mean fragment size, and
can play a significant role in the cost saving of subsequent size reduction processes.
Moreover the mean fragment size increases with increasing airdeck size.
Table 3-7 Experimental results with the varying lengths of the airdecks at the
middle position of the explosive column
Fraction
Size
(mm)
Middle Position – Mean Values (Wt, kg)
10%
Airdeck
20 %
Airdeck
30 %
Airdeck
40 %
Airdeck
50 %
Airdeck
+128 23.27 19.29 39.15 45.99 51.80
-128+64 23.37 22.74 25.58 25.81 24.64
-64+32 17.49 21.51 12.16 7.71 5.05
-32+16 10.56 12.23 4.15 2.54 1.78
-16+8 6.37 5.92 2.31 1.44 0.88
-8+4 2.27 1.60 0.70 0.64 0.27
-4+2 0.75 0.70 0.25 0.16 0.12
-2+1 0.46 0.53 0.12 0.07 0.11
Total 84.53 84.52 84.42 84.37 84.63
Table 3-8 Mean fragmentation size for varying length of airdeck at middle position of
explosive column
Fraction
Middle Position
10%
Airdeck
20 %
Airdeck
30 %
Airdeck
40 %
Airdeck
50 %
Airdeck
Mean fragment
Size(mm) 85.7 79.9 117.5 124.1 131.8
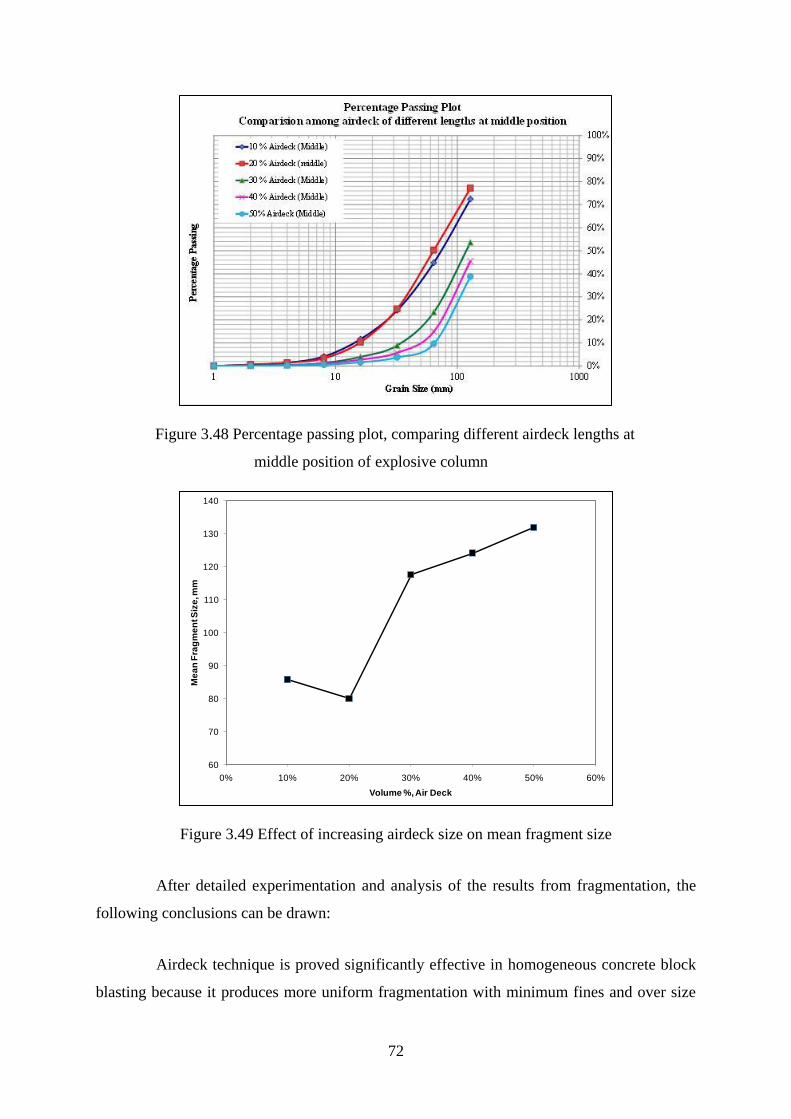
72
Figure 3.48 Percentage passing plot, comparing different airdeck lengths at
middle position of explosive column
Figure 3.49 Effect of increasing airdeck size on mean fragment size
After detailed experimentation and analysis of the results from fragmentation, the
following conclusions can be drawn:
Airdeck technique is proved significantly effective in homogeneous concrete block
blasting because it produces more uniform fragmentation with minimum fines and over size
60
70
80
90
100
110
120
130
140
0% 10% 20% 30% 40% 50% 60%
Me
an
Fra
gm
en
t S
ize
, mm
Volume %, Air Deck
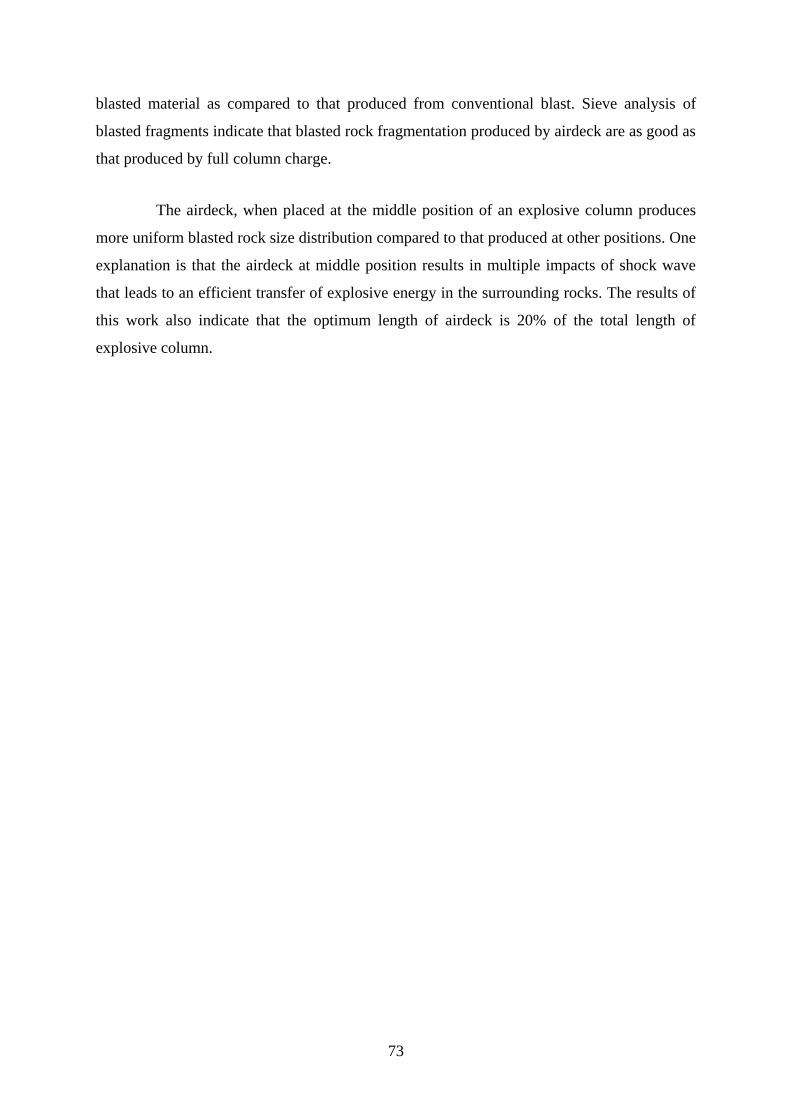
73
blasted material as compared to that produced from conventional blast. Sieve analysis of
blasted fragments indicate that blasted rock fragmentation produced by airdeck are as good as
that produced by full column charge.
The airdeck, when placed at the middle position of an explosive column produces
more uniform blasted rock size distribution compared to that produced at other positions. One
explanation is that the airdeck at middle position results in multiple impacts of shock wave
that leads to an efficient transfer of explosive energy in the surrounding rocks. The results of
this work also indicate that the optimum length of airdeck is 20% of the total length of
explosive column.
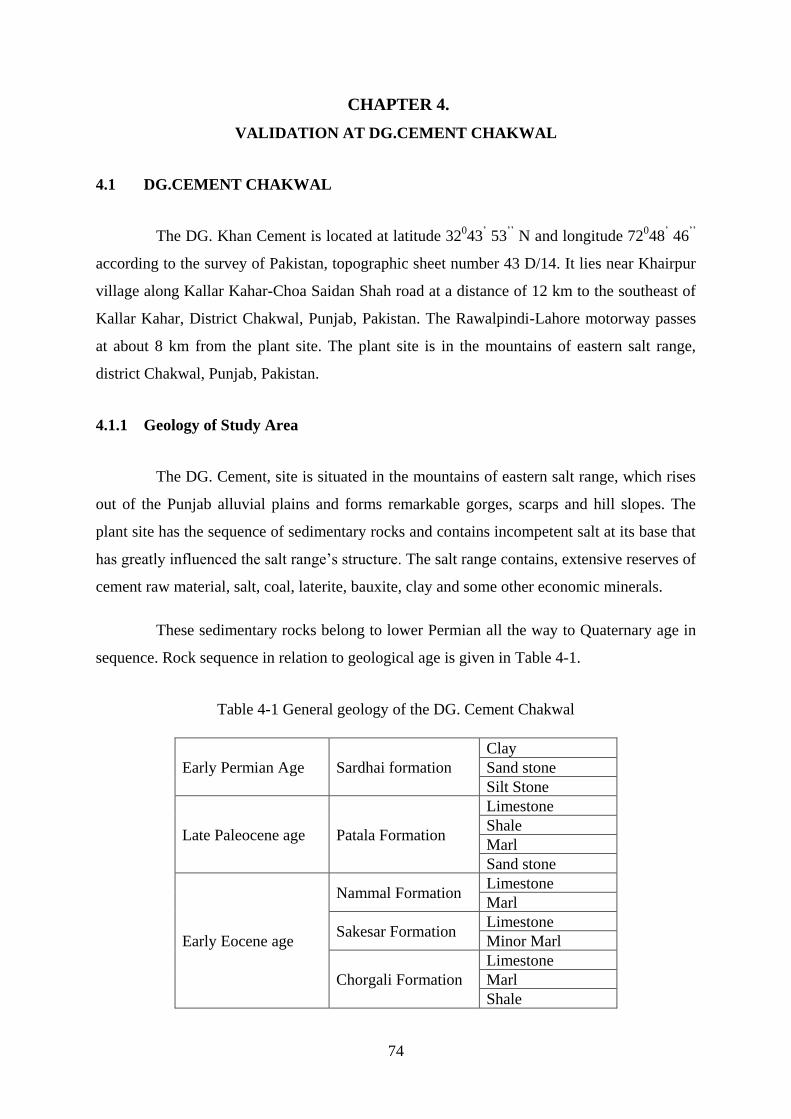
74
CHAPTER 4.
VALIDATION AT DG.CEMENT CHAKWAL
4.1 DG.CEMENT CHAKWAL
The DG. Khan Cement is located at latitude 32043
‘ 53
‘‘ N and longitude 72
048
‘ 46
‘‘
according to the survey of Pakistan, topographic sheet number 43 D/14. It lies near Khairpur
village along Kallar Kahar-Choa Saidan Shah road at a distance of 12 km to the southeast of
Kallar Kahar, District Chakwal, Punjab, Pakistan. The Rawalpindi-Lahore motorway passes
at about 8 km from the plant site. The plant site is in the mountains of eastern salt range,
district Chakwal, Punjab, Pakistan.
4.1.1 Geology of Study Area
The DG. Cement, site is situated in the mountains of eastern salt range, which rises
out of the Punjab alluvial plains and forms remarkable gorges, scarps and hill slopes. The
plant site has the sequence of sedimentary rocks and contains incompetent salt at its base that
has greatly influenced the salt range‘s structure. The salt range contains, extensive reserves of
cement raw material, salt, coal, laterite, bauxite, clay and some other economic minerals.
These sedimentary rocks belong to lower Permian all the way to Quaternary age in
sequence. Rock sequence in relation to geological age is given in Table 4-1.
Table 4-1 General geology of the DG. Cement Chakwal
Early Permian Age Sardhai formation
Clay
Sand stone
Silt Stone
Late Paleocene age Patala Formation
Limestone
Shale
Marl
Sand stone
Early Eocene age
Nammal Formation Limestone
Marl
Sakesar Formation Limestone
Minor Marl
Chorgali Formation
Limestone
Marl
Shale
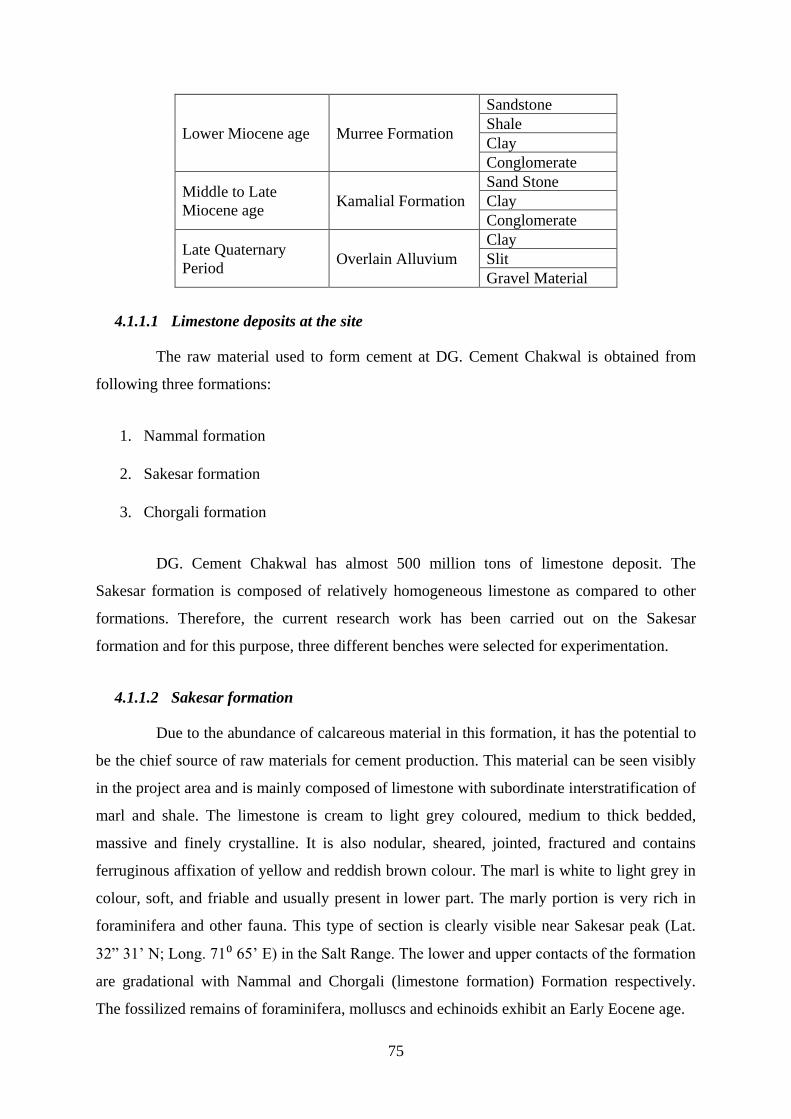
75
Lower Miocene age Murree Formation
Sandstone
Shale
Clay
Conglomerate
Middle to Late
Miocene age Kamalial Formation
Sand Stone
Clay
Conglomerate
Late Quaternary
Period Overlain Alluvium
Clay
Slit
Gravel Material
4.1.1.1 Limestone deposits at the site
The raw material used to form cement at DG. Cement Chakwal is obtained from
following three formations:
1. Nammal formation
2. Sakesar formation
3. Chorgali formation
DG. Cement Chakwal has almost 500 million tons of limestone deposit. The
Sakesar formation is composed of relatively homogeneous limestone as compared to other
formations. Therefore, the current research work has been carried out on the Sakesar
formation and for this purpose, three different benches were selected for experimentation.
4.1.1.2 Sakesar formation
Due to the abundance of calcareous material in this formation, it has the potential to
be the chief source of raw materials for cement production. This material can be seen visibly
in the project area and is mainly composed of limestone with subordinate interstratification of
marl and shale. The limestone is cream to light grey coloured, medium to thick bedded,
massive and finely crystalline. It is also nodular, sheared, jointed, fractured and contains
ferruginous affixation of yellow and reddish brown colour. The marl is white to light grey in
colour, soft, and friable and usually present in lower part. The marly portion is very rich in
foraminifera and other fauna. This type of section is clearly visible near Sakesar peak (Lat.
32‖ 31‘ N; Long. 71⁰ 65‘ E) in the Salt Range. The lower and upper contacts of the formation
are gradational with Nammal and Chorgali (limestone formation) Formation respectively.
The fossilized remains of foraminifera, molluscs and echinoids exhibit an Early Eocene age.
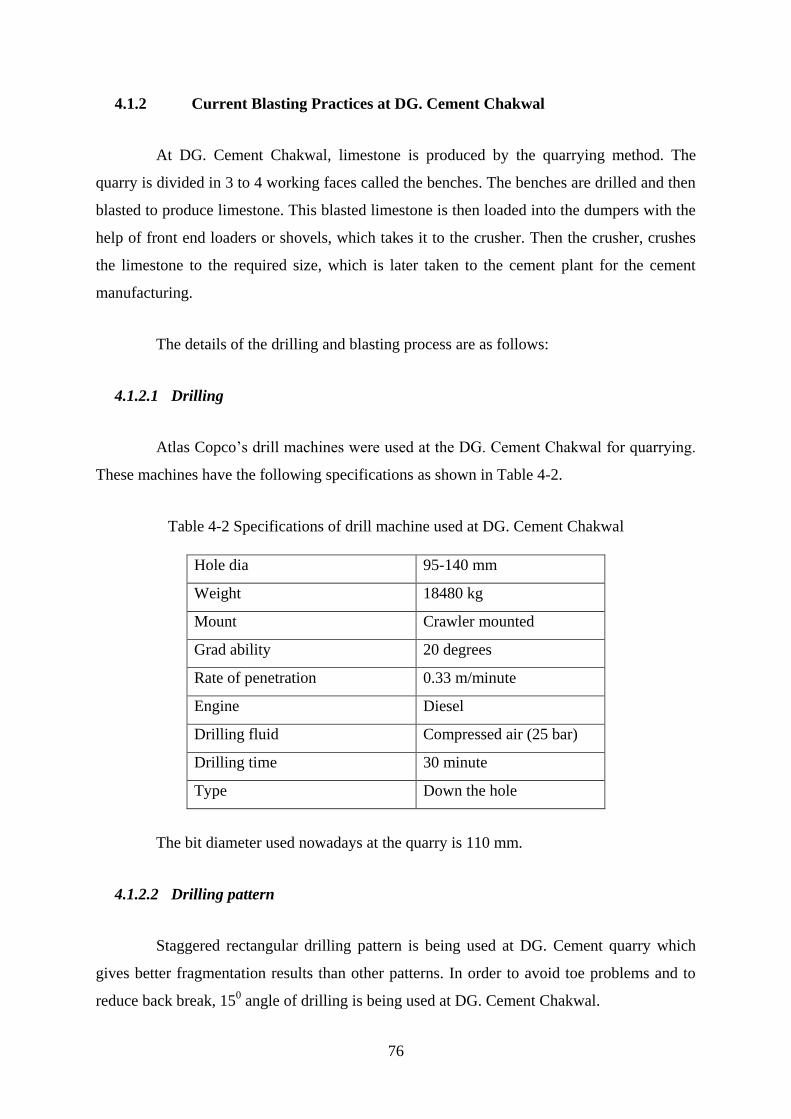
76
4.1.2 Current Blasting Practices at DG. Cement Chakwal
At DG. Cement Chakwal, limestone is produced by the quarrying method. The
quarry is divided in 3 to 4 working faces called the benches. The benches are drilled and then
blasted to produce limestone. This blasted limestone is then loaded into the dumpers with the
help of front end loaders or shovels, which takes it to the crusher. Then the crusher, crushes
the limestone to the required size, which is later taken to the cement plant for the cement
manufacturing.
The details of the drilling and blasting process are as follows:
4.1.2.1 Drilling
Atlas Copco‘s drill machines were used at the DG. Cement Chakwal for quarrying.
These machines have the following specifications as shown in Table 4-2.
Table 4-2 Specifications of drill machine used at DG. Cement Chakwal
Hole dia 95-140 mm
Weight 18480 kg
Mount Crawler mounted
Grad ability 20 degrees
Rate of penetration 0.33 m/minute
Engine Diesel
Drilling fluid Compressed air (25 bar)
Drilling time 30 minute
Type Down the hole
The bit diameter used nowadays at the quarry is 110 mm.
4.1.2.2 Drilling pattern
Staggered rectangular drilling pattern is being used at DG. Cement quarry which
gives better fragmentation results than other patterns. In order to avoid toe problems and to
reduce back break, 150 angle of drilling is being used at DG. Cement Chakwal.

77
4.1.2.3 Blasting
Currently three benches are being used at DG. Cement Chakwal to fulfil the
limestone requirement of the plant.
4.1.2.4 Explosives
The explosives used in the DG. Cement quarry Chakwal are shown in Table 4-3.
Table 4-3 Explosive used at DG. Cement Chakwal
Trade name of explosive Type of explosive Company
Wabox 80% Dynamite Wah Nobel (pvt) ltd
Blaster Watergel BIAFO (pvt) ltd
Emulite Emulsion Wah Nobel (pvt) ltd
Two types of ANFO are prepared on the site:
1. Fertilizer grade
2. Prilled
Fertilizer grade ANFO is prepared by mixing diesel oil and fertilizer grade
ammonium nitrate, while in case of prilled ANFO, diesel oil is mixed with blasting grade
ammonium nitrate prills. Both fertilizer grade and prilled ANFO are mixed before loading
into the blastholes.
4.1.2.5 Initiation system
Bottom priming is used to blast all the holes at DG. Cement Chakwal. For this
purpose both Nonel and detonating cord are being used for down the hole initiation. Only
Nonel is used as trunk line in order to control air blast.
4.1.2.6 Blast design
The blast design parameters used at DG. Cement Chakwal are presented in the
following Table4-4.
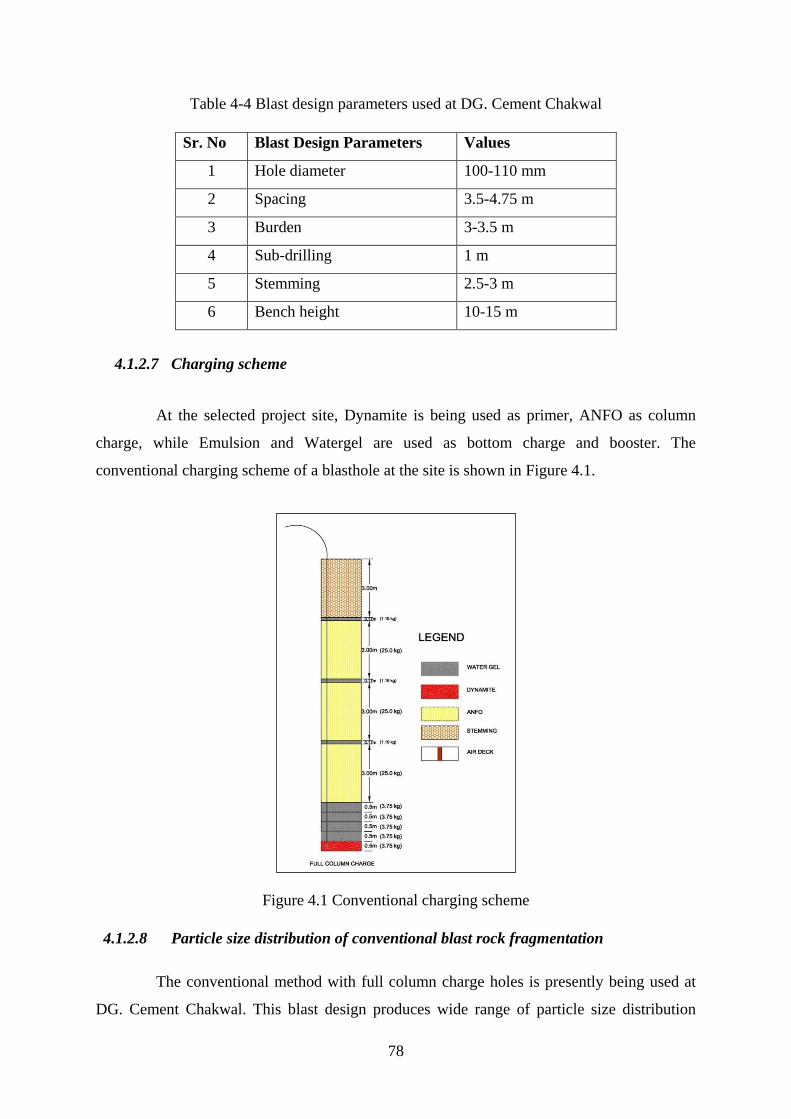
78
Table 4-4 Blast design parameters used at DG. Cement Chakwal
Sr. No Blast Design Parameters Values
1 Hole diameter 100-110 mm
2 Spacing 3.5-4.75 m
3 Burden 3-3.5 m
4 Sub-drilling 1 m
5 Stemming 2.5-3 m
6 Bench height 10-15 m
4.1.2.7 Charging scheme
At the selected project site, Dynamite is being used as primer, ANFO as column
charge, while Emulsion and Watergel are used as bottom charge and booster. The
conventional charging scheme of a blasthole at the site is shown in Figure 4.1.
Figure 4.1 Conventional charging scheme
4.1.2.8 Particle size distribution of conventional blast rock fragmentation
The conventional method with full column charge holes is presently being used at
DG. Cement Chakwal. This blast design produces wide range of particle size distribution
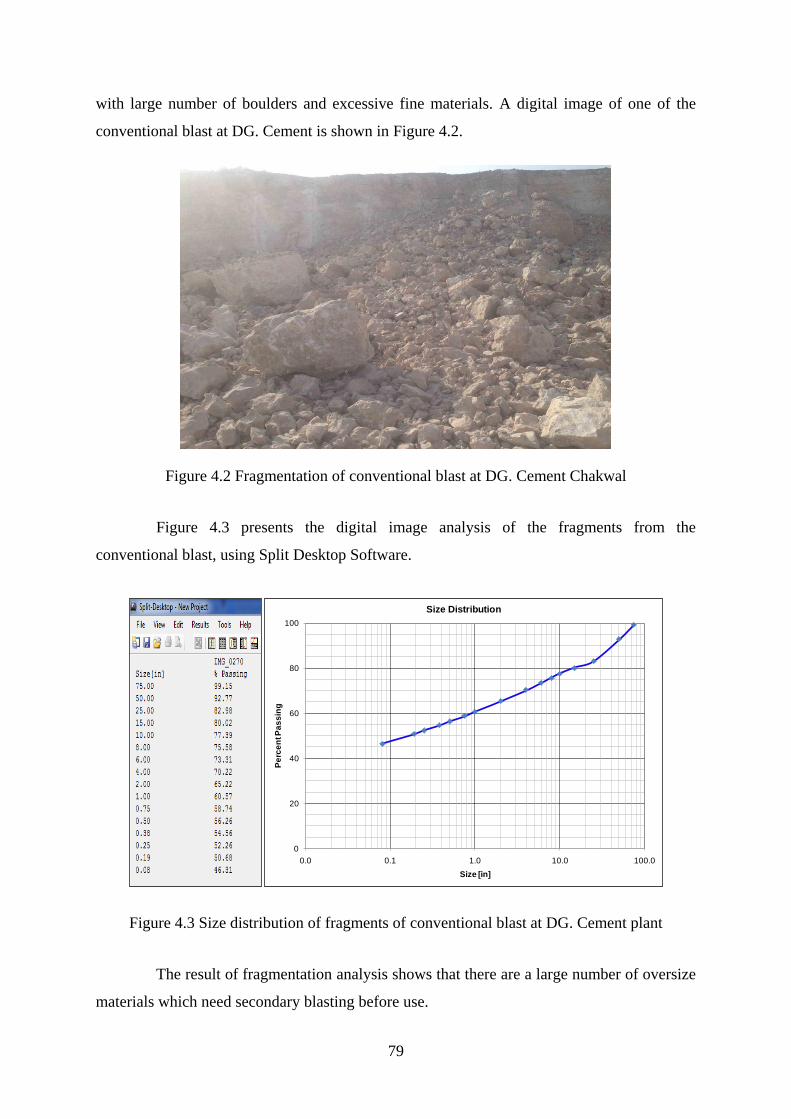
79
with large number of boulders and excessive fine materials. A digital image of one of the
conventional blast at DG. Cement is shown in Figure 4.2.
Figure 4.2 Fragmentation of conventional blast at DG. Cement Chakwal
Figure 4.3 presents the digital image analysis of the fragments from the
conventional blast, using Split Desktop Software.
Figure 4.3 Size distribution of fragments of conventional blast at DG. Cement plant
The result of fragmentation analysis shows that there are a large number of oversize
materials which need secondary blasting before use.
0
20
40
60
80
100
0.0 0.1 1.0 10.0 100.0
Pe
rce
nt P
as
sin
g
Size [in]
Size Distribution
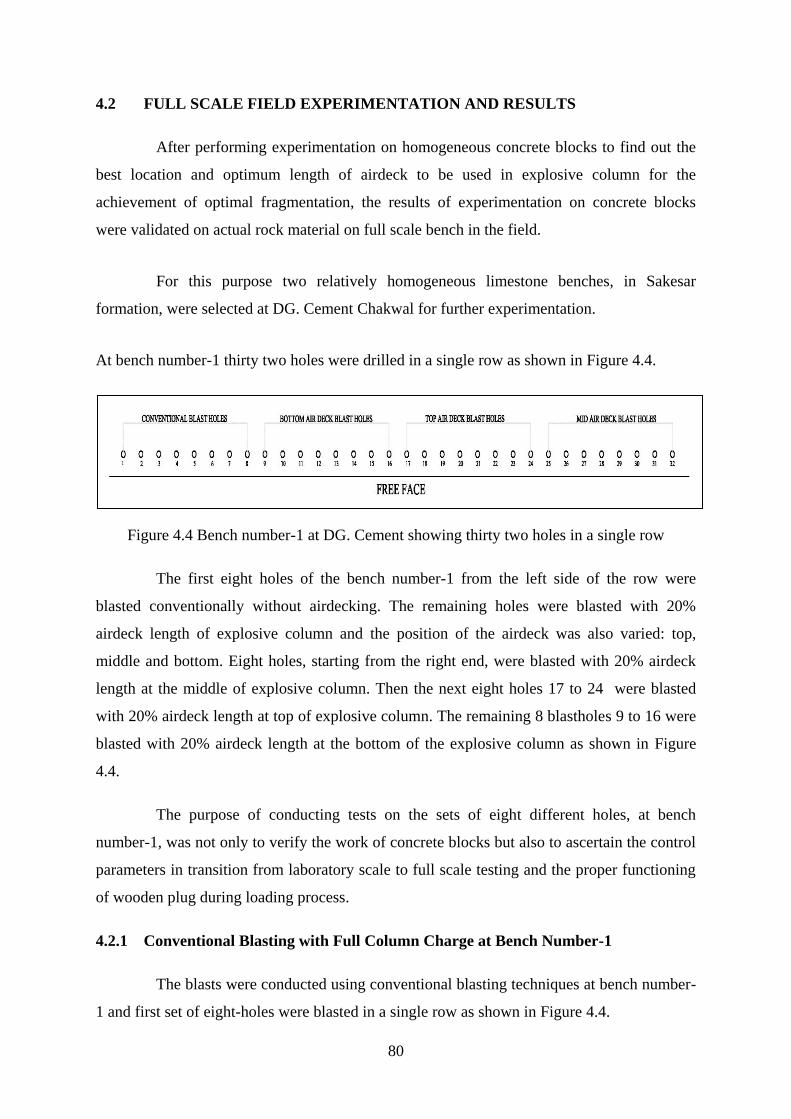
80
4.2 FULL SCALE FIELD EXPERIMENTATION AND RESULTS
After performing experimentation on homogeneous concrete blocks to find out the
best location and optimum length of airdeck to be used in explosive column for the
achievement of optimal fragmentation, the results of experimentation on concrete blocks
were validated on actual rock material on full scale bench in the field.
For this purpose two relatively homogeneous limestone benches, in Sakesar
formation, were selected at DG. Cement Chakwal for further experimentation.
At bench number-1 thirty two holes were drilled in a single row as shown in Figure 4.4.
Figure 4.4 Bench number-1 at DG. Cement showing thirty two holes in a single row
The first eight holes of the bench number-1 from the left side of the row were
blasted conventionally without airdecking. The remaining holes were blasted with 20%
airdeck length of explosive column and the position of the airdeck was also varied: top,
middle and bottom. Eight holes, starting from the right end, were blasted with 20% airdeck
length at the middle of explosive column. Then the next eight holes 17 to 24 were blasted
with 20% airdeck length at top of explosive column. The remaining 8 blastholes 9 to 16 were
blasted with 20% airdeck length at the bottom of the explosive column as shown in Figure
4.4.
The purpose of conducting tests on the sets of eight different holes, at bench
number-1, was not only to verify the work of concrete blocks but also to ascertain the control
parameters in transition from laboratory scale to full scale testing and the proper functioning
of wooden plug during loading process.
4.2.1 Conventional Blasting with Full Column Charge at Bench Number-1
The blasts were conducted using conventional blasting techniques at bench number-
1 and first set of eight-holes were blasted in a single row as shown in Figure 4.4.

81
4.2.1.1 Charge loading
Loading scheme of each blasthole in case of conventional blast with full column
charge was maintained as shown in Figure 4.5. High Explosives, Dynamite and Watergel
(Blaster) were used as bottom charge and blasting grade ANFO was used as column charge in
each blasthole. Charge loading was done by first putting 3.57 kg of Dynamite cartridge
attached to the nonel detonator as primer charge followed by 4 cartridges of watergel
weighing 14.28 kg to make a bottom charge. The diameter, length and weight of each
explosive cartridge was 100 mm, 0.5 m and 3.57 kg respectively. The bottom charge was
then followed by the column charge of 75 kg ANFO. One cartridge of Watergel, cut in 3
equal parts, was used as a booster in the column charge, as shown in Figure 4.5. For
stemming drill cuttings were used and a length of 3 m was maintained in all blastholes.
Progressive firing pattern was used and a time delay of 25 ms was maintained after each hole
was blasted. Nonel detonators were used for this purpose. All holes were connected by
instantaneous nonel detonators which in turn were connected to the plain detonator. The plain
detonator was crimped to a safety fuse as shown in Figure 4.7.
4.2.1.2 Conventional blast design parameters at bench number-1
The details of conventional blast design parameters are presented in Table 4-5.
Table 4-5 Conventional blast design parameters at bench number-1
S.No Blast Design Parameters Values
1 Hole diameter 110 mm
2 Spacing 4.75 m
3 Burden 3.5 m
4 Sub-drilling 1 m
5 Stemming 3 m
6 High Explosive (1 Dynamite + 4 Watergel
cartridges)
(3.57 + 14.28) = 17.85 kg
7 Booster (1 Watergel cartridge cut into 3 pieces) 3.57 kg
8 ANFO 75 kg
9 No. of holes 08
10 No. of rows 01
11 Depth of hole 15 m
12 Bench height 14 m
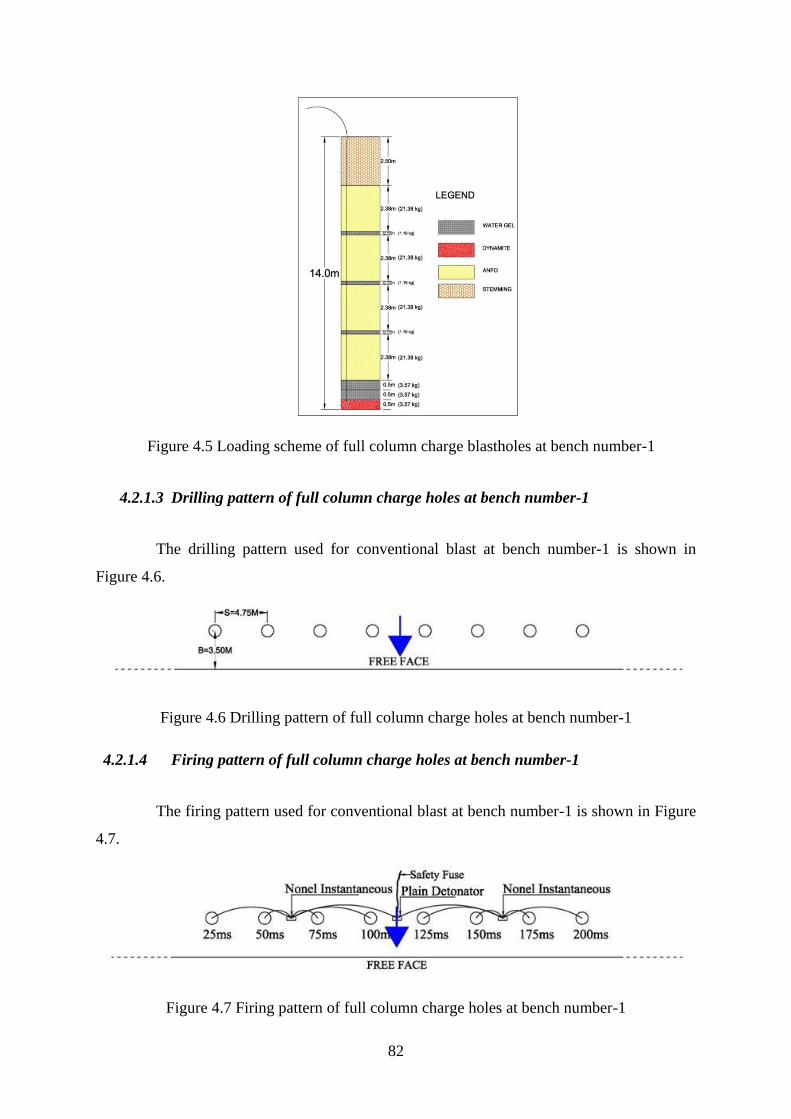
82
Figure 4.5 Loading scheme of full column charge blastholes at bench number-1
4.2.1.3 Drilling pattern of full column charge holes at bench number-1
The drilling pattern used for conventional blast at bench number-1 is shown in
Figure 4.6.
Figure 4.6 Drilling pattern of full column charge holes at bench number-1
4.2.1.4 Firing pattern of full column charge holes at bench number-1
The firing pattern used for conventional blast at bench number-1 is shown in Figure
4.7.
Figure 4.7 Firing pattern of full column charge holes at bench number-1

83
A front and plan view of bench number-1 before blast is given in Figure 4.8 and
Figure 4.9 respectively.
Figure 4.8 Front view of bench -1 before blast Figure 4.9 Plan view of bench-1 before blast showing 32
drill holes in a single row
Figure 4.10 to Figure 4.13 are showing different steps involved in preparing the
bench number-1 for blast.
Figure 4.10 Measuring the burden distance at bench-1 Figure 4.11 Measuring the length of Watergel cartridge
at bench -1
Figure 4.12 Loading of dynamite cartridge at bench-1 Figure 4.13 Loading of ANFO at bench -1

84
Digital image of fragmentation after conventional blast (first eight holes) at bench
number-1 as shown in Figure 4.14 was taken for analysis by the digital fragmentation
analysis software.
Figure 4.14 Fragmentation of full column charge holes after blast at bench
number-1
4.2.2 Assessment of Blast Performance by Split Desktop
Several images were taken from appropriate distance of blasted muckpile in a
proper light environment with a canon digital camera having a resolution of 3456 pixels. The
images were cropped before being used in the software in order to remove all unwanted
background information such as ground, sky etc. The images were then scaled and delineated
by the image analysis software.
4.1.2.1 Introduction of software
Split-Desktop is a software that uses the digital image analysis technique to
determine the size distribution of fragments. Split-Desktop refers to the "user-assisted"
version of the Split rock fragmentation measurement software. Digital images acquired in the
field can be analyzed on a laptop in the field or in the office to determine the size distribution
of fragmented rock after blast at any stage in the comminution process.
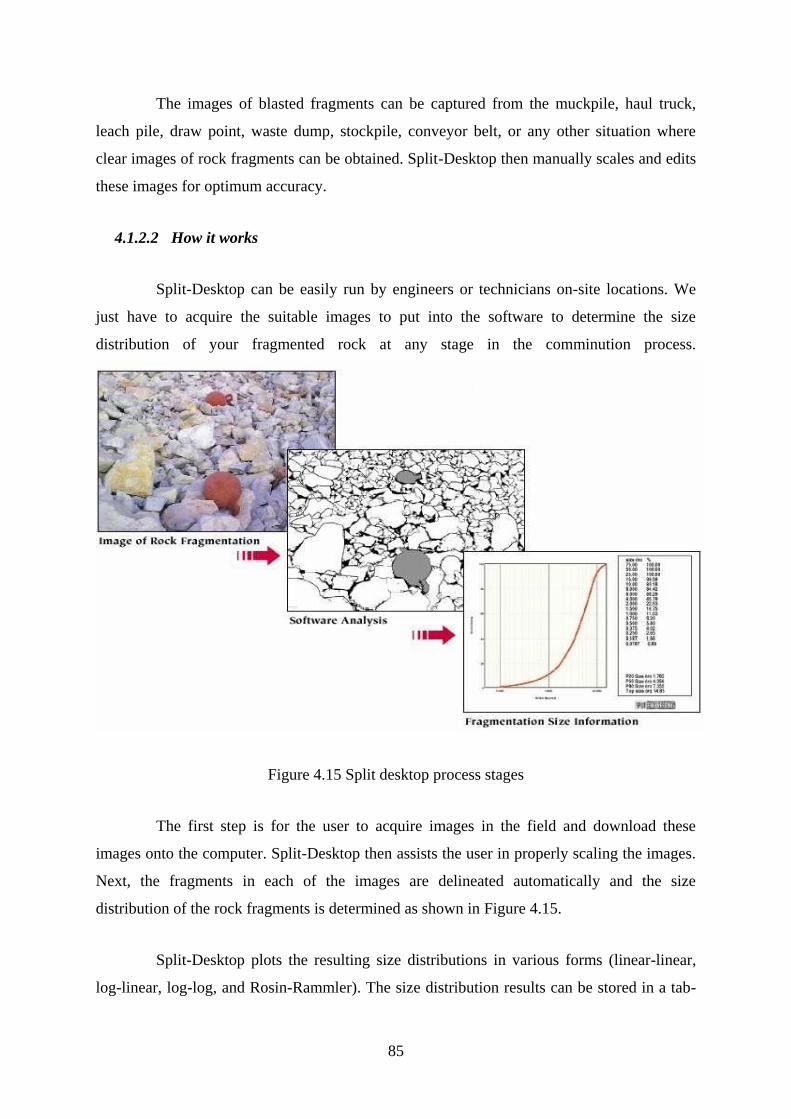
85
The images of blasted fragments can be captured from the muckpile, haul truck,
leach pile, draw point, waste dump, stockpile, conveyor belt, or any other situation where
clear images of rock fragments can be obtained. Split-Desktop then manually scales and edits
these images for optimum accuracy.
4.1.2.2 How it works
Split-Desktop can be easily run by engineers or technicians on-site locations. We
just have to acquire the suitable images to put into the software to determine the size
distribution of your fragmented rock at any stage in the comminution process.
Figure 4.15 Split desktop process stages
The first step is for the user to acquire images in the field and download these
images onto the computer. Split-Desktop then assists the user in properly scaling the images.
Next, the fragments in each of the images are delineated automatically and the size
distribution of the rock fragments is determined as shown in Figure 4.15.
Split-Desktop plots the resulting size distributions in various forms (linear-linear,
log-linear, log-log, and Rosin-Rammler). The size distribution results can be stored in a tab-
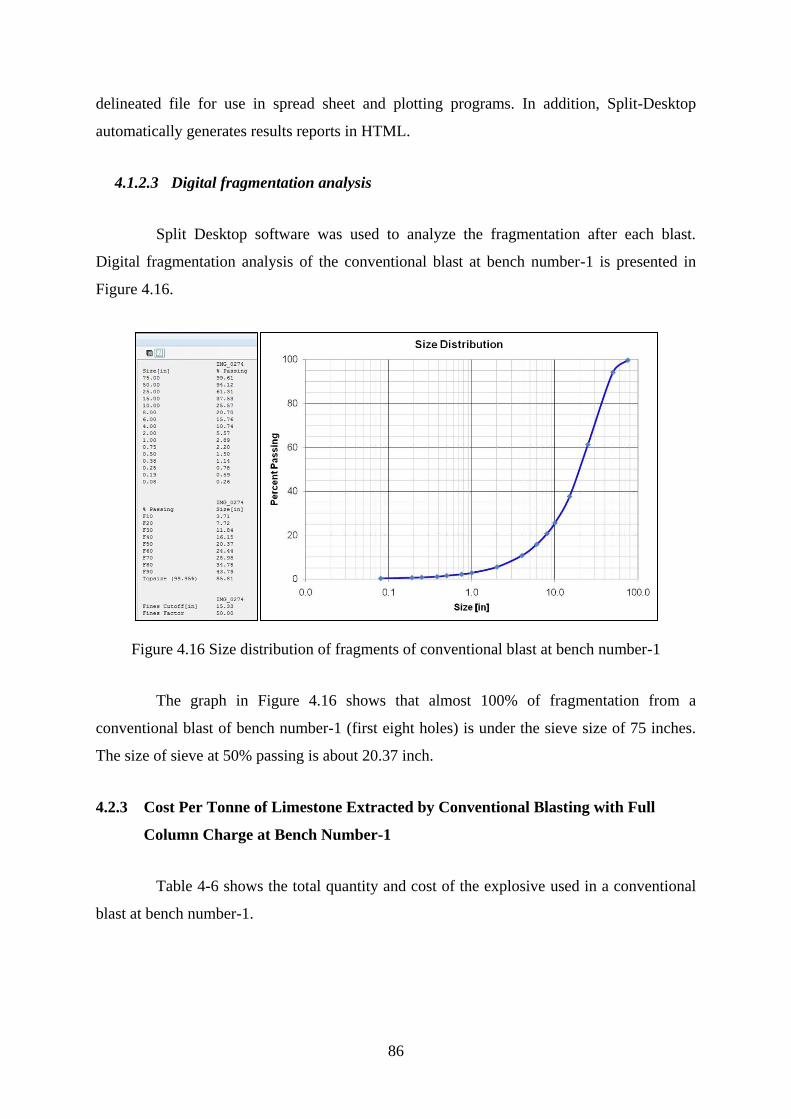
86
delineated file for use in spread sheet and plotting programs. In addition, Split-Desktop
automatically generates results reports in HTML.
4.1.2.3 Digital fragmentation analysis
Split Desktop software was used to analyze the fragmentation after each blast.
Digital fragmentation analysis of the conventional blast at bench number-1 is presented in
Figure 4.16.
Figure 4.16 Size distribution of fragments of conventional blast at bench number-1
The graph in Figure 4.16 shows that almost 100% of fragmentation from a
conventional blast of bench number-1 (first eight holes) is under the sieve size of 75 inches.
The size of sieve at 50% passing is about 20.37 inch.
4.2.3 Cost Per Tonne of Limestone Extracted by Conventional Blasting with Full
Column Charge at Bench Number-1
Table 4-6 shows the total quantity and cost of the explosive used in a conventional
blast at bench number-1.
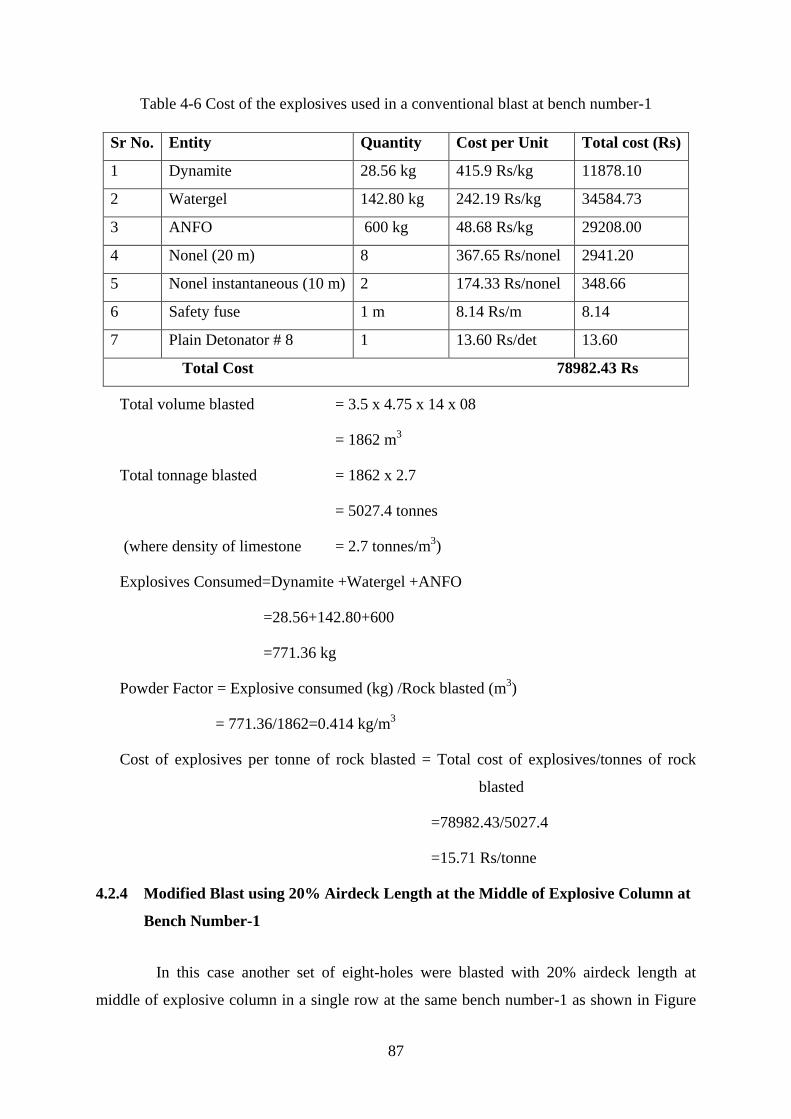
87
Table 4-6 Cost of the explosives used in a conventional blast at bench number-1
Sr No. Entity Quantity Cost per Unit Total cost (Rs)
1 Dynamite 28.56 kg 415.9 Rs/kg 11878.10
2 Watergel 142.80 kg 242.19 Rs/kg 34584.73
3 ANFO 600 kg 48.68 Rs/kg 29208.00
4 Nonel (20 m) 8 367.65 Rs/nonel 2941.20
5 Nonel instantaneous (10 m) 2 174.33 Rs/nonel 348.66
6 Safety fuse 1 m 8.14 Rs/m 8.14
7 Plain Detonator # 8 1 13.60 Rs/det 13.60
Total Cost 78982.43 Rs
Total volume blasted = 3.5 x 4.75 x 14 x 08
= 1862 m3
Total tonnage blasted = 1862 x 2.7
= 5027.4 tonnes
(where density of limestone = 2.7 tonnes/m3)
Explosives Consumed=Dynamite +Watergel +ANFO
=28.56+142.80+600
=771.36 kg
Powder Factor = Explosive consumed (kg) /Rock blasted (m3)
= 771.36/1862=0.414 kg/m3
Cost of explosives per tonne of rock blasted = Total cost of explosives/tonnes of rock
blasted
=78982.43/5027.4
=15.71 Rs/tonne
4.2.4 Modified Blast using 20% Airdeck Length at the Middle of Explosive Column at
Bench Number-1
In this case another set of eight-holes were blasted with 20% airdeck length at
middle of explosive column in a single row at the same bench number-1 as shown in Figure

88
4.4. Same blast parameters were maintained as that used in conventional blast at bench
number-1, other than introducing a wooden plug or a spacer in the middle of the explosive
column to create an air space equivalent to 20% of explosive charge length. This airdeck at
the middle of the explosive column reduced the quantity of explosive by 20% as compared to
conventional blast with continuous charge and was supposed to enhance the effect of the
explosive on the rock. The wooden plug used in the experimentation is shown in the Figure
4.17. Top and bottom priming was used due to mid-airdeck.
Initially self-inflating gas bags were considered for the experiments, as these bags
provide proper airdecking in the explosive column. However, these bags are not
manufactured in Pakistan and had to be procured from another country. Thus it was decided
to make use of a wooden plug keeping in view the equally good alternate, the convenience
and the rationalization of budget.
Figure 4.17 Wooden plug used to give airdeck
4.2.4.1 Charge loading
The loading scheme of each blasthole in case of 20% mid-airdeck blast at bench
number-1 was maintained as shown in Figure 4.18.
Charge loading was done by first putting 3.57 kg of Watergel cartridge in the
blasthole, attached to the nonel detonator as primer charge, it is shown in Figure 4.18.
Followed by one cartridge of Watergel weighing 3.57 kg and half cartridge of Dynamite
100 mm
2400 mm
19mm
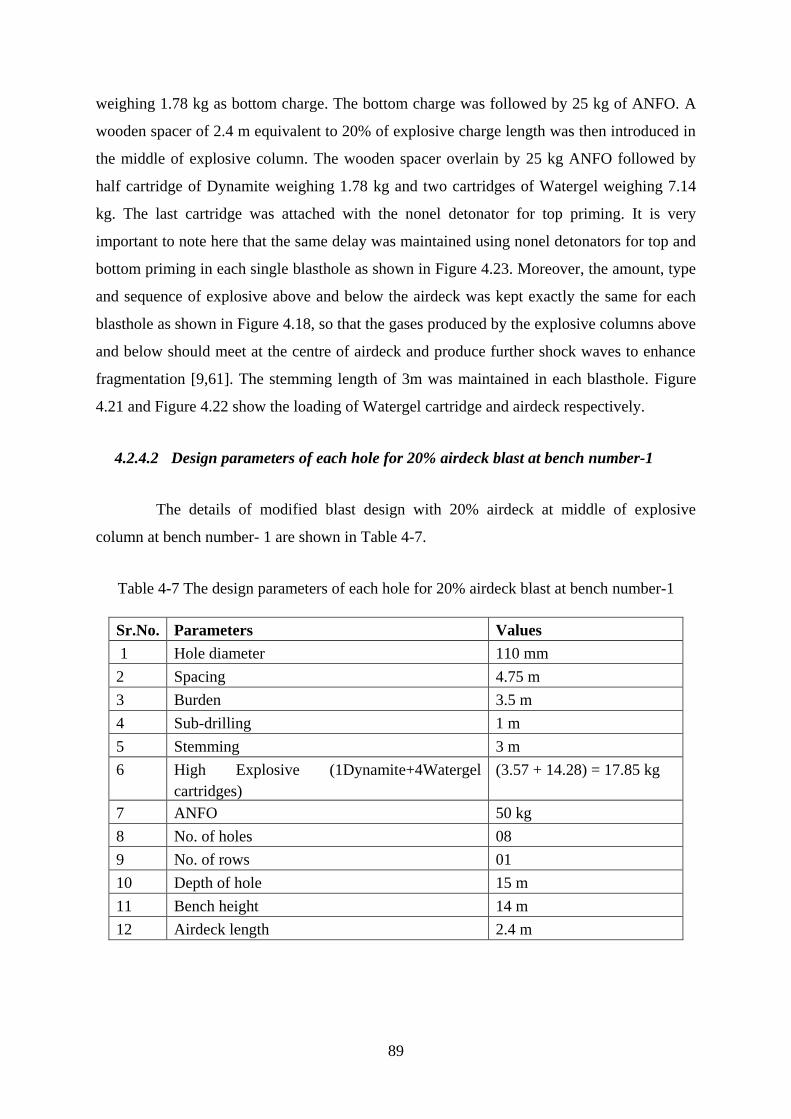
89
weighing 1.78 kg as bottom charge. The bottom charge was followed by 25 kg of ANFO. A
wooden spacer of 2.4 m equivalent to 20% of explosive charge length was then introduced in
the middle of explosive column. The wooden spacer overlain by 25 kg ANFO followed by
half cartridge of Dynamite weighing 1.78 kg and two cartridges of Watergel weighing 7.14
kg. The last cartridge was attached with the nonel detonator for top priming. It is very
important to note here that the same delay was maintained using nonel detonators for top and
bottom priming in each single blasthole as shown in Figure 4.23. Moreover, the amount, type
and sequence of explosive above and below the airdeck was kept exactly the same for each
blasthole as shown in Figure 4.18, so that the gases produced by the explosive columns above
and below should meet at the centre of airdeck and produce further shock waves to enhance
fragmentation [9,61]. The stemming length of 3m was maintained in each blasthole. Figure
4.21 and Figure 4.22 show the loading of Watergel cartridge and airdeck respectively.
4.2.4.2 Design parameters of each hole for 20% airdeck blast at bench number-1
The details of modified blast design with 20% airdeck at middle of explosive
column at bench number- 1 are shown in Table 4-7.
Table 4-7 The design parameters of each hole for 20% airdeck blast at bench number-1
Sr.No. Parameters Values
1 Hole diameter 110 mm
2 Spacing 4.75 m
3 Burden 3.5 m
4 Sub-drilling 1 m
5 Stemming 3 m
6 High Explosive (1Dynamite+4Watergel
cartridges)
(3.57 + 14.28) = 17.85 kg
7 ANFO 50 kg
8 No. of holes 08
9 No. of rows 01
10 Depth of hole 15 m
11 Bench height 14 m
12 Airdeck length 2.4 m
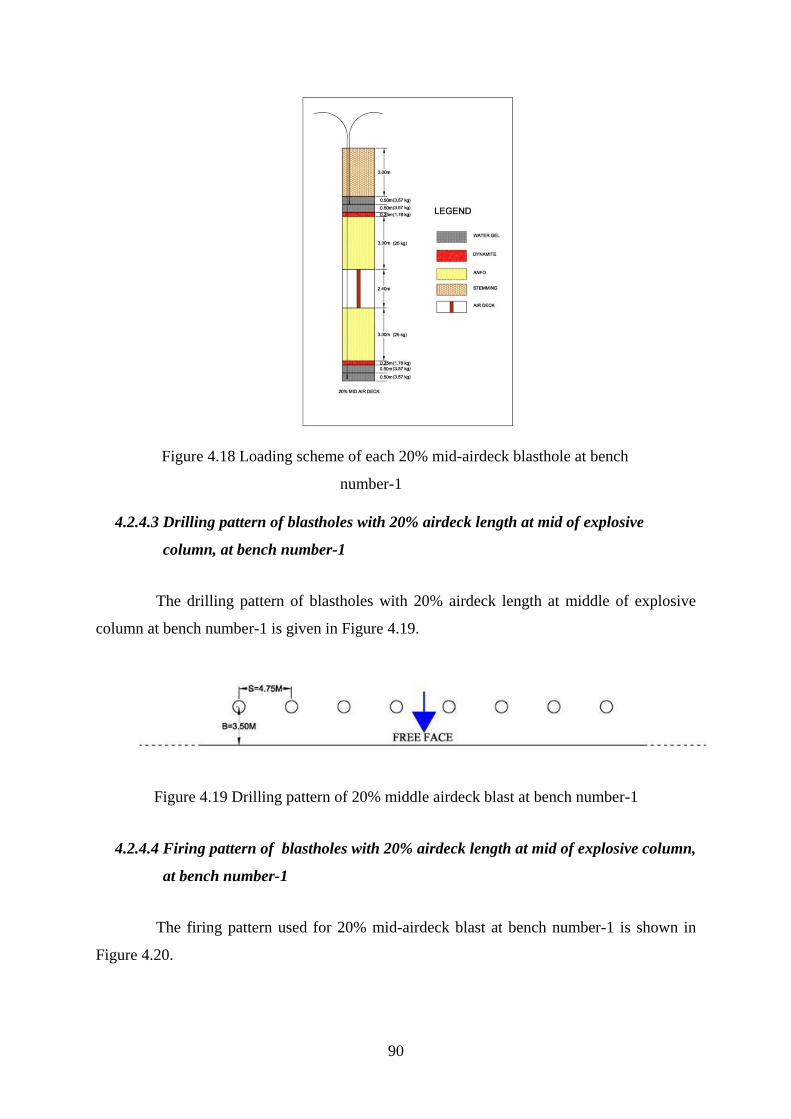
90
Figure 4.18 Loading scheme of each 20% mid-airdeck blasthole at bench
number-1
4.2.4.3 Drilling pattern of blastholes with 20% airdeck length at mid of explosive
column, at bench number-1
The drilling pattern of blastholes with 20% airdeck length at middle of explosive
column at bench number-1 is given in Figure 4.19.
Figure 4.19 Drilling pattern of 20% middle airdeck blast at bench number-1
4.2.4.4 Firing pattern of blastholes with 20% airdeck length at mid of explosive column,
at bench number-1
The firing pattern used for 20% mid-airdeck blast at bench number-1 is shown in
Figure 4.20.

91
Figure 4.20 Firing pattern of 20% middle airdeck blast at bench number-1
Figure 4.21 Loading of Watergel cartridge as a primer in case of mid-airdeck
blast
Figure 4.22 Loading of wooden plug as an airdeck in the blasthole
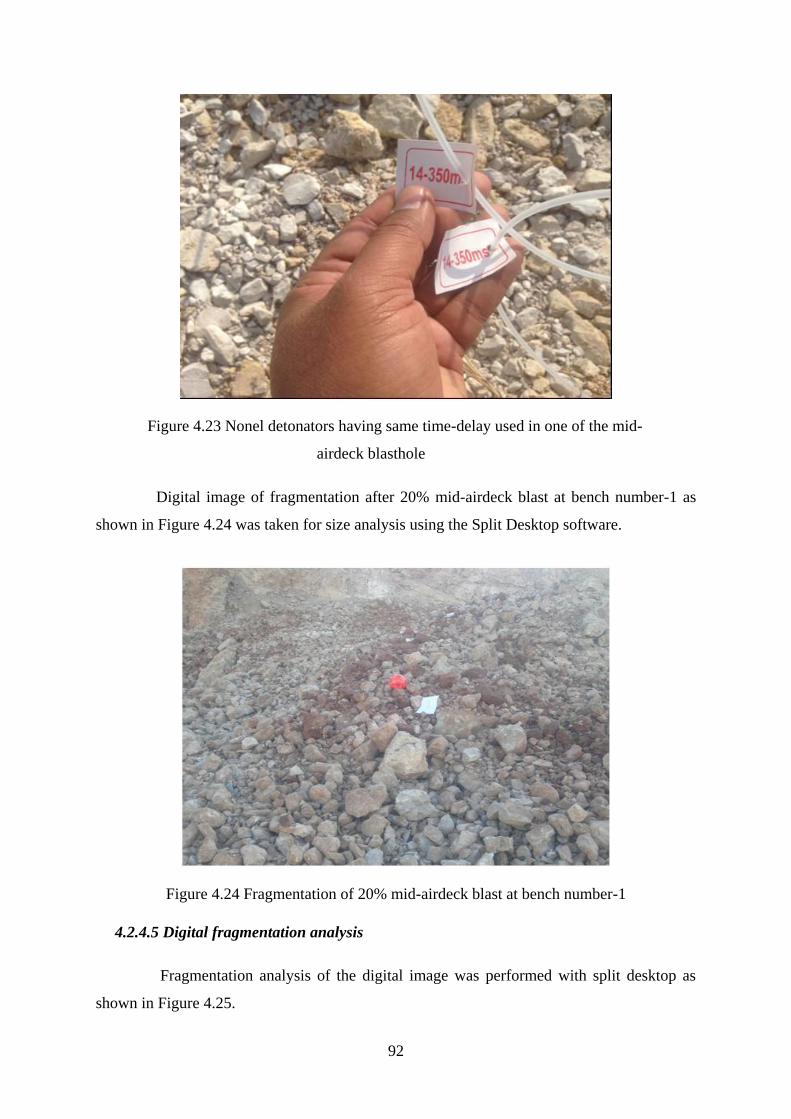
92
Figure 4.23 Nonel detonators having same time-delay used in one of the mid-
airdeck blasthole
Digital image of fragmentation after 20% mid-airdeck blast at bench number-1 as
shown in Figure 4.24 was taken for size analysis using the Split Desktop software.
Figure 4.24 Fragmentation of 20% mid-airdeck blast at bench number-1
4.2.4.5 Digital fragmentation analysis
Fragmentation analysis of the digital image was performed with split desktop as
shown in Figure 4.25.
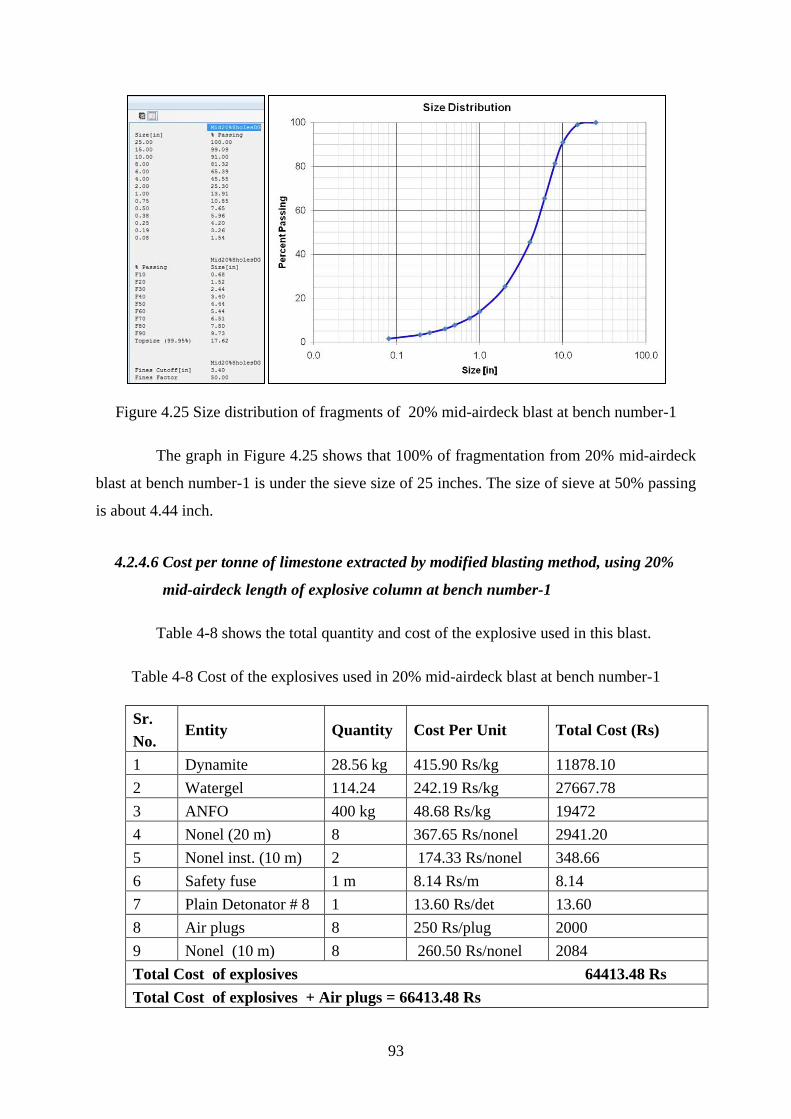
93
Figure 4.25 Size distribution of fragments of 20% mid-airdeck blast at bench number-1
The graph in Figure 4.25 shows that 100% of fragmentation from 20% mid-airdeck
blast at bench number-1 is under the sieve size of 25 inches. The size of sieve at 50% passing
is about 4.44 inch.
4.2.4.6 Cost per tonne of limestone extracted by modified blasting method, using 20%
mid-airdeck length of explosive column at bench number-1
Table 4-8 shows the total quantity and cost of the explosive used in this blast.
Table 4-8 Cost of the explosives used in 20% mid-airdeck blast at bench number-1
Sr.
No. Entity Quantity Cost Per Unit Total Cost (Rs)
1 Dynamite 28.56 kg 415.90 Rs/kg 11878.10
2 Watergel 114.24 242.19 Rs/kg 27667.78
3 ANFO 400 kg 48.68 Rs/kg 19472
4 Nonel (20 m) 8 367.65 Rs/nonel 2941.20
5 Nonel inst. (10 m) 2 174.33 Rs/nonel 348.66
6 Safety fuse 1 m 8.14 Rs/m 8.14
7 Plain Detonator # 8 1 13.60 Rs/det 13.60
8 Air plugs 8 250 Rs/plug 2000
9 Nonel (10 m) 8 260.50 Rs/nonel 2084
Total Cost of explosives 64413.48 Rs
Total Cost of explosives + Air plugs = 66413.48 Rs
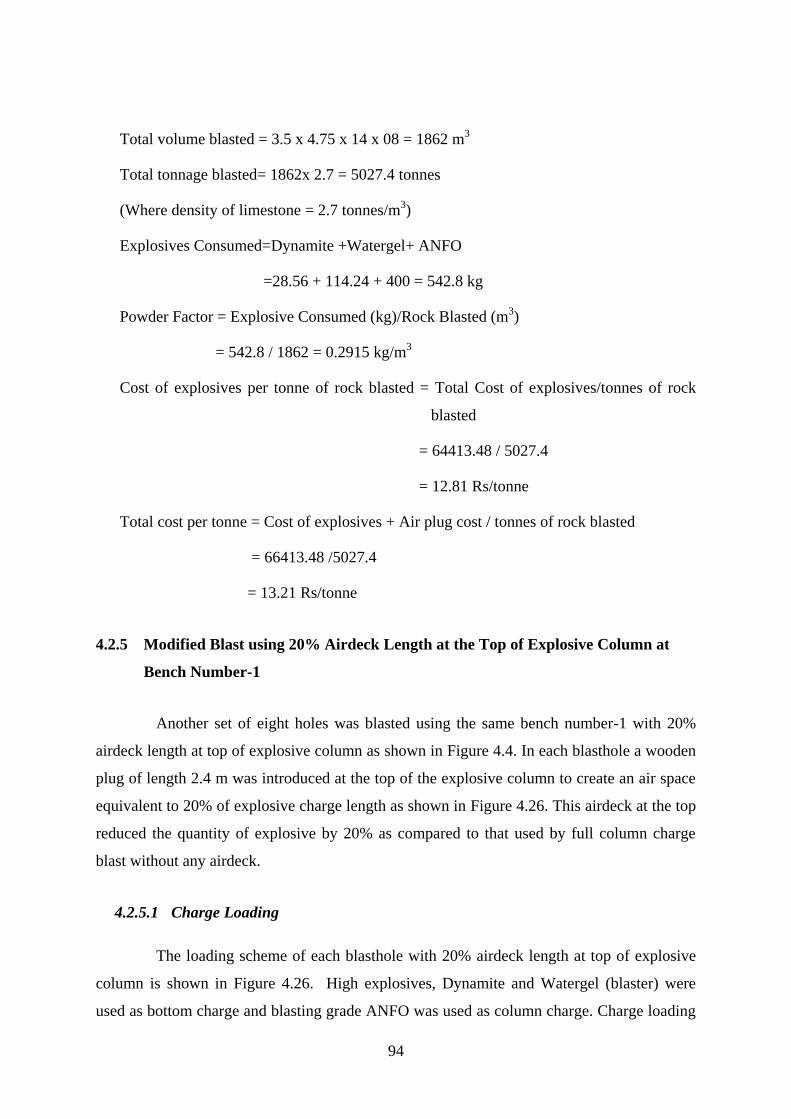
94
Total volume blasted = 3.5 x 4.75 x 14 x 08 = 1862 m3
Total tonnage blasted= 1862x 2.7 = 5027.4 tonnes
(Where density of limestone = 2.7 tonnes/m3)
Explosives Consumed=Dynamite +Watergel+ ANFO
=28.56 + 114.24 + 400 = 542.8 kg
Powder Factor = Explosive Consumed (kg)/Rock Blasted (m3)
= 542.8 / 1862 = 0.2915 kg/m3
Cost of explosives per tonne of rock blasted = Total Cost of explosives/tonnes of rock
blasted
= 64413.48 / 5027.4
= 12.81 Rs/tonne
Total cost per tonne = Cost of explosives + Air plug cost / tonnes of rock blasted
= 66413.48 /5027.4
= 13.21 Rs/tonne
4.2.5 Modified Blast using 20% Airdeck Length at the Top of Explosive Column at
Bench Number-1
Another set of eight holes was blasted using the same bench number-1 with 20%
airdeck length at top of explosive column as shown in Figure 4.4. In each blasthole a wooden
plug of length 2.4 m was introduced at the top of the explosive column to create an air space
equivalent to 20% of explosive charge length as shown in Figure 4.26. This airdeck at the top
reduced the quantity of explosive by 20% as compared to that used by full column charge
blast without any airdeck.
4.2.5.1 Charge Loading
The loading scheme of each blasthole with 20% airdeck length at top of explosive
column is shown in Figure 4.26. High explosives, Dynamite and Watergel (blaster) were
used as bottom charge and blasting grade ANFO was used as column charge. Charge loading
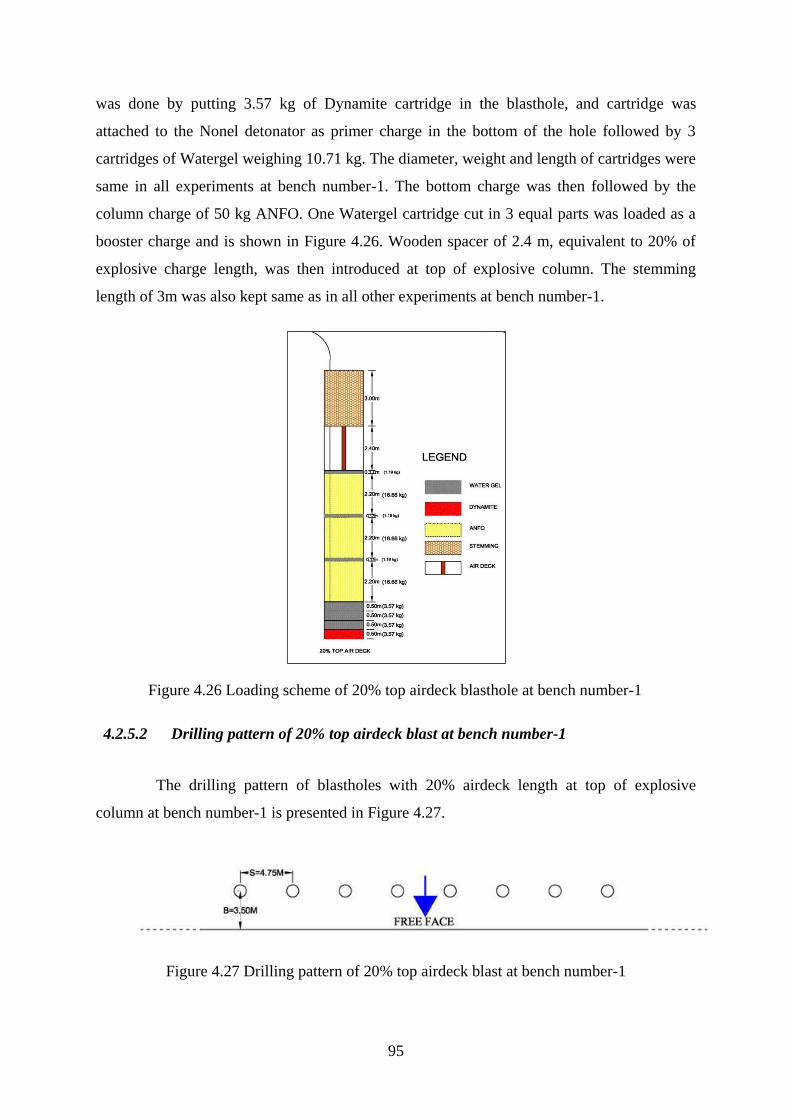
95
was done by putting 3.57 kg of Dynamite cartridge in the blasthole, and cartridge was
attached to the Nonel detonator as primer charge in the bottom of the hole followed by 3
cartridges of Watergel weighing 10.71 kg. The diameter, weight and length of cartridges were
same in all experiments at bench number-1. The bottom charge was then followed by the
column charge of 50 kg ANFO. One Watergel cartridge cut in 3 equal parts was loaded as a
booster charge and is shown in Figure 4.26. Wooden spacer of 2.4 m, equivalent to 20% of
explosive charge length, was then introduced at top of explosive column. The stemming
length of 3m was also kept same as in all other experiments at bench number-1.
Figure 4.26 Loading scheme of 20% top airdeck blasthole at bench number-1
4.2.5.2 Drilling pattern of 20% top airdeck blast at bench number-1
The drilling pattern of blastholes with 20% airdeck length at top of explosive
column at bench number-1 is presented in Figure 4.27.
Figure 4.27 Drilling pattern of 20% top airdeck blast at bench number-1
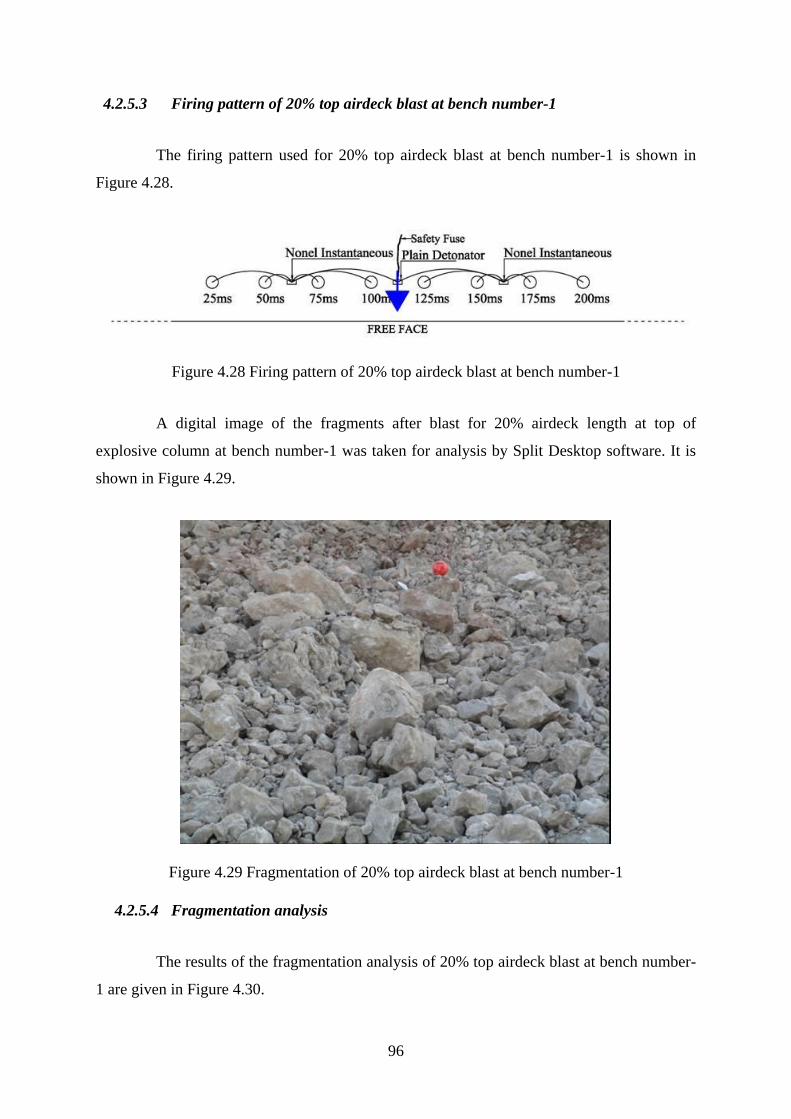
96
4.2.5.3 Firing pattern of 20% top airdeck blast at bench number-1
The firing pattern used for 20% top airdeck blast at bench number-1 is shown in
Figure 4.28.
Figure 4.28 Firing pattern of 20% top airdeck blast at bench number-1
A digital image of the fragments after blast for 20% airdeck length at top of
explosive column at bench number-1 was taken for analysis by Split Desktop software. It is
shown in Figure 4.29.
Figure 4.29 Fragmentation of 20% top airdeck blast at bench number-1
4.2.5.4 Fragmentation analysis
The results of the fragmentation analysis of 20% top airdeck blast at bench number-
1 are given in Figure 4.30.
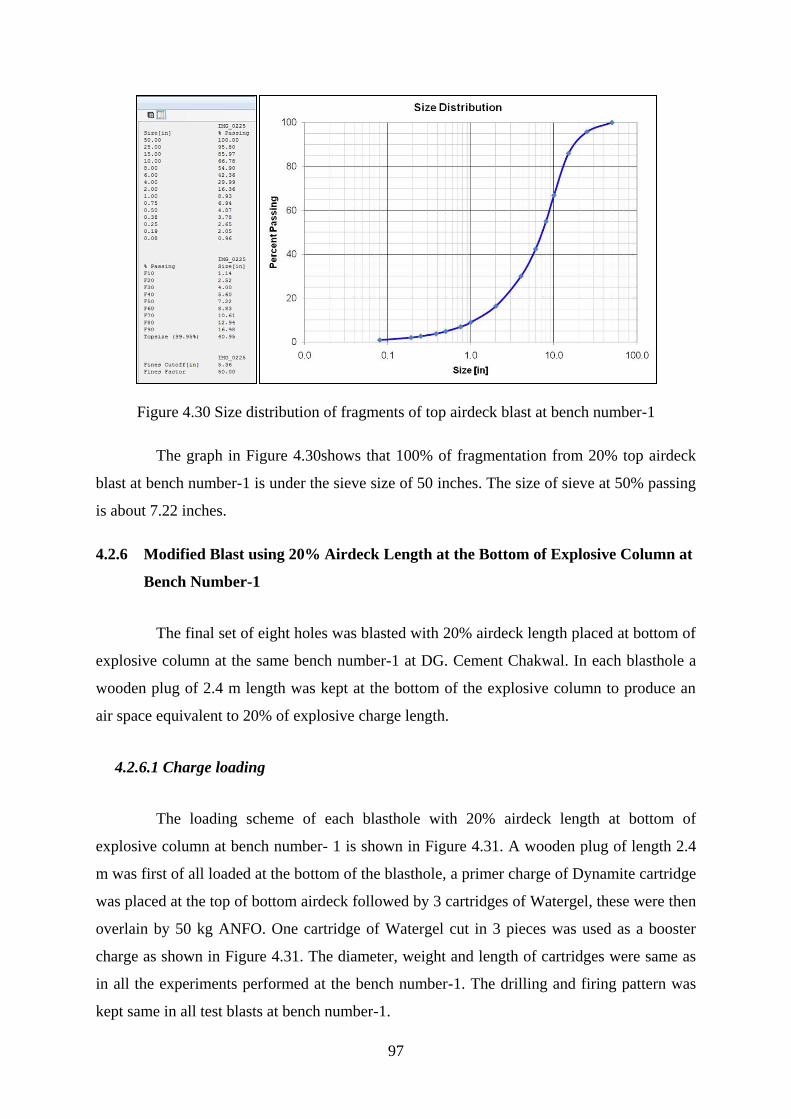
97
Figure 4.30 Size distribution of fragments of top airdeck blast at bench number-1
The graph in Figure 4.30shows that 100% of fragmentation from 20% top airdeck
blast at bench number-1 is under the sieve size of 50 inches. The size of sieve at 50% passing
is about 7.22 inches.
4.2.6 Modified Blast using 20% Airdeck Length at the Bottom of Explosive Column at
Bench Number-1
The final set of eight holes was blasted with 20% airdeck length placed at bottom of
explosive column at the same bench number-1 at DG. Cement Chakwal. In each blasthole a
wooden plug of 2.4 m length was kept at the bottom of the explosive column to produce an
air space equivalent to 20% of explosive charge length.
4.2.6.1 Charge loading
The loading scheme of each blasthole with 20% airdeck length at bottom of
explosive column at bench number- 1 is shown in Figure 4.31. A wooden plug of length 2.4
m was first of all loaded at the bottom of the blasthole, a primer charge of Dynamite cartridge
was placed at the top of bottom airdeck followed by 3 cartridges of Watergel, these were then
overlain by 50 kg ANFO. One cartridge of Watergel cut in 3 pieces was used as a booster
charge as shown in Figure 4.31. The diameter, weight and length of cartridges were same as
in all the experiments performed at the bench number-1. The drilling and firing pattern was
kept same in all test blasts at bench number-1.
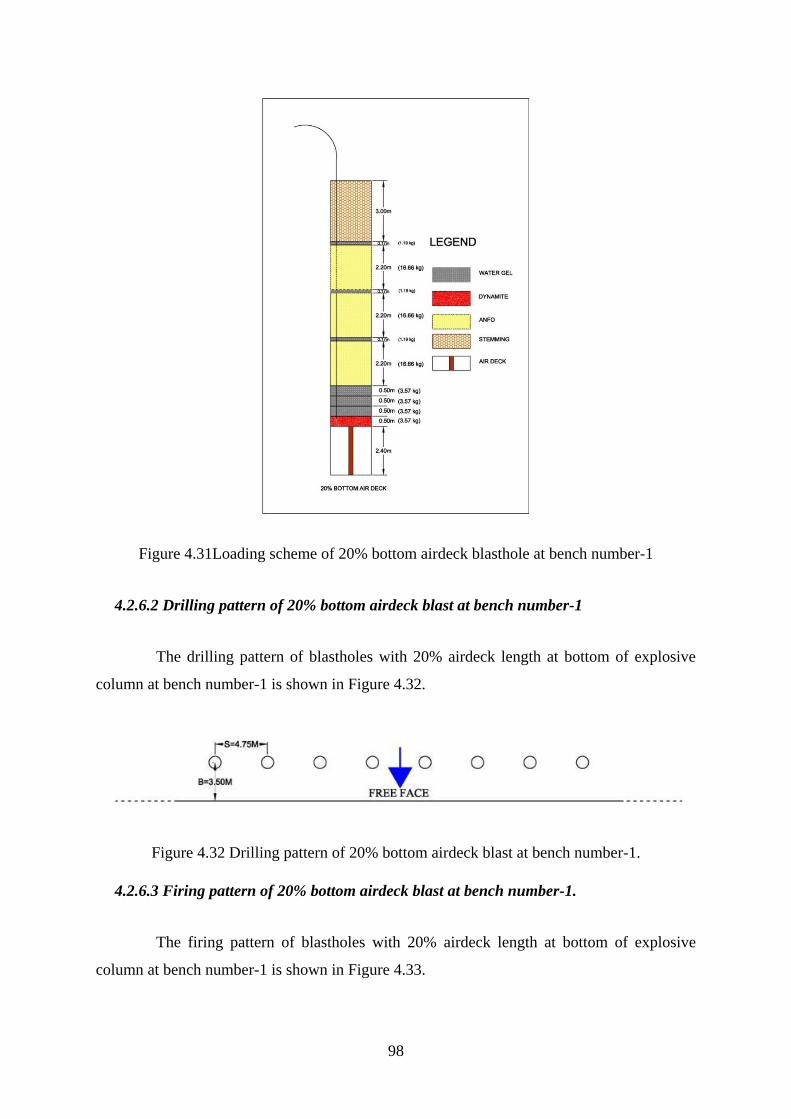
98
Figure 4.31Loading scheme of 20% bottom airdeck blasthole at bench number-1
4.2.6.2 Drilling pattern of 20% bottom airdeck blast at bench number-1
The drilling pattern of blastholes with 20% airdeck length at bottom of explosive
column at bench number-1 is shown in Figure 4.32.
Figure 4.32 Drilling pattern of 20% bottom airdeck blast at bench number-1.
4.2.6.3 Firing pattern of 20% bottom airdeck blast at bench number-1.
The firing pattern of blastholes with 20% airdeck length at bottom of explosive
column at bench number-1 is shown in Figure 4.33.
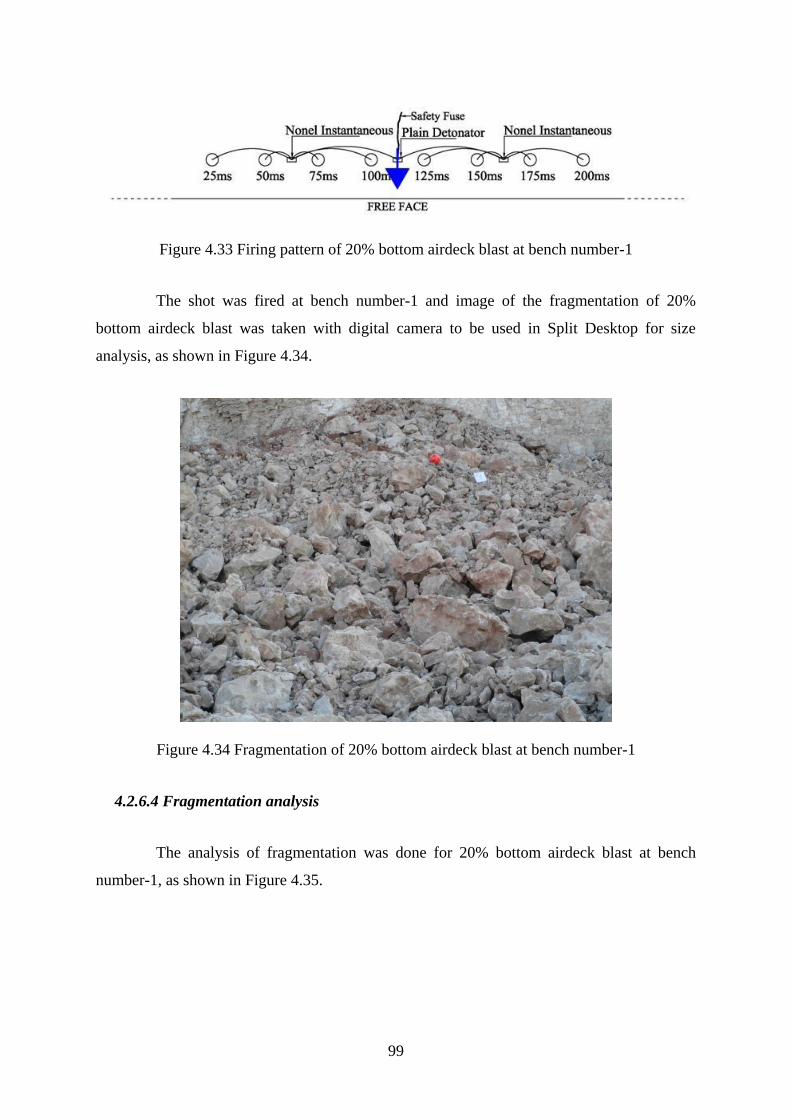
99
Figure 4.33 Firing pattern of 20% bottom airdeck blast at bench number-1
The shot was fired at bench number-1 and image of the fragmentation of 20%
bottom airdeck blast was taken with digital camera to be used in Split Desktop for size
analysis, as shown in Figure 4.34.
Figure 4.34 Fragmentation of 20% bottom airdeck blast at bench number-1
4.2.6.4 Fragmentation analysis
The analysis of fragmentation was done for 20% bottom airdeck blast at bench
number-1, as shown in Figure 4.35.
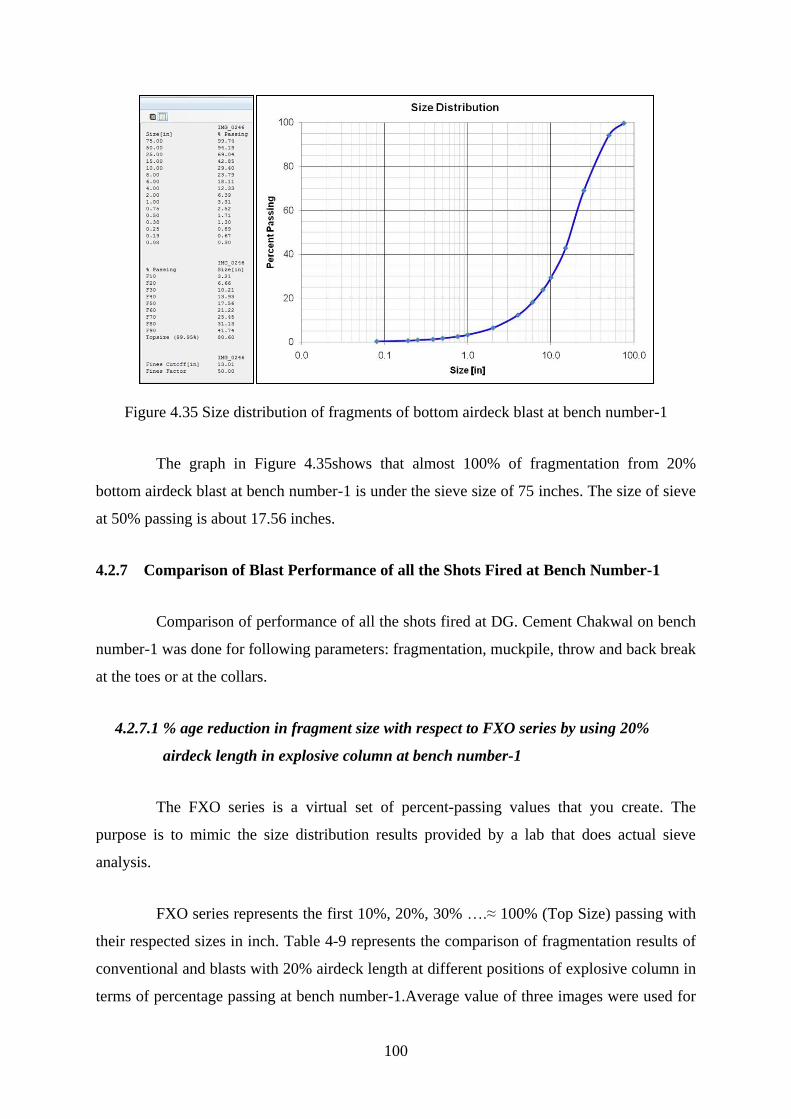
100
Figure 4.35 Size distribution of fragments of bottom airdeck blast at bench number-1
The graph in Figure 4.35shows that almost 100% of fragmentation from 20%
bottom airdeck blast at bench number-1 is under the sieve size of 75 inches. The size of sieve
at 50% passing is about 17.56 inches.
4.2.7 Comparison of Blast Performance of all the Shots Fired at Bench Number-1
Comparison of performance of all the shots fired at DG. Cement Chakwal on bench
number-1 was done for following parameters: fragmentation, muckpile, throw and back break
at the toes or at the collars.
4.2.7.1 % age reduction in fragment size with respect to FXO series by using 20%
airdeck length in explosive column at bench number-1
The FXO series is a virtual set of percent-passing values that you create. The
purpose is to mimic the size distribution results provided by a lab that does actual sieve
analysis.
FXO series represents the first 10%, 20%, 30% ….≈ 100% (Top Size) passing with
their respected sizes in inch. Table 4-9 represents the comparison of fragmentation results of
conventional and blasts with 20% airdeck length at different positions of explosive column in
terms of percentage passing at bench number-1.Average value of three images were used for

101
each percentage passing size, to avoid any biases and to ensure that more accurate results
were obtained.
Table 4-9 Fragmentation results of conventional, 20% mid,20% top and 20% bottom airdeck
blasts at bench number-1
Des
crip
tion
(
per
cen
tage
pass
ing)
Con
ven
tion
al
Bla
st
Aver
age
Valu
es (
inch
es)
20%
Mid
-air
dec
k B
last
Aver
age
Valu
es (
inch
es)
20%
Top
Air
dec
k B
last
Aver
age
Valu
es (
inch
es)
20%
Bott
om
Air
dec
k B
last
Aver
age
Valu
es (
inch
es)
%age
Red
uct
ion
wit
h 2
0%
Mid
-air
dec
k B
last
as
Com
pare
d t
o C
on
ven
tion
al
Bla
st
%age
Red
uct
ion
wit
h 2
0%
Mid
-air
dec
k B
last
as
Com
pare
d t
o 2
0%
Top
Air
dec
k B
last
%age
Red
uct
ion
wit
h 2
0%
Mid
-air
dec
k B
last
as
Com
pare
d t
o 2
0%
Bott
om
Air
dec
k B
last
F10 2.39 0.63 0.76 2.08 74% 17% 70%
F20 5.24 1.38 1.65 4.28 74% 16% 68%
F30 8.3 2.17 2.59 6.53 74% 16% 67%
F40 11.58 3.01 3.6 8.85 74% 16% 66%
F50 14.93 3.93 4.61 11.16 74% 15% 65%
F60 18.2 4.91 5.69 13.44 73% 14% 63%
F70 21.81 6.17 7.22 16.04 72% 15% 62%
F80 26.38 8.01 10.14 19.39 70% 21% 59%
F90 33.32 10.77 16.52 25.13 68% 35% 57%
Top size
measured 63.5 22.25 38.77 48.48 65% 43% 54%
Comparison of each % age passing size of fragmentation for conventional and 20%
airdeck at different positions of explosive column is further shown by bar and cumulative
percentage passing graph in Figure 4.36.
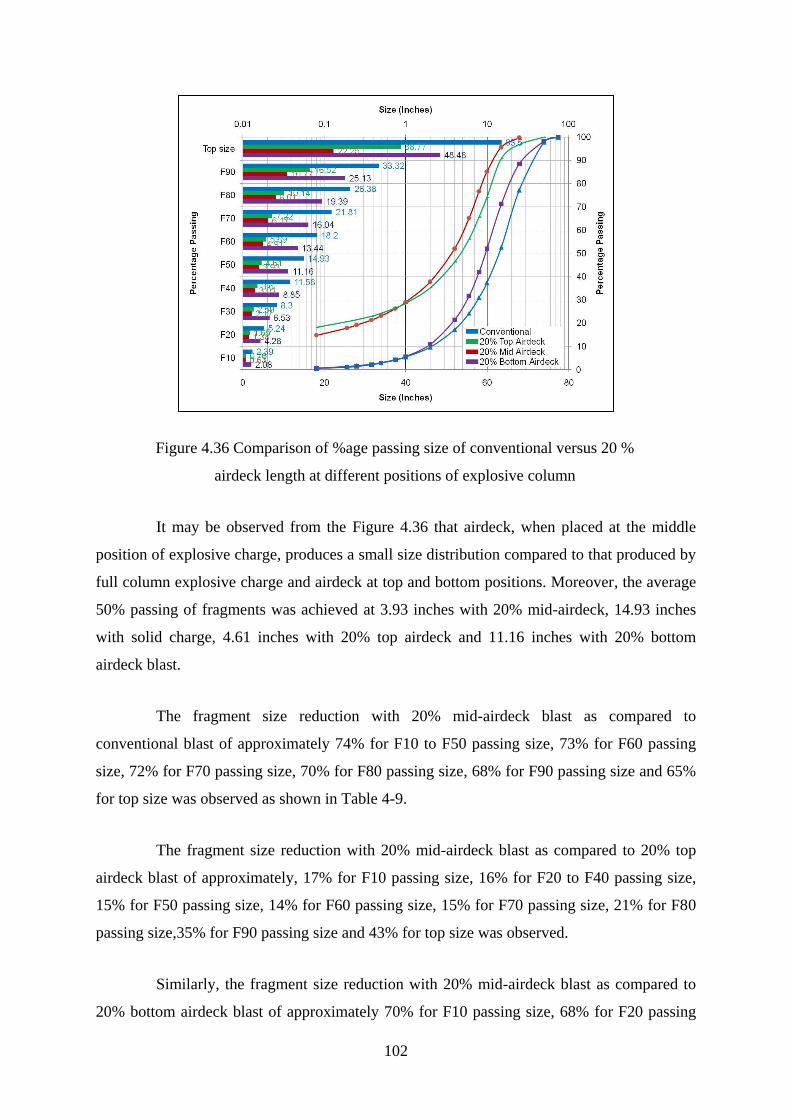
102
Figure 4.36 Comparison of %age passing size of conventional versus 20 %
airdeck length at different positions of explosive column
It may be observed from the Figure 4.36 that airdeck, when placed at the middle
position of explosive charge, produces a small size distribution compared to that produced by
full column explosive charge and airdeck at top and bottom positions. Moreover, the average
50% passing of fragments was achieved at 3.93 inches with 20% mid-airdeck, 14.93 inches
with solid charge, 4.61 inches with 20% top airdeck and 11.16 inches with 20% bottom
airdeck blast.
The fragment size reduction with 20% mid-airdeck blast as compared to
conventional blast of approximately 74% for F10 to F50 passing size, 73% for F60 passing
size, 72% for F70 passing size, 70% for F80 passing size, 68% for F90 passing size and 65%
for top size was observed as shown in Table 4-9.
The fragment size reduction with 20% mid-airdeck blast as compared to 20% top
airdeck blast of approximately, 17% for F10 passing size, 16% for F20 to F40 passing size,
15% for F50 passing size, 14% for F60 passing size, 15% for F70 passing size, 21% for F80
passing size,35% for F90 passing size and 43% for top size was observed.
Similarly, the fragment size reduction with 20% mid-airdeck blast as compared to
20% bottom airdeck blast of approximately 70% for F10 passing size, 68% for F20 passing

103
size, 67% for F30 passing size, 66% for F40 passing size, 65% for F50 passing size, 63% for
F60 passing size, 62% for F70 passing size, 59% for F80 passing size, 57% for F90 passing
size and 54% for top size was observed.
The above analysis established that 20% airdeck length at top, middle and bottom of
the explosive column produced better fragmentation as compared to that produced when a
conventional blasting method was employed with full column charge without any airdeck.
The results of the test blasts at bench number-1 of DG. Cement quarry were in accordance
with the test blasts performed on concrete blocks. It was also very clear that 20% airdecks,
when placed at middle position of the explosive column produced more uniform blasted rock
size distribution compared to that produced at other positions and full column charge without
any airdeck.
Moreover, there was no back break and toe problem found with 20% mid-airdeck
blast at bench no 1. The degree of muckpile formed by fragmentation of the blast with 20%
airdeck at middle of explosive column was better than that produced by conventional blast
with controlled throw and the scattering of material was also non-existent to make it easy for
the loading equipment. The more significant aspect was that in the airdeck blast 20% less
explosive was used.
4.3 FULL SCALE BLASTS
Full scale blasts were conducted on two different sets of 20 holes. These blasts were
executed in the same limestone formation (Sakesar formation) at DG. Cement Chakwal in
Pakistan on a relatively homogeneous bench number-2 to differentiate the blast performance
between the conventional hole loads with full column charge without any airdecking as
shown in Figure 4.38 and the hole loads with airdecking at middle of explosive column as
shown in Figure 4.45. The holes with airdecks were loaded with 20% less explosive as
compared to conventional blast but all other design parameters were kept constant for both
blasts.
In order to check the homogeneity and consistency of limestone bench, each
blasthole was inspected for any discontinuity such as faults, voids and cavities etc which
could alter the results. The blastholes which differed drastically from other blastholes were
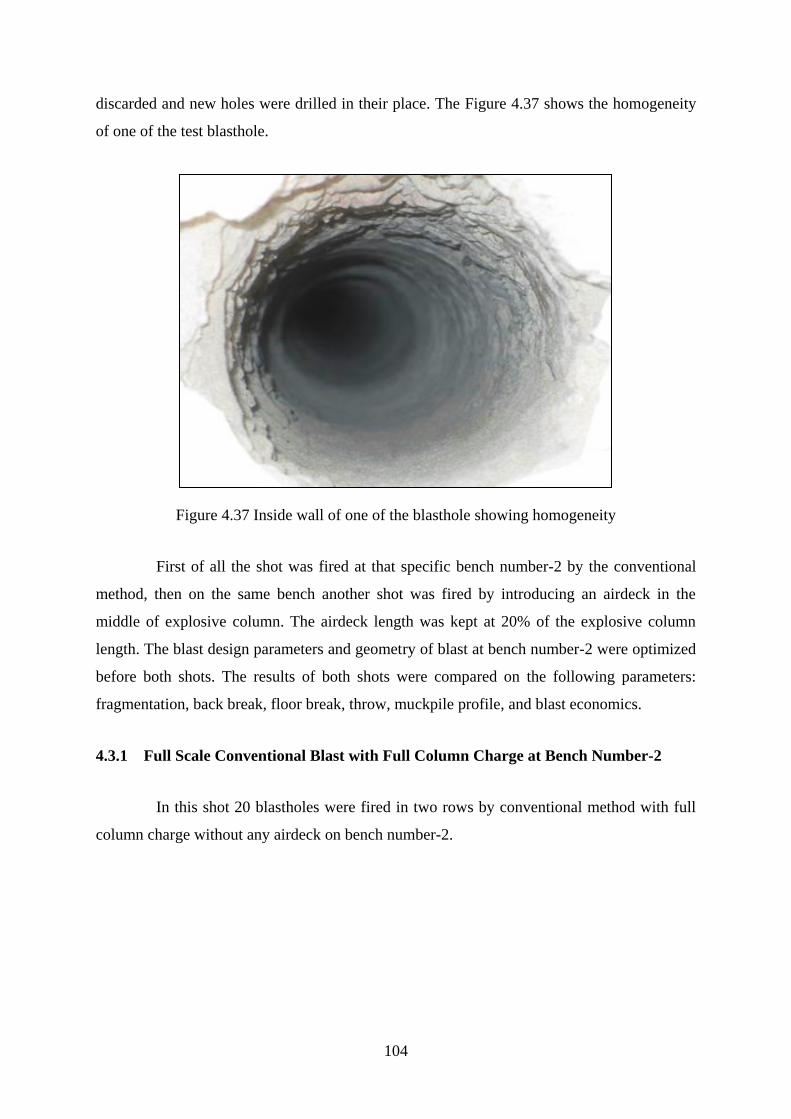
104
discarded and new holes were drilled in their place. The Figure 4.37 shows the homogeneity
of one of the test blasthole.
Figure 4.37 Inside wall of one of the blasthole showing homogeneity
First of all the shot was fired at that specific bench number-2 by the conventional
method, then on the same bench another shot was fired by introducing an airdeck in the
middle of explosive column. The airdeck length was kept at 20% of the explosive column
length. The blast design parameters and geometry of blast at bench number-2 were optimized
before both shots. The results of both shots were compared on the following parameters:
fragmentation, back break, floor break, throw, muckpile profile, and blast economics.
4.3.1 Full Scale Conventional Blast with Full Column Charge at Bench Number-2
In this shot 20 blastholes were fired in two rows by conventional method with full
column charge without any airdeck on bench number-2.

105
4.3.1.1 Conventional blast design parameters at bench number-2
The details of blast design for full scale conventional blast with full column charge
without any airdeck at bench number-2 are shown in Table 4-10.
Table 4-10 Full scale conventional blast design parameters at bench number-2
S.No. Parameters Values
1 Hole diameter 110 mm
2 Spacing 4.75 m
3 Burden 3.5 m
4 Sub-drilling 1 m
5 Stemming 3 m
6 High-Explosive(1Dynamite+4Watergel cartridges) (3.57 + 14.28) = 17.85 kg
7 Booster (1 Watergel cartridge cut into 3 pieces) 3.57 kg
8 ANFO 75 kg
9 No. of holes 20
10 No. of rows 2
11 Depth of hole 15 m
12 Bench height 14 m
4.3.1.2 Loading scheme of each hole in case of full scale conventional blast with full
column charge at bench number-2
The charge loading of all 20 blastholes in case of full scale conventional blast at
bench number-2, as shown in Figure 4.38 was kept exactly the same as that in the
conventional blast at bench number-1.
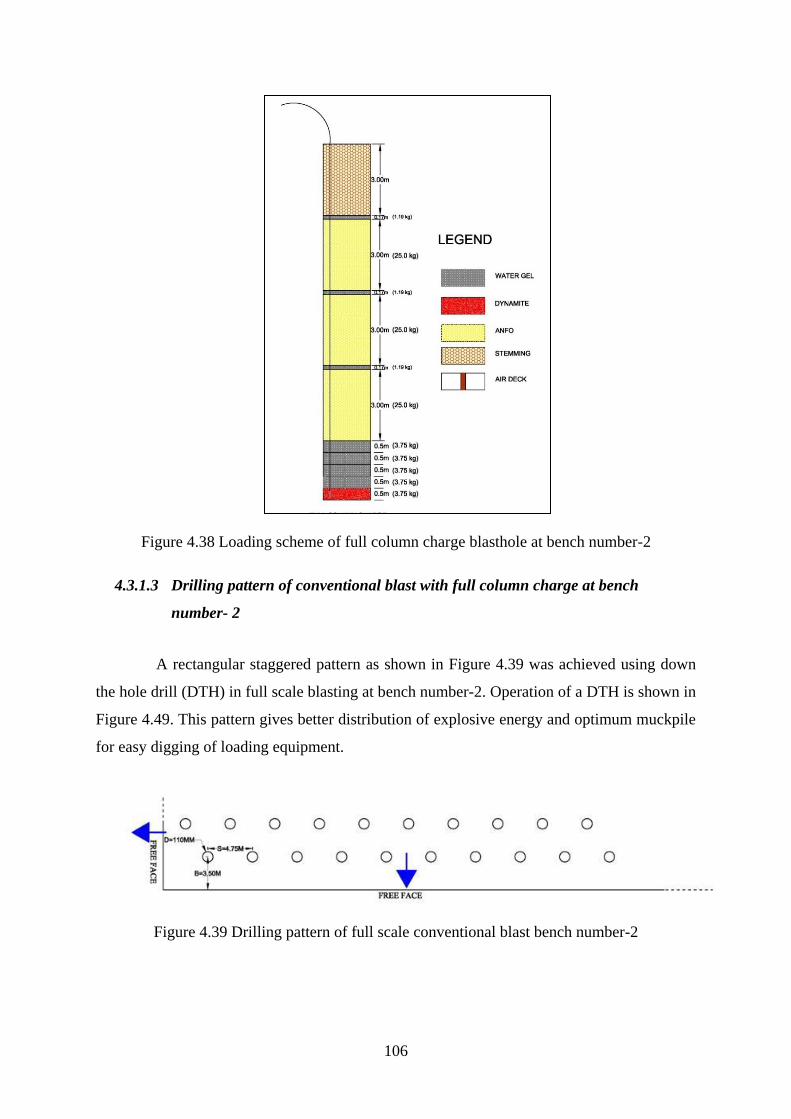
106
Figure 4.38 Loading scheme of full column charge blasthole at bench number-2
4.3.1.3 Drilling pattern of conventional blast with full column charge at bench
number- 2
A rectangular staggered pattern as shown in Figure 4.39 was achieved using down
the hole drill (DTH) in full scale blasting at bench number-2. Operation of a DTH is shown in
Figure 4.49. This pattern gives better distribution of explosive energy and optimum muckpile
for easy digging of loading equipment.
Figure 4.39 Drilling pattern of full scale conventional blast bench number-2
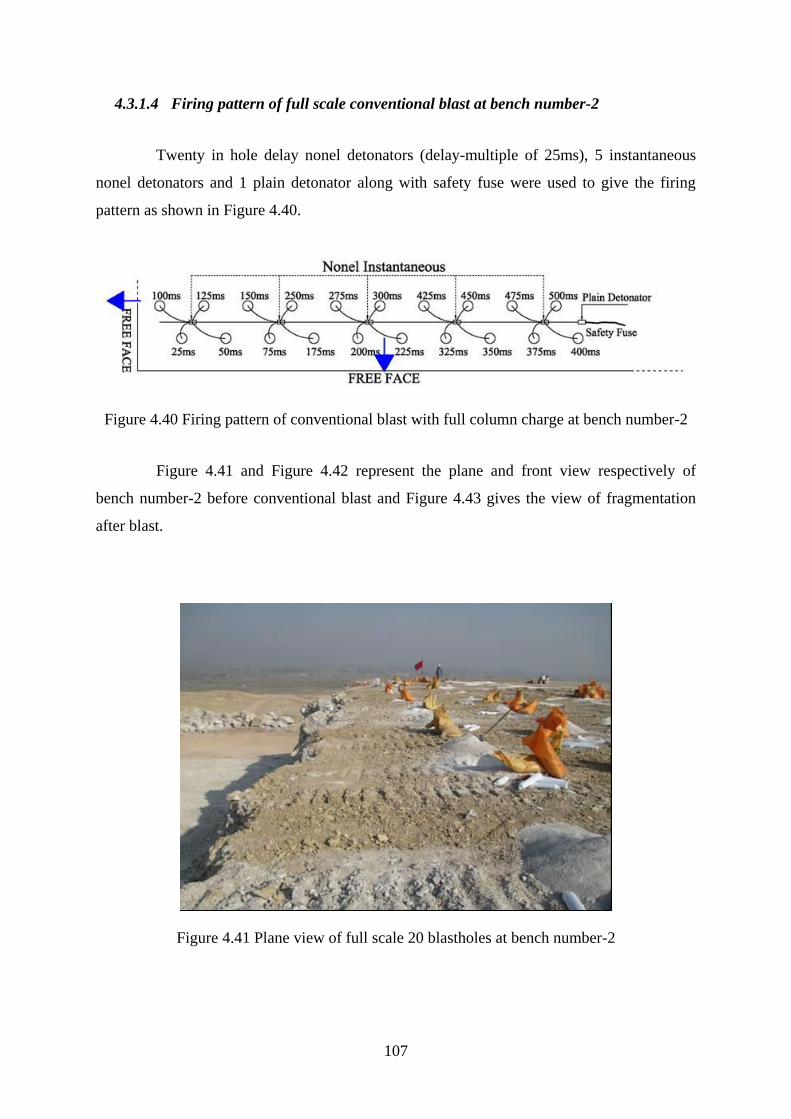
107
4.3.1.4 Firing pattern of full scale conventional blast at bench number-2
Twenty in hole delay nonel detonators (delay-multiple of 25ms), 5 instantaneous
nonel detonators and 1 plain detonator along with safety fuse were used to give the firing
pattern as shown in Figure 4.40.
Figure 4.40 Firing pattern of conventional blast with full column charge at bench number-2
Figure 4.41 and Figure 4.42 represent the plane and front view respectively of
bench number-2 before conventional blast and Figure 4.43 gives the view of fragmentation
after blast.
Figure 4.41 Plane view of full scale 20 blastholes at bench number-2

108
Figure 4.42 Front view of bench number-2 before full scale conventional blast
Figure 4.43 Fragmentation after blast of full scale conventional shot at bench
number-2
4.3.1.5 Fragmentation analysis
Digital image analysis of the fragmentation after blast of full scale conventional
blast was evaluated by using Split Desktop software as shown in Figure 4.44.
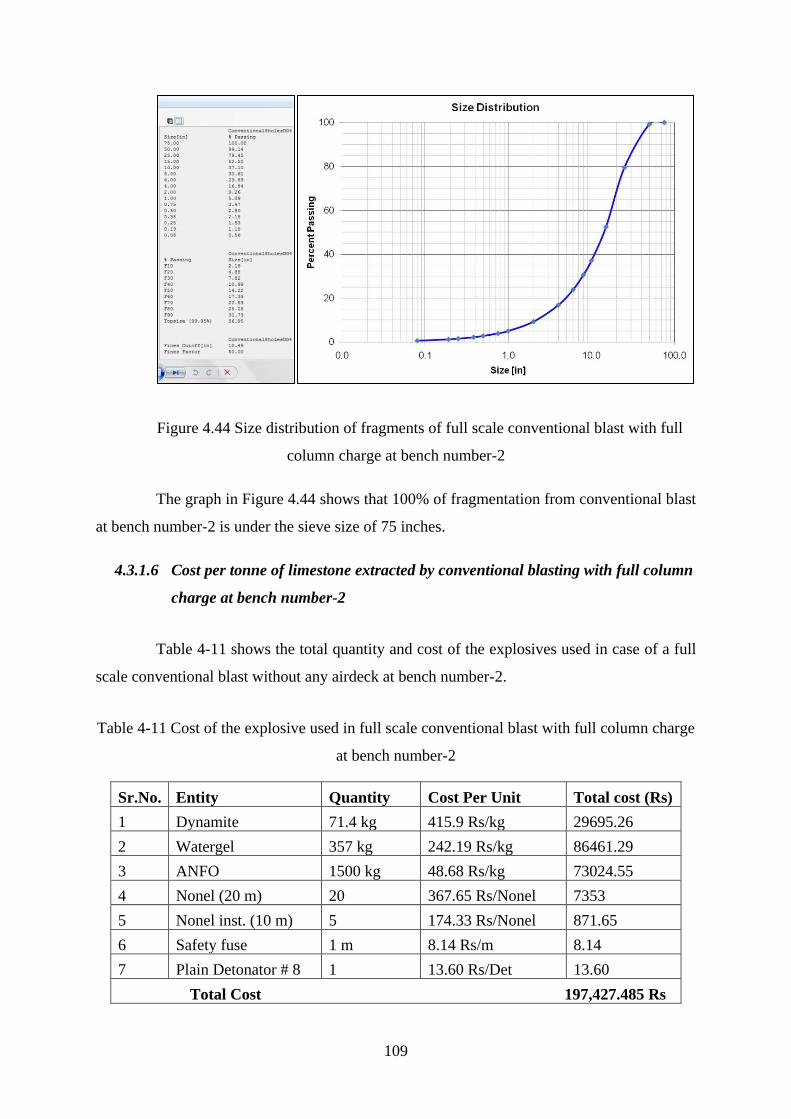
109
Figure 4.44 Size distribution of fragments of full scale conventional blast with full
column charge at bench number-2
The graph in Figure 4.44 shows that 100% of fragmentation from conventional blast
at bench number-2 is under the sieve size of 75 inches.
4.3.1.6 Cost per tonne of limestone extracted by conventional blasting with full column
charge at bench number-2
Table 4-11 shows the total quantity and cost of the explosives used in case of a full
scale conventional blast without any airdeck at bench number-2.
Table 4-11 Cost of the explosive used in full scale conventional blast with full column charge
at bench number-2
Sr.No. Entity Quantity Cost Per Unit Total cost (Rs)
1 Dynamite 71.4 kg 415.9 Rs/kg 29695.26
2 Watergel 357 kg 242.19 Rs/kg 86461.29
3 ANFO 1500 kg 48.68 Rs/kg 73024.55
4 Nonel (20 m) 20 367.65 Rs/Nonel 7353
5 Nonel inst. (10 m) 5 174.33 Rs/Nonel 871.65
6 Safety fuse 1 m 8.14 Rs/m 8.14
7 Plain Detonator # 8 1 13.60 Rs/Det 13.60
Total Cost 197,427.485 Rs
110
Total volume blasted = 3.5 x 4.75 x 14 x 20
= 4655 m3
Total tonnage blasted = 4655 × 2.7
= 12,568.5 tonnes
(where density of limestone = 2.7 tonnes/m3)
Explosives Consumed = Dynamite +Watergel+ANFO
=71.4+357+1500=1928.4 kg
Powder Factor = Explosive Consumed (kg)/Rock Blasted (m3)
=1928.4/4655=0.414 kg/m3
Cost of explosives per tonne of rock blasted = Total Cost of explosives/Tonnes of rock
blasted
=197,427.485/12,568.5
=15.708 Rs/tonne
4.3.2 Modified Full Scale Blast using 20% Airdeck Length at the Middle of Explosive
Column at Bench Number-2
In this case, in each blasthole a wooden plug of 2.4 m length as shown in Figure
4.51 was loaded at the middle of the explosive column to create an air space equivalent to
20% of explosive charge length. This airdeck at the middle of the explosive column was
supposed to enhance the effect of the explosive on the rock and reduce its consumption up to
20%.
4.3.2.1 Design parameters of full scale 20% mid-airdeck blast at bench number-2
Table 4-12 shows the design specifications of full scale 20% mid-airdeck blast at
bench number-2.
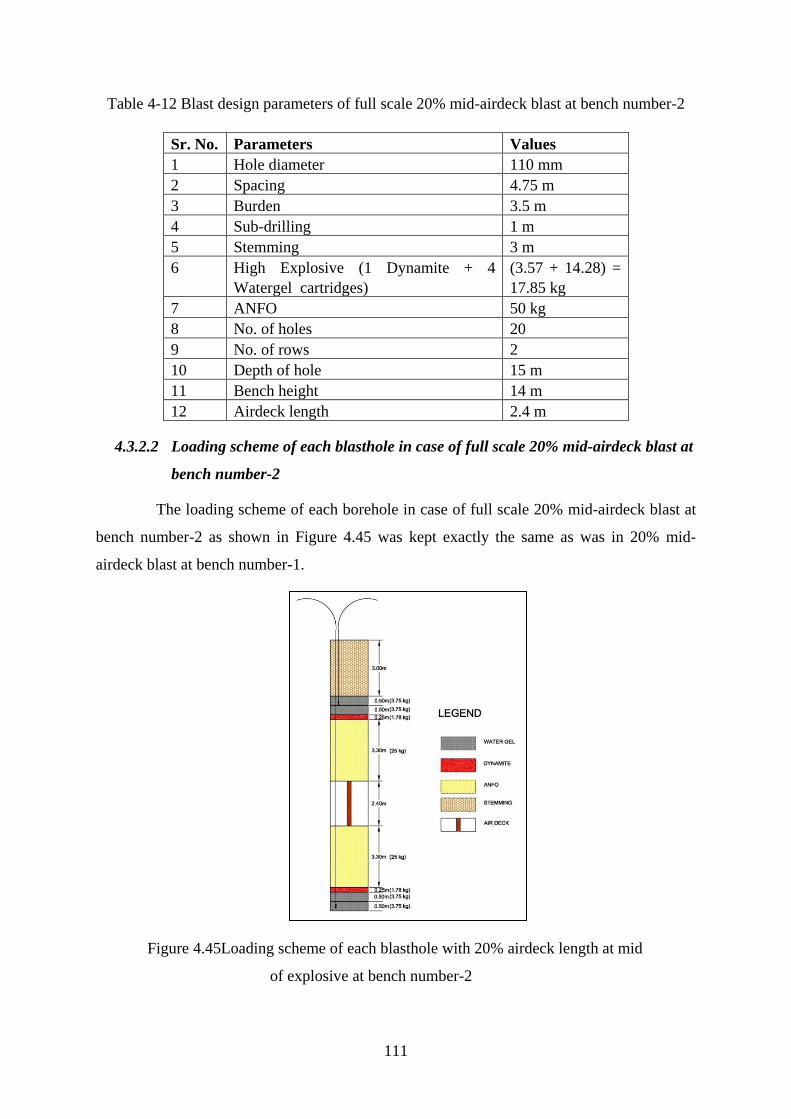
111
Table 4-12 Blast design parameters of full scale 20% mid-airdeck blast at bench number-2
Sr. No. Parameters Values
1 Hole diameter 110 mm
2 Spacing 4.75 m
3 Burden 3.5 m
4 Sub-drilling 1 m
5 Stemming 3 m
6 High Explosive (1 Dynamite + 4
Watergel cartridges)
(3.57 + 14.28) =
17.85 kg
7 ANFO 50 kg
8 No. of holes 20
9 No. of rows 2
10 Depth of hole 15 m
11 Bench height 14 m
12 Airdeck length 2.4 m
4.3.2.2 Loading scheme of each blasthole in case of full scale 20% mid-airdeck blast at
bench number-2
The loading scheme of each borehole in case of full scale 20% mid-airdeck blast at
bench number-2 as shown in Figure 4.45 was kept exactly the same as was in 20% mid-
airdeck blast at bench number-1.
Figure 4.45Loading scheme of each blasthole with 20% airdeck length at mid
of explosive at bench number-2

112
4.3.2.3 Drilling pattern of full scale 20%mid-airdeck blast at bench number-2
The drilling pattern for full scale 20% mid-airdeck blast, as shown in Figure 4.46
was kept exactly the same as was in the conventional blast at bench number-1.
Figure 4.46 Drilling pattern of full scale mid-airdeck blast bench number-2
4.3.2.4 Firing pattern of full scale 20% mid-airdeck blast at bench number-2
The firing pattern as shown in Figure 4.47 was kept exactly the same as was in the
full scale conventional blast. As amid-airdeck divides the explosive column in two equal
parts, so top and bottom priming, with same delay nonel detonators, was achieved in each
blasthole. The loading of 20% mid-airdeck can be seen in Figure 4.51. The network of nonel
initiation system is also shown in Figure 4.53.
Figure 4.47 Firing pattern of 20% mid-airdeck blast at bench number-2
Figure 4.48 and Figure 4.54 present the image of bench number-2 before and after
full scale 20% mid-airdeck blast respectively.
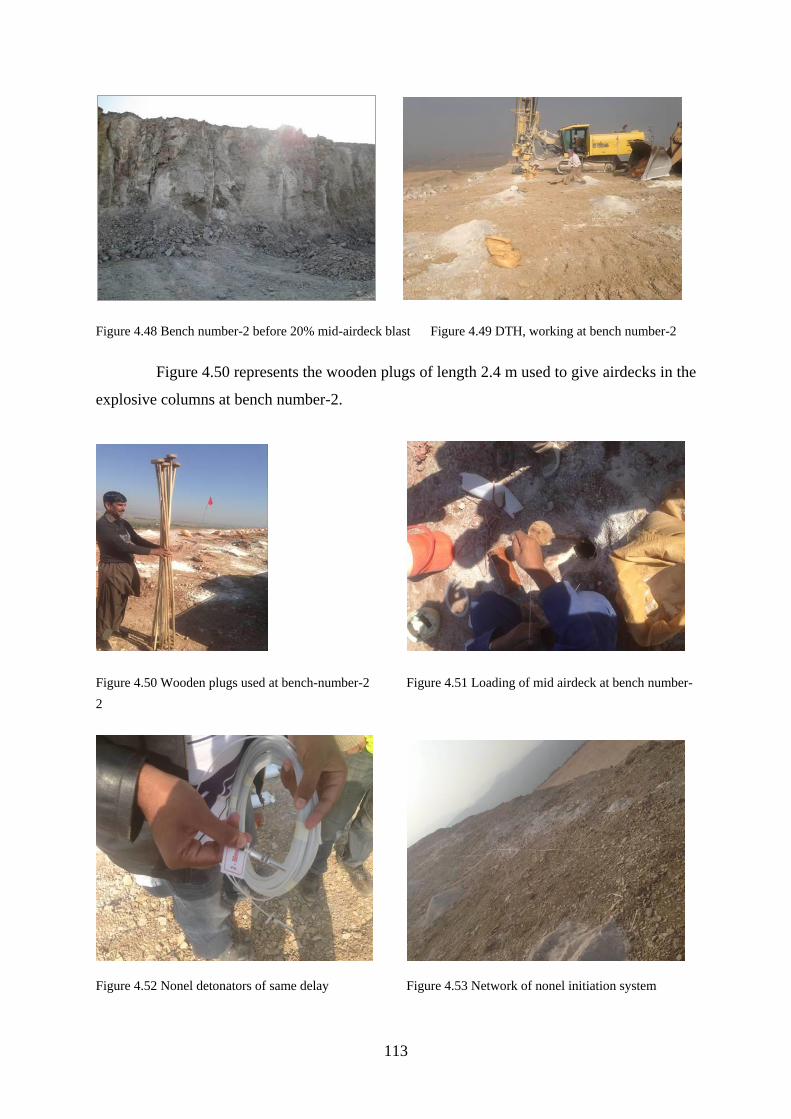
113
Figure 4.48 Bench number-2 before 20% mid-airdeck blast Figure 4.49 DTH, working at bench number-2
Figure 4.50 represents the wooden plugs of length 2.4 m used to give airdecks in the
explosive columns at bench number-2.
Figure 4.50 Wooden plugs used at bench-number-2 Figure 4.51 Loading of mid airdeck at bench number-
2
Figure 4.52 Nonel detonators of same delay Figure 4.53 Network of nonel initiation system
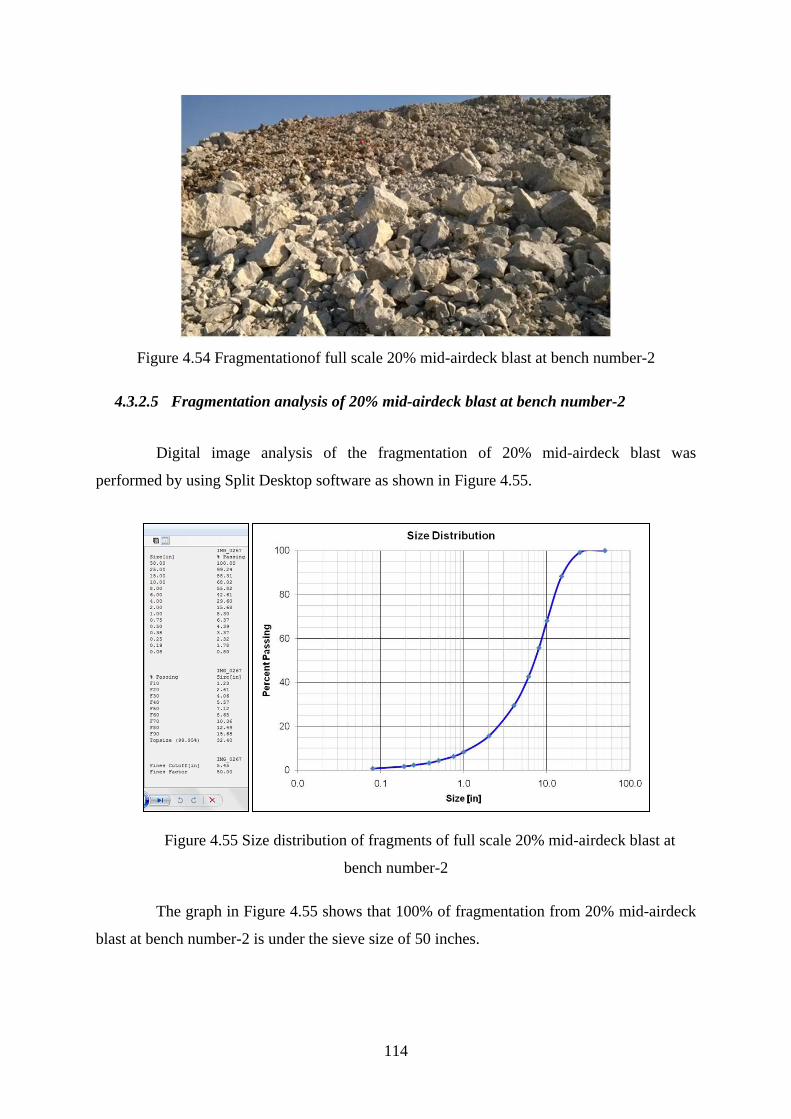
114
Figure 4.54 Fragmentationof full scale 20% mid-airdeck blast at bench number-2
4.3.2.5 Fragmentation analysis of 20% mid-airdeck blast at bench number-2
Digital image analysis of the fragmentation of 20% mid-airdeck blast was
performed by using Split Desktop software as shown in Figure 4.55.
Figure 4.55 Size distribution of fragments of full scale 20% mid-airdeck blast at
bench number-2
The graph in Figure 4.55 shows that 100% of fragmentation from 20% mid-airdeck
blast at bench number-2 is under the sieve size of 50 inches.
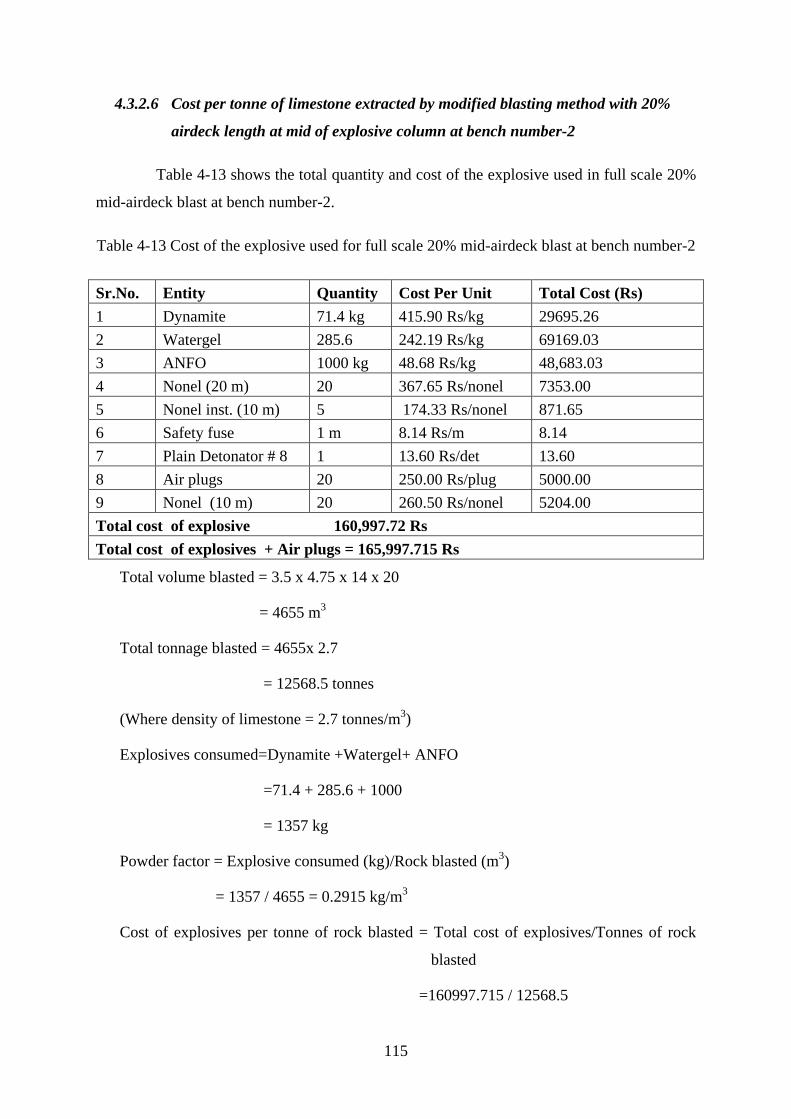
115
4.3.2.6 Cost per tonne of limestone extracted by modified blasting method with 20%
airdeck length at mid of explosive column at bench number-2
Table 4-13 shows the total quantity and cost of the explosive used in full scale 20%
mid-airdeck blast at bench number-2.
Table 4-13 Cost of the explosive used for full scale 20% mid-airdeck blast at bench number-2
Sr.No. Entity Quantity Cost Per Unit Total Cost (Rs)
1 Dynamite 71.4 kg 415.90 Rs/kg 29695.26
2 Watergel 285.6 242.19 Rs/kg 69169.03
3 ANFO 1000 kg 48.68 Rs/kg 48,683.03
4 Nonel (20 m) 20 367.65 Rs/nonel 7353.00
5 Nonel inst. (10 m) 5 174.33 Rs/nonel 871.65
6 Safety fuse 1 m 8.14 Rs/m 8.14
7 Plain Detonator # 8 1 13.60 Rs/det 13.60
8 Air plugs 20 250.00 Rs/plug 5000.00
9 Nonel (10 m) 20 260.50 Rs/nonel 5204.00
Total cost of explosive 160,997.72 Rs
Total cost of explosives + Air plugs = 165,997.715 Rs
Total volume blasted = 3.5 x 4.75 x 14 x 20
= 4655 m3
Total tonnage blasted = 4655x 2.7
= 12568.5 tonnes
(Where density of limestone = 2.7 tonnes/m3)
Explosives consumed=Dynamite +Watergel+ ANFO
=71.4 + 285.6 + 1000
= 1357 kg
Powder factor = Explosive consumed (kg)/Rock blasted (m3)
= 1357 / 4655 = 0.2915 kg/m3
Cost of explosives per tonne of rock blasted = Total cost of explosives/Tonnes of rock
blasted
=160997.715 / 12568.5
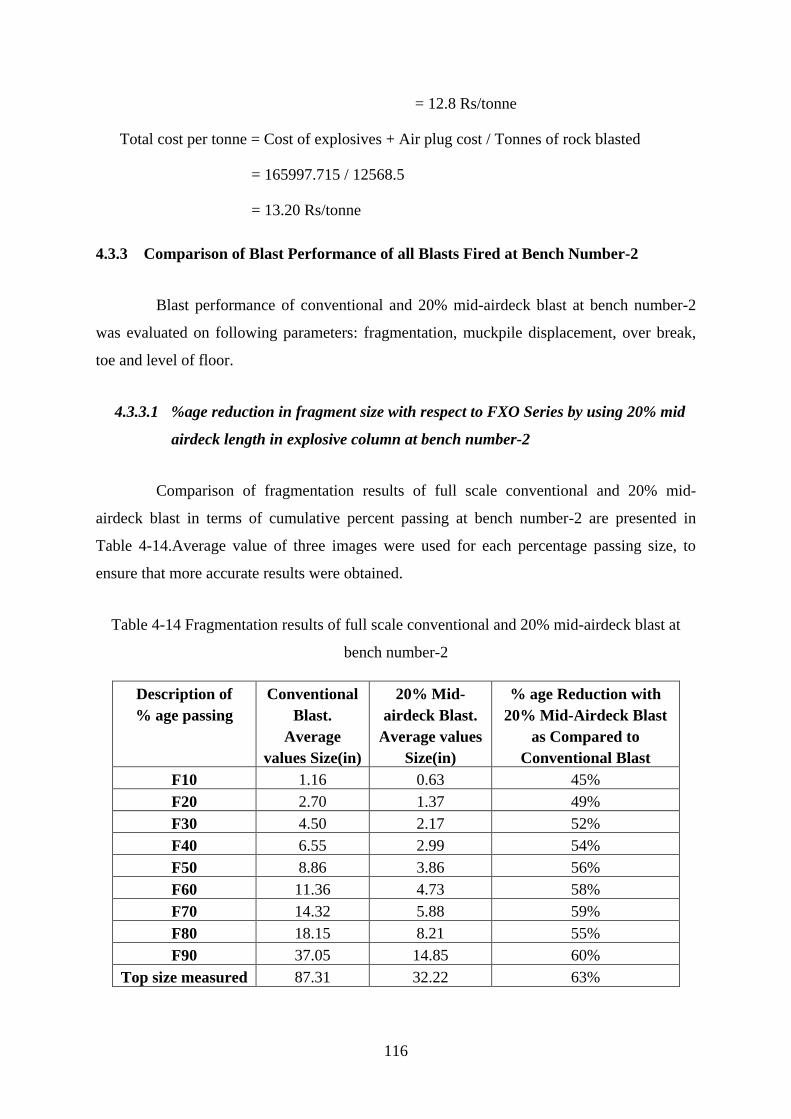
116
= 12.8 Rs/tonne
Total cost per tonne = Cost of explosives + Air plug cost / Tonnes of rock blasted
= 165997.715 / 12568.5
= 13.20 Rs/tonne
4.3.3 Comparison of Blast Performance of all Blasts Fired at Bench Number-2
Blast performance of conventional and 20% mid-airdeck blast at bench number-2
was evaluated on following parameters: fragmentation, muckpile displacement, over break,
toe and level of floor.
4.3.3.1 %age reduction in fragment size with respect to FXO Series by using 20% mid
airdeck length in explosive column at bench number-2
Comparison of fragmentation results of full scale conventional and 20% mid-
airdeck blast in terms of cumulative percent passing at bench number-2 are presented in
Table 4-14.Average value of three images were used for each percentage passing size, to
ensure that more accurate results were obtained.
Table 4-14 Fragmentation results of full scale conventional and 20% mid-airdeck blast at
bench number-2
Description of
% age passing
Conventional
Blast.
Average
values Size(in)
20% Mid-
airdeck Blast.
Average values
Size(in)
% age Reduction with
20% Mid-Airdeck Blast
as Compared to
Conventional Blast
F10 1.16 0.63 45%
F20 2.70 1.37 49%
F30 4.50 2.17 52%
F40 6.55 2.99 54%
F50 8.86 3.86 56%
F60 11.36 4.73 58%
F70 14.32 5.88 59%
F80 18.15 8.21 55%
F90 37.05 14.85 60%
Top size measured 87.31 32.22 63%
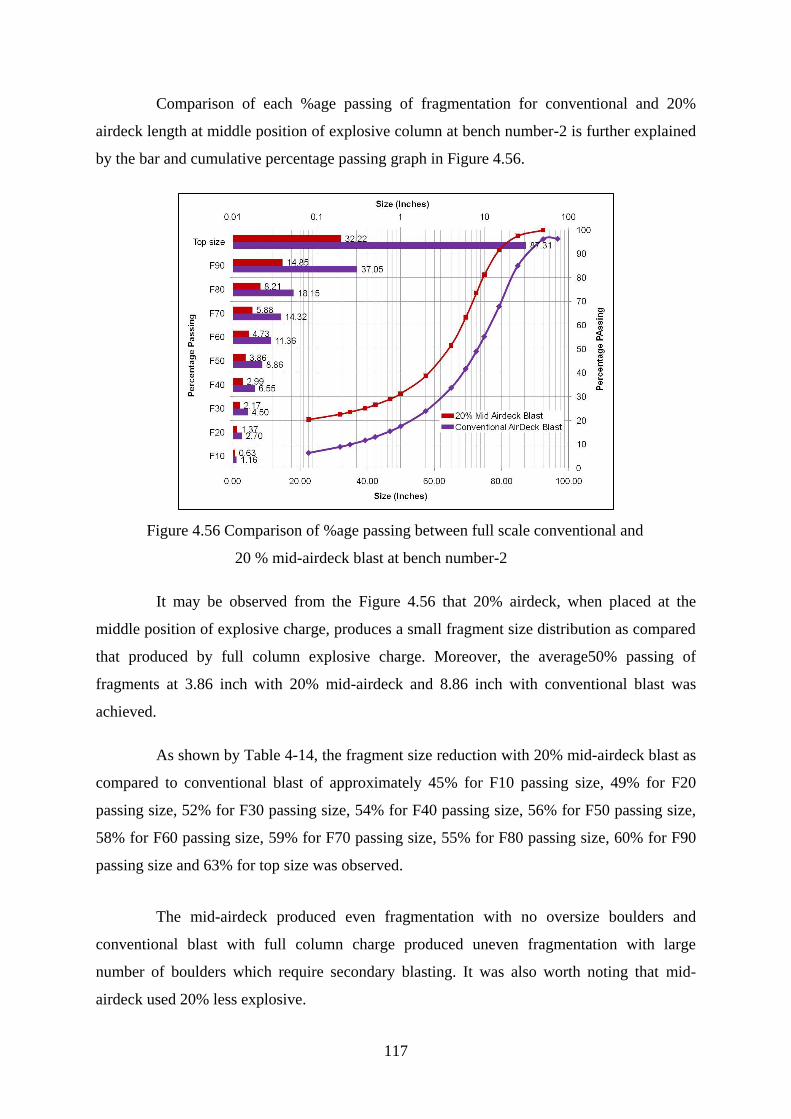
117
Comparison of each %age passing of fragmentation for conventional and 20%
airdeck length at middle position of explosive column at bench number-2 is further explained
by the bar and cumulative percentage passing graph in Figure 4.56.
Figure 4.56 Comparison of %age passing between full scale conventional and
20 % mid-airdeck blast at bench number-2
It may be observed from the Figure 4.56 that 20% airdeck, when placed at the
middle position of explosive charge, produces a small fragment size distribution as compared
that produced by full column explosive charge. Moreover, the average50% passing of
fragments at 3.86 inch with 20% mid-airdeck and 8.86 inch with conventional blast was
achieved.
As shown by Table 4-14, the fragment size reduction with 20% mid-airdeck blast as
compared to conventional blast of approximately 45% for F10 passing size, 49% for F20
passing size, 52% for F30 passing size, 54% for F40 passing size, 56% for F50 passing size,
58% for F60 passing size, 59% for F70 passing size, 55% for F80 passing size, 60% for F90
passing size and 63% for top size was observed.
The mid-airdeck produced even fragmentation with no oversize boulders and
conventional blast with full column charge produced uneven fragmentation with large
number of boulders which require secondary blasting. It was also worth noting that mid-
airdeck used 20% less explosive.
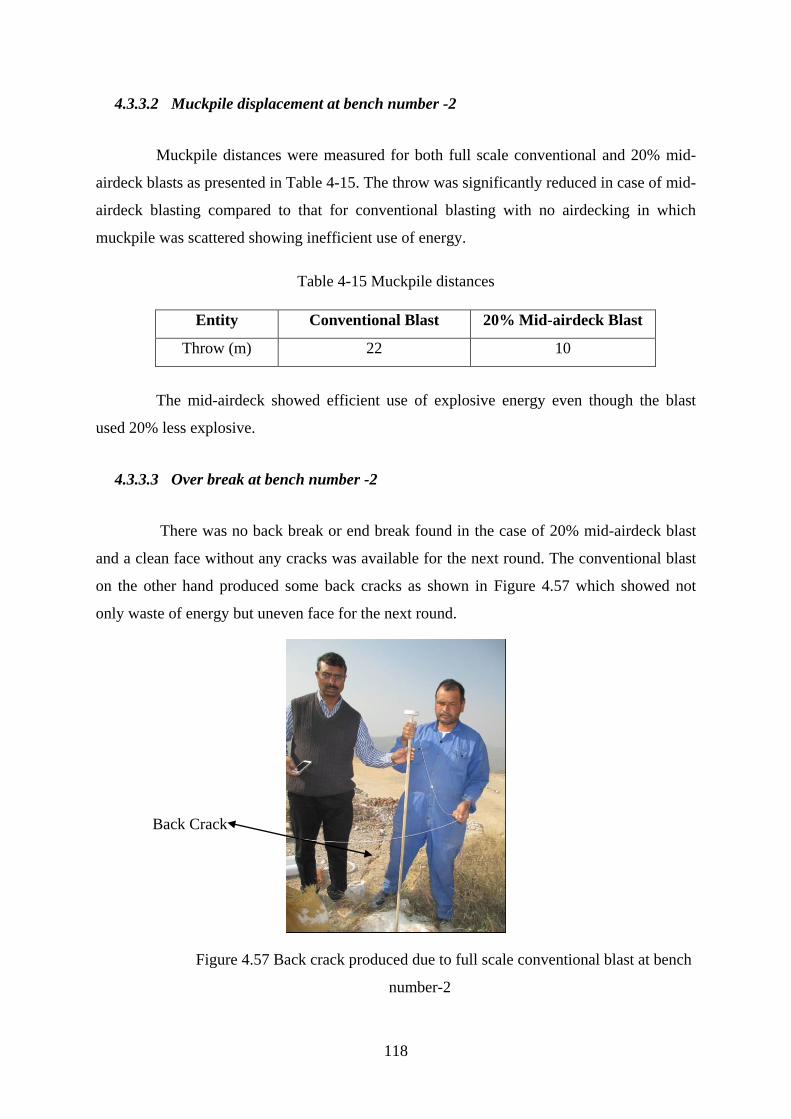
118
4.3.3.2 Muckpile displacement at bench number -2
Muckpile distances were measured for both full scale conventional and 20% mid-
airdeck blasts as presented in Table 4-15. The throw was significantly reduced in case of mid-
airdeck blasting compared to that for conventional blasting with no airdecking in which
muckpile was scattered showing inefficient use of energy.
Table 4-15 Muckpile distances
Entity Conventional Blast 20% Mid-airdeck Blast
Throw (m) 22 10
The mid-airdeck showed efficient use of explosive energy even though the blast
used 20% less explosive.
4.3.3.3 Over break at bench number -2
There was no back break or end break found in the case of 20% mid-airdeck blast
and a clean face without any cracks was available for the next round. The conventional blast
on the other hand produced some back cracks as shown in Figure 4.57 which showed not
only waste of energy but uneven face for the next round.
Figure 4.57 Back crack produced due to full scale conventional blast at bench
number-2
Back Crack
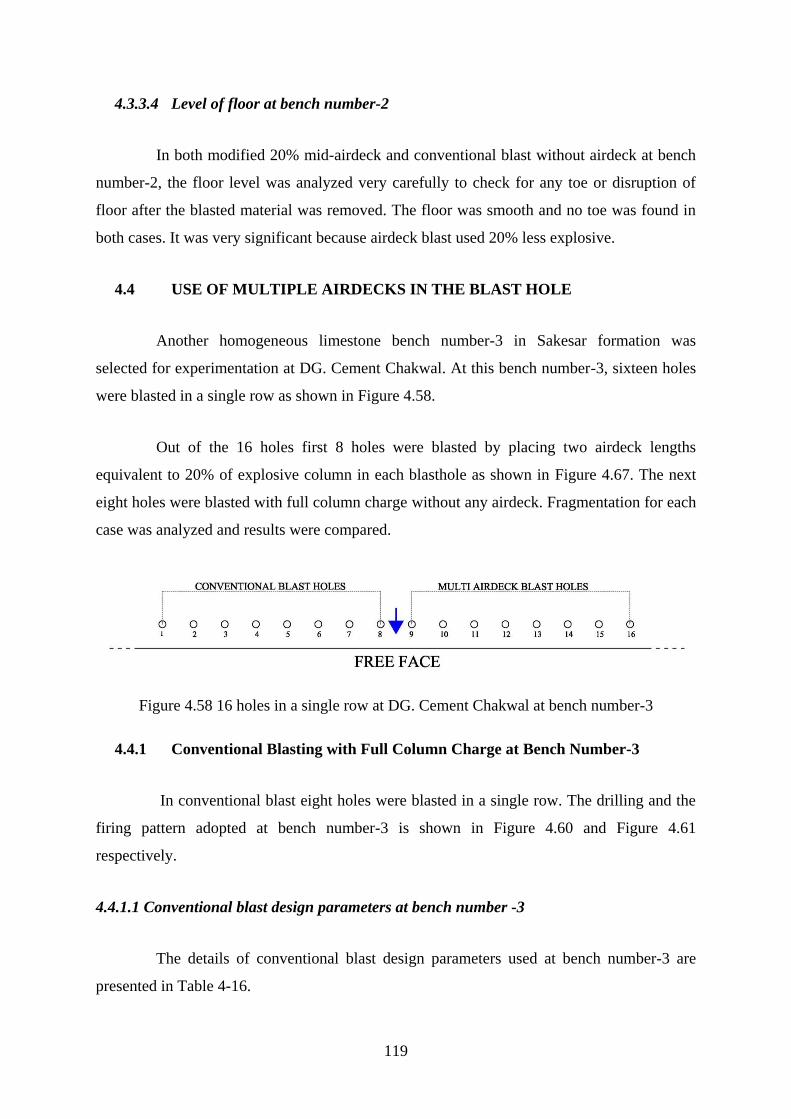
119
4.3.3.4 Level of floor at bench number-2
In both modified 20% mid-airdeck and conventional blast without airdeck at bench
number-2, the floor level was analyzed very carefully to check for any toe or disruption of
floor after the blasted material was removed. The floor was smooth and no toe was found in
both cases. It was very significant because airdeck blast used 20% less explosive.
4.4 USE OF MULTIPLE AIRDECKS IN THE BLAST HOLE
Another homogeneous limestone bench number-3 in Sakesar formation was
selected for experimentation at DG. Cement Chakwal. At this bench number-3, sixteen holes
were blasted in a single row as shown in Figure 4.58.
Out of the 16 holes first 8 holes were blasted by placing two airdeck lengths
equivalent to 20% of explosive column in each blasthole as shown in Figure 4.67. The next
eight holes were blasted with full column charge without any airdeck. Fragmentation for each
case was analyzed and results were compared.
Figure 4.58 16 holes in a single row at DG. Cement Chakwal at bench number-3
4.4.1 Conventional Blasting with Full Column Charge at Bench Number-3
In conventional blast eight holes were blasted in a single row. The drilling and the
firing pattern adopted at bench number-3 is shown in Figure 4.60 and Figure 4.61
respectively.
4.4.1.1 Conventional blast design parameters at bench number -3
The details of conventional blast design parameters used at bench number-3 are
presented in Table 4-16.

120
Table 4-16 Design parameters for conventional blast with full column charge at DG.
Cement Chakwal on bench number-3
Hole diameter 110mm
Spacing 4.5m
Burden 4m
Stemming 2.5m
High explosive
(1 unit Dynamite + 3 units of Watergel)
(3.57kg + 3* 3.57) = 14.28
kg
Column Charge ANFO 86 kg
No of holes 8
No of rows 1
Hole depth 14m
Bench height 13m
4.4.1.2 Charge loading
The loading scheme of each blasthole in case of the conventional blast with full
column charge at bench-3 was maintained as shown in Figure 4.59. Dynamite and Watergel
(Blaster) were the high explosives used as bottom charge and blasting grade ANFO was used
as column charge in each blasthole. The charge loading was done by putting 3.57 kg of
Dynamite cartridge attached to the nonel detonator as primer charge followed by 2 cartridges
of Watergel weighing 7.14 kg to make a bottom charge. The diameter, length and weight of
each explosive cartridge were 100 mm, 0.5 m and 3.57 kg respectively. The bottom charge
was then followed by the column charge of 85 kg ANFO. One cartridge of Watergel cut in 3
equal parts was used as a booster in the column charge as shown in Figure 4.59. The
stemming of length 3m with drill cuttings was maintained in all blastholes. Progressive firing
pattern was achieved by using multiple of 25ms in hole delay nonel detonators. All holes
were connected, in a row, by instantaneous nonel detonators which in turn were connected to
the plain detonator. The plain detonator was crimped to safety fuse as shown in Figure 4.61.
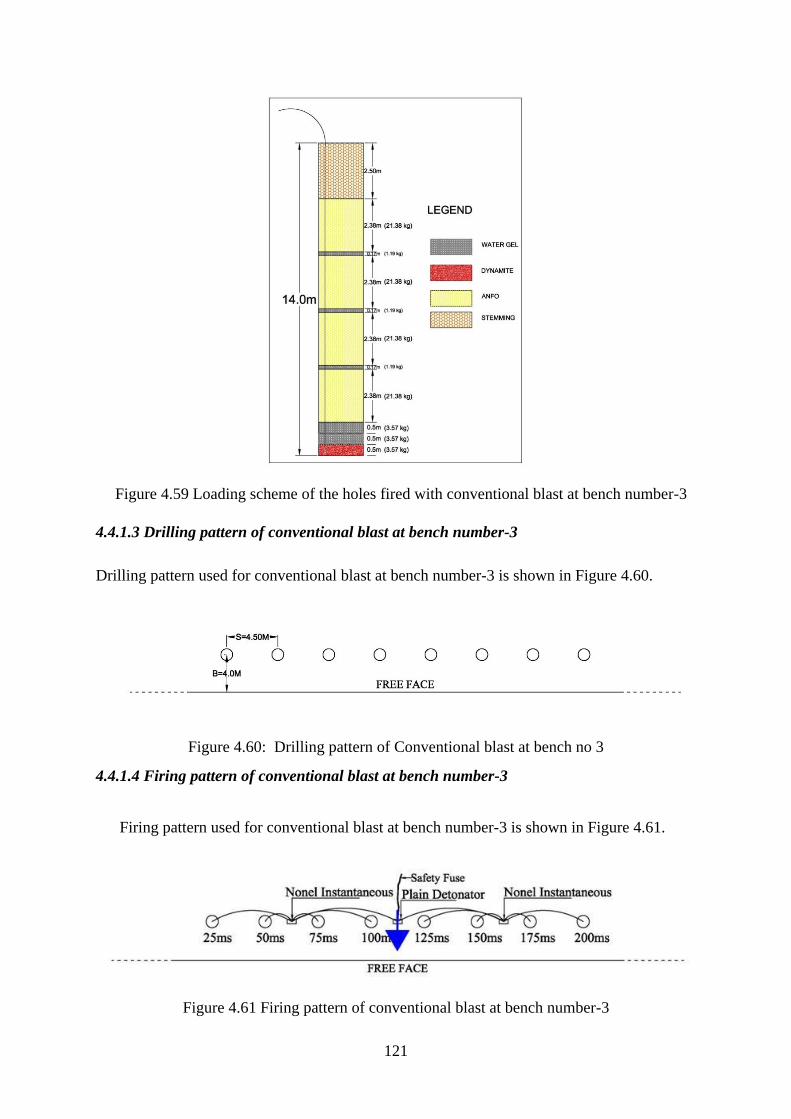
121
Figure 4.59 Loading scheme of the holes fired with conventional blast at bench number-3
4.4.1.3 Drilling pattern of conventional blast at bench number-3
Drilling pattern used for conventional blast at bench number-3 is shown in Figure 4.60.
Figure 4.60: Drilling pattern of Conventional blast at bench no 3
4.4.1.4 Firing pattern of conventional blast at bench number-3
Firing pattern used for conventional blast at bench number-3 is shown in Figure 4.61.
Figure 4.61 Firing pattern of conventional blast at bench number-3
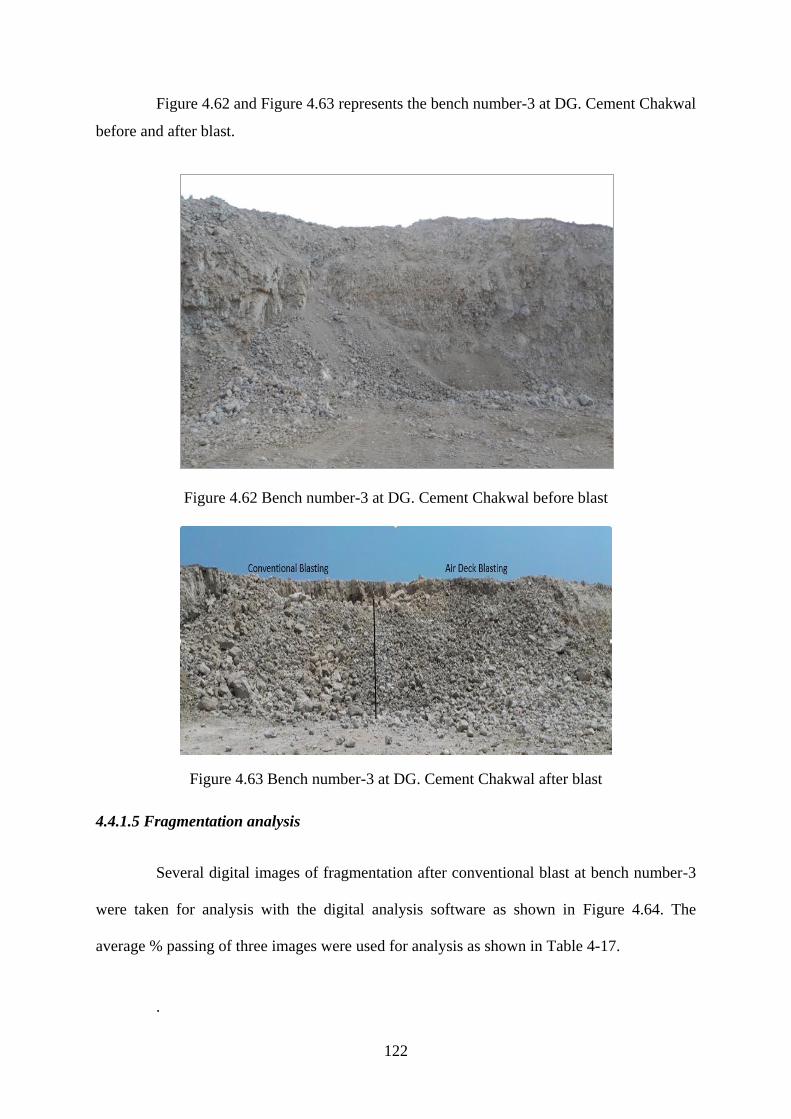
122
Figure 4.62 and Figure 4.63 represents the bench number-3 at DG. Cement Chakwal
before and after blast.
Figure 4.62 Bench number-3 at DG. Cement Chakwal before blast
Figure 4.63 Bench number-3 at DG. Cement Chakwal after blast
4.4.1.5 Fragmentation analysis
Several digital images of fragmentation after conventional blast at bench number-3
were taken for analysis with the digital analysis software as shown in Figure 4.64. The
average % passing of three images were used for analysis as shown in Table 4-17.
.
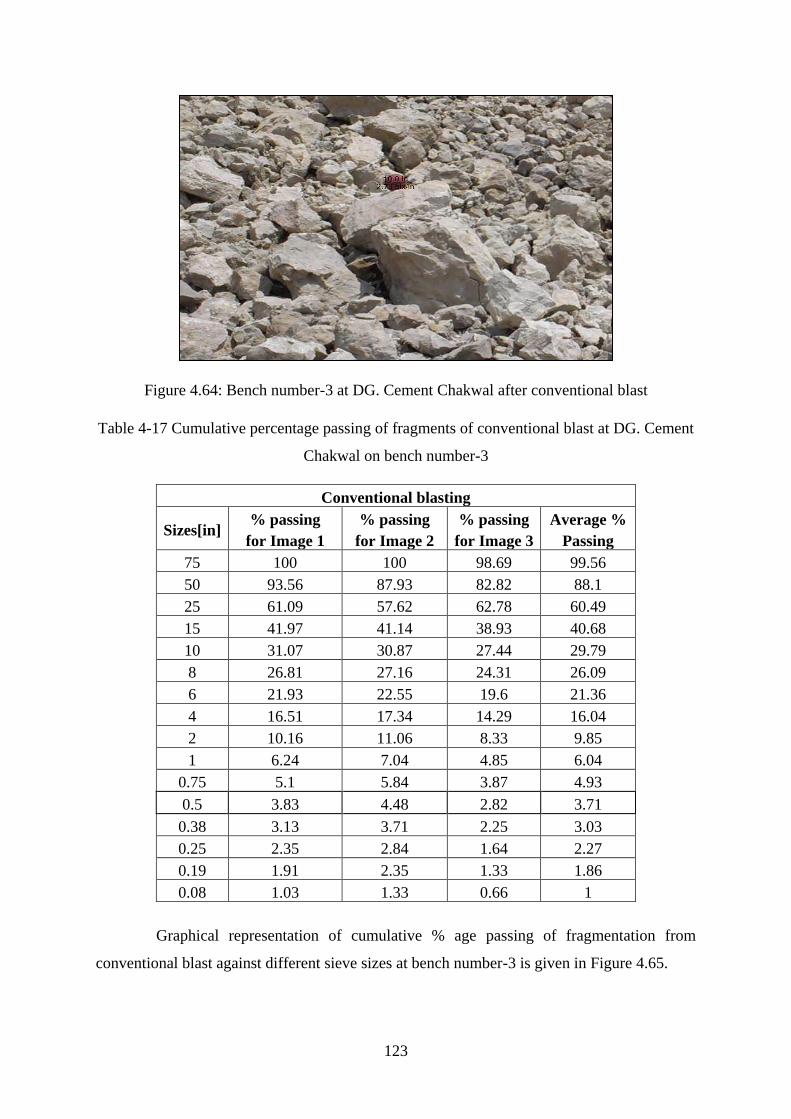
123
Figure 4.64: Bench number-3 at DG. Cement Chakwal after conventional blast
Table 4-17 Cumulative percentage passing of fragments of conventional blast at DG. Cement
Chakwal on bench number-3
Conventional blasting
Sizes[in] % passing
for Image 1
% passing
for Image 2
% passing
for Image 3
Average %
Passing
75 100 100 98.69 99.56
50 93.56 87.93 82.82 88.1
25 61.09 57.62 62.78 60.49
15 41.97 41.14 38.93 40.68
10 31.07 30.87 27.44 29.79
8 26.81 27.16 24.31 26.09
6 21.93 22.55 19.6 21.36
4 16.51 17.34 14.29 16.04
2 10.16 11.06 8.33 9.85
1 6.24 7.04 4.85 6.04
0.75 5.1 5.84 3.87 4.93
0.5 3.83 4.48 2.82 3.71
0.38 3.13 3.71 2.25 3.03
0.25 2.35 2.84 1.64 2.27
0.19 1.91 2.35 1.33 1.86
0.08 1.03 1.33 0.66 1
Graphical representation of cumulative % age passing of fragmentation from
conventional blast against different sieve sizes at bench number-3 is given in Figure 4.65.
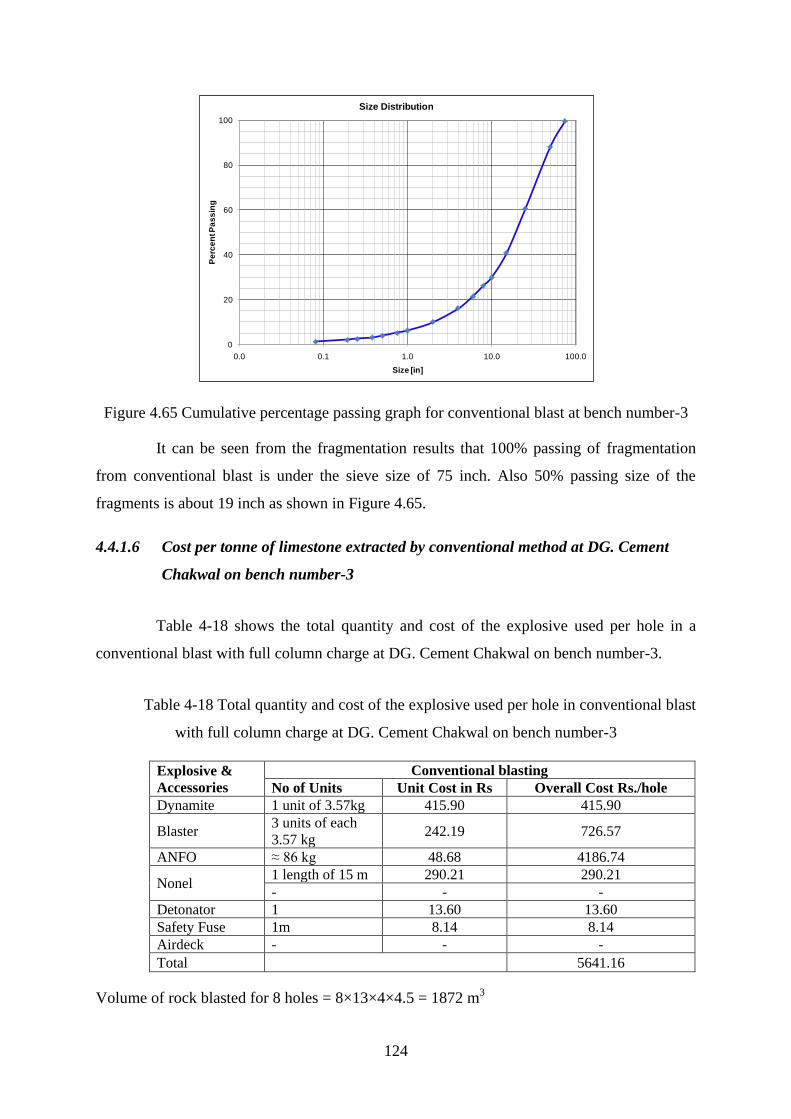
124
Figure 4.65 Cumulative percentage passing graph for conventional blast at bench number-3
It can be seen from the fragmentation results that 100% passing of fragmentation
from conventional blast is under the sieve size of 75 inch. Also 50% passing size of the
fragments is about 19 inch as shown in Figure 4.65.
4.4.1.6 Cost per tonne of limestone extracted by conventional method at DG. Cement
Chakwal on bench number-3
Table 4-18 shows the total quantity and cost of the explosive used per hole in a
conventional blast with full column charge at DG. Cement Chakwal on bench number-3.
Table 4-18 Total quantity and cost of the explosive used per hole in conventional blast
with full column charge at DG. Cement Chakwal on bench number-3
Explosive &
Accessories Conventional blasting
No of Units Unit Cost in Rs Overall Cost Rs./hole Dynamite 1 unit of 3.57kg 415.90 415.90
Blaster 3 units of each
3.57 kg 242.19 726.57
ANFO ≈ 86 kg 48.68 4186.74
Nonel 1 length of 15 m 290.21 290.21 - - -
Detonator 1 13.60 13.60 Safety Fuse 1m 8.14 8.14 Airdeck - - -
Total 5641.16
Volume of rock blasted for 8 holes = 8×13×4×4.5 = 1872 m3
0
20
40
60
80
100
0.0 0.1 1.0 10.0 100.0
Pe
rce
nt P
as
sin
g
Size [in]
Size Distribution
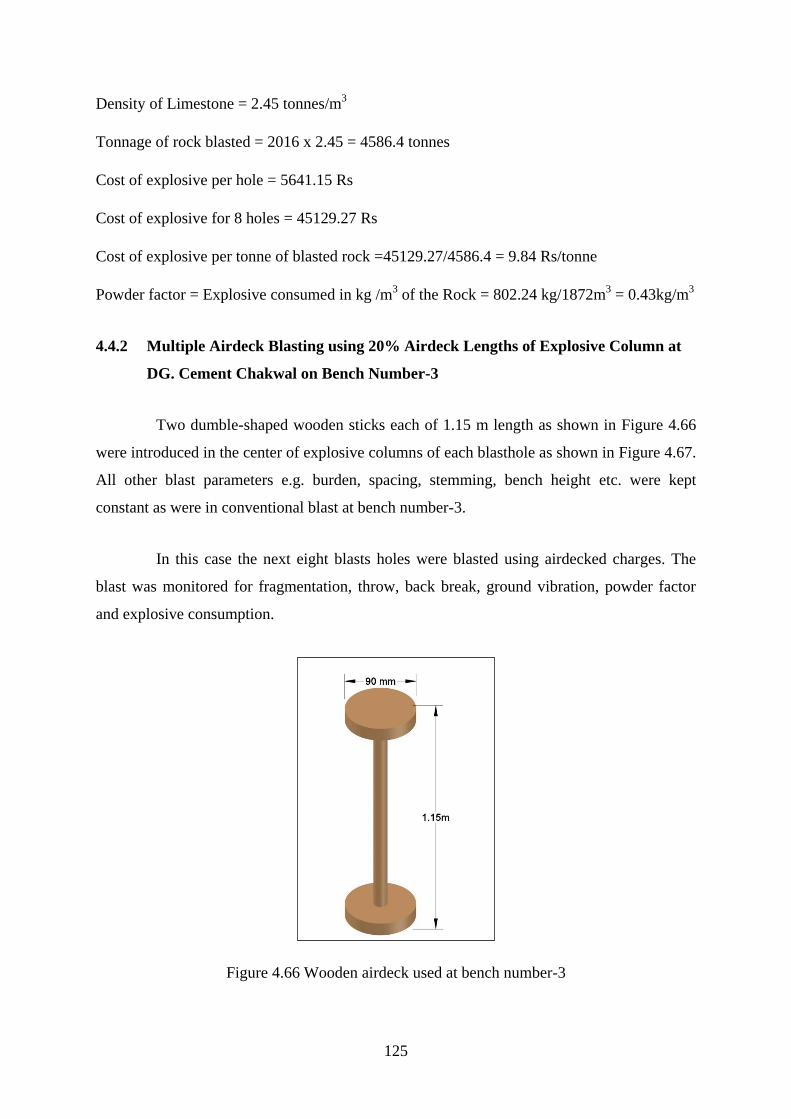
125
Density of Limestone = 2.45 tonnes/m3
Tonnage of rock blasted = 2016 x 2.45 = 4586.4 tonnes
Cost of explosive per hole = 5641.15 Rs
Cost of explosive for 8 holes = 45129.27 Rs
Cost of explosive per tonne of blasted rock =45129.27/4586.4 = 9.84 Rs/tonne
Powder factor = Explosive consumed in kg /m3 of the Rock = 802.24 kg/1872m
3 = 0.43kg/m
3
4.4.2 Multiple Airdeck Blasting using 20% Airdeck Lengths of Explosive Column at
DG. Cement Chakwal on Bench Number-3
Two dumble-shaped wooden sticks each of 1.15 m length as shown in Figure 4.66
were introduced in the center of explosive columns of each blasthole as shown in Figure 4.67.
All other blast parameters e.g. burden, spacing, stemming, bench height etc. were kept
constant as were in conventional blast at bench number-3.
In this case the next eight blasts holes were blasted using airdecked charges. The
blast was monitored for fragmentation, throw, back break, ground vibration, powder factor
and explosive consumption.
Figure 4.66 Wooden airdeck used at bench number-3
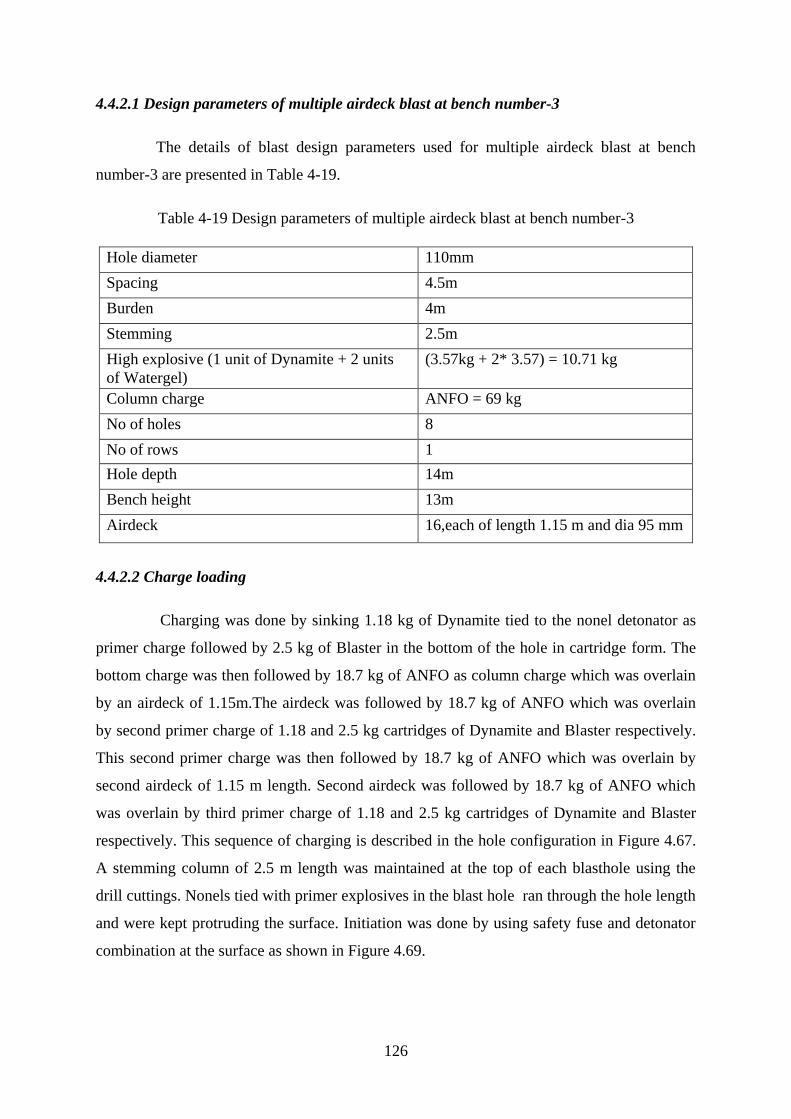
126
4.4.2.1 Design parameters of multiple airdeck blast at bench number-3
The details of blast design parameters used for multiple airdeck blast at bench
number-3 are presented in Table 4-19.
Table 4-19 Design parameters of multiple airdeck blast at bench number-3
Hole diameter 110mm
Spacing 4.5m
Burden 4m
Stemming 2.5m
High explosive (1 unit of Dynamite + 2 units
of Watergel)
(3.57kg + 2* 3.57) = 10.71 kg
Column charge ANFO = 69 kg
No of holes 8
No of rows 1
Hole depth 14m
Bench height 13m
Airdeck 16,each of length 1.15 m and dia 95 mm
4.4.2.2 Charge loading
Charging was done by sinking 1.18 kg of Dynamite tied to the nonel detonator as
primer charge followed by 2.5 kg of Blaster in the bottom of the hole in cartridge form. The
bottom charge was then followed by 18.7 kg of ANFO as column charge which was overlain
by an airdeck of 1.15m.The airdeck was followed by 18.7 kg of ANFO which was overlain
by second primer charge of 1.18 and 2.5 kg cartridges of Dynamite and Blaster respectively.
This second primer charge was then followed by 18.7 kg of ANFO which was overlain by
second airdeck of 1.15 m length. Second airdeck was followed by 18.7 kg of ANFO which
was overlain by third primer charge of 1.18 and 2.5 kg cartridges of Dynamite and Blaster
respectively. This sequence of charging is described in the hole configuration in Figure 4.67.
A stemming column of 2.5 m length was maintained at the top of each blasthole using the
drill cuttings. Nonels tied with primer explosives in the blast hole ran through the hole length
and were kept protruding the surface. Initiation was done by using safety fuse and detonator
combination at the surface as shown in Figure 4.69.
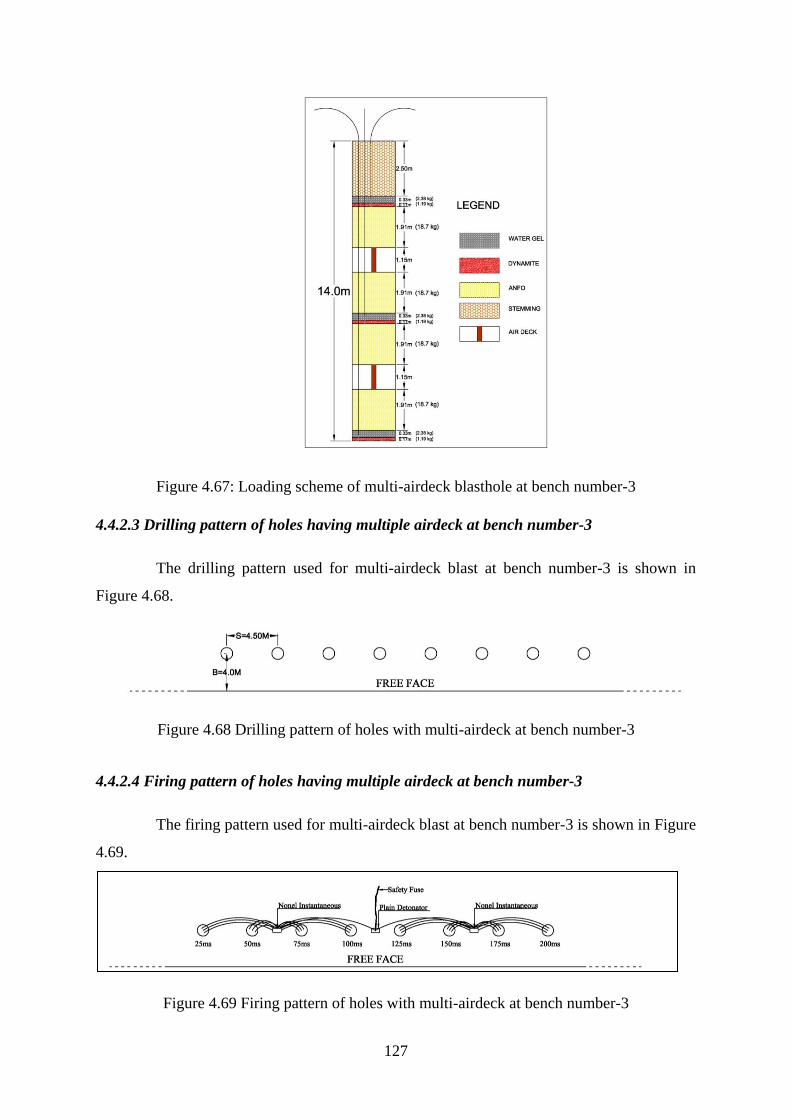
127
Figure 4.67: Loading scheme of multi-airdeck blasthole at bench number-3
4.4.2.3 Drilling pattern of holes having multiple airdeck at bench number-3
The drilling pattern used for multi-airdeck blast at bench number-3 is shown in
Figure 4.68.
Figure 4.68 Drilling pattern of holes with multi-airdeck at bench number-3
4.4.2.4 Firing pattern of holes having multiple airdeck at bench number-3
The firing pattern used for multi-airdeck blast at bench number-3 is shown in Figure
4.69.
Figure 4.69 Firing pattern of holes with multi-airdeck at bench number-3
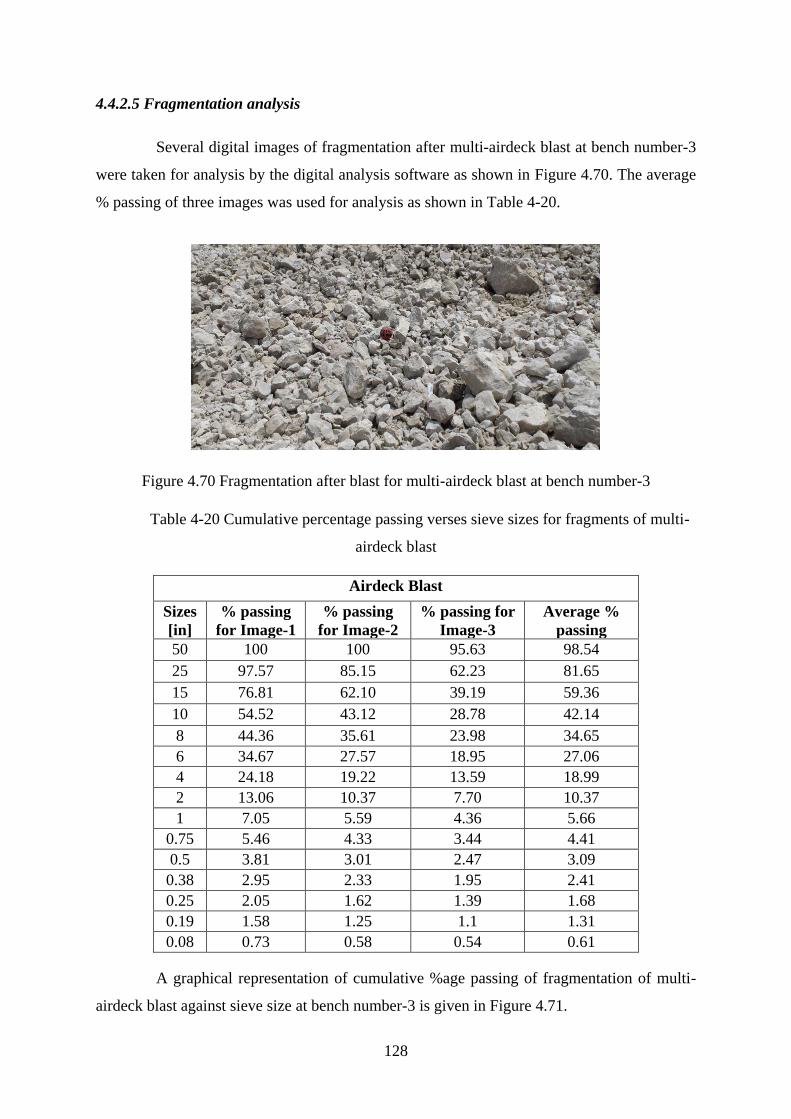
128
4.4.2.5 Fragmentation analysis
Several digital images of fragmentation after multi-airdeck blast at bench number-3
were taken for analysis by the digital analysis software as shown in Figure 4.70. The average
% passing of three images was used for analysis as shown in Table 4-20.
Figure 4.70 Fragmentation after blast for multi-airdeck blast at bench number-3
Table 4-20 Cumulative percentage passing verses sieve sizes for fragments of multi-
airdeck blast
Airdeck Blast
Sizes
[in]
% passing
for Image-1
% passing
for Image-2
% passing for
Image-3
Average %
passing
50 100 100 95.63 98.54
25 97.57 85.15 62.23 81.65
15 76.81 62.10 39.19 59.36
10 54.52 43.12 28.78 42.14
8 44.36 35.61 23.98 34.65
6 34.67 27.57 18.95 27.06
4 24.18 19.22 13.59 18.99
2 13.06 10.37 7.70 10.37
1 7.05 5.59 4.36 5.66
0.75 5.46 4.33 3.44 4.41
0.5 3.81 3.01 2.47 3.09
0.38 2.95 2.33 1.95 2.41
0.25 2.05 1.62 1.39 1.68
0.19 1.58 1.25 1.1 1.31
0.08 0.73 0.58 0.54 0.61
A graphical representation of cumulative %age passing of fragmentation of multi-
airdeck blast against sieve size at bench number-3 is given in Figure 4.71.
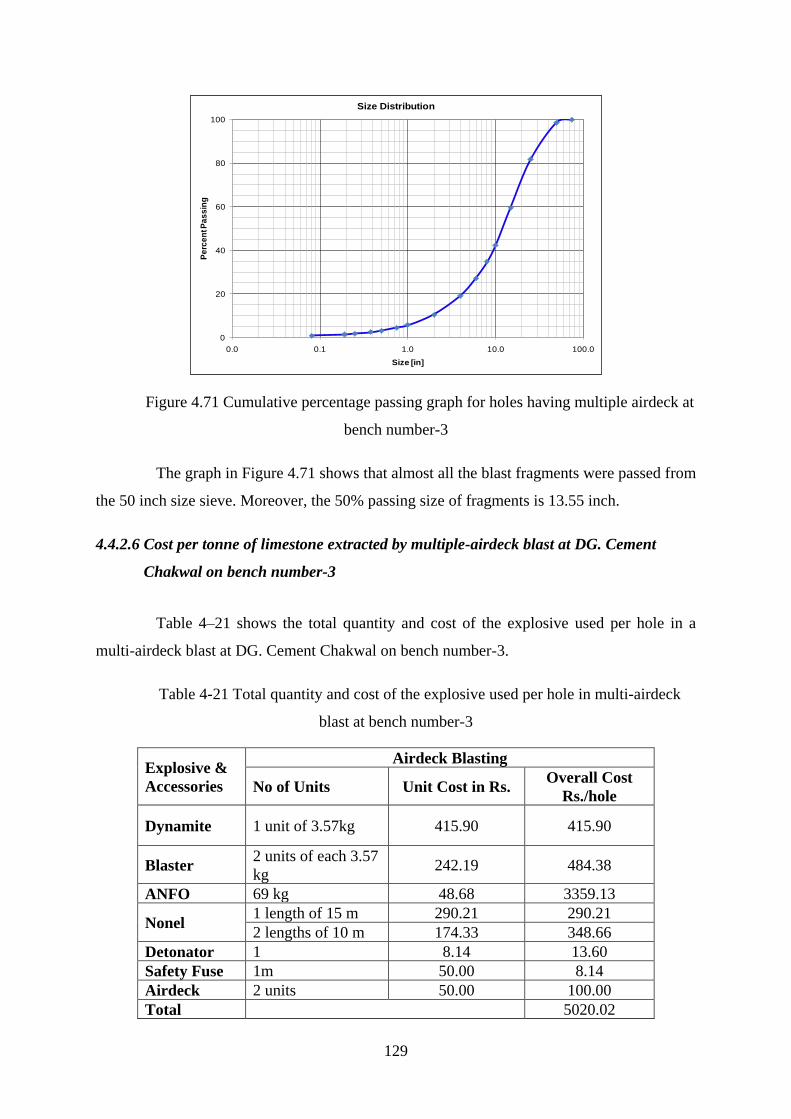
129
Figure 4.71 Cumulative percentage passing graph for holes having multiple airdeck at
bench number-3
The graph in Figure 4.71 shows that almost all the blast fragments were passed from
the 50 inch size sieve. Moreover, the 50% passing size of fragments is 13.55 inch.
4.4.2.6 Cost per tonne of limestone extracted by multiple-airdeck blast at DG. Cement
Chakwal on bench number-3
Table 4–21 shows the total quantity and cost of the explosive used per hole in a
multi-airdeck blast at DG. Cement Chakwal on bench number-3.
Table 4-21 Total quantity and cost of the explosive used per hole in multi-airdeck
blast at bench number-3
Explosive &
Accessories
Airdeck Blasting
No of Units Unit Cost in Rs. Overall Cost
Rs./hole
Dynamite 1 unit of 3.57kg 415.90 415.90
Blaster 2 units of each 3.57
kg 242.19 484.38
ANFO 69 kg 48.68 3359.13
Nonel 1 length of 15 m 290.21 290.21
2 lengths of 10 m 174.33 348.66
Detonator 1 8.14 13.60
Safety Fuse 1m 50.00 8.14
Airdeck 2 units 50.00 100.00
Total 5020.02
0
20
40
60
80
100
0.0 0.1 1.0 10.0 100.0
Pe
rce
nt P
as
sin
g
Size [in]
Size Distribution
130
Volume of rock blasted for 8 holes = 8×13×4×4.5 = 1872 m3
Density of limestone = 2.45 tonnes/m3
Tonnage of rock blasted = 1872×2.45=4586.4 tonnes
Cost of explosive per hole =5020.0 Rs
Cost of explosive for 8 holes =40160.12 Rs
Cost of explosive per tonne of blasted rock = 40160.12/4586.4 = 8.7 Rs/tonne
Powder Factor = Explosive consumed in kg /m3 of the Rock
= 589.68kg/1872 m3 =0.31 kg/m
3
Saving per tonne = Cost of explosive per tonne of rock - Cost of explosive per tonne of rock
(Conventional blast) (Airdeck blast)
Saving per tonne = 9.84 – 8.7 = 1.14 Rs per tonne
It means 4586.4 tonnes of rock has been blasted for both the blasts at bench
number- 3, but the explosive consumed per hole is less for airdecked blast as compared to
conventional blast.
4.4.3 Comparison of Blast Performance of all the Shots Fired at Bench Number-3
4.4.3.1 % reduction in fragment size with respect to FXO series by using multi- airdeck
in explosive column at bench number-3
The average sieve sizes of three images from both the blasts at bench number-3
were taken for comparison as shown in the Table 4-22.
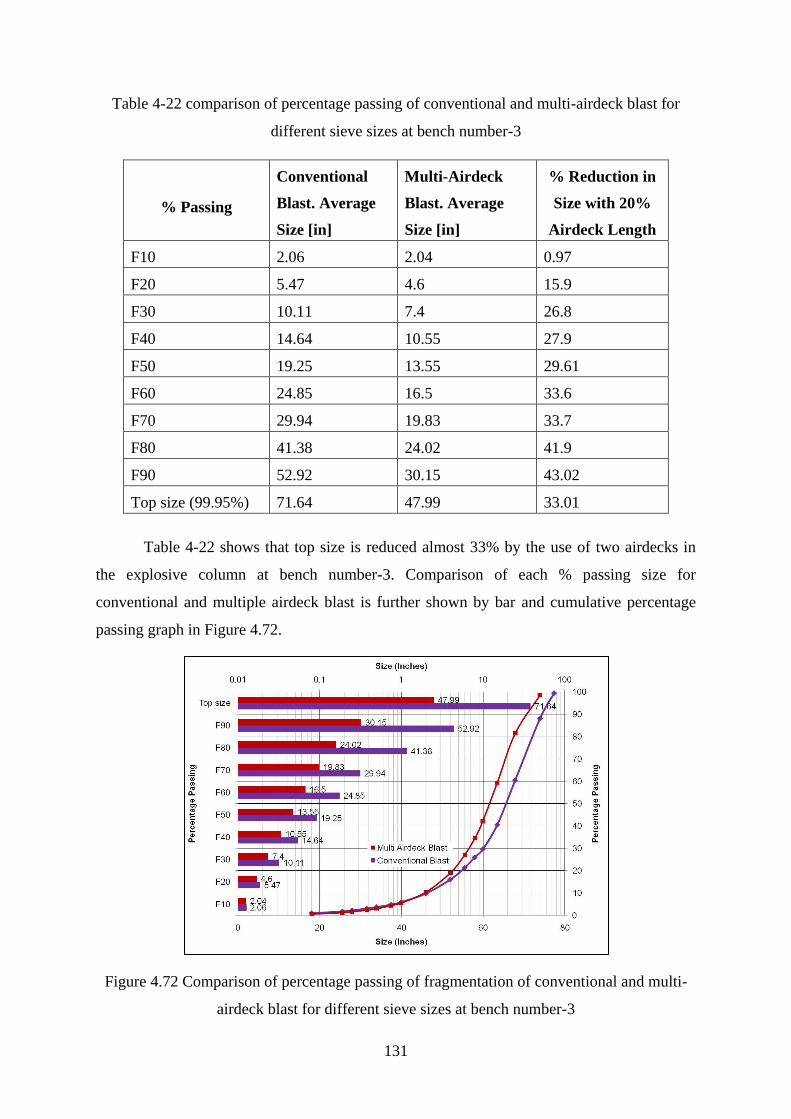
131
Table 4-22 comparison of percentage passing of conventional and multi-airdeck blast for
different sieve sizes at bench number-3
% Passing
Conventional
Blast. Average
Size [in]
Multi-Airdeck
Blast. Average
Size [in]
% Reduction in
Size with 20%
Airdeck Length
F10 2.06 2.04 0.97
F20 5.47 4.6 15.9
F30 10.11 7.4 26.8
F40 14.64 10.55 27.9
F50 19.25 13.55 29.61
F60 24.85 16.5 33.6
F70 29.94 19.83 33.7
F80 41.38 24.02 41.9
F90 52.92 30.15 43.02
Top size (99.95%) 71.64 47.99 33.01
Table 4-22 shows that top size is reduced almost 33% by the use of two airdecks in
the explosive column at bench number-3. Comparison of each % passing size for
conventional and multiple airdeck blast is further shown by bar and cumulative percentage
passing graph in Figure 4.72.
Figure 4.72 Comparison of percentage passing of fragmentation of conventional and multi-
airdeck blast for different sieve sizes at bench number-3
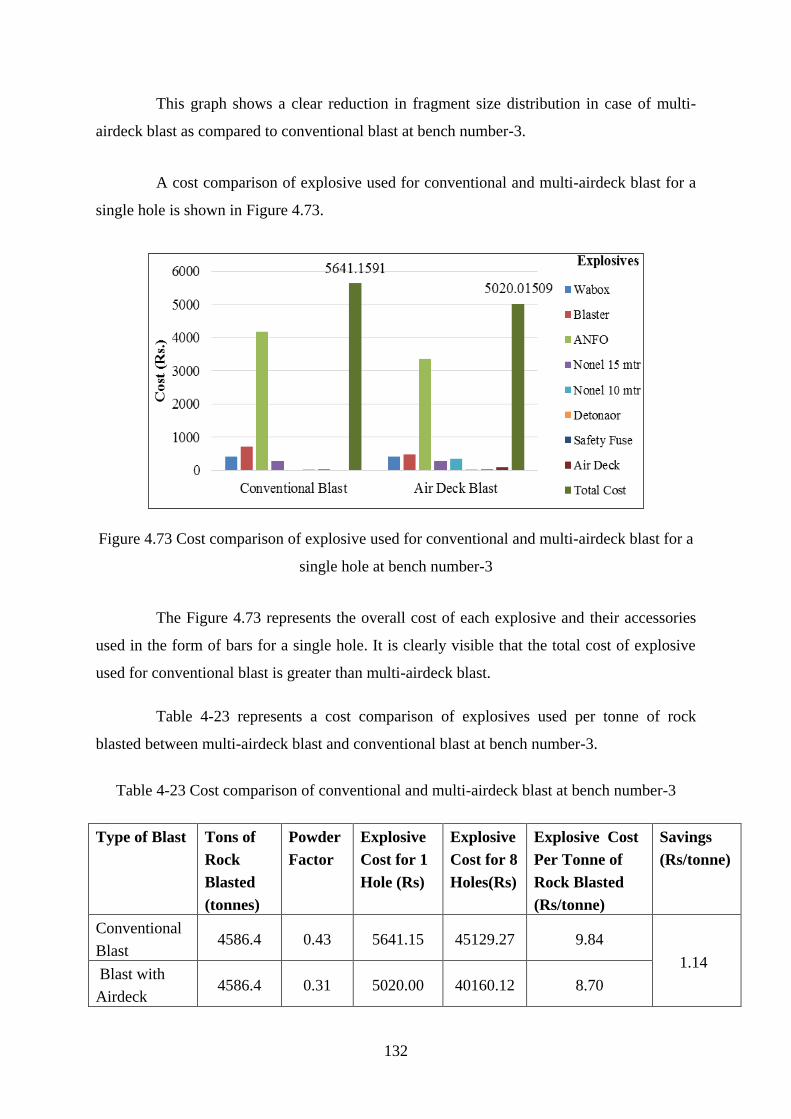
132
This graph shows a clear reduction in fragment size distribution in case of multi-
airdeck blast as compared to conventional blast at bench number-3.
A cost comparison of explosive used for conventional and multi-airdeck blast for a
single hole is shown in Figure 4.73.
Figure 4.73 Cost comparison of explosive used for conventional and multi-airdeck blast for a
single hole at bench number-3
The Figure 4.73 represents the overall cost of each explosive and their accessories
used in the form of bars for a single hole. It is clearly visible that the total cost of explosive
used for conventional blast is greater than multi-airdeck blast.
Table 4-23 represents a cost comparison of explosives used per tonne of rock
blasted between multi-airdeck blast and conventional blast at bench number-3.
Table 4-23 Cost comparison of conventional and multi-airdeck blast at bench number-3
Type of Blast Tons of
Rock
Blasted
(tonnes)
Powder
Factor
Explosive
Cost for 1
Hole (Rs)
Explosive
Cost for 8
Holes(Rs)
Explosive Cost
Per Tonne of
Rock Blasted
(Rs/tonne)
Savings
(Rs/tonne)
Conventional
Blast 4586.4 0.43 5641.15 45129.27 9.84
1.14 Blast with
Airdeck 4586.4 0.31 5020.00 40160.12 8.70
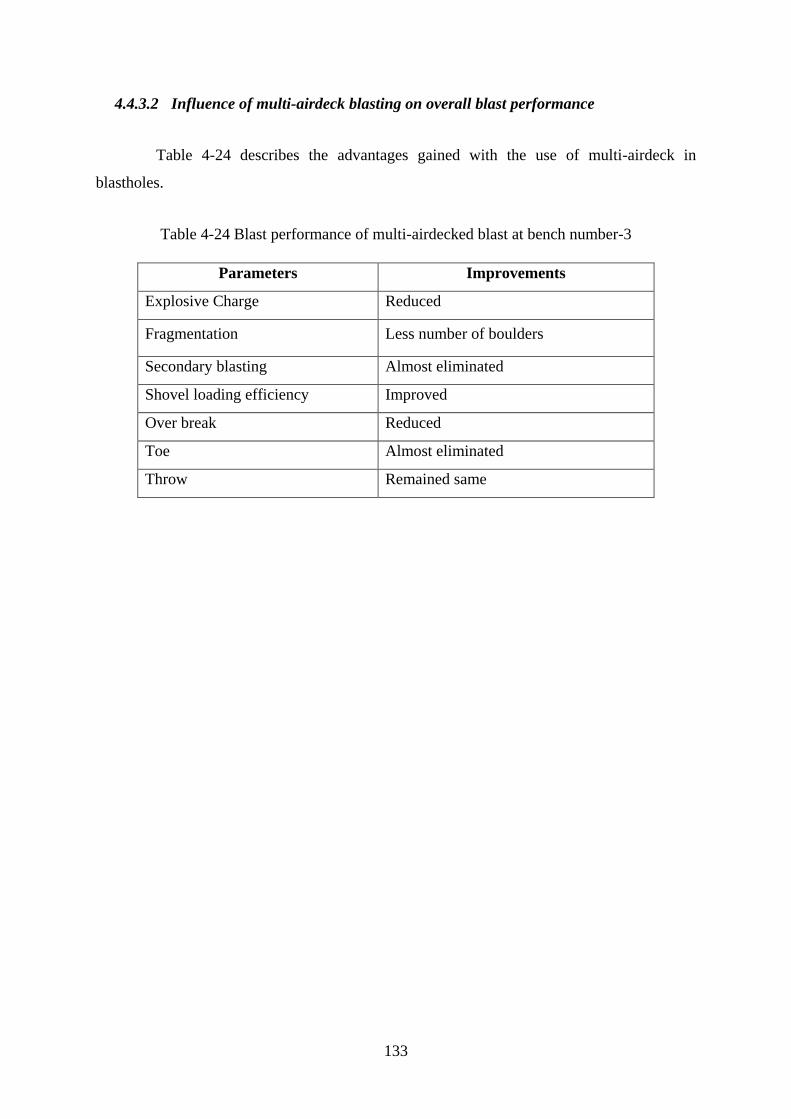
133
4.4.3.2 Influence of multi-airdeck blasting on overall blast performance
Table 4-24 describes the advantages gained with the use of multi-airdeck in
blastholes.
Table 4-24 Blast performance of multi-airdecked blast at bench number-3
Parameters Improvements
Explosive Charge Reduced
Fragmentation Less number of boulders
Secondary blasting Almost eliminated
Shovel loading efficiency Improved
Over break Reduced
Toe Almost eliminated
Throw Remained same
134
CHAPTER 5.
VALIDATION AT ASKARI CEMENT NIZAMPUR
5.1 ASKARI CEMENT NIZAMPUR
After conducting successful experimentation on actual heterogeneous and
anisotropic rock material at DG. Cement Chakwal, the next step was to validate and verify
the applicability of these tests at some other limestone quarries in Pakistan. In order to further
validate the results, permission was obtained from the management of Askari Cement to
perform experiments at Askari Cement quarry Nizampur. To proceed further, all the required
information regarding present blasting practice, stratigraphy and geology at Askari Cement
quarry Nizampur was acquired and assessed thoroughly. The details of the site are given in
the following text.
5.1.1 Location and Accessibility
Askari cement factory was established in Nizampur, in the Khyber Phakhtoon
Khawa province (earlier known as North Western Frontier Province) of Pakistan and can
produce approximately 6000 tons of limestone daily. Its location according to Geological
Survey of Pakistan topographic sheet No. 43 C/1 is: longitude 72 2‘ 00‖ to 72o 6‘ 00‖ and
latitude 33 47‘ 30‖ to 33 49‘ 00‖. It is bounded between the village of Assukhel and Kahi
and is located about 20 km south west of old and about 24 km from the new Attock Bridge
and 8 km to the north east of Nizampur village. It lies within the administrative boundary of
District Nowshera. The area is approachable by a metalled road which bifurcates from the
G.T. road near the old Attock Bridge and runs parallel to the Indus River through the project
area and leads to Nizampur. The area has no rail link. The nearest railway station is
Khairabad.
5.1.2 General Geology
The investigated area is the north western (Trans Indus) extension of the Kala Chita
range. It is mostly underlain by sedimentary rocks which range in age from Jurassic to
Quaternary. The general strike trend of the rock is nearly east –west with a gentle to moderate
dip toward south. The rock in this area is highly folded with a few thrust and strike slip faults.

135
The highest elevation in this area is 387 m above mean sea level and lowest elevation is 300
m above mean sea level. The area is drained by dendritic drainage pattern in which the flow
is like tree branches. The direction of flow of all seasonal water channel are south-wards,
which ultimately fall in River Indus.
5.1.2.1 Stratigraphy of DG. Cement Chakwal
Table 5-1describes the stratigraphical sequence of the site at Askari Cement Nizampur.
Table 5-1 Stratigraphical sequence of the site at Askari Cement Nizampur
For the manufacture of Portland cement the possible calcareous materials including
limestone of Samamasuk, Lumshiwal, Lockhart and Patala formation can be considered,
Age Rock Unit Thickness Lithology
Quaternary Surficial
deposit 0.30 m
Undifferentiated surficial deposits
consisting of alluvium clay boulders
and other clay boulders and other
clayey material.
Eocene Middle
Murree
Formation
and Eocene
200m Dark red and purple alternation of clay
and sand stone beds.
Late Paleocene
to Early Eocene
Patala
Formation 10m-150m
Greenish grey to yellowish brown
shale with inter bedded limestone.
Later Paleocene Lockhart 10-200m Light grey to dark grey thin to
medium bedded, nodular limestone.
Late Cretaceous Kawagarh
Formation 15-100m
Yellowish grey to brownish grey thin
marl with cleaved calcareous shale.
Early
Cretaceous
Lumshiwal
Formation 5-30m
Light to dark grey glauconitic
limestone and sandstone, with reddish
brown quartzite.
Early
Cretaceous
Chichali
Formation 5-15m
Dark green to greenish grey
glauconitic sandstone with black
shale.
Jurassic Samanasuk
Formation 20-150m
Light grey to yellowish brown, hard
limestone.
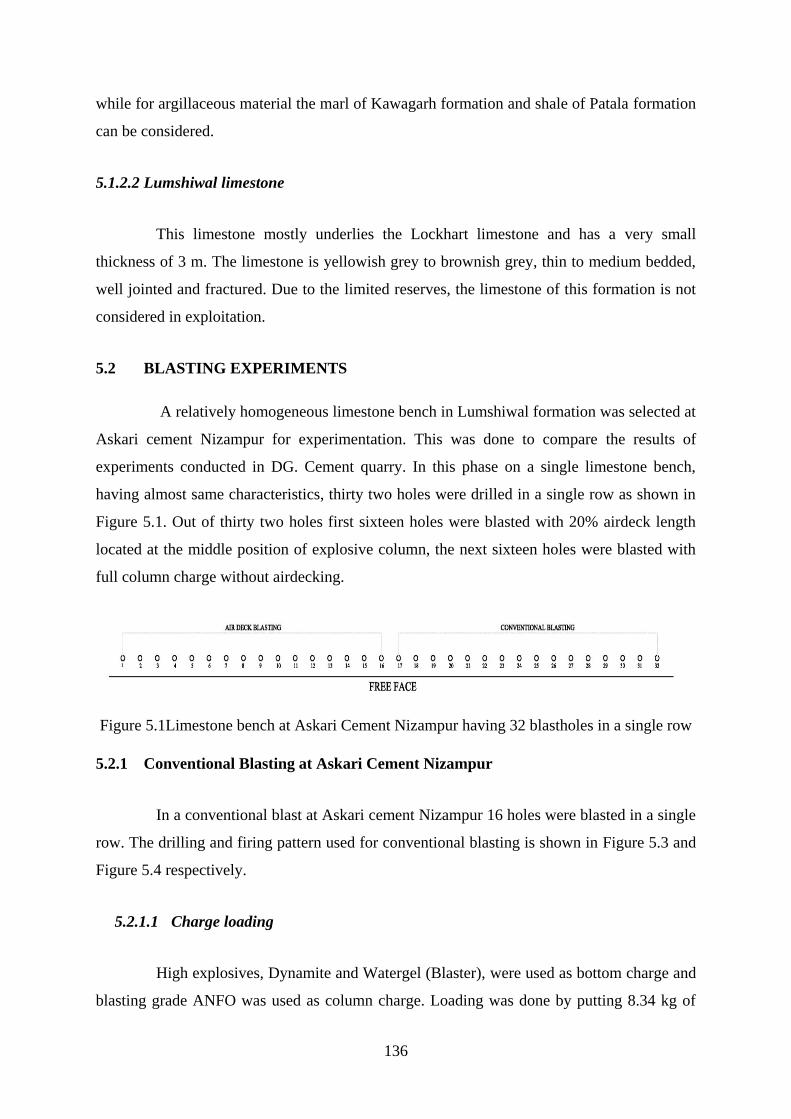
136
while for argillaceous material the marl of Kawagarh formation and shale of Patala formation
can be considered.
5.1.2.2 Lumshiwal limestone
This limestone mostly underlies the Lockhart limestone and has a very small
thickness of 3 m. The limestone is yellowish grey to brownish grey, thin to medium bedded,
well jointed and fractured. Due to the limited reserves, the limestone of this formation is not
considered in exploitation.
5.2 BLASTING EXPERIMENTS
A relatively homogeneous limestone bench in Lumshiwal formation was selected at
Askari cement Nizampur for experimentation. This was done to compare the results of
experiments conducted in DG. Cement quarry. In this phase on a single limestone bench,
having almost same characteristics, thirty two holes were drilled in a single row as shown in
Figure 5.1. Out of thirty two holes first sixteen holes were blasted with 20% airdeck length
located at the middle position of explosive column, the next sixteen holes were blasted with
full column charge without airdecking.
Figure 5.1Limestone bench at Askari Cement Nizampur having 32 blastholes in a single row
5.2.1 Conventional Blasting at Askari Cement Nizampur
In a conventional blast at Askari cement Nizampur 16 holes were blasted in a single
row. The drilling and firing pattern used for conventional blasting is shown in Figure 5.3 and
Figure 5.4 respectively.
5.2.1.1 Charge loading
High explosives, Dynamite and Watergel (Blaster), were used as bottom charge and
blasting grade ANFO was used as column charge. Loading was done by putting 8.34 kg of
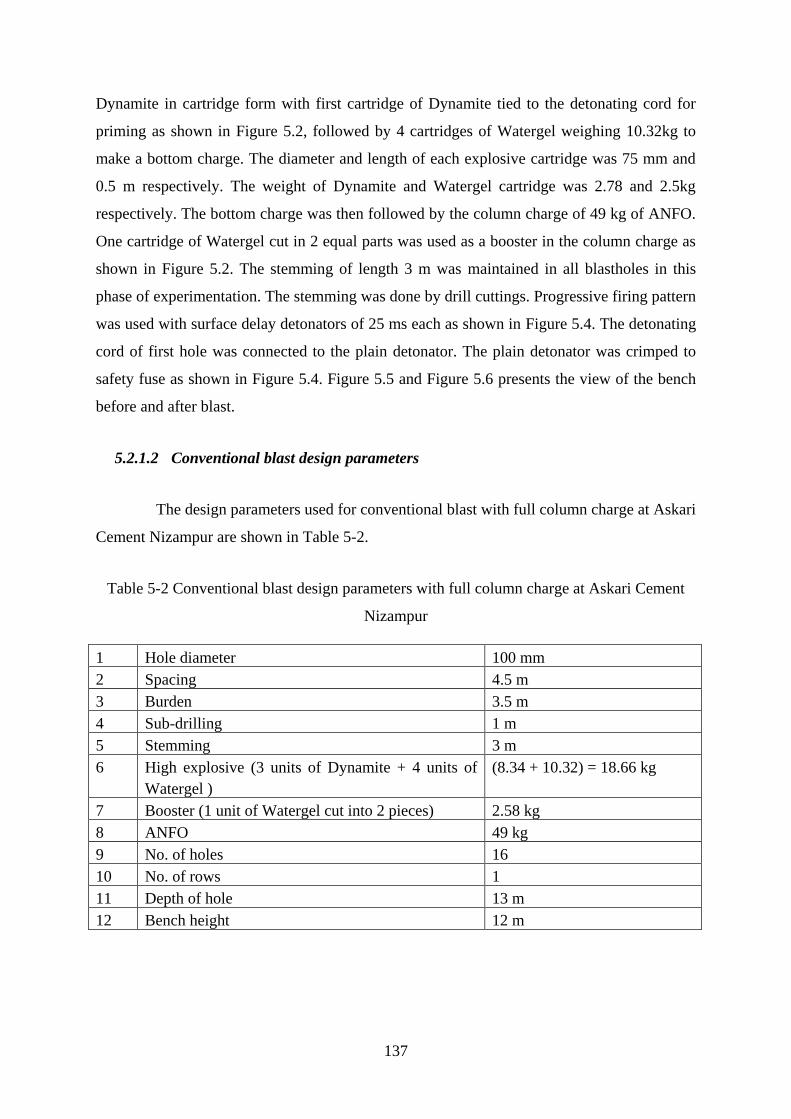
137
Dynamite in cartridge form with first cartridge of Dynamite tied to the detonating cord for
priming as shown in Figure 5.2, followed by 4 cartridges of Watergel weighing 10.32kg to
make a bottom charge. The diameter and length of each explosive cartridge was 75 mm and
0.5 m respectively. The weight of Dynamite and Watergel cartridge was 2.78 and 2.5kg
respectively. The bottom charge was then followed by the column charge of 49 kg of ANFO.
One cartridge of Watergel cut in 2 equal parts was used as a booster in the column charge as
shown in Figure 5.2. The stemming of length 3 m was maintained in all blastholes in this
phase of experimentation. The stemming was done by drill cuttings. Progressive firing pattern
was used with surface delay detonators of 25 ms each as shown in Figure 5.4. The detonating
cord of first hole was connected to the plain detonator. The plain detonator was crimped to
safety fuse as shown in Figure 5.4. Figure 5.5 and Figure 5.6 presents the view of the bench
before and after blast.
5.2.1.2 Conventional blast design parameters
The design parameters used for conventional blast with full column charge at Askari
Cement Nizampur are shown in Table 5-2.
Table 5-2 Conventional blast design parameters with full column charge at Askari Cement
Nizampur
1 Hole diameter 100 mm
2 Spacing 4.5 m
3 Burden 3.5 m
4 Sub-drilling 1 m
5 Stemming 3 m
6 High explosive (3 units of Dynamite + 4 units of
Watergel )
(8.34 + 10.32) = 18.66 kg
7 Booster (1 unit of Watergel cut into 2 pieces) 2.58 kg
8 ANFO 49 kg
9 No. of holes 16
10 No. of rows 1
11 Depth of hole 13 m
12 Bench height 12 m
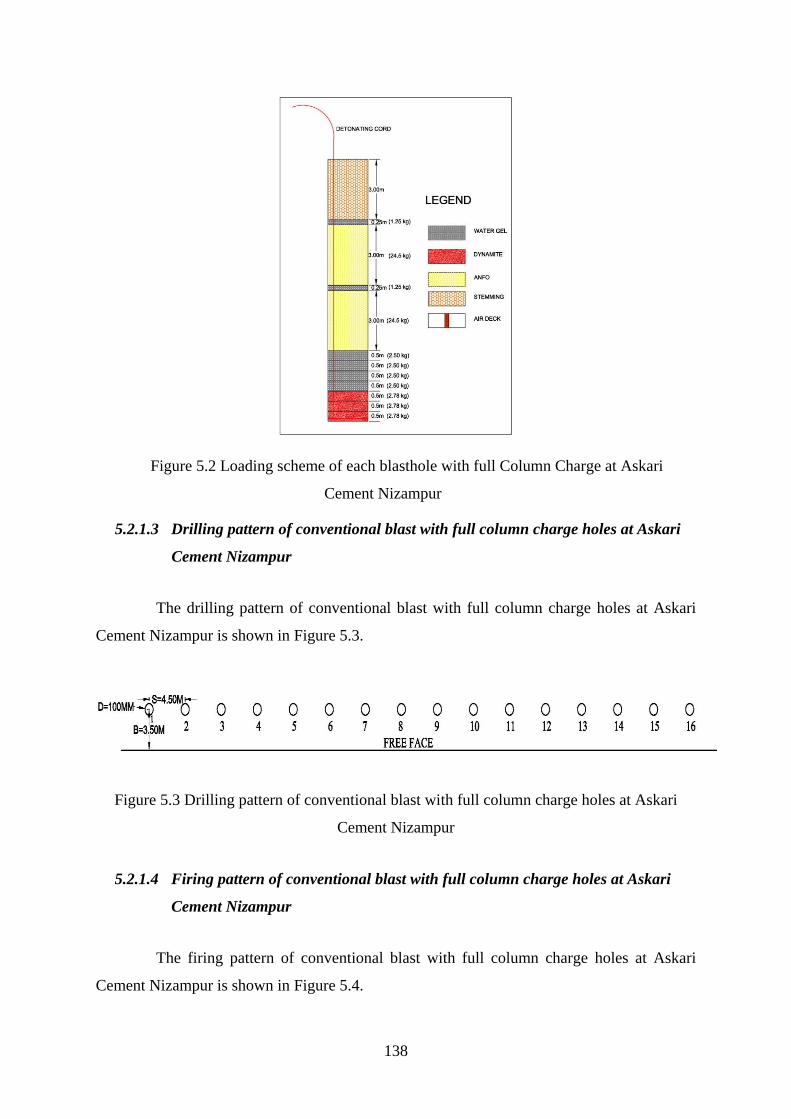
138
Figure 5.2 Loading scheme of each blasthole with full Column Charge at Askari
Cement Nizampur
5.2.1.3 Drilling pattern of conventional blast with full column charge holes at Askari
Cement Nizampur
The drilling pattern of conventional blast with full column charge holes at Askari
Cement Nizampur is shown in Figure 5.3.
Figure 5.3 Drilling pattern of conventional blast with full column charge holes at Askari
Cement Nizampur
5.2.1.4 Firing pattern of conventional blast with full column charge holes at Askari
Cement Nizampur
The firing pattern of conventional blast with full column charge holes at Askari
Cement Nizampur is shown in Figure 5.4.
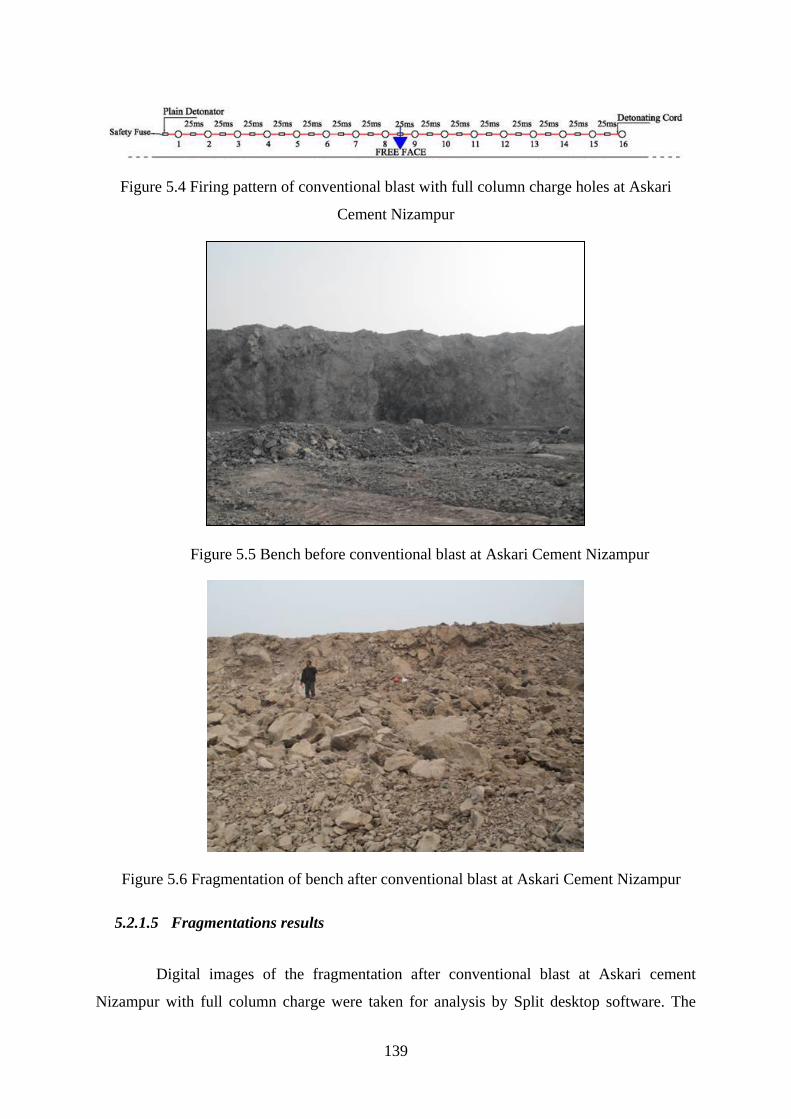
139
Figure 5.4 Firing pattern of conventional blast with full column charge holes at Askari
Cement Nizampur
Figure 5.5 Bench before conventional blast at Askari Cement Nizampur
Figure 5.6 Fragmentation of bench after conventional blast at Askari Cement Nizampur
5.2.1.5 Fragmentations results
Digital images of the fragmentation after conventional blast at Askari cement
Nizampur with full column charge were taken for analysis by Split desktop software. The
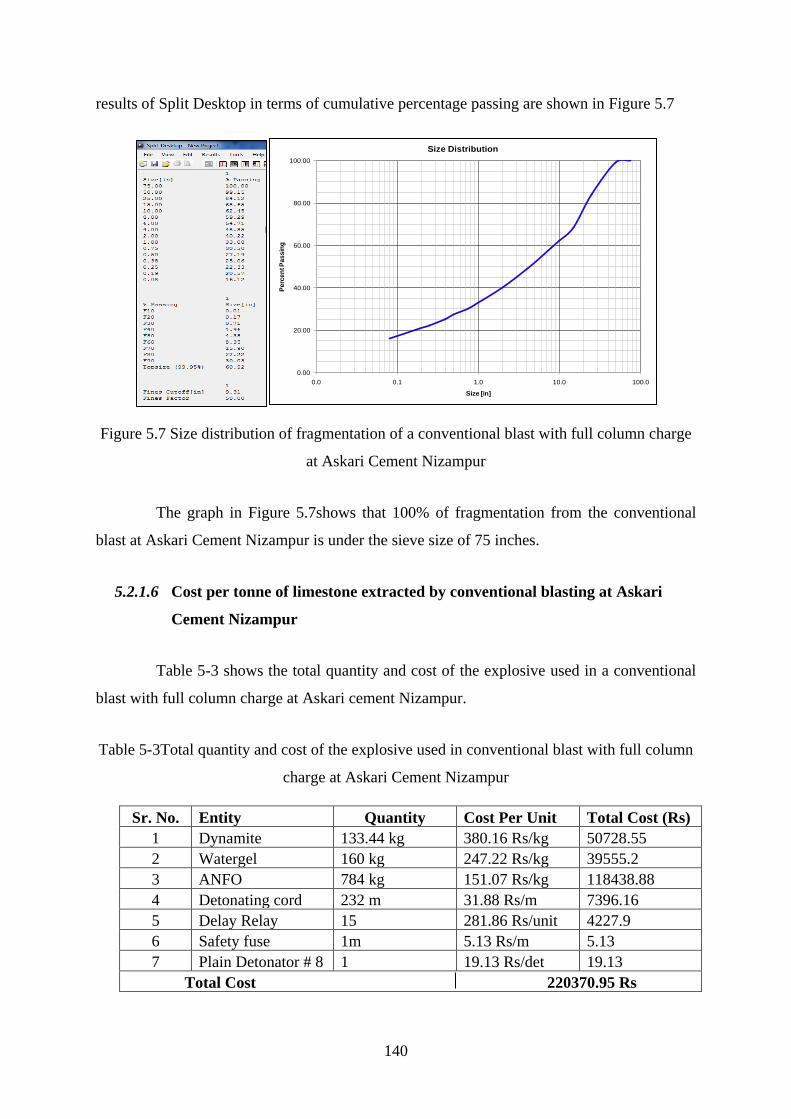
140
results of Split Desktop in terms of cumulative percentage passing are shown in Figure 5.7
Figure 5.7 Size distribution of fragmentation of a conventional blast with full column charge
at Askari Cement Nizampur
The graph in Figure 5.7shows that 100% of fragmentation from the conventional
blast at Askari Cement Nizampur is under the sieve size of 75 inches.
5.2.1.6 Cost per tonne of limestone extracted by conventional blasting at Askari
Cement Nizampur
Table 5-3 shows the total quantity and cost of the explosive used in a conventional
blast with full column charge at Askari cement Nizampur.
Table 5-3Total quantity and cost of the explosive used in conventional blast with full column
charge at Askari Cement Nizampur
Sr. No. Entity Quantity Cost Per Unit Total Cost (Rs)
1 Dynamite 133.44 kg 380.16 Rs/kg 50728.55
2 Watergel 160 kg 247.22 Rs/kg 39555.2
3 ANFO 784 kg 151.07 Rs/kg 118438.88
4 Detonating cord 232 m 31.88 Rs/m 7396.16
5 Delay Relay 15 281.86 Rs/unit 4227.9
6 Safety fuse 1m 5.13 Rs/m 5.13
7 Plain Detonator # 8 1 19.13 Rs/det 19.13
Total Cost 220370.95 Rs
0.00
20.00
40.00
60.00
80.00
100.00
0.0 0.1 1.0 10.0 100.0
Pe
rce
nt P
as
sin
g
Size [in]
Size Distribution

141
Total volume blasted = 3.5 x 4.5 x 12 x 16
= 3024 m3
Total tonnage blasted= 3024 x 2.7
= 8164.8 tonnes
(Where density of limestone = 2.7 tonnes/m3)
Explosives Consumed= Dynamite + Watergel + ANFO
=133.44+160+784=1077.44 kg
Powder Factor = Explosive Consumed (kg)/Rock Blasted (m3)
=1077.44/3024
=0.36 kg/m3
Cost of explosives per tonne of rock blasted = Total cost of explosives/Tonnes of rock
blasted
=220370.95/8164.8
= 25 Rs/tonne
5.2.2 Modified Blast using 20% Airdeck Length at Middle of the Explosive Column at
Askari Cement Nizampur
In order to determine the effect of airdeck on fragmentation, all blast design
parameters like bench height, hole length, stemming length, hole dia, burden, spacing, type of
rock and type of explosive were kept constant for conventional and airdeck blast other than
introducing a wooden plug or spacer at the middle position of the explosive column in case of
modified 20% mid-airdeck blast.
In this test, in each blasthole a wooden plug of 2 m length was introduced at the
middle of the explosive column to create an air space equivalent to 20% of explosive charge
length. This airdeck at the middle of the explosive column reduced the consumption of
explosive by 20%. The wooden plug used in the experimentation is shown in the Figure 5.8.
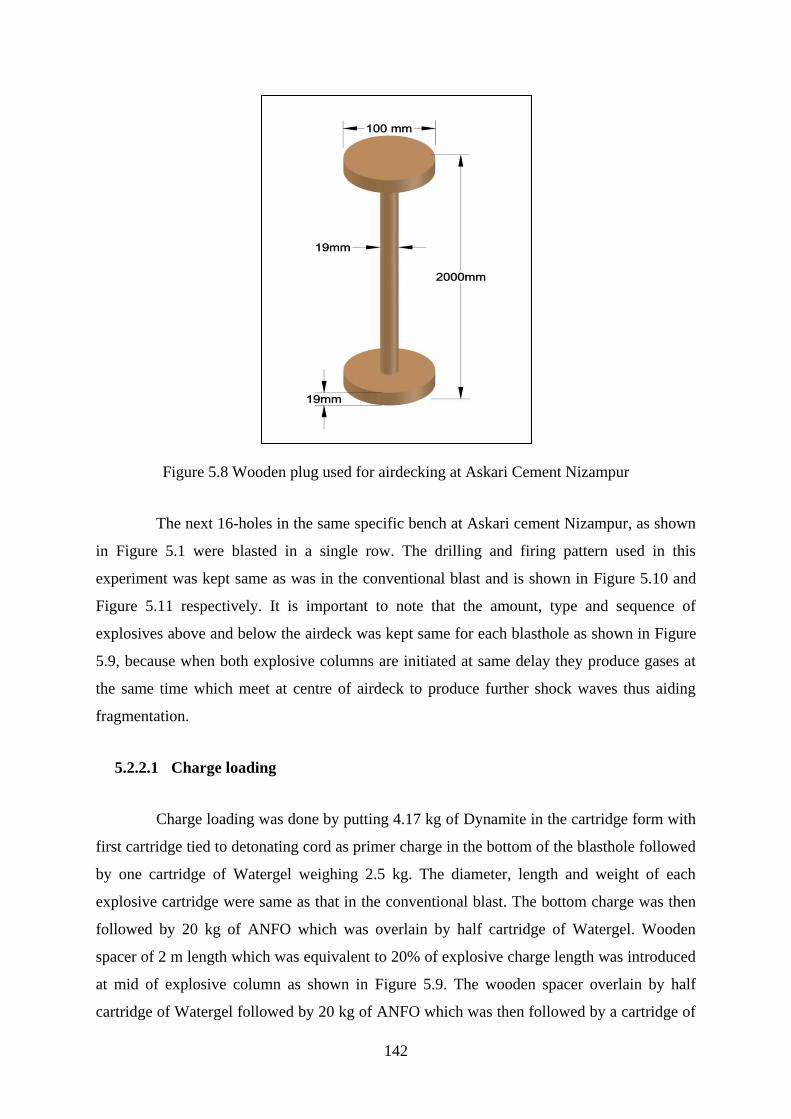
142
Figure 5.8 Wooden plug used for airdecking at Askari Cement Nizampur
The next 16-holes in the same specific bench at Askari cement Nizampur, as shown
in Figure 5.1 were blasted in a single row. The drilling and firing pattern used in this
experiment was kept same as was in the conventional blast and is shown in Figure 5.10 and
Figure 5.11 respectively. It is important to note that the amount, type and sequence of
explosives above and below the airdeck was kept same for each blasthole as shown in Figure
5.9, because when both explosive columns are initiated at same delay they produce gases at
the same time which meet at centre of airdeck to produce further shock waves thus aiding
fragmentation.
5.2.2.1 Charge loading
Charge loading was done by putting 4.17 kg of Dynamite in the cartridge form with
first cartridge tied to detonating cord as primer charge in the bottom of the blasthole followed
by one cartridge of Watergel weighing 2.5 kg. The diameter, length and weight of each
explosive cartridge were same as that in the conventional blast. The bottom charge was then
followed by 20 kg of ANFO which was overlain by half cartridge of Watergel. Wooden
spacer of 2 m length which was equivalent to 20% of explosive charge length was introduced
at mid of explosive column as shown in Figure 5.9. The wooden spacer overlain by half
cartridge of Watergel followed by 20 kg of ANFO which was then followed by a cartridge of
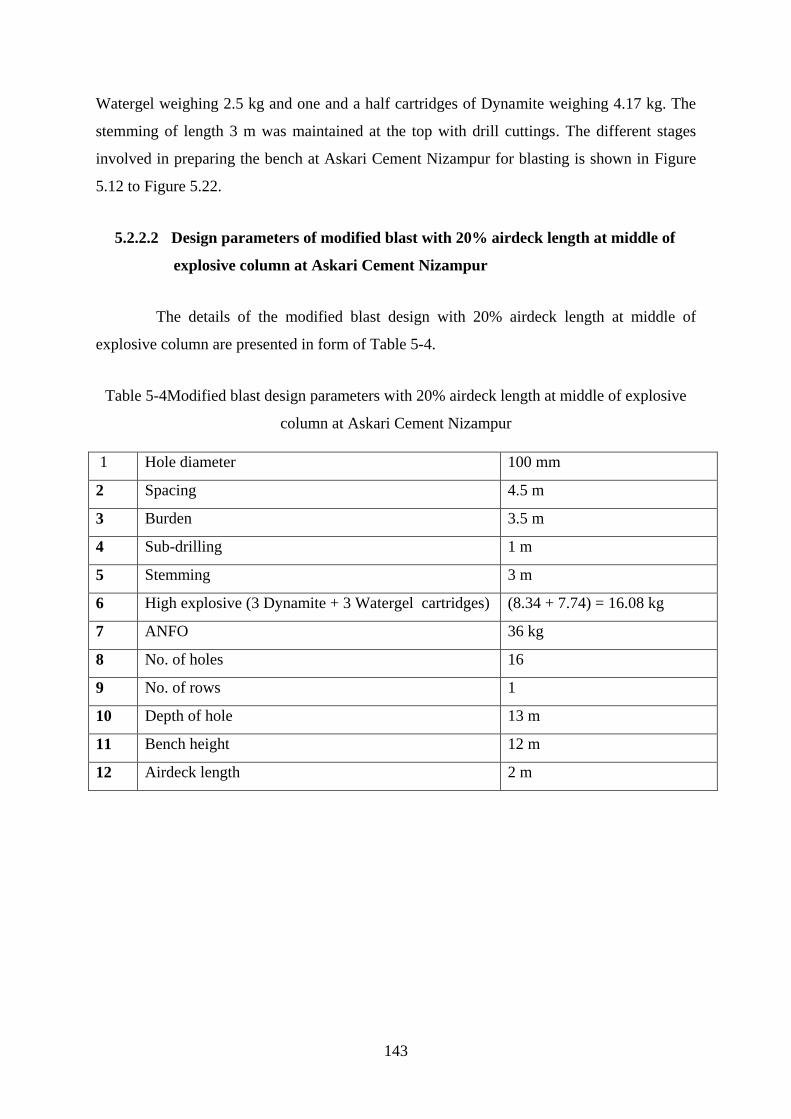
143
Watergel weighing 2.5 kg and one and a half cartridges of Dynamite weighing 4.17 kg. The
stemming of length 3 m was maintained at the top with drill cuttings. The different stages
involved in preparing the bench at Askari Cement Nizampur for blasting is shown in Figure
5.12 to Figure 5.22.
5.2.2.2 Design parameters of modified blast with 20% airdeck length at middle of
explosive column at Askari Cement Nizampur
The details of the modified blast design with 20% airdeck length at middle of
explosive column are presented in form of Table 5-4.
Table 5-4Modified blast design parameters with 20% airdeck length at middle of explosive
column at Askari Cement Nizampur
1 Hole diameter 100 mm
2 Spacing 4.5 m
3 Burden 3.5 m
4 Sub-drilling 1 m
5 Stemming 3 m
6 High explosive (3 Dynamite + 3 Watergel cartridges) (8.34 + 7.74) = 16.08 kg
7 ANFO 36 kg
8 No. of holes 16
9 No. of rows 1
10 Depth of hole 13 m
11 Bench height 12 m
12 Airdeck length 2 m
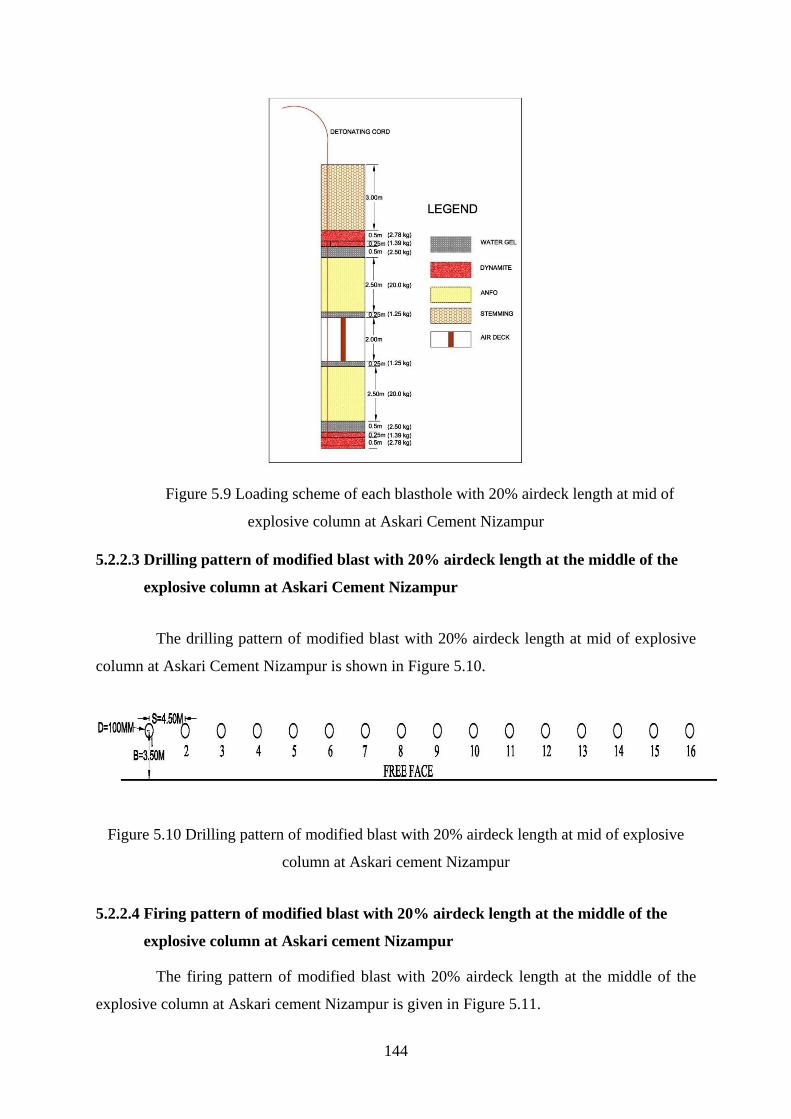
144
Figure 5.9 Loading scheme of each blasthole with 20% airdeck length at mid of
explosive column at Askari Cement Nizampur
5.2.2.3 Drilling pattern of modified blast with 20% airdeck length at the middle of the
explosive column at Askari Cement Nizampur
The drilling pattern of modified blast with 20% airdeck length at mid of explosive
column at Askari Cement Nizampur is shown in Figure 5.10.
Figure 5.10 Drilling pattern of modified blast with 20% airdeck length at mid of explosive
column at Askari cement Nizampur
5.2.2.4 Firing pattern of modified blast with 20% airdeck length at the middle of the
explosive column at Askari cement Nizampur
The firing pattern of modified blast with 20% airdeck length at the middle of the
explosive column at Askari cement Nizampur is given in Figure 5.11.
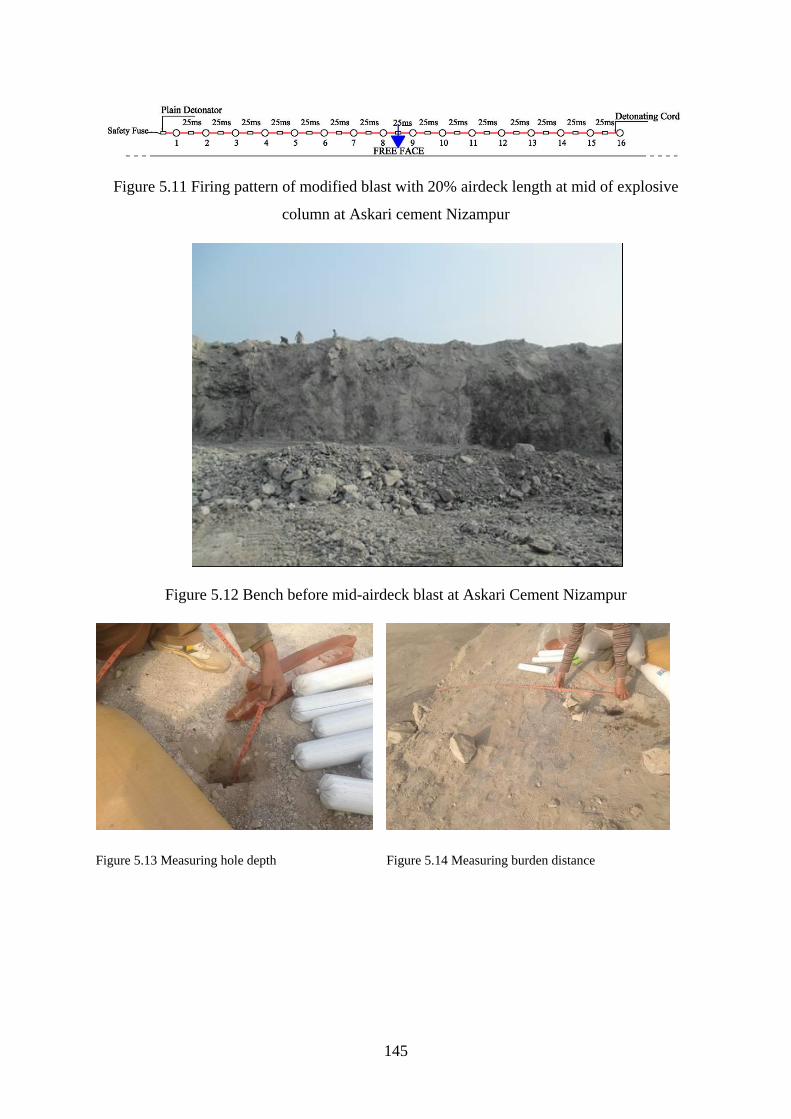
145
Figure 5.11 Firing pattern of modified blast with 20% airdeck length at mid of explosive
column at Askari cement Nizampur
Figure 5.12 Bench before mid-airdeck blast at Askari Cement Nizampur
Figure 5.13 Measuring hole depth Figure 5.14 Measuring burden distance
146
Figure 5.15 Measuring spacing between the holes Figure 5.16 Loading of Dynamite cartridge as primer
Figure 5.17 Loading of Watergel at Askari Cement Figure 5.18 Loading of ANFO at Askari Cement
Figure 5.19 Loading of wooden plug at Askari Cement Figure 5.20 Firing circuit at Askari Cement

147
Figure 5.21 Surface delay detonator at Askari Cement
Figure 5.22 Fragmentation after blast with mid-airdeck at Askari Cement Nizampur
5.2.2.5 Fragmentations results
Digital image analysis of the fragmentations after blast with 20% airdeck at the
middle of the explosive column at Askari Cement Nizampur was done with Split Desktop
software. The results of the fragmentation analysis in terms of cumulative percentage passing
are presented in Figure 5.23.

148
Figure 5.23 Size distribution of fragmentations of 20% mid-airdeck blast at Askari Cement
The graph in Figure 5.23 shows that 100% of fragmentation from 20% mid-airdeck
blast at Askari Cement Nizampur is under the sieve size of 50 inches.
5.2.2.6 Cost per tonne of limestone extracted by modified blast design with 20% airdeck
length at middle of explosive column at Askari Cement Nizampur
Table 5-5 shows the total quantity and cost of the explosive used in the blast with
20% airdeck length at the middle of explosive column.
Table 5-5Total quantity and cost of the explosive used in the blast with 20% airdeck length at
middle of explosive column at Askari Cement Nizampur
Sr. No. Entity Quantity Cost per Unit Total Cost (Rs)
1 Dynamite 133.44 kg 380.16 Rs/kg 50728.55
2 Watergel 120 kg 247.22 Rs/kg 29666.4
3 ANFO 576 kg 151.07 Rs/kg 87016.32
4 Detonating cord 232 m 31.88 Rs/m 7396.16
5 Delay relay 15 281.86 Rs/unit 4227.9
6 Safety fuse 1 m 5.13 Rs/m 5.13
7 Plain detonator #
8
1 19.13 Rs/det 19.13
8 Air plugs 16 250 Rs/plug 4000
Total cost of explosives 179059.59 Rs
Total cost of explosives + Air plugs = 183059.59 Rs
0
20
40
60
80
100
0.0 0.1 1.0 10.0 100.0
Pe
rce
nt P
as
sin
g
Size [in]
Size Distribution
149
Total volume blasted = 3.5 x 4.5 x 12 x 16
= 3024 m3
Total tonnage blasted =3024 x 2.7
= 8164.8 tonnes
(Where density of limestone = 2.7 tonnes/m3)
Explosives Consumed = Dynamite + Watergel + ANFO
= 133.44 + 120+ 576
= 829.44 kg
Powder Factor = Explosive Consumed (kg)/Rock Blasted (m3)
= 829.44/ 3024 = 0.27 kg/m3
Cost of explosives per tonne of rock blasted = Total Cost of explosives/Tonnes of rock
blasted =179059.59 / 8164.8 = 22 Rs/tonne
Total cost per tonne= cost of explosives + air plug cost / tonnes of rock blasted
= 183059.59 / 8164.8 = 22.4 Rs/tonne
5.2.3 Comparison of Performance of all Blasts Fired at Askari Cement Nizampur
Blast performance of conventional with full column charge and 20% mid-airdeck
blast was evaluated on following parameters: degree of fragmentation, muckpile
displacement, over break, toe, floor level and ground vibrations.
5.2.3.1 %age reduction in fragment size with respect to FXO series by using 20%
airdeck length at mid of explosive column at Askari Cement Nizampur
Fragmentation results of conventional and 20% mid-airdeck blast in terms of
cumulative percent passing at Askari Cement Nizampur are shown in Table 5-6.
150
Table 5-6Fragmentation results of conventional and 20% mid-airdeck blast at Askari Cement
Nizampur
Description of %
age Passing
Conventional Blast
Size(in)
20% Mid-Airdeck
Blast
Size(in)
%age Reduction
with 20% Mid-
Airdeck Blast
F10 0.01 0.01 0
F20 0.17 0.02 88%
F30 0.71 0.15 79%
F40 1.96 0.57 71%
F50 4.35 1.59 63%
F60 8.35 3.71 56%
F70 15.90 7.69 52%
F80 22.22 13.99 37%
F90 30.03 22.75 24%
Top size measured 60.92 48.49 20%
Comparison of %age passing between the fragmentation of conventional and 20%
mid-airdeck blast at Askari cement Nizampur is further shown by bar and cumulative passing
graph in Figure 5.24.
Figure 5.24 Comparison of %age passing of fragmentation between conventional and 20%
mid-airdeck blast at Askari Cement Nizampur

151
It can be observed from Figure 5.24 that the blast with 20% airdeck length when
placed at the middle position of explosive charge produces a small and uniform fragment size
distribution as compared to blast when full column explosive charge was used. Moreover
50% passing of fragments was achieved at 1.59 inch with 20% mid-airdeck blast and 4.35
inch with conventional blast.
It may also be observed from Table 5-6 that in 20% mid-airdeck blast the fragment
size reduction of approximately 88% for F20 passing size, 79% for F30 passing size, 71% for
F40 passing size, 63% for F50 passing size,56% for F60 passing size,52% for F70 passing
size,37% for F80 passing size, 24% for F90 passing size and 20% for top size was found.
Thus, there was no significant difference found for sizes of F10 or below.
5.2.3.2 Muckpile displacement
Muckpile distances were measured for both conventional and mid-airdeck blasts as
presented in Table 5-7. The throw was significantly reduced in case of mid-airdeck blast as
compared to conventional blasting with full column charge as shown in Figure 5.25. The
muckpile was scattered in case of conventional blast with full column charge showing
inefficient use of energy.
Figure 5.25 Muckpile profile of 20% mid-airdeck blast at Askari Cement Nizampur
152
Table 5-7 Muckpile distances
Entity Conventional Blast 20% Mid-Airdeck Blast
Throw(m) 24 12
The mid-airdeck showed efficient use of explosive energy even though the blast
used 20% less explosive.
5.2.3.3 Over break
There was no back break found in case of mid-airdeck blast and clean face without
any crack was available for the next round. The conventional blast on the other hand
produced some back crack as shown in Figure 5.26 which showed not only wastage of energy
but uneven face for the next round.
Figure 5.26 Back crack due to conventional blast
5.2.3.4 Level of floor
In both modified mid-airdeck and conventional blast without airdeck at Askari
Cement Nizampur bench the floor level was analyzed very carefully to check for any toe or
disruption of floor after the blasted material was removed. The floor was smooth and no toe
was found in both cases. It was very significant because mid-airdeck blast used 20% less
explosive.
Back Crack
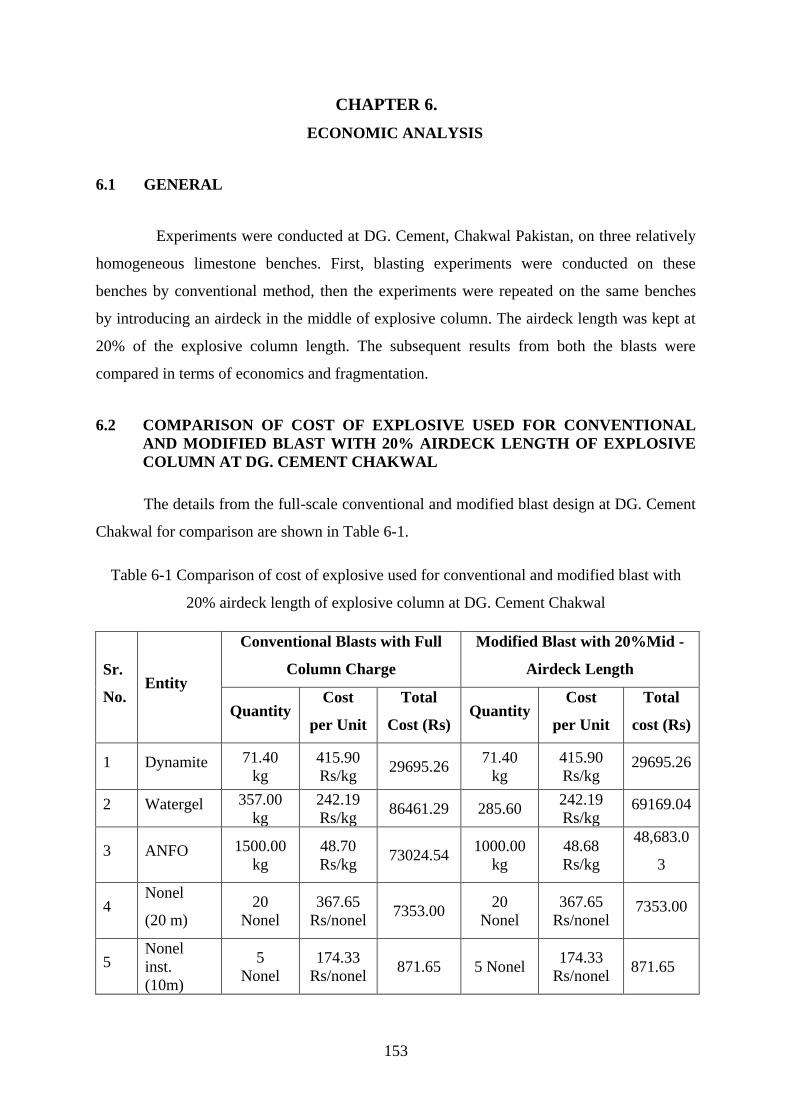
153
CHAPTER 6.
ECONOMIC ANALYSIS
6.1 GENERAL
Experiments were conducted at DG. Cement, Chakwal Pakistan, on three relatively
homogeneous limestone benches. First, blasting experiments were conducted on these
benches by conventional method, then the experiments were repeated on the same benches
by introducing an airdeck in the middle of explosive column. The airdeck length was kept at
20% of the explosive column length. The subsequent results from both the blasts were
compared in terms of economics and fragmentation.
6.2 COMPARISON OF COST OF EXPLOSIVE USED FOR CONVENTIONAL
AND MODIFIED BLAST WITH 20% AIRDECK LENGTH OF EXPLOSIVE
COLUMN AT DG. CEMENT CHAKWAL
The details from the full-scale conventional and modified blast design at DG. Cement
Chakwal for comparison are shown in Table 6-1.
Table 6-1 Comparison of cost of explosive used for conventional and modified blast with
20% airdeck length of explosive column at DG. Cement Chakwal
Sr.
No. Entity
Conventional Blasts with Full
Column Charge
Modified Blast with 20%Mid -
Airdeck Length
Quantity Cost
per Unit
Total
Cost (Rs) Quantity
Cost
per Unit
Total
cost (Rs)
1 Dynamite 71.40
kg
415.90
Rs/kg 29695.26
71.40
kg
415.90
Rs/kg 29695.26
2 Watergel 357.00
kg
242.19
Rs/kg 86461.29 285.60
242.19
Rs/kg 69169.04
3 ANFO 1500.00
kg
48.70
Rs/kg 73024.54
1000.00
kg
48.68
Rs/kg
48,683.0
3
4 Nonel
(20 m)
20
Nonel
367.65
Rs/nonel 7353.00
20
Nonel
367.65
Rs/nonel 7353.00
5 Nonel
inst.
(10m)
5
Nonel
174.33
Rs/nonel 871.65 5 Nonel
174.33
Rs/nonel 871.65
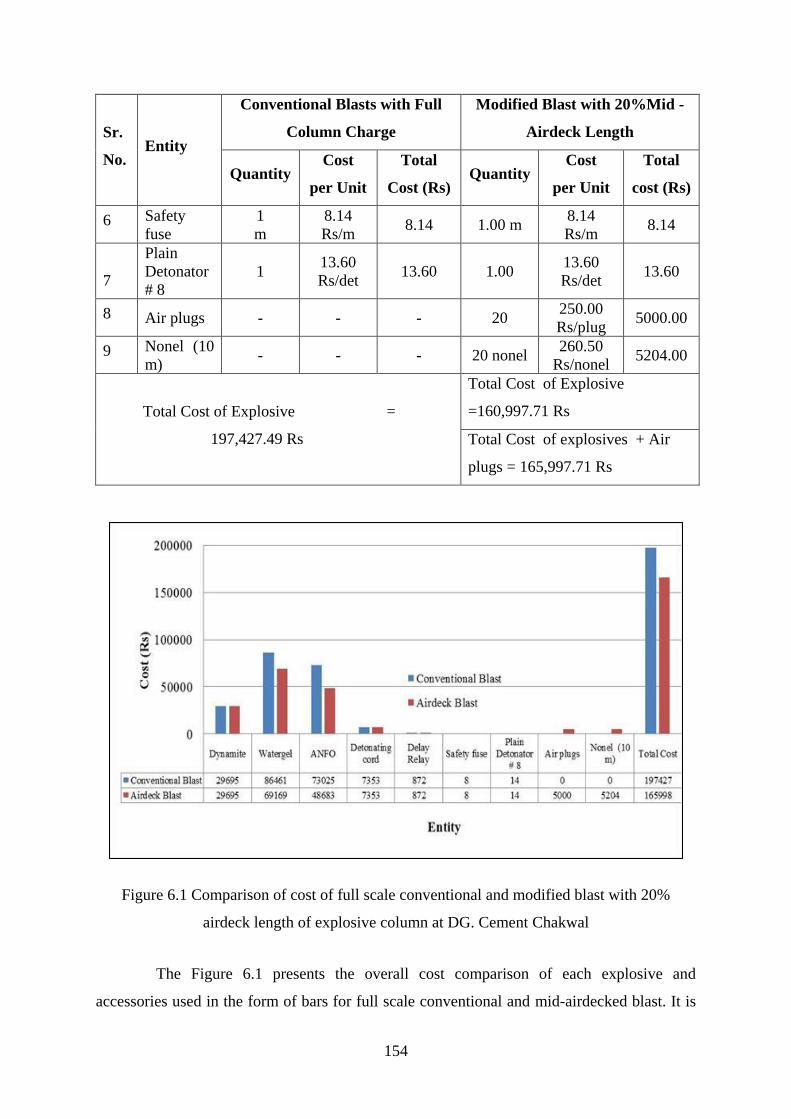
154
Sr.
No. Entity
Conventional Blasts with Full
Column Charge
Modified Blast with 20%Mid -
Airdeck Length
Quantity Cost
per Unit
Total
Cost (Rs) Quantity
Cost
per Unit
Total
cost (Rs)
6 Safety
fuse
1
m
8.14
Rs/m 8.14 1.00 m
8.14
Rs/m 8.14
7
Plain
Detonator
# 8
1 13.60
Rs/det 13.60 1.00
13.60
Rs/det 13.60
8 Air plugs - - - 20 250.00
Rs/plug 5000.00
9 Nonel (10
m) - - - 20 nonel
260.50
Rs/nonel 5204.00
Total Cost of Explosive =
197,427.49 Rs
Total Cost of Explosive
=160,997.71 Rs
Total Cost of explosives + Air
plugs = 165,997.71 Rs
Figure 6.1 Comparison of cost of full scale conventional and modified blast with 20%
airdeck length of explosive column at DG. Cement Chakwal
The Figure 6.1 presents the overall cost comparison of each explosive and
accessories used in the form of bars for full scale conventional and mid-airdecked blast. It is

155
clearly visible that the total cost of explosive used for conventional blast is greater than that
in the case of airdecked blast. Table 6-2 represents cost comparison of explosive used per
tonne of rock blasted between full scale conventional and 20% mid-airdecked blast at DG.
Cement Chakwal.
Table 6-2 Cost per tonne of full scale conventional and modified blast with 20% airdeck
length at mid of explosive column at DG. Cement Chakwal
Entity Conventional Blast 20% Mid-airdeck Blast
Cost of Explosive per Tonne
(Rs.) 15.70 13.20
As presented in Table 6-2 savings in explosives cost/tonne of rock blasted by using
20% mid-airdeck length in explosive column is 2.50 rupees per tonne (15.70 – 13.20).
Moreover, the analysis of estimated cost of limestone extracted by modified blast
design with 20% airdeck length at middle of explosive column and conventional blast with
full column charge at DG. Cement Chakwal, suggests that up to 2.5 rupees per tonne can be
saved for the explosive only by adopting 20% mid-airdeck length in the explosive column.
The current production of limestone per month at DG. Cement Chakwal is 300,000 tonnes.
As per the calculation up to 16% saving can be achieved and 750,000 rupees can be saved at
the DG. Cement quarry monthly and annually 9 million rupees can be saved.
6.3 COMPARISON OF COST OF EXPLOSIVE USED FOR CONVENTIONAL
AND MODIFIED BLAST WITH 20% MID-AIRDECK LENGTH OF
EXPLOSIVE COLUMN AT ASKARI CEMENT NIZAMPUR
The details of cost of explosive incurred on conventional and modified blast with
20% airdeck length of explosive column at Askari Cement Nizampur are given in Table 6-3.
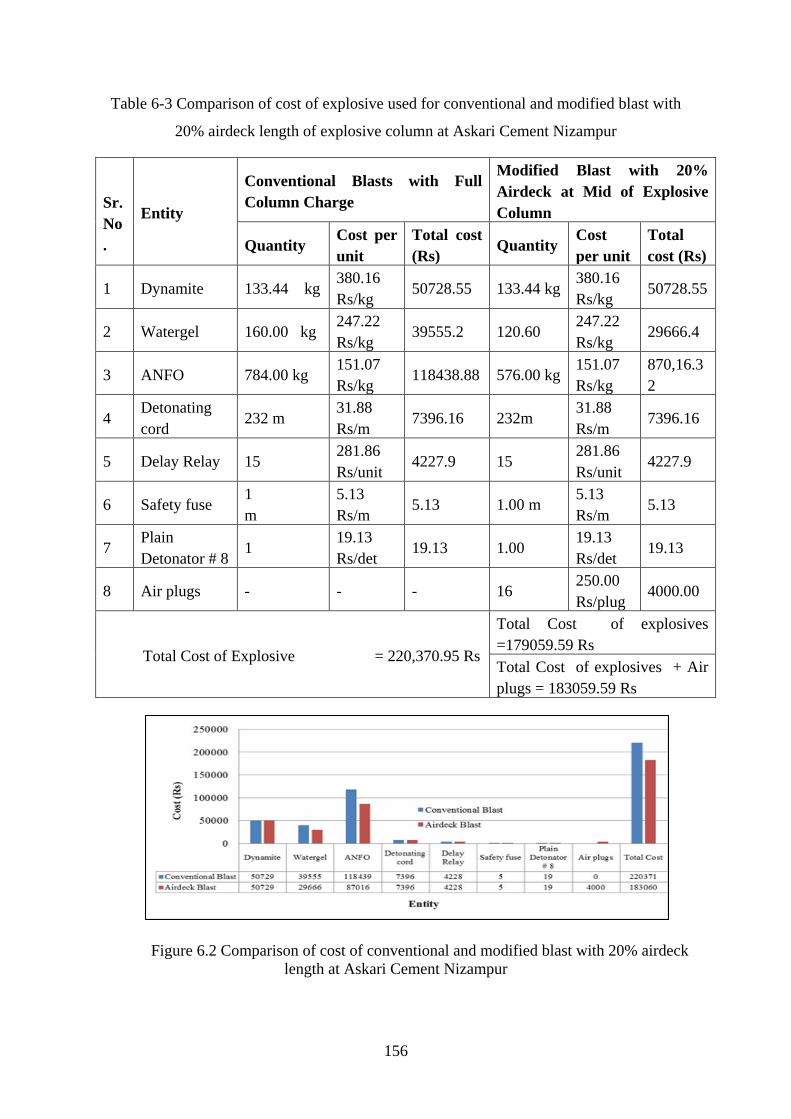
156
Table 6-3 Comparison of cost of explosive used for conventional and modified blast with
20% airdeck length of explosive column at Askari Cement Nizampur
Sr.
No
.
Entity
Conventional Blasts with Full
Column Charge
Modified Blast with 20%
Airdeck at Mid of Explosive
Column
Quantity Cost per
unit
Total cost
(Rs) Quantity
Cost
per unit
Total
cost (Rs)
1 Dynamite 133.44 kg 380.16
Rs/kg 50728.55 133.44 kg
380.16
Rs/kg 50728.55
2 Watergel 160.00 kg 247.22
Rs/kg 39555.2 120.60
247.22
Rs/kg 29666.4
3 ANFO 784.00 kg 151.07
Rs/kg 118438.88 576.00 kg
151.07
Rs/kg
870,16.3
2
4 Detonating
cord 232 m
31.88
Rs/m 7396.16 232m
31.88
Rs/m 7396.16
5 Delay Relay 15 281.86
Rs/unit 4227.9 15
281.86
Rs/unit 4227.9
6 Safety fuse 1
m
5.13
Rs/m 5.13 1.00 m
5.13
Rs/m 5.13
7 Plain
Detonator # 8 1
19.13
Rs/det 19.13 1.00
19.13
Rs/det 19.13
8 Air plugs - - - 16 250.00
Rs/plug 4000.00
Total Cost of Explosive = 220,370.95 Rs
Total Cost of explosives
=179059.59 Rs
Total Cost of explosives + Air
plugs = 183059.59 Rs
Figure 6.2 Comparison of cost of conventional and modified blast with 20% airdeck
length at Askari Cement Nizampur

157
The Figure 6.2 represents the overall cost comparison of each explosive and
accessories used in the form of bars for full scale conventional and airdecked blast. It is
clearly visible that the total cost of explosive used for conventional blast is greater than that
incurred in the case of airdecked blast.
The cost per tonne of both blasts fired at Askari Cement Nizampur is given in Table
6-4.
Table 6-4 Cost/tonne of conventional and modified blast with 20% mid-airdeck length of
explosive column at Askari Cement Nizampur
Entity Conventional blast 20% Mid-airdeck Blast
Cost of Explosive per
Tonne (Rs) 25 22.4
As given in Table 6-4 saving in explosives cost/tonne of rock excavated by 20%
mid-airdecked blast is 2.6 rupees ( 25 – 22.4) .
The cost analysis conducted from blasting results of Askari Cement Nizampur,
clearly suggests that up to 2.6 rupees per tonne can be saved by adopting 20% mid-airdeck
length in the explosive column, instead of the conventional blast. Now production of
limestone per month at Askari Cement Nizampur is 180,000 tonnes. Therefore, using 20%
mid-airdeck length in explosive column, saving per ton can be increased by 10.4%. If it is
converted into nominal values, Rs. 468,000 rupees can be saved at the Askari cement quarry
monthly and an annual saving of 5.6 million rupees can be achieved.
6.4 DISTRICT/MINERAL WISE LIMESTONE PRODUCTION IN MINING
INDUSTRY OF PUNJAB
Table 6-5 presents the annual production of limestone for various districts of
Punjab.

158
Table 6-5 District/Mineral wise limestone production in mining industry of the Punjab
Districts of Punjab Limestone (Tonnes)
Attock 3029757
Rawalpindi 982495
Jhelum 487970
Chakwal 6120377
Sargodha 0
Khushab 1487688
Mianwali 2890400
D.g. Khan / Rajan pur 2387188
Total 17385875
The total production of limestone as given in Table 6-5 is 17385875 tonnes. The
average cost/tonne saved at DG. Cement Chakwal and Askari Cement Nizampur is 2.55
Rs/tonne.
If the calculation based on statistical data as given in Table 6-5 were to be projected
for limestone production in Punjab (province of Pakistan), 44.33 million rupees
(=17385875x2.55) can be saved annually, just for the explosive used, by adopting 20%
airdeck length in explosive column. Similar calculations can be estimated for other provinces
of the country as well. As there are many other minerals is Pakistan which require blasting
for their production. If airdeck blasting technique is used for the production of those minerals,
millions of rupees can be saved annually.
To sum it up, the efficiency of all downstream processes: loading, hauling, crushing
and grinding, depends upon the optimum size of fragmentation from the blast. As the 20%
mid-airdeck blasting gives even fragmentation with negligible amount of boulders and fines,
machinery can easily handle even fragmentation with least power consumption and wear and
tear, increasing the overall efficiency and production of the entire process. The cost analysis
of all these downstream processes could lead to billions of rupees being saved annually.
159
CHAPTER 7.
CONCLUSIONS AND RECOMMENDATIONS
7.1 CONCLUSIONS
After comprehensive experimentation and analysis of the results from blasted
fragmentation, following conclusions can be drawn:
Airdeck blasting technique was found to be significantly effective in homogeneous
concrete block, as the rock fragments produced by this method were either better or as
good as those produced by using full column charge ,but with reduced expense.
Furthermore, it was also established that the type of fragmentation produced by
airdecked charge depends on the location and size of airdeck in the explosive column.
In this regards it was learned, that the mean size of blasted rock fragments increase with
the increase in airdeck size. While airdecks, when placed in middle position of an
explosive columns produced more uniform blasted rock size distribution, with
minimum fines and oversized material, compared to those produced when same airdeck
length and explosive loadings used at top and bottom positions. The reason that
explains this finding is that when the airdeck is placed in the middle position it creates
multiple series of shock waves which lead to efficient transfer of explosive energy in
the surrounding rocks. For the model materials and explosive used in this research
work, the combination of 20% airdeck length and the center position of airdeck in the
explosive column were produced optimum results.
Comparison of performance of all the shots fired at DG. Cement Chakwal on bench
number-1 was done for following parameters: fragmentation, muckpile, throw and back
break at the toes or at the collars. For this purpose the Split Desktop software was used
at bench number-1, the analysis established that 20% airdeck length at top, middle and
bottom of the explosive column produced better fragmentation as compared to when
conventional blasting method was employed with full column charge without any
airdeck. The results of the test blasts at bench number-1 of DG. Cement quarry were in
accordance with the test blasts performed on concrete blocks. It was also very clear that
20% airdeck, when placed at middle position of the explosive column produced more
160
uniform blasted rock size distribution compared to that at other positions and full
column charge without any airdeck. Moreover, there was no back break and toe
problem. The degree of muckpile formed by fragmentation of the blast with 20%
airdeck at middle of explosive column was better than that produced by conventional
blast with controlled throw and the scattering of material was also nonexistent to make
it easy for the loading equipment. The more significant aspect was that in the airdeck
blast 20% less explosive was used.
For the full scale blast at DG. Cement quarry on bench number-2, the fragment size
reduction with 20% mid-airdeck blast as compared to conventional blast of
approximately 45% for F10 passing size, 49% for F20 passing size, 52% for F30
passing size, 54% for F40 passing size, 56% for F50 passing size, 58% for F60 passing
size, 59% for F70 passing size, 55% for F80 passing size, 60% for F90 passing size and
63% for top size was observed. Mid-airdeck produced even and no oversized
fragmentation, which has significant economic effect on downstream processes.
Muckpile distances were measured for both conventional and mid-airdeck blasts. The
throw was significantly reduced in case of mid-airdeck blasting compared to that in the
case of conventional blasting with no airdecking and in which muckpile was scattered
because of inefficient use of energy. Furthermore, there was no back break or end break
found in case of mid-airdeck blast and clean face without any crack was available for
the next round. Conventional blast on the other hand produced some back cracks, not
only did it waste energy but also produced uneven face for the next round.
With regards to the quarry floor no significant difference was found between modified
mid-airdeck and conventional blast without airdeck at bench number-2. It was very
significant because airdeck blast used 20% less explosive.
The full scale blast at Askari cement Nizampur yielded significant difference in degree
of fragmentation and muckpile displacement by using 20% airdeck at middle of
explosive column as compared to that produced in the case of conventional blast with
full column charge. In 20% mid-airdeck length blast the fragment size reduction of
approximately 88% was found for F20 passing size, 79% for F30 passing size,71% for
F40 passing size, 63% for F50 passing size,56% for F60 passing size,52% for F70
161
passing size,37% for F80 passing size, 24% for F90 passing size and 20% for the top
size. There was no significant difference found for sizes of F10 or below.
Muckpile distances were measured for both conventional and 20% mid-airdeck blasts
conducted at Askari Cement Nizampur. Throw was significantly reduced in case of
mid-airdeck blasting as compared to that in the case of conventional blasting with no
airdecking, in which muckpile was scattered showing inefficient use of energy. The
mid-airdeck showed efficient use of explosive energy even though the blast used 20%
less explosive. Moreover, there was no back break found in case of mid-airdeck blast
and clean face without any crack was available for next round. Conventional blast on
the other hand produced some back cracks which showed not only wastage of energy
but also uneven face for the next round.
With regards to the multiple airdecks, double airdecks equivalent to 20% of explosive
column when placed at middle of explosive columns achieved the same results, in
terms of fragmentation, muckpile, throw and back break at the toes with 20% less
explosive, as was achieved in other benches with 20% middle airdeck in the explosive
column.
From the analysis of estimated cost of explosive used per tonne of limestone extracted
by modified blast design, with 20% airdeck at middle of explosive column and
conventional blast with full column charge at DG. Cement Chakwal, it can be
concluded that up to 2.5 rupees per tonne of explosive can be saved by adopting 20%
mid-airdeck length in the explosive column. In other words saving can be increased by
16% per tonne of rock excavated. This way 750,000rupees can be saved at the DG.
cement quarry monthly while annually 9 million rupees can be saved.
Similarly, the cost analysis conducted from blasting results of Askari Cement
Nizampur, it can be concluded that up to 2.6 rupees per tonne of rock excavated can be
saved by adopting 20% mid-airdeck length in the explosive column, instead of the
conventional blast. Therefore, using 20% mid-airdeck length in explosive column
saving can be increased by 10.4 % per tonne of rock excavated. This way 468,000
rupees can be saved at the Askari cement quarry monthly and an annual saving of 5.6
million rupees can be achieved. If the calculation based on statistical data were to be
162
projected for limestone production in Punjab (province of Pakistan), 44.33 million
rupees can be saved annually only for explosive by adopting 20% airdeck length in
explosive column. Similar calculations can be estimated for other provinces of the
country as well. As there are many other minerals is Pakistan which require blasting for
their production. If airdeck blasting technique is used for the production of those
minerals, millions of rupees can be saved annually.
The airdeck blasting technique was used for the first time in Pakistan at industry level.
In fact the workforce at DG. Cement Chakwal and Askari Cement Nizampur were so
impressed with the effectiveness of the airdeck blasting technique that they have
already started using it in their routine blasts. The teams there have also verified the
cost saving that they are achieving by airdeck blasting technique.
To sum it up, the efficiency of all downstream processes: loading, hauling, crushing
and grinding, depends upon the optimum size of fragmentation from the blast. As the
20% mid-airdeck blasting gives even fragmentation with negligible amount of boulders
and fines, machinery can easily handle even fragmentation with least power
consumption and wear and tear, increasing the overall efficiency and production of the
entire process. The cost analysis of all these downstream processes could lead to
billions of rupees being saved annually.
7.2 RECOMMENDATIONS
The following recommendations are being made to further enhance this study and to
take full advantage of the airdeck blasting technique.
The scope of the study was to deal with the homogenous material but the work can be
safely extended to limestone having variation in geological properties. Thereby, in case
of a particular rock formation, a relationship can be developed between airdeck length
& fragment size. This relation will serve as guideline to select optimum airdeck length
for a certain rock type.
The size distribution of blasted rock fragmentation depends on the extent of geological
discontinuity in the area to be blasted. Therefore, in order to find out precisely the
163
discontinuities within the blasthole a borehole Camera is recommended for the future
work.
While drilling it is recommended that the drilling rate for the blastholes drilled with the
machine should be monitored. This would allow to extract information about the
variation in strata, presence of cavities and voids within the borehole for making
necessary adjustment in blast design.
As widely believed that the size distribution of blast fragments mostly depends upon
the discontinuities present in the rock. Moreover, ease or difficulty of blasting a rock
depends on its strength. Keeping this in mind it is recommended that a relationship be
developed between the rock condition, its strength and airdeck length. In this regard,
rock condition can be quantified by using RMR system of classification of rocks,
whereas rock strength can be expressed in terms of ultimate compressive or tensile
strength. This relationship can help the engineers working in the cement quarries or in
any other surface mine to select the airdeck length for their blast design conveniently.
The plug used in this study was made of wood with fixed diameter, due to which in
cracked and soft holes it got stuck. So there is a need to design a plug locally which
should be adjustable according to hole dia. Also the cost of wood is high, therefore it is
recommended to manufacture a plastic plug which will reduce the cost of plug thus
increasing profits. Moreover, it was also learned that the use of gas bags could help in
achieving better airdecking, increasing the efficiency of this method and resulting in
more effective use of airdeck blasting technique.
In the present research work up to two airdecks in the explosive column were used, but
it will be more beneficial to check if more than two airdecks are used in the explosive
column, allowing for better and economic fragmentation.
It would be better to make use of Seismograph for monitoring blast induced vibrations
and air blast for both conventional and airdecked blast because it has been reported that
with the inclusion of airdecks in explosive column the magnitude of ground vibration
are reduced from 10% to 75%. This reduction will allow mining engineers to use larger
quantity of explosive per delay while maintaining the same vibration level.
164
A cost analysis of all downstream processes like secondary blasting, hauling, crushing,
grinding etc, should be conducted for conventional and 20% mid-airdecked blast. This
will allow for a comprehensive analysis of cost saving from mine to mill.
Moreover, it is recommended that test blasts should be conducted at different cement
quarries of Pakistan using airdeck in the explosive column, so that all mine operators in
Pakistan can adopt this technique, which will help them to solve a lot of blasting related
problems.
165
REFERENCES
[1] Nielsen, K., and J Kristiansen(1996). Blasting –crushing –grinding: Optimization of
an integrated comminution system. In Proc 5th Int Symp on Rock Fragmentation by
Blasting, B Mohanty ed, pp 269-277. Balkema, Rotterdam.
[2] Eloranta, J (1995). Selection of powder factor in large diameter blastholes. In Proc
Explo'95 Conference, pp 25-34. Publication series no. 6/95. AusIMM, Carlton VIC.
[3] Palay,N., and T kojovic (2001).Adjusting blasting to increase SAG mill through put
at the Red Dog mine.In pro ISEE 27TH
Ann Conf Expl and Blasting Techn,pp 65-
81.ISEE,Cleveland OH.
[4] Sastry, V.,& Ram Chander K (2004). "Influence of the initiation system on blast
results case studies" Fragblast, volume 8, pp, 207-220.
[5] Ryu, d.w.,Shim h.j,and Han c.y.ahn s.m (2009). Prediction of rock fragmentation and
design of blasting pattern based on 3-D spatial distribution of rock factor.
International journal of rock mechanics and mining Sciences vol.46,pp.326-332.
[6] Gary, L. Buffington (2000). The art of Blasting on Construction and Surface Mining
Sites, American Society of Safety Engineers.
[7] Obert, L., & Duvall, W.I. (1949). A Gauge and Recording Equipment for Measuring
Dynamic Strain in Rock, USBM, RI 4581.
[8] Obert, L., & Duvall, W.I. (1950). Generation and Propagation of Strain Waves in
Rock, USBM, RI 4663.
[9] Field, J.E., and Ladegaard-Pederson, A. (1971). The Importance of the Reflected
Stress Wave in Rock Blasting .Int. J. Rock. Mech. Min. Sci.
[10] Barker, D. B., Fourney, W. I., and Dally, J. W. (1978, March). Photo Elastic
Investigation of Fragmentation Mechanisms, Part 1-BoreHole Crack Network,
University of Maryland.
[11] Johansson, C. H., and Persson, P. A. (1970). Detonics of High Explosives. New
York: Academic Press
[12] Ash, R.I., (1973, June). The influence of Geological Discontinuities on Rock
Blasting. Unpublished doctoral dissertation, University of Minnesota.
166
[13] Kutter, H. K., and Fairhust. C. (1971). On the Fracture Process in Blasting. Int. J.
Rock Mech. Min. Sci., B, 181-202. Great Britain: Pergamon Press.
[14] Lang, L. C., and Favreau, R. F. (1974, June). A Modern Approach to Open Pit Blast
Design and Analysis, CIM Bulletin, pp. 37-44.
[15] Adams, P. F., Dmuth, R. B., Margolin, L. G., and Nichols, B. D. (1983, August).
Simulation of Rock Blasting with the Shale Code. Proceeding of the First
International Symposiun on Rock Fragmentation by Blasting. (pp. 361-373), Lulea,
Sweden.
[16] Lang, L. C., Roach R. J., and Osoko, M.N. (1977, September). Vertical Crater
Retreat- An Important New Mining Method, Canadian Mining journal.
[17] Chiappetta, R. F., Bauer, A., and Burchell, S. I. (1983). The Use of high Speed
Motion Picture Photography in Blast Evaluation and Design. Proceedings of the 9th
Annual Conference on Explosives and Blasting Techniques. Society of Explosive
Engineers.
[18] Chiappetta. (1998). Choosing the right delay timing for the blasting application,
optimization and maintaining field control. In Proc 8th High-Tech Seminar on State-
of-the-Art, Blasting Technology, Instrumentation and Explosives Applications. BAI,
Allentown PA.
[19] Hagan, T. N. (1979a).The control of fines through improved blast design.In Proc
Workshop on Influence of Rock Properties on Drilling and Blasting,ch 6,pp 153-
192.Australian Mineral Foundation.
[20] Hagan, T. N. (1979b). Redesign of hypothetical blast to reduce fines.In Proc
Workshop on Influence of Rock Properties on Drilling and Blasting,ch 27,pp 574-
578.Ausralian Mineral Foundation.
[21] Winzer, S. R., D. A. Anderson,. & A p Ritter (1983). Rock Fragmentation by
explosives. In proc 1st Int Symp on Rock Fragmentation by blasting, R holmberg & A
Rustan eds, pp 225-249. Lulea University of Technology, Sweden.
[22] Stagg, M. S.,& S. A. Rholl (1987). Effects of accurate delays on Fragmentation by
Blasting, W L Fourney & R D Dick eds, pp210-223. SEM, Bethel CT.

167
[23] Elliot, R. J., R. Ethier.,& J-G. Levacque (1999). Lafarage Exshaw finer fragmentation
study. In proc 25th ISEE Conf on Explosives & Blasting Techniques, vol II, pp 333-
353. ISEE, Cleveland OH.
[24] Ethier, et al., (1999).Achieving finer fragmentation and proving cost benefits. In Proc
6th
Int Symp on Rock Fragmentation by blasting, pp 99-103.Symposium series S21
SAIMM, Johannesburg.
[25] Onoderra, I., & S. Esen(2003).Selection of inter-hole and intra-row timing for surface
blasting. An approach based on burden relief analysis. In Proc EFEE 2nd
World
Conference on explosive and blasting. R Holmberg ed. pp 269-
275.Balkema,Rotterdam.
[26] Applied Explosives Technology for Construction and Mining; Applex, Arla,(1990).
[27] Mel‘nikov, N.V., Marchenko, L.N.(1971). Effective Methods of Applications of
Explosive Energy in Mining and Construction, 12th
U.S. Symposium Dynamic Rock
Mechanics(New York, AIME), chap. 18, pp35-378.
[28] Fourney, W.L., Barker D.B. and Holloway D.C. Model Studies of explosives well
stimulation techniques. Int.j. Rock Mech.& Min. Sci. 18, 1981, pp113-27.
[29] Marchenko, LN. Raising the efficiency of a blast in rock crushing. Journal of Mining
Science 1982; 18(5): 395-99.
[30] Chiappetta, R. F.,& Mammele, M. E (1987). Analytical high –speed photography to
evaluate airdecks, stemming retention and gas confinement in pre-splitting,
reclamation and gross motion application. Second Int. Symp. Rock Fragmentation
by Blasting, Keystone, Colorado, August 23-26, 1987, pp 257-301.
[31] Chiappetta, R.F., (2004). New blasting techniques to eliminate sub-grade drilling
improve fragmentation; reduce explosive consumption and lower ground vibration.
Journal of Explosive Engineering
[32] Liu L,& Katsabanis, P.D (1996). Numerical modelling of the effects of
airdecking/decoupling in production and controlled blasting.Rock fragmentation by
blasting, Monhanty (ed.) Balkema, Rotterdam.Pp319-330.
[33] J.C. Jhanwar.,& J. L. Jethwa. (2000). The use of airdecks in production blasting in an
open. Central Mining Research Institute Regional Centre, 54-B, Shankar Nagar.

168
[34] Jhanwer J. C., Cakarborty, A.K. Anireddy, H. R. & Jethwa J.L (1999). Application of
airdecks in production blasting to improve fragmentation and economics of an open
pit mine, Geotechnical and Geological Engineering 17: pp37-57.
[35] Thote, N.R.,Singh D.P. (2000). Effect of airdecking on fragmentation: A few case
studies of Indian mining. Explosives and Blasting Technique. Rotterdam, ISBN 90
5809 1 686.
[36] W. Lu. Wuhan.,& W. Hustrulid (2003). A further study on the mechanism of
airdecking. International Journal for Rock Fragmentation by Blasting 7(4):231-255.
[37] Moxon, N.T.,& Mead D. Richardson, S.B.(1993). Airdecked blasting techniques:
some collaborative experiments. Transaction of the institution of Mining and
Metallurgy. Section A. Mining Industry. Vol. 102,pp. A25-30.
[38] Jhanwar, J. C.(2011). Theory and practice of airdeck blasting in mines and surface
excavation, A Review, Geotechnical and Geological Engineering. 10.1007/s10706-
011-9425-x.
[39] John. L. Floyd (2004). A report on power deck optimization prepared by blast
dynamics, Inc.
[40] Rommayawes, S. Leelasukseree, C. (2011). A guideline of empty gap length for
airdeck blasting in good rockmass. Rock mechanics, Fuenkajom and Phien-Wej(eds)
2011. ISBN 978 974 533636 0
[41] Suttithep Rommayawes, Chewchan Leelasukseree, & Pirat Jaroonpattanapong.
(2013). Influence of airdeck length on fragmentation in quarry blasting. European
Scientific Journal December 2013 /SPECIAL/ edition vol.3 ISSN: 1857 – 7881 (Print)
e - ISSN 1857- 7431.
[42] Tariq, S.M., and Zeshan (2008). Use of airdeck in secondary boulder blasting to
mitigate air blast and fly rocks. International society of explosive engineers.
[43] Gynnemo (1996). The importance of velocity of detonation in rock blasting. In Proc
5th
int Symp on Rock Fragmentation by Blasting, B Mohanty ed, pp 297-300.
Balkema, Rotterdam.
169
[44] Olsson, M.,& I. Bergqvist (2002). Fragmentation in quarries. In Proc Discussion
meeting BK 2002. pp 33-38.Swedish Rock Construction Committee, Stockholm. In
Swedish.
[45] Carlsson, O.,& L. Nyberg (1983). A method for estimation of fragment size
distribution with automatic image processing. In Proc 1st
Int Symp on Rock
Fragmentation by Blasting, R Holmberg & A Rustan eds, pp 333-345. Lulea
University of Technology, Sweden.
[46] Liu, Q.,& H. Tran (1996). Comparing systems- Validation of Fragscan, WipFrag and
Split Desktop.
[47] Katabasin,T. (1999). Calibration of optical digital fragmentation measuring
systems.In Proc ISEE 25th
Ann Conf Expl and Blasting, vol 11,pp 325-332.ISEE,
Cleveland OH.
[48] Kemeny, J., (1994). "A practical technique for determining the size distribution of
blasted benches, waste dumps, and heap-leach sites", Mining Engineering, Vol. 46,
No. 11, pp. 1281-1284.
[49] Advance optimizing group (2003). Newsletter, vol2, no 1. www.topex.on.ca.
[50] Abrahamsson, S. B. Niklasson.,& F. Ouchterlony. (1987). Fragmentation monitoring
of production blasts at Mrica. SveDeFo report DS 1987:6. Swedish Detonic Research
Foundation, Stockholm.
[51] Fabrila,H., (2006).Microfracturing as a result of explosion and increased dissolution
of metal in an oxidized copper ore.In:8th
International Symposium on Rock
fragmentation by blasting,Editec S.A Santiago,Chile,pp,262-270.
[52] Katsabanis, p.,Kunzel, G., Pelley, C., Kelebek, S., (2003). Small scale study of
damage due to blasting and implication on crushing and grinding. In: 29th
Explosives
and Blasting Technique Conference, International Society of Explosives Engineers,
Nashville, Tennessee, pp, 365-376.
[53] Hector Ivan Parra Galvez.,(2011). Analysis of the state of the art of blast-induced
fragment conditioning. Minerals Engineers volume 24,issue 14 , pp, 1638-1650.
170
[54] Workman, L.,& J. Eloranta. (2003). The effects of Blasting on crushing and grnding
efficiency and energy consumption. In Porc ISEE 29th Ann Conf Expl & Blasting
Techn, vol I, pp 131-140 . ISEE Cleveland OH.
[55] Kojovic, T., S. Michaux.,& C. M. Mckenzie. (1995). Impacts of blast fragmentation
on crushing screening operations in quarrying. In Proc Explo'95 Conference, pp 427-
436. Publication series no. 6/95. AusIMM, Carlton VIC.
[56] Grundstrom, C. S. M. Kanchibotla., A. Jankovich.,& D. Thornton. (2001). Blast
fragmentattion for maxising the SAG mill throughput at Porgera gold mine. In proce
ISEE 27th Ann Conf Expl & Blasting Techn, vol I, pp 383-399. ISEE, Cleveland OH.
[57] Craig Imrie, J. O. (2001). Ore flow optimisation-Mine to mill.
www.hatchbeddows.com.
[58] Eloranra, J. (1997). The efficiency of blasting crushing and grinding. In Proc ISEE
23rd
Ann Conf Expl & Blasting Techn, pp 157-163. ISEE, Cleveland OH.
[59] Eloranra, J. (2001). Improve milling through better powder distribution. In Proc
ISEE 27th
Ann Conf Expl & Blasting Techn, vol-I, pp 55-63. ISEE, Cleveland OH.
[60] Eloranra, J. (2002). The role of blasting operations in metal minng. In Proc ISEE
28th
Ann Conf Expl & Blasting Techn, vol-I, pp 45-54. ISEE, Cleveland OH.
[61] S.Saqib.,Tariq, S.M., & Z. Ali (2015). Improving Rock Fragmentation using airdeck
blasting technique, Pakistan Journal of Engineering and Applied Sciences, Vol 17,
July 2015 (P 46-52).