
IMPORTANT: A framework to systematically analyze the Impact of Mobility on Performance of RouTing...
11
IMPORTANT: A framework to systematically analyze the Impact of Mobility on Performance of RouTing protocols for Adhoc NeTworks Fan Bai Dept. of Electrical Engineering Univ. of Southern California Los Angeles, CA 90089-2562 Email: [email protected] Narayanan Sadagopan Dept. of Computer Science Univ. of Southern California Los Angeles, CA 90089-0781 Email: [email protected] Ahmed Helmy Dept. of Electrical Engineering Univ. of Southern California Los Angeles, CA 90089-2562 Email: [email protected] Abstract— A Mobile Ad hoc Network (MANET) is a collection of wireless mobile nodes forming a temporary network without using any existing infrastructure. Since not many MANETs are currently deployed, research in this area is mostly simulation based. Random Waypoint is the commonly used mobility model in these simulations. Random Waypoint is a simple model that may be applicable to some scenarios. However, we believe that it is not sufficient to capture some important mobility characteristics of scenarios in which MANETs may be deployed. Our framework aims to evaluate the impact of different mobility models on the performance of MANET routing protocols. We propose various protocol independent metrics to capture interesting mobility characteristics, including spatial and temporal dependence and geographic restrictions. In addition, a rich set of parameterized mobility models is introduced including Random Waypoint, Group Mobility, Freeway and Manhattan models. Based on these models several ’test-suite’ scenarios are chosen carefully to span the metric space. We demonstrate the utility of our test- suite by evaluating various MANET routing protocols, including DSR, AODV and DSDV. Our results show that the protocol performance may vary drastically across mobility models and performance rankings of protocols may vary with the mobility models used. This effect can be explained by the interaction of the mobility characteristics with the connectivity graph properties. Finally, we attempt to decompose the routing protocols into mechanistic “building blocks” to gain a deeper insight into the performance variations across protocols in the face of mobility. I. I NTRODUCTION A Mobile Ad hoc NETwork (MANET) is a collection of wireless nodes communicating with each other in the absence of any infrastructure. Classrooms, battlefields and disaster relief activities are a few scenarios where MANETs can be used. MANET research is gaining ground due to the ubiquity of small, inexpensive wireless communicating devices. Since, not many MANETs have been deployed, most of this research is simulation based. These simulations have several parameters including the mobility model and the communicating traffic pattern. In this paper, we focus on the impact of mobility models on the performance of MANET routing protocols. We acknowledge that the communicating traffic pattern also has a significant impact on the routing protocol performance and merits a study on its own. However, as in most studies in this area, in order to isolate the effect of mobility, we fix the communicating traffic pattern to consist of randomly chosen source-destination pairs with long enough session times. Mobility pattern, in many previous works was assumed to be Random Waypoint. In the current network simulator (ns- 2) distribution, the implementation of this mobility model is as follows: at every instant, a node randomly chooses a destination and moves towards it with a velocity chosen uni- formly randomly from [0,V max ], where V max is the maximum allowable velocity for every mobile node [1]. Most of the simulations using the Random Waypoint model are based on this standard implementation. For the rest of the paper, we refer to this basic implementation as the Random Waypoint model. In the future, MANETs are expected to be deployed in myriads of scenarios having complex node mobility and connectivity dynamics. For example, in a MANET on a battlefield, the movement of the soldiers will be influenced by the commander. In a city-wide MANET, the node movement is restricted by obstacles or maps. The node mobility charac- teristics are very application specific. Widely varying mobility characteristics are expected to have a significant impact on the performance of the routing protocols like DSR [2], DSDV [3] and AODV [4]. Random Waypoint is a well designed model but it is insufficient to capture the following characteristics: 1) Spatial dependence of movement among nodes. 2) Temporal Dependence of movement of a node over time. 3) Existence of barriers or obstacles constraining mobility. In this study, we focus on the impact of the above mentioned mobility characteristics on protocol performance. While doing so, we propose a generic framework to systematically analyze the impact of mobility on the performance of routing protocols for MANETs. This analysis attempts to answer the following questions: 1) Whether mobility affects routing protocol performance? 2) If the answer to 1 is yes, why? 3) If the answer to 1 is yes, how? To answer Whether, the framework evaluates the perfor- 0-7803-7753-2/03/$17.00 (C) 2003 IEEE 825
-
Upload
independent -
Category
Documents
-
view
1 -
download
0
Transcript of IMPORTANT: A framework to systematically analyze the Impact of Mobility on Performance of RouTing...

IMPORTANT: A framework to systematicallyanalyze the Impact of Mobility on Performance of
RouTing protocols for Adhoc NeTworksFan Bai
Dept. of Electrical EngineeringUniv. of Southern California
Los Angeles, CA 90089-2562Email: [email protected]
Narayanan SadagopanDept. of Computer Science
Univ. of Southern CaliforniaLos Angeles, CA 90089-0781
Email: [email protected]
Ahmed HelmyDept. of Electrical EngineeringUniv. of Southern California
Los Angeles, CA 90089-2562Email: [email protected]
Abstract— A Mobile Ad hoc Network (MANET) is a collectionof wireless mobile nodes forming a temporary network withoutusing any existing infrastructure. Since not many MANETs arecurrently deployed, research in this area is mostly simulationbased. Random Waypoint is the commonly used mobility modelin these simulations. Random Waypoint is a simple model thatmay be applicable to some scenarios. However, we believe that it isnot sufficient to capture some important mobility characteristicsof scenarios in which MANETs may be deployed. Our frameworkaims to evaluate the impact of different mobility models on theperformance of MANET routing protocols. We propose variousprotocol independent metrics to capture interesting mobilitycharacteristics, including spatial and temporal dependence andgeographic restrictions. In addition, a rich set of parameterizedmobility models is introduced including Random Waypoint,Group Mobility, Freeway and Manhattan models. Based onthese models several ’test-suite’ scenarios are chosen carefullyto span the metric space. We demonstrate the utility of our test-suite by evaluating various MANET routing protocols, includingDSR, AODV and DSDV. Our results show that the protocolperformance may vary drastically across mobility models andperformance rankings of protocols may vary with the mobilitymodels used. This effect can be explained by the interaction of themobility characteristics with the connectivity graph properties.Finally, we attempt to decompose the routing protocols intomechanistic “building blocks” to gain a deeper insight into theperformance variations across protocols in the face of mobility.
I. INTRODUCTION
A Mobile Ad hoc NETwork (MANET) is a collection ofwireless nodes communicating with each other in the absenceof any infrastructure. Classrooms, battlefields and disasterrelief activities are a few scenarios where MANETs can beused. MANET research is gaining ground due to the ubiquityof small, inexpensive wireless communicating devices. Since,not many MANETs have been deployed, most of this researchis simulation based. These simulations have several parametersincluding the mobility model and the communicating trafficpattern. In this paper, we focus on the impact of mobilitymodels on the performance of MANET routing protocols. Weacknowledge that the communicating traffic pattern also hasa significant impact on the routing protocol performance andmerits a study on its own. However, as in most studies in
this area, in order to isolate the effect of mobility, we fix thecommunicating traffic pattern to consist of randomly chosensource-destination pairs with long enough session times.
Mobility pattern, in many previous works was assumed tobe Random Waypoint. In the current network simulator (ns-2) distribution, the implementation of this mobility modelis as follows: at every instant, a node randomly chooses adestination and moves towards it with a velocity chosen uni-formly randomly from [0, Vmax], where Vmax is the maximumallowable velocity for every mobile node [1]. Most of thesimulations using the Random Waypoint model are based onthis standard implementation. For the rest of the paper, werefer to this basic implementation as the Random Waypointmodel.
In the future, MANETs are expected to be deployed inmyriads of scenarios having complex node mobility andconnectivity dynamics. For example, in a MANET on abattlefield, the movement of the soldiers will be influenced bythe commander. In a city-wide MANET, the node movementis restricted by obstacles or maps. The node mobility charac-teristics are very application specific. Widely varying mobilitycharacteristics are expected to have a significant impact on theperformance of the routing protocols like DSR [2], DSDV [3]and AODV [4]. Random Waypoint is a well designed modelbut it is insufficient to capture the following characteristics:
1) Spatial dependence of movement among nodes.2) Temporal Dependence of movement of a node over time.3) Existence of barriers or obstacles constraining mobility.
In this study, we focus on the impact of the above mentionedmobility characteristics on protocol performance. While doingso, we propose a generic framework to systematically analyzethe impact of mobility on the performance of routing protocolsfor MANETs. This analysis attempts to answer the followingquestions:
1) Whether mobility affects routing protocol performance?2) If the answer to 1 is yes, why?3) If the answer to 1 is yes, how?
To answer Whether, the framework evaluates the perfor-
0-7803-7753-2/03/$17.00 (C) 2003 IEEE 825

Mobility Models
Mobility Metrics
ConnectivityGraph
Connectivity Metrics
Performance Metrics
RoutingProtocol
Performance
Random WaypointGroup Mobility
Freeway MobilityManhattan Mobility
DSRAODVDSDV
Relative SpeedSpatial Dependence
Link Duration ThroughputOverhead
BuildingBlock
Analysis
FloodingCaching
Error DetectionError Handling
Error Notification
Fig. 1. IMPORTANT Framework
mance of these routing protocols over different mobility pat-terns that capture some of the characteristics listed above. Themobility models used in our study include the Random Way-point, Group Mobility [5], Freeway and Manhattan. To answerWhy, we propose some protocol independent metrics suchas mobility metrics and connectivity graph metrics. Mobilitymetrics aim to capture some of the aforementioned mobilitycharacteristics. Connectivity graph metrics aim to study theeffect of different mobility patterns on the connectivity graphof the mobile nodes. It has also been observed in previousworks that under a given mobility pattern, routing protocolslike DSR, DSDV and AODV perform differently [6] [7][8]. This is possibly because each protocol differs in the basicmechanisms or “building blocks” it uses. For example, DSRuses route discovery, while DSDV uses periodic updates. Toanswer How, we want to investigate the effect of mobilityon some of these “building blocks” and how they impact theprotocol performance as a “whole”.
In order to conduct our research and answer the above ques-tions systematically, we propose a framework for analyzing theImpact of Mobility on the Performance Of RouTing protocolsin Adhoc NeTworks (IMPORTANT). Through this frameworkwe illustrate how modeling mobility is important in affectingrouting performance and understanding the mechanism of adhoc routing protocols. As shown in Fig.1, our frameworkfocuses on the following aspects: mobility models, the metricsfor mobility and connectivity graph characteristics, the poten-tial relationship between mobility and routing performance andthe analysis of impact of mobility on building blocks of ad hocrouting protocols.
The rest of this paper is organized as follows. Section IIgives a brief description of the related work and elaboratesour contribution. Section III discusses some limitations of theRandom Waypoint model and motivates part of our framework.Section IV presents our proposed metrics to capture charac-teristics of mobility and the connectivity graph between themobile nodes. Section V describes the mobility models usedand introduces two new models, the Freeway mobility modeland the Manhattan mobility model. Results of our simulationexperiments are presented and discussed in Section VI. Theanalysis of the impact of mobility on protocol building blocksis discussed in Section VII. Finally, our conclusions from thisstudy and planned future work are listed in section VIII.
II. RELATED WORK
Extensive research has been done in modeling mobility forMANETs. In this section, we mainly focus on experimentalresearch in this area. This research can be broadly classifiedas follows based on the methodology used:
A. Random Waypoint Based Performance Comparisons
Much of the initial research was based on using RandomWaypoint as the underlying mobility model and CBR trafficconsisting of randomly chosen source destination pairs as thetraffic pattern. Routing protocols like DSR [2], DSDV [3],AODV [4] and TORA [9] were mainly evaluated based onthe following metrics: packet delivery ratio (ratio of thenumber of packets received to the number of packets sent)and routing overhead (number of routing control packets sent).[6] concluded that on-demand protocols such as DSR andAODV performed better than table driven ones such as DSDVat high mobility rates, while DSDV performed quite well atlow mobility rates. [7] performed a comparison study ofthe two on-demand routing protocols: DSR and AODV, usingthe performance metrics of packet delivery ratio and end toend delay. It observed that DSR outperforms AODV in lessdemanding situations, while AODV outperforms DSR at heavytraffic load and high mobility. However, the routing overheadof DSR was found to be lesser than that of AODV. In the aboveworks, focus was given on performance evaluation, whileparameters investigated in the mobility model were changeof maximum velocity and pause time. In our work, however,we design our test suites very carefully to pick scenarios thatspan a much larger set of mobility characteristics. Not onlydo we use Random Waypoint but also other mobility modelssuch as RPGM [5], Freeway and Manhattan in our evaluationof the performance of routing protocols.
B. Scenario Based Performance Comparisons
Random Waypoint is a simple model that is easy to analyzeand implement. This has probably been the main reason for thewidespread use of this model for simulations. Realizing thatRandom Waypoint is too general a model, recent research hasstarted focusing on alternative mobility models and protocolindependent metrics to characterize them. [10] conducteda scenario based performance analysis of the MANET pro-tocols. It proposed models for a few “realistic” scenariossuch as a conference, event coverage and disaster relief. Todifferentiate between scenarios used, the study introduced therelative motion of the mobile nodes as a mobility metric.Their conclusions about the performance of proactive andreactive protocols were similar to [6]. [8] used a mobilitymodel in which each node computes its next position basedon a probability distribution. This model does not allowsignificant changes in direction between successive instants.It concluded that proactive protocols perform better thanreactive ones in terms of packet delivery ratio and end-to-end delay. However, reactive protocols were seen to incur alower routing overhead. [5] introduced the Reference PointGroup Mobility (RPGM) model, which is one of the mobility
826
models used in this study. Rate of link changes was used tocharacterize a few group mobility patterns as well as RandomWaypoint. It observed that the rate of link change for RandomWaypoint was higher than that for RPGM. From experiments,it observed that protocols like AODV, DSDV and HSR [11]perform worse with Random Waypoint than with RPGM.Thus, it concluded that mobility models do matter and it isnot sufficient to simulate protocols with only the “randomwalk” like models. [12] proposed a mobility framework thatconsisted of a Mobility Vector Model which can be used togenerate “realistic” movement patterns used in several variedapplications. It proposed the Displacement Measure that is anormalization of the actual distance traveled by the geographicdisplacement as a metric to evaluate the different movementpatterns including those generated by Random Waypoint,Random Walk, RPGM and Mobility Vector models. By exper-iments, it observed that Random Waypoint and Random Walkproduced higher Displacement Measure as compared to theMobility Vector model. It studied the effect of transmissionrange on throughput across different mobility models andconcluded that as the transmission range is increased, the rateof link changes decreased and the throughput for all protocolsincreased. However, the link change rate does not seem tovary greatly across the different mobility models. As far asrouting overhead was concerned, Mobility Vector was seento produce a worse overhead than Random Waypoint. Ourstudy is also framework based. However, we do not aim toprovide a generic mobility model from which all “realistic”mobility patterns can be derived. Rather, our framework aimsat systematically studying the effect of mobility per se onperformance of MANET routing protocols. The contributionsof our proposed framework are three fold:
1) Focus on mobility characteristics such as spatial depen-dence, geographic restrictions and temporal dependence.Define mobility metrics that capture these characteris-tics. Choose mobility models that span the metric spaceand use them to evaluate the performance of routingprotocols.
2) Define connectivity graph metrics. Study the interactionof mobility metrics and connectivity graph metrics andits effect on protocol performance.
3) Analyze the reasons for the differences in protocolperformance as a “whole” by investigating the effect ofmobility on “parts” that build the protocol.
III. LIMITATIONS OF RANDOM WAYPOINT
Random Waypoint model was introduced in [6] and isamong the most commonly used mobility models in theMANET research community. In this model, at every instant,each mobile node chooses a random destination and movestowards it with a speed uniformly distributed in [0, Vmax],where Vmax is the maximum allowable speed for a node. Afterreaching the destination, the node stops for a duration definedby the “pause time” parameter. After this duration, it againchooses a random destination and repeats the whole processagain until the simulation ends.
The Random Waypoint model is widely accepted mainlydue to its simplicity of implementation and analysis. However,we observe that the basic Random Waypoint model as used inmost of the simulations is insufficient to capture the followingmobility characteristics:
1) Temporal dependency: Due to physical constraints ofthe mobile entity itself, the velocity of mobile nodewill change continuously and gently instead of abruptly,i.e. the current velocity is dependent on the previousvelocity. However, the velocities at two different timeslots are independent in the Random Waypoint model.
2) Spatial dependency: The movement pattern of a mobilenode may be influenced by and correlated with nodesin its neighborhood. In Random Waypoint, each mobilenode moves independently of others.
3) Geographic restrictions: In many cases, the movementof a mobile node may be restricted along the street or afreeway. A geographic map may define these boundaries.
In our study, we focus on the above-mentioned characteristics.In the next section, we formally define metrics to capture someof these characteristics.
IV. METRICS
To quantitatively and qualitatively analyze the impact ofmobility on routing protocol performance, we make use ofseveral protocol independent metrics and protocol performancemetrics. The protocol independent metrics attempt to extractthe characteristics of mobility and the connectivity graphbetween the mobile nodes. These metrics are then used toexplain the impact of mobility on the protocol performancemetrics. The metrics we use can be broadly classified as:
1) Protocol Independent Metrics.2) Protocol Performance Metrics.
A. Terminology
Before formally defining the metrics, we introduce somebasic terminology that will be used later in the paper:
1) �Vi(t): Velocity vector of node i at time t.2) |�Vi(t)|: Speed of node i at time t.3) θi(t): Angle made by �Vi(t) at time t with the X-axis.4) �ai(t): Acceleration vector of node i at time t.5) xi(t): X co-ordinate of node i at time t.6) yi(t): Y co-ordinate of node i at time t.7) Di,j(t): Euclidean Distance between nodes i and j at
time t.8) RD(�a(t),�b(t′)): Relative Direction(RD) (or cosine of
the angle) between the two vectors �a(t),�b(t′) is given
by �a(t)·�b(t′)|�a(t)|∗|�b(t′)| .
9) SR(�a(t),�b(t′)): Speed Ratio(SR) between the two vec-
tors �a(t),�b(t′) is given bymin |�a(t)|,|�b(t′)|max |�a(t)|,|�b(t′)| .
10) R: Transmission range of a mobile node.11) N : Number of mobile nodes.12) T : Simulation time.13) random(): returns a value uniformly distributed in the
interval [−1, 1].
827

B. Protocol Independent Metrics
Mobility Metrics: We propose these metrics to differentiatethe various mobility patterns used in our study. The basisof differentiation is the extent to which a given mobilitypattern captures the characteristics of spatial dependence,temporal dependence and geographic restrictions. In additionto these metrics, we also use the Relative Speed metric thatdifferentiates mobility patterns based on relative motion. Thismetric was proposed in [10].
1) Degree of Spatial Dependence: It is extent of similarityof the velocities of two nodes that are not too far apart.Formally,
Dspatial(i, j, t) = RD(�vi(t), �vj(t)) ∗ SR(�vi(t), �vj(t))
The value of Dspatial(i, j, t) is high when the nodesi and j travel in more or less the same directionand at almost similar speeds. However, Dspatial(i, j, t)decreases if the Relative Direction or the Speed Ratiodecreases.As it is rare for a node’s motion to be spatially dependenton a far off node, we add the condition that
Di,j(t) > c1 ∗ R ⇒ Dspatial(i, j, t) = 0
where c1 > 0 is a constant which will be determinedduring our experiments in VI.Average Degree of Spatial Dependence: It is the valueof Dspatial(i, j, t) averaged over node pairs and timeinstants satisfying certain condition. Formally,
D̄spatial =
∑Tt=1
∑Ni=1
∑Nj=i+1 Dspatial(i, j, t)P
where P is the number of tuples (i, j, t) such thatDspatial(i, j, t) �= 0. Thus, if mobile nodes move in-dependently of one another, then the mobility pattern isexpected to have a smaller value for D̄spatial. On theother hand, if the node movement is co-ordinated by acentral entity, or influenced by nodes in its neighbor-hood, such that they move in similar directions and atsimilar speeds, then the mobility pattern is expected tohave a higher value for D̄spatial .
2) Degree of Temporal Dependence: It is the extentof similarity of the velocities of a node at two timeslots that are not too far apart. It is a function of theacceleration of the mobile node and the geographicrestrictions. Formally,
Dtemporal(i, t, t′) = RD(�vi(t), �vi(t′))∗SR(�vi(t), �vi(t′))
The value of Dtemporal(i, t, t′) is high when the nodetravels in more or less the same direction and almostat the same speed over a certain time interval that canbe defined. However, Dtemporal(i, t, t′) decreases if theRelative Direction or the Speed Ratio decreases.Arguing in a way similar to that for Dspatial(i, j, t), wehave the following condition
|t − t′| > c2 ⇒ Dtemporal(i, t, t′) = 0
where c2 > 0 is a constant which will be determinedduring our experiments in section VI.Average Degree of Temporal Dependence: It is thevalue of Dtemporal(i, t, t′) averaged over nodes and timeinstants satisfying certain condition. Formally,
D̄temporal =∑N
i=1∑T
t=1∑T
t′=1 Dtemporal(i, t, t′)P
where P is the number of tuples (i, t, t′) such thatDtemporal(i, t, t′) �= 0 Thus, if the current velocity of anode is completely independent of its velocity at someprevious time step, then the mobility pattern is expectedto have a smaller value for D̄temporal. However, if thecurrent velocity is strongly dependent on the velocityat some previous time step, then the mobility pattern isexpected to have a higher value for D̄temporal.
3) Relative Speed (RS): We use the standard definitionfrom physics i.e.
RS(i, j, t) = |�Vi(t) − �Vj(t)|
As in the case of Dspatial(i, j, t), we add the followingcondition
Di,j(t) > c3 ∗ R ⇒ RS(i, j, t) = 0
where c3 > 0 is a constant which will be determinedduring our experiments in VI.Average Relative Speed: It is the value of RS(i, j, t)averaged over node pairs and time instants satisfyingcertain condition. Formally,
R̄S =
∑Ni=1
∑Nj=1
∑Tt=1 RS(i, j, t)
P
where P is the number of tuples (i, j, t) such thatRS(i, j, t) �= 0.
4) Geographic Restrictions: We developed the notion ofdegree of freedom of points on a map. Degree offreedom of a point is the number of directions a node cango after reaching that point1. We do not quantitativelydefine the Geographic Restrictions, but we qualitativelyinclude it in our study as will be seen in Section V.
Connectivity Graph Metrics: Since routing protocol per-formance is in general affected by the network topologydynamics, we feel that it is useful to have metrics to analyzethe effect of mobility on the connectivity graph between themobile nodes. The connectivity graph metrics aim to studythis effect. These metrics might also help in relating mobilitymetrics with protocol performance, which will be shown inSection VI.
The connectivity graph is the graph G = (V,E), such that|V | = N and at time t, a link (i, j) ∈ E iff Di,j(t) ≤ R.Let X(i, j, t) be an indicator random variable which has avalue 1 iff there is a link between nodes i and j at time t.X(i, j) = maxT
t=1X(i, j, t) be an indicator random variable
1Currently we do not have a good way of quantitatively aggregating thisdefinition for the whole map. This is part of our on going and future work.
828
which is 1 if a link existed between nodes i and j at any timeduring the simulation, 0 otherwise.
1) Number of Link Changes: Number of link changesfor a pair of nodes i and j is the number of timesthe link between them transitions from “down” to “up”.Formally,
LC(i, j) =T∑
t=1
C(i, j, t)
where C(i, j, t) is an indicator random variable such thatC(i, j, t) = 1 iff X(i, j, t − 1) = 0 and X(i, j, t) = 1i.e. if the link between nodes i and j is down at timet − 1, but comes up at time t.Average Number of Link Changes: It is the valueof LC(i, j) averaged over node pairs satisfying certaincondition. Formally,
L̄C =
∑Ni=1
∑Nj=i+1 LC(i, j)P
where P is the number of pairs i,j such that X(i, j) �= 0.2) Link Duration: It is the average duration of the link
existing between two nodes i and j. It is a measure ofstability of the link between these nodes. Formally,
LD(i, j) =
∑T
t=1X(i,j,t)
LC(i,j)if LC(i, j) �= 0
∑Tt=1 X(i, j, t) otherwise
(1)Average Link Duration: It is the value of LD(i, j)averaged over node pairs satisfying certain condition.Formally,
L̄D =
∑Ni=1
∑Nj=i+1 LD(i, j)P
where P is the number of pairs i,j such that X(i, j) �= 0.3) Path Availability: It is the fraction of time during which
a path is available between two nodes i and j. The nodepairs of interest are the ones that have communicationtraffic between them. Formally,
PA(i, j) =
∑T
t=start(i,j)A(i,j,t)
T−start(i,j) if T − start(i, j) > 00 otherwise
(2)where A(i, j, t) is an indicator random variable whichhas a value 1 if a path is available from node i to nodej at time t, and has a value 0 otherwise. start(i, j) is thetime at which the communication traffic between nodesi and j starts.Average Path Availability: It is the value of PA(i, j)averaged over node pairs satisfying certain condition.Formally,
P̄A =
∑Ni=1
∑Nj=i+1 PA(i, j)P
where P is the number of pairs i,j such that T −start(i, j) > 0.
C. Protocol Performance Metrics:
We evaluate the performance of the MANET routing pro-tocols using the metrics of throughput (ratio of the number ofpackets delivered to the number of packets sent) and routingoverhead (number of routing control packets sent) as done inseveral previous studies in this area of research.
V. MOBILITY MODELS
As mentioned in Section I, Random Waypoint does notseem to capture the mobility characteristics of spatial depen-dence, temporal dependence and geographic restrictions. Inthe previous section, we defined Mobility metrics that eitherqualitatively or quantitatively define these characteristics. Tothoroughly study the effect of mobility on MANET protocolperformance, we seek to evaluate the protocols over a richset of mobility models that span the design space of theMobility metrics. Thus, apart from Random Waypoint, we usethe following mobility models:
1) Reference Point Group Mobility (RPGM) Model2) Freeway Mobility Model3) Manhattan Mobility ModelEach of the above models has certain characteristics that are
different from Random Waypoint, which will be shown by ourmetrics and simulations.
1) RPGM Model: [5] introduced this model. Here, eachgroup has a logical center (group leader) that determinesthe group’s motion behavior. Initially, each member ofthe group is uniformly distributed in the neighborhoodof the group leader. Subsequently, at each instant, everynode has a speed and direction that is derived byrandomly deviating from that of the group leader.Applications: Group mobility can be used in militarybattlefield communications where the commander andsoldiers form a logical group. More applications arementioned in [5].Important Characteristics: Each node deviates its ve-locity (both speed and direction) randomly from thatof the leader. The movement in group mobility can becharacterized as follows:
a)∣∣∣�Vmember(t)
∣∣∣ =∣∣∣�Vleader(t)
∣∣∣ + random() ∗SDR ∗max speed
b) θmember(t) = θleader(t) + random() ∗ ADR ∗max angle
where 0 ≤ SDR,ADR ≤ 1. SDR is the SpeedDeviation Ratio and ADR is the Angle Deviation Ratio.SDR and ADR are used to control the deviation of thevelocity (magnitude and direction) of group membersfrom that of the leader. max speed and max angle areused to specify the maximum deviation a group membercan take. In our simulation, we set maximum speedfor the group leader as the max speed and set 180◦ asthe max angle. Since the group leader mainly decidesthe mobility of group members, group mobility patternis expected to have high spatial dependence for smallvalues of SDR and ADR.
829
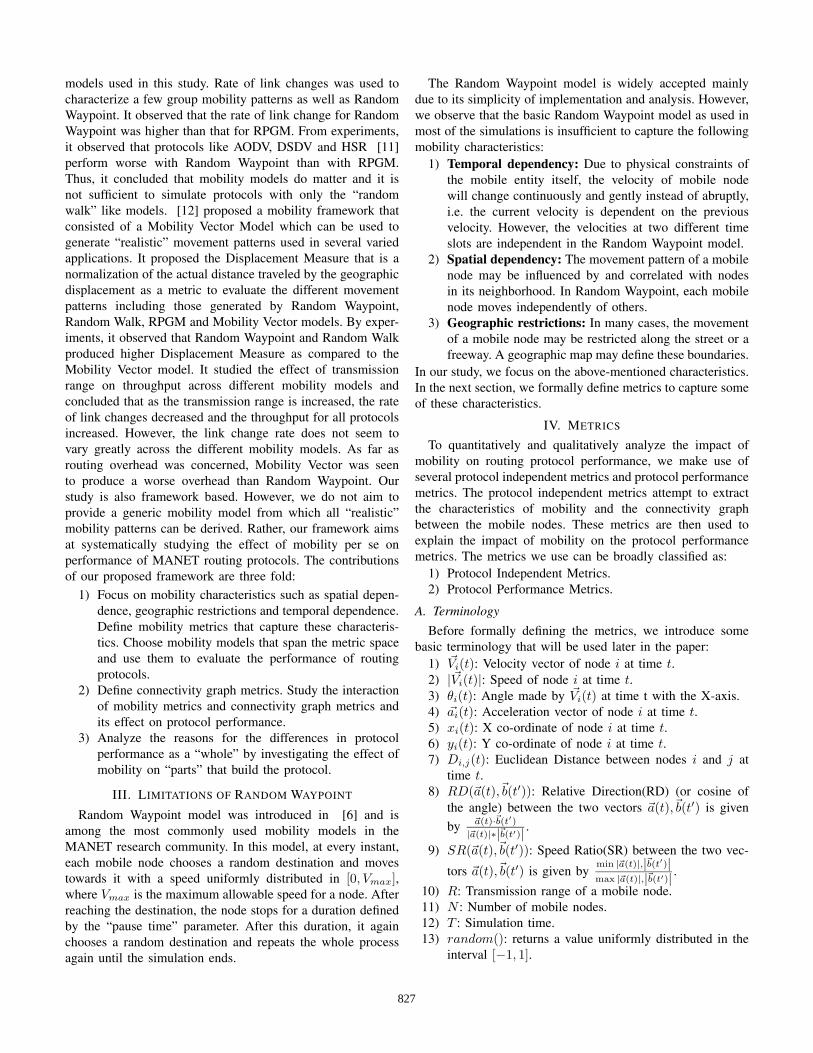
2) Freeway Mobility Model: We propose this new modelto emulate the motion behavior of mobile nodes on afreeway. The freeway map used in our study is shownin Fig.2.Applications: It can be used in exchanging traffic statusor tracking a vehicle on a freeway.Important Characteristics: In this model we use maps.There are several freeways on the map and each freewayhas lanes in both directions. The differences betweenRandom Waypoint and Freeway are the following:
a) Each mobile node is restricted to its lane on thefreeway.
b) The velocity of mobile node is temporally depen-dent on its previous velocity.
c) If two mobile nodes on the same freeway lane arewithin the Safety Distance (SD), the velocity ofthe following node cannot exceed the velocity ofpreceding node.
The inter-node and intra-node relationships involved are:
a)∣∣∣�Vi(t + 1)
∣∣∣ =∣∣∣�Vi(t)
∣∣∣ + random() ∗ |�ai(t)|b) ∀i,∀j,∀t Di,j(t) ≤ SD ⇒ |�Vi(t)| ≤ | �Vj(t)|, if j
is ahead of i in its lane.Due to the above relationships, the Freeway mobilitypattern is expected to have spatial dependence and hightemporal dependence. It also imposes strict geographicrestrictions on the node movement by not allowing anode to change its lane.
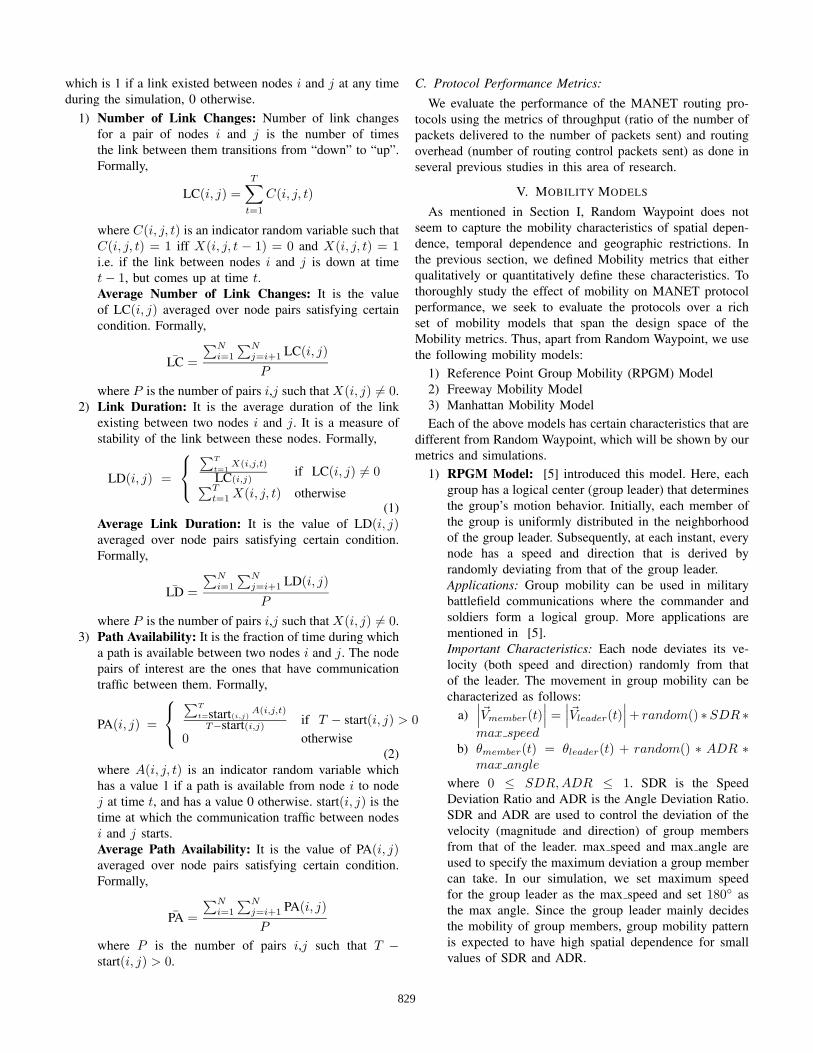
3) Manhattan Mobility Model: We introduce the Manhat-tan model to emulate the movement pattern of mobilenodes on streets defined by maps. The Manhattan mapused in our study is shown in Fig.3.Applications: It can be useful in modeling movementin an urban area where a pervasive computing servicebetween portable devices is provided.Important Characteristics: Maps are used in this modeltoo. The map is composed of a number of horizontaland vertical streets. Each street has two lanes for eachdirection (North and South direction for vertical streets,East and West for horizontal streets). The mobile node isallowed to move along the grid of horizontal and verticalstreets on the map. At an intersection of a horizontal anda vertical street, the mobile node can turn left, right orgo straight. This choice is probabilistic: the probabilityof moving on the same street is 0.5, the probability ofturning left is 0.25 and the probability of turning rightis 0.25.The velocity of a mobile node at a time slot is dependenton its velocity at the previous time slot. Also, a node’svelocity is restricted by the velocity of the node preced-ing it on the same lane of the street. The inter-node andintra-node relationships involved are the same as in theFreeway model.Thus, the Manhattan mobility model is also expectedto have high spatial dependence and high temporaldependence. It too imposes geographic restrictions on
Fig. 2. Map used in Freeway Mobility Model
Fig. 3. Map used in Manhattan Mobility Model
node mobility. However, it differs from the Freewaymodel in giving a node some freedom to change itsdirection.
Most of the mobility models mentioned above are parame-terized. E.g. SDR and ADR are some of the parameters used inRPGM, while maps are important parameters in the Freewayand Manhattan models. Although we did not quantitativelydefine Geographic Restrictions in Section IV, we qualitativelyinclude them in our study by using the Freeway and Manhattanmodels. Using a parameterized approach, we aim to get a goodcoverage of design space of the proposed mobility metrics byproducing a rich set of mobility patterns that can be used asa “test-suite” for further research.
VI. EXPERIMENTS
As a first step, we wanted to validate if our proposedmetrics differentiate the mobility models. Once this was done,we focused on answering the following questions: Whethermobility affects protocol performance?, if yes, we attempt toanswer the questions Why? and How? mentioned in Section I.
A. Validating the Mobility Metrics
Our mobility scenario generator produced the different mo-bility patterns following the RPGM, Freeway and Manhattanmodels according to the format required by ns-2. In all thesepatterns, 40 mobile nodes moved in an area of 1000m x 1000mfor a period of 900 seconds. Random Waypoint mobilitypattern was generated using the setdest tool which is a partof the ns-2 distribution. For RPGM, we used 2 differentmobility scenarios: single group of 40 nodes and 4 groups of10 nodes each moving independently of each other and in anoverlapping fashion. Both Speed Deviation Ratio (SDR) and
830
0 10 20 30 40 50 60Maximum Speed (m/sec)
0
10
20
30
40
50
Ave
rage
Rel
ativ
e Sp
eed
(m/s
ec)
Random WaypointRPGM (Single Group)RPGM (4 Groups)FreewayManhattan
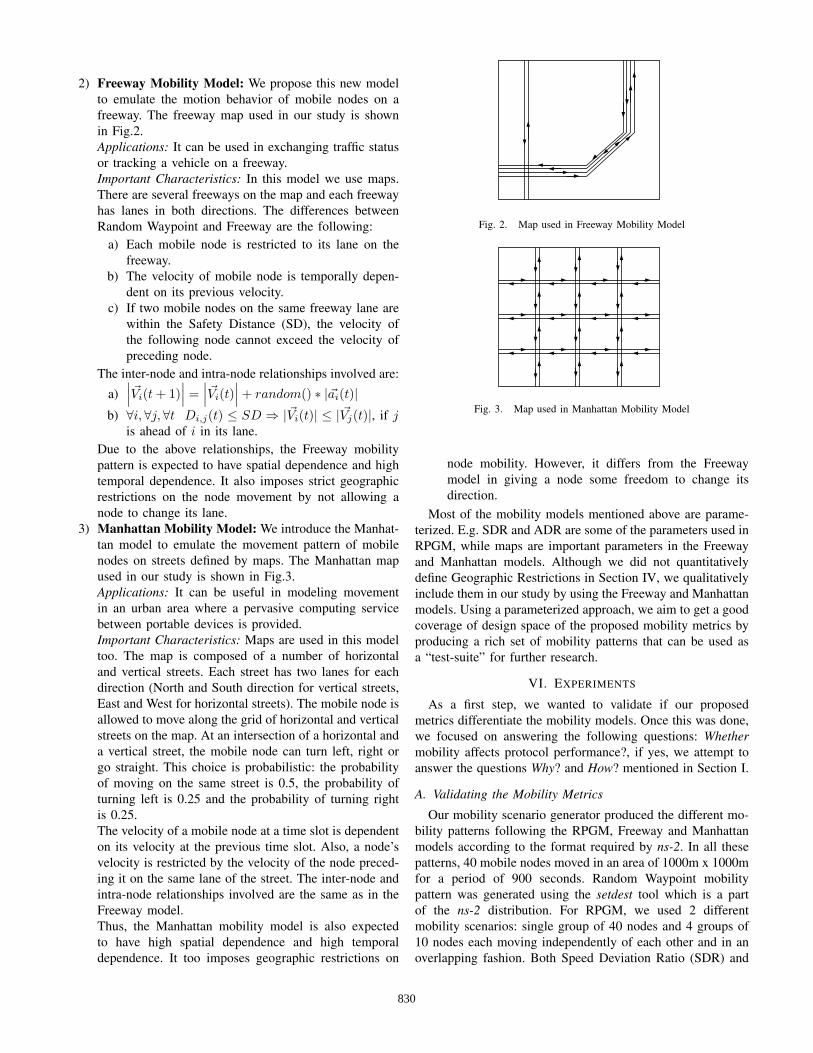
Fig. 4. Average Relative Speed
0 10 20 30 40 50 60Maximum Speed (m/sec)
0
0.05
0.1
0.15
0.2
0.25
0.3
0.35
0.4
0.45
0.5
0.55
Ave
rage
Deg
ree
of S
patia
l Dep
ende
nce
Random WaypointRPGM (Single Group)RPGM (4 groups)FreewayManhattan
Fig. 5. Average Degree of Spatial Dependence
Angle Deviation Ratio (ADR) were set to 0.1. For the Freewayand Manhattan models, the nodes were placed on the freewaylanes or local streets randomly in both directions initially.Their movement was controlled as per the specifications ofthe models. If a node moves beyond the boundary of the areait is re-inserted at the beginning position in a randomly chosenlane in the area. The maximum speed Vmax was set to 1, 5, 10,20, 30, 40, 50 and 60 m/sec to generate different movementpatterns for the same mobility model. On evaluating thesepatterns with our mobility metrics, we observed that someof the metrics were able to differentiate between the mobilitypatterns based on the characteristics we focused on, while theothers failed.
Average Relative Speed (R̄S): We experimented with differ-ent values of the constant c3 mentioned in Section IV. For thevalue of c3 = 2, R̄S could differentiate between the differentmobility patterns very clearly. As seen in Fig.4, R̄S has thelowest value for RPGM (single group and multiple groupmobility) as the nodes move together in a co-ordinated fashion
0 10 20 30 40 50 60Maximum Speed (m/sec)
0
200
400
600
800
1000
Ave
rage
Lin
k D
urat
ion
(sec
)
Random WaypointRPGM (Single Group)RPGM (Multiple Groups)FreewayManhattan
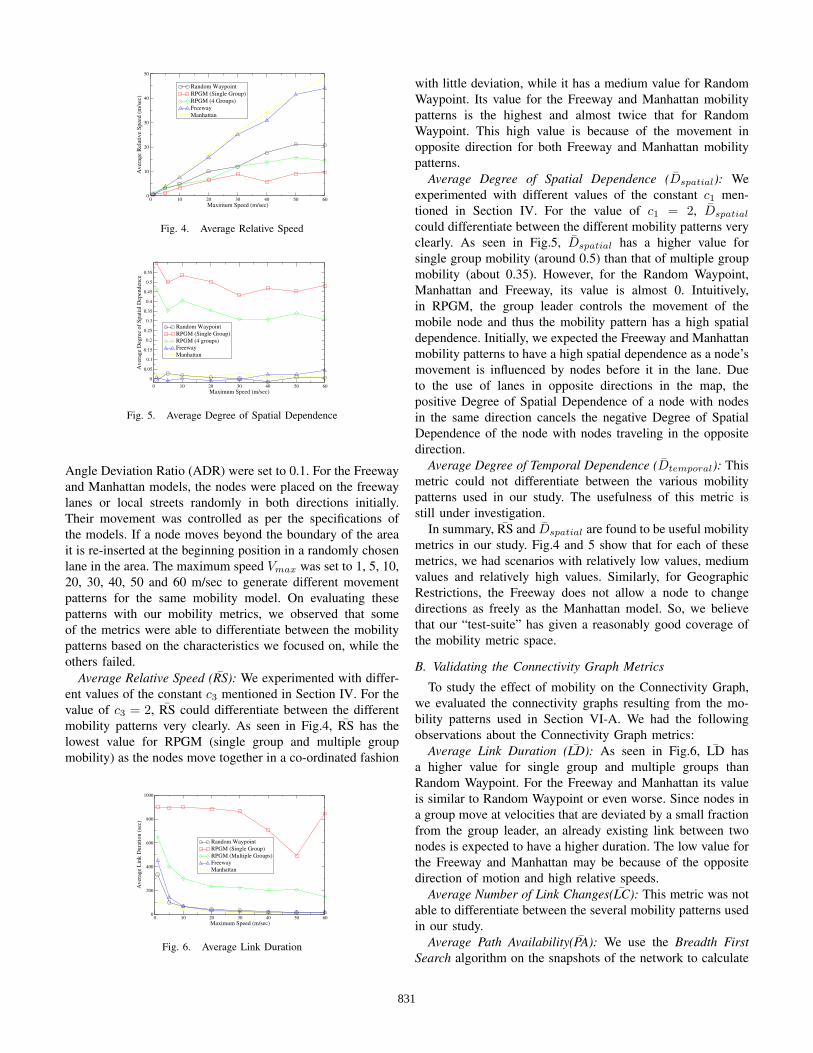
Fig. 6. Average Link Duration
with little deviation, while it has a medium value for RandomWaypoint. Its value for the Freeway and Manhattan mobilitypatterns is the highest and almost twice that for RandomWaypoint. This high value is because of the movement inopposite direction for both Freeway and Manhattan mobilitypatterns.
Average Degree of Spatial Dependence (D̄spatial): Weexperimented with different values of the constant c1 men-tioned in Section IV. For the value of c1 = 2, D̄spatial
could differentiate between the different mobility patterns veryclearly. As seen in Fig.5, D̄spatial has a higher value forsingle group mobility (around 0.5) than that of multiple groupmobility (about 0.35). However, for the Random Waypoint,Manhattan and Freeway, its value is almost 0. Intuitively,in RPGM, the group leader controls the movement of themobile node and thus the mobility pattern has a high spatialdependence. Initially, we expected the Freeway and Manhattanmobility patterns to have a high spatial dependence as a node’smovement is influenced by nodes before it in the lane. Dueto the use of lanes in opposite directions in the map, thepositive Degree of Spatial Dependence of a node with nodesin the same direction cancels the negative Degree of SpatialDependence of the node with nodes traveling in the oppositedirection.
Average Degree of Temporal Dependence (D̄temporal): Thismetric could not differentiate between the various mobilitypatterns used in our study. The usefulness of this metric isstill under investigation.
In summary, R̄S and D̄spatial are found to be useful mobilitymetrics in our study. Fig.4 and 5 show that for each of thesemetrics, we had scenarios with relatively low values, mediumvalues and relatively high values. Similarly, for GeographicRestrictions, the Freeway does not allow a node to changedirections as freely as the Manhattan model. So, we believethat our “test-suite” has given a reasonably good coverage ofthe mobility metric space.
B. Validating the Connectivity Graph Metrics
To study the effect of mobility on the Connectivity Graph,we evaluated the connectivity graphs resulting from the mo-bility patterns used in Section VI-A. We had the followingobservations about the Connectivity Graph metrics:
Average Link Duration (L̄D): As seen in Fig.6, L̄D hasa higher value for single group and multiple groups thanRandom Waypoint. For the Freeway and Manhattan its valueis similar to Random Waypoint or even worse. Since nodes ina group move at velocities that are deviated by a small fractionfrom the group leader, an already existing link between twonodes is expected to have a higher duration. The low value forthe Freeway and Manhattan may be because of the oppositedirection of motion and high relative speeds.
Average Number of Link Changes(L̄C): This metric was notable to differentiate between the several mobility patterns usedin our study.
Average Path Availability(P̄A): We use the Breadth FirstSearch algorithm on the snapshots of the network to calculate
831
0 10 20 30 40 50 60Maximum Speed (m/sec)
50
60
70
80
90
100
Thr
ough
put (
%)
Random WaypointRPGM (Single Group)RPGM (4 Groups)FreewayManhattan
Fig. 7. DSR Throughput
whether a path between a specific source destination pairexists [15]. For RPGM (single group), RPGM (mutiplegroup), Random Waypoint, Freeway and Manhattan models,P̄A is found to be around 100%, 92%, 97%, 99% and 95%respectively. In most cases, a path is available at least 95% ofthe time. Thus, the difference across the models was too smallto be of any help.
In summary, L̄D is found to be a useful metric to differen-tiate the connectivity graph arising from the different mobilitypatterns used in our study.
To evaluate the effect of mobility on the performance ofprotocols, we carried out simulations in the network simulator(ns-2) environment with the CMU Wireless Ad Hoc network-ing extension. The transmission range of the nodes was 250m.The mobility patterns used were the same as those used toSection VI-A. The traffic pattern was generated by the cbrgentool that is part of ns-2 distribution. The traffic consisted of20 Constant Bit Rate (CBR) sources and 30 connections. Thesource-destination pairs were chosen at random. The data rateused was 4 packets/sec and the packet size was 64 bytes.
To remove any effects due to randomness of the trafficpattern, we used different random seeds to generate 3 differenttraffic patterns having the same number of sources and con-nections. The results for each model (for a given Vmax) areaveraged over simulation runs using these 3 different trafficpatterns.
C. Whether mobility affects protocol performance?
We evaluated the performance of DSR, AODV and DSDVacross this rich set of mobility models and observed that themobility models may drastically affect protocol performance.We use DSR as an illustrative example. DSR shows a dif-ference of almost 40% in throughput from Manhattan to theRPGM (Single Group) model as seen from Fig.7. Also, thereis an order of magnitude difference in the routing overhead ofDSR across the various models as shown by Fig.8. Similarperformance differences were observed for other protocolsused in our study. We observed that DSR, DSDV and AODVachieve the highest throughput and the least overhead withRPGM and incur high overhead and low throughput withboth Freeway and Manhattan models. This is consistent withthe observations made in [5] which evaluated the protocolsusing Random Waypoint and several other group mobilityapplications. However, we take a step further and attempt to
0 10 20 30 40 50 60Maximum Speed (m/sec)
0
20000
40000
60000
80000
Rou
ting
Ove
rhea
d (p
acke
ts)
Random WaypointRPGM (Single Group)RPGM (4 Groups)FreewayManhattan
Fig. 8. DSR Routing Overhead
0 10 20 30 40 50 60Maximum Speed (m/sec)
50
60
70
80
90
100
Thr
ough
put (
%)
DSDVAODVDSR
Fig. 9. Random Waypoint: Throughput
analyze the reason for this performance difference in SectionVI-D.
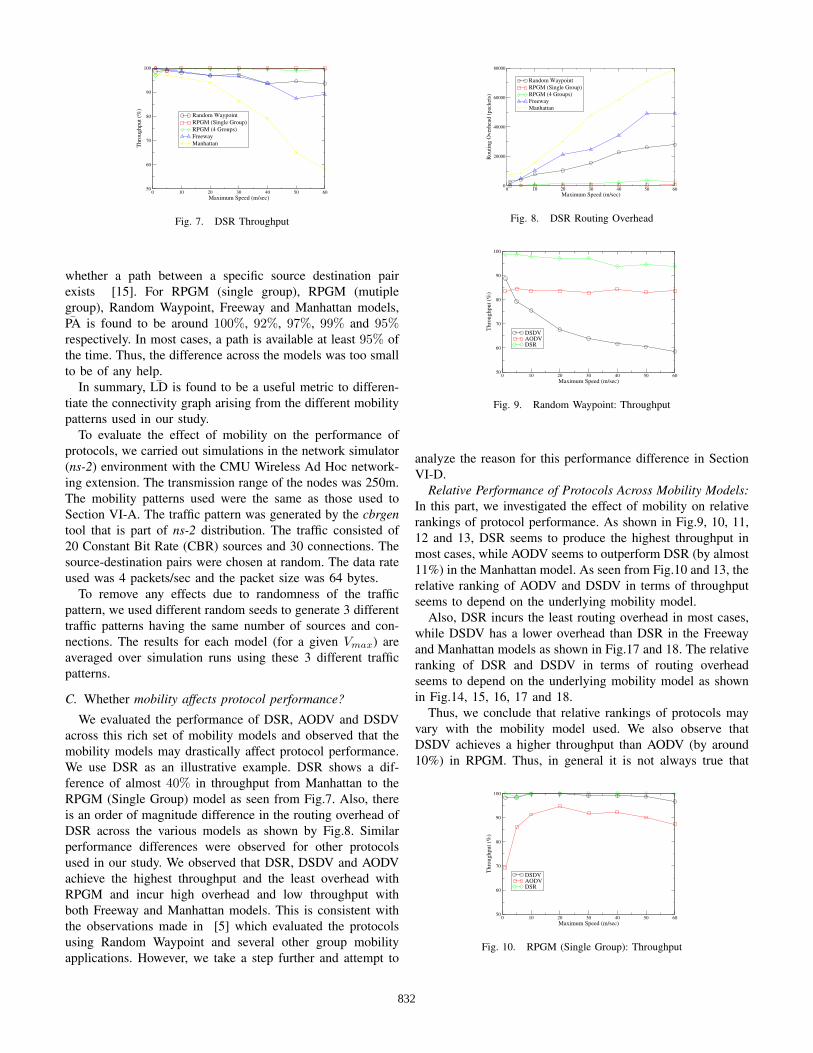
Relative Performance of Protocols Across Mobility Models:In this part, we investigated the effect of mobility on relativerankings of protocol performance. As shown in Fig.9, 10, 11,12 and 13, DSR seems to produce the highest throughput inmost cases, while AODV seems to outperform DSR (by almost11%) in the Manhattan model. As seen from Fig.10 and 13, therelative ranking of AODV and DSDV in terms of throughputseems to depend on the underlying mobility model.
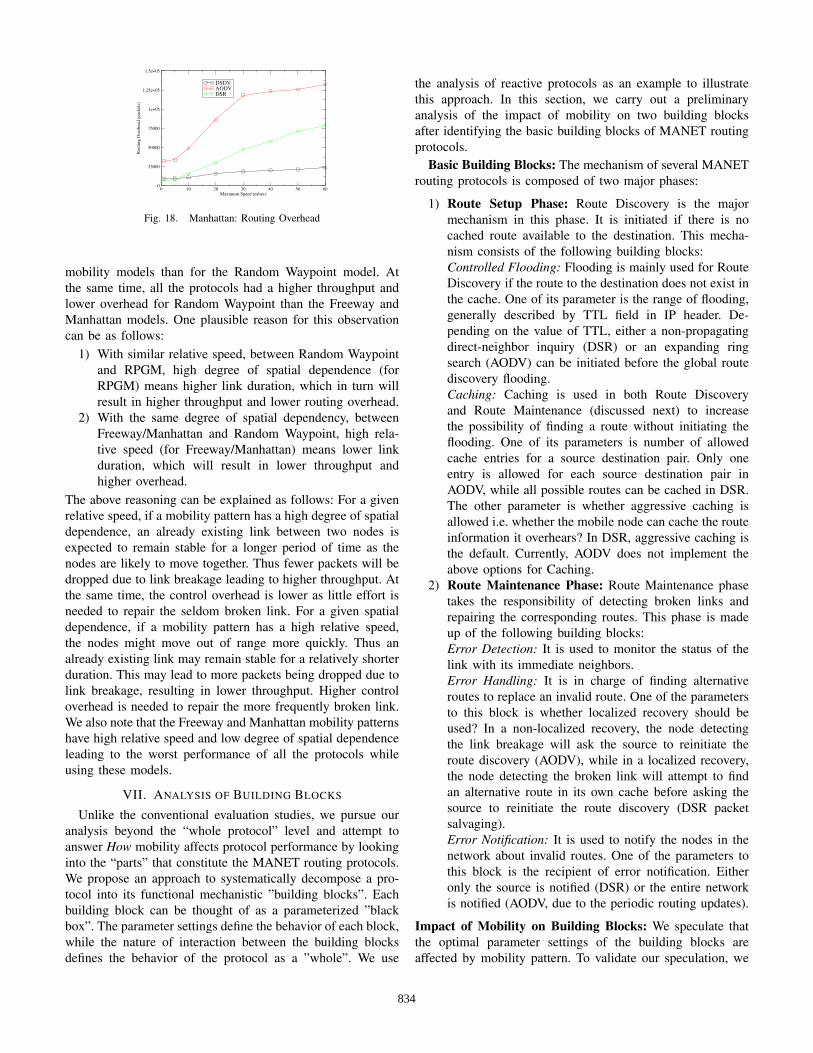
Also, DSR incurs the least routing overhead in most cases,while DSDV has a lower overhead than DSR in the Freewayand Manhattan models as shown in Fig.17 and 18. The relativeranking of DSR and DSDV in terms of routing overheadseems to depend on the underlying mobility model as shownin Fig.14, 15, 16, 17 and 18.
Thus, we conclude that relative rankings of protocols mayvary with the mobility model used. We also observe thatDSDV achieves a higher throughput than AODV (by around10%) in RPGM. Thus, in general it is not always true that
0 10 20 30 40 50 60Maximum Speed (m/sec)
50
60
70
80
90
100
Thr
ough
put (
%)
DSDVAODVDSR
Fig. 10. RPGM (Single Group): Throughput
832

0 10 20 30 40 50 60Maximum Speed (m/sec)
50
60
70
80
90
100
Thr
ough
put (
%)
DSDVAODVDSR
Fig. 11. RPGM (4 Groups): Throughput
0 10 20 30 40 50 60Maximum Speed (m/sec)
50
60
70
80
90
100
Thr
ough
put (
%)
DSDVAODVDSR
Fig. 12. Freeway: Throughput
0 10 20 30 40 50 60Maximum Speed (m/sec)
50
60
70
80
90
100
Thr
ough
put (
%)
DSDVAODVDSR
Fig. 13. Manhattan: Throughput
0 10 20 30 40 50 60Maximum Speed (m/sec)
0
25000
50000
75000
1e+05
1.25e+05
1.5e+05
Rou
ting
Ove
rhea
d (p
acke
ts)
DSDVAODVDSR
Fig. 14. Random Waypoint: Routing Overhead
0 10 20 30 40 50 60Maximum Speed (m/sec)
0
2000
4000
6000
8000
10000
Rou
ting
Ove
rhea
d (p
acke
ts)
DSDVAODVDSR
Fig. 15. RPGM (Single Group): Routing Overhead
0 10 20 30 40 50 60Maximum Speed (m/sec)
0
2000
4000
6000
8000
10000
Rou
ting
Ove
rhea
d (p
acke
ts)
DSDVAODVDSR
Fig. 16. RPGM (4 Groups): Routing Overhead
on demand protocols perform better than table driven ones interms of throughput. Also, a protocol with the least overheaddoes not always produce the highest throughput. E.g. in theFreeway model, DSDV seems to have the least throughput andthe least overhead.
Although, these results were somewhat expected, the quan-titative analysis helped us gain a lot of insight to answer thenext question.
D. Why mobility affects protocol performance?
First, the relationship between the mobility metrics and theperformance metrics was unclear. But after introducing theconnectivity graph metrics, we were able to observe a veryclear correlation between Average Degree of Spatial Depen-dence, Average Relative Speed, Average Link Duration andprotocol performance metrics. The mobility pattern influencesthe connectivity graph which in turn influences the protocolperformance.
In general, it was observed that DSR, DSDV and AODVhad a higher throughput and lower overhead for the group
0 10 20 30 40 50 60Maximum Speed (m/sec)
0
25000
50000
75000
1e+05
1.25e+05
1.5e+05
Rou
ting
Ove
rhea
d (p
acke
ts)
DSDVAODVDSR
Fig. 17. Freeway: Routing Overhead
833
0 10 20 30 40 50 60Maximum Speed (m/sec)
0
25000
50000
75000
1e+05
1.25e+05
1.5e+05
Rou
ting
Ove
rhea
d (p
acke
ts)
DSDVAODVDSR
Fig. 18. Manhattan: Routing Overhead
mobility models than for the Random Waypoint model. Atthe same time, all the protocols had a higher throughput andlower overhead for Random Waypoint than the Freeway andManhattan models. One plausible reason for this observationcan be as follows:
1) With similar relative speed, between Random Waypointand RPGM, high degree of spatial dependence (forRPGM) means higher link duration, which in turn willresult in higher throughput and lower routing overhead.
2) With the same degree of spatial dependency, betweenFreeway/Manhattan and Random Waypoint, high rela-tive speed (for Freeway/Manhattan) means lower linkduration, which will result in lower throughput andhigher overhead.
The above reasoning can be explained as follows: For a givenrelative speed, if a mobility pattern has a high degree of spatialdependence, an already existing link between two nodes isexpected to remain stable for a longer period of time as thenodes are likely to move together. Thus fewer packets will bedropped due to link breakage leading to higher throughput. Atthe same time, the control overhead is lower as little effort isneeded to repair the seldom broken link. For a given spatialdependence, if a mobility pattern has a high relative speed,the nodes might move out of range more quickly. Thus analready existing link may remain stable for a relatively shorterduration. This may lead to more packets being dropped due tolink breakage, resulting in lower throughput. Higher controloverhead is needed to repair the more frequently broken link.We also note that the Freeway and Manhattan mobility patternshave high relative speed and low degree of spatial dependenceleading to the worst performance of all the protocols whileusing these models.
VII. ANALYSIS OF BUILDING BLOCKS
Unlike the conventional evaluation studies, we pursue ouranalysis beyond the “whole protocol” level and attempt toanswer How mobility affects protocol performance by lookinginto the “parts” that constitute the MANET routing protocols.We propose an approach to systematically decompose a pro-tocol into its functional mechanistic ”building blocks”. Eachbuilding block can be thought of as a parameterized ”blackbox”. The parameter settings define the behavior of each block,while the nature of interaction between the building blocksdefines the behavior of the protocol as a ”whole”. We use
the analysis of reactive protocols as an example to illustratethis approach. In this section, we carry out a preliminaryanalysis of the impact of mobility on two building blocksafter identifying the basic building blocks of MANET routingprotocols.
Basic Building Blocks: The mechanism of several MANETrouting protocols is composed of two major phases:
1) Route Setup Phase: Route Discovery is the majormechanism in this phase. It is initiated if there is nocached route available to the destination. This mecha-nism consists of the following building blocks:Controlled Flooding: Flooding is mainly used for RouteDiscovery if the route to the destination does not exist inthe cache. One of its parameter is the range of flooding,generally described by TTL field in IP header. De-pending on the value of TTL, either a non-propagatingdirect-neighbor inquiry (DSR) or an expanding ringsearch (AODV) can be initiated before the global routediscovery flooding.Caching: Caching is used in both Route Discoveryand Route Maintenance (discussed next) to increasethe possibility of finding a route without initiating theflooding. One of its parameters is number of allowedcache entries for a source destination pair. Only oneentry is allowed for each source destination pair inAODV, while all possible routes can be cached in DSR.The other parameter is whether aggressive caching isallowed i.e. whether the mobile node can cache the routeinformation it overhears? In DSR, aggressive caching isthe default. Currently, AODV does not implement theabove options for Caching.
2) Route Maintenance Phase: Route Maintenance phasetakes the responsibility of detecting broken links andrepairing the corresponding routes. This phase is madeup of the following building blocks:Error Detection: It is used to monitor the status of thelink with its immediate neighbors.Error Handling: It is in charge of finding alternativeroutes to replace an invalid route. One of the parametersto this block is whether localized recovery should beused? In a non-localized recovery, the node detectingthe link breakage will ask the source to reinitiate theroute discovery (AODV), while in a localized recovery,the node detecting the broken link will attempt to findan alternative route in its own cache before asking thesource to reinitiate the route discovery (DSR packetsalvaging).Error Notification: It is used to notify the nodes in thenetwork about invalid routes. One of the parameters tothis block is the recipient of error notification. Eitheronly the source is notified (DSR) or the entire networkis notified (AODV, due to the periodic routing updates).
Impact of Mobility on Building Blocks: We speculate thatthe optimal parameter settings of the building blocks areaffected by mobility pattern. To validate our speculation, we
834

analyze the effect of mobility on the following building blocks:Caching: As most previous studies, we observe that DSR
has a higher throughput than the other protocols under mostmobility patterns with high or moderate link duration (likeRandom Waypoint model or RPGM ). However, we observethat DSR performs worse than AODV (by about 11%) underthe mobility patterns with extremely low link duration andweak route stability (like Manhattan) as shown in Fig.13.One possible explanation for this observation is that theprice paid for eliminating the stale cached routes obtainedby aggressive caching more than evens out the benefit gainedfrom aggressive caching. Thus, whether aggressive cachingshould be adopted depends on the mobility scenarios theprotocol will be deployed in.
Controlled Flooding: There is high possibility of findingcached route in a node’s neighborhood under mobility sce-narios with stable routes and high link duration while thispossibility is low under the mobility scenarios with smallerlink durations. Thus, whether Controlled Flooding should beused depends on the underlying mobility scenarios.
During the analysis, we noticed that DSR attempts to applyseveral optimizations and optimal parameter settings for mostbuilding blocks i.e. non-propagating direct-neighbor inquiryfor Controlled Flooding, multiple cache entries and aggressivecaching for Caching, local error recovery for Error Handling.In summary, DSR is a well-designed protocol whose parame-ters have been adjusted to achieve the optimal performance.
Our current study of classifying the building blocks andinvestigating its effect on the performance of various routingprotocols is mainly based on intuitive analysis. To understandthe functionality of building blocks and their contributions tothe routing performance, we plan to conduct a quantitativeanalysis using the procedure profiling of the building blockswe mentioned. We are interested in how the contributions ofthese building blocks will change across mobility patterns,which will help us, better answer How mobility affects proto-col performance.
VIII. CONCLUSIONS & FUTURE WORK
In this paper, we proposed a framework to analyze the im-pact of mobility pattern on routing performance of mobile adhoc network in a systematic manner. In our study, we observethat the mobility pattern does influence the performance ofMANET routing protocols. This conclusion is consistent withthe observation of previous studies. But unlike previous studiesthat compared different ad hoc routing protocols, there is noclear winner among the protocols in our case, since differentmobility patterns seem to give different performance rankingsof the protocols. We hope that our “test-suite” of mobilitymodels can be incorporated into the current scenarios used totest the MANET routing protocols.
Moreover, we observe that the mobility pattern influencesthe connectivity graph that in turn influences the protocolperformance. In addition, we did a preliminary investigationof the common building blocks of MANET routing protocols,
the effect of mobility on these building blocks and how theyinfluence the protocol as a “whole”.
In the future, we plan to study the impact of our “test-suite” on the performance of other ad hoc network protocolslike multicast ad hoc, geographic routing protocols. This studywould help us understand the impact of mobility more deeplyand clearly. We believe that several parameters such as trafficpatterns, node density and initial placement pattern of nodesmay affect the routing performance and need to investigatethem further. We are currently investigating the quantitativeanalysis of the building blocks.
IX. ACKNOWLEGEMENTS
We would like to thank Dr. John Heidemann for hisvalueable suggestions at the initial stages of this work; Dr.Sandeep Gupta and Dr. Bhaskar Krishnamachari for theirhelpful discussions during the development of this work; andthe anonymous reviewers for their useful comments. Thiswork was made possible by a grant from NSF Career Award0134650.
REFERENCES
[1] L. Breslau, D. Estrin, K. Fall, S. Floyd, J. Heidemann, A. Helmy,P. Huang, S. McCanne, K. Varadhan, Y. Xu, and H. Yu, “Advancesin network simulation,” in IEEE Computer, vol. 33, no. 5, May 2000,pp. 59–67.
[2] D. B. Johnson, D. A. Maltz, and J. Broch, “”DSR: The dynamic sourcerouting protocol for multi-hop wireless ad hoc networks”,” in Ad HocNetworking, C. Perkins, Ed. Addison-Wesley, 2001, pp. 139–172.
[3] C. E. Perkins and P. Bhagwat, “Highly dynamic destination sequenceddistance vector routing (DSDV) for mobile computers,” in ACM SIG-COMM, 1994, pp. 234–244.
[4] C. Perkins, “Ad hoc on demand distance vector (AODV) routing, internetdraft, draft-ietf-manet-aodv-00.txt.”
[5] X. Hong, M. Gerla, G. Pei, and C.-C. Chiang, “A group mobility modelfor ad hoc wireless networks,” in ACM/IEEE MSWiM, August 1999.
[6] J. Broch, D. A. Maltz, D. B. Johnson, Y.-C. Hu, and J. Jetcheva,“A performance comparison of multi-hop wireless ad hoc networkrouting protocols,” in Proceedings of the Fourth Annual ACM/IEEEInternational Conference on Mobile Computing and Networking, ACM,October 1998.
[7] S. R. Das, C. E. Perkins, and E. M. Royer, “Performance comparison oftwo on-demand routing protocols for ad hoc networks,” in INFOCOM,March 2000.
[8] S. R. Das, R. Castaneda, J. Yan, and R. Sengupta, “Comparative per-formance evaluation of routing protocols for mobile, ad hoc networks,”October 1998, pp. 153–161.
[9] V. D. Park and M. S. Corson, “Temporally-ordered routing algorithm(TORA) version 1: Functional specification, internet-draft, draft-ietf-manet-tora-spec-01.txt,” August 1998.
[10] P. Johansson, T. Larsson, N. Hedman, B. Mielczarek, and M. Degermark,“Scenario-based performance analysis of routing protocols for mobilead-hoc networks,” in International Conference on Mobile Computingand Networking (MobiCom’99), 1999, pp. 195–206.
[11] G.Pei, M. Gerla, X. Hong, and C.-C.-Chiang, “A wireless hierarchicalprotocol with group mobility,” in IEEE WCNC, September 1999.
[12] X. Hong, T. Kwon, M. Gerla, D. Gu, and G. Pei, “A mobility frameworkfor ad hoc wireless networks,” in ACM Second International Conferenceon Mobile Data Management (MDM), January 2001.
[13] D. A. Maltz, J. Broch, J. Jetcheva, and D. B. Johnson, “The effectsof on-demand behavior in routing protocols for multi-hop wireless adhoc networks,” in IEEE Journal on Selected Areas in Communicationsspecial issue on mobile and wireless networks, August 1999.
[14] S.-J. Lee, M. Gerla, and C.-K. Toh, “A simulation study of table-drivenand on-demand routing protocols for mobile ad hoc networks,” vol. 13,no. 4, August 1999, pp. 48–54.
[15] T. H. Cormen, C. E. Leiserson, R. L. Rivest, and C. Stein, “Introductionto algorithms.” McGraw Hill, 1998.
835