The impacts of moisture transport of East Asian monsoon on summer precipitation in Northeast China
13
ADVANCES IN ATMOSPHERIC SCIENCES, VOL. 24, NO. 4, 2007, 606–618 The Impacts of Moisture Transport of East Asian Monsoon on Summer Precipitation in Northeast China SUN Li ∗ 1,2 ( ), SHEN Baizhu 1,2 ( ), GAO Zongting 1,2 ( ), SUI Bo 1 ( ), Lesheng BAI 3 , Sheng-Hung WANG 2 , AN Gang 1 ( ), and LI Jian 1 ( ) 1 Institute of Meteorological Sciences of Jilin Province, Changchun 130062 2 Wuhan Institute of Heavy Rain, Wuhan 430074 3 Polar Meteorology Group, Byrd Polar Research Center, The Ohio State University, Columbus, Ohio 43210, USA (Received 24 February 2006; revised 15 August 2006) ABSTRACT By using the ECMWF reanalysis daily data and daily precipitation data of 80 stations in Northeast China from 1961 to 2002, the impacts of moisture transport of East Asian summer monsoon on the summer precipitation anomaly in Northeast China, and the relationship between the variation of moisture budget and the establishment of East Asian summer monsoon in this region are studied. The results demonstrate that the moisture of summer precipitation in Northeast China mainly originates from subtropical, South China Sea, and South Asia monsoon areas. East China and its near coastal area are the convergent region of the monsoonal moisture currents and the transfer station for the currents continually moving northward. The monsoonal moisture transport, as an important link or bridge, connects the interaction between middle and low latitude systems. In summer half year, there is a moisture sink in Northeast China where the moisture influx is greater than outflux. The advance transport and accumulation of moisture are of special importance to pentad time scale summer precipitation. The onset, retreat, and intensity change of the monsoonal rainy season over Northeast China are mainly signified by the moisture input condition along the southern border of this area. The establishment of East Asian summer monsoon in this area ranges from about 10 July to 20 August and the onset in the west is earlier than that in the east. The latitude that the monsoon can reach is gradually northward from west to east, reaching 50 ◦ N within longitude 120 ◦ –135 ◦ E. In summer, the difference of air mass transport between summers with high and low rainfall mainly lies in whether more air masses originating from lower latitudes move northward through East China and its coastal areas, consequently transporting large amounts of hot and humid air into Northeast China. Key words: Northeast China, East Asian monsoon, moisture transport, source-sink structure, air mass trajectory DOI: 10.1007/s00376-007-0606-8 1. Introduction Northeast China is located in the northern end of the East Asian monsoon area, where annual precipita- tion is mainly determined by the intensity of summer monsoon activity. Influenced by the large annual vari- ation of East Asian monsoon, meteorological and cli- matic disasters, such as torrential rain and floods, as well as durative drought, occur in this area frequently. The frequency of drought and flood events are evi- dently an increasing trend since the 1990s (Sun et al., 2002a). Although some studies of the summer precip- itation anomaly in this area have been carried out in many ways, such as through climatic rules of precipita- tion (Sun et al., 2000), characteristics of atmospheric circulation anomalies (Sun et al., 2002b), and impacts of sea surface temperature (Sun and An, 2003; Sun et al., 2004), the relationship between moisture transport of East Asian monsoon and the summer precipitation anomaly in this area remains undiscovered. In fact, from this point of view, the study is very important to Northeast China, not only because—compared with ∗ Corresponding author: SUN Li, [email protected]
Transcript of The impacts of moisture transport of East Asian monsoon on summer precipitation in Northeast China

ADVANCES IN ATMOSPHERIC SCIENCES, VOL. 24, NO. 4, 2007, 606–618
The Impacts of Moisture Transport of East Asian Monsoon
on Summer Precipitation in Northeast China
SUN Li∗1,2 (� �), SHEN Baizhu1,2 (���), GAO Zongting1,2 (���), SUI Bo1 (� �),Lesheng BAI3, Sheng-Hung WANG2, AN Gang1 (� �), and LI Jian1 (� �)
1Institute of Meteorological Sciences of Jilin Province, Changchun 130062
2Wuhan Institute of Heavy Rain, Wuhan 430074
3Polar Meteorology Group, Byrd Polar Research Center, The Ohio State University, Columbus, Ohio 43210, USA
(Received 24 February 2006; revised 15 August 2006)
ABSTRACT
By using the ECMWF reanalysis daily data and daily precipitation data of 80 stations in NortheastChina from 1961 to 2002, the impacts of moisture transport of East Asian summer monsoon on the summerprecipitation anomaly in Northeast China, and the relationship between the variation of moisture budgetand the establishment of East Asian summer monsoon in this region are studied. The results demonstratethat the moisture of summer precipitation in Northeast China mainly originates from subtropical, SouthChina Sea, and South Asia monsoon areas. East China and its near coastal area are the convergent regionof the monsoonal moisture currents and the transfer station for the currents continually moving northward.The monsoonal moisture transport, as an important link or bridge, connects the interaction between middleand low latitude systems. In summer half year, there is a moisture sink in Northeast China where themoisture influx is greater than outflux. The advance transport and accumulation of moisture are of specialimportance to pentad time scale summer precipitation. The onset, retreat, and intensity change of themonsoonal rainy season over Northeast China are mainly signified by the moisture input condition along thesouthern border of this area. The establishment of East Asian summer monsoon in this area ranges fromabout 10 July to 20 August and the onset in the west is earlier than that in the east. The latitude that themonsoon can reach is gradually northward from west to east, reaching 50◦N within longitude 120◦–135◦E.In summer, the difference of air mass transport between summers with high and low rainfall mainly liesin whether more air masses originating from lower latitudes move northward through East China and itscoastal areas, consequently transporting large amounts of hot and humid air into Northeast China.
Key words: Northeast China, East Asian monsoon, moisture transport, source-sink structure, air masstrajectory
DOI: 10.1007/s00376-007-0606-8
1. Introduction
Northeast China is located in the northern end ofthe East Asian monsoon area, where annual precipita-tion is mainly determined by the intensity of summermonsoon activity. Influenced by the large annual vari-ation of East Asian monsoon, meteorological and cli-matic disasters, such as torrential rain and floods, aswell as durative drought, occur in this area frequently.The frequency of drought and flood events are evi-dently an increasing trend since the 1990s (Sun et al.,
2002a). Although some studies of the summer precip-itation anomaly in this area have been carried out inmany ways, such as through climatic rules of precipita-tion (Sun et al., 2000), characteristics of atmosphericcirculation anomalies (Sun et al., 2002b), and impactsof sea surface temperature (Sun and An, 2003; Sun etal., 2004), the relationship between moisture transportof East Asian monsoon and the summer precipitationanomaly in this area remains undiscovered. In fact,from this point of view, the study is very importantto Northeast China, not only because—compared with
∗Corresponding author: SUN Li, [email protected]

NO. 4 SUN ET AL. 607
other areas of East China—the air mass in this areadoes not often meet with hot and humid conditions,but also because the strength or weakness of summermonsoon in this area often corresponds with specialcirculation patterns (Sun et al., 2003). Thus, it is pos-sible that characteristics of monsoonal moisture trans-port and budget in this area are significantly differentfrom those in other areas of China.
Local precipitation anomalies mainly result fromcirculation and moisture change. Moisture transportcomprehensively reflects the impacts of both parts. Inthe last few years, more and more attention has beenpaid by studies analyzing the impacts of East Asianmonsoon on drought and flood in China from the view-point of moisture transport and its recycling. Huanget al. (1998) studied the characteristics of moisturetransport in the East Asian monsoon area and its dif-ference from that of the South Asian monsoon area.They believed that the moisture convergence in theEast Asian monsoon area was mainly caused by ad-vection processes, and that its longitudinal transportis very important, and thus it is very different from theIndian monsoon area. Through analyzing the charac-teristics of moisture transport and budget of two tor-rential rains in the Changjiang River and Changjiang-Huaihe River drainage area in 1998 and 1991, Ding andHu (2003) and Hu and Ding (2003) revealed the rela-tionship between these two torrential rains and large-scale moisture transport, as well as East Asian mon-soon systems. Xu et al. (2002), Xu et al. (2003a,b,c)also discussed the main characteristics of the areas in-fluenced by monsoonal moisture transport and pre-sented a teleconnection model and a physical imageof moisture transport in the monsoonal mei-yu belt.All these studies suggest that it is an indispensable di-rection for analyzing precipitation anomalies to studymoisture transport and budget, which is essential forfurther understanding precipitation mechanisms andforecasting drought and flood processes.
Since the 1980s, many significant advancements instudying the East Asian monsoon have been achieved[see Tao and Chen (1988) and Chen et al. (1991) forsummaries and generalizations of such studies beforethe 1990s]. In recent years, many considerable devel-opments have been made in the aspects of variabil-ity of East Asian monsoon (Huang et al., 2003; Wuand Wang, 2000), the relationship between East Asianmonsoon and the ENSO phenomenon (Wang et al.,2000; Wang et al., 2001; Wu and Wang, 2002; Huanget al., 2004), and the precipitation characteristics ofEast Asian monsoon (Wang and LinHo, 2002; Yu etal., 2001). Ding et al. (2004a,b) described the researchresults in this field for the past ten and more yearsin detail. On the whole, compared with other areas
of China, relatively few studies have been carried outwith regard to the determination of the activity region(borders that the monsoon can reach), the influenceduration, and intensity of the East Asian monsoon tothe north of Huaihe River. Many aspects should beinvestigated further.
In this study, by using the ECMWF (EuropeanCentre for Medium-range Weather Forecast) reanal-ysis daily data and daily precipitation data of 80stations in Northeast China from 1961 to 2002, theimpacts of moisture transport and its source-sinkstructural characteristics on the summer precipitationanomaly in Northeast China, as well as the relation-ship between the variation of moisture budget and theestablishment of East Asian summer monsoon (includ-ing the onset, retreat, and the impact areas of themonsoonal rainy season) in this region are studied. Itis helpful for discussing the mechanism of drought andflood formation in Northeast China, as well as for en-hancing the understanding of the interaction betweenmiddle and low latitude systems and the impacts ofEast Asian monsoon on this region. The data andanalysis method are described in section 2; the anal-ysis results are presented in section 3; and section 4summarizes the main conclusions.
2. Data and method
Moisture flux vector Q is defined as:
Q(λ, ϕ, t) = Qu(λ, ϕ, t)i + Qv(λ, ϕ, t)j , (1)
where λ, ϕ and t are longitude, latitude and time; iand j are meridional and longitudinal unit vectors.Q = (Q2
u + Q2v)1/2 is the value of Q.
The two moisture flux components, Qu and Qv aredefined as follows:
Qu(λ, ϕ, t) =1g
∫ pt
ps
q(λ, ϕ, p, t)u(λ, ϕ, p, t)dp , (2)
Qv(λ, ϕ, t) =1g
∫ pt
ps
q(λ, ϕ, p, t)v(λ, ϕ, p, t)dp , (3)
where Qu and Qv are the eastward and northwardmoisture fluxes; q, u and v are specific humidity andhorizontal wind velocity components, respectively; gis the gravity constant; p is pressure; ps is surface airpressure; and pt is top air pressure.
The estimation of the trajectory of two-dimensional air parcel transport is based on thebackward-trajectory model of the semi-Lagrangianintegration scheme, which searches for the upstream

608 IMPACTS OF MOISTURE TRANSPORT OF EASM ON NE SUMMER PRECIPITATION VOL. 24
point (Robert, 1982). In a given wind field, the up-stream point of the air parcel that reaches the targetpoint is searched for through an iteration procedure.The iteration formula is as follows:
αn+1ijk = ∆t(m2U)(Xi − αn
ijk, Yj − βnijk, σk, t) , (4)
βn+1ijk = ∆t(m2V )(Xi − αn
ijk, Yj − βnijk, σk, t) , (5)
where αijk and βijk are the position changes along thex and y directions in a map projection plane; U andV denote x and y components of wind velocity in amap projection plane; m denotes the map magnifica-tion coefficient; polar stereographic projection of theNorthern Hemisphere is adopted; i, j and k representx, y and vertical direction; σ = (p − pt)/(ps − pt); ndenotes the iteration number; and X and Y are theposition of the air parcel along the x and y directionsrespectively.
Data for wind field evolution are ECMWF reanal-ysis data, which are available four times a day (0000,0600, 1200, and 1800 UTC). Data for other times areattained through interpolation. In order to overcometopographical effects, the trajectory is modeled in aσ coordinate system. Considering the moisture andits transport are mainly concentrated in the lower lay-ers, the trajectory is estimated in the two-dimensionalwind field of the layer with σk=0.9, with a time step ofone hour. When the position in a previous time pointis determined, the iteration method can be appliedat this point to continue to search for the upstreampoint backwardly. Thus, through repeating the proce-dure, the transport trajectory of the two-dimensionalair parcel that reaches the target point at a certaintime point will be attained.
In order to understand the climatic characteristicsof moisture transport over Northeast China, the mois-ture fluxes of the four borders (east, south, west, andnorth) of the region (40.0◦–52.5◦N, 117.5◦–135.0◦E)are calculated.
Moisture transport through a certain border is de-fined as:
1ga
∫ pt
ps
∫L
Vnqdldp , (6)
where L is the horizontal border; l is the length of thehorizontal border; Vn is normal velocity perpendicularto the border surface; and a is the region area. Posi-tive and negative values represent outflux and influx,respectively. Moisture flux of each of the four bordersis, respectively:
East border:
1ga
∫ pt
ps
∫L
qudldp , (7)
Fig. 1. Geographical distribution of 80 stations in North-east China. The stations selected are labeled as maculae.
south border:
− 1ga
∫ pt
ps
∫L
qvdldp , (8)
west border:
− 1ga
∫ pt
ps
∫L
qudldp , (9)
north border:
1ga
∫ pt
ps
∫L
qvdldp . (10)
The data used in this paper mainly include dailyprecipitation of 80 stations uniformly distributed inNortheast China (Fig. 1) and the ECMWF reanalysisdaily data (ERA-40). The dataset is a global atmo-spheric analysis of many conventional observations andsatellite data streams for the period September 1957to August 2002 (Uppala et al., 2005). The datasetused here contains surface and upper level variableson a global 2.5◦ × 2.5◦ latitude-longitude grid. Allvariables are reported four times a day. The upperlevel variables, geopotential height, temperature, spe-cific humidity, and latitudinal and longitudinal compo-nents of wind velocity (1000, 925, 850, 700, 500, 400,300, 250, 300, 150, 100, 70, 50, 30, 20, 10 hPa) areused for this study. Specific humidity is the primaryfocus between 1000 hPa to 300 hPa.

NO. 4 SUN ET AL. 609
- 3 0
- 2 0
- 1 0
0
1 0
2 0
3 0
4 0
5 0
1 9 6 1 1 9 6 6 1 9 7 1 1 9 7 6 1 9 8 1 1 9 8 6 1 9 9 1 1 9 9 6 2 0 0 1
Time (year)
Precipitation anomaly
percent (%)
Fig. 2. Time series of area average summer (July–August) precipitation anomaly percentage in NortheastChina from 1961 to 2002.
3. Results
3.1 Source-sink distribution characteristics ofwater vapor flux for summers with highand low rainfall
Figure 2 shows the time series of area average sum-mer (July–August) precipitation anomaly percentagefrom 1961 to 2002 in Northeast China. Taking thesummer (July–August) precipitation anomaly percent-age as standard, the six highest (1962, 1964, 1966,1985, 1994, and 1998) and six lowest (1968, 1976, 1980,1989, 1992, and 1999) rainfall summers have been cho-sen as cases of high and low precipitation in this study.The average value of the precipitation anomaly per-centage with high rainfall summers is 31.71%, and−24.11% with low rainfall summers. The departurecomposite maps of water vapor flux (Q) both for highand low rainfall summers over Northeast China from1961 to 2002 and their difference map (water vaporflux anomaly for high rainfall summers minus water va-por flux anomaly for low rainfall summers) are shownin Fig. 3.
In high rainfall summers, it can be seen from themap (Fig. 3a) that a large and notable positive valuearea covers from Northeast China to the Korean penin-sula, where the water vapor flux is above normal,meaning this region is a water vapor transport “sink”(in this paper, the positive value area of water va-por flux anomalies is defined as a water vapor trans-port “sink” and, conversely, the negative value area iscalled a water vapor transport “source”). The Sea ofOchotsk, the western Pacific Ocean, the South ChinaSea, and the Indian Ocean to the south of the Bay ofBengal, are the notable areas of negative anomalies,and are therefore the “sources” of water vapor trans-port. In low rainfall summers, the features of watervapor flux anomaly distributions are the opposite to
Fig. 3. Composite maps of the water vapor flux (Q)anomaly both for summers with (a) high rainfall and (b)low rainfall over Northeast China, and (c) their differ-ence map (large rainfall summers minus small rainfallsummers). Shaded areas show the regions where the dif-ference is statistically significant at the 95% confidencelevel by t-test. (Units: g cm−1 s−1)
610 IMPACTS OF MOISTURE TRANSPORT OF EASM ON NE SUMMER PRECIPITATION VOL. 24
(a)
(b)
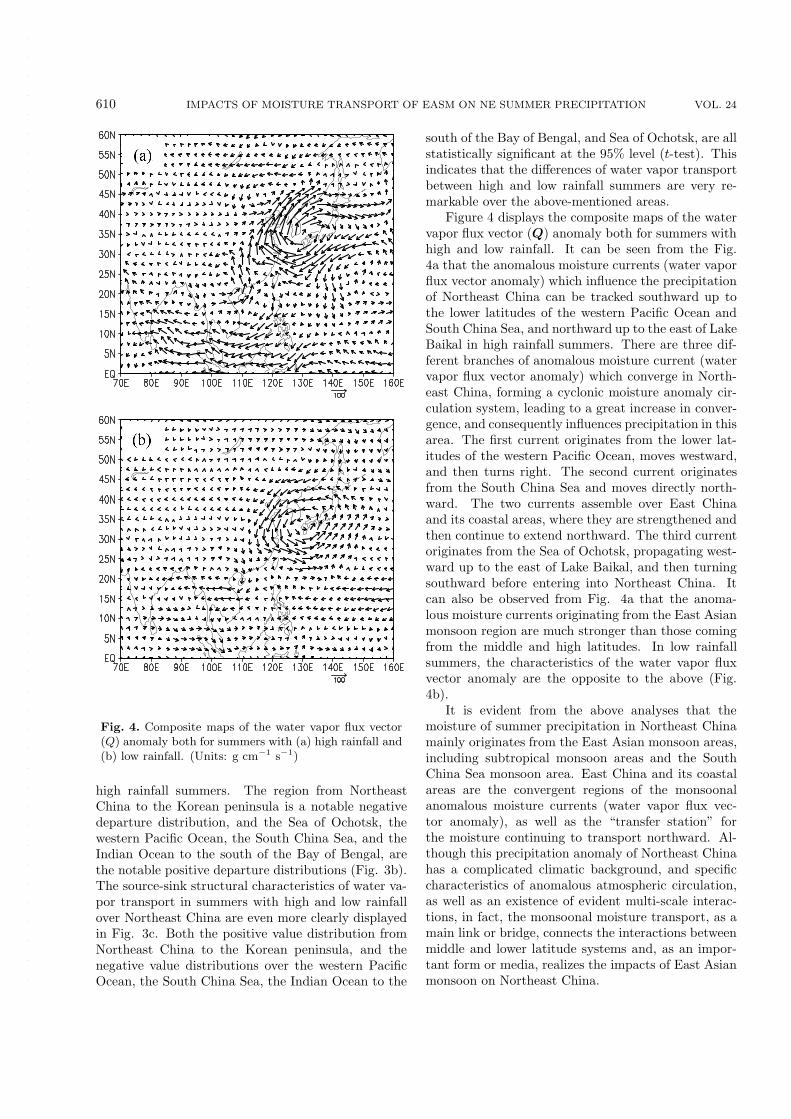
Fig. 4. Composite maps of the water vapor flux vector(Q) anomaly both for summers with (a) high rainfall and(b) low rainfall. (Units: g cm−1 s−1)
high rainfall summers. The region from NortheastChina to the Korean peninsula is a notable negativedeparture distribution, and the Sea of Ochotsk, thewestern Pacific Ocean, the South China Sea, and theIndian Ocean to the south of the Bay of Bengal, arethe notable positive departure distributions (Fig. 3b).The source-sink structural characteristics of water va-por transport in summers with high and low rainfallover Northeast China are even more clearly displayedin Fig. 3c. Both the positive value distribution fromNortheast China to the Korean peninsula, and thenegative value distributions over the western PacificOcean, the South China Sea, the Indian Ocean to the
south of the Bay of Bengal, and Sea of Ochotsk, are allstatistically significant at the 95% level (t-test). Thisindicates that the differences of water vapor transportbetween high and low rainfall summers are very re-markable over the above-mentioned areas.
Figure 4 displays the composite maps of the watervapor flux vector (Q) anomaly both for summers withhigh and low rainfall. It can be seen from the Fig.4a that the anomalous moisture currents (water vaporflux vector anomaly) which influence the precipitationof Northeast China can be tracked southward up tothe lower latitudes of the western Pacific Ocean andSouth China Sea, and northward up to the east of LakeBaikal in high rainfall summers. There are three dif-ferent branches of anomalous moisture current (watervapor flux vector anomaly) which converge in North-east China, forming a cyclonic moisture anomaly cir-culation system, leading to a great increase in conver-gence, and consequently influences precipitation in thisarea. The first current originates from the lower lat-itudes of the western Pacific Ocean, moves westward,and then turns right. The second current originatesfrom the South China Sea and moves directly north-ward. The two currents assemble over East Chinaand its coastal areas, where they are strengthened andthen continue to extend northward. The third currentoriginates from the Sea of Ochotsk, propagating west-ward up to the east of Lake Baikal, and then turningsouthward before entering into Northeast China. Itcan also be observed from Fig. 4a that the anoma-lous moisture currents originating from the East Asianmonsoon region are much stronger than those comingfrom the middle and high latitudes. In low rainfallsummers, the characteristics of the water vapor fluxvector anomaly are the opposite to the above (Fig.4b).
It is evident from the above analyses that themoisture of summer precipitation in Northeast Chinamainly originates from the East Asian monsoon areas,including subtropical monsoon areas and the SouthChina Sea monsoon area. East China and its coastalareas are the convergent regions of the monsoonalanomalous moisture currents (water vapor flux vec-tor anomaly), as well as the “transfer station” forthe moisture continuing to transport northward. Al-though this precipitation anomaly of Northeast Chinahas a complicated climatic background, and specificcharacteristics of anomalous atmospheric circulation,as well as an existence of evident multi-scale interac-tions, in fact, the monsoonal moisture transport, as amain link or bridge, connects the interactions betweenmiddle and lower latitude systems and, as an impor-tant form or media, realizes the impacts of East Asianmonsoon on Northeast China.

NO. 4 SUN ET AL. 611
Fig. 5. Correlation distribution between summer (July–August) precipitation in Northeast China and the twocomponents of moisture flux of the whole atmospherelayer, (a) Qv and (b) Qu. The shaded areas from lightto heavy show the regions where the correlation is statis-tically significant at the 95%, 99% and 99.9% confidencelevels.
3.2 Correlation analysis between the sum-mer precipitation anomaly and moisturetransport of East Asian summer monsoon
Figure 5 demonstrates the correlation distributionbetween summer (July–August) precipitation and thetwo moisture flux components, Qv (Fig. 5a) and Qu
(Fig. 5b). The results shown in Fig. 5a suggest thatthe significant positive correlation area is mainly lo-cated in East China and its coastal areas. This posi-tive correlation area is belt-shaped in the south-northdirection and can extend to the north part of the SouthChina Sea, and the sea to the east of Taiwan in the
Fig. 6. Correlation distribution between the precipita-tion of the sixth Pentad of July in Northeast China and(a) the previous pentad’s precipitable water, (b) the pre-vious pentad’s component of moisture flux Q, and (c) theprevious pentad’s component of moisture flux divergence.Shaded areas from light to heavy show the regions wherethe correlation is statistically significant at the 95% and99% confidence levels.
612 IMPACTS OF MOISTURE TRANSPORT OF EASM ON NE SUMMER PRECIPITATION VOL. 24
-15
-10
-5
0
5
10
15
20
25
24 30 36 42 48
30-Apr 31-May 30-Jun 31-Jul 31-Aug
Time (pentad)
Water vapor flux ( mm d -
1)
flux along the north borderflux along the south borderflux along the west borderflux along the east borderbudget for the whole region
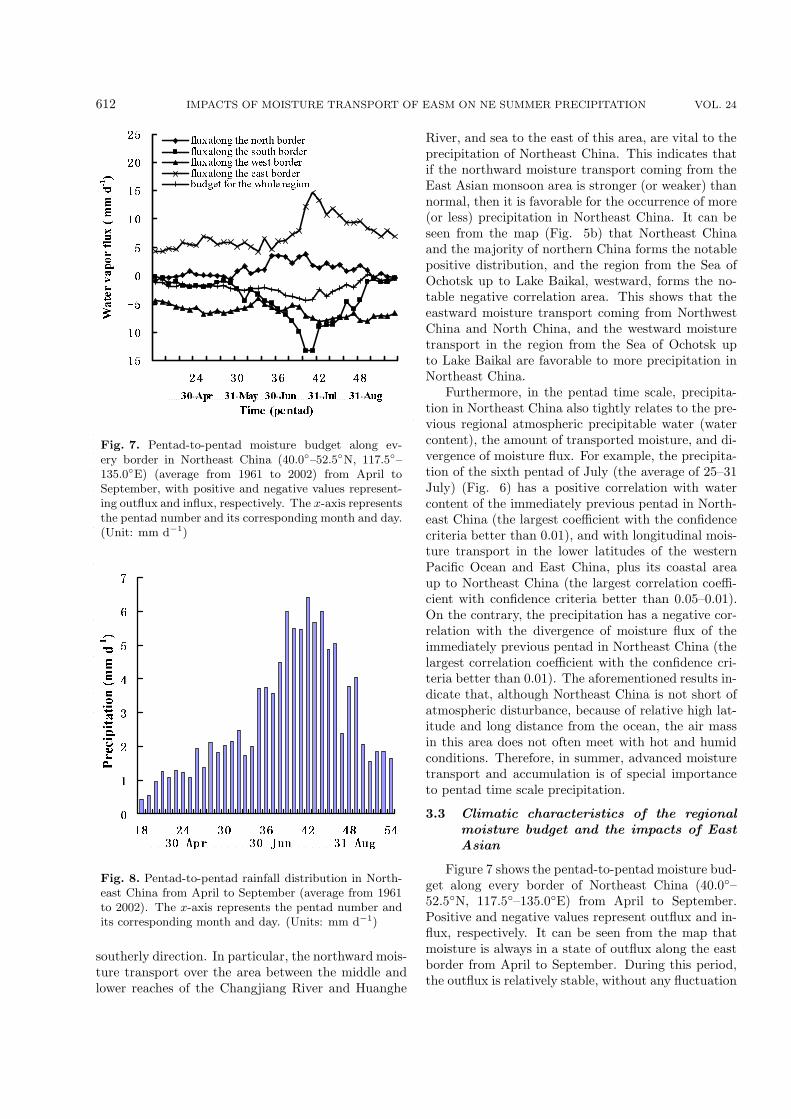
Fig. 7. Pentad-to-pentad moisture budget along ev-ery border in Northeast China (40.0◦–52.5◦N, 117.5◦–135.0◦E) (average from 1961 to 2002) from April toSeptember, with positive and negative values represent-ing outflux and influx, respectively. The x-axis representsthe pentad number and its corresponding month and day.(Unit: mm d−1)
30-Apr 30-Jun 31-Aug
0
1
2
3
4
5
6
7
18 24 30 36 42 48 54
Precipitation (mm d
-1
)
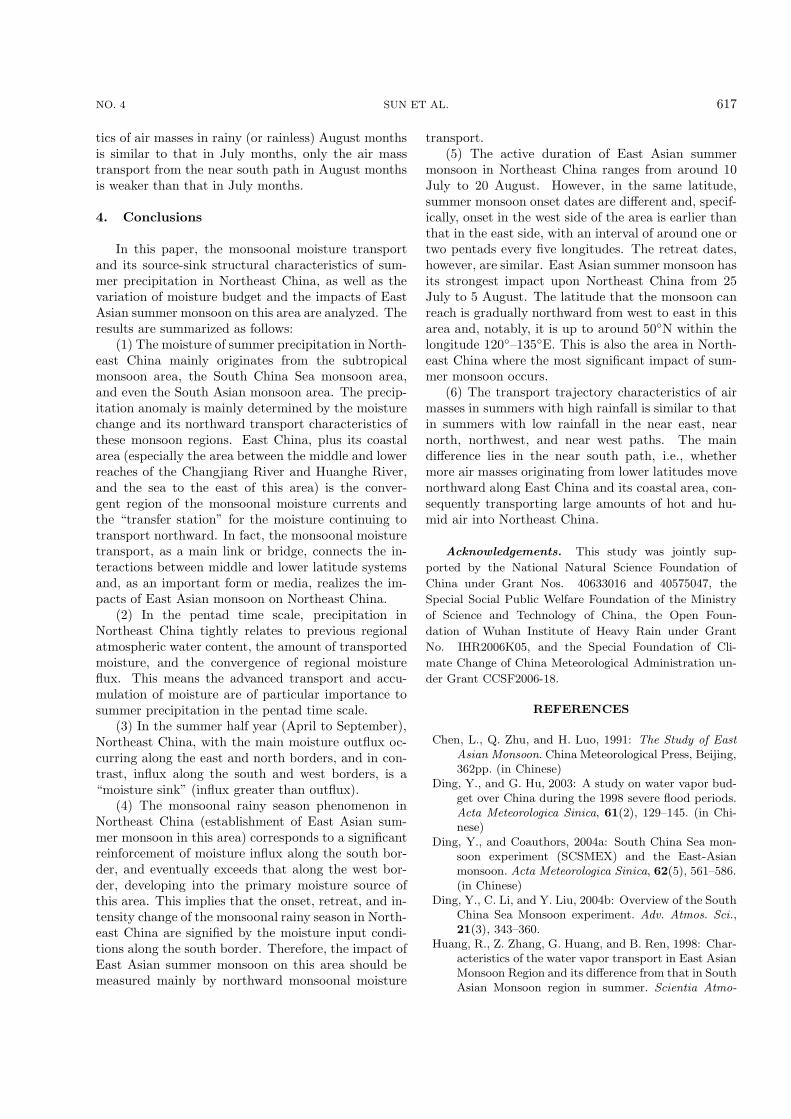
Fig. 8. Pentad-to-pentad rainfall distribution in North-east China from April to September (average from 1961to 2002). The x-axis represents the pentad number andits corresponding month and day. (Units: mm d−1)
southerly direction. In particular, the northward mois-ture transport over the area between the middle andlower reaches of the Changjiang River and Huanghe
River, and sea to the east of this area, are vital to theprecipitation of Northeast China. This indicates thatif the northward moisture transport coming from theEast Asian monsoon area is stronger (or weaker) thannormal, then it is favorable for the occurrence of more(or less) precipitation in Northeast China. It can beseen from the map (Fig. 5b) that Northeast Chinaand the majority of northern China forms the notablepositive distribution, and the region from the Sea ofOchotsk up to Lake Baikal, westward, forms the no-table negative correlation area. This shows that theeastward moisture transport coming from NorthwestChina and North China, and the westward moisturetransport in the region from the Sea of Ochotsk upto Lake Baikal are favorable to more precipitation inNortheast China.
Furthermore, in the pentad time scale, precipita-tion in Northeast China also tightly relates to the pre-vious regional atmospheric precipitable water (watercontent), the amount of transported moisture, and di-vergence of moisture flux. For example, the precipita-tion of the sixth pentad of July (the average of 25–31July) (Fig. 6) has a positive correlation with watercontent of the immediately previous pentad in North-east China (the largest coefficient with the confidencecriteria better than 0.01), and with longitudinal mois-ture transport in the lower latitudes of the westernPacific Ocean and East China, plus its coastal areaup to Northeast China (the largest correlation coeffi-cient with confidence criteria better than 0.05–0.01).On the contrary, the precipitation has a negative cor-relation with the divergence of moisture flux of theimmediately previous pentad in Northeast China (thelargest correlation coefficient with the confidence cri-teria better than 0.01). The aforementioned results in-dicate that, although Northeast China is not short ofatmospheric disturbance, because of relative high lat-itude and long distance from the ocean, the air massin this area does not often meet with hot and humidconditions. Therefore, in summer, advanced moisturetransport and accumulation is of special importanceto pentad time scale precipitation.
3.3 Climatic characteristics of the regionalmoisture budget and the impacts of EastAsian
Figure 7 shows the pentad-to-pentad moisture bud-get along every border of Northeast China (40.0◦–52.5◦N, 117.5◦–135.0◦E) from April to September.Positive and negative values represent outflux and in-flux, respectively. It can be seen from the map thatmoisture is always in a state of outflux along the eastborder from April to September. During this period,the outflux is relatively stable, without any fluctuation

NO. 4 SUN ET AL. 613
from April to June, and begins to increase rapidly fromthe second pentad of July, reaching a maximum in thefirst pentad of August, before beginning to slowly de-crease soon after. Moisture is always in a state ofinflux along the west border from April to September,meaning that moisture influx here is always of spe-cial importance to summer precipitation in NortheastChina. During this period, the influx from April toJune is similar to, and therefore counteracts, the out-flux along the east border, and then increases slightlyby a low magnitude from July to September. Thus, thenet moisture budget is a positive value from April toSeptember in the west-east direction. This representsnet outflux, especially significant in July and August.Moisture transport along the north border is basicallya positive value from April to September. During thisperiod, the absolute value is very low and fluctuatesnear to zero from April to May, before increasing fromJune to reach a maximum value in July, and then de-creasing from August. On the whole, the magnitude ofmoisture outflux along the north border from April toSeptember is not high, even in July and August. Thisindicates that the moisture transported by the southwind has a limited impact upon the area to the northof Northeast China. Compared with Fig. 8 [pentad-to-pentad rainfall distribution for Northeast China fromApril to September (average from 1961 to 2002)], mois-ture transport along the south border is analyzed indetail. It can be found that moisture transport alongthe south border is always a negative value from Aprilto September; in other words, a moisture influx. Dur-ing this period, the influx along the south border, witha small change from the first pentad of April to thesecond pentad of June, is evidently smaller than thatalong the west border, and the corresponding rainfallof each pentad is smaller than 2 mm d−1. From thethird pentad of June to the second pentad of July,moisture influx along the south border begins to in-crease, and its value is still smaller than, but similar to,that of the west border. During this phase, the rainfallof each pentad also increases up to around 4 mm d−1,and the moisture influxes in Northeast China are in-fluenced by the combined forces of moisture transport,both along the west and south borders. From the thirdpentad of July to the fourth pentad of August (10 Julyto 20 August), the moisture influx along the southborder increases significantly and rapidly exceeds thatalong the west border (notably, the value is more thantwo times that along the west border from the fifthpentad of July to the first pentad of August). Duringthis phase, the corresponding rainfall of each pentadreaches a peak for the whole year: around 6 mm d−1.This means the establishment of the monsoonal rainyseason (major flood period) in this area. After the
fourth pentad of August, the moisture influx along thesouth border decreases rapidly, and in the third pentadof September, reverts to a level similar to that of Apriland May. From April to September, moisture is in astate of net influx from the viewpoint of the moisturetransport budget in the north-south direction, which ismost significant in July and August. Synthesizing thelatitudinal and longitudinal moisture budget, it can befound that, in the summer half year, moisture influx isgreater than outflux in Northeast China, with a signif-icant net moisture increase from June to August, andthus this area can be classed as a “moisture sink” insummer.
The abovementioned analysis indicates that inNortheast China the monsoonal rainy season phe-nomenon (establishment of East Asian summer mon-soon in this area) corresponds to a significant rein-forcement of moisture influx along the south border,eventually exceeding that along the west border, anddeveloping into the primary moisture source for thisregion. This implies that the onset, retreat, and inten-sity change of the monsoonal rainy season in North-east China are signified by moisture input conditionsalong the south border. Therefore, the impacts of EastAsian summer monsoon on this area should be mea-sured mainly by northward monsoonal moisture trans-port.
Figure 9 shows the temporal-latitudinal profile ofvertical integrated moisture transport by south winds,averaged by every five longitudes along 110◦–140◦E(average from 1961 to 2002). It can be seen fromthis map that, after summer begins, the area with thegreatest value of moisture transport by south windsgradually extends northward, but in different longi-tudes, and the latitudes which the area with high mois-ture transport values by south winds can reach are dif-ferent, as are the times at which they reach them. If wedefine the time (pentad) that the isoline 30 mm d−1 inthe map moves across latitude 40◦N as the onset date(pentad) of East Asian summer monsoon in NortheastChina, the durative (accumulated) numbers of pentadas the impact duration, the time that the isoline re-treat to the south of latitude 40◦N as the end date(pentad) of the impact of East Asian summer mon-soon in this area, and the most northerly latitude thatthe isoline can reach as the north border of impact ofEast Asian summer monsoon, then the duration andextension of the impacts of East Asian summer mon-soon in Northeast China can be determined. Based onthe above definition, and combined with Fig. 9, thefollowing facts can be found. Within longitudes 110◦–115◦E, the impacts of East Asian summer monsoonbegins from the first pentad of July and finishes in thethird pentad of August (1 July to 15 August), and the

614 IMPACTS OF MOISTURE TRANSPORT OF EASM ON NE SUMMER PRECIPITATION VOL. 24
Fig. 9. Temporal-latitudinal profile of vertical integrated moisture transport by south winds averaged byevery five longitudes along 110◦–140◦E (average from 1961 to 2002). The x-axis represents the pentadnumber and its corresponding month and day. Along (a) 110◦–115◦E, (b) 115◦–120◦E, (c) 120◦–125◦E,(d) 125◦–130◦E, (e) 130◦–135◦E, and (f) 135◦–140◦E. (Units: mm d−1)

NO. 4 SUN ET AL. 615
Fig. 10. Northernmost border position that East Asiansummer monsoon reaches in Northeast China.
north border is 42◦N. Within longitudes 115◦–120◦E,the impacts of East Asian summer monsoon beginsfrom the third pentad of July and finishes in the fourthpentad of August (10 July to 20 August), with thestrongest moisture transport by south winds in thesixth pentad of July (25 July to 31 July), and the northborder is 46◦N. In this longitude range, the durationof the impacts of East Asian summer monsoon is wellmatched to the conclusion drawn by Lian et al. (2004)that along 117.5◦E the average onset and retreat dateof East Asian summer monsoon at 40◦N are, respec-tively, pentad 37.65 (around 10 July) and pentad 46.76(around 20 August). Within longitudes 120◦–125◦E,the impacts of East Asian summer monsoon beginsfrom the fourth pentad of July and finishes in thethird pentad of August (15 July to 15 August), withthe strongest moisture transport by south winds in thesixth pentad of July (25 July to 31 July), and the northborder is 49◦N. Within longitudes 125◦–130◦E, the im-pacts of East Asian summer monsoon begins from thefifth pentad of July and finishes in the fourth pentad ofAugust (20 July to 20 August 20), with the strongestmoisture transport by south winds in the sixth pentadof July (25 July to 31 July), and the north border is51◦N. Within longitudes 135◦–140◦E, the northwardmoisture transport of East Asian summer monsoonweakens sharply and the isoline 30 mm d−1 can notmove across 40◦N. On the basis of above discussion,we demonstrate the northernmost border that EastAsian summer monsoon reaches in Northeast China(Fig. 10). The impacts of East Asian summer mon-soon are relatively weak in areas to the west, north,and east of the border.
Synthesizing the above analysis, the following
statements can be reached. The active duration ofEast Asian summer monsoon in Northeast China isfrom around 10 July to 20 August. However, in thesame latitude, the summer monsoon onset dates aredifferent and, specifically, the onset in the west side ofthe area is earlier than that in the east side, with aninterval of around one or two pentads every five lon-gitudes. The retreat dates, however, are similar. EastAsian summer monsoon has the strongest impact onNortheast China from 25 July to 5 August. The lat-itude that the monsoon can reach is gradually north-ward from west to east in this area and, notably, it isup to around 50◦N within longitude 120◦–135◦E. Thisis also the area in Northeast China where the mostsignificant impacts of summer monsoon occur.
3.4 Trajectory characteristics of air masstransport in summers with high and lowrainfall
According to the departure percentage of monthlyregional average precipitation, four typical rainymonths and four typical rainless months are pickedout from the months of July and August in the yearssince 1980. The years with a rainy July were 1985,1986, 1991, and 1994, and the years with a rainlessJuly were 1982, 1997, 1999, and 2000. The averagepercentage value of the precipitation anomaly with arainy July is 32.25%, and −33.5% for a rainless July.The years with a rainy August were 1985, 1987, 1997,and 1998, and the years with a rainless August were1980, 1989, 1991, and 1992. The average percentagevalue of the precipitation anomaly with a rainy Au-gust is 54.5%, and −44.0% with a rainless August. Inorder to compare the trajectory characteristics of airmass transport in the summers with high and low rain-fall, one backward trajectory model is used to calculatetrajectories of the two-dimensional air mass that canreach Changchun (43◦54′N, 125◦13′E) for four rainyJuly and August months, as well as four rainless Julyand August months. The trajectory of air mass thatcan reach Changchun is calculated for each rainy (orrainless) July and August with an interval of six hoursfrom 0000 UTC of the first day of every month to1800 UTC of the last day of every month. As a re-sult, 124 trajectories are attained for each rainy (orrainless) July and August. Thus, there are 496 tra-jectories for four rainy (or rainless) July and Augustmonths. The time span of a trajectory is set as 10days and the point step in the same trajectory is setas one hour. In order to overcome topographical ef-fects, trajectory is modeled in a sigma (σ) coordinatesystem, and considering the moisture and its transportare mainly concentrated in the lower layers, trajectoryis estimated in the two-dimensional wind field of the

616 IMPACTS OF MOISTURE TRANSPORT OF EASM ON NE SUMMER PRECIPITATION VOL. 24
400
800
100
60 40 20
200
600
(b)
(a)
400
100
40
20
60
200
600 800
(c)
20
40
60
100 200 400
800 600
(d)
20 40 60
100
200 400
800
600
Fig. 11. Frequency distribution of trajectory dots of the air masses that can reach Changchun (43◦54′N,125◦13′E) for the four rainy (or rainless) July and August months in Northeast China. (a) Four rainy Julymonths (1985, 1986, 1991, and 1994); (b) four rainless July months (1982, 1997, 1999, and 2000); (c) fourrainy August months (1985, 1987, 1997, and 1998); (d) four rainless August months (1980, 1989, 1991,and 1992).
layer with σ = 0.9, around 900–850 hPa. For the sakeof saving space, Fig. 11 only provides the frequencydistribution of trajectory dots of air mass that reachesChangchun for four rainy (or rainless) July and Au-gust months. The results shown in Fig. 11 suggestthat the air masses which reach Changchun in the fourrainy July months mainly come from near east, nearnorth, northwest, near west, southwest, and southeastpaths. The air masses with near south paths (south-west and southeast paths) can transport large amountsof warm and moist air into Northeast China and theair masses with near west and near north paths mainlyprovide the cold air for the local precipitation. Theair masses that reach Changchun in the four rainlessJuly months also mainly come from the near east, nearnorth, northwest, near west, and near south paths,among which the first four paths are similar to those
of the rainy July months. The main difference lies inthe near south paths. Specifically, the trajectories ofair masses in East China and its coastal area in rainyJuly months are evidently denser than those in rain-less July months, and, in the meantime, the isolineswith the same frequency can extend southward intomuch lower latitudes. For example, the isoline withfrequency 20 in the southwest path can reach 10◦N, thesouth end of Indochina, and in the southeast path itcan reach 15◦N, near the Philippines. In contrast, theisoline in the rainless July months is not able to reach20◦N. This indicates that the difference between rainyand rainless months mainly lies in whether more airmasses originating from lower latitudes move north-ward along East China and its coastal area, conse-quently transporting large amounts of hot and humidair into Northeast China. The trajectory characteris-
NO. 4 SUN ET AL. 617
tics of air masses in rainy (or rainless) August monthsis similar to that in July months, only the air masstransport from the near south path in August monthsis weaker than that in July months.
4. Conclusions
In this paper, the monsoonal moisture transportand its source-sink structural characteristics of sum-mer precipitation in Northeast China, as well as thevariation of moisture budget and the impacts of EastAsian summer monsoon on this area are analyzed. Theresults are summarized as follows:
(1) The moisture of summer precipitation in North-east China mainly originates from the subtropicalmonsoon area, the South China Sea monsoon area,and even the South Asian monsoon area. The precip-itation anomaly is mainly determined by the moisturechange and its northward transport characteristics ofthese monsoon regions. East China, plus its coastalarea (especially the area between the middle and lowerreaches of the Changjiang River and Huanghe River,and the sea to the east of this area) is the conver-gent region of the monsoonal moisture currents andthe “transfer station” for the moisture continuing totransport northward. In fact, the monsoonal moisturetransport, as a main link or bridge, connects the in-teractions between middle and lower latitude systemsand, as an important form or media, realizes the im-pacts of East Asian monsoon on Northeast China.
(2) In the pentad time scale, precipitation inNortheast China tightly relates to previous regionalatmospheric water content, the amount of transportedmoisture, and the convergence of regional moistureflux. This means the advanced transport and accu-mulation of moisture are of particular importance tosummer precipitation in the pentad time scale.
(3) In the summer half year (April to September),Northeast China, with the main moisture outflux oc-curring along the east and north borders, and in con-trast, influx along the south and west borders, is a“moisture sink” (influx greater than outflux).
(4) The monsoonal rainy season phenomenon inNortheast China (establishment of East Asian sum-mer monsoon in this area) corresponds to a significantreinforcement of moisture influx along the south bor-der, and eventually exceeds that along the west bor-der, developing into the primary moisture source ofthis area. This implies that the onset, retreat, and in-tensity change of the monsoonal rainy season in North-east China are signified by the moisture input condi-tions along the south border. Therefore, the impact ofEast Asian summer monsoon on this area should bemeasured mainly by northward monsoonal moisture
transport.(5) The active duration of East Asian summer
monsoon in Northeast China ranges from around 10July to 20 August. However, in the same latitude,summer monsoon onset dates are different and, specif-ically, onset in the west side of the area is earlier thanthat in the east side, with an interval of around one ortwo pentads every five longitudes. The retreat dates,however, are similar. East Asian summer monsoon hasits strongest impact upon Northeast China from 25July to 5 August. The latitude that the monsoon canreach is gradually northward from west to east in thisarea and, notably, it is up to around 50◦N within thelongitude 120◦–135◦E. This is also the area in North-east China where the most significant impact of sum-mer monsoon occurs.
(6) The transport trajectory characteristics of airmasses in summers with high rainfall is similar to thatin summers with low rainfall in the near east, nearnorth, northwest, and near west paths. The maindifference lies in the near south path, i.e., whethermore air masses originating from lower latitudes movenorthward along East China and its coastal area, con-sequently transporting large amounts of hot and hu-mid air into Northeast China.
Acknowledgements. This study was jointly sup-
ported by the National Natural Science Foundation of
China under Grant Nos. 40633016 and 40575047, the
Special Social Public Welfare Foundation of the Ministry
of Science and Technology of China, the Open Foun-
dation of Wuhan Institute of Heavy Rain under Grant
No. IHR2006K05, and the Special Foundation of Cli-
mate Change of China Meteorological Administration un-
der Grant CCSF2006-18.
REFERENCES
Chen, L., Q. Zhu, and H. Luo, 1991: The Study of EastAsian Monsoon. China Meteorological Press, Beijing,362pp. (in Chinese)
Ding, Y., and G. Hu, 2003: A study on water vapor bud-get over China during the 1998 severe flood periods.Acta Meteorologica Sinica, 61(2), 129–145. (in Chi-nese)
Ding, Y., and Coauthors, 2004a: South China Sea mon-soon experiment (SCSMEX) and the East-Asianmonsoon. Acta Meteorologica Sinica, 62(5), 561–586.(in Chinese)
Ding, Y., C. Li, and Y. Liu, 2004b: Overview of the SouthChina Sea Monsoon experiment. Adv. Atmos. Sci.,21(3), 343–360.
Huang, R., Z. Zhang, G. Huang, and B. Ren, 1998: Char-acteristics of the water vapor transport in East AsianMonsoon Region and its difference from that in SouthAsian Monsoon region in summer. Scientia Atmo-
618 IMPACTS OF MOISTURE TRANSPORT OF EASM ON NE SUMMER PRECIPITATION VOL. 24
spherica Sinica, 22(4), 460–469. (in Chinese)Huang, R., L. Zhou, and W. Chen, 2003: The progresses
of recent studies on the variabilities of the East AsianMonsoon and their causes. Adv. Atmos. Sci., 20(1),55–69.
Huang, R., W. Chen, B. Yan, and R. Zhang, 2004: Recentadvances in studies of the interaction between theEast Asian winter and summer monsoon and ENSOcycle. Adv. Atmos. Sci., 21(3), 407–424.
Hu, G., and Y. Ding, 2003: A study on the energy and wa-ter cycles over Changjiang River-Huaihe River basinsduring the 1991 heavy rain periods. Acta Meteorolog-ica Sinica, 61(2), 146–163. (in Chinese)
Lian, Y., B. Shen, and Z. Gao, 2004: An exploration onthe determination of East Asian Summer Monsoonindex. Acta Meteorological Sinica, 62(6), 782–789.(in Chinese)
Robert, A., 1982: A semi-Lagrangian and semi-implicitnumerical integration scheme of the primitive mete-orological equations. J. Meteor. Soc. Japan, 60, 319–325.
Sun, L., and G. An, 2003: The effect of north PacificSea surface temperature anomaly on the summerprecipitation in Northeast China. Acta Meteorolog-ica Sinica, 61(3), 346–353. (in Chinese)
Sun, L., G. An, L. Ding, and B. Shen, 2000: A cli-matic analysis of summer precipitation features andanomaly in Northeast China. Acta MeteorologicaSinica, 58(1), 70–82. (in Chinese)
Sun, L., G. An, and L. Ding, 2002a: The characteristicsof summer drought and flood in Northeast area ofChina. Scientia Geographica Sinica, 22(3), 311–316.(in Chinese)
Sun, L., G. An, Y. Lian, Z. Gao, X. Tang, B. Shen, andL. Ding, 2002b: A study of the characteristics of thegeneral circulation anomaly of the flood and droughtin Northeast China. Climatic and Environmental Re-search, 7(1), 102–113. (in Chinese)
Sun, L., G. An, and X. Tang, 2003: Relationship betweenthe Northeast Asian summer south wind anomalyand the precipitation in Northeast China. ChineseJ. Atmos. Sci., 27(2), 186–196.
Sun, L., B. Shen, G. An, and X. Tang, 2004: A study onthe relationship between the summer precipitation inNortheast China and the global sea surface temper-ature anomaly (SST) in preceding seasons. JournalTropical Meteorology, 10(1), 43–52.
Tao, S., and L. Chen, 1988: A review of recent research onthen East Asian Summer Monsoon in China. Mon-soon Meteorology, C. -P. Chang and T. N. Krishna-murti, Eds., Oxford University Press, 60–92.
Uppala, S., and Coauthors, 2005: The ERA-40 re-analysis. Quart. J. Roy. Meteor. Soc., 131, 2961–3012.
Wang, B., and LinHo, 2002: Rainy seasons of the Asian-Pacific monsoon. J. Climate, 15, 386–398.
Wang, B., R. Wu, and X. Fu, 2000: Pacific-East Asianteleconnection: How does ENSO affect Asian cli-mate? J. Climate, 13, 1517–1536.
Wang, Y., B. Wang, and J.-H. Oh, 2001: Impact of pre-ceding El Nino on the East Asian summer atmo-spheric circulation. J. Meteor. Soc. Japan, 79, 575–588.
Wu, R., and B. Wang, 2000: Interannual variability ofsummer monsoon onset over the Western North Pa-cific and the underlying processes. J. Climate, 13,2483–2501.
Wu, R., and B. Wang, 2002: A contrast of the East AsianSummer Monsoon and ENSO relationship between1962–1977 and 1978–1993. J. Climate, 15, 3266–3279.
Xu, X., S. Tao, J. Wang, L. Chen, L. Zhou, and X. Wang,2002: The relationship between water vapor trans-port features of Tibetan Plateau-monsoon “LargeTriangle” affecting region and drought-flood abnor-mality of China. Acta Meteorologica Sinica, 60(3),257–266. (in Chinese)
Xu, X., L. Chen, X. Wang, Q. Miao, and S. Tao, 2003a:The source-sink structure of water vapor transportof mei-yu belt in Changjiang River basin. ChineseScience Bulletin, 48(21), 2288–2294. (in Chinese)
Xu, X., Q. Miao, J. Wang, and X. Zhang, 2003b: Thewater vapor transport model at the regional bound-ary during mei-yu period. Adv. Atmos. Sci., 20(3),333–342.
Xu, X., L. Zhou, S. Chang, and Q. Miao, 2003c: Char-acteristics of the correlation between regional watervapor transport along with the convective action andvariation of the Pacific Subtropical High in 1998.Adv. Atmos. Sci., 20(2), 269–283.
Yu, R., M. Zhang, Y. Yu, and Y. Liu, 2001: Summermonsoon rainfalls over mid-eastern China lagged cor-related with global SSTs. Adv. Atmos. Sci., 18, 179–196.