The Impact of Microcredit on Financial Inclusion - Lund ...
49
Bachelor Thesis in Economics Autumn semester of 2016 Beg, Borrow or Sell - The Impact of Microcredit on Financial Inclusion Marie Thylén & Valter Selén Supervisor: Maria Persson School of Economics and Management Lund University
-
Upload
khangminh22 -
Category
Documents
-
view
1 -
download
0
Transcript of The Impact of Microcredit on Financial Inclusion - Lund ...
Bachelor Thesis in Economics
Autumn semester of 2016
Beg, Borrow or Sell - The Impact of Microcredit on
Financial Inclusion
Marie Thylén & Valter Selén
Supervisor: Maria Persson
School of Economics and Management
Lund University
2
Abstract
Microcredits have alternately been hailed as the future of developing economics and criticised
for becoming a one size fits all-solution to complex issues. This paper is an attempt to add to
a growing literature on the impact of microcredits on different stakeholders in the developing
world. It investigates the role of microcredit in fostering financial inclusion through a minor
field study carried out in Botswana during eight weeks at the end of 2016. Our data was
gathered through a survey distributed to small- and medium-size enterprises (SMEs) and
through interviews conducted with relevant agents in Gaborone. Our thesis strives to provide
a descriptive overview of the attitudes of SMEs towards microloans, and supplement this
descriptive analysis with a research question on whether microloans can act as a stepping-
stone towards financial inclusion, which is analyzed through econometric regressions. We
find that attitudes towards microloans are negative, mainly due to the fact that there is a lack
of awareness surrounding microloans. Furthermore, our econometric regressions cannot be
considered indicative of microloans having a significant effect on financial inclusion, as the
results lack robustness. We attribute the lack of awareness to the presence of information
asymmetry that creates conditions in which it becomes more rational for SMEs to seek other
sources of credit such as banks or informal lenders. For this reason, microcredits do not foster
financial inclusion in Botswana. However, it has the potential to do so if attitudes can be
improved through initiatives to increase the awareness of microloans amongst SMEs.
Keywords: Microcredits, financial inclusion, small- and medium-size enterprises, Botswana
3
Acknowledgements
We dedicate this paper to his worshipness Haskins Nkaigwa who mayored the amazing city
of Gaborone during our stay, and thank him for busting some mad moves at the St Louis
Fresh Festival.
We would like to offer our profuse thanks to our supervisor and sensei Maria Persson for all
the helpful advice she has given us – it has been indispensible. Also manning the barricades at
home was Joakim Westerlund, who offered succinct replies to our econometrics-related
tirades. We extend our thanks to Noam, Porky, Lala, Chipo and Alex the Beard for giving us
the warmest and wettest welcome fathomable. We would also like to extend our gratitude to
Veronica Makwinja at Botho University, for showing two jetlagged Swedes the ins and outs
of Batswana bureaucracy. Furthermore, we would like to thank the Swedish International
Development and Cooperation Agency for granting us funding for our research through the
Minor Field Study scholarship, proving once again their ability to allocate taxpayers’ money
to undeserving but thankful hands. Lastly, we would like to thank our families, especially
BC300 and Face the Face for always providing (sur)reality checks.
4
Table of Contents
Abstract ................................................................................................................................... 2
Acknowledgements ............................................................................................................... 3
Abbreviations ......................................................................................................................... 5
1. Introduction ....................................................................................................................... 6
2. Background ........................................................................................................................ 9 2.1 Microcredits .............................................................................................................................. 9 2.2 Financial inclusion ................................................................................................................ 10
3. Previous Studies ............................................................................................................. 12
4. Theoretical Framework ............................................................................................... 15 4.1 Microcredits as a means of gaining financial access ..................................................... 15 4.2 Financial inclusion through microloans .......................................................................... 16
5. Empirical Strategy and Methodology ....................................................................... 18 5.1 Data collection method ......................................................................................................... 18 5.2 Approach to descriptive data analysis of attitudes ....................................................... 19 5.3 Econometric approach to answering our research question ...................................... 20
6. Results and Analysis ..................................................................................................... 23 6.1 Empirical findings and analysis of attitudes towards microcredit ............................ 24 6.2 Empirical results and implications for microcredit as a stepping-stone .................. 31 6.3 Potential flaws in our research design .............................................................................. 38
7. Recommendations and Final Remarks .................................................................... 41 7.1 Policy recommendations ...................................................................................................... 41 7.2 Summary and conclusion .................................................................................................... 41
Reference List ..................................................................................................................... 44
Appendix .............................................................................................................................. 46
5
Abbreviations
CEDA Citizen Entrepreneurial Development Agency
LEA Local Enterprise Authority
MFI Microfinancial Institution
NBFIRA Non-bank Financial Institutions Regulatory Authorities
NGO Non-Governmental Organization
OECD Organization for Economic Cooperation and Development
OLS Ordinary Least Square
SIDA Swedish International Development and Cooperation Agency
SME Small- and Medium-sized Enterprises
UN United Nations
6
1. Introduction
In 2015, member nations of the UN adopted seventeen Sustainable Development Goals with
the aim of eradicating poverty and foster prosperity in a feasible way. The approach to
working with these goals and their priority varies with political, economic, environmental and
social contexts that differ between countries. In the context of developing economies, a well-
functioning financial system plays an especially crucial role in facilitating economic growth
that can move people out of poverty (Lopatta & Tchikov 2016, p. 6). Even though this is
recognized in several of the sustainable development goals, goal number 8 specifically states
that member countries should “promote inclusive and sustainable economic growth,
employment and decent work for all” (UN 2016). One of the explicit target policies outlined
to reach the goal is the encouragement of micro-, small- and medium-sized enterprises
(SMEs) through ensuring financial access (UN 2016). As such, financial inclusion is an
integral part of creating opportunities for SMEs in developing countries. If this inclusion can
be achieved, it holds the promise of a path to growth and development for large parts of the
developing world. Therefore, a practical issue becomes how to best grant these enterprises
access through including them financially. One prominent idea is that the provision of
microfinancial services can provide a means of promoting financial inclusion,
entrepreneurship and productivity. For these reasons, many have considered microloans an
efficient and preferable means of creating economic growth. For instance, microloans have
sometimes replaced traditional aid when non-governmental organisations (NGOs) and
national governments provide assistance to developing countries. Therefore, the question of
the efficacy of microloans is a current issue, and findings on this credit source have both
academic and practical applicability throughout the developing world. Throughout this thesis,
the terms microcredits and microloans will be used interchangeably and defined as “the
provision of credit without [much] collateral, usually in relatively small amounts and for short
periods of time” (Ghosh 2013, p. 1205). We will also define financial inclusion as “the
proportion of individuals and firms that use financial [banking] services” (World Bank Group
2014, p. 1). These financial banking services are in turn restricted to loans provided by formal
financial banking entities. Our thesis investigates whether microcredits do indeed act as a
good means of fostering financial inclusion through a case study in Botswana. Our hypothesis
is that microfinancial loans act to improve financial inclusion in Botswana and other
comparable developing countries.
Sub-Saharan Africa serves as a potent example of how traditional financial
institutions come up short against the goal of financial inclusion (Napier 2011, p. 5).
Although financial inclusion has improved in sub-Saharan Africa over the last decade, the
region is lagging behind compared to the rest of the world in terms of financial inclusion with
persistent regional differences. Research on different financial markets in Botswana can be
7
found but more research on the effect of microcredit on financial inclusion is needed. The
country is considered somewhat of a historical and economical outlier in Sub-Saharan Africa
as diamond mining and cattle raising forms the foundation of a relatively successful economy.
However, as the economy is lacking in diversification, the economic growth of Botswana
today is largely conditioned by continued diamond revenue. As recourse to this dilemma, the
Botswana government wishes to enable Batswana (nationality and people of Botswana)
entrepreneurs to invest and develop new businesses and strives to encourage existing firms to
grow (Mangadi et al. 2011, p. 63). Therefore, it is in the interest of the government to ensure
that agents have access to some sort of credit, which could allow for investments and in
extension promote continued economic growth in Botswana. The main providers of these
credits are different kinds of financial institutions. However, larger commercial agents that do
not necessarily place an emphasis on smaller entrepreneurial clients have dominated the
financial landscape. This has lead to smaller borrowers becoming excluded from formal
financial institutions (Botlhole & Okurut 2009, pp. 255-6).
Moreover, the degree of financial inclusion depends in no small part on the
conditions facing lenders and borrowers in Botswana. Commercial banks face problems with
lack of information about potential borrowers and therefore set up requirements which can
become barriers to prospective clients that cannot show credit history, trustworthy licenses for
their enterprises, or provide enough collateral (Morewagae, Seemule & Rempel 1995, p. 496).
This is where microlenders have an advantage in customer relations, since they often operate
on a smaller scale and in communities where they often know their clients. This can promote
trust and respect in the relationship between the microlender and entrepreneur (Anjugam &
Senum 2013, p. 406). In smaller communities the threat of embarrassment and bad reputation
can serve as enough incentive to repay loans, making collateral a mostly secondary source of
risk-management for microcreditors.
In this context, our thesis we will investigate whether microfinance acts as a stepping-
stone to financial inclusion through our case study in Botswana. Our first aim is to provide a
descriptive overview of the attitudes of small- and medium-sized enterprises towards
microloans. Secondly, we center our attention on answering the research question:
Does the previous or current use of microcredits amongst small- and
medium-sized enterprises increase the probability of having a bank loan?
To reach these aims, this paper is structured as follows: First, in order to give the reader some
background we will define, describe and relate the concepts of microcredits and financial
inclusion to the country-specific context. The next section outlines the relevant previous
studies and their main findings. The theoretical section links the concepts and our research
8
question to economic theory. The empirical strategy describes the research methodology for
collecting and processing primary data. This is followed by our findings and analysis of these
together with a discussion of potential shortcomings of our study. Lastly, policy
recommendations, a conclusion of our study and a summary of our thesis complete this paper.
9
2. Background
2.1 Microcredits
Given the topic of this thesis, it is important to be clear on how we define ”microcredits”. We
have chosen to define microcredit as “the provision of credit without [much] collateral,
usually in relatively small amounts and for short periods of time” (Ghosh 2013, p. 1205).
Furthermore, microcredits are usually directed at smaller enterprises that presumably would
not qualify for a formal bank loan. The microloans are designed to be granted to higher-risk
borrowers as they apply less rigorous demands.
When studying the financial environment in Botswana we differentiate between
formal and informal financial institutions as these operate under different conditions. Formal
institutions include both state-run and commercial banks as well as licensed microlenders.
Informal institutions refer to agents working outside the government enforced regulatory
frameworks. Formal sources of credit will refer to bank loans while microloans refer to loans
from licensed microlenders or microfinancial institutions (MFIs). Informal loans on the other
hand, will refer to loans issued by lenders that are not licensed by the state, which includes
unofficial moneylenders but also friends and family. Whilst this dichotomy is necessary to
establish for research purposes, it is important to acknowledge that this division is far from
unproblematic. Considering that Botswana only founded a regulatory agency for microlenders
in 2012, the Non-Bank Financial Institutions Regulatory Authority (NBFIRA), it is not
unlikely that some MFIs operate in legal gray areas under conditions that are neither formal
nor informal.
Furthermore, one may get the impression that as licensed microlenders work under
the rules of the government they ought to provide fairer and more accessible loans than
informal lenders. However, this is not necessarily the case as the requirements put on licensed
microlenders only applies to areas such as the lenders’ financial liquidity, business plan,
delinquency policy, etc. (NBFIRA Act 2012). The regulatory framework that allows NBFIRA
to license a lender says nothing about what the contract between lender and borrower may or
may not include. Thus in terms of interest rates, collateral requirements and repayment plans
applicable to clients, the licensed microlenders are in no way bound to be superior to an
informal source of credit. This is not to say that a license is meaningless, as it does provide
legitimacy and establishes conditions for increased transparency in the financial system. It is
reasonable to believe that predominantly serious lenders would go through the trouble of
becoming licensed, which means the license can improve the level of trust between the lender
and the borrower.
Given that microcredits are one of the credit options available to enterprises, they can
play a major role in the financing of entrepreneurial activities for borrowers that can be both
10
financially included or excluded (CGAP 2012, p. 2). Bearing this in mind, the growing
prevalence of MFIs has also meant that the results initially promised by microfinancial
services have come under closer scrutiny in academic circles. A common assumption has
been that microcredits serve primarily as a means of including previously financially
excluded poor people. This is often not the case, since many microcredit clients used informal
financial services before the introduction of microcredits and continue to use them as well.
Similarly, the microloans taken by smaller enterprises are far from always used for business
investments (CGAP 2012, p. 2). Small enterprises get 14,9 percent of their credit from
informal sources that include family, friends and moneylenders and 12,9 percent from the
banking sector. When looking at larger firms, these percentages are respectively 2,1 percent
and 26,5 percent (Peachy & Roe 2006, p. 51), suggesting that as firms grow they tend to
prefer bank loans to informal sources of credit.
2.2 Financial inclusion
When investigating our research topic, we will use the definition of financial inclusion
outlined by the World Bank, where financial inclusion is “the proportion of individuals and
firms that use financial [banking] services” (World Bank Group 2014, p. 1). These financial
banking services are in turn restricted to loans provided by formal financial banking entities.
Some consider MFIs to be a means of improving financial inclusion, whereas others have
questioned whether they can indeed act as determinants of growth and development (World
Bank Group 2014, p. 3). Hence, our definition of financial inclusion does not include
microcredits granted by MFIs. This follows the established research typology, and allows us
to focus on the relationship between microcredits and financial inclusion. More specifically,
these distinctions help us investigate whether microcredits act as a stepping-stone from which
individuals can enter the formal banking sector.
When considering the level of financial access enjoyed by enterprises, we must
account for the characteristics of the financial sector. In Botswana the financial sector is
regionally heterogeneous, but on the aggregate about 68 percent of the adult population is
served by the formal financial banking sector (UNCDF 2016, p. 7). Informal lenders still
constitute for a large portion of the credit market, especially in rural areas. However, almost a
fourth of the national adult population is classified as excluded from any financial services
(UNCDF 2016, p. 8). This is troublesome, as these constitute the national workforce, of
which many are running SMEs or currently employed by them. Even though Botswana is
doing relatively well compared to other sub-Saharan economies there are still improvements
to be made. Furthermore, there is reason to believe that the formal banking sector underserves
SMEs with financial services in Botswana. This is supported both by the presence of both
government initiatives aimed at providing credit and financial advice such as the Citizen
11
Entrepreneurial Development Agency (CEDA) and the Local Enterprise Authority (LEA),
and the number of microlenders in Botswana1.
1 Based on List of Licensed Microlenders NBFIRA 2016.
12
3. Previous Studies
When discussing the majority of the previous studies relevant to our thesis topic, it is
important to consider the context in which they were conducted. The studies found in this
section are meant to constitute a representative cross-section and are mainly indirectly related
to the realms of both attitudes towards microcredits and our research questions, i.e. “Does the
previous or current use of microcredits amongst small- and medium-sized enterprises increase
the probability of having a bank loan?”. As our research attempts to address a specific aspect
of microloans using a specific country for our case study, the included previous studies are in
a broader sense indirectly related to our topic. We will first present studies that cover general
aspects of microfinance while the later studies are more specific to Botswana in order to
provide the reader with the relevant context for our study.
As this thesis sets out to investigate whether microcredits could further financial
access and inclusion we found Ghosh’s (2013) critical review of empirical literature on the
subject relevant. Looking at the development of microfinance, Ghosh highlights the problems
with the transformation of the microcredit industry. Emerging as non-profit NGO-run
measures to help the poorest in the economy, it later became dominated by market-oriented
profit seeking lenders. This led to microloans being characterized by excessive interest rates
and less ethical methods to ensure repayment, much like the moneylenders that MFIs initially
were meant to constitute an alternative to. Furthermore, Ghosh finds that MFIs are unwilling
to take on the burden of risk assessing, screening and monitoring individual clients and
therefore find it easier to charge high interest rates on all loans to cover the costs of potential
defaults. Yet, the author remarks that microfinance cannot be completely disregarded for
financial inclusion as the alternative for the financially excluded are the more exploitative or
unreliable informal lenders. Ghosh concludes that financial inclusion to institutional finance
must be a policy-driven and subsidised measure by regulatory authorities in order to be
successful.
Beck and Cull (2014) provides a comprehensive study that aims at gauging SMEs
access to financial services in Africa. As such, it is highly relevant to our study as it provides
a general perspective on hinders to financial inclusion on the African continent. Since it uses
regression analysis of aggregated survey data, their methodology and approach to the subject
informs our working method to a large extent. The study identifies microenterprises as a key
segment for microlenders to target and finds that African enterprises in general are less likely
to have bank loans than in other parts of the developing world. Furthermore, it finds that over
25 percent of African firms consider availability and cost of finance a hinder to growth and
further investments (Beck & Cull 2014, p. 9). Crucially, the study provides a rationale for
why SM’s would choose to not use microcredits, such as high interest rates and shallow
13
financial markets (Beck & Cull 2014, p. 7). This informs our negative prior in regards to our
descriptive analysis.
Also looking at the African region De Wet et al. (2012) conducts a systematic review
of previous studies on microfinance in sub-Saharan Africa. The study methodologically
presents and evaluates significant findings of 15 studies that met a number of criterions. Its
most controversial finding is that microfinance has no significant impact on incomes for
households and businesses. Rather, it finds that the effects seem ambiguous. Even though
microfinance has been found to have positive effects on other welfare factors such as health
and food security, it seems to have negative effects on education, doubtful effects on female
empowerment and no effect on job creation. The authors’ conclusion is that microfinance
does not act to effectively reduce poverty, and they therefore take a critical stance towards the
promotion of microfinance as a means of achieving the previous Millennium Development
Goals.
Aggarwal et al. (2016) provides insights on why entrepreneurs in both Africa as a
whole and Botswana particularly do not consider microcredits an attractive source of
financing. The book provides findings that indicate that over 20 percent of Batswana
entrepreneurs use family as the primary source of credit, and over 40 percent use formal bank
loans. In this context, the number of entrepreneurs using microcredits as their primary credit
source is negligible (Aggarwal et al. 2016, p. 184). To explain this, the authors raise the
possibility that African entrepreneurs are not aware that microfinancing is an existing option
for them. Such a lack of information could prove crucial to whether microcredits act as a
stepping-stone towards financial access or not and clearly informs the attitude of
entrepreneurs toward microcredits as a concept. For instance, the book provides evidence that
more than 35 percent of Batswana are unaware of the presence of micro financing in their
community (Aggarwal et al. 2016, p. 186). As such, the book finds that the success of
microcredits depends not only on the provided services themselves, but also on the awareness
and perception of these services. These findings are crucial to how attitudes towards
microcredit affect the usage of this credit source.
UNCDF (2016) is one of the most comprehensive studies found on the subject of
financial access in Botswana, which gathered data in order to identify necessary
improvements that can be made to the existing financial infrastructure. These issues are
addressed from a demand-side perspective. The study finds that 50 percent of the adult
population is served by the formal banking sector, whilst only 8 percent use purely informal
financial services. The perceived obstacles to financial inclusion for those financially
excluded are identified as low levels of income, lack of financial literacy, high costs of
lending, low demand of financial services, and client requirements such as collateral and
documentation.

14
Generally speaking, most of the studies consider economic development and growth
from a wider perspective, where financial inclusion is a given precondition for these
developments rather than the main subject of study. In the specific context of microfinance in
Botswana, it is worth noting that whilst there are several studies which investigate the role of
microfinance in the Botswana economy (see above Aggawar et al. 2016; UNCDF 2016), few
if any of these studies focus on whether microcredits in particular affect the transition of
lenders from the informal to the formal economy. This serves as the academic motivation for
our research.
15
4. Theoretical Framework
4.1 Microcredits as a means of gaining financial access
Access to some kind of credit in the economy allows enterprises to borrow or lend funds in
the present, in order to account for planned savings or spending in the future (Burda &
Wyplosz 2010, pp. 156). Such financial access is a pivotal to the ability of enterprises to
establish themselves and develop through investment. The main providers of these credits are
different kinds of financial institutions. These institutions are intermediaries dedicated to the
reallocation of monetary means from agents with a surplus of funds to those in need of
additional funds (Byström 2014, p. 20). For this reason, financial institutions are central in the
context of financial inclusion as the actions of these institutions impact the accessibility of
credit. The behavior of financial institutions can in turn be traced to their organizational
structure and legal standing. It is reasonable to assume that a venerable international bank
with a diverse clientele will operate differently than a small, newly started microfinancial
agent that caters exclusively to local entrepreneurs.
We will assume that SMEs act as rational agents who seek to choose the optimal
financing option that maximizes their utility. As such we assume that SMEs evaluate the
credit options based on their perceptions and knowledge of these options, as well as their
availability of the same. They will then apply for the financing option that is not only optimal,
but also viable. Thereby, we assume that SMEs act in accordance with bounded rationality.
Within this framework, their preferences and decisions are rational within a context of limited
available information and the potentially imperfect cognitive abilities of the entrepreneurs
(Burns & Roszkowska 2016, p. 200). By taking information asymmetry into account,
bounded rationality provides a convincing theoretical rationale for how to analyze the
financing decisions of SMEs. Bounded rationality also captures how the cost of finding
information influences the decision-making of agents, which helps explain why SMEs may be
unaware of credit alternatives and unwilling to gather information about these alternatives.
Information on the credit options is crucial for SMEs making financing decisions. In
this context, we use information in the widest sense to mean not only facts, but also
perceptions, attitudes and “word of mouth” that constitutes the entrepreneurs’ knowledge of
the available sources of credit. Furthermore, we can assume that there is a heterogeneous
level of financial literacy and knowledge of available credit options amongst SMEs. This
results in an information asymmetry between prospective borrowers and is especially
prevalent when comparing financially excluded and financially included SMEs. Besides
plausibly having a higher level of creditworthiness, the fact that those financially included
hold more information on available credit options may be due to things such as previous
experiences and established connections with lenders. Taking this asymmetric situation into
16
account it provides a theory as to why some credit sources are preferred over others and why
some might not even be considered at all.
The presence of information asymmetry results in a lack of awareness of financial
alternatives, and increases the information costs related to SMEs having to devote time, effort
and money on gathering and evaluating limited information on the available financing
options. These costs in time, money and effort related to unsuccessful applications for
microloans may well outweigh the potential benefits, and such information costs therefore
apply both to lenders and borrowers (Waldeck 2002, p. 1). Moreover, the costs attributable to
this information asymmetry will lead to sub-optimal choices of financing and potentially
higher credit costs as lenders can take advantage of the fact that financially excluded SMEs
must make a decision on their financing without being in possession of full information.
Furthermore, information asymmetry will affect the attitude of SMEs towards the available
credit options. As those with some degree of financial access enjoy greater availability of
financing options, it is likely that these SMEs will have a more positive view on the
availability of credit. By the same token, those SMEs who find themselves financially
excluded are likely to have an opposing view. As such, the attitudes of SMEs’ towards credit
options will affect whether they even consider different credit options, regardless of their
actual eligibility for such credits. As a result, there is the distinct theoretical possibility of a
negative spiral, wherein those already financially excluded will not gain financial literacy and
attain increased information about credit options, which in turn perpetuates the presence of
information asymmetry.
4.2 Financial inclusion through microloans
Without access to some type of formal financial intermediary, enterprises are left to their own
devices when seeking credit. Assuming that agents do indeed wish to invest and/or
consumption smooth, a hypothetical absence of microcredits would not affect the demand for
credit in the economy. Rather, this situation would force many non-bankable enterprises to
rely on informal sources of credit such as pawnbrokers, family or friends, etc. As these
informal sources are by definition under- or unregulated, it follows that these sources will
offer sub-optimal loans. Without regulations in place, there are no safeguards against
predatory lending. At the same time, the lenders would most likely charge high interest rates
to account for the high level of risk associated with lending to agents rejected by formal
institutions. Moreover, from the agent’s perspective these informal sources of credit are less
reliable, since they may not always be available. For these reasons, it should be more
attractive for agents such as SMEs to borrow from formal financial institutions as these loans
are more reliable, less risky and more effective (Byström 2014, p. 19).

17
The lack of access to formal bank loans can be traced to the theoretical distinction
between microcredits and formal bank loans. Formal banking institutions do not usually grant
smaller loans, since the returns with interest on such loans do not cover the costs associated
with gathering the necessary information (Waldeck 2002, p. 1). The formal banks resort to
using other methods of minimizing default risks associated with lending, such as large
collateral, which prevents many enterprises from getting formal loans. Unlike for formal bank
loans, MFIs do not have to face the same level of information costs since they can develop
close relationships with the lenders through working close to the communities where informal
channels provide information on creditworthiness. This means that microcredits usually cater
to customers that are unable to qualify for formal bank loans such as smaller enterprises that
lack sufficient financial documentation. Microlenders can compensate for some borrowers’
lack of accurate financial documentation and assess their creditworthiness through visits and
repeated social interactions, which allows them to gauge a client’s character and by extension
their risk of default.
The granting of a microloan can positively affect the enterprise’s earnings and
financial flows, which in turn can act to improve the creditworthiness of the enterprise in the
long run. Moreover, it is realistic for formal institutions to assume that MFIs have no interest
in granting credit to borrowers that run too high risks of default. By extension, microlenders’
judgment on the creditworthiness of an enterprise is based on the same metrics used by formal
banking institutions. This means that agents trusted by microlenders, especially licensed ones,
can also be considered reliable by formal banking institutions. This holds especially true if the
microlenders themselves are subject to a legitimate framework of rules and regulations.
Following from this line of reasoning, microcredits could theoretically act as means of
gaining access to the formal banking sector as enterprises seeking formal loans can use their
records of successful use of microcredit as proof of creditworthiness and reliability. This
leads us to hypothesize that given that SMEs have a positive attitude towards microloans, the
usage of such loans could act as a stepping-stone to financial inclusion. We investigate this by
providing a descriptive overview of attitudes towards microloans, and by testing whether the
use of microloans increase the probability of having a bank loan.
18
5. Empirical Strategy and Methodology
5.1 Data collection method
To provide a descriptive overview of SMEs’ attitudes towards microcredits and answer our
research question, “Does the previous or current use of microcredits amongst small- and
medium-sized enterprises increase the probability of having a bank loan?” we use primary
data collected through a survey2 aimed at suitable enterprises. We strategically target SMEs
as they are usually run by low to low-middle income earners who are more likely to be
financially excluded or using informal loans. They are also likely to be looking for smaller
types of loans for investments and may be in need of larger loans in favour of enterprise
expansion. Therefore, we cover subjects financing their enterprises through different means
and credit options. We use the OECD definition of SMEs, which acknowledges the lack of a
universal definition but goes on to assert that SMEs are “non-subsidiary firms which employ
less than a given number of employees” (OECD 2016, p. 21). Though the upper limit is set at
250 employees, we recognize that the Botswana conditions and our research questions
mandate a less generous definition. Therefore, we only consider firms with less than 50
employees (the upper limit for small firms according to the OECD), which in our terminology
will include so-called microenterprises with less than 10 employees (OECD 2016, p. 21).
When distributing our survey we have primarily focused on reaching the manager or owner of
the enterprise, since they are the ones most likely to be making the financing decisions. Many
of the respondent enterprises were found in shops, restaurants, service points, etc. in and
around malls in central Gaborone. Another representative group was found amid the many
market stalls and so called “tuck shops” (kiosk-like small businesses) around the city. Some
respondents were clients found through LEA and a local licensed microlender. By doing this
we have tried to capture the targeted demographic whilst ensuring that we carry out the field
study within the limited time frame. We are aware that our sample may not capture all sectors
in which SMEs are operating and therefore acknowledge that our sample potentially does not
fully reflect the population we wish to capture. This will be discussed further in section 6.3.
However, for the purposes of this thesis we will treat our sample as representative of the
SMEs operating in Gaborone.
The survey concerns previous and current credit access, what sources of credit the
enterprises potentially use, determinants of choosing and having access to these credit sources
as well as attitudes towards different sources. In designing the survey, we made an effort to
ensure that the questions were to the point and easily understood in order to get answers that
reflect reality. For this reason, the survey predominantly consists of multiple-choice questions
of a yes/no-type. These answers have been transformed into binary data to allow for
2 Survey found in Appendix 1
19
regression analysis. To avoid recall bias and navigate potential cultural stigmas some
questions are posed several times with different wording, whilst instruments are used to
capture data on potentially sensitive matters such as personal wealth and financial outlook.
To get started with our research we initially received assistance from our contact at
Botho University in Gaborone to help us locate local businesses and guide us when
approaching banks and ministries relevant to our research. Once we had identified relevant
government-run financial development agencies for SMEs and located the commercial banks
we asked them to help us locate and distribute the survey to their SME clients. However, after
conducting an impromptu pilot study by distributing a few surveys in a smaller mall, we soon
realized that the best way to collect data was to approach SMEs directly and ask them to fill
out the survey on site. This way we could clarify any arising questions. To this end, we have
found this method to ensure quality data in terms of reliable and comprehensive answers. It
should however be noted that we have at times chosen to be flexible in our collection method
in order to ensure a significant data quantity within our given timeframe. Thus we have
chosen to rather disregard uncompleted survey responses in order to obtain a greater number
of survey responses. This flexibility served to overcome language barriers, ensure anonymity
and collect a larger sample despite our restricted mobility.
Additional to the data gathered in the form of survey responses we have also
conducted interviews in an open-ended methodological format. Qualitative data attained from
these interviews serves the purpose of complementing the survey responses when providing a
descriptive overview of SMEs attitude towards microcredits. Since we are looking to
investigate attitudes these cannot only be analyzed through hard facts. As they include less
tangible matters such as perceptions and feelings these are not fully mediated through a
multiple-choice questionnaire. Aiming to present a representative depiction of agents
concerned with SMEs credit access, the variety of perspectives as well as complexity of
different interests in the matter, we have held interviews with state-run financial agencies,
commercial banks, and the owners and employees of the enterprises themselves.
5.2 Approach to descriptive data analysis of attitudes
In providing a descriptive overview of attitudes towards MFIs, we use our survey data and
interviews to evaluate four questions. These questions are used to capture the attitudes and
include issues of awareness, availability, fairness and desirability. These are:
1) Do SMEs know what microloans are, and do they consider microloans a possible source of
credit?
2) Do SMEs perceive microloans as sources of credit available to them, and what
characterizes the SMEs that find microloans to be a likely choice of credit?
20
3) Do SMEs consider microloans to have fair terms, and are there any preconceptions
surrounding the use of microloans?
4) Are microloans considered desirable to SMEs, or do they prefer other sources of credit?
To answer the first question we exclusively use our qualitative findings from
interviews conducted with both relevant financial agents and the SMEs themselves. This
follows from the fact that awareness is a less tangible concept and is not captured in any of
our survey data. The following three questions will primarily be evaluated based on statistics
from the survey data. The second question concerning attainability of microcredits is
evaluated through the findings from question 34 in our survey3, which addresses which source
of credit SMEs would first consider if in need of a loan. We have formulated the question in
this way following from our theoretical argument that subjects will turn to the best available
credit option they consider attainable. The third question concerning fairness is evaluated
using data from survey question 24, which asks about the respondents’ personal opinions on
the fairness of microloans, regardless of their potential eligibility for such a loan. Their stance
towards credit options is evaluated on whether they consider microloans fair on the three
criterions of interest rates, repayments plans and collateral requirements. Furthermore, the
evaluations of these quantitative findings will be complemented by qualitative material from
interviews, which provides additional depth to the analysis. The fourth and last question is
evaluated through findings on survey question 31, which asks the respondents to indicate their
preferred choice between a microloan and a bank loan. They are asked to consider the same
three criterions found in question 24, but in a comparative context rather than as a question of
fairness. This approach to use both quantitative and qualitative findings to answer these
questions enables us to provide a comprehensive and nuanced descriptive overview of
attitudes towards microcredits.
5.3 Econometric approach to answering our research question
By answering the question “Does the previous or present use of microcredits amongst small-
and medium-sized enterprises increase the probability of having a bank loan?” we want to
investigate whether the use of microcredit could be advantageous when trying to become
financially included into the formal financial sector. Using a binary regression model and our
gathered data, where having a bank loan is the dependent variable (𝑦), it is possible to
estimate the coefficients (βi), which indicate the effect on having a bank loan for our
independent variables. The two independent variables of interest are the previous (D1) and
current (D2) uses of microloans. These specific independent variables will be dummy-
variables equal to one if the individual subject has used or is using microcredits, and equal to
3 Survey found in Appendix 1
21
zero if the subject is not using or never has used microcredits. We have set out to cover as
many other relevant determinants as possible in order to isolate the single effects of
microcredits. Thusly, we formulate our null hypothesis as β1=0, β2=0.
When handling the data mathematically, we will only be able to observe the dummy-
variable 𝑦 for the latent variable 𝑍,
𝑦 = {1 𝑖𝑓 𝑠𝑢𝑏𝑗𝑒𝑐𝑡 ℎ𝑎𝑠 𝑎 𝑏𝑎𝑛𝑘 𝑙𝑜𝑎𝑛0 𝑖𝑓 𝑠𝑢𝑏𝑗𝑒𝑐𝑡 𝑑𝑜𝑒𝑠 𝑛𝑜𝑡 ℎ𝑎𝑣𝑒 𝑎 𝑏𝑎𝑛𝑘 𝑙𝑜𝑎𝑛
To estimate the determinants of 𝑦 there are a few ways to model the probability of having a
bank loan (𝑝𝑖). We will consider an ordinary least square (OLS) model, a logit model and a
probit model. In all three we start by defining 𝑍𝑖, which is the dependent variable “having a
bank loan” given by a function of independent variables that are determinants of getting a
bank loan. For example the function could be given by:
𝑍𝑖 = 𝛽0
+ 𝛽1
𝐷1𝑖 + 𝛽2
𝐷2𝑖 + 𝛽3
𝑥3𝑖 + 𝑢𝑖
where 𝐷1 is the dummy-variable for previous use of microcredits, 𝐷2 is the dummy-variable
for currently using microcredit, 𝑥3 is a variable for sex, and 𝑢𝑖 is the error term. This is
merely a simplified example of what the function includes, but given our data we fine-tune
and adjust the regression function by adding or subtracting relevant determinants. Through
this fine-tuning, we specify a model that best captures the trends in the data. Once we have
run the regression we will get the coefficient for the independent variables. When calculating
our estimated value of the function (��) we will use the sample mean for each variable (i.e.
𝐷1 , 𝐷2
, 𝑥3 ) rather than individual observation values (i.e. 𝐷1𝑖, 𝐷2𝑖, 𝑥3𝑖).
OLS is the simplest model we use to estimate our binary choice model. It assumes the
probability of the dependent variable being equal to one to be a linear function of the
independent variables. Simplified, this means that 𝑝𝑖 = 𝑍𝑖. This model allows us to interpret
the coefficients 𝛽1 and 𝛽2 as the marginal effects, such that these effects tell us how much the
probability of having a bank loan changes by having previously used microloans and by
currently using microloans. Although the model is straightforward and easy to use, it has
considerable limitations. The predictions can take values less than zero and greater than one,
in which case it becomes faulty to interpret these results as probabilities as we wish to do.
Thus, this model is not optimal for estimation, but we have chosen to include it in order to
check for robustness and to run tests for heteroscedasticity. Our second model for estimation,
which is logit suits our data better. This model assumes the probability to have a logistic
22
distribution. As the probability is a logistic function of the latent variable 𝑍 (𝑝𝑖 = 𝐹(𝑍𝑖)) it
will tend to one when 𝑍 approaches infinity and tend to zero when 𝑍 approaches minus
infinity. We therefore do not risk getting invalid values for probability with this model.
Unlike OLS we cannot interpret the coefficients we receive from the logit regression as the
marginal effects of the independent variables. The marginal effect is calculated as the
derivative of the probability function (𝑑𝑝
𝑑𝑍) multiplied by the estimated value of relevant
variable coefficient (e.g. 𝑏1). However, the logistic distribution assumes a higher variance
than the normal distribution, which is the most commonly used when the distribution is
unknown. In spite of this, we have chosen to include it as a check for robustness.
The probit model, which is our main model for estimation, assumes the probability of
the dependent variable, in our case “having a bank loan” to follow a normal distribution. To
estimate the marginal effect of having previously used microcredit on the probability of
having a bank loan, we calculate:
𝑓(��)𝑏1 =1
√2𝜋𝑒(−
12
��2)𝑏1
where �� is the estimated value of 𝑍𝑖 and 𝑏1 is the estimate of the coefficient 𝛽1 that we
received from the regression. The marginal effect will be interpreted as by how many
percentage points the use of microcredits change the probability of having a bank
loan. Although marginal effects are specific to individual observations we wish to estimate
the effect based on our full sample and therefore use the sample mean of variable values as
explained above. As long as there is a sufficient number of observations with a dependent
variable taking the value of one in the data sample, probit can be used for the regression.
23
6. Results and Analysis
In analysing our empirical findings, we have computed both regression analysis and
descriptive analysis. Our primary collected data consists of 103 respondents and is treated as
representative of SMEs in Gaborone as previously mentioned (see section 5.1). We estimate
the number of SMEs in the city and its surroundings to number approximately 19004,
meaning that we have collected a survey sample representing a little more than 5 percent of
the described population. To briefly describe the characteristics of the sample we found that
about two thirds of respondents are female, one third male and the mean age of respondents is
38 years. The median enterprise age is 5 years in operation and about 90 percent of
enterprises in the study employ 10 people or less. Although this means that our sample mainly
includes micro-enterprises we still treat the sample as representative. This is based on our
perception of a micro-enterprises being more common than enterprises with a greater number
of employees in Gaborone. Note that for our presented data in this section, a broader
definition of financially included subjects is used. This definition includes respondents who
have access to any formal banking services, and is therefore not limited to loans. It follows
from this that financially excluded subjects are defined as respondents who do not have
access to formal banking services. The raw data used for regression analysis is found in
Appendix 2, where some of the data is grouped in the ordinal categories used in the
regression. This format provides a concise overview of the raw data. The complete set of raw
data is available upon request.
Our qualitative data consists of material from ten open-ended interviews held with
individuals working within SMEs or with SME and credit related matters, of which all have
been promised anonymity. Seven interviews were held with SMEs themselves, of which three
subjects were employees and four subjects were owners of different enterprises. Three of the
SMEs were financially excluded in the sense that they did not have access to any financial
banking services, while the remaining four did. Two interviews were held with government-
employed agents, of which one worked at NBFIRA and one at CEDA. Lastly, one interview
was held with a subject employed by a commercial bank. The interview material we found
relevant is presented in the following sub-sections in relation to the questions we wish to
evaluate. Since the interviews were held in an open-ended format the material differs slightly
in focus and structure, which allowed us to capture what the subjects specifically wished to
share.
4 Based on a 2009 CSO briefing.
24
6.1 Empirical findings and analysis of attitudes towards microcredit
We begin our analytical section by analysing descriptive data on attitudes towards
microcredit. The qualitative and quantitative data findings are structured and presented in
relation to the four evaluated questions concerning attitudes (see section 5.2). The qualitative
interview material is presented in written text and analyzed as we progress. The quantitative
descriptive data is presented in diagrams and tables and is used to highlight patterns within
the sample.
6.1.1 Do SMEs know what microloans are?
Our empirical findings on the awareness about microloans reveal that SMEs generally do not
know what microloans are. We base this on purely qualitative data that consists of interview
findings. One interview subject working at a newly established commercial bank offered
insight about the lack of a microfinancial market in Gaborone. In his view there is both a
general unawareness about the existence of microloans as well as a lack of knowledge as to
what they actually are. Furthermore, with the exception of some previous attempts to provide
microfinancial services, the commercial banks are not interested in offering these as they
consider them unprofitable and unfeasible in Gaborone. The seven interviews held with SMEs
also shed some light on the issue. Putting aside the fact that four SMEs did not know what
microloans are, we also found that the term itself is confusing to many subjects, as it is not a
well-known concept. When explaining the concept of microloans, two of these subjects would
know these loans in terms of cash loans, short-term loans, fast cash etc. This aligns with our
experiences in the field when distributing the survey to SMEs. However, not all of these terms
are what we consider microloans, as we have limited our definition to microcredit offered by
licenced MFIs. We tried to continuously communicate this fact to our interview subjects in
order to clarify what we were asking about. We further found that it is not generally known
that there exists a regulatory framework for MFIs, as laid out by NBFIRA in 2012. Close to
no SMEs therefore make the distinction between formal and informal MFIs.
The lack of awareness amongst the respondents makes it difficult to consider
microloans a viable source of credit, and we find that awareness and knowledge of MFIs
therefore becomes a crucial aspect of attitudes towards microloans. Interviews with SMEs
further confirmed that most SMEs in Gaborone make no distinction between informal and
formal or licensed microcreditors, which might influence attitudes towards microloans. To
exemplify this, one interviewed SME equated microloans with informal cash loans, which
influenced the respondent’s negative attitude towards microloans. Seen in this light, it
becomes rational for SMEs to disregard even licensed microlenders as sub-optimal sources of
credit. If they perceive microloans as sub-optimal and associate it with for example predatory
lending, it is not only rational to foremost favour formal bank loans but also to prefer informal
25
lenders like friends and family rather than MFIs. The three interview subjects that were
financially excluded showed even less knowledge of microloans, which can be explained by
the presence of an information asymmetry. Furthermore, material from our interview subject
at CEDA, which is one of the main organisations in Botswana providing microloans, supports
this lack of awareness. He claimed that many financially excluded SMEs are generally
unaware of the existence of the organisation and their mission. Therefore, our findings
indicate that SMEs in general do not know what microcredits are. However, we found that
some SMEs are unfamiliar with the term microloans but familiar with the concept itself. As
we will see, our answers to the remaining three questions in the following sections can to a
large extent be explained by the fact that few SMEs knew and understood what microloans
constitute.
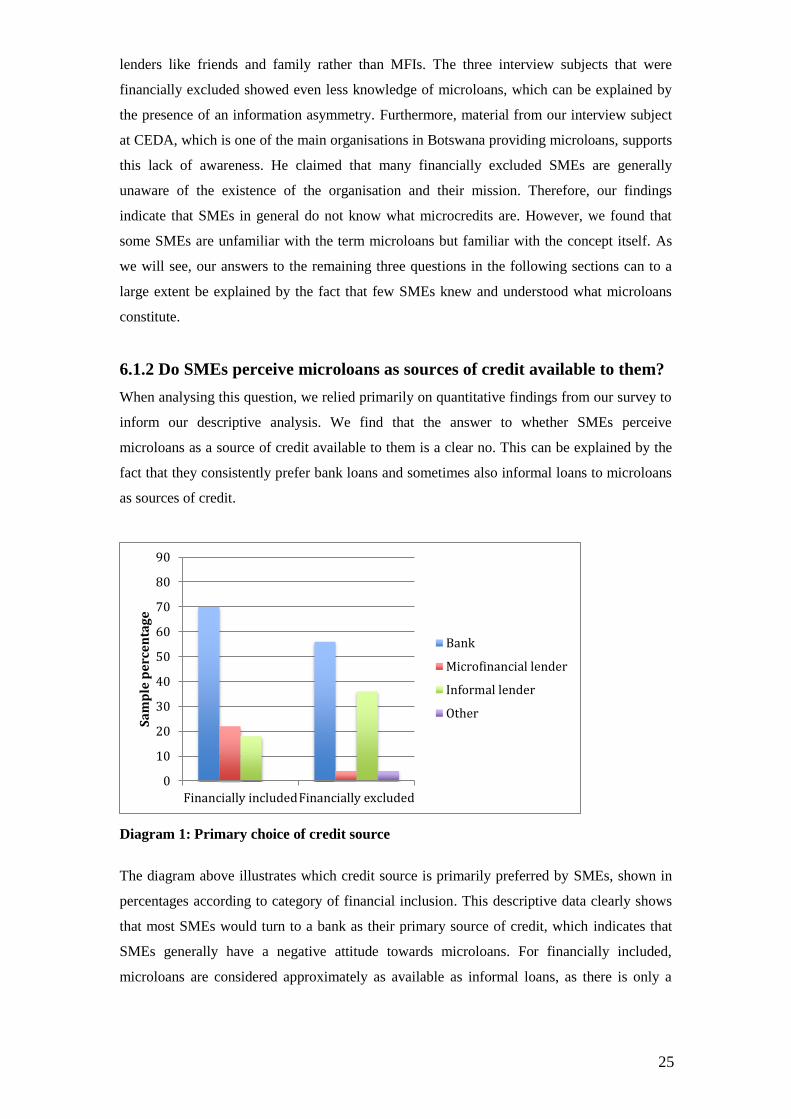
6.1.2 Do SMEs perceive microloans as sources of credit available to them?
When analysing this question, we relied primarily on quantitative findings from our survey to
inform our descriptive analysis. We find that the answer to whether SMEs perceive
microloans as a source of credit available to them is a clear no. This can be explained by the
fact that they consistently prefer bank loans and sometimes also informal loans to microloans
as sources of credit.
Diagram 1: Primary choice of credit source
The diagram above illustrates which credit source is primarily preferred by SMEs, shown in
percentages according to category of financial inclusion. This descriptive data clearly shows
that most SMEs would turn to a bank as their primary source of credit, which indicates that
SMEs generally have a negative attitude towards microloans. For financially included,
microloans are considered approximately as available as informal loans, as there is only a
0
10
20
30
40
50
60
70
80
90
Financially includedFinancially excluded
Sa
mp
le p
erc
en
tag
e
Bank
Microfinancial lender
Informal lender
Other
26
small difference in percentage points between these two credit sources as evidenced by
Diagram 1. However, when only considering financially excluded SMEs in Diagram 1, we
find that only 4 percent of these enterprises would choose a microlender when in need of
credit. In fact, a larger proportion of financially excluded SMEs would primarily turn to
family and friends for a loan rather than to an MFI. This can be attributed to the presence of
information asymmetry and a lack of knowledge of microloans as mentioned in the previous
section. Following from bounded rationality, SMEs will seek to counter their lack of
information on microcredits and formal lenders by turning to friends and family instead.
Thus, social ties and relationships make informal lenders a safer choice for financially
excluded, and make this credit source more available than microloans.
Table 1: Hinders to financial inclusion amongst financially excluded
Lack of
collateral
Insufficient
enterprise
documentation
Inconvenient
bank location
Previous
default
Other Total
Number 14 5 1 3 2 25
Percentage 56 20 4 12 8 100
This table captures hinders to financial inclusion, and provides an additional explanation for
why SMEs do not have bank loans and why these enterprises potentially choose other primary
credit sources instead. Surprisingly, the group financially excluded SMEs, where most choose
a bank as source of credit, finds lack of collateral to be the biggest hinder to financial
inclusion. Applying the theory of bounded rationality, we would expect this group to consider
microloans a more available option as MFIs usually have much lower collateral requirements
than bank loans. However, these contradictive findings can be explained by the lack of
awareness and information discussed in section 6.1.1, which influences attitudes towards
microloans.
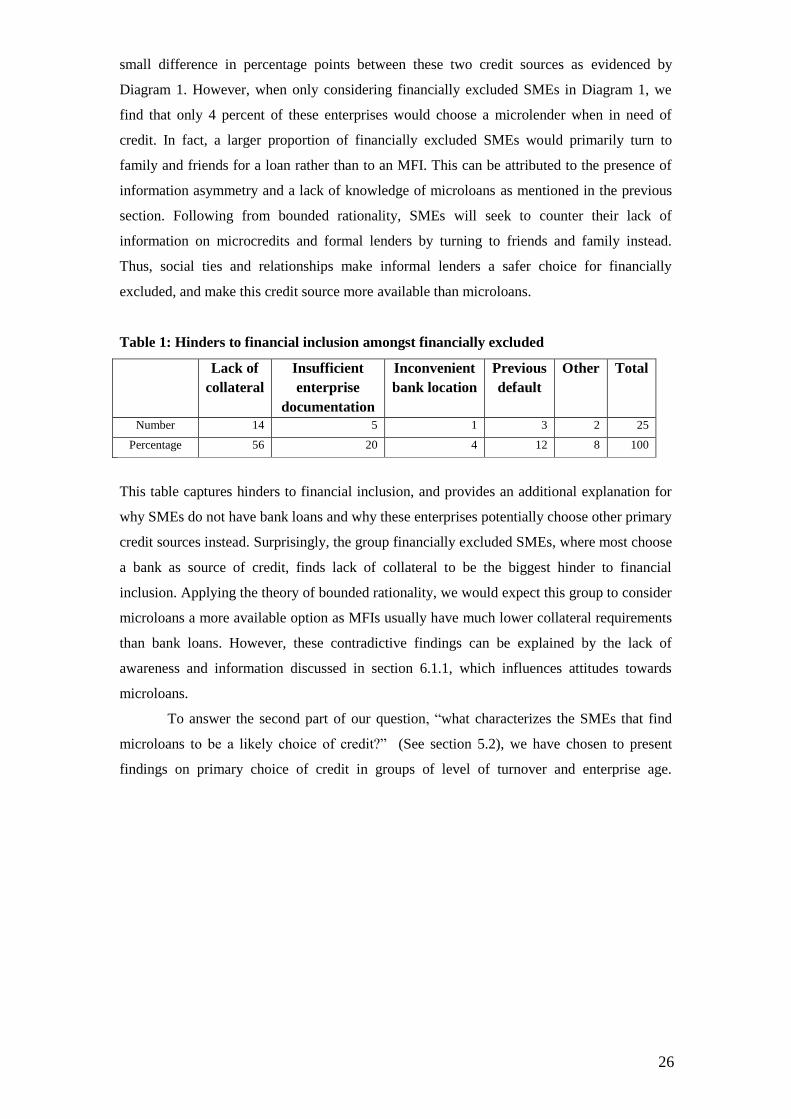
To answer the second part of our question, “what characterizes the SMEs that find
microloans to be a likely choice of credit?” (See section 5.2), we have chosen to present
findings on primary choice of credit in groups of level of turnover and enterprise age.
27
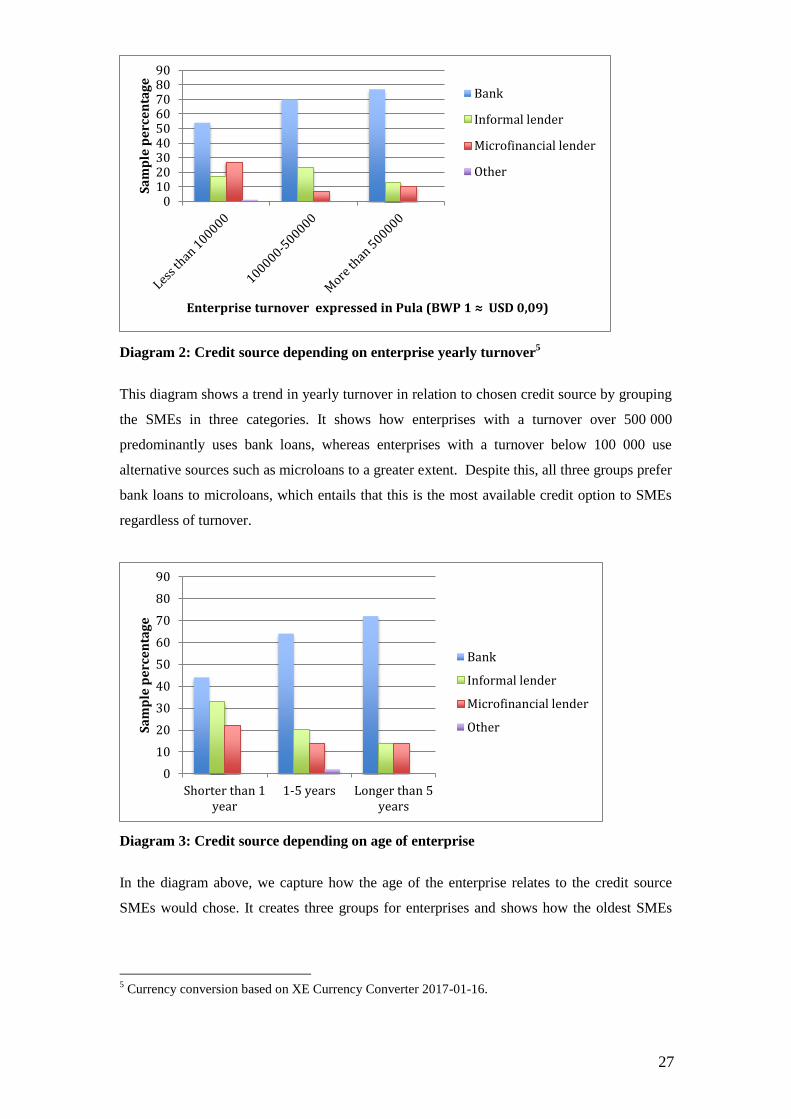
Diagram 2: Credit source depending on enterprise yearly turnover5
This diagram shows a trend in yearly turnover in relation to chosen credit source by grouping
the SMEs in three categories. It shows how enterprises with a turnover over 500 000
predominantly uses bank loans, whereas enterprises with a turnover below 100 000 use
alternative sources such as microloans to a greater extent. Despite this, all three groups prefer
bank loans to microloans, which entails that this is the most available credit option to SMEs
regardless of turnover.
Diagram 3: Credit source depending on age of enterprise
In the diagram above, we capture how the age of the enterprise relates to the credit source
SMEs would chose. It creates three groups for enterprises and shows how the oldest SMEs
5 Currency conversion based on XE Currency Converter 2017-01-16.
0102030405060708090
Sa
mp
le p
erc
en
tag
e
Enterprise turnover expressed in Pula (BWP 1 ≈ USD 0,09)
Bank
Informal lender
Microfinancial lender
Other
0
10
20
30
40
50
60
70
80
90
Shorter than 1year
1-5 years Longer than 5years
Sa
mp
le p
erc
en
tag
e
Bank
Informal lender
Microfinancial lender
Other
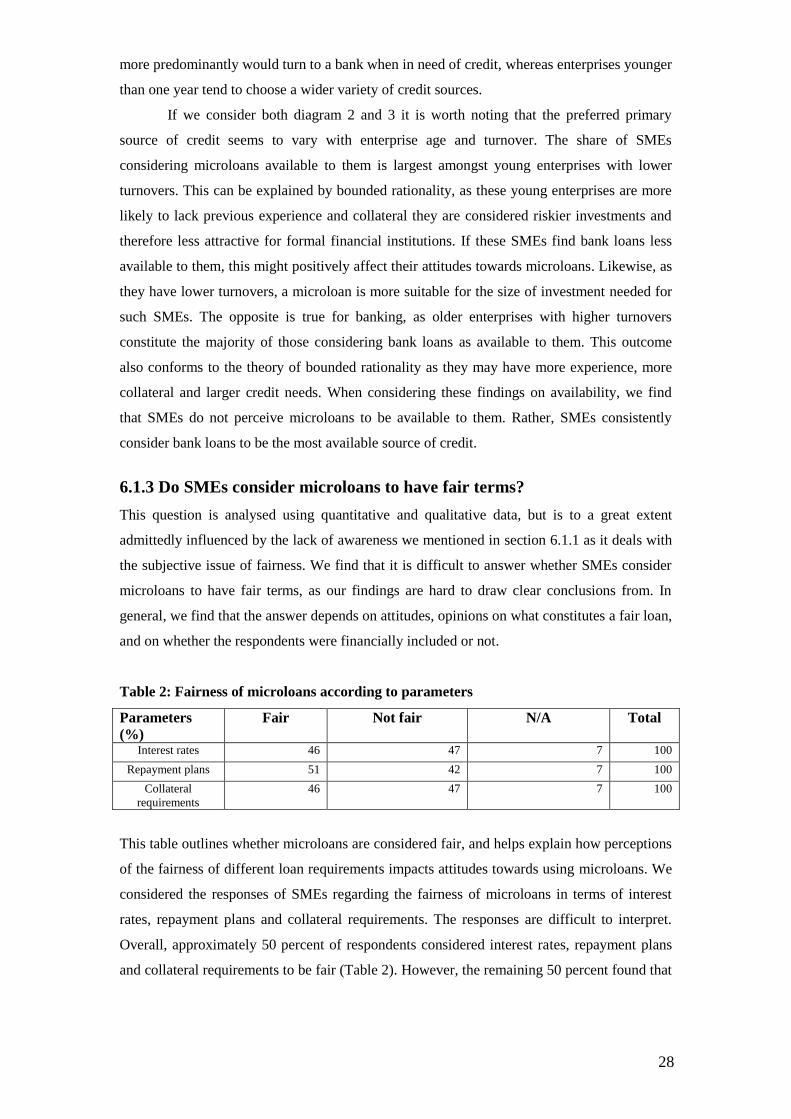
28
more predominantly would turn to a bank when in need of credit, whereas enterprises younger
than one year tend to choose a wider variety of credit sources.
If we consider both diagram 2 and 3 it is worth noting that the preferred primary
source of credit seems to vary with enterprise age and turnover. The share of SMEs
considering microloans available to them is largest amongst young enterprises with lower
turnovers. This can be explained by bounded rationality, as these young enterprises are more
likely to lack previous experience and collateral they are considered riskier investments and
therefore less attractive for formal financial institutions. If these SMEs find bank loans less
available to them, this might positively affect their attitudes towards microloans. Likewise, as
they have lower turnovers, a microloan is more suitable for the size of investment needed for
such SMEs. The opposite is true for banking, as older enterprises with higher turnovers
constitute the majority of those considering bank loans as available to them. This outcome
also conforms to the theory of bounded rationality as they may have more experience, more
collateral and larger credit needs. When considering these findings on availability, we find
that SMEs do not perceive microloans to be available to them. Rather, SMEs consistently
consider bank loans to be the most available source of credit.
6.1.3 Do SMEs consider microloans to have fair terms?
This question is analysed using quantitative and qualitative data, but is to a great extent
admittedly influenced by the lack of awareness we mentioned in section 6.1.1 as it deals with
the subjective issue of fairness. We find that it is difficult to answer whether SMEs consider
microloans to have fair terms, as our findings are hard to draw clear conclusions from. In
general, we find that the answer depends on attitudes, opinions on what constitutes a fair loan,
and on whether the respondents were financially included or not.
Table 2: Fairness of microloans according to parameters
Parameters
(%)
Fair Not fair N/A Total
Interest rates 46 47 7 100
Repayment plans 51 42 7 100
Collateral
requirements
46 47 7 100
This table outlines whether microloans are considered fair, and helps explain how perceptions
of the fairness of different loan requirements impacts attitudes towards using microloans. We
considered the responses of SMEs regarding the fairness of microloans in terms of interest
rates, repayment plans and collateral requirements. The responses are difficult to interpret.
Overall, approximately 50 percent of respondents considered interest rates, repayment plans
and collateral requirements to be fair (Table 2). However, the remaining 50 percent found that
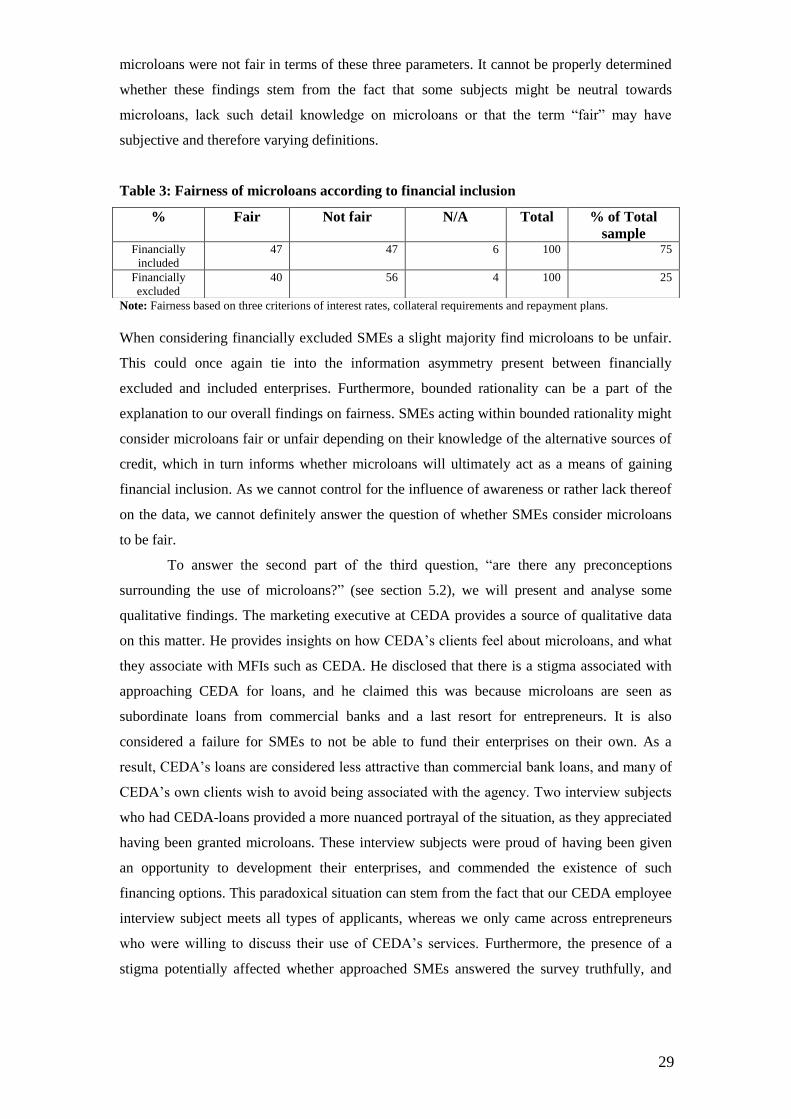
29
microloans were not fair in terms of these three parameters. It cannot be properly determined
whether these findings stem from the fact that some subjects might be neutral towards
microloans, lack such detail knowledge on microloans or that the term “fair” may have
subjective and therefore varying definitions.
Table 3: Fairness of microloans according to financial inclusion
Note: Fairness based on three criterions of interest rates, collateral requirements and repayment plans.
When considering financially excluded SMEs a slight majority find microloans to be unfair.
This could once again tie into the information asymmetry present between financially
excluded and included enterprises. Furthermore, bounded rationality can be a part of the
explanation to our overall findings on fairness. SMEs acting within bounded rationality might
consider microloans fair or unfair depending on their knowledge of the alternative sources of
credit, which in turn informs whether microloans will ultimately act as a means of gaining
financial inclusion. As we cannot control for the influence of awareness or rather lack thereof
on the data, we cannot definitely answer the question of whether SMEs consider microloans
to be fair.
To answer the second part of the third question, “are there any preconceptions
surrounding the use of microloans?” (see section 5.2), we will present and analyse some
qualitative findings. The marketing executive at CEDA provides a source of qualitative data
on this matter. He provides insights on how CEDA’s clients feel about microloans, and what
they associate with MFIs such as CEDA. He disclosed that there is a stigma associated with
approaching CEDA for loans, and he claimed this was because microloans are seen as
subordinate loans from commercial banks and a last resort for entrepreneurs. It is also
considered a failure for SMEs to not be able to fund their enterprises on their own. As a
result, CEDA’s loans are considered less attractive than commercial bank loans, and many of
CEDA’s own clients wish to avoid being associated with the agency. Two interview subjects
who had CEDA-loans provided a more nuanced portrayal of the situation, as they appreciated
having been granted microloans. These interview subjects were proud of having been given
an opportunity to development their enterprises, and commended the existence of such
financing options. This paradoxical situation can stem from the fact that our CEDA employee
interview subject meets all types of applicants, whereas we only came across entrepreneurs
who were willing to discuss their use of CEDA’s services. Furthermore, the presence of a
stigma potentially affected whether approached SMEs answered the survey truthfully, and
% Fair Not fair N/A Total % of Total
sample Financially
included
47 47 6 100 75
Financially
excluded
40 56 4 100 25
30
might potentially have resulted in an unrepresentatively low number of microloan users,
including CEDA clients, in our sample.
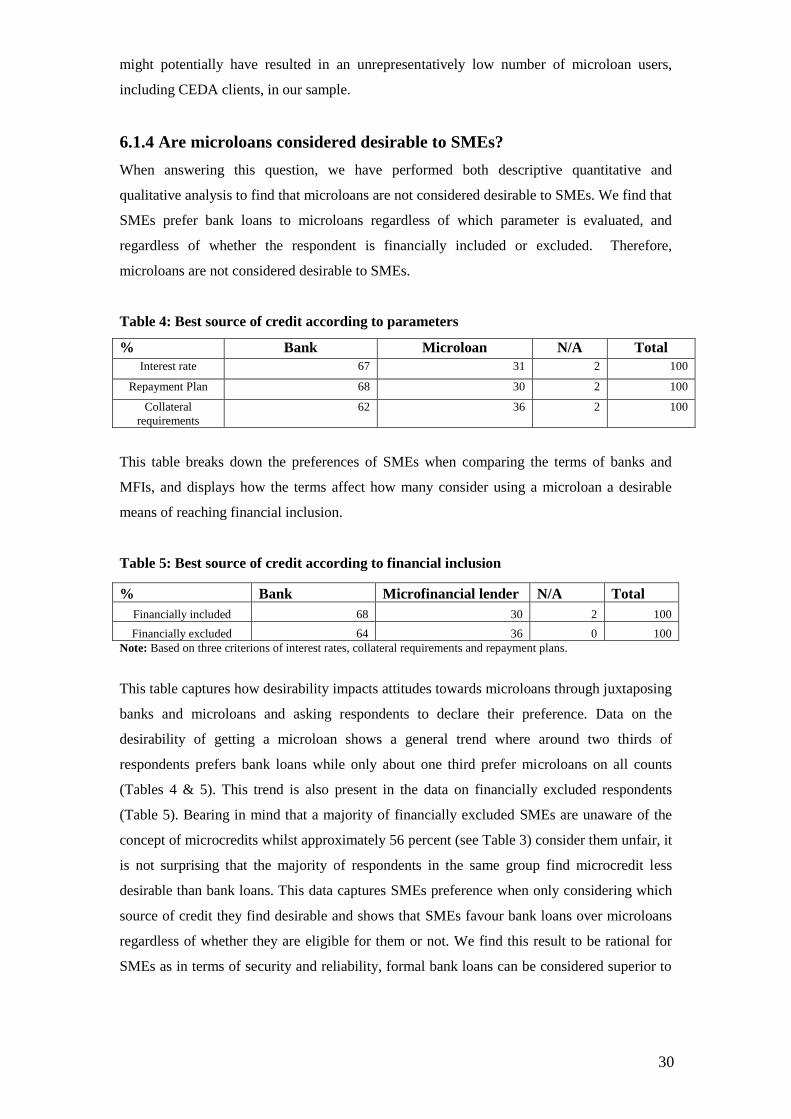
6.1.4 Are microloans considered desirable to SMEs?
When answering this question, we have performed both descriptive quantitative and
qualitative analysis to find that microloans are not considered desirable to SMEs. We find that
SMEs prefer bank loans to microloans regardless of which parameter is evaluated, and
regardless of whether the respondent is financially included or excluded. Therefore,
microloans are not considered desirable to SMEs.
Table 4: Best source of credit according to parameters
% Bank Microloan N/A Total
Interest rate 67 31 2 100
Repayment Plan 68 30 2 100
Collateral
requirements
62 36 2 100
This table breaks down the preferences of SMEs when comparing the terms of banks and
MFIs, and displays how the terms affect how many consider using a microloan a desirable
means of reaching financial inclusion.
Table 5: Best source of credit according to financial inclusion
Note: Based on three criterions of interest rates, collateral requirements and repayment plans.
This table captures how desirability impacts attitudes towards microloans through juxtaposing
banks and microloans and asking respondents to declare their preference. Data on the
desirability of getting a microloan shows a general trend where around two thirds of
respondents prefers bank loans while only about one third prefer microloans on all counts
(Tables 4 & 5). This trend is also present in the data on financially excluded respondents
(Table 5). Bearing in mind that a majority of financially excluded SMEs are unaware of the
concept of microcredits whilst approximately 56 percent (see Table 3) consider them unfair, it
is not surprising that the majority of respondents in the same group find microcredit less
desirable than bank loans. This data captures SMEs preference when only considering which
source of credit they find desirable and shows that SMEs favour bank loans over microloans
regardless of whether they are eligible for them or not. We find this result to be rational for
SMEs as in terms of security and reliability, formal bank loans can be considered superior to
% Bank Microfinancial lender N/A Total
Financially included 68 30 2 100
Financially excluded 64 36 0 100
31
microloans. As a minority of SMEs found microloans to be desirable, thus making them an
undesirable credit source, the results once again indicate that attitudes towards microloans are
negative on the whole.
To conclude our overall descriptive findings and discuss the implications of these we
find that SMEs have a generally negative attitude towards microloans. When evaluating the
four questions, we have to account for the fact that many of the respondents are unaware of
what microloans are, or have perceptions rooted in misinformation of this credit source. As
previously mentioned, this entails that several findings on for example the fairness of
microloans are hard to draw any conclusions from, since the respondents are oftentimes
unaware of what a microloan actually is. To some extent awareness thus becomes a
prerequisite for SMEs to be able give account for their attitudes in terms of availability,
fairness and desirability. For this reason, we cannot unequivocally state that SMEs hold
negative attitudes toward MFIs, as many of the respondents are oblivious to the existence of
microloans.
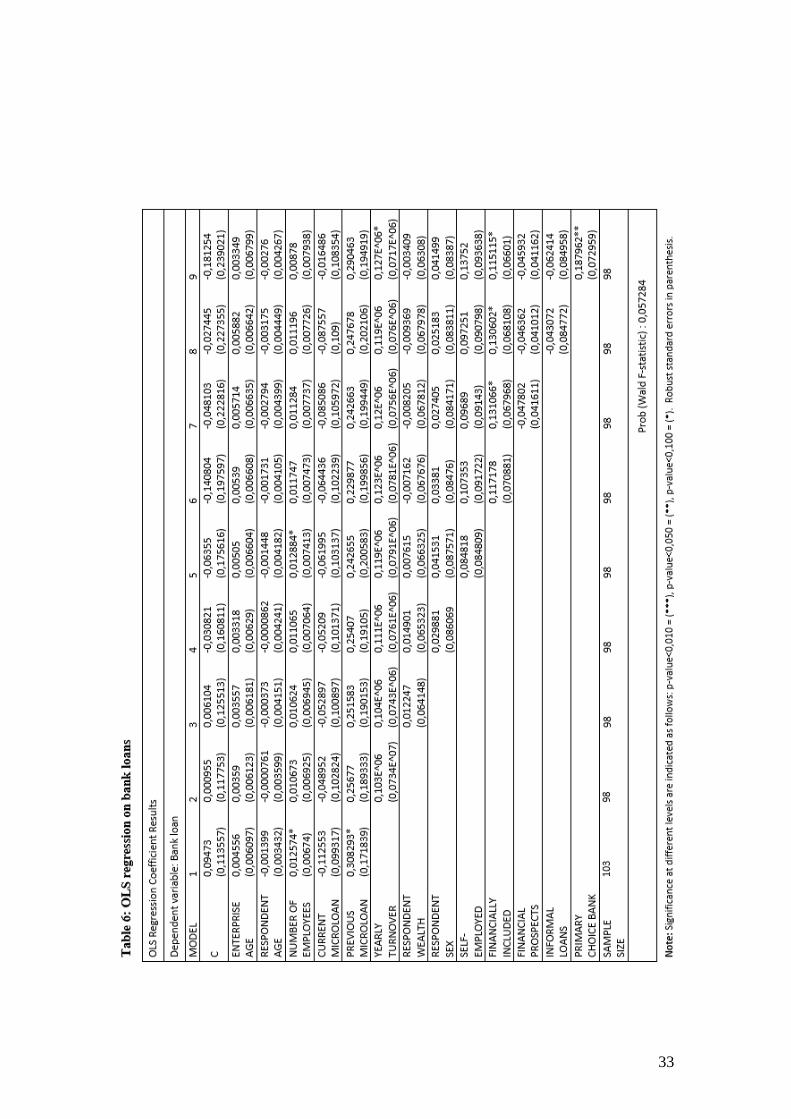
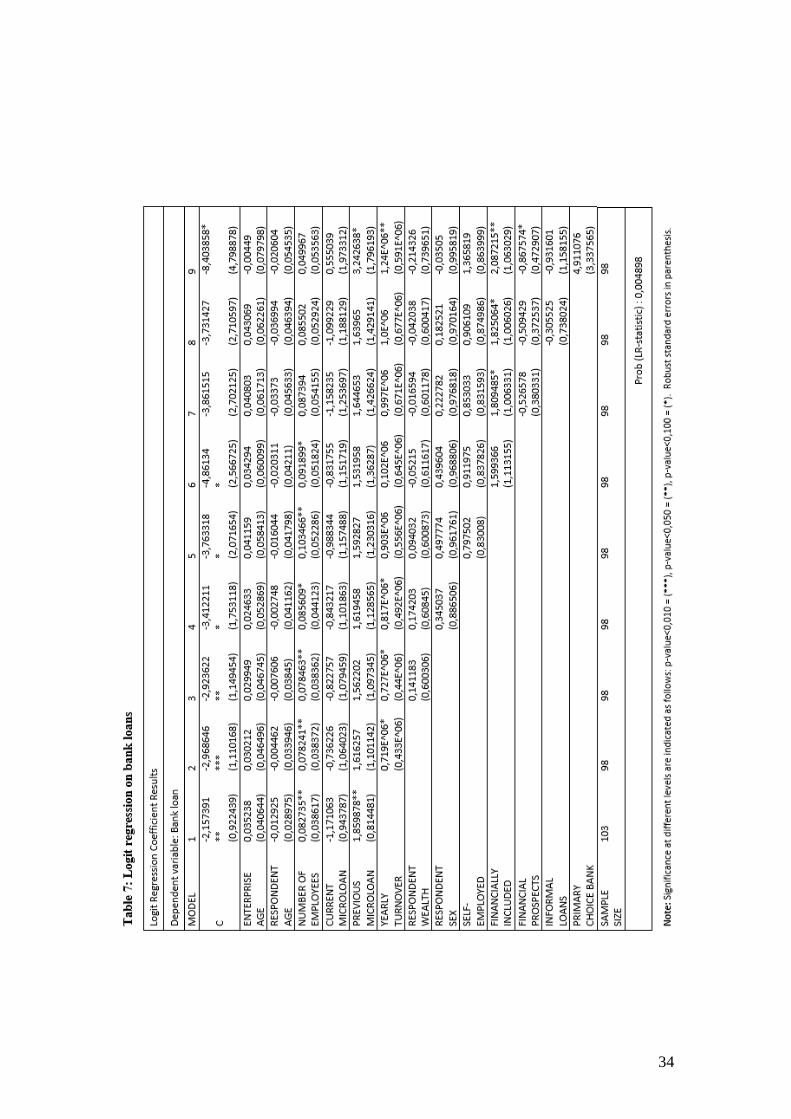
6.2 Empirical results and implications for microcredit as a stepping-stone
The findings from the regression analysis of our primary collected data concerning our first
research question are presented in tables below. Note that due to deficient data in 5 surveys
only 98 subjects are included in most models used for the regressions estimating data. A
Breusch-Pagan-Godfrey test performed on the OLS regression models was used to test for
heteroscedasticity6. We found heteroscedasticity in eight out of nine specified models and
have therefore used White-adjusted robust standard errors in the logit and probit regressions
in an attempt to compensate for this.
6.2.1 Regression analysis and marginal effects
In this section we present the regression results from the three models used for estimation,
OLS, logit and probit. Probit is our main model but we have chosen to include OLS and logit
for comparison, a heteroscedasticity test and a robustness check. For our regressions we have
chosen to run nine different models which each add one more variable. The two main
variables of interest is the current and previous use of microloans but ultimately we include
eleven control variables, which we believe help explain the probability of having a bank loan
for SMEs. Before studying the regression results we will give account for our overall
expected outcomes of the included variables.
For our first model we include five independent variables. These are enterprise age,
respondent age, number of employees, current microloan and previous microloan. We expect
6 Breusch-Pagan-Godfrey test results found in Appendix 3
32
to see positive effects on the probability of SMEs having a bank loan for all variables. A high
enterprise age as well as a large number of employees may indicate enterprise viability while
seniority in respondent age could imply personal financial stability, which would make
subjects more eligible for bank loans. The hypothesis that current and previous use of
microloans increase the probability of the SME having a bank loan has been motivated and
explained throughout this thesis and will therefore not be further explained in this section.
For the second and third model we add enterprise yearly turnover and respondent
personal wealth respectively. We anticipate these variables to have positive coefficients as a
high turnover shows financial stability and creditworthiness, while wealth could be beneficial
in order to meet the bank’s collateral demands. Model number four adds the variable
respondent sex, where female was coded 1 and male 0, which we expect to have a small yet
positive effect. This is due to the general perception of women, especially in developing
countries, as more responsible when handling money. Next we include a variable for self-
employment. We believe this variable to have a positive effect on the probability of having a
bank loan, as it seems more likely that the owner is granted a bank loan for his/her SME
rather than someone employed in the enterprise. In the sixth model a variable for financially
included SMEs is added, which is expected to have a positive effect. With the broader
definition of financial inclusion in this section this means that the SME is already using
financial banking services and is therefore likely to have a bank loan as one of these services.
Model number seven further includes “financial prospects”, which is a combined
ordinal variable that depends on whether respondents thought their enterprise would survive
losing its main customer, and whether they feel the enterprise is reaching its full potential. We
believe this variable will have a positive coefficient as it captures financial stability and
business viability, which indicates creditworthiness. Next we add a variable for SMEs using
informal loans. We expect the use of informal loans to have a negative coefficient. This is
motivated by the fact that SMEs using informal loans may not be in need of a second source
of credit. Furthermore, informal loans provide no formal credit history, which the banks can
use to check the SMEs creditworthiness. Lastly, in model nine we add the variable “primary
choice bank” which is coded 1 for the respondent SMEs that has answered they would
primarily turn to a bank if ever in need of a loan, and 0 for respondents who would turn to any
other source of credit. We expect this variable to have a positive effect, as SMEs who would
choose to turn to a bank are also likelier to actually apply for a bank loan. This is due to that
they prefer this source of credit over others and plausibly perceive themselves as eligible for a
bank loan. This last model, number nine, will be our main model used for analysing the
coefficient results as it contains most possible explanatory variables.
33
34
35
36
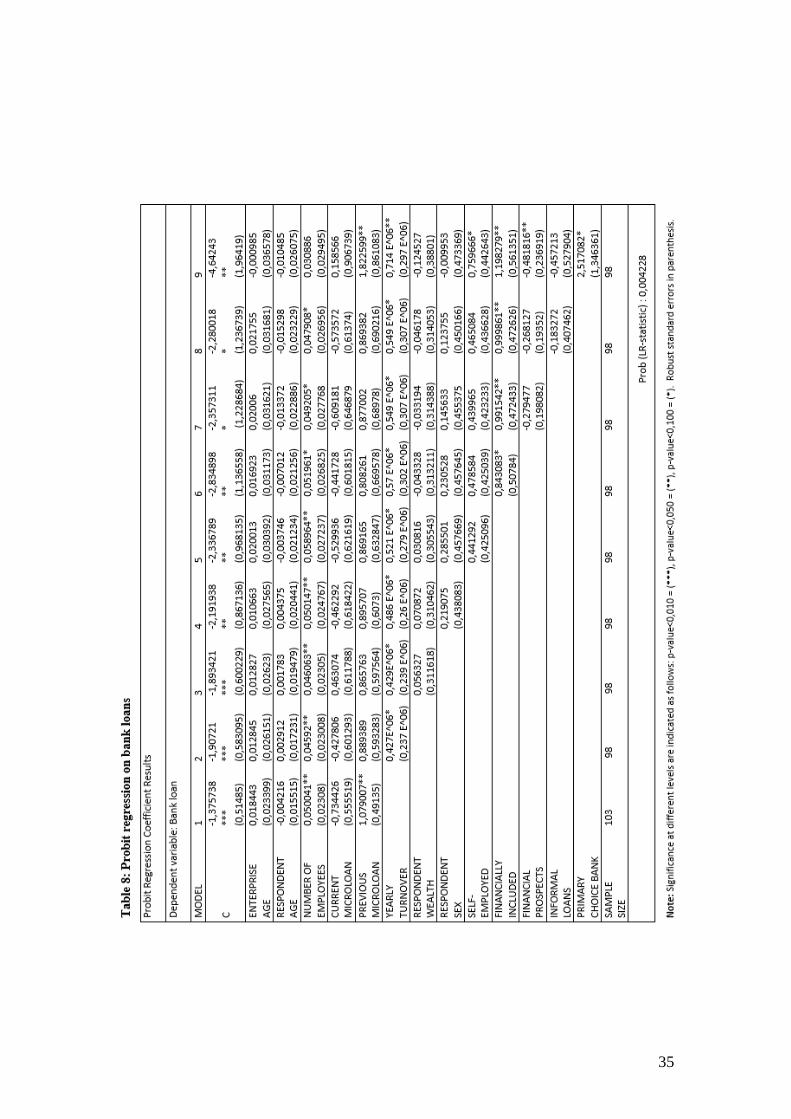
The three regressions are varyingly successful in estimating the data.
We have chosen to include general significance tests for all models to test the null hypothesis
that all coefficients equal zero. Our first regression, OLS, has a probability Wald F-statistic
value of approximately 0,057, which is not a significant result. The model may therefore hold
no explanatory power, which can be expected from OLS. The logit regression has a LR-
statistic probability of 0,005. This is a significant value, which means that logit predicts the
values well on a five percent significance level. Lastly, the probit regression models the
probability of having a bank loan with a LR-statistic probability of 0,004 when including all
coefficients. This is the lowest p-value and entails that the probit regression best estimates our
data. Considering the coefficients for the variables relevant to our null hypothesis (𝛽1 =
0, 𝛽2 = 0 ) none of the regression estimates the coefficient “current microloan” to have
significance and thus we cannot reject part of the null hypothesis, 𝛽2 = 0. However, the
probit regression best estimates “previous microloans” since it gives us a coefficient with a
significance level of five percent. This in combination with our motivation for probit being
the most suitable estimation to use in our study (see section 5) leads us to base our analysis
for the research question “Does the previous or current use of microcredits amongst small-
and medium-sized enterprises increase the probability of having a bank loan?” on these
regression results. However, we have not found any consistent or robust results on this. In
seven out of nine models we have no significant values for the coefficient of the variable
previous microloans. We find the same degree of lack of robustness in the logit estimation
and even more so in the OLS estimation. Due to the lack in consistency we cannot reject the
other part of our null hypothesis, 𝛽1 = 0. Thus we conclude that neither the current nor the
previous use of microloans has a significant robust effect on the probability of getting a bank
loan.
Despite the lack of results we will in accordance with our outlined method briefly
present the marginal effect for previous microloans. Though this variable lacks robustness, it
showed some significance. Using the regression result for the coefficient “previous
microloans” that takes a value of 1,82 and the estimated probit function when letting all
variables take the sample mean value, we calculate the marginal effect to be 0,72. That is, if
we allow all other variables take the sample mean values, the probability of having a bank
loan increases by about 72 percent if the subject has used microloans in the past. Within our
small sample of 98 enterprises, only 15 percent of respondents have a bank loan and 10
percent have had a microloan in the past. Therefore, we expect our results on this variable to
be slightly misleading. In combination with the lack of robustness we will not rely on the
marginal effect to be accurate, and we cannot claim to have shown a significant marginal
effect of previous use of microloans. Due to these findings, or rather lack thereof, we cannot
prove our hypothesis in relation to our theoretical framework on how microloans can serve as
37
a means of gaining financial inclusion. The fact that current microloans were found to have an
insignificant effect on the probability of having a bank loan may be due to the fact that the
subjects that have microloans are not in need of any other type of credit such as bank loans.
The fact that previous microloans shows no certain effect on the probability of having a bank
loan could be due to SMEs that have used microloans and used them well have managed to
improve their financial situation and therefore have not been in need of any more credit since.
However, it could just as well indicate the opposite, that is that the microloan did not help the
SMEs and they either have not improved their financial stability enough to be eligible for a
bank loan or they defaulted their microloan and therefore have no proof of creditworthiness.
However, we find no support of this latter explanation in our data7, as we found that amongst
the SMEs that used microloans in our sample close to none of them defaulted on their loans.
This entails that banks still may be able to rely on the risk assessments conducted by
microfinancial institutions. If these institutions can be relied upon as a litmus test of SMEs,
banks can use microlenders as a means of screening potential SME borrowers. In this way it
is still theoretically possible that microloans provide path from financial exclusion to financial
inclusion. Despite these arguments, the lack of results are most likely explained by the
unawareness of microloans and slightly negative attitude towards these amongst SMEs as
described in section 6.1, which is the most plausible reason for the small number of
respondents using microloans.
We will now briefly account for our remaining variables that have been included in
the regressions, but do not present their marginal effects. Enterprise age and age of the
respondent show no significance effect on the probability of having a bank loan. The lack of
effect of respondent age may be due to that some respondents are not the persons in the SMEs
who would have applied for such a loan. The next variable is the number of employees. In the
probit estimation its coefficient has significance in eight out of nine models. It shows
significance in most models from the logit regression as well although at higher values.
Altogether the regression results on this variable imply that it may have some positive effect
on the probability of getting a bank loan. This is in accordance with our expectations and may
be explained by the argument that mostly financially stable enterprise can afford to keep
many employees. Moving on to turnover, our findings show that it is one of the few variables
with a significant and robust result from the probit regression. However, it should be noted
that the magnitude of the coefficient is miniscule at 1,24e^06 in the full model (number 9).
Even if we expected a more significant result it aligns with the theory that financially
successful SMEs are more likely to be eligible for a bank loan and therefore have a greater
probability of having one. The next variable is wealth, which shows no significance in any of
the regressions. We expected this to have a positive effect but the lack of result may be due to
7 Primary data found in Appendix 2
38
a poorly designed variable (this will be explained more thoroughly in section 6.3). The
variable for respondent sex shows no significant effect in any regression or model
specification. Once again we expected this coefficient to have a positive effect, that is that it
would be more probable that females to hold bank loans than male respondents. The
coefficient for self-employed respondents shows no robust results and only significance in
one model in the probit estimation. The variable is once again poorly designed and only really
shows that it is the owner who has answered the survey. It may however be the manager or
someone else who would have applied for a loan and therefore this variable is misleading.
Financially included SMEs show positive robust significance in probit and throughout the
other estimation models as well. This aligns with our expectations as they due to experience
have established contacts within the formal banking sector. It is also plausible that those who
have savings accounts hold a financial buffer, which makes them less risky borrowers and
indicates that they can afford to pay interest. The variable “financial prospects” shows a
negative effect with significance in one of the models, however it does not have robustness.
The result on this variable contradicts part of our theoretical framework that says financially
stable SMEs are likelier to be formal financially included. However, this variable is a poor
instrument to accurately measure financial stability and business prospects of SMEs (see 6.3),
which might explain the confusing results. However, good prospects might provide a
disincentive to take a bank loan as it could entail that the successful SME is in less need of
credit. Informal loans show no effect on the probability of having a bank loan. We expected
this variable to have a negative coefficient. However, the lack of results may be due to a small
share of SMEs in the sample actually having informal loans. Bank loan as the primary choice
of credit has a positive significant effect in probit and OLS, however lacks robustness as these
are very differing numbers and it has no significance in the logit estimation. It is hard to
interpret the results on this variable as it is only included in the last model and we will
therefore not draw any further conclusions from it but not exclude the possibility of a positive
effect on the probability of having a bank loan.
6.3 Potential flaws in our research design
When conducting our case study, we became aware of several flaws in the design of our
research. Though they do not disqualify or invalidate our findings, we believe that it is useful
to consider these issues as a means of improving potential future research on microloans and
financial inclusion. The main issue we encountered when conducting our research was the
lack of awareness surrounding the concept of microloans. Many of the people and SMEs we
approached were either unsure of what characterizes a microloan, or unaware of the existence
of such a source of credit. This presented an obstacle as we were initially forced to discredit
data on the basis that the respondent did not seem to understand what they were answering
39
through the survey. To remedy the situation, we decided to guide the respondents through the
process by remaining present when they filled out the survey. This way, we could answer
questions, provide information on our research topic and avoid misunderstandings.
However, the lack of financial literacy still presented a challenge to our research, and
even more so when combined with unclear and varying organisational structures found
amongst SMEs. There was often confusion within the surveyed SMEs regarding who was in
charge of the finances, as professional and personal roles within these enterprises are blurred
more often than not. This meant that respondents sometimes were not sure who should answer
the survey as the owner may hold some knowledge about the enterprise’s credit but not
always up to date financial information on for example turnover. The responsibilities also
differ with varying structures within SMEs. Medium-sized enterprises sometimes have an
accountant whom holds relevant financial information while small-scale businesses will
usually entrust such responsibilities with the owner or manager. At times, this significantly
complicated the collection of data as we were often directed to an absent owner who only
comes in once a month. Other times we would need to pose the survey to several employees
within the same firm to get complete responses, or we would have to make complementary
visits to some SMEs for follow-up questions. From this, it follows that our research at times
suffered from incomplete or contradictory survey responses. However, these issues might not
only be due to a lack of financial literacy or due to confusing structures, but can also be
attributed to the presence of cultural stigmas surrounding financial matters. As we predicted
in the method, some respondents refused to answer questions on income and turnover for
religious or cultural reasons.
There are additional problems with our method of locating and sampling SMEs.
Although we have tried to gather a representative and diversified sample of SMEs in the city
of Gaborone, a majority of respondents were found in, around or nearby malls, bus stations,
squares or plazas. The enterprises located in these areas are predominantly working in the
retail sector (selling shoes, clothes, electronics, etc.), performing simpler service professions
(hair dressers, manicurists, opticians, electronic repairs, etc.) or selling food (kiosks, food
stalls, restaurants, cafés, etc.). Although it may be argued that these are in fact typical sectors
for SMEs to operate within, it may provide slightly skewed results considering they mainly
constitute firms providing in-store customer services. Furthermore, the firms located inside
malls are likely to be quite financially stable, as to be able to afford paying high store rents.
Therefore, these firms may not be the typical clientele for microloans nor bank loans. To
diversify our sample and better represent several types of SMEs in our sample, LEA assisted
us by providing additional respondents. As these enterprises were spread out around
Gaborone, we contacted these enterprises over the phone and posed our survey. These firms
were operating in service, manufacturing and tourist sectors (such as consultants, caretakers,
40
engineers, tour agents, etc.). This means that we could not meet these respondents face to
face, which potentially prevents full understanding of the survey questions.
Lastly, another prominent issue has been the design of the survey. Even though we
put great effort into identifying suitable enterprises and adjusting for plausible problems such
as cultural stigmas, recall biasness and varying level of financial literacy, there were still
unforeseen problems. For example, our survey did not account for that most individuals do
not own houses and livestock in Gaborone, but rather their families in their home villages do.
Had we known this, we could have used other instruments to capture levels of wealth.
Moreover, had we known yearly turnover was not a financial indicator used by most
businesses we would rather have asked about their weekly or monthly revenues. Furthermore,
had we known most people do not make distinctions between licenced/formal and informal
MFIs we could have rephrased our questions to reflect this. The difficulties in designing the
survey is also evident when considering what instruments and parameters were used to
measure and capture information as well as perceptions on SMEs’ credit. The determinant
“financial prospects” which is a combined ordinal variable of the enterprise potential and
stability is an example of an instrument showing ambiguous results. If respondents have
answered they do not feel their SMEs are reaching its full potential it could indicate positive
future prospects for a business that is still growing. On the contrary, it could also indicate
negative financial prospects for a failed business that used to be going well and is currently
not living up to that standard.
41
7. Recommendations and Final Remarks
7.1 Policy recommendations
During our research, we encountered a number of respondents and interview subjects who
approached us with suggestions and complaints surrounding the status quo in the financial
system of Botswana. More concretely, they offered insights on how financial inclusion and
especially microloans could work even better. Although these suggestions have arisen in the
country specific context of Botswana some may very well be applicable to other similar
developing countries. One suggestion is a more forceful regulation and implementation of
rules for microlenders. However, this can only occur if the rules and regulations succeed on
two counts. Firstly, the rules should be stringent and appropriate for the specific conditions in
which microlenders operate. Second, an authority such as NBFIRA must enforce these rules.
However, if the rules and requirements placed on microlenders are too stringent, it reduces
incentives for microlenders to become licensed and hence hinders rather than facilitates
financial inclusion. Through stringent legislation, there is also the risk of microlenders
passing on increased administrative costs to the customers, whilst also running the risk of
raising the demands made on the SMEs seeking microcredits.
Another suggestion is to improve financial literacy in Botswana through a number of
avenues such as including it in school curricula, teaching it through public media and by
requiring microlenders to ensure that the borrowers fully grasp what they are committing
themselves to when taking a loan. Lastly, to counter the problem of information asymmetry
surrounding microloans there could be a need for a publicity push conducted by CEDA with
the backing of the Batswana government. Such a campaign should act to counter the stigma
associated with using microloans, and could also serve as a way of informing SMEs of the
viability of microloans as a credit option.
7.2 Summary and conclusion
In this thesis we have set out to investigate the role of microcredits for financial inclusion
amongst small- and medium-sized enterprises. Although existing research on the broader
topics of microfinance and formal financial inclusion can be found, none specifically studies
whether the previous can promote the latter by acting as a stepping-stone for SMEs in need of
credit. We have strived to provide a descriptive overview of the attitudes towards microloans
in Botswana, as these attitudes affect whether microloans can act as a means of gaining
financial inclusion. We have also tried to answer the research question “Does the previous or
current use of microcredits amongst small- and medium-sized enterprises increase the
probability of having a bank loan” by providing econometric analysis of the issue. Our area of
study is currently relevant as there are large regional differences in economic growth, which
42
makes the finding of sustainable ways to include developing countries a global concern. One
way of achieving this has been the promotion of SMEs, as these can act to increase economic
growth, provide a stable source of income and increase employment. Ensuring financial
access for SMEs and including these financially becomes a crucial component in promoting
growth for the developing world. As the efficiency of microloans in providing such inclusion
is currently under academic debate, findings on if and how microloans actually work are
crucial to the general discourse on developing economics. In theory, there are several reasons
to why using microcredits could increase the likeliness of being granted a bank loan. By
letting MFIs take the risk of lending to SMEs, previous successful use of microcredits can
work as a screening of borrowers for formal banks. If the SMEs use their credits well, they
ought to have a better financial standing following from investment and expansion. The
remaining problem for SMEs in need of funds is the collateral requirements that banks pose
on clients. As MFIs usually have less stringent demands on their clients they ought to be more
accessible sources of credit. Hence using microcredits could be a way for enterprises to gain
initial financial access, and in the longer run formal financial inclusion.
To test our thesis we collected primary data using a multiple-choice survey posed to
SMEs in Gaborone. The data was used both for descriptive and regression analysis. In our
descriptive analysis we found that SMEs have a generally negative attitude towards
microloans, which can in part be explained by a lack of awareness of what microloans are.
These results were in general even more prominent when only considering financially
excluded SMEs. The findings of our descriptive analysis are supported by the results of our
regressions. We found the probit model to best estimate our data, but we could not reject our
null hypothesis. The current use of microcredits shows no significant effect on the probability
of having a bank loan and neither does the previous use of microcredit. Calculating the
marginal effect for the sample mean, we found that having previously used microloans
increased the probability of having a bank loan by 72 percentage units. However, as there was
a lack of robustness between our models and regression estimations, we cannot conclusively
say that microloans act to further financial inclusion. This is most likely due to lack of
respondents using microloan. This in turn may be explained by, our descriptive analysis
findings. These findings lead us to believe that attitudes towards microloans prevent them
from acting as a stepping-stone to financial inclusion in Gaborone.
These findings can be more widely applicable on developing countries in sub-Saharan
Africa, where similar financial conditions and negative attitudes towards microloans can act
to prevent economic growth. Since this thesis is a case study, its findings naturally reflect the
specific context of the Botswana economy. However, our findings on how attitudes and
specifically a lack of awareness prevent microloans acting as a means of financial inclusion
hold a broader relevance. To conclude our findings, microcredits do not currently act as a

43
stepping-stone for SMEs to financial inclusion, but has the potential to do so if SMEs become
more aware of their existence and more positively inclined towards using them as a source of
credit. Accordingly, we would like to encourage government initiatives directed at informing
the public, and specifically SMEs, about microcredits and credit options. We would hope to
see continued research on the topic of microcredits and financial inclusion, especially
considering the continued lack of conclusive findings within this field.
44
Reference List Aggarwal S, Klapper L., & Singer D. 2016. Financing Businesses in Africa: The Role of
Microfinance. Microfinance in Developing Countries: Issues, Policies and Performance
Evaluation. pp. 178-98. ISBN: 978-0-230-34846-2. (Accessed 11.12.16)
Anjugam, M. & Senum, R. K. S. 2013. Measuring the Efficiency of sub-Saharan Africa’s
Microfinance Institutions and its Drivers. Annals of Public and Cooperative Economics, 84:4,
pp. 399–422, DOI: 10.1111/apce.12021
Beck T. & Cull R. 2014. SME Finance in Africa. Washington, DC: World Bank Group.
Policy Research Working Paper 7018. pp. 1-35. (Accessed 20.10.16)
Botlhole T. & Okurut, F. N. 2009. Informal financial markets in Botswana: a case study of
Gaborone City. Development Southern Africa, 26:2, pp. 255-270,
DOI: 10.1080/03768350902899561
Burda, M. & Wyplosz C. 2010. Macroeconomics – A European text, 5:1. Oxford: Oxford
University Press. ISBN 9780199236824
Burns T. & Roszkowska E. 2016. Rational Choice Theory: Toward a Psychological, Social,
and Material Contextualization of Human Choice Behavior. Theoretical Economics Letters.
16:6. pp. 195-207. http://file.scirp.org/pdf/TEL_2016041416071822.pdf. (Accessed 05.12.16)
Byström, H. 2014. Finance, 3:1, Lund: Studentlitteratur AB. ISBN 9789144096025.
CGAP. 2012. A Guide to Regulation and Supervision of Microfinance. Consensus Guidelines.
Washington D.C.: World Bank. https://www.cgap.org/sites/default/files/Consensus-
Guideline-A-Guide-to-Regulation-and-Supervision-of-Microfinance-Oct-2012_0.pdf
(Accessed 11.09.16)
CSO-Central Statistics Office. 2009. 2006/7 Census of Enterprises And Establishments.
Gaborone.
http://www.statsbots.org.bw/sites/default/files/publications/2006%20%20Census%20of%20E
nterprises%20And%20Establishments%20Stats%20Brief.pdf (Accessed 15.12.16)
De Wet, T. Stewart, R. & Van Rooyen, C. 2012. The Impact of Microfinance in Sub-Saharan
Africa: A Systematic Review of the Evidence. World Development, 40:11,
pp. 2249–2262, http://dx.doi.org/10.1016/j.worlddev.2012.03.012
Ghosh, Jayati. 2013. Microfinance and the challenge of financial inclusion for development.
Cambridge Journal of Economics, issue 37, pp. 1203–1219. DOI:10.1093/cje/bet042
Lopatta, K. & Tchikov, M. 2016. Do microfinance institutions fulfil their promise? Evidence
from cross-country data. Applied Economics, 48:18, 1655-1677.
DOI:10.1080/00036846.2015.1105924
Mangadi K., Okurut F. N, & Olalekan Y. 2011. Credit rationing and SME Development in
Botswana: Implications for Economic Diversification. Botswana Journal of Economics. 8:12,
pp. 62-85. http://www.ajol.info/index.php/boje/article/view/72978/61869 (Accessed 19.12.16)
Morewagae, B. S.; Seemule, M. & Rempel, H. 1995.Access to Credit for Non-Formal Micro-
Enterprises in Botswana. The Journal of Development Studies, 31:3, pp.481-
504. http://eurekamag.com/pdf.php?pdf=002557502 (Accessed 09.11.16)
45
Napier, M. 2011. Including Africa – beyond microfinance. London: Centre for the Study of
Financial Innovation (CSFI). ISBN: 978-0-9563888-5-8
NBFIRA. 2012. Non-bank Financial Institutions Regulatory Institutions Act 2012, Gaborone:
NBFIRA. pp. 1-36.
http://www.nbfira.org.bw/sites/default/files/NBFIRA%20Act.pdf (Accessed 06.11.16)
NBFIRA. 2016. List of Licensed Microlenders NBFIRA 2016.
http://www.nbfira.org.bw/regulated-entities-1 (Accessed 14.01.17)
OECD. 2016. Financing SMEs and Entrepreneurs 2016: An OECD Scoreboard. Paris:
OECD Publishing. DOI: 10.1787/fin_sme_ent-2016-en
Peachy, S. & Roe, A. 2006. Access to Finance – What Does It Mean and How Do Savings
Banks Foster Access? Perspectives, 49. Brussels: WSBI/ESBG. http://www.savings-
banks.com/SiteCollectionDocuments/Perspectives%2049.pdf (Accessed 09.11.16)
UN. 2016. Goal 8: Promote inclusive and sustainable economic growth, employment and
decent work for all.
http://www.un.org/sustainabledevelopment/economic-growth/ (Accessed 13.11.16)
UN General Assembly. 2000. United Nations Millennium Declaration
A/RES/55/2. http://www.un.org/millennium/declaration/ares552e.pdf (Accessed 09.11.16)
UNCDF. 2016. Botswana Financial Inclusion Roadmap: Deepening access, extending
financial services to the farthest corners of
Botswana. http://map.uncdf.org/sites/default/files/Documents/botswana-
roadmap.pdf (Accessed 09.11.16)
Waldeck, R. 2002. Rationing Rule, Imperfect Information and Equilibrium. Economic
Theory 19:3. pp. 493- 507.
http://content.ebscohost.com.ludwig.lub.lu.se/ContentServer.asp?T=P&P=AN&K=5806731&
S=R&D=bth&EbscoContent=dGJyMMvl7ESep7c4wtvhOLCmr06eprJSsqe4SLGWxWXS&
ContentCustomer=dGJyMPGpt0mwqrBRuePfgeyx44Dt6fIA. (Accessed 20.12.16)
World Bank. 2014. Global Financial Development Report 2014: Financial
Inclusion. Washington, DC: World Bank. DOI:10.1596/978-0-8213-9985-9.
World Bank Group. 2016. Global Monitoring Report 2015/2016: Development Goals in an
Era of Demographic Change. Washington, DC: World Bank. DOI: 10.1596/978-1-4648-
0669-8.
XE. 2017. XE Currency Converter BWP to USD.
http://www.xe.com/currencyconverter/convert/?Amount=1&From=BWP&To=USD
(Accessed 16.01.17)
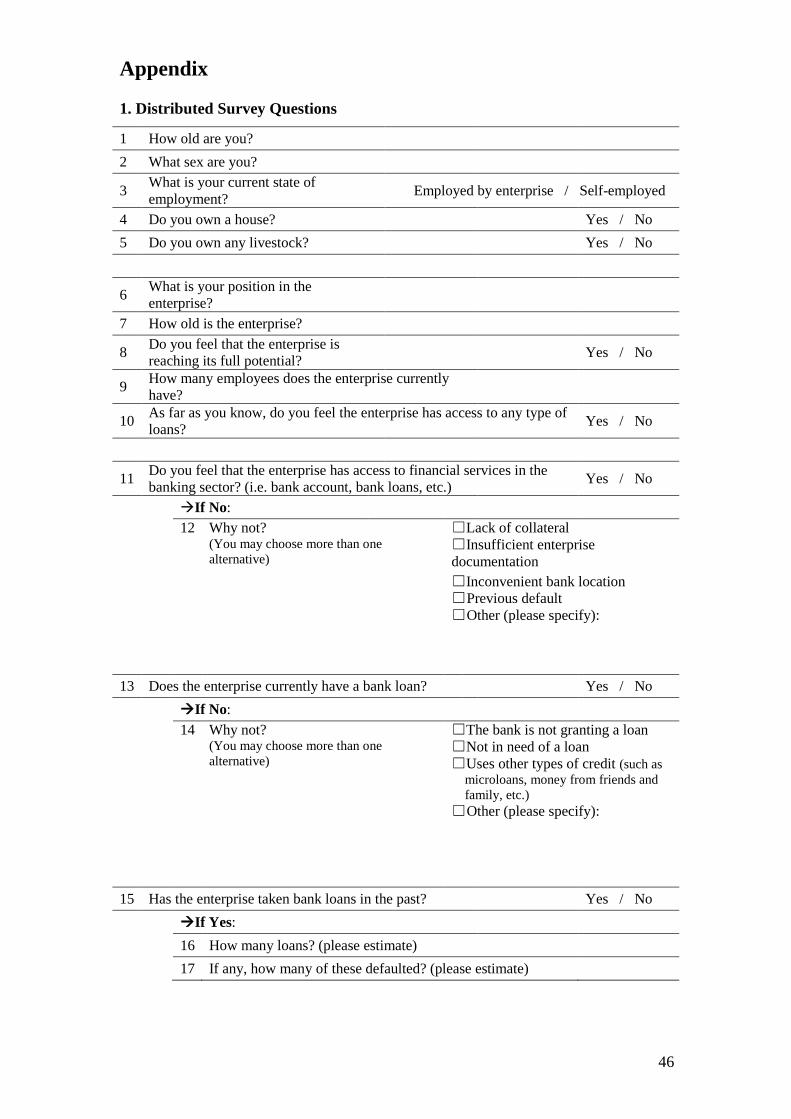
46
Appendix 1. Distributed Survey Questions
1 How old are you?
2 What sex are you?
3 What is your current state of
employment? Employed by enterprise / Self-employed
4 Do you own a house? Yes / No
5 Do you own any livestock? Yes / No
6 What is your position in the
enterprise?
7 How old is the enterprise?
8 Do you feel that the enterprise is
reaching its full potential? Yes / No
9 How many employees does the enterprise currently
have?
10 As far as you know, do you feel the enterprise has access to any type of
loans? Yes / No
11 Do you feel that the enterprise has access to financial services in the
banking sector? (i.e. bank account, bank loans, etc.) Yes / No
If No:
12 Why not? (You may choose more than one
alternative)
☐ Lack of collateral
☐ Insufficient enterprise
documentation
☐ Inconvenient bank location
☐ Previous default
☐ Other (please specify):
13 Does the enterprise currently have a bank loan? Yes / No
If No:
14 Why not? (You may choose more than one
alternative)
☐ The bank is not granting a loan
☐ Not in need of a loan
☐ Uses other types of credit (such as
microloans, money from friends and
family, etc.)
☐ Other (please specify):
15 Has the enterprise taken bank loans in the past? Yes / No
If Yes:
16 How many loans? (please estimate)
17 If any, how many of these defaulted? (please estimate)
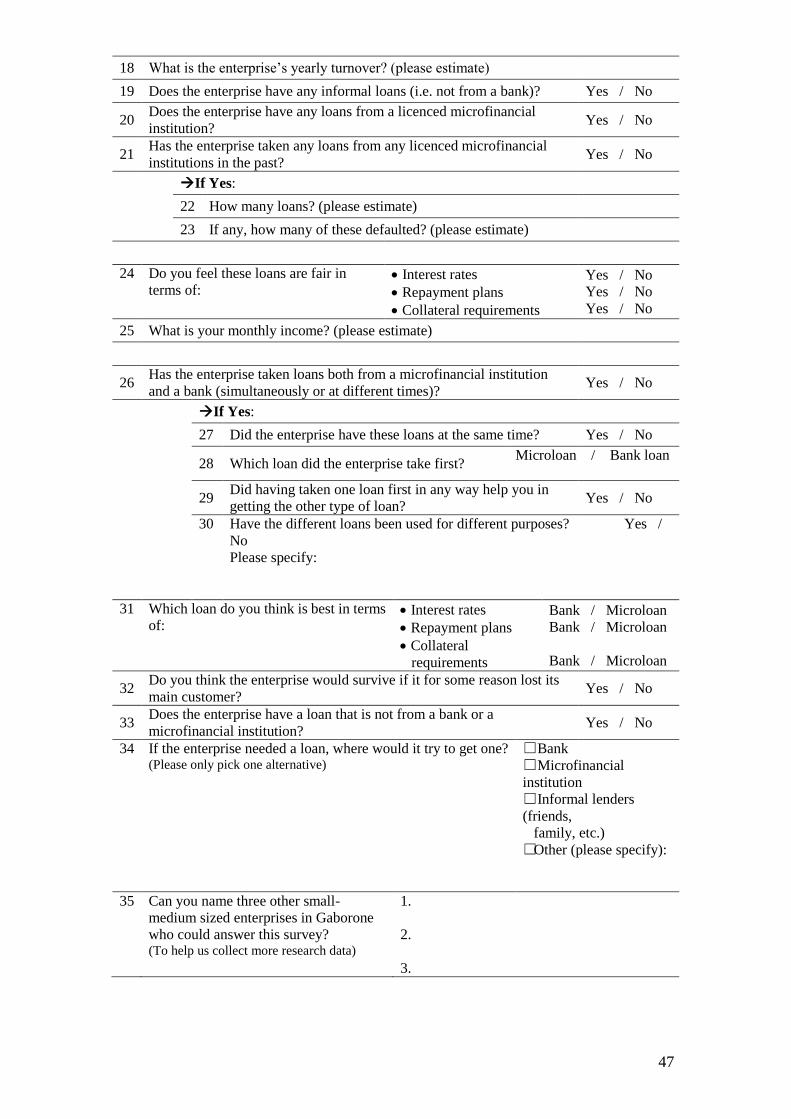
47
18 What is the enterprise’s yearly turnover? (please estimate)
19 Does the enterprise have any informal loans (i.e. not from a bank)? Yes / No
20 Does the enterprise have any loans from a licenced microfinancial
institution? Yes / No
21 Has the enterprise taken any loans from any licenced microfinancial
institutions in the past? Yes / No
If Yes:
22 How many loans? (please estimate)
23 If any, how many of these defaulted? (please estimate)
24 Do you feel these loans are fair in
terms of:
Interest rates
Repayment plans
Collateral requirements
Yes / No
Yes / No
Yes / No
25 What is your monthly income? (please estimate)
26 Has the enterprise taken loans both from a microfinancial institution
and a bank (simultaneously or at different times)? Yes / No
If Yes:
27 Did the enterprise have these loans at the same time? Yes / No
28 Which loan did the enterprise take first? Microloan / Bank loan
29 Did having taken one loan first in any way help you in
getting the other type of loan? Yes / No
30 Have the different loans been used for different purposes? Yes /
No
Please specify:
31 Which loan do you think is best in terms
of:
Interest rates
Repayment plans
Collateral
requirements
Bank / Microloan
Bank / Microloan
Bank / Microloan
32 Do you think the enterprise would survive if it for some reason lost its
main customer? Yes / No
33 Does the enterprise have a loan that is not from a bank or a
microfinancial institution? Yes / No
34 If the enterprise needed a loan, where would it try to get one? (Please only pick one alternative)
☐ Bank
☐ Microfinancial
institution
☐ Informal lenders
(friends,
family, etc.)
☐Other (please specify):
35 Can you name three other small-
medium sized enterprises in Gaborone
who could answer this survey? (To help us collect more research data)
1.
2.
3.
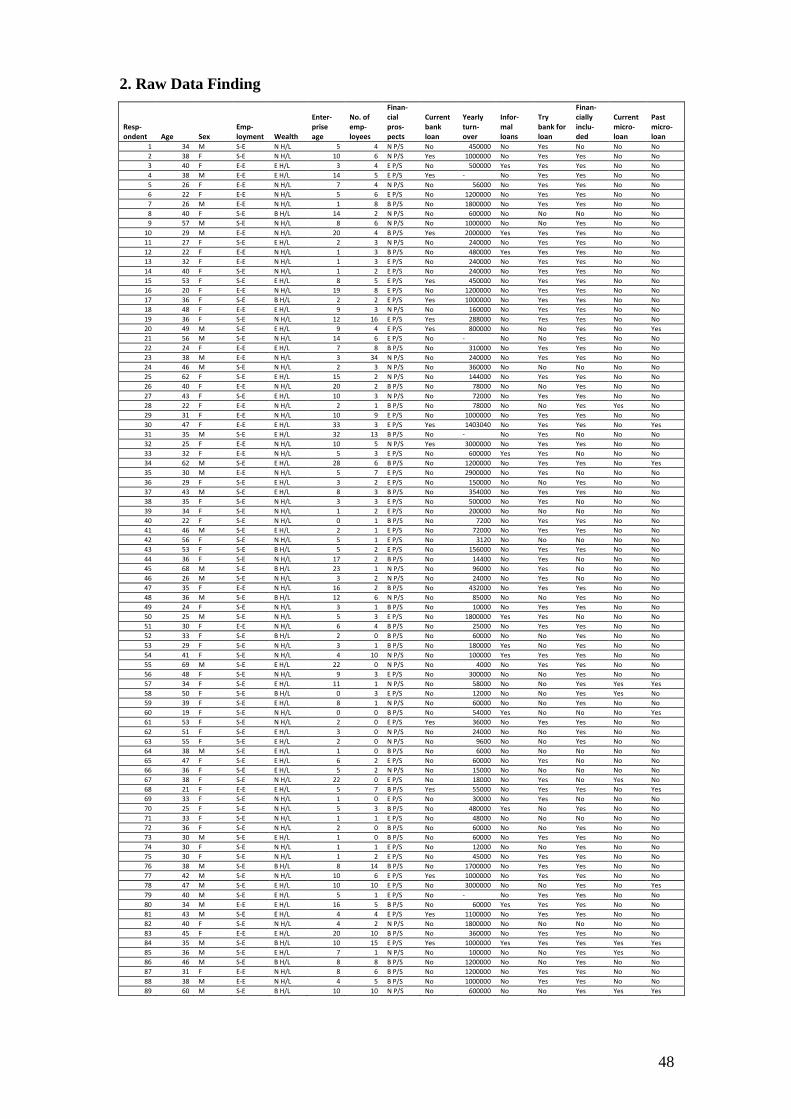
48
2. Raw Data Finding
Resp-ondent Age Sex
Emp-loyment Wealth
Enter-prise age
No. of emp-loyees
Finan-cial pros-pects
Current bank loan
Yearly turn-over
Infor-mal loans
Try bank for loan
Finan-cially inclu-ded
Currentmicro- loan
Past micro- loan
1 34 M S-E N H/L 5 4 N P/S No 450000 No Yes No No No
2 38 F S-E N H/L 10 6 N P/S Yes 1000000 No Yes Yes No No
3 40 F E-E E H/L 3 4 E P/S No 500000 Yes Yes Yes No No
4 38 M E-E E H/L 14 5 E P/S Yes - No Yes Yes No No
5 26 F E-E N H/L 7 4 N P/S No 56000 No Yes Yes No No
6 22 F E-E N H/L 5 6 E P/S No 1200000 No Yes Yes No No
7 26 M E-E N H/L 1 8 B P/S No 1800000 No Yes Yes No No
8 40 F S-E B H/L 14 2 N P/S No 600000 No No No No No
9 57 M S-E N H/L 8 6 N P/S No 1000000 No No Yes No No
10 29 M E-E N H/L 20 4 B P/S Yes 2000000 Yes Yes Yes No No
11 27 F S-E E H/L 2 3 N P/S No 240000 No Yes Yes No No
12 22 F E-E N H/L 1 3 B P/S No 480000 Yes Yes Yes No No
13 32 F E-E N H/L 1 3 E P/S No 240000 No Yes Yes No No
14 40 F S-E N H/L 1 2 E P/S No 240000 No Yes Yes No No
15 53 F S-E E H/L 8 5 E P/S Yes 450000 No Yes Yes No No
16 20 F E-E N H/L 19 8 E P/S No 1200000 No Yes Yes No No
17 36 F S-E B H/L 2 2 E P/S Yes 1000000 No Yes Yes No No
18 48 F E-E E H/L 9 3 N P/S No 160000 No Yes Yes No No
19 36 F S-E N H/L 12 16 E P/S Yes 288000 No Yes Yes No No
20 49 M S-E E H/L 9 4 E P/S Yes 800000 No No Yes No Yes
21 56 M S-E N H/L 14 6 E P/S No - No No Yes No No
22 24 F E-E E H/L 7 8 B P/S No 310000 No Yes Yes No No
23 38 M E-E N H/L 3 34 N P/S No 240000 No Yes Yes No No
24 46 M S-E N H/L 2 3 N P/S No 360000 No No No No No
25 62 F S-E E H/L 15 2 N P/S No 144000 No Yes Yes No No
26 40 F E-E N H/L 20 2 B P/S No 78000 No No Yes No No
27 43 F S-E E H/L 10 3 N P/S No 72000 No Yes Yes No No
28 22 F E-E N H/L 2 1 B P/S No 78000 No No Yes Yes No
29 31 F E-E N H/L 10 9 E P/S No 1000000 No Yes Yes No No
30 47 F E-E E H/L 33 3 E P/S Yes 1403040 No Yes Yes No Yes
31 35 M S-E E H/L 32 13 B P/S No - No Yes No No No
32 25 F E-E N H/L 10 5 N P/S Yes 3000000 No Yes Yes No No
33 32 F E-E N H/L 5 3 E P/S No 600000 Yes Yes No No No
34 62 M S-E E H/L 28 6 B P/S No 1200000 No Yes Yes No Yes
35 30 M E-E N H/L 5 7 E P/S No 2900000 No Yes No No No
36 29 F S-E E H/L 3 2 E P/S No 150000 No No Yes No No
37 43 M S-E E H/L 8 3 B P/S No 354000 No Yes Yes No No
38 35 F S-E N H/L 3 3 E P/S No 500000 No Yes No No No
39 34 F S-E N H/L 1 2 E P/S No 200000 No No No No No
40 22 F S-E N H/L 0 1 B P/S No 7200 No Yes Yes No No
41 46 M S-E E H/L 2 1 E P/S No 72000 No Yes Yes No No
42 56 F S-E N H/L 5 1 E P/S No 3120 No No No No No
43 53 F S-E B H/L 5 2 E P/S No 156000 No Yes Yes No No
44 36 F S-E N H/L 17 2 B P/S No 14400 No Yes No No No
45 68 M S-E B H/L 23 1 N P/S No 96000 No Yes No No No
46 26 M S-E N H/L 3 2 N P/S No 24000 No Yes No No No
47 35 F E-E N H/L 16 2 B P/S No 432000 No Yes Yes No No
48 36 M S-E B H/L 12 6 N P/S No 85000 No No Yes No No
49 24 F S-E N H/L 3 1 B P/S No 10000 No Yes Yes No No
50 25 M S-E N H/L 5 3 E P/S No 1800000 Yes Yes No No No
51 30 F E-E N H/L 6 4 B P/S No 25000 No Yes Yes No No
52 33 F S-E B H/L 2 0 B P/S No 60000 No No Yes No No
53 29 F S-E N H/L 3 1 B P/S No 180000 Yes No Yes No No
54 41 F S-E N H/L 4 10 N P/S No 100000 Yes Yes Yes No No
55 69 M S-E E H/L 22 0 N P/S No 4000 No Yes Yes No No
56 48 F S-E N H/L 9 3 E P/S No 300000 No No Yes No No
57 34 F S-E E H/L 11 1 N P/S No 58000 No No Yes Yes Yes
58 50 F S-E B H/L 0 3 E P/S No 12000 No No Yes Yes No
59 39 F S-E E H/L 8 1 N P/S No 60000 No No Yes No No
60 19 F S-E N H/L 0 0 B P/S No 54000 Yes No No No Yes
61 53 F S-E N H/L 2 0 E P/S Yes 36000 No Yes Yes No No
62 51 F S-E E H/L 3 0 N P/S No 24000 No No Yes No No
63 55 F S-E E H/L 2 0 N P/S No 9600 No No Yes No No
64 38 M S-E E H/L 1 0 B P/S No 6000 No No No No No
65 47 F S-E E H/L 6 2 E P/S No 60000 No Yes No No No
66 36 F S-E E H/L 5 2 N P/S No 15000 No No No No No
67 38 F S-E N H/L 22 0 E P/S No 18000 No Yes No Yes No
68 21 F E-E E H/L 5 7 B P/S Yes 55000 No Yes Yes No Yes
69 33 F S-E N H/L 1 0 E P/S No 30000 No Yes No No No
70 25 F S-E N H/L 5 3 B P/S No 480000 Yes No Yes No No
71 33 F S-E N H/L 1 1 E P/S No 48000 No No No No No
72 36 F S-E N H/L 2 0 B P/S No 60000 No No Yes No No
73 30 M S-E E H/L 1 0 B P/S No 60000 No Yes Yes No No
74 30 F S-E N H/L 1 1 E P/S No 12000 No No Yes No No
75 30 F S-E N H/L 1 2 E P/S No 45000 No Yes Yes No No
76 38 M S-E B H/L 8 14 B P/S No 1700000 No Yes Yes No No
77 42 M S-E N H/L 10 6 E P/S Yes 1000000 No Yes Yes No No
78 47 M S-E E H/L 10 10 E P/S No 3000000 No No Yes No Yes
79 40 M S-E E H/L 5 1 E P/S No - No Yes Yes No No
80 34 M E-E E H/L 16 5 B P/S No 60000 Yes Yes Yes No No
81 43 M S-E E H/L 4 4 E P/S Yes 1100000 No Yes Yes No No
82 40 F S-E N H/L 4 2 N P/S No 1800000 No No No No No
83 45 F E-E E H/L 20 10 B P/S No 360000 No Yes Yes No No
84 35 M S-E B H/L 10 15 E P/S Yes 1000000 Yes Yes Yes Yes Yes
85 36 M S-E E H/L 7 1 N P/S No 100000 No No Yes Yes No
86 46 M S-E B H/L 8 8 B P/S No 1200000 No No Yes No No
87 31 F E-E N H/L 8 6 B P/S No 1200000 No Yes Yes No No
88 38 M E-E N H/L 4 5 B P/S No 1000000 No Yes Yes No No
89 60 M S-E B H/L 10 10 N P/S No 600000 No No Yes Yes Yes

49
90 30 F S-E N H/L 0 0 N P/S No - No No Yes Yes No
91 39 F S-E N H/L 9 4 E P/S No 350000 Yes Yes Yes No No
92 25 F E-E N H/L 10 4 B P/S No 2125000 No No No No No
93 48 F E-E N H/L 5 13 B P/S No 400000 No Yes Yes No No
94 31 F E-E E H/L 18 3 N P/S No 600000 Yes Yes Yes No No
95 35 M S-E N H/L 6 7 B P/S No 2000000 Yes Yes Yes No No
96 22 F E-E N H/L 0 4 E P/S No 18000 Yes Yes No No No
97 22 F E-E N H/L 1 4 B P/S No 984696 No Yes Yes No No
98 27 M E-E N H/L 3 11 N P/S Yes 2000000 No Yes No No No
99 32 M E-E E H/L 22 44 E P/S Yes 400000 No Yes Yes Yes No
100 33 F S-E E H/L 3 5 E P/S No 50000 No Yes Yes No No
101 54 F S-E E H/L 9 1 E P/S No 84000 No Yes No No No
102 31 M E-E N H/L 1 2 E P/S No 240000 No Yes Yes No No
103 43 F E-E E H/L 18 30 E P/S No 180000 No Yes Yes Yes No
Note: Abbreviations as follows, M:Male, F:Female, S-E:Self-Employed, E-E:Employed by Enterprise,
N H/L:Neither House/Livestock, E H/L:Either House/Livestock, B H/L:Both House/Livestock,
N P/S:Neither Potential/Survival, E P/S:Either Potential/Survival, B P/S:Both Potential/Survival.
3. Breusch-Pagan-Godfrey Test for Heteroscedasticity