The impact of marketing capability, operations capability and diversification strategy on...
13
The impact of marketing capability, operations capability and diversification strategy on performance: A resource-based view Prithwiraj Nath ⁎, Subramanian Nachiappan 1 , Ramakrishnan Ramanathan 2 Nottingham University Business School Jubilee Campus, Wollaton Road Nottingham NG8 1BB, UK abstract article info Article history: Received 17 December 2007 Received in revised form 16 June 2008 Accepted 1 September 2008 Available online 23 October 2008 Keywords: Marketing capability Operations capability Diversification Performance Efficiency Resource-based view Using resource-based view (RBV) of the firm as a theoretical backdrop; we aim to find out the relative impact of a firm's functional capabilities (namely, marketing and operations) and diversification strategies (product/ service and international diversification) on financial performance. We hypothesize that this linkage depends on the firm's relative efficiency to integrate its resource–capabilities–performance triad. Using archival data of 102 UK based logistics companies, we find marketing capability is the key determinant for superior financial performance. This study highlights that a market-driven firm is likely to have better business performance than a firm focusing solely on operational capabilities. Also, firms are better off when they focus on a narrow portfolio of products/services for the clients and concentrate on a diverse geographical market. Our findings provide a new perspective to model a firm's functional capabilities and diversification strategy on its financial performance and offer a benchmarking tool to improve resource allocation decisions. Crown Copyright © 2008 Published by Elsevier Inc. All rights reserved. 1. Introduction Traditionally, marketing and operations functions have been studied separately in management literature (Karmakar, 1996). Marketing focused on creation of customer demand and how to offer customers a unique value proposition. On the other hand, operations focused on management of supply to fulfill customer demand. Porter (1985) argued that all functional areas of business contribute towards delivery of goods and services but marketing and operations are the two key functional areas that add and create value to customers. There is a growing body of management science literature which stresses the integration of marketing and operations functions as key to organizational performance (Balasubramanian & Bhardwaj, 2004; Ho & Zheng, 2004; Malhotra & Sharma, 2002; Sawhney & Piper, 2002). Mismatch between these two functions lead to production inefficiency and customer dissatisfaction, whereas a proper fit lead to superior competitive advantage and sustainable profits (Ho & Tang, 2004). It is widely accepted even among business leaders that ability to integrate such cross-functional expertise is essential for continued growth and profitability (Wind, 2005). Diversification strategy, in terms of entering into a related or unrelated business and/or entering into a new geographic market is considered to be of crucial importance to an organization's long term leadership position in its own industry (Hoopes, 1999; Goerzen & Beamish, 2003; Nachum, 2004; Narasimhan & Kim, 2002). Strategic management literature has studied extensively the costs and the benefits of diversification strategy and its effect on competitive advantage for an organization (Chakrabarti, Singh, & Mahmood, 2007; Palich, Cradinal, & Miller, 2000; Ramanujam & Varadarajan, 1989). Researchers have particularly focused on the effect of product/service diversification which is defined as the synergy in different lines of business (Berger & Ofek, 1995; Bettis & Mahajan, 1985) and, international diversification or geographical diversification in a different market (Fang, Wade, Delios, & Beamish, 2007; Ghoshal, 1987; Kim, Hwang, & Burgers, 1993) on firm performance. Hitt, Hoskisson, and Kim (1997) argued that the ability of an organization to manage such diversification depends on their cross-functional capabilities and coordination activities. It is widely accepted that efficient linkage of various internal functions within an organization and interactions among them is crucial to manage the ‘curvilinear effects’ of diversification on performance (Narasimhan & Kim, 2002; Palich et al., 2000). From the above discussions, it is clear that functional capabilities (marketing and operations) and diversification strategies (product/ service and international diversification) have significant impact on a firm's financial performance. But to our knowledge, there has been no research to integrate all these constructs and find out the relative impact of each of them on firm performance. Thus, our first research objective is to understand the nature of relationship between marketing capability, operations capability, and diversification strat- egy (product/service and international) on organization's financial Industrial Marketing Management 39 (2010) 317–329 ⁎ Corresponding author. Tel.: +44115 846 8122; fax: +44115 846 6667. E-mail addresses: [email protected] (P. Nath), [email protected] (S. Nachiappan), [email protected] (R. Ramanathan). 1 Tel.: +44 115 8466634. 2 Tel.: +44115 846 7764; fax: +44115 846 6341. 0019-8501/$ – see front matter. Crown Copyright © 2008 Published by Elsevier Inc. All rights reserved. doi:10.1016/j.indmarman.2008.09.001 Contents lists available at ScienceDirect Industrial Marketing Management
-
Upload
eastanglia -
Category
Documents
-
view
1 -
download
0
Transcript of The impact of marketing capability, operations capability and diversification strategy on...
Industrial Marketing Management 39 (2010) 317–329
Contents lists available at ScienceDirect
Industrial Marketing Management
The impact of marketing capability, operations capability and diversification strategyon performance: A resource-based view
Prithwiraj Nath ⁎, Subramanian Nachiappan 1, Ramakrishnan Ramanathan 2
Nottingham University Business School Jubilee Campus, Wollaton Road Nottingham NG8 1BB, UK
⁎ Corresponding author. Tel.: +44 115 846 8122; fax:E-mail addresses: [email protected]
[email protected] (S. [email protected] (R. Ramanathan).
1 Tel.: +44 115 8466634.2 Tel.: +44 115 846 7764; fax: +44 115 846 6341.
0019-8501/$ – see front matter. Crown Copyright © 20doi:10.1016/j.indmarman.2008.09.001
a b s t r a c t
a r t i c l e i n f oArticle history:
Using resource-based view Received 17 December 2007Received in revised form 16 June 2008Accepted 1 September 2008Available online 23 October 2008Keywords:Marketing capabilityOperations capabilityDiversificationPerformanceEfficiencyResource-based view
(RBV) of the firm as a theoretical backdrop; we aim to find out the relative impactof a firm's functional capabilities (namely, marketing and operations) and diversification strategies (product/service and international diversification) on financial performance. We hypothesize that this linkage dependson the firm's relative efficiency to integrate its resource–capabilities–performance triad. Using archival dataof 102 UK based logistics companies, we find marketing capability is the key determinant for superiorfinancial performance. This study highlights that a market-driven firm is likely to have better businessperformance than a firm focusing solely on operational capabilities. Also, firms are better off when they focuson a narrow portfolio of products/services for the clients and concentrate on a diverse geographical market.Our findings provide a new perspective to model a firm's functional capabilities and diversification strategyon its financial performance and offer a benchmarking tool to improve resource allocation decisions.
Crown Copyright © 2008 Published by Elsevier Inc. All rights reserved.
1. Introduction
Traditionally, marketing and operations functions have beenstudied separately in management literature (Karmakar, 1996).Marketing focused on creation of customer demand and how tooffer customers a unique value proposition. On the other hand,operations focused on management of supply to fulfill customerdemand. Porter (1985) argued that all functional areas of businesscontribute towards delivery of goods and services but marketing andoperations are the two key functional areas that add and create valueto customers. There is a growing body of management scienceliterature which stresses the integration of marketing and operationsfunctions as key to organizational performance (Balasubramanian &Bhardwaj, 2004; Ho & Zheng, 2004; Malhotra & Sharma, 2002;Sawhney & Piper, 2002). Mismatch between these two functions leadto production inefficiency and customer dissatisfaction, whereas aproper fit lead to superior competitive advantage and sustainableprofits (Ho & Tang, 2004). It is widely accepted even among businessleaders that ability to integrate such cross-functional expertise isessential for continued growth and profitability (Wind, 2005).
Diversification strategy, in terms of entering into a related orunrelated business and/or entering into a new geographic market is
+44 115 846 6667.(P. Nath),pan),
08 Published by Elsevier Inc. All rig
considered to be of crucial importance to an organization's long termleadership position in its own industry (Hoopes, 1999; Goerzen &Beamish, 2003; Nachum, 2004; Narasimhan & Kim, 2002). Strategicmanagement literature has studied extensively the costs and thebenefits of diversification strategy and its effect on competitiveadvantage for an organization (Chakrabarti, Singh, &Mahmood, 2007;Palich, Cradinal, & Miller, 2000; Ramanujam & Varadarajan, 1989).Researchers have particularly focused on the effect of product/servicediversification which is defined as the synergy in different lines ofbusiness (Berger & Ofek, 1995; Bettis & Mahajan, 1985) and,international diversification or geographical diversification in adifferent market (Fang, Wade, Delios, & Beamish, 2007; Ghoshal,1987; Kim, Hwang, & Burgers, 1993) on firm performance. Hitt,Hoskisson, and Kim (1997) argued that the ability of an organizationto manage such diversification depends on their cross-functionalcapabilities and coordination activities. It is widely accepted thatefficient linkage of various internal functions within an organizationand interactions among them is crucial to manage the ‘curvilineareffects’ of diversification on performance (Narasimhan & Kim, 2002;Palich et al., 2000).
From the above discussions, it is clear that functional capabilities(marketing and operations) and diversification strategies (product/service and international diversification) have significant impact on afirm's financial performance. But to our knowledge, there has been noresearch to integrate all these constructs and find out the relativeimpact of each of them on firm performance. Thus, our first researchobjective is to understand the nature of relationship betweenmarketing capability, operations capability, and diversification strat-egy (product/service and international) on organization's financial
hts reserved.
318 P. Nath et al. / Industrial Marketing Management 39 (2010) 317–329
performance. Capabilities are broadly defined as “complex bundle ofskills and accumulated knowledge that enable firms (or strategicbusiness units — SBU) to coordinate activities and make use of theirassets” (Day,1990, p. 38). As a theoretical background of our study, weuse the resource-based view (RBV) framework to assess howindividual organization's resources and capabilities affect its financialperformance (Wernerfelt, 1984). RBV theory suggests that eachorganization has a distinctive set of resources and capabilities, andsome capabilities will have superior impact on financial performancethan the others (Song, Benedetto, & Nason, 2007). Such difference inimpact is attributed to the efficiency with which a firm is able toconvert its resources into “valuable” “difficult to imitate” capabilitiesand into financial performance (Liebermann & Dhawan, 2005).Efficiency is defined as the ratio of a firm's output to that of its inputand is measured in terms of the maximum feasible output which canbe obtained with a given set of inputs (Liebermann & Dhawan, 2005).In this study, we specifically study the relationship in two contexts:high vs. low efficient firms in making this transformation. Thus, oursecond research objective is to understand how efficiency of a firm toconvert its resources into financial outputs moderates the relationshipbetween the functional capabilities and diversification strategy onoverall business performance.
We accomplish our research objectives in three stages. First,following RBV rationale, we model the functional capabilities(marketing and operations) of a firm in the form of input–outputtransformation. This enables us to understand how a firm is able tooptimally use its function specific resources to achieve functionspecific objectives. Such identification of sub-optimal resource usageprovides insights to better resource allocation decisions. We usesimilar approach to classify firms into high and low efficient groups asper their overall business performance. Second, we propose andempirically test how diversification strategy affects firm performance.Third, we examine how business performance measured using multi-factor construct in stage 1 affects the relationship between functionalcapabilities and diversification strategy on firm's financialprofitability.
We test our conceptual framework using archival financial data forUK road based logistics service providers. A logistics firm, operating inbusiness to business context, has to excel in both operationscapabilities through superior process knowledge and marketingcapability through continuous creation of customer value. Firms inlogistics industry are extremely dependent on the overall economicgrowth of the country; and the performance of freight intensiveindustries such as manufacturing, agriculture, and retail. However,with increase in focus on services dominant industries, stagnanteconomic growth, increase in fuel cost, and congestion on the roads,the logistics industry in UK is experiencing stagnation. The growth infreight transport in UK has been less than the GDP growth of thecountry (Office of National Statistics, 2006). In UK, the numbers ofroad freight operators have steadily fallen by 15% in the last decade.Rail and water based transport has steadily replaced road transport.The cost of moving freight by rail and sea has decreased over the yearswhereas, the cost of road transport has increased by a third during thelast decade making it more challenging for the road transportoperators to compete and sustain (Department of Transport, 2004).Thus, recession in economy, spiraling cost of operation, and tighterprofit margin has made it imperative for the logistics companies to re-think about their value propositions to their customers, diversifythrough expansion of services offered and geographical coverage.Many logistics companies are thus going towards consolidation oftheir business portfolio to achieve greater efficiency. Despite thegloomy industry forecasts, there is a significant variation in perfor-mance of the logistics firms. The small and medium logistics firmsexperience a negative growth in business and very large firms havesignificantly higher profit than the firms in the other end of thespectrum (Office of National Statistics, 2006). Thus, it becomes critical
to understand how functional capabilities and long term diversifica-tion strategies of logistics firms affect their business profitability andhow efficiency of firms moderates this inter-relationship.
The rest of the paper is structured as follows. The next sectiondiscusses our theoretical underpinning of using RBV framework andthe conceptualization of functional capabilities and diversification forlogistics firms. Section 3 discusses the data and the methodology formeasuring resources, capabilities and efficiency. Section 4 presentsthe empirical findings and Section 5 highlights the implications of ourresult, limitations of our study and provides direction for futureresearch.
2. Conceptual framework
This section narrates our conceptual framework developed on thebasis of resource-based view (RBV) theory. It is organized as follows.In subsection 2.1, we give a synopsis of RBV theory explaining the keyconcepts of resources, capabilities and their linkage to firm perfor-mance. In subsection 2.2, we describe the principal functionalcapabilities namely marketing and operations. We also explain therole of diversification and its impact on long term competitiveadvantage along with the arguments for hypotheses formulation.We hypothesize that such relationships between capabilities, diversi-fication and performance is moderated by a firm's efficiency intransforming its financial resources into profitability outputs.
2.1. Resource-based view (RBV) — a synopsis
RBV views a firm as a bundle of resources and capabilities(Wernerfelt, 1984). Amit and Schoemaker (1993) define resource as“stocks of available factors that are owned or controlled by the firm”.Resource consist of tangible components like financial and physicalassets like property, plant and equipment, and intangible componentslike human capital, patent, technology knowhow (Grant, 1991; Amit &Schoemaker, 1993). Capability is defined as the ability of the firm touse its resource “to effect a desired end” (Amit & Schoemaker, 1993). Itis like “intermediate goods” generated by the firm using organiza-tional processes to provide “enhanced productivity to its resources”(Amit & Schoemaker,1993). Capabilities are “invisible assets”, tangibleor intangible organizational processes developed by a firm over aperiod of time that “cannot be easily bought; they must be built”(Teece, Pisano, & Shuen, 1997). RBV argues that firms will havedifferent nature of resources and varying levels of capabilities. Firms'survival depends on its ability to create new resources, build on itscapabilities platform, and make the capabilities more inimitable toachieve competitive advantage (Day & Wensley, 1988; Peteraf, 1993;Prahalad & Hamel, 1990). Thus, mere possession of superior resourcescannot achieve competitive advantage for the firm, but how a firmdeploys its scarce resources, put its capabilities to best use, invest andcomplement its existing capabilities infrastructure can bring “immo-bility and inimitability” to its resource-capability framework (Peteraf,1993; Song et al., 2007). In marketing literature, there has beenextensive use of RBV framework to analyze firm performance (Dutta,Narasimhan, & Surendra, 1999; Liebermann & Dhawan, 2005), tounderstand the interaction between marketing and other functionalcapabilities and their effect on performance (Song et al., 2007; Song,Droge, Hanvanich, & Calantone, 2005; Song, Nason, & Benedetto,2008), and particularly to understand inter-organizational relation-ship performance (Palmatier, Dant, & Grewal, 2007). The resultssuggest that there is a significant relationship between capabilitiesand performance. Strategic management researchers have used RBVto understand the inter-firm difference in performance (Barney, 1986;Peteraf, 1993; Makadok, 2001). In addition, RBV theory suggests thatheterogeneity in firm performance is due to ownership of resourcesthat have differential productivity (Makadok, 2001). Since, a firm'scapability is defined “as its ability to deploy resources (inputs)
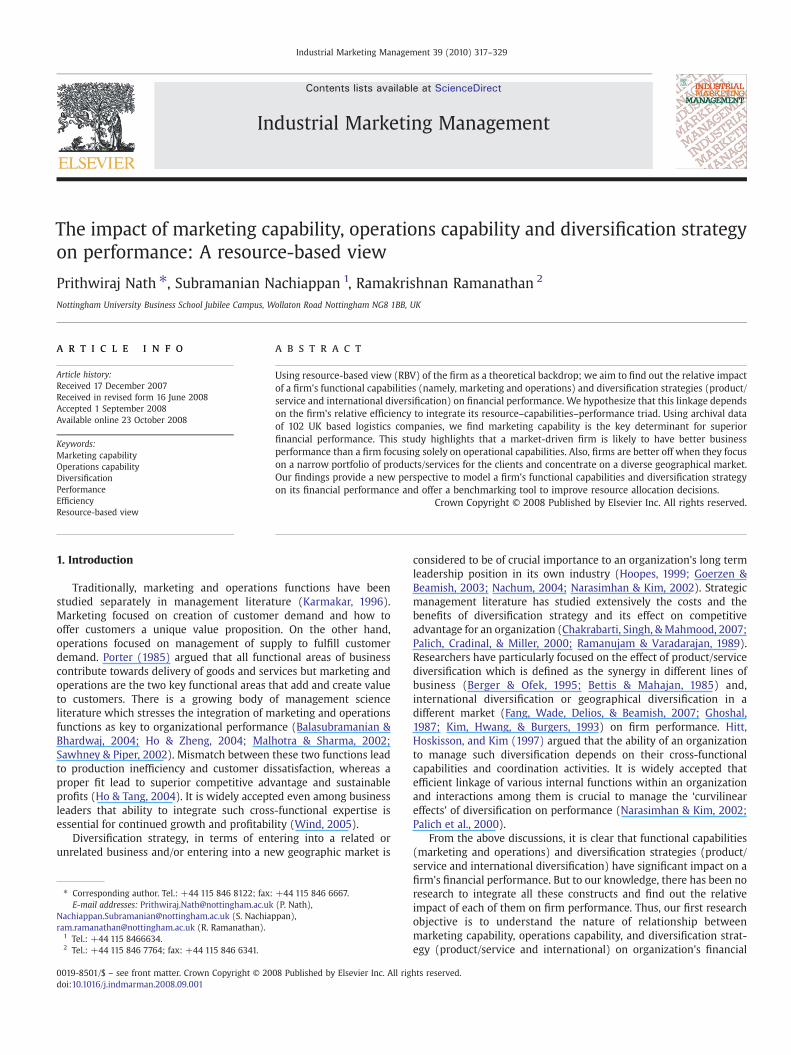
Fig. 1. Framework to measure resources–capabilities–performances transformation.
319P. Nath et al. / Industrial Marketing Management 39 (2010) 317–329
available to it to achieve the desired objectives (outputs)” (Dutta et al.,1999), so in this study, we use an input–output framework in the formof efficiency frontier function to understand the optimal conversion ofa firm's resources to its objectives.
2.2. Resources, capabilities, diversification and performance
In our conceptual framework, we consider how a firm exploits itscritical capabilities in marketing and operations; and pursue adiversification strategy to achieve competitive advantage. Accordingto RBV, a firm diversifies to extend its resources into newmarkets andbusinesses. Resources and capabilities such as business knowledge,technological expertise, and international diversification experienceare transferred between the parent company and its businesssubsidiaries (Fang et al., 2007; Lu & Beamish, 2001). RBV posits thatas firms diversify within the scope of their resources and capabilities,they obtain economies of scale through lower operational costs andleverage superior business efficiency through shared fixed assets likecommon production facilities, distribution channels, or even brandnames (Hitt et al., 1997). Marketing capability involves integration ofall marketing related activities of a firm using superior marketknowledge from customers and competitions. Operations capabilityis the process, technology, reliability and quality of the overalloperations of the firm. According to RBV, a coordinated effort by thefirm tomake these two capabilities as “immovable and inimitable” canbring the competitive edge (Dutta et al., 1999; Liebermann & Dhawan,2005; Narsimhan, Rajiv, & Dutta, 2006). Day (1994) suggests that“every business develops its own configuration of capabilities”according to the environment, and “it is not possible to enumerateall possible capabilities”. So, in this study, we focus on the principalfunctions of a logistics firm (namely marketing and operations) andstudy how their functional capabilities along with diversificationstrategies affect their business performance. Fig. 1 represents theconceptual framework for our study.
2.2.1. Marketing capabilityMarketing capability is defined as the integrative process, inwhich
a firm uses its tangible and intangible resources to understandcomplex consumer specific needs, achieve product differentiationrelative to competition, and achieve superior brand equity (Day, 1994;Dutta et al., 1999; Song, Benedetto et al., 2007; Song, Droge et al.,2005). A firm develops its marketing capabilities when it can combineindividual skills and knowledge of its employees along with theavailable resources (Vorhies & Morgan, 2005). A firm that spendsmore resources to interact with customers can enhance their “marketsensing” abilities (Narsimhan et al., 2006). Such capabilities, once
built are very difficult to imitate for competing firms (Day, 1994).Thus, marketing capability is considered to be an important source toenhance competitive advantage of firms.
The role of being “market-driven” and its impact on firm perfor-mance has been an active area of research inmarketing discipline (Songet al., 2008). Songet al. (2007) suggestmarketing capability helps a firmto create and retain strong bondwith customers and channel members.Marketing capability create a strong brand image that allows firms toproduce superior performance (Ortega & Villaverde, 2008). Marketingliterature suggests thatfirms use capabilities to transform resources intooutputs based on their marketing mix strategies and such marketingcapabilities is linked to their business performance (Vorhies & Morgan,2003, 2005). Based on the above arguments, we hypothesize:
Hypothesis 1a. The greater is the marketing capability of a firm; thebetter is its business performance
2.2.2. Moderating effect of firm efficiency on marketing capability-business performance linkage
Extant literature suggests that the impact of marketing capability ona firm's business performance varies according to a firm's owncharacteristics (Ortega & Villaverde, 2008; Song, Benedetto et al.,2007; Song, Droge et al., 2005; Song, Nason et al., 2008). Song et al.(2007) studied the moderating role of a firm's strategy based on Milesand Snow framework and found a positive impact of marketingcapability on financial performance for firms which can sustaincustomer loyalty through their unique marketing communication.Ortega and Villaverde (2008) propose marketing capability has moreimpact on financial performance for firms which invest on better assetsto innovate in a dynamic business environment. Strategic managementliterature suggests that marketing capability has varied impact onperformancedependingon theyway inwhich afirm can align itselfwithits business environment (Conant, Mokwa, & Varadarajan, 1990;Desarbo, Benedetto, Song, & Sinha, et al., 2005; Song et al., 2007).Firms with proactive market orientation have distinct competencies inmarket planning,marketing resource allocation and overall control thanfirms who prefer to wait and watch. Thus, innovative firms devotesignificant resource on its marketing activities whereas, defender firmsfocus more on cost reduction rather than develop their criticalinnovative abilities. Market orientation literature suggests that firmswith superior market orientation frequently outperform their lessmarket oriented rivals in delivering better customer value (Jaworski &Kohli, 1993; Kumar, Ganesh, & Echambadi, 1998; Narver & Slater, 1990).Vorhies andMorgan (2005) emphasize thatmarketing capability is firmspecific and unique to it. Such customer value-adding capabilities arenot imitable, replaceable, or transferable, and thus provide basis for
320 P. Nath et al. / Industrial Marketing Management 39 (2010) 317–329
competitive advantage. Competing firms targeting similar marketevolve comparable marketing capability but not identical ones. Firmsare classified as more efficient if they have a superior resource–capability–performance transformation ability and less efficient other-wise. Following the RBV rationale, we posit that marketing capabilitiesof firms differ and unique firm characteristics like efficiency influenceperformance. Thus, we investigate the following:
Hypothesis 1b. Marketing capability has a stronger impact on businessperformance for efficient firms rather than the inefficient ones.
2.2.3. Operations capabilityOperations capability is defined as the integration of a complex set
of tasks performed by a firm to enhance its output through the mostefficient use of its production capabilities, technology, and flow ofmaterials (Dutta et al., 1999; Hayes, Wheelwright, & Clark, 1988).Manufacturing strategy literature highlights the role of operationscapability on firm performance (Gonzalez-Benito & Gonzalez-Benito,2005; Hayes & Pisano, 1996; Roth & Miller, 1990). It argues that a firmcan achieve competitive advantage by handling an efficient materialflow process, careful utilization of assets; and acquisition anddissemination of superior process knowledge (Tan, Kannan, &Narasimhan, 2007). Superior operations capability increase efficiencyin the delivery process, reduce cost of operations and achievecompetitive advantage (Day, 1994). Extant literature emphasizes therole of an integrative approach in combining marketing and opera-tions capability; and suggest operations success is a pre-condition tomarketing success (Hausmana, Montgomery, & Roth, 2002; Tatikonda& Montoya-Weiss, 2001). Thus, we hypothesize
Hypothesis 2a. The greater is the operations capability of a firm; thebetter is its business performance
2.2.4. Moderating effect of firm efficiency on operations capability–business performance linkage
Extant literature suggests that the impact of operations capabilityon a firm's business performance varies according to a firm's owncharacteristics (Ortega & Villaverde, 2008; Song, Benedetto et al.,2007; Song, Droge et al., 2005). Operations capability is likely to bemore important for firms which are not cost effective at this momentand want to reduce their cost of operations, develop their productionfacilities, improve their value proposition to their customers, and thusincrease their efficiency in running their business (Song et al., 2008).Operations capability improves performance of firms which competeswith superior competitors from a relatively disadvantaged position interms of product and process development, cost of operations, andinnovative characteristics (Ortega & Villaverde, 2008). Strategicmanagement literature suggests that operations capability has variedimpact on performance depending on they way in which firms alignthemselveswith their business environment (McDaniel & Kolari,1987;Song et al., 2005; Wu, Yeniyurt, Kim, & Cavusgil, 2006). Innovatorshave superior product engineering technology, high R&D budgets, andprioritize technology as a source of competitive advantage. Followersare more interested to maintain status-quo, rely less on new product/service development, do not invest resources to understand andforecast technological changes. This follows the RBV rationale asoperations capability is inimitable, immobile and classified as a sourceof competitive advantage. Cool and Schendel (1988) demonstrates thatfirms in the samemarket segment having similar operations capabilitydiffer in terms of their financial performance. Using the abovearguments, we posit firms which are less efficient in resource–capability–performance transformation need superior operationscapabilities, and such capabilities have cumulative effect on theirbusiness performance. Thus, we suggest the following:
Hypothesis 2b. Operations capability has a stronger impact on businessperformance for inefficient firms rather than the efficient ones.
2.2.5. Diversification strategies and performanceRamanujam and Varadarajan (1989) define diversification as the
entry of a firm into new lines of business activity through internalbusiness development or acquisition. Strategic management literaturehas delved extensively onwhy a firm diversifies, cost of diversification,when diversification can improve firm performance and when it isdetrimental to it (Chakrabarti et al., 2007; Montgomery, 1994;Ramanujam & Varadarajan, 1989). The principal reasons for diversi-fication are perceived benefits associated with greater target market,utilization of unused productive capacity, risk reduction in terms ofdiverse portfolio of business, and capability build-up. Conceptually,diversification should have a positive influence on firm performanceas it helps the firms to achieve economies of scale, greater reach, andleverage its experience in other markets (Rumelt, 1974). However,empirical studies on the role of diversification on firm performancegive a different result. Montgomery and Wernerfelt (1988) suggestthat diversification has negative impact on performance. Diversifica-tion often increase the cost of operation, causes conflict in terms ofgreater managerial and organizational complexities; and inhibitsfirms from responding to major external changes (Chakrabarti et al.,2007; Grant, Jammine, & Thomas, 1988). Researchers have studied theeffect of product/service diversification (Berger & Ofek, 1995; Bettis &Mahajan, 1985), and international diversification (Ghoshal, 1987; Kimet al., 1993) on firm performance. In this study, we focus on the servicediversification aspect as the context we have chosen is the servicesector. Service diversification can either be in related or unrelatedcategory. For example, logistics firms offer a complete supply chainmanagement solutions coordinating the flow of information andgoods between suppliers, manufacturers, retailers and customers issaid to pursue a related service diversification strategy. They offerwarehousing, distribution, and inventory management solution to theentire supply chain and act as an integrated partner to the clientorganizations. On the other hand, logistics firms transportingconsumer goods like food, clothing diversify into offering specializedinsurance services, export, import and customs clearance services issaid to pursue an unrelated service diversification strategy as offeringsuch diversified services require different skill sets. Similarly, inter-national diversification can be in related or unrelated geographicalmarkets depending on the synergy between the principal and the newmarkets entered by the logistics firms. RBV theory explains diversi-fication improves performance if the resources likemarket knowledgetransferred between partners are rare, valuable and inimitable(Prahalad & Hamel, 1990). Thus related diversification improves firmperformance through better use of resources and capabilities, whereasunrelated diversification exceeds the range of resource utilization,surpasses management capabilities and proves to be detrimental tofirm performance (Tallman & Li, 1996). Extant literature suggests thatthere exist a mixed relation between diversification and firmperformance (both positive and negative according to context) andthe relationship is not a linear function but turns out to be U shapedcurvilinear (Datta, Rajagopalan, & Rasheed, 1991; Geringer, Tallman, &Olsen, 2000; Narasimhan & Kim, 2002). In this study, we do notattempt to study the curvilinear impact of diversification as our focusis not to identify the threshold point in diversification where itsimpact on firm performance changes from positive to negative or viceversa. Rather, on the basis of the above arguments on the impact ofdiversification on long term business performance, we propose:
Hypothesis 3a. Diversification (service and international) has anegative impact on a firm's business performance
2.2.6. Moderating effect of firm efficiency on diversification-businessperformance linkage
RBV theory assumes a firm to be a source of distributed knowledge(Tsoukas, 1996). Although, managers assume that such knowledge trans-fer is seamless between the parent organization and the diversification
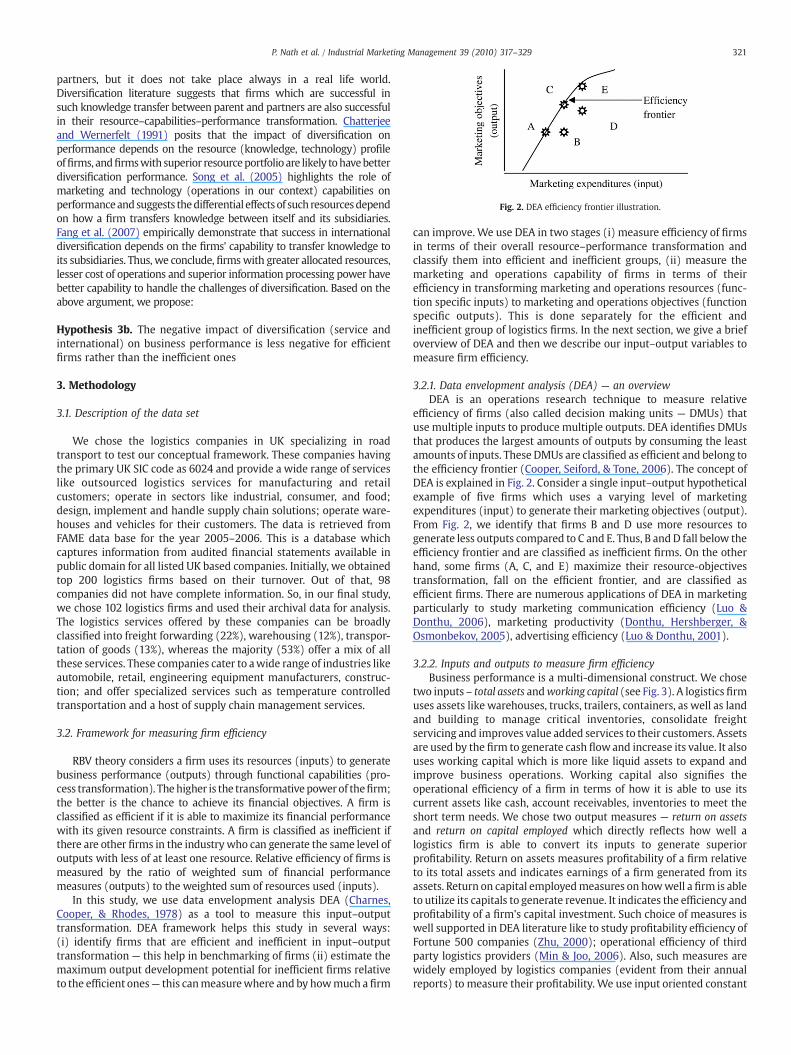
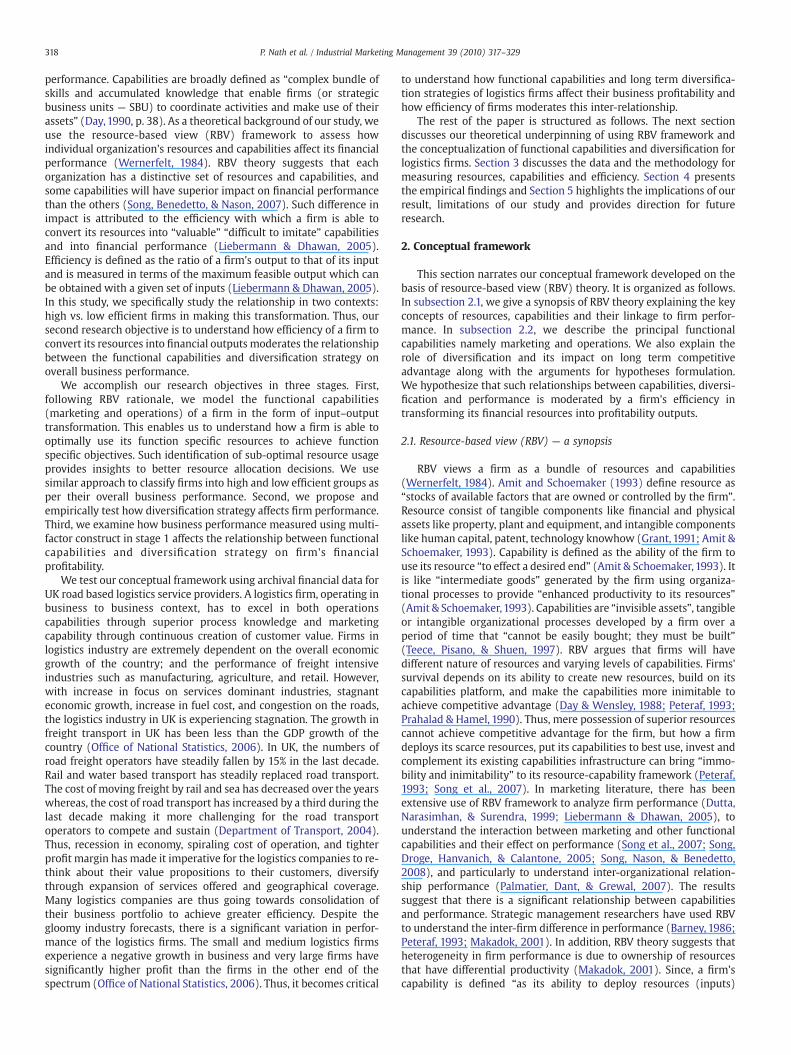
Fig. 2. DEA efficiency frontier illustration.
321P. Nath et al. / Industrial Marketing Management 39 (2010) 317–329
partners, but it does not take place always in a real life world.Diversification literature suggests that firms which are successful insuch knowledge transfer between parent and partners are also successfulin their resource–capabilities–performance transformation. Chatterjeeand Wernerfelt (1991) posits that the impact of diversification onperformance depends on the resource (knowledge, technology) profileoffirms, andfirmswith superior resourceportfolio are likely tohavebetterdiversification performance. Song et al. (2005) highlights the role ofmarketing and technology (operations in our context) capabilities onperformanceandsuggests thedifferential effectsof such resourcesdependon how a firm transfers knowledge between itself and its subsidiaries.Fang et al. (2007) empirically demonstrate that success in internationaldiversification depends on the firms' capability to transfer knowledge toits subsidiaries. Thus, we conclude, firmswith greater allocated resources,lesser cost of operations and superior information processing power havebetter capability to handle the challenges of diversification. Based on theabove argument, we propose:
Hypothesis 3b. The negative impact of diversification (service andinternational) on business performance is less negative for efficientfirms rather than the inefficient ones
3. Methodology
3.1. Description of the data set
We chose the logistics companies in UK specializing in roadtransport to test our conceptual framework. These companies havingthe primary UK SIC code as 6024 and provide a wide range of serviceslike outsourced logistics services for manufacturing and retailcustomers; operate in sectors like industrial, consumer, and food;design, implement and handle supply chain solutions; operate ware-houses and vehicles for their customers. The data is retrieved fromFAME data base for the year 2005–2006. This is a database whichcaptures information from audited financial statements available inpublic domain for all listed UK based companies. Initially, we obtainedtop 200 logistics firms based on their turnover. Out of that, 98companies did not have complete information. So, in our final study,we chose 102 logistics firms and used their archival data for analysis.The logistics services offered by these companies can be broadlyclassified into freight forwarding (22%), warehousing (12%), transpor-tation of goods (13%), whereas the majority (53%) offer a mix of allthese services. These companies cater to awide range of industries likeautomobile, retail, engineering equipment manufacturers, construc-tion; and offer specialized services such as temperature controlledtransportation and a host of supply chain management services.
3.2. Framework for measuring firm efficiency
RBV theory considers a firm uses its resources (inputs) to generatebusiness performance (outputs) through functional capabilities (pro-cess transformation). Thehigher is the transformative powerof thefirm;the better is the chance to achieve its financial objectives. A firm isclassified as efficient if it is able to maximize its financial performancewith its given resource constraints. A firm is classified as inefficient ifthere are other firms in the industrywho can generate the same level ofoutputs with less of at least one resource. Relative efficiency of firms ismeasured by the ratio of weighted sum of financial performancemeasures (outputs) to the weighted sum of resources used (inputs).
In this study, we use data envelopment analysis DEA (Charnes,Cooper, & Rhodes, 1978) as a tool to measure this input–outputtransformation. DEA framework helps this study in several ways:(i) identify firms that are efficient and inefficient in input–outputtransformation — this help in benchmarking of firms (ii) estimate themaximum output development potential for inefficient firms relativeto the efficient ones— this canmeasurewhere and by howmuch a firm
can improve. We use DEA in two stages (i) measure efficiency of firmsin terms of their overall resource–performance transformation andclassify them into efficient and inefficient groups, (ii) measure themarketing and operations capability of firms in terms of theirefficiency in transforming marketing and operations resources (func-tion specific inputs) to marketing and operations objectives (functionspecific outputs). This is done separately for the efficient andinefficient group of logistics firms. In the next section, we give a briefoverview of DEA and then we describe our input–output variables tomeasure firm efficiency.
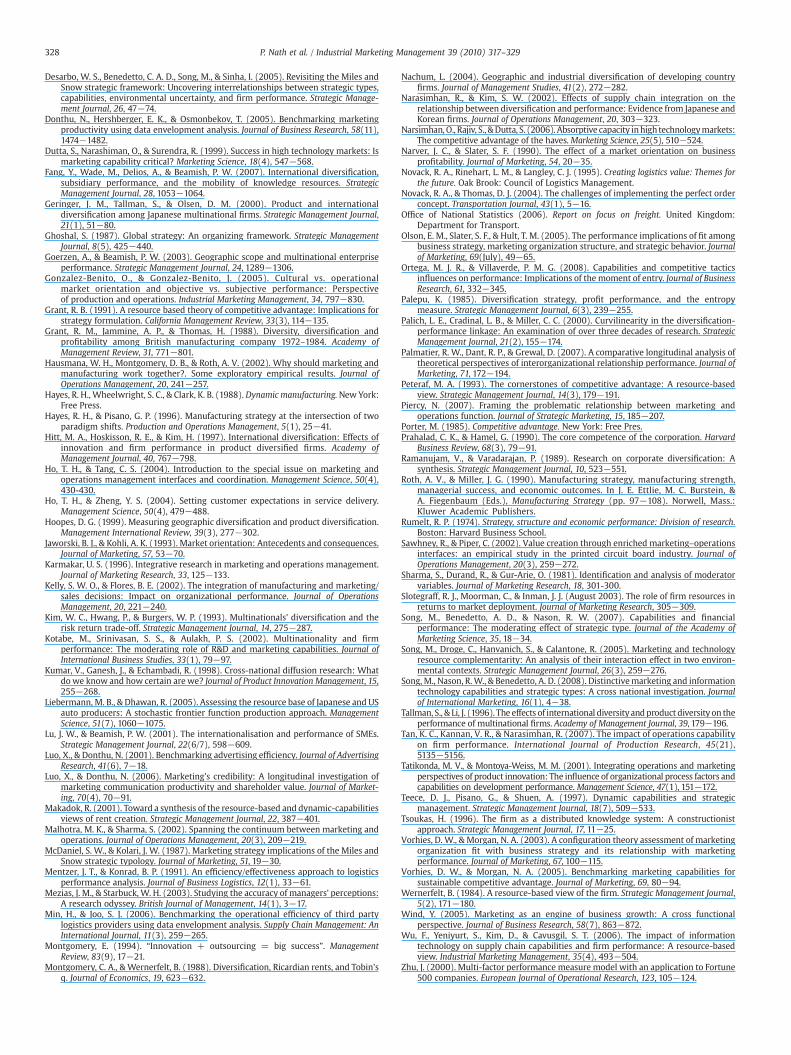
3.2.1. Data envelopment analysis (DEA) — an overviewDEA is an operations research technique to measure relative
efficiency of firms (also called decision making units — DMUs) thatuse multiple inputs to produce multiple outputs. DEA identifies DMUsthat produces the largest amounts of outputs by consuming the leastamounts of inputs. These DMUs are classified as efficient and belong tothe efficiency frontier (Cooper, Seiford, & Tone, 2006). The concept ofDEA is explained in Fig. 2. Consider a single input–output hypotheticalexample of five firms which uses a varying level of marketingexpenditures (input) to generate their marketing objectives (output).From Fig. 2, we identify that firms B and D use more resources togenerate less outputs compared to C and E. Thus, B and D fall below theefficiency frontier and are classified as inefficient firms. On the otherhand, some firms (A, C, and E) maximize their resource-objectivestransformation, fall on the efficient frontier, and are classified asefficient firms. There are numerous applications of DEA in marketingparticularly to study marketing communication efficiency (Luo &Donthu, 2006), marketing productivity (Donthu, Hershberger, &Osmonbekov, 2005), advertising efficiency (Luo & Donthu, 2001).
3.2.2. Inputs and outputs to measure firm efficiencyBusiness performance is a multi-dimensional construct. We chose
two inputs – total assets andworking capital (see Fig. 3). A logistics firmuses assets like warehouses, trucks, trailers, containers, as well as landand building to manage critical inventories, consolidate freightservicing and improves value added services to their customers. Assetsare used by the firm to generate cash flowand increase its value. It alsouses working capital which is more like liquid assets to expand andimprove business operations. Working capital also signifies theoperational efficiency of a firm in terms of how it is able to use itscurrent assets like cash, account receivables, inventories to meet theshort term needs. We chose two output measures — return on assetsand return on capital employed which directly reflects how well alogistics firm is able to convert its inputs to generate superiorprofitability. Return on assets measures profitability of a firm relativeto its total assets and indicates earnings of a firm generated from itsassets. Return on capital employedmeasures on howwell a firm is ableto utilize its capitals to generate revenue. It indicates the efficiency andprofitability of a firm's capital investment. Such choice of measures iswell supported in DEA literature like to study profitability efficiency ofFortune 500 companies (Zhu, 2000); operational efficiency of thirdparty logistics providers (Min & Joo, 2006). Also, such measures arewidely employed by logistics companies (evident from their annualreports) to measure their profitability. We use input oriented constant
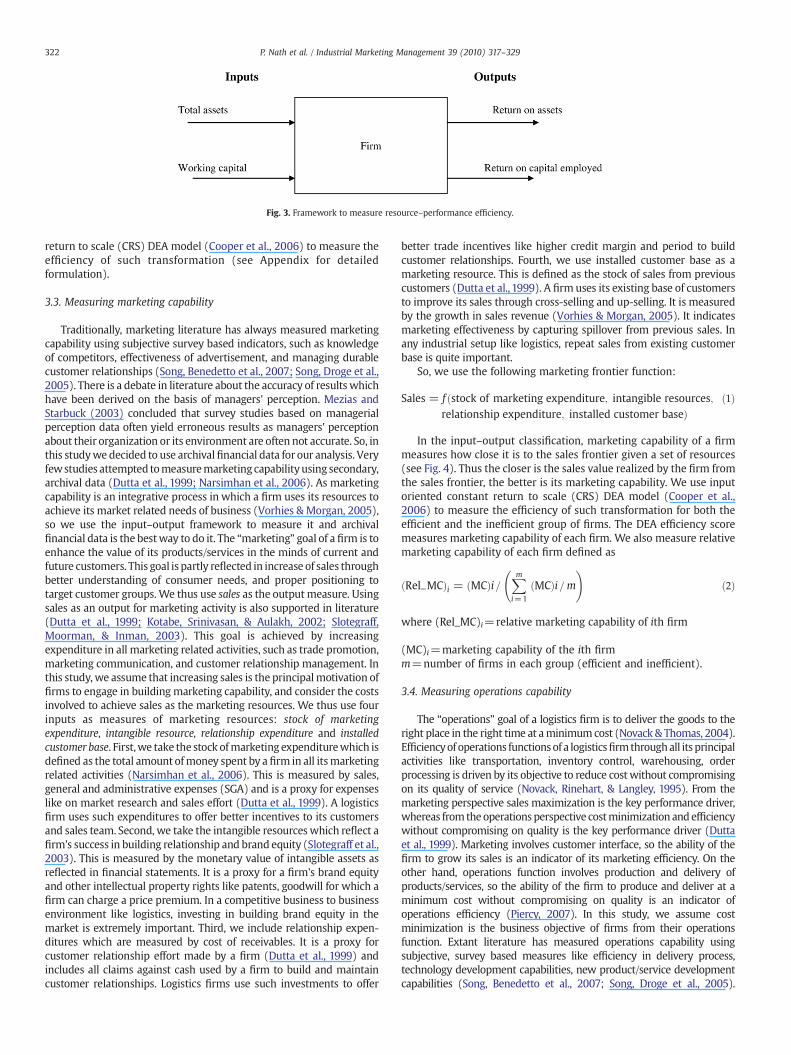
Fig. 3. Framework to measure resource–performance efficiency.
322 P. Nath et al. / Industrial Marketing Management 39 (2010) 317–329
return to scale (CRS) DEA model (Cooper et al., 2006) to measure theefficiency of such transformation (see Appendix for detailedformulation).
3.3. Measuring marketing capability
Traditionally, marketing literature has always measured marketingcapability using subjective survey based indicators, such as knowledgeof competitors, effectiveness of advertisement, and managing durablecustomer relationships (Song, Benedetto et al., 2007; Song, Droge et al.,2005). There is a debate in literature about the accuracy of results whichhave been derived on the basis of managers' perception. Mezias andStarbuck (2003) concluded that survey studies based on managerialperception data often yield erroneous results as managers' perceptionabout their organization or its environment are often not accurate. So, inthis studywe decided to use archivalfinancial data for our analysis. Veryfewstudies attempted tomeasuremarketing capabilityusing secondary,archival data (Dutta et al., 1999; Narsimhan et al., 2006). As marketingcapability is an integrative process in which a firm uses its resources toachieve its market related needs of business (Vorhies & Morgan, 2005),so we use the input–output framework to measure it and archivalfinancial data is the bestway to do it. The “marketing” goal of a firm is toenhance the value of its products/services in the minds of current andfuture customers. This goal is partly reflected in increase of sales throughbetter understanding of consumer needs, and proper positioning totarget customer groups.We thus use sales as the output measure. Usingsales as an output for marketing activity is also supported in literature(Dutta et al., 1999; Kotabe, Srinivasan, & Aulakh, 2002; Slotegraff,Moorman, & Inman, 2003). This goal is achieved by increasingexpenditure in all marketing related activities, such as trade promotion,marketing communication, and customer relationship management. Inthis study, we assume that increasing sales is the principalmotivation offirms to engage in building marketing capability, and consider the costsinvolved to achieve sales as the marketing resources. We thus use fourinputs as measures of marketing resources: stock of marketingexpenditure, intangible resource, relationship expenditure and installedcustomer base. First,we take the stock ofmarketing expenditurewhich isdefined as the total amount ofmoney spent by a firm in all itsmarketingrelated activities (Narsimhan et al., 2006). This is measured by sales,general and administrative expenses (SGA) and is a proxy for expenseslike on market research and sales effort (Dutta et al., 1999). A logisticsfirm uses such expenditures to offer better incentives to its customersand sales team. Second, we take the intangible resources which reflect afirm's success in building relationship and brand equity (Slotegraff et al.,2003). This is measured by the monetary value of intangible assets asreflected in financial statements. It is a proxy for a firm's brand equityand other intellectual property rights like patents, goodwill for which afirm can charge a price premium. In a competitive business to businessenvironment like logistics, investing in building brand equity in themarket is extremely important. Third, we include relationship expen-ditures which are measured by cost of receivables. It is a proxy forcustomer relationship effort made by a firm (Dutta et al., 1999) andincludes all claims against cash used by a firm to build and maintaincustomer relationships. Logistics firms use such investments to offer
better trade incentives like higher credit margin and period to buildcustomer relationships. Fourth, we use installed customer base as amarketing resource. This is defined as the stock of sales from previouscustomers (Dutta et al., 1999). A firm uses its existing base of customersto improve its sales through cross-selling and up-selling. It is measuredby the growth in sales revenue (Vorhies & Morgan, 2005). It indicatesmarketing effectiveness by capturing spillover from previous sales. Inany industrial setup like logistics, repeat sales from existing customerbase is quite important.
So, we use the following marketing frontier function:
Sales = f ðstock of marketing expenditure; intangible resources;relationship expenditure; installed customer baseÞ
ð1Þ
In the input–output classification, marketing capability of a firmmeasures how close it is to the sales frontier given a set of resources(see Fig. 4). Thus the closer is the sales value realized by the firm fromthe sales frontier, the better is its marketing capability. We use inputoriented constant return to scale (CRS) DEA model (Cooper et al.,2006) to measure the efficiency of such transformation for both theefficient and the inefficient group of firms. The DEA efficiency scoremeasures marketing capability of each firm. We also measure relativemarketing capability of each firm defined as
Rel MCð Þi = MCð Þi=Xmi=1
MCð Þi =m !
ð2Þ
where (Rel_MC)i=relative marketing capability of ith firm
(MC)i=marketing capability of the ith firmm=number of firms in each group (efficient and inefficient).
3.4. Measuring operations capability
The “operations” goal of a logistics firm is to deliver the goods to theright place in the right time at aminimumcost (Novack & Thomas, 2004).Efficiencyof operations functionsof a logisticsfirmthroughall its principalactivities like transportation, inventory control, warehousing, orderprocessing is driven by its objective to reduce costwithout compromisingon its quality of service (Novack, Rinehart, & Langley, 1995). From themarketing perspective sales maximization is the key performance driver,whereas from theoperationsperspective costminimization andefficiencywithout compromising on quality is the key performance driver (Duttaet al., 1999). Marketing involves customer interface, so the ability of thefirm to grow its sales is an indicator of its marketing efficiency. On theother hand, operations function involves production and delivery ofproducts/services, so the ability of the firm to produce and deliver at aminimum cost without compromising on quality is an indicator ofoperations efficiency (Piercy, 2007). In this study, we assume costminimization is the business objective of firms from their operationsfunction. Extant literature has measured operations capability usingsubjective, survey based measures like efficiency in delivery process,technology development capabilities, new product/service developmentcapabilities (Song, Benedetto et al., 2007; Song, Droge et al., 2005).
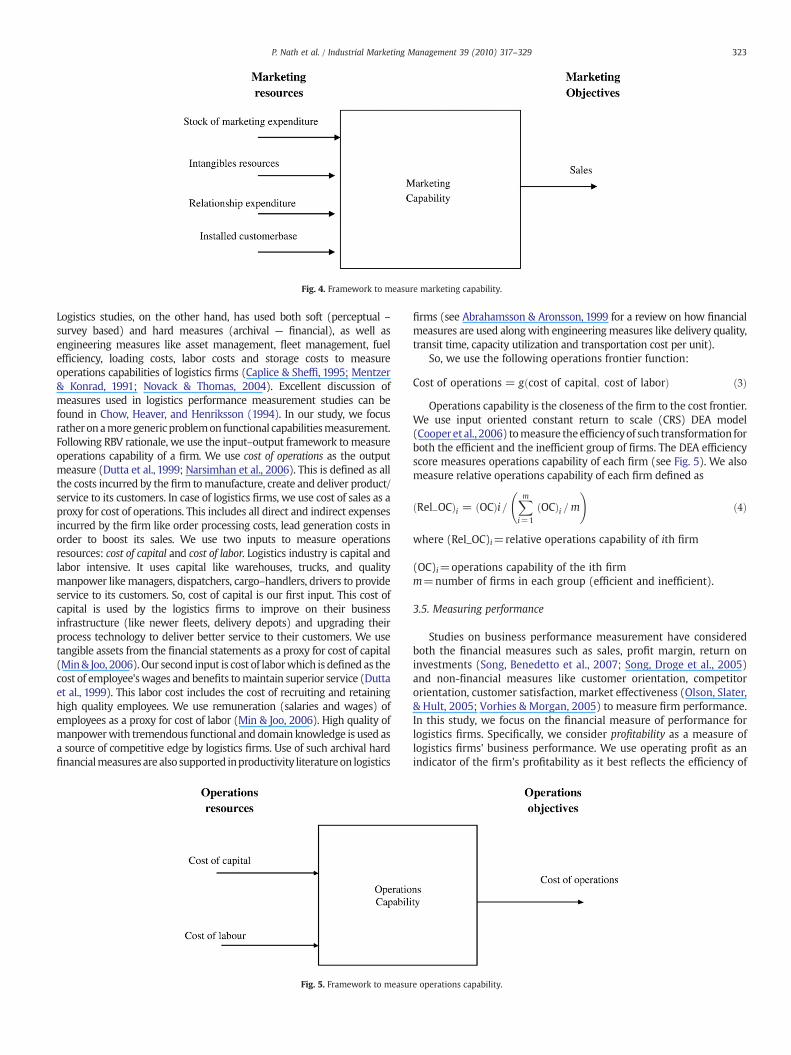
Fig. 4. Framework to measure marketing capability.
323P. Nath et al. / Industrial Marketing Management 39 (2010) 317–329
Logistics studies, on the other hand, has used both soft (perceptual –survey based) and hard measures (archival — financial), as well asengineering measures like asset management, fleet management, fuelefficiency, loading costs, labor costs and storage costs to measureoperations capabilities of logistics firms (Caplice & Sheffi, 1995; Mentzer& Konrad, 1991; Novack & Thomas, 2004). Excellent discussion ofmeasures used in logistics performance measurement studies can befound in Chow, Heaver, and Henriksson (1994). In our study, we focusratheronamoregenericproblemon functional capabilitiesmeasurement.Following RBV rationale, we use the input–output framework tomeasureoperations capability of a firm. We use cost of operations as the outputmeasure (Dutta et al., 1999; Narsimhan et al., 2006). This is defined as allthe costs incurred by the firm tomanufacture, create and deliver product/service to its customers. In case of logistics firms, we use cost of sales as aproxy for cost of operations. This includes all direct and indirect expensesincurred by the firm like order processing costs, lead generation costs inorder to boost its sales. We use two inputs to measure operationsresources: cost of capital and cost of labor. Logistics industry is capital andlabor intensive. It uses capital like warehouses, trucks, and qualitymanpower likemanagers, dispatchers, cargo–handlers, drivers to provideservice to its customers. So, cost of capital is our first input. This cost ofcapital is used by the logistics firms to improve on their businessinfrastructure (like newer fleets, delivery depots) and upgrading theirprocess technology to deliver better service to their customers. We usetangible assets from the financial statements as a proxy for cost of capital(Min& Joo, 2006). Our second input is cost of laborwhich is defined as thecost of employee'swages and benefits tomaintain superior service (Duttaet al., 1999). This labor cost includes the cost of recruiting and retaininghigh quality employees. We use remuneration (salaries and wages) ofemployees as a proxy for cost of labor (Min & Joo, 2006). High quality ofmanpowerwith tremendous functional and domain knowledge is used asa source of competitive edge by logistics firms. Use of such archival hardfinancialmeasuresare also supported inproductivity literatureon logistics
Fig. 5. Framework to measur
firms (see Abrahamsson & Aronsson, 1999 for a review on how financialmeasures are used alongwith engineeringmeasures like delivery quality,transit time, capacity utilization and transportation cost per unit).
So, we use the following operations frontier function:
Cost of operations = g cost of capital; cost of laborð Þ ð3Þ
Operations capability is the closeness of the firm to the cost frontier.We use input oriented constant return to scale (CRS) DEA model(Cooperet al., 2006) tomeasure theefficiencyof such transformation forboth the efficient and the inefficient group of firms. The DEA efficiencyscore measures operations capability of each firm (see Fig. 5). We alsomeasure relative operations capability of each firm defined as
Rel OCð Þi = OCð Þi =Xmi=1
OCð Þi =m !
ð4Þ
where (Rel_OC)i=relative operations capability of ith firm
(OC)i=operations capability of the ith firmm=number of firms in each group (efficient and inefficient).
3.5. Measuring performance
Studies on business performance measurement have consideredboth the financial measures such as sales, profit margin, return oninvestments (Song, Benedetto et al., 2007; Song, Droge et al., 2005)and non-financial measures like customer orientation, competitororientation, customer satisfaction, market effectiveness (Olson, Slater,& Hult, 2005; Vorhies & Morgan, 2005) to measure firm performance.In this study, we focus on the financial measure of performance forlogistics firms. Specifically, we consider profitability as a measure oflogistics firms' business performance. We use operating profit as anindicator of the firm's profitability as it best reflects the efficiency of
e operations capability.

Table 1Variables and their measures.
Variables Measures (in GBP £)
Marketing capabilityResources Stock of marketing expenditure Sales, general and administrative expenses (SGA)
Intangible resources Intangible assetsRelationship expenditure Cost of receivablesInstalled customer base Sales growth
Objectives Sales Turnover
Operations capabilityResources Cost of capital Tangible assets
Cost of labor RemunerationObjectives Cost of operations Cost of sales
Diversification strategyService diversification Sectoral concentration Number of sectorsInternational diversification Foreign market concentration Number of foreign subsidiaries
Business performance Profitability Operating profit
EfficiencyInputs Assets Total assets
Working capital Actual valueOutputs Return on assets Actual value (%)
Return on capital employed Actual value (%)
324 P. Nath et al. / Industrial Marketing Management 39 (2010) 317–329
the firm in its resource-output transformation (Min & Joo, 2006). Wealso measure relative performance of each firm defined as
Rel Perfð Þi = Perfð Þi=Xmi=1
Perfð Þi =m !
ð5Þ
where (Rel_Perf)i=relative performance of ith firm
(Perf)i=performance of the ith firmm=number of firms in each group (efficient and inefficient).
3.6. Measuring diversification strategies
Diversification (both product/service and international/geo-graphic) is often measured in strategic management literature byusing measures like entropy (Palepu, 1985) or Herfindahl Index(Chakrabarti et al., 2007). Application of such measures requiresinformation on market share (in terms of sales value) of the variousproducts/services offered by the firm or the geographical markets inwhich the firm operates. In our case, such information on sales figuresaccording to service portfolio or geographical market is not available.So, for service diversification, we measured the actual number ofsectors like automotive, clothing, food retail, non-food retail, buildingmaterials inwhich the firm operates. We collected this information onindividual firm's portfolio or sectoral concentration from their annualreports and websites. For international diversification, we use thenumber of foreign subsidiaries of the firm. The number of globalmarket regions in which a firm operates is indicated by its number offoreign subsidiaries (Narasimhan & Kim, 2002). So, a firm operating inmore sectors or having bigger service portfolio is considered to havegreater service diversification, and firm having more number offoreign subsidiaries is considered to have greater internationaldiversification. We also measure relative diversification level of eachfirm defined as:
Rel Divð Þi = Divð Þi=Xmi=1
Divð Þi =m !
ð6Þ
where (Rel_Div)i=relative diversification level of ith firm
(Div)i=diversification level of the ith firmm=number of firms in each group (efficient and inefficient).
This measure is calculated for both service diversification andinternational diversification. Since, sales figures of firms for eachsector in which they operate or each geographical market in whichthey operate is not available publicly, so an entropymeasure (like ratioof sales in individual sector to total sales) cannot be computed. Werather use the diversification scores as measured by Eq. (6) as a proxyfor the diversification entropy as it measures the level of diversifica-tion strategy of each firm relative to the industry average.
3.7. Hypotheses testing
We estimate the relationship between functional capabilities,diversification strategies, and firm's overall business performanceusing the following least square regression equation:
Rel Perf = βo + β1Rel MC + β2Rel OC + β3Rel SERVDIV
+ β4Rel INTDIV + e
ð7Þ
where Rel_Perf=relative performance of firms (measured by relativeprofitability)
Rel_MC=relative marketing capabilityRel_OC=relative operations capabilityRel_SERVDIV=relative service diversification strategyRel_INTDIV=relative international diversification strategy
Since, we use frontier function to estimate the performance of afirm relative to its industry benchmarks, so we use relative figures inthe above equation. Table 1 summarizes our choice of functionalresources, capabilities, their output objectives, business performance,diversification strategy and the variables to measure firm efficiencywith their operationalization. All the variables are measured in poundsterling except the diversificationmeasures which are number of unitsand the ratios expressed in form of percentage.
4. Results
We followed a three-stage approach in our data analysis. In stage one,we use DEA efficiency frontier function to classify the logistics firms intoefficient and inefficient group relative to the industry frontier. In thesecond stage, we again use DEA efficiency frontier function to measuremarketing and operations capability of each firm relative to the industryfrontier. This is done for both the efficient and the inefficient group of
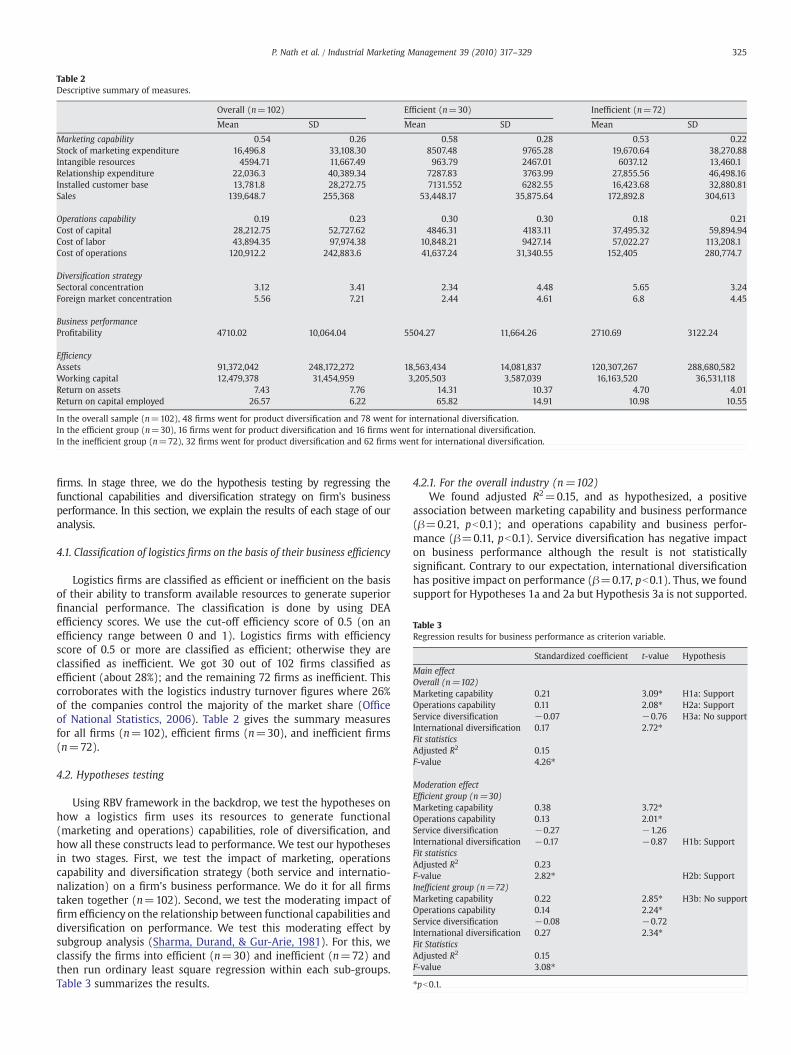
Table 2Descriptive summary of measures.
Overall (n=102) Efficient (n=30) Inefficient (n=72)
Mean SD Mean SD Mean SD
Marketing capability 0.54 0.26 0.58 0.28 0.53 0.22Stock of marketing expenditure 16,496.8 33,108.30 8507.48 9765.28 19,670.64 38,270.88Intangible resources 4594.71 11,667.49 963.79 2467.01 6037.12 13,460.1Relationship expenditure 22,036.3 40,389.34 7287.83 3763.99 27,855.56 46,498.16Installed customer base 13,781.8 28,272.75 7131.552 6282.55 16,423.68 32,880.81Sales 139,648.7 255,368 53,448.17 35,875.64 172,892.8 304,613
Operations capability 0.19 0.23 0.30 0.30 0.18 0.21Cost of capital 28,212.75 52,727.62 4846.31 4183.11 37,495.32 59,894.94Cost of labor 43,894.35 97,974.38 10,848.21 9427.14 57,022.27 113,208.1Cost of operations 120,912.2 242,883.6 41,637.24 31,340.55 152,405 280,774.7
Diversification strategySectoral concentration 3.12 3.41 2.34 4.48 5.65 3.24Foreign market concentration 5.56 7.21 2.44 4.61 6.8 4.45
Business performanceProfitability 4710.02 10,064.04 5504.27 11,664.26 2710.69 3122.24
EfficiencyAssets 91,372,042 248,172,272 18,563,434 14,081,837 120,307,267 288,680,582Working capital 12,479,378 31,454,959 3,205,503 3,587,039 16,163,520 36,531,118Return on assets 7.43 7.76 14.31 10.37 4.70 4.01Return on capital employed 26.57 6.22 65.82 14.91 10.98 10.55
In the overall sample (n=102), 48 firms went for product diversification and 78 went for international diversification.In the efficient group (n=30), 16 firms went for product diversification and 16 firms went for international diversification.In the inefficient group (n=72), 32 firms went for product diversification and 62 firms went for international diversification.
Table 3Regression results for business performance as criterion variable.
Standardized coefficient t-value Hypothesis
Main effectOverall (n=102)Marketing capability 0.21 3.09⁎ H1a: SupportOperations capability 0.11 2.08⁎ H2a: SupportService diversification −0.07 −0.76 H3a: No supportInternational diversification 0.17 2.72⁎Fit statisticsAdjusted R2 0.15F-value 4.26⁎
Moderation effectEfficient group (n=30)Marketing capability 0.38 3.72⁎Operations capability 0.13 2.01⁎Service diversification −0.27 −1.26International diversification −0.17 −0.87 H1b: SupportFit statisticsAdjusted R2 0.23F-value 2.82⁎ H2b: SupportInefficient group (n=72)Marketing capability 0.22 2.85⁎ H3b: No supportOperations capability 0.14 2.24⁎Service diversification −0.08 −0.72International diversification 0.27 2.34⁎Fit StatisticsAdjusted R2 0.15F-value 3.08⁎
⁎pb0.1.
325P. Nath et al. / Industrial Marketing Management 39 (2010) 317–329
firms. In stage three, we do the hypothesis testing by regressing thefunctional capabilities and diversification strategy on firm's businessperformance. In this section, we explain the results of each stage of ouranalysis.
4.1. Classification of logistics firms on the basis of their business efficiency
Logistics firms are classified as efficient or inefficient on the basisof their ability to transform available resources to generate superiorfinancial performance. The classification is done by using DEAefficiency scores. We use the cut-off efficiency score of 0.5 (on anefficiency range between 0 and 1). Logistics firms with efficiencyscore of 0.5 or more are classified as efficient; otherwise they areclassified as inefficient. We got 30 out of 102 firms classified asefficient (about 28%); and the remaining 72 firms as inefficient. Thiscorroborates with the logistics industry turnover figures where 26%of the companies control the majority of the market share (Officeof National Statistics, 2006). Table 2 gives the summary measuresfor all firms (n=102), efficient firms (n=30), and inefficient firms(n=72).
4.2. Hypotheses testing
Using RBV framework in the backdrop, we test the hypotheses onhow a logistics firm uses its resources to generate functional(marketing and operations) capabilities, role of diversification, andhow all these constructs lead to performance. We test our hypothesesin two stages. First, we test the impact of marketing, operationscapability and diversification strategy (both service and internatio-nalization) on a firm's business performance. We do it for all firmstaken together (n=102). Second, we test the moderating impact offirm efficiency on the relationship between functional capabilities anddiversification on performance. We test this moderating effect bysubgroup analysis (Sharma, Durand, & Gur-Arie, 1981). For this, weclassify the firms into efficient (n=30) and inefficient (n=72) andthen run ordinary least square regression within each sub-groups.Table 3 summarizes the results.
4.2.1. For the overall industry (n=102)We found adjusted R2=0.15, and as hypothesized, a positive
association between marketing capability and business performance(β=0.21, pb0.1); and operations capability and business perfor-mance (β=0.11, pb0.1). Service diversification has negative impacton business performance although the result is not statisticallysignificant. Contrary to our expectation, international diversificationhas positive impact on performance (β=0.17, pb0.1). Thus, we foundsupport for Hypotheses 1a and 2a but Hypothesis 3a is not supported.
326 P. Nath et al. / Industrial Marketing Management 39 (2010) 317–329
4.2.2. Test of moderation — for efficient firms (n=30)We found adjusted R2=0.23, and as hypothesized a positive
association between marketing capability and business performance(β=0.38, pb0.1), operations capability and business performance(β=0.13, pb0.1). Thus, we find the impact of marketing capability onbusiness performance is more than the impact of operations capabilityfor efficient firms. Both service diversification and internationaldiversification has negative impact on business performance althoughthe results are not statistically significant.
4.2.3. Test of moderation — for inefficient firms (n=72)We found adjusted R2=0.15, and as hypothesized both marketing
(β=0.22, pb0.1) and operations capability (β=0.14, pb0.1) havesignificant positive impact on a firm's business performance. When wecompare the results of the impact of marketing capability on thebusiness performance for the efficient group (β=0.38, pb0.1) andinefficient group (β=0.22, pb0.1), we find that marketing capabilityhasmore impact in case of efficient groupoffirms. Thus,wefind supportfor Hypothesis 1b. Similarly, whenwe compare the impact of operationscapability on the business performance for the efficient group (β=0.13,pb0.1) and inefficient group (β=0.14, pb0.1), we find that operationscapability has more impact for inefficient group. Thus, we find supportfor Hypothesis 2b. Service diversification has a negative impact onbusiness performance although the result is not statistically significant.International diversification has significant positive impact on businessperformance (β=0.27,pb0.1).Whenwe compare the relative impact ofservicediversification for efficientfirms (β=−0.27, not significant) andinefficient firms (β=−0.08, n.s), we do not find that profitabilityefficiency of firms to have any moderating effect on diversification andperformance linkage. Similarly, whenwe compare the relative impact ofinternational diversification for efficient firms (β=−0.17, n.s) andinefficientfirms (β=0.27, pb0.1), we donot find anymoderation effect.Thus, contrary to our expectations, Hypothesis 3b is not supported.
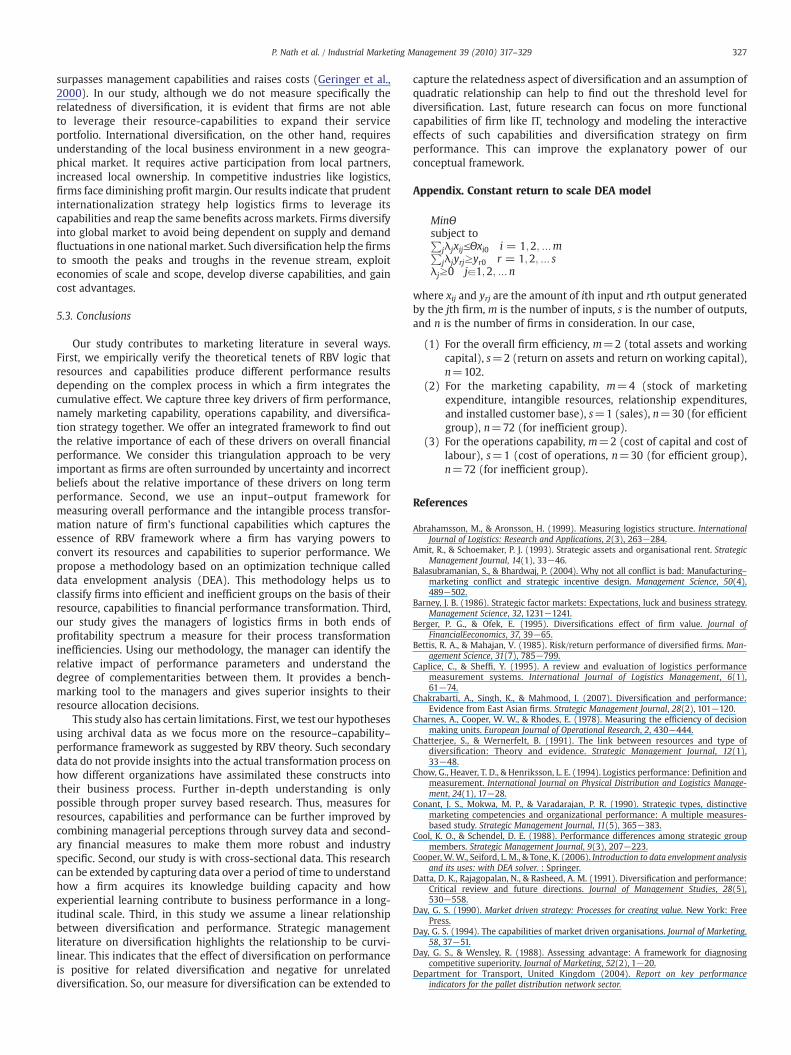
5. Discussions, implications, and conclusions
5.1. Functional capabilities and performance
Results show overall, marketing capabilities dominate firm'sbusiness performance. This is consistent with previous studies likeDutta et al. (1999), Kotabe et al. (2002), Song et al. (2005), Vorhiesand Morgan (2005). Marketing capability of a firm particularly, inbusiness to business service sector like logistics industry depends onits ability to understand customer needs and create long termrelationships. This is possible if the firm is able to deploy its marketingresources optimally to generate superior customer value using itsunique, inimitable marketing capability. In an industrial marketsetting, marketing assets like stock of marketing expenditures whichare the expenses incurred by a firm to improve its sales effort,relationship expenditures to build and maintain trade relationshipsare extremely crucial. Moreover, the majority of the business isgenerated through the network of existing customer base and thus theimportance of building up brand equity becomes more critical. So, in ahighly competitive industry like logistics, better marketing capabilitylead to competitive advantage for firms and help them to achievesuperior business performance.
Our results show that operations capability has a significant impacton a firm's business performance. This reiterates the importance ofinfrastructure development like fleet upgradation, extension of dis-tribution network, and improvement of technology usage for logisticsfirms. Thus, superior performance in operations function can enhancelogistics firm's ability to increase connectivity with their customers andsuppliers, provide more flexibility in operations and improve the valueproposition in the entire supply chain. So, we can conclude that anefficient integration of marketing and operations functions leads toimproved organizational performance. This is consistent with previous
research on the integrative role of these functional capabilities onbusiness performance (Kelly & Flores, 2002).
Our study indicates that marketing capability has more impact onbusinessperformance forfirmswhichare efficient. Our results shows forlogistics firms which have better resource-performance transformationabilities, marketing capabilities dominate over operations capabilities.Firms with superior marketing capabilities are proactive in under-standing changing customer requirements in terms improved servicestandards. Suchfirmswith their inherentmarket knowledge offer bettervalue creation for the customers. This corroborates with the “marketorientation” literature which suggests that firms with stronger marketorientation develops better marketing capabilities, and it positivelyinfluence business performance (Jaworski &Kohli,1993;Narver& Slater,1990). Market-driven firms have better marketing capabilities than theothers and generate superior performance (Vorhies & Morgan, 2005).Superiority ofmarketingover operations capability is alsohighlighted inother business to business sectors like high technology industry (Duttaet al., 1999; Narsimhan et al., 2006).
For logistics firm managers, the implication is clear: althoughmarketing capability has a stronger impact on business performancebut successful integration of functional capabilities is the key tosuccess. Careful deployment of resources on marketing activities likeadvertisement, trade promotion , and customer relationship manage-ment develop a powerful marketing strategy and investment indeveloping the infrastructure is necessary to build operationsefficiency to meet customer demand. Superior marketing capabilityis essential for achieving maximum financial performance andimproving efficiency. Inefficient logistics firms have relatively largerexpenditures for building their operations capabilities (cost ofoperations/turnover=0.88) compared to efficient firms (0.77).Since, the impact of functional capabilities on performance differbetween firms on the broad range of efficiency spectrum, it hastremendous implication on resource allocation decision. Inefficientfirms should invest more resources on building their marketingcapabilities so that they can expand their market, communicate withcurrent and potential customers in a better way, and be competitive inthe long run. Over reliance on operations capability like buildinginfrastructure cannot give firms the extra edge as marketing capabilityis found to be the key to success.
5.2. Diversification strategies and performance
Our results show overall diversification has a negative impact onlogistics firm's performance. This is evident for both the efficient andthe inefficient group which suggests that firm input–output transfor-mation efficiency does not moderate the impact of diversificationstrategy on firm performance. This is consistent with diversificationliterature which emphasize that not all firms improve their perfor-mance through diversification (Chakrabarti et al., 2007; Ramanujam &Varadarajan, 1989). Diversification (both in terms of product/serviceand geographical territory) require assimilation of extensive knowl-edge in terms of new product/service development, understandingcultures in the newmarkets, and transfer of resources between parentand the partner companies. This is consistent with RBV literaturewhich highlights capabilities transfer like business knowledgebetween parent and partners is a complex process (Chatterjee &Wernerfelt, 1991; Fang et al., 2007). However, our study finds negativeimpact of service diversification and positive impact of internationaldiversification on business performance under certain context. This isconsistent with extant literature (Narasimhan & Kim, 2002; Tallman &Li, 1996). Service diversification requires leveraging firm's strategicresources and functional capabilities across the product/servicespectrum. In case of related service diversification, this portfolioexpansion remains within the scope of a firm's resource-capabilitiesand it can achieve economies of scale and better performance. On theother hand, in case of unrelated service diversification, the scope
327P. Nath et al. / Industrial Marketing Management 39 (2010) 317–329
surpasses management capabilities and raises costs (Geringer et al.,2000). In our study, although we do not measure specifically therelatedness of diversification, it is evident that firms are not ableto leverage their resource-capabilities to expand their serviceportfolio. International diversification, on the other hand, requiresunderstanding of the local business environment in a new geogra-phical market. It requires active participation from local partners,increased local ownership. In competitive industries like logistics,firms face diminishing profit margin. Our results indicate that prudentinternationalization strategy help logistics firms to leverage itscapabilities and reap the same benefits across markets. Firms diversifyinto global market to avoid being dependent on supply and demandfluctuations in one nationalmarket. Such diversification help the firmsto smooth the peaks and troughs in the revenue stream, exploiteconomies of scale and scope, develop diverse capabilities, and gaincost advantages.
5.3. Conclusions
Our study contributes to marketing literature in several ways.First, we empirically verify the theoretical tenets of RBV logic thatresources and capabilities produce different performance resultsdepending on the complex process in which a firm integrates thecumulative effect. We capture three key drivers of firm performance,namely marketing capability, operations capability, and diversifica-tion strategy together. We offer an integrated framework to find outthe relative importance of each of these drivers on overall financialperformance. We consider this triangulation approach to be veryimportant as firms are often surrounded by uncertainty and incorrectbeliefs about the relative importance of these drivers on long termperformance. Second, we use an input–output framework formeasuring overall performance and the intangible process transfor-mation nature of firm's functional capabilities which captures theessence of RBV framework where a firm has varying powers toconvert its resources and capabilities to superior performance. Wepropose a methodology based on an optimization technique calleddata envelopment analysis (DEA). This methodology helps us toclassify firms into efficient and inefficient groups on the basis of theirresource, capabilities to financial performance transformation. Third,our study gives the managers of logistics firms in both ends ofprofitability spectrum a measure for their process transformationinefficiencies. Using our methodology, the manager can identify therelative impact of performance parameters and understand thedegree of complementarities between them. It provides a bench-marking tool to the managers and gives superior insights to theirresource allocation decisions.
This study also has certain limitations. First, we test our hypothesesusing archival data as we focus more on the resource–capability–performance framework as suggested by RBV theory. Such secondarydata do not provide insights into the actual transformation process onhow different organizations have assimilated these constructs intotheir business process. Further in-depth understanding is onlypossible through proper survey based research. Thus, measures forresources, capabilities and performance can be further improved bycombining managerial perceptions through survey data and second-ary financial measures to make them more robust and industryspecific. Second, our study is with cross-sectional data. This researchcan be extended by capturing data over a period of time to understandhow a firm acquires its knowledge building capacity and howexperiential learning contribute to business performance in a long-itudinal scale. Third, in this study we assume a linear relationshipbetween diversification and performance. Strategic managementliterature on diversification highlights the relationship to be curvi-linear. This indicates that the effect of diversification on performanceis positive for related diversification and negative for unrelateddiversification. So, our measure for diversification can be extended to
capture the relatedness aspect of diversification and an assumption ofquadratic relationship can help to find out the threshold level fordiversification. Last, future research can focus on more functionalcapabilities of firm like IT, technology and modeling the interactiveeffects of such capabilities and diversification strategy on firmperformance. This can improve the explanatory power of ourconceptual framework.
Appendix. Constant return to scale DEA model
MinΘsubject toP
jλjxijVΘxi0 i = 1;2; N mPjλjyrjzyr0 r = 1;2; N s
λjz0 ja1;2; N n
where xij and yrj are the amount of ith input and rth output generatedby the jth firm, m is the number of inputs, s is the number of outputs,and n is the number of firms in consideration. In our case,
(1) For the overall firm efficiency, m=2 (total assets and workingcapital), s=2 (return on assets and return onworking capital),n=102.
(2) For the marketing capability, m=4 (stock of marketingexpenditure, intangible resources, relationship expenditures,and installed customer base), s=1 (sales), n=30 (for efficientgroup), n=72 (for inefficient group).
(3) For the operations capability, m=2 (cost of capital and cost oflabour), s=1 (cost of operations, n=30 (for efficient group),n=72 (for inefficient group).
References
Abrahamsson, M., & Aronsson, H. (1999). Measuring logistics structure. InternationalJournal of Logistics: Research and Applications, 2(3), 263−284.
Amit, R., & Schoemaker, P. J. (1993). Strategic assets and organisational rent. StrategicManagement Journal, 14(1), 33−46.
Balasubramanian, S., & Bhardwaj, P. (2004). Why not all conflict is bad: Manufacturing–marketing conflict and strategic incentive design. Management Science, 50(4),489−502.
Barney, J. B. (1986). Strategic factor markets: Expectations, luck and business strategy.Management Science, 32, 1231−1241.
Berger, P. G., & Ofek, E. (1995). Diversifications effect of firm value. Journal ofFinancialEeconomics, 37, 39−65.
Bettis, R. A., & Mahajan, V. (1985). Risk/return performance of diversified firms. Man-agement Science, 31(7), 785−799.
Caplice, C., & Sheffi, Y. (1995). A review and evaluation of logistics performancemeasurement systems. International Journal of Logistics Management, 6(1),61−74.
Chakrabarti, A., Singh, K., & Mahmood, I. (2007). Diversification and performance:Evidence from East Asian firms. Strategic Management Journal, 28(2), 101−120.
Charnes, A., Cooper, W. W., & Rhodes, E. (1978). Measuring the efficiency of decisionmaking units. European Journal of Operational Research, 2, 430−444.
Chatterjee, S., & Wernerfelt, B. (1991). The link between resources and type ofdiversification: Theory and evidence. Strategic Management Journal, 12(1),33−48.
Chow, G., Heaver, T. D., & Henriksson, L. E. (1994). Logistics performance: Definition andmeasurement. International Journal on Physical Distribution and Logistics Manage-ment, 24(1), 17−28.
Conant, J. S., Mokwa, M. P., & Varadarajan, P. R. (1990). Strategic types, distinctivemarketing competencies and organizational performance: A multiple measures-based study. Strategic Management Journal, 11(5), 365−383.
Cool, K. O., & Schendel, D. E. (1988). Performance differences among strategic groupmembers. Strategic Management Journal, 9(3), 207−223.
Cooper,W.W., Seiford, L. M., & Tone, K. (2006). Introduction to data envelopment analysisand its uses: with DEA solver. : Springer.
Datta, D. K., Rajagopalan, N., & Rasheed, A. M. (1991). Diversification and performance:Critical review and future directions. Journal of Management Studies, 28(5),530−558.
Day, G. S. (1990). Market driven strategy: Processes for creating value. New York: FreePress.
Day, G. S. (1994). The capabilities of market driven organisations. Journal of Marketing,58, 37−51.
Day, G. S., & Wensley, R. (1988). Assessing advantage: A framework for diagnosingcompetitive superiority. Journal of Marketing, 52(2), 1−20.
Department for Transport, United Kingdom (2004). Report on key performanceindicators for the pallet distribution network sector.
328 P. Nath et al. / Industrial Marketing Management 39 (2010) 317–329
Desarbo, W. S., Benedetto, C. A. D., Song, M., & Sinha, I. (2005). Revisiting the Miles andSnow strategic framework: Uncovering interrelationships between strategic types,capabilities, environmental uncertainty, and firm performance. Strategic Manage-ment Journal, 26, 47−74.
Donthu, N., Hershberger, E. K., & Osmonbekov, T. (2005). Benchmarking marketingproductivity using data envelopment analysis. Journal of Business Research, 58(11),1474−1482.
Dutta, S., Narashiman, O., & Surendra, R. (1999). Success in high technology markets: Ismarketing capability critical? Marketing Science, 18(4), 547−568.
Fang, Y., Wade, M., Delios, A., & Beamish, P. W. (2007). International diversification,subsidiary performance, and the mobility of knowledge resources. StrategicManagement Journal, 28, 1053−1064.
Geringer, J. M., Tallman, S., & Olsen, D. M. (2000). Product and internationaldiversification among Japanese multinational firms. Strategic Management Journal,21(1), 51−80.
Ghoshal, S. (1987). Global strategy: An organizing framework. Strategic ManagementJournal, 8(5), 425−440.
Goerzen, A., & Beamish, P. W. (2003). Geographic scope and multinational enterpriseperformance. Strategic Management Journal, 24, 1289−1306.
Gonzalez-Benito, O., & Gonzalez-Benito, J. (2005). Cultural vs. operationalmarket orientation and objective vs. subjective performance: Perspectiveof production and operations. Industrial Marketing Management, 34, 797−830.
Grant, R. B. (1991). A resource based theory of competitive advantage: Implications forstrategy formulation. California Management Review, 33(3), 114−135.
Grant, R. M., Jammine, A. P., & Thomas, H. (1988). Diversity, diversification andprofitability among British manufacturing company 1972–1984. Academy ofManagement Review, 31, 771−801.
Hausmana, W. H., Montgomery, D. B., & Roth, A. V. (2002). Why should marketing andmanufacturing work together?. Some exploratory empirical results. Journal ofOperations Management, 20, 241−257.
Hayes, R. H., Wheelwright, S. C., & Clark, K. B. (1988). Dynamic manufacturing.NewYork:Free Press.
Hayes, R. H., & Pisano, G. P. (1996). Manufacturing strategy at the intersection of twoparadigm shifts. Production and Operations Management, 5(1), 25−41.
Hitt, M. A., Hoskisson, R. E., & Kim, H. (1997). International diversification: Effects ofinnovation and firm performance in product diversified firms. Academy ofManagement Journal, 40, 767−798.
Ho, T. H., & Tang, C. S. (2004). Introduction to the special issue on marketing andoperations management interfaces and coordination. Management Science, 50(4),430-430.
Ho, T. H., & Zheng, Y. S. (2004). Setting customer expectations in service delivery.Management Science, 50(4), 479−488.
Hoopes, D. G. (1999). Measuring geographic diversification and product diversification.Management International Review, 39(3), 277−302.
Jaworski, B. J., & Kohli, A. K. (1993). Market orientation: Antecedents and consequences.Journal of Marketing, 57, 53−70.
Karmakar, U. S. (1996). Integrative research in marketing and operations management.Journal of Marketing Research, 33, 125−133.
Kelly, S. W. O., & Flores, B. E. (2002). The integration of manufacturing and marketing/sales decisions: Impact on organizational performance. Journal of OperationsManagement, 20, 221−240.
Kim, W. C., Hwang, P., & Burgers, W. P. (1993). Multinationals' diversification and therisk return trade-off. Strategic Management Journal, 14, 275−287.
Kotabe, M., Srinivasan, S. S., & Aulakh, P. S. (2002). Multinationality and firmperformance: The moderating role of R&D and marketing capabilities. Journal ofInternational Business Studies, 33(1), 79−97.
Kumar, V., Ganesh, J., & Echambadi, R. (1998). Cross-national diffusion research: Whatdo we know and how certain are we? Journal of Product Innovation Management, 15,255−268.
Liebermann, M. B., & Dhawan, R. (2005). Assessing the resource base of Japanese and USauto producers: A stochastic frontier function production approach. ManagementScience, 51(7), 1060−1075.
Lu, J. W., & Beamish, P. W. (2001). The internationalisation and performance of SMEs.Strategic Management Journal, 22(6/7), 598−609.
Luo, X., & Donthu, N. (2001). Benchmarking advertising efficiency. Journal of AdvertisingResearch, 41(6), 7−18.
Luo, X., & Donthu, N. (2006). Marketing's credibility: A longitudinal investigation ofmarketing communication productivity and shareholder value. Journal of Market-ing, 70(4), 70−91.
Makadok, R. (2001). Toward a synthesis of the resource-based and dynamic-capabilitiesviews of rent creation. Strategic Management Journal, 22, 387−401.
Malhotra, M. K., & Sharma, S. (2002). Spanning the continuum between marketing andoperations. Journal of Operations Management, 20(3), 209−219.
McDaniel, S. W., & Kolari, J. W. (1987). Marketing strategy implications of the Miles andSnow strategic typology. Journal of Marketing, 51, 19−30.
Mentzer, J. T., & Konrad, B. P. (1991). An efficiency/effectiveness approach to logisticsperformance analysis. Journal of Business Logistics, 12(1), 33−61.
Mezias, J. M., & Starbuck, W. H. (2003). Studying the accuracy of managers' perceptions:A research odyssey. British Journal of Management, 14(1), 3−17.
Min, H., & Joo, S. J. (2006). Benchmarking the operational efficiency of third partylogistics providers using data envelopment analysis. Supply Chain Management: AnInternational Journal, 11(3), 259−265.
Montgomery, E. (1994). “Innovation + outsourcing = big success”. ManagementReview, 83(9), 17−21.
Montgomery, C. A., & Wernerfelt, B. (1988). Diversification, Ricardian rents, and Tobin'sq. Journal of Economics, 19, 623−632.
Nachum, L. (2004). Geographic and industrial diversification of developing countryfirms. Journal of Management Studies, 41(2), 272−282.
Narasimhan, R., & Kim, S. W. (2002). Effects of supply chain integration on therelationship between diversification and performance: Evidence from Japanese andKorean firms. Journal of Operations Management, 20, 303−323.
Narsimhan, O., Rajiv, S., &Dutta, S. (2006). Absorptive capacity inhigh technologymarkets:The competitive advantage of the haves.Marketing Science, 25(5), 510−524.
Narver, J. C., & Slater, S. F. (1990). The effect of a market orientation on businessprofitability. Journal of Marketing, 54, 20−35.
Novack, R. A., Rinehart, L. M., & Langley, C. J. (1995). Creating logistics value: Themes forthe future. Oak Brook: Council of Logistics Management.
Novack, R. A., & Thomas, D. J. (2004). The challenges of implementing the perfect orderconcept. Transportation Journal, 43(1), 5−16.
Office of National Statistics (2006). Report on focus on freight. United Kingdom:Department for Transport.
Olson, E. M., Slater, S. F., & Hult, T. M. (2005). The performance implications of fit amongbusiness strategy, marketing organization structure, and strategic behavior. Journalof Marketing, 69(July), 49−65.
Ortega, M. J. R., & Villaverde, P. M. G. (2008). Capabilities and competitive tacticsinfluences on performance: Implications of the moment of entry. Journal of BusinessResearch, 61, 332−345.
Palepu, K. (1985). Diversification strategy, profit performance, and the entropymeasure. Strategic Management Journal, 6(3), 239−255.
Palich, L. E., Cradinal, L. B., & Miller, C. C. (2000). Curvilinearity in the diversification-performance linkage: An examination of over three decades of research. StrategicManagement Journal, 21(2), 155−174.
Palmatier, R. W., Dant, R. P., & Grewal, D. (2007). A comparative longitudinal analysis oftheoretical perspectives of interorganizational relationship performance. Journal ofMarketing, 71, 172−194.
Peteraf, M. A. (1993). The cornerstones of competitive advantage: A resource-basedview. Strategic Management Journal, 14(3), 179−191.
Piercy, N. (2007). Framing the problematic relationship between marketing andoperations function. Journal of Strategic Marketing, 15, 185−207.
Porter, M. (1985). Competitive advantage. New York: Free Pres.Prahalad, C. K., & Hamel, G. (1990). The core competence of the corporation. Harvard
Business Review, 68(3), 79−91.Ramanujam, V., & Varadarajan, P. (1989). Research on corporate diversification: A
synthesis. Strategic Management Journal, 10, 523−551.Roth, A. V., & Miller, J. G. (1990). Manufacturing strategy, manufacturing strength,
managerial success, and economic outcomes. In J. E. Ettlie, M. C. Burstein, &A. Fiegenbaum (Eds.), Manufacturing Strategy (pp. 97−108). Norwell, Mass.:Kluwer Academic Publishers.
Rumelt, R. P. (1974). Strategy, structure and economic performance: Division of research.Boston: Harvard Business School.
Sawhney, R., & Piper, C. (2002). Value creation through enriched marketing–operationsinterfaces: an empirical study in the printed circuit board industry. Journal ofOperations Management, 20(3), 259−272.
Sharma, S., Durand, R., & Gur-Arie, O. (1981). Identification and analysis of moderatorvariables. Journal of Marketing Research, 18, 301-300.
Slotegraff, R. J., Moorman, C., & Inman, J. J. (August 2003). The role of firm resources inreturns to market deployment. Journal of Marketing Research, 305−309.
Song, M., Benedetto, A. D., & Nason, R. W. (2007). Capabilities and financialperformance: The moderating effect of strategic type. Journal of the Academy ofMarketing Science, 35, 18−34.
Song, M., Droge, C., Hanvanich, S., & Calantone, R. (2005). Marketing and technologyresource complementarity: An analysis of their interaction effect in two environ-mental contexts. Strategic Management Journal, 26(3), 259−276.
Song, M., Nason, R.W., & Benedetto, A. D. (2008). Distinctivemarketing and informationtechnology capabilities and strategic types: A cross national investigation. Journalof International Marketing, 16(1), 4−38.
Tallman, S., & Li, J. (1996). The effects of international diversityandproduct diversity on theperformance of multinational firms. Academy of Management Journal, 39, 179−196.
Tan, K. C., Kannan, V. R., & Narasimhan, R. (2007). The impact of operations capabilityon firm performance. International Journal of Production Research, 45(21),5135−5156.
Tatikonda, M. V., & Montoya-Weiss, M. M. (2001). Integrating operations and marketingperspectives of product innovation: The influence of organizational process factors andcapabilities on development performance. Management Science, 47(1), 151−172.
Teece, D. J., Pisano, G., & Shuen, A. (1997). Dynamic capabilities and strategicmanagement. Strategic Management Journal, 18(7), 509−533.
Tsoukas, H. (1996). The firm as a distributed knowledge system: A constructionistapproach. Strategic Management Journal, 17, 11−25.
Vorhies, D. W., & Morgan, N. A. (2003). A configuration theory assessment of marketingorganization fit with business strategy and its relationship with marketingperformance. Journal of Marketing, 67, 100−115.
Vorhies, D. W., & Morgan, N. A. (2005). Benchmarking marketing capabilities forsustainable competitive advantage. Journal of Marketing, 69, 80−94.
Wernerfelt, B. (1984). A resource-based view of the firm. Strategic Management Journal,5(2), 171−180.
Wind, Y. (2005). Marketing as an engine of business growth: A cross functionalperspective. Journal of Business Research, 58(7), 863−872.
Wu, F., Yeniyurt, S., Kim, D., & Cavusgil, S. T. (2006). The impact of informationtechnology on supply chain capabilities and firm performance: A resource-basedview. Industrial Marketing Management, 35(4), 493−504.
Zhu, J. (2000). Multi-factor performance measure model with an application to Fortune500 companies. European Journal of Operational Research, 123, 105−124.
329P. Nath et al. / Industrial Marketing Management 39 (2010) 317–329
Prithwiraj Nath is a Lecturer in Marketing at the University of Nottingham BusinessSchool, U.K. His research area includes services marketing, marketing–operationsinterface, marketing performance measurement, impact of marketing on the firmfinancials, marketing performance measurement and benchmarking, marketingdecision models, and e-logistics. He specializes in application of operational researchtools to solve marketing problems. His research has appeared in several top-ratedMarketing and Operations journals such as Industrial Marketing Management, Journalof Services Marketing, International Journal of Bank Marketing, European Journal ofMarketing and Journal of the Operational Research Society.
Subramanian Nachiappan is a visiting scholar at Nottingham university businessschool, Nottingham and serves as an Assistant Professor in Thiagarajar College ofEngineering, Madurai, India. His research interests are performance measurement,supply chain operations, modeling and analysis of manufacturing systems. He serves as areferee for various internationally reputed journals His research has appeared in EuropeanJournal of Operational Research, International Journal of Production Research, Journal ofAdvanced Manufacturing Systems, International Journal of Industrial and Systems Engineer-ing, International Journalof Logistics SystemManagementand International Journalof Serviceand Operations Management.
Ramakrishnan Ramanathan is working as an associate professor in operationsmanagement inNottinghamUniversity Business School, UK. His research interests includeoperations management, supply chains, energy, environment, transport and otherinfrastructure sectors, optimization, data envelopment analysis and the analytic hierarchyprocess. His research articles have appeared in Supply Chain Management, InternationalJournal of Operations & Production Management, European Journal of Operational Re-search, Computers & Operations Research, Journal of EnvironmentalManagement, EnergyEconomics, Transport Policy, Transportation Research, IEEE Transactions on Systems, Manand Cybernetics, and, IEEE Transactions on Power Systems.