Mathematical Simulation of Polymer Flooding in Complex Reservoirs
Upload
independentCategory
view
1download
0
This article was downloaded by: [Okechukwu Okogwu]On: 09 June 2013, At: 22:41Publisher: Taylor & FrancisInforma Ltd Registered in England and Wales Registered Number: 1072954 Registered office: MortimerHouse, 37-41 Mortimer Street, London W1T 3JH, UK
Zoology and EcologyPublication details, including instructions for authors and subscription information:http://www.tandfonline.com/loi/tzec20
The impact of flooding on water quality, zooplanktoncomposition, density and biomass in Lake Iyieke,Cross River-Floodplain, Southeastern NigeriaNkwuda G. Nwonumara a & Okechukwu I. Okogwu aa Department of Applied Biology , Ebonyi State University , Abakaliki , Ebonyi State ,NigeriaPublished online: 09 Jun 2013.
To cite this article: Nkwuda G. Nwonumara & Okechukwu I. Okogwu (2013): The impact of flooding on water quality,zooplankton composition, density and biomass in Lake Iyieke, Cross River-Floodplain, Southeastern Nigeria, Zoology andEcology, DOI:10.1080/21658005.2013.805015
To link to this article: http://dx.doi.org/10.1080/21658005.2013.805015
PLEASE SCROLL DOWN FOR ARTICLE
Full terms and conditions of use: http://www.tandfonline.com/page/terms-and-conditions
This article may be used for research, teaching, and private study purposes. Any substantial or systematicreproduction, redistribution, reselling, loan, sub-licensing, systematic supply, or distribution in any form toanyone is expressly forbidden.
The publisher does not give any warranty express or implied or make any representation that the contentswill be complete or accurate or up to date. The accuracy of any instructions, formulae, and drug dosesshould be independently verified with primary sources. The publisher shall not be liable for any loss, actions,claims, proceedings, demand, or costs or damages whatsoever or howsoever caused arising directly orindirectly in connection with or arising out of the use of this material.
The impact of flooding on water quality, zooplankton composition, density and biomass inLake Iyieke, Cross River-Floodplain, Southeastern Nigeria
Nkwuda G. Nwonumara and Okechukwu I. Okogwu*
Department of Applied Biology, Ebonyi State University, Abakaliki, Ebonyi State, Nigeria
(Received 18 February 2013; final version received 8 May 2013)
The physico-chemical parameters, zooplankton composition, density and biomass of Lake Iyieke (Cross River-Floodplain, Nigeria) were studied monthly from February to December 2011 during pre-flood (February–May), flood(June–August) and post-flood (September–December) periods. The study was aimed at evaluating the response ofzooplankton to seasonal flooding. Canonical correspondence analysis showed that temperature (28–35 °C), PO4-P (0.10–0.16 μg/L), pH (6.50–6.80), transparency (0.17–0.98m), conductivity (18.0–56.00 μS/cm) and total dissolved solids(8.50–28.00mg/L) were the main environmental variables that influenced zooplankton dynamics. Rotifers of the familiesCollothecidae, Collurellidae and the cladoceran Scapholeberi kingi were recorded in the lake for the first time. Rotiferswere dominant in the pre-flood period, while microcrustaceans were dominant in the flood and post-flood periods.Contrary to our expectations, species richness (56 species) and density (527 ind/L) peaked during the pre-flood and floodperiods, respectively. Based on our results and previous studies on the lake, we recommend undertaking a comprehensivestudy on this and other lakes within the Cross River basin in order to gain a clear understanding of the impact anthropo-genic activities (dams and dredging) and climatic factors (that could alter the intensity and duration of flood) could haveon zooplankton.
2011 metais buvo tiriami Iyieke ežero (Nigerija) fiziniai ir cheminiai parametrai, zooplanktono rūšinė sudėtis, tankumasir biomasė, imant mėginius kiekvieną mėnesį šių hidrologinių periodų metu: prieš potvynį (nuo vasario iki gegužėsmėnesio), potvynio metu (nuo birželio iki rugpjūčio mėnesio) ir po potvynio (nuo rugsėjo iki gruodžio mėnesio). Tyrimotikslas – nustatyti sezoninių potvynių poveikį zooplanktonui. Kanoninės koreliacijos analizė parodė, kad pagrindiniaizooplanktono dinamiką lemiantys aplinkos kintamieji buvo: vandens temperatūra (28–35 °C), PO4-P (0,10–0,16 μg/L),pH (6,50–6,80), skaidrumas (0,17–0,98m), laidumas (18,0–56,00 μS/cm) ir bendras ištirpusių kietųjų medžiagų kiekis(8,50–28,00mg/L). Ežere pirmą buvo aptikti Collothecidae ir Collurellidae šeimų žiuželiniai bei šakotaūsiai Scapholeberikingi. Žiuželiniai ežere vyravo prieš potvynį, mikroskopiniai vėžiagyviai potvynio metu ir po potvynio. Priešingai negutikėtasi, rūšių gausumas (56 rūšys) ir tankumas (527 ind/L) buvo maksimalūs prieš potvynį ir potvynio metu. Remdamie-si savo ankstesnių tyrimų rezultatais ir kitų autorių duomenimis, rekomenduojame tirti šį ir kitus Kroso upės baseinoežerus, įvertinant žmogaus veiklos (užtvankų statymas, dugno gilinimas) ir klimato veiksnių, galinčių pakeisti potvyniųintensyvumą ir trukmę, poveikį zooplanktonui.
Keywords: Lake Iyieke; water quality; flood; zooplankton; density; biomass
Introduction
Most tropical floodplain lakes are located near largerivers, which make them subject to seasonal floodingduring the wet season (Wetzel 2001). Flooding alters thequality of water in lakes by introducing cool, oxygen-and nutrient-rich water, and sometimes species from aninundating river (Ward and Tockner 2001). It also facili-tates the mixing of autochthonous materials within a lakeand extends its width (Hamilton and Lewis 1987;Okogwu and Ugwumba 2012). These changes in waterquality affect zooplankton community. Zooplankton isimportant in the aquatic food web, serving both as con-sumers of algae, bacteria and other micro-organisms andas prey to larger animals, such as fish (Infante and
Abella 1985). The composition and density of zooplank-ton species in a shallow water system can be influencedby several physical, chemical and biological factors(Hanazato and Dodson 1995). In general, environmentalfactors such as temperature and pH (Edmondson 1965),electrical conductivity (Mavuti 1990), salinity (Egborge1994), hydrology (Moss 1994), food quality and quantity(Ghadouani et al. 1998) and submerged aquatic vegeta-tion (Lauridsen et al. 1998) are known to affect the spe-cies composition and population density of zooplankton.The size of water bodies and their trophic state (Gannonand Stemberger 1978), and the successional stage(Hutchinson 1967), also influence the species composi-tion of zooplankton. Biotic factors such as competition
*Corresponding author. Email: [email protected]
Zoology and Ecology, 2013http://dx.doi.org/10.1080/21658005.2013.805015
Copyright � 2013 Nature Research Centre
Dow
nloa
ded
by [
Oke
chuk
wu
Oko
gwu]
at 2
2:41
09
June
201
3
and predation are recognised to play a major role inseasonal variation of zooplankton species composition(Zaret 1980; Hanley 1987; Agrawal 1998; Donald et al.2001; Hampton and Gilbert 2001; Shashikanth andVijaykumar 2008).
Studies on zooplankton of shallow floodplains in theAfrican continent are few and the information availableis mainly on south and east-African lakes (Hecky andFee 1981; Havens 2002). A few studies on west-Africanfloodplains, such as the study by Okogwu (2010), haveshown enormous seasonal changes in hydrobiology dueto flooding and water withdrawal. However, there is stilla gap in the knowledge of how these changes affect thespecies composition, density and diversity of zooplank-ton among flood episodes. Such information will invalu-ably contribute to ecologists’ understanding about thepossible effects of environmental stressors such asclimate change and excessive water withdrawal on theecology of these lakes. Therefore, this study was under-taken to evaluate the response of zooplankton to seasonalinundation in Lake Iyieke. We studied the speciescomposition, density and biomass of zooplankton duringthe pre-flood (February–May), flood (June–August) andpost-flood (September–December) periods. More specifi-cally, we hypothesised that flooding will increasezooplankton species richness and reduce density.
Study area
Lake Iyieke is a natural shallow floodplain lake (5°50′33.49 N, 7°56′ 40.88 E) located 50 m away from theCross River channel (Okogwu and Ugwumba 2012)(Figure 1). It is one of the numerous lakes within thedrainage basin of the Cross River system. Seasonalflooding of Lake Iyieke by the Cross River can bedivided into three distinct hydrologic periods: the pre-flood period (January–May), when the lake remains com-pletely separated from the river; the flood period (June–August), when the lake is inundated; and the post-floodperiod (September–December), when the flood recedes.Farming and fishing are the major anthropogenic activi-ties undertaken around and in the lake, all of which canaffect water quality.
Material and methods
Water samples for physico-chemical and zooplanktonanalyses were collected monthly from the littoral andpelagic zones of the lake from February to December,2011. The sampling period covered pre-flood, flood andpost-flood periods. Water depth was measured from per-manent calibrated poles mounted in the lake andtransparency was determined by Secchi disc. Tempera-ture, dissolved oxygen (DO) and pH were measuredin situ using Hanna instruments. Total dissolved solids(TDS) and conductivity were determined in situ usingHanna TDS (Model 98108) and conductivity (Model HI98303) metres, respectively. Phosphate (PO4-P) andnitrate (NO3-N) were measured using the methods
recommended by the American Public Health Associa-tion (APHA 2005).
Zooplankton samples were collected from the pelagicand littoral zones, fixed in 5% buffered formalin andidentified to the species level using the taxonomic keysof Gebrüder (1978), Jeje and Fernando (1986), Williams(1991) and Water Research Commission (WRC 2002)and an Olympus microscope at 400� magnification(Model BHTU BH-2). The quantitative assessment ofzooplankton density was carried out by counting individ-uals of each species deposited in Utermohl chambersand was presented as the number of individuals per litre(ind/L). The biovolume of zooplankton (mm3/L) wasestimated by measuring individual cells and their vol-umes were calculated according to geometrical solids.Biovolume (mm3/L) was, then, obtained by multiplica-tion of the density of each species by the average vol-ume of its cells. Specific biomass was expressed in mg(fresh weight)/L, assuming the specific density of a zoo-plankter as 1 g/cm3. Shannon-Wiener diversity index wasused to estimate species diversity, and species richnesswas estimated as the total number of species in a sample.Variations in physico-chemical parameters and zooplank-ton density and biomass during pre-flood, flood andpost-flood periods were tested statistically using a one-way analysis of variance (ANOVA). Values were consid-ered significant at p< 0.05 levels. Zooplankton density–environment relationship was analysed using canonicalcorrespondence analysis (CCA). ANOVA and CCA wereperformed using Statistical Package for Social Scienceversion 15.0 and PC-ORD 5.10, respectively.
Results
Physico-chemical variables
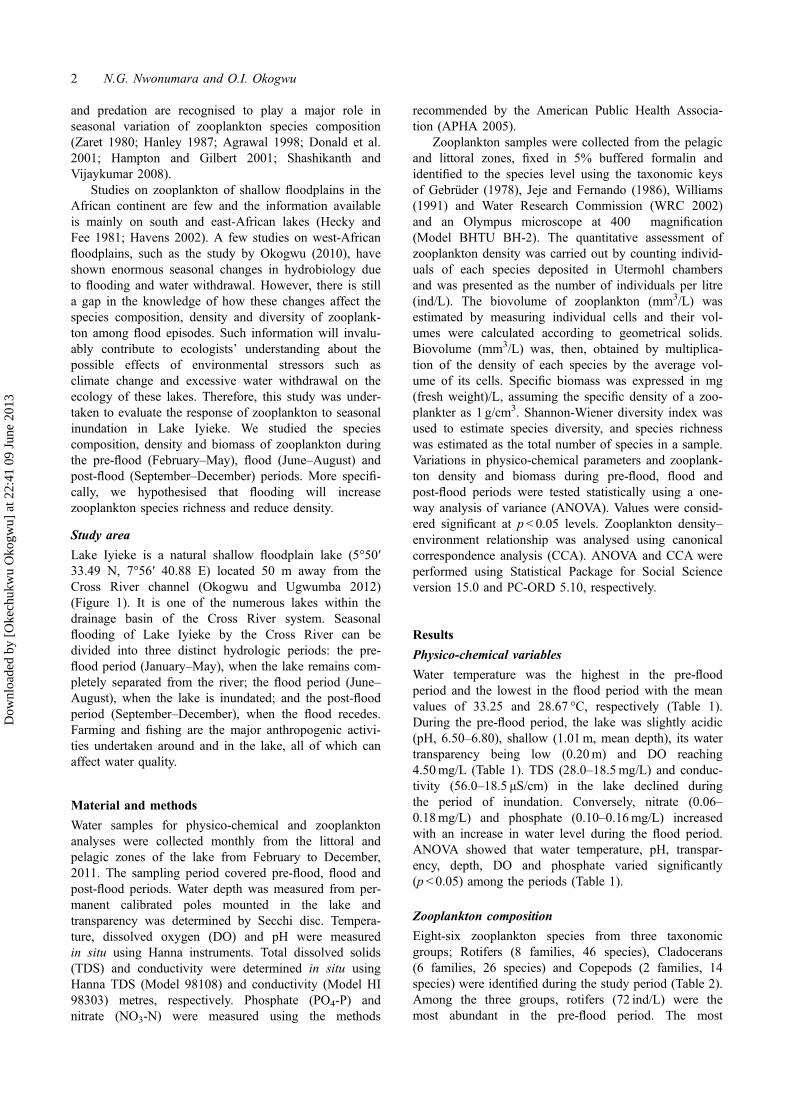
Water temperature was the highest in the pre-floodperiod and the lowest in the flood period with the meanvalues of 33.25 and 28.67 °C, respectively (Table 1).During the pre-flood period, the lake was slightly acidic(pH, 6.50–6.80), shallow (1.01m, mean depth), its watertransparency being low (0.20m) and DO reaching4.50mg/L (Table 1). TDS (28.0–18.5mg/L) and conduc-tivity (56.0–18.5 μS/cm) in the lake declined duringthe period of inundation. Conversely, nitrate (0.06–0.18mg/L) and phosphate (0.10–0.16mg/L) increasedwith an increase in water level during the flood period.ANOVA showed that water temperature, pH, transpar-ency, depth, DO and phosphate varied significantly(p< 0.05) among the periods (Table 1).
Zooplankton composition
Eight-six zooplankton species from three taxonomicgroups; Rotifers (8 families, 46 species), Cladocerans(6 families, 26 species) and Copepods (2 families, 14species) were identified during the study period (Table 2).Among the three groups, rotifers (72 ind/L) were themost abundant in the pre-flood period. The most
2 N.G. Nwonumara and O.I. Okogwu
Dow
nloa
ded
by [
Oke
chuk
wu
Oko
gwu]
at 2
2:41
09
June
201
3

abundant rotifers were Trichocerca taurocephala, Collot-heca ornate ornate, Collotheca quadrinodosa and Pro-ales fallaciosa. Notably, peak numbers of totalzooplankton (TZ) (527 ind/L), copepod (344 ind/L) andcladoceran (181 ind/L) densities were observed in Augustwhen the flood peaked (Figure 2). Conversely, the lowestdensities for cladoceran (2 ind/L), Copepods (3 ind/L)and TZ (5 ind/L) were recorded in February when waterlevel was the lowest. The most abundant cladoceransand copepods species were Diaphanosoma excisum,Diaphanosoma sarsi, Simocephalus vetulus, Moinodaphniamacleayi, Microcyclops varicans, Thermocycopsoithonoides and Bryocampyus birsteini. The ANOVAresults showed that seasonal variations in the density ofrotifers, cladocerans and copepods were significant(p< 0.05) (Table 3). On the average, zooplankton densitywas the least during the pre-flood period (Figure 3). Rot-ifera (46 species, H′= 2.7833) had the highest number ofspecies and made up the most diverse group during the
pre-flood period, while copepods had the highest speciesrichness during the flood and post-flood periods (Table 3,Figure 4). Although rotifers formed the most abundantand diverse group in the pre-flood period, they contrib-uted to the total biomass the least (0.16 μg/L). Cladocer-ans (0.61 μg/L) and copepods (0.48 μg/L) had the highestbiomass in the flood and post-flood periods, respectively(Table 3). ANOVA results showed that the species rich-ness, density and biomass of different zooplanktongroups varied significantly among the periods (p < 0.05)(Table 3).
Ordination performed on environmental variables andzooplankton density (Figure 5) showed that the first twoCCA axes explained 69.9% of the variation in zooplank-ton density. Zooplankton–environment correlations weresignificant for axis 1 (r= 0.99, p< 0.001) and axis 2(r= 0.98, p < 0.001). Most of the variance in axis 1 isdescribed by PO4-P (r= 0.60), pH (r=�0.58), transpar-ency (r= 0.44), conductivity (r=�0.42) and temperature,
Figure 1. Map of Lake Iyieke with an insert of the maps of the Cross River Basin and Nigeria.
Zoology and Ecology 3
Dow
nloa
ded
by [
Oke
chuk
wu
Oko
gwu]
at 2
2:41
09
June
201
3
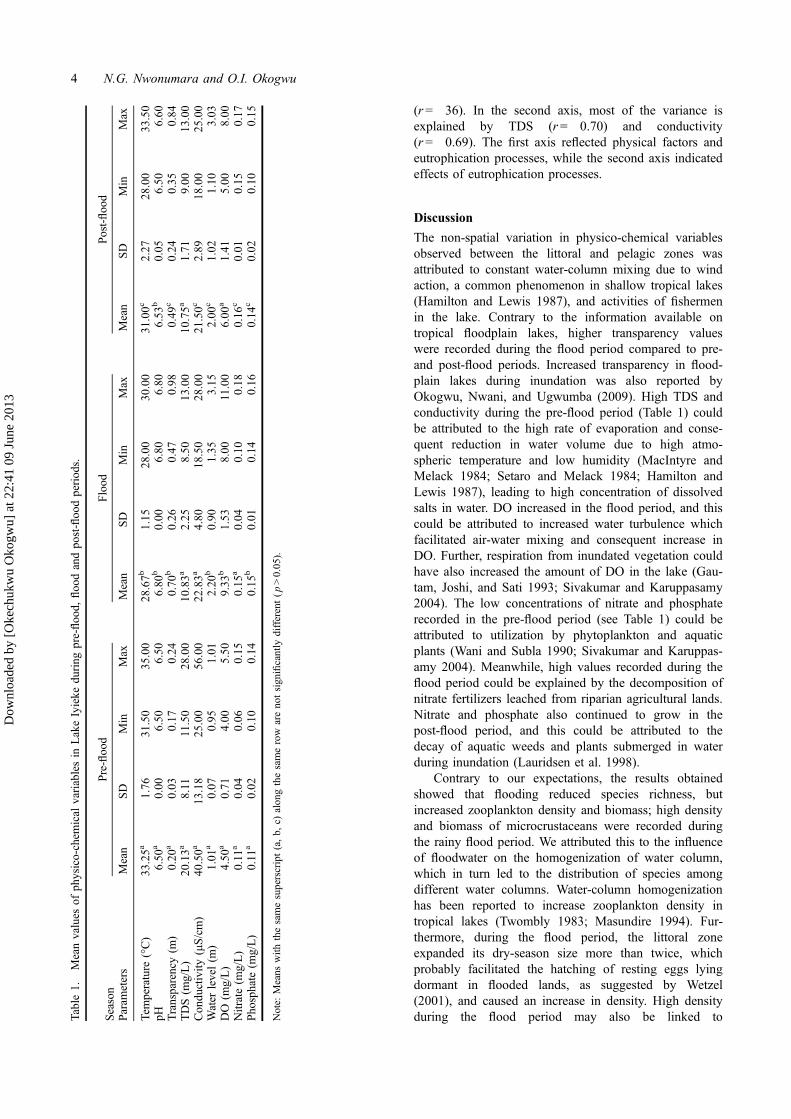
(r=�36). In the second axis, most of the variance isexplained by TDS (r=�0.70) and conductivity(r=�0.69). The first axis reflected physical factors andeutrophication processes, while the second axis indicatedeffects of eutrophication processes.
Discussion
The non-spatial variation in physico-chemical variablesobserved between the littoral and pelagic zones wasattributed to constant water-column mixing due to windaction, a common phenomenon in shallow tropical lakes(Hamilton and Lewis 1987), and activities of fishermenin the lake. Contrary to the information available ontropical floodplain lakes, higher transparency valueswere recorded during the flood period compared to pre-and post-flood periods. Increased transparency in flood-plain lakes during inundation was also reported byOkogwu, Nwani, and Ugwumba (2009). High TDS andconductivity during the pre-flood period (Table 1) couldbe attributed to the high rate of evaporation and conse-quent reduction in water volume due to high atmo-spheric temperature and low humidity (MacIntyre andMelack 1984; Setaro and Melack 1984; Hamilton andLewis 1987), leading to high concentration of dissolvedsalts in water. DO increased in the flood period, and thiscould be attributed to increased water turbulence whichfacilitated air-water mixing and consequent increase inDO. Further, respiration from inundated vegetation couldhave also increased the amount of DO in the lake (Gau-tam, Joshi, and Sati 1993; Sivakumar and Karuppasamy2004). The low concentrations of nitrate and phosphaterecorded in the pre-flood period (see Table 1) could beattributed to utilization by phytoplankton and aquaticplants (Wani and Subla 1990; Sivakumar and Karuppas-amy 2004). Meanwhile, high values recorded during theflood period could be explained by the decomposition ofnitrate fertilizers leached from riparian agricultural lands.Nitrate and phosphate also continued to grow in thepost-flood period, and this could be attributed to thedecay of aquatic weeds and plants submerged in waterduring inundation (Lauridsen et al. 1998).
Contrary to our expectations, the results obtainedshowed that flooding reduced species richness, butincreased zooplankton density and biomass; high densityand biomass of microcrustaceans were recorded duringthe rainy flood period. We attributed this to the influenceof floodwater on the homogenization of water column,which in turn led to the distribution of species amongdifferent water columns. Water-column homogenizationhas been reported to increase zooplankton density intropical lakes (Twombly 1983; Masundire 1994). Fur-thermore, during the flood period, the littoral zoneexpanded its dry-season size more than twice, whichprobably facilitated the hatching of resting eggs lyingdormant in flooded lands, as suggested by Wetzel(2001), and caused an increase in density. High densityduring the flood period may also be linked toTa
ble1.
Meanvalues
ofph
ysico-chem
ical
variablesin
LakeIyieke
during
pre-floo
d,floo
dandpo
st-floo
dperiod
s.
Season
Pre-floo
dFlood
Post-floo
d
Param
eters
Mean
SD
Min
Max
Mean
SD
Min
Max
Mean
SD
Min
Max
Temperature
(°C)
33.25a
1.76
31.50
35.00
28.67b
1.15
28.00
30.00
31.00c
2.27
28.00
33.50
pH6.50
a0.00
6.50
6.50
6.80
b0.00
6.80
6.80
6.53
b0.05
6.50
6.60
Transparency(m
)0.20
a0.03
0.17
0.24
0.70
b0.26
0.47
0.98
0.49
c0.24
0.35
0.84
TDS(m
g/L)
20.13a
8.11
11.50
28.00
10.83a
2.25
8.50
13.00
10.75a
1.71
9.00
13.00
Con
ductivity
(μS/cm)
40.50a
13.18
25.00
56.00
22.83a
4.80
18.50
28.00
21.50c
2.89
18.00
25.00
Water
level(m
)1.01
a0.07
0.95
1.01
2.20
b0.90
1.35
3.15
2.00
c1.02
1.10
3.03
DO
(mg/L)
4.50
a0.71
4.00
5.50
9.33
b1.53
8.00
11.00
6.00
a1.41
5.00
8.00
Nitrate(m
g/L)
0.11
a0.04
0.06
0.15
0.15
a0.04
0.10
0.18
0.16
c0.01
0.15
0.17
Pho
sphate
(mg/L)
0.11
a0.02
0.10
0.14
0.15
b0.01
0.14
0.16
0.14
c0.02
0.10
0.15
Note:
Means
with
thesamesuperscript(a,b,
c)alon
gthesamerow
areno
tsign
ificantly
different(p
>0.05).
4 N.G. Nwonumara and O.I. Okogwu
Dow
nloa
ded
by [
Oke
chuk
wu
Oko
gwu]
at 2
2:41
09
June
201
3

Table 2. Zooplankton species and density (ind/L) in Lake Iyieke.
Periods
Zooplankton taxa Pre-flood Flood Post-flood
Rotifera (Total density (ind/L)) 72 14 12Family BranchionidaeAnuraeopsis ceolata ceolata de Beauchamp, 1932 ⁄⁄ ⁄⁄
Anuraeopsis racenisi Berzins, 1962 ⁄⁄ ⁄⁄
Branchionus angularis f. bidens Ahlstrom, 1940 ⁄⁄ ⁄⁄
Branchionus caudatus f. majusculus Ahlstrom, 1940 ⁄⁄ ⁄⁄
Branchionus havanaensis havanaensis Rousselet, 1907 ⁄⁄
Branchionus leydigi rotundus Rousselet, 1907 ⁄⁄
Branchionus urceolris O. F. Muller, 1786 ⁄⁄
Keratella cochlearis var robusta Lauterborn, 1900 ⁄⁄
Notholca kostei Chengalath, 1978 ⁄⁄
Notholca labis Gosse, 1887 ⁄⁄
Notholca latistyla Oloffson, 1918 ⁄⁄
Notholca liepettersoni Bjorklund ⁄⁄
Notholca psammarina Buchholz and Ruhmann, 1956 ⁄⁄
Family CollothecidaeCollotheca campanulata campanulata Dobie, 1849 ⁄⁄
Collotheca campanulata var gracilipes Edmondson, 1939 ⁄⁄
Collotheca coronetta var weberi Wright, 1961 ⁄⁄
Collotheca cucullata cucullata Hood, 1894 ⁄⁄
Collotheca odentata Berzins, 1951 ⁄⁄
Collotheca ornata ornata Ehrenberg, 1835 ⁄⁄⁄
Collotheca quadrinodosa quadrinodosa Wright, 1961 ⁄⁄
Collotheca quadrinodosa var bicornuta Koste, 1978 ⁄⁄
Collotheca sp. ⁄⁄
Collotheca stephanochaeta Edmondson, 1936 ⁄⁄
Family CollurellidaeColurella colurus colurus Ehrenberg, 1930 ⁄⁄
Colurella hindenburgi Steinecke, 1917 ⁄⁄
Colurella salina Althaus, 1957 ⁄⁄
Colurella uncinata f. bicuspidata Ehrenberg, 1834 ⁄⁄
Lepadella bidentata Voronkov, 1913 ⁄⁄
Lepadella patella patella O. F. Muller, 1786 ⁄⁄
Proales fallaciosa Wulfert ⁄⁄
Proales globulifera Hauer, 1921 ⁄⁄
Family EuchlanidaeEuchlanis deflexa deflexa Gosse, 1851 ⁄⁄ ⁄⁄
Family HexarthridaeHexarthra mira mira Hudson, 1871 ⁄⁄
Hexarthra bulgarica Wiszniewski, 1933 ⁄⁄
Family LecanidaeLecane leontina Turner, 1892 ⁄⁄
Lecane punctata Murray, 1913 ⁄⁄
Lecane stenroosi Meissner, 1908 ⁄⁄
Family TestudinellidaeTestudinella spec. Yamamoto, 1951 ⁄⁄
Testudinella tridentate var curvata Wulfert, 1965 ⁄⁄
Family TrichocercidaeMacrochaetus collinsi collinsi Gosse, 1867 ⁄⁄
Macrochaetus sericus Thorpe, 1893 ⁄⁄
Trichocerca dubia Lauterborn, 1894 ⁄⁄
Trichocerca elongata elongate Gosse, 1886 ⁄⁄⁄ ⁄⁄
Trichocerca similis Wierzejski, 1893 ⁄⁄
Trichocerca taurocephala Hauer, 1931 ⁄⁄⁄ ⁄⁄
Trichocerca tenuior Gosse, 1886 ⁄⁄
Cladocera (Total density) 64 223 149Family SididaeDiaphanosoma excisum Sars, 1885 ⁄⁄⁄ ⁄⁄⁄ ⁄⁄⁄
Diaphanosoma sarsi Richard, 1895 ⁄⁄ ⁄⁄⁄ ⁄⁄
Pseudosida bidentata Herrick, 1884 ⁄⁄ ⁄⁄⁄ ⁄⁄⁄
Family DaphinidaeCeriodaphnia cornuta Sars, 1885 ⁄⁄ ⁄⁄
(Continued)
Zoology and Ecology 5
Dow
nloa
ded
by [
Oke
chuk
wu
Oko
gwu]
at 2
2:41
09
June
201
3

Table 2. (Continued)
Periods
Zooplankton taxa Pre-flood Flood Post-flood
Daphnia longispina O. F. Muller, 1785 ⁄⁄ ⁄⁄
Scapholeberi kingi Sars, 1903 ⁄⁄
Simocephalus serrulatus Koch, 1841 ⁄⁄ ⁄⁄
Simocephalus vetulus Muller, 1776 ⁄⁄ ⁄⁄⁄ ⁄⁄⁄
Family MoinidaeMoina micrura Kurz, 1874 ⁄⁄⁄ ⁄⁄
Moinodaphnia macleayi King, 1853 ⁄⁄ ⁄⁄ ⁄⁄
Family BosminidaeBosmina longirostris Muller, 1785 ⁄⁄
Bosminopsis deisteri Richard, 1895 ⁄⁄ ⁄⁄
Family MacrothricidaeEchinisca capensis capensis Sars, 1916 ⁄⁄ ⁄⁄
Echinisca rosea Lievin, 1848 ⁄⁄
Echinisca triseralis Brady, 1886 ⁄⁄
Grimaldina brazzai Richard, 1892 ⁄⁄
Guernella raphaelis Richard, 1892 ⁄⁄
Ilyocryptus spinifer Herrick, 1882 ⁄⁄
Macrothrix geoldi Richard, 1897 ⁄⁄
Family ChydoridaeAlona karua King, 1853 ⁄⁄ ⁄⁄
Alona rectangular serratta Daday, 1908 ⁄⁄
Alona verrucosa Sars, 1901 ⁄⁄
Chydorus eurynotus Sars, 1901 ⁄⁄
Chydorus sphaericus O. F. Muller, 1785 ⁄⁄
Leyidigia acanthocercoides Fischer, 1854 ⁄⁄
Pleuroxus hamatus hamatus Birge, 1879 ⁄⁄
Copepoda (Total density) 21 372 496Family CyclopidaeCryptocyclops bicolor Sars, 1863 ⁄⁄ ⁄⁄
Ectocyclops phaleratus Koch, 1838 ⁄⁄ ⁄⁄
Eucyclops serrulatus Fischer, 1851 ⁄⁄ ⁄⁄ ⁄⁄
Halicyclops troglodytes Kiefer, 1954 ⁄⁄ ⁄⁄
Mesocyclops leuckarti Claus, 1857 ⁄⁄ ⁄⁄
Metacyclops minutus Claus, 1863 ⁄⁄ ⁄⁄⁄
Microcyclops varicans Sars, 1863 ⁄⁄ ⁄⁄⁄ ⁄⁄⁄
Thermocyclops neglectus Sars, 1901 ⁄⁄
Thermocyclops oithonoides Sars, 1863 ⁄⁄⁄ ⁄⁄⁄ ⁄⁄⁄
Family DiaptomidaeBryocamptus birsteini Borutskii, 1931 ⁄⁄ ⁄⁄⁄ ⁄⁄⁄
Thermodiaptomus galebi Kiefer, 1927 ⁄⁄ ⁄⁄
Thermodiaptomus yabensis Wright and Tressler, 1928 ⁄⁄
Tropodiaptomus incognitus Dussart and Gras, 1966 ⁄⁄
Tropodiaptomus processifer Kiefer, 1927 ⁄⁄ ⁄⁄
Notes: ⁄⁄present; ⁄⁄⁄abundant.
0
100
200
300
400
500
600
700
Pre-flood Flood Post-flood
Den
sity
(N
o/L
)
Copepoda
Cladocera
Rotifera
Figure 3. Mean zooplankton density in Lake Iyieke duringthe study periods.
Feb Mar Apr May Jun Jul Aug Sep Oct Nov Dec
0
100
200
300
400
500
600 Rotifera Cladocera Copepoda TZ Water level
Den
sity
(N
o/L
)
0
2
4
Wat
er le
vel (
m)
Figure 2. Monthly variation in water level and TZ density.
6 N.G. Nwonumara and O.I. Okogwu
Dow
nloa
ded
by [
Oke
chuk
wu
Oko
gwu]
at 2
2:41
09
June
201
3
connectivity. During the flood period, other lakes withinthe Cross River-Floodplain such as Ehoma, Bob-Eric,Ujum, Ibini and Egwebe are usually flooded and areconnected with Lake Iyieke. Aoyagui and Bonecker(2004) and Junk, Bayley, and Sparks (1989) suggestedthat such connectivity facilitates the distribution of thefauna among connected aquatic systems. In contrast, lowcrustacean density and biomass during the dry seasonwere attributed to poor environmental conditions likehigh temperature, low transparency and increased acidity.In tropical lakes, these factors are known to impact nega-tively on the microcrustacean population size (Masundire1994; Mergeay et al. 2006; Okogwu 2010). High micro-crustacean biomass in the flood period is, therefore,attributed to moderate environmental factors like lowwater temperature, high transparency and DO and foodavailability. These factors have been reported to promotegrowth and increase of zooplankton biomass in tropicallakes (Saunders and Williams 1988; Okogwu, Nwani,and Ugwumba 2009).
The high rotifer species richness observed during thepre-flood period (see Figure 3 and Table 3) was in agree-ment with the reports of Okogwu, Nwani, and Ugwumba(2009) and Okogwu (2010). During the pre-flood period,
temperature was high while DO, transparency and waterlevel were low. These conditions may advertently andinadvertently support the proliferation of rotifers. Earlierstudies (Masundire 1994) have clearly stated that suchconditions are unfavourable to microcrustaceans, whoseabsence apparently provides competitive advantage torotifers that maximize the opportunity to proliferate.New rotifer species of the families Collothecidae andCollurellidae and the cladoceran S. kingi were recordedin the lake for the first time. This supports the reports byDumont (1994), according to which the number of stud-ies on tropical waters will increase, and there will be acommensurate increase in the number of new speciesidentified.
The study revealed that the zooplankton of the lakerespond significantly to changes in the water level, DO,transparency and decreased water temperature during andafter flood episodes. Therefore, there is a need for com-prehensive studies on the lakes within the Cross Riverbasin aimed to gain a clear understanding of the possibleimpact anthropogenic activities (dams and dredging) andclimatic factors (that could alter the intensity and
Table 3. Mean density, diversity and biomass of zooplankton during the study period.
Taxa Pre-flood period Flood period Post-flood period
RotiferaDensity (ind/L) 72a 14b 12b
Shannon-Wiener index (H′) 2.7833a 2.4410b 1.9073c
Biomass (μg/L) 0.1628a 0.0231b 0.0200c
CladoceraDensity (ind/L) 64a 233b 145c
Shannon-Wiener index (H′) 2.4277a 1.4718b 1.4988c
Biomass (μg/L) 0.5674a 0.6053a 0.4971a
CopepodaDensity (ind/L) 21a 385b 496c
Shannon-Wiener index (H′) 1.5655a 1.4388b 1.5317c
Biomass (μg/L) 0.2698a 0.3716b 0.4829c
C. ornate
T. taurocephalaD. sarsi
Axis 1 (49.9%) P. bidenentata
M. macleayi
M. micrura
D. excisum
B. bristeiniS. vetulus M. varicans
T. oithonoids
NO3
DO
TEMP
pH
TDS
COND
-400 -200 2000
-200
200
Figure 5. Biplot of CCA analysis of the most abundantzooplankton species and environmental variables in pre-flood(open triangles), flood (closed triangles) and post-flood (opencircles) periods.
Copepoda
Cladocera
Rotifera
0
10
20
30
40
50
60
Pre-flood Flood Post-flood
Num
ber
of s
peci
es
Figure 4. Zooplankton species richness in Iyieke during thestudy periods.
Zoology and Ecology 7
Dow
nloa
ded
by [
Oke
chuk
wu
Oko
gwu]
at 2
2:41
09
June
201
3
duration of flood) could have on the structure of the zoo-plankton community.
Acknowledgment
We are grateful to Mrs Ebere Ejikeme, whose assistance madethe laboratory analysis of water parameters possible at ProjectDevelopment Centre (PRODA), Enugu State, Nigeria.
ReferencesAgrawal, A. A. 1998. “Algal Defenses, Grazers and Their
Interactions in Aquatic Trophic Cascades.” Acta Oecologica19: 331–337.
APHA (American Public Health Association). 2005. StandardMethods for the Examination of Water and WastewatersAnalysis. 21st ed. Washington, DC: American PublicHealth Association.
Aoyagui, A. S. M., and C. C. Bonecker. 2004. “Rotifers in Dif-ferent Environments of the Upper Parana River Floodplain(Brazil): Richness, Abundance and the Relationship to Con-nectivity.” Hydrobiologia 522: 281–290.
Donald, D. B., R. D. V. Brooke, R. S. Anderson, J. Syrian, andM. D. Graham. 2001. “Recovery of Zooplankton Assem-blages in Mountain Wetlands from the Effects of Intro-duced Sport Fish.” Canadian Journal of Fisheries andAquatic Sciences 58: 1822–1830.
Dumont, H. J. 1994. “On the Diversity of the Cladocera in theTropics.” Hydrobiologia 272: 27–38.
Edmondson, W. T. 1965. “Reproductive Rate of PlanktonicRotifers as Related to Food and Temperature in Nature.”Ecological Monographs 35: 61–111.
Egborge, A. B. M. 1994. “Salinity and the Distribution of Roti-fers in the Lagos Harbour-Badagry Creek System, Nigeria.”Hydrobiologia 272: 95–104.
Gannon, J. E., and R. S. Stemberger. 1978. “Zooplankton(Especially Crustaceans and Rotifers) as Indicators of WaterQuality.” Transactions of the American Microscopic Society97: 16–35.
Gautam, A., V. P. Joshi, and O. P. Sati. 1993. “Physico-chemi-cal Characteristics of Sewage and its Impact on WaterQuality of Alkananda at Srinagar (Garhwal).” Journal ofEcotoxicology and Environmental Monitoring 3: 61–63.
Gebrüder, B. 1978. Rotatoria. München: Druck Graphic.Ghadouani, A., B. Pinel-Alloul, Y. Zhang, and E. E. Prepas.
1998. “Relationships between Zooplankton CommunityStructure and Phytoplankton in Two Lime-treated EutrophicHardwater Wetlands.” Freshwater Biology 39: 775–790.
Hamilton, S. K., and W. M. Lewis. 1987. “Chemistry andNutrient Mass Balance of a Lake on the Orinoco RiverFloodplain, Venezuela.” Limnology and Oceanography 23:245–267.
Hampton, S. E., and J. J. Gilbert. 2001. “Observations of InsectPredation on Rotifers.” Hydrobiologia 446/447: 115–121.
Hanazato, T., and S. I. Dodson. 1995. “Synergistic Effects ofLow Oxygen Concentration, Predator Kairomone and aPesticide on the Cladoceran Daphnia pulex.” Limnologyand Oceanography 40: 700–709.
Hanley, J. F. 1987. “Field Studies on Zooplankton-cyanobacte-ria Interactions.” New Zealand Journal of Marine andFreshwater Resources 21: 467–475.
Havens, K. E. 2002. “Zooplankton Structure and PotentialFood Web Interactions in the Plankton of a SubtropicalChain-of-lakes.” Science World Journal 2: 926–942.
Hecky, R. E., and F. J. Fee. 1981. “Primary Production andRates of Algal Growth in Lake Tanganyika.” Limnologyand Oceanography 26: 532–547.
Hutchinson, G. E. 1967. Introduction to Lake Biology. NewYork: John Wiley and Sons.
Infante, A., and S. E. B. Abella. 1985. “Inhibition of Daphniaby Oscillatoria in Lake Washington.” Limnology andOceanography 30: 1046–1052.
Jeje, C. Y., and C. H. Fernando. 1986. A Practical Guide tothe Identification of Nigerian Zooplankton (Cladocera,Copepoda and Rotifera). New Bussa: Kanji Lake ResearchInstitute, Nigeria Publication.
Junk, W. J., P. B. Bayley, and R. E. Sparks. 1989. “The FloodPulse Concept in River Floodplain System.” CanadianSpecial Publication of Fisheries and Aquatic Sciences 106:110–127.
Lauridsen, T., E. Jeppesen, M. Sondergaard, and D. M. Lodge.1998. “Horizontal Migration of Zooplankton: Predator-med-iated Use of Macrophyte Habitat.” In The Structuring Roleof Submerged Macrophytes in Wetlands, edited byE. Jeppesen, Ma. Søndergaard, Mo. Søndergaard, andK. Christoffersen, 233–239. New York, NY: Springer Ver-lag.
MacIntyre, S., and J. M. Melack. 1984. “Vertical Mixingin Amazon Floodplain Lakes.” Verhandlungen der Interna-tionalen Vereingung fur Theoretische und AngewandteLimnologie 22: 1283–1287.
Masundire, H. M. 1994. “Seasonal Trends in ZooplanktonDensities in Sanyati Basin, Lake Kariba: MultivariateAnalysis.” Hydrobiologia 272: 211–230.
Mavuti, K. M. 1990. “Ecology and Role of Zooplankton in theFishery of Lake Naivasha.” Hydrobiologia 208: 131–140.
Mergeay, J., S. Declerck, D. Verschuren, and L. Meester. 2006.“Daphnia Community Analysis in Shallow Kenyan Lakesand Ponds Using Dormant Eggs in Surface Sediments.”Freshwater Biology 51: 399–411.
Moss, B. 1994. “Brackish and Freshwater Shallow Wetlands –Different Systems or Variations on the Same Theme?”Hydrobiologia 275/276: 1–14.
Okogwu, O. I. 2010. “Seasonal Variations of Species Composi-tion and Abundance of Zooplankton in Ehoma Lake, aFloodplain Lake in Nigeria.” Revista de Biologia Tropical58: 171–182.
Okogwu, O. I., C. D. Nwani, and A. O. Ugwumba. 2009.“Seasonal Variations in the Abundance and Biomass ofMicrocrustaceans in Relation to Environmental Variables inTwo Shallow Tropical Lakes within the Cross River Flood-plain, Nigeria.” Acta Zoologica Lituanica 19 (3): 205–215.
Okogwu, O. I., and A. O. Ugwumba. 2012. “Response of Phy-toplankton Functional Groups in Fluctuating Water Level inTwo Shallow Floodplain Lakes in Cross River, Nigeria.”Inland Waters 2: 37–46.
Saunders, J. F., and W. M. Williams. 1988. “Composition andSeasonality of the Zooplankton Community of Lake Valen-cia, Venezuela.” Journal of Plankton Research 10:957–985.
Setaro, F. V., and J. M. Melack. 1984. “Responses of Phyto-plankton to Experimental Nutrient Enrichment in an Ama-zon Floodplain Lake.” Limnology and Oceanography 29:971–984.
Shashikanth, M., and K. Vijaykumar. 2008. “Ecology andAbundance of Zooplankton in Karanja Reservoir.” TropicalEcology 23: 55–72.
Sivakumar, K., and R. Karuppasamy. 2004. “Factors AffectingProductivity of Phytoplankton in a Reservoir of Tamilnadu,India.” American-Eurasian Journal of Botany 1: 99–103.
Twombly, S. 1983. “Seasonal and Short-term Fluctuations inZooplankton Abundance in Tropical Lake Malawi.”Limnology and Oceanography 28: 1214–1224.
Wani, I. A., and B. A. Subla. 1990. “Physico-chemical Featuresof Two Shallow Himalayan Lakes.” Bulletin of Environ-mental Science 8: 33–49.
8 N.G. Nwonumara and O.I. Okogwu
Dow
nloa
ded
by [
Oke
chuk
wu
Oko
gwu]
at 2
2:41
09
June
201
3
Ward, J. V., and K. Tockner. 2001. “Biodiversity: Towards aUnifying Theme for River Ecology.” Freshwater Biology46: 807–819.
WRC (Water Research Commission). 2002. “Guides to theFreshwater Invertebrate of Southern Africa.” In Volume 5:Non-Arthropods, edited by J. A. Day and I. J. de Moor,292–300. Pretoria: WRC.
Wetzel, R. G. 2001. Limnology Lake and River Ecosystems.California CA: Academic Press.
Williams, C. E. 1991. “Copepods.” In Ecology and Classificationof North American Freshwater Invertebrates, edited by C.Thorp and N. Covich, 799–822. New York: Academic Press.
Zaret, T. M. 1980. Predation and Freshwater Communities.New Haven, CT: Yale University Press.
Zoology and Ecology 9
Dow
nloa
ded
by [
Oke
chuk
wu
Oko
gwu]
at 2
2:41
09
June
201
3
Copyright © 2022 FDOKUMEN