THE IMPACT OF ENVIRONMENTAL REGULATIONS ON TRADE AND FOREIGN DIRECT INVESTMENTS
29
1 DRAFT (01.09.2004)-not to be quoted THE IMPACT OF ENVIRONMENTAL REGULATIONS ON TRADE AND FOREIGN DIRECT INVESTMENTS Hakan MIHCI, Selim CAGATAY and Onur KOSKA HACETTEPE UNIVERSITY Department of Economics Beytepe, Ankara/TURKEY e-mails: [email protected] [email protected] [email protected] 1. INTRODUCTION Globalization concept had brought to light a new phenomenon, worldwide integration. The basic dynamic, lying under that phenomenon was simply matter of reciprocal utility, where strategical interactions between countries were the cornerstone. Strategical interactions sheltered varied behavior patterns in its nature. For instance, developed nations, in order to get rid of any obstacles affecting their competitive superiority, were looking for creative solutions, like seeking suitable circumstances for foreign market access, whereas developing nations were in a position, striving to draw formers’ attention, in a way of offering varied promotions. Therefore, within already developed nations, there was a serious competition for an access to developing nations’ markets in order to carry on their production through a cost, internal market and/or ownership-specific (factor endowments) advantages. Developing nations were also in a position, competing for attracting developed nations’ attention, due to their insufficient/inefficient sources, and also due to lack of their knowledge and experience both on production process and on global market rules. In this increasingly integrated world, declining trade barriers indicate that the role of environmental regulations play in shaping a country’s comparative advantage is greater than
-
Upload
independent -
Category
Documents
-
view
1 -
download
0
Transcript of THE IMPACT OF ENVIRONMENTAL REGULATIONS ON TRADE AND FOREIGN DIRECT INVESTMENTS
1
DRAFT (01.09.2004)-not to be quoted
THE IMPACT OF ENVIRONMENTAL REGULATIONS ON TRADE
AND FOREIGN DIRECT INVESTMENTS
Hakan MIHCI, Selim CAGATAY and Onur KOSKA
HACETTEPE UNIVERSITY
Department of Economics
Beytepe, Ankara/TURKEY
e-mails: [email protected] [email protected] [email protected]
1. INTRODUCTION
Globalization concept had brought to light a new phenomenon, worldwide integration.
The basic dynamic, lying under that phenomenon was simply matter of reciprocal utility,
where strategical interactions between countries were the cornerstone. Strategical interactions
sheltered varied behavior patterns in its nature. For instance, developed nations, in order to
get rid of any obstacles affecting their competitive superiority, were looking for creative
solutions, like seeking suitable circumstances for foreign market access, whereas developing
nations were in a position, striving to draw formers’ attention, in a way of offering varied
promotions. Therefore, within already developed nations, there was a serious competition for
an access to developing nations’ markets in order to carry on their production through a cost,
internal market and/or ownership-specific (factor endowments) advantages. Developing
nations were also in a position, competing for attracting developed nations’ attention, due to
their insufficient/inefficient sources, and also due to lack of their knowledge and experience
both on production process and on global market rules.
In this increasingly integrated world, declining trade barriers indicate that the role of
environmental regulations play in shaping a country’s comparative advantage is greater than
2
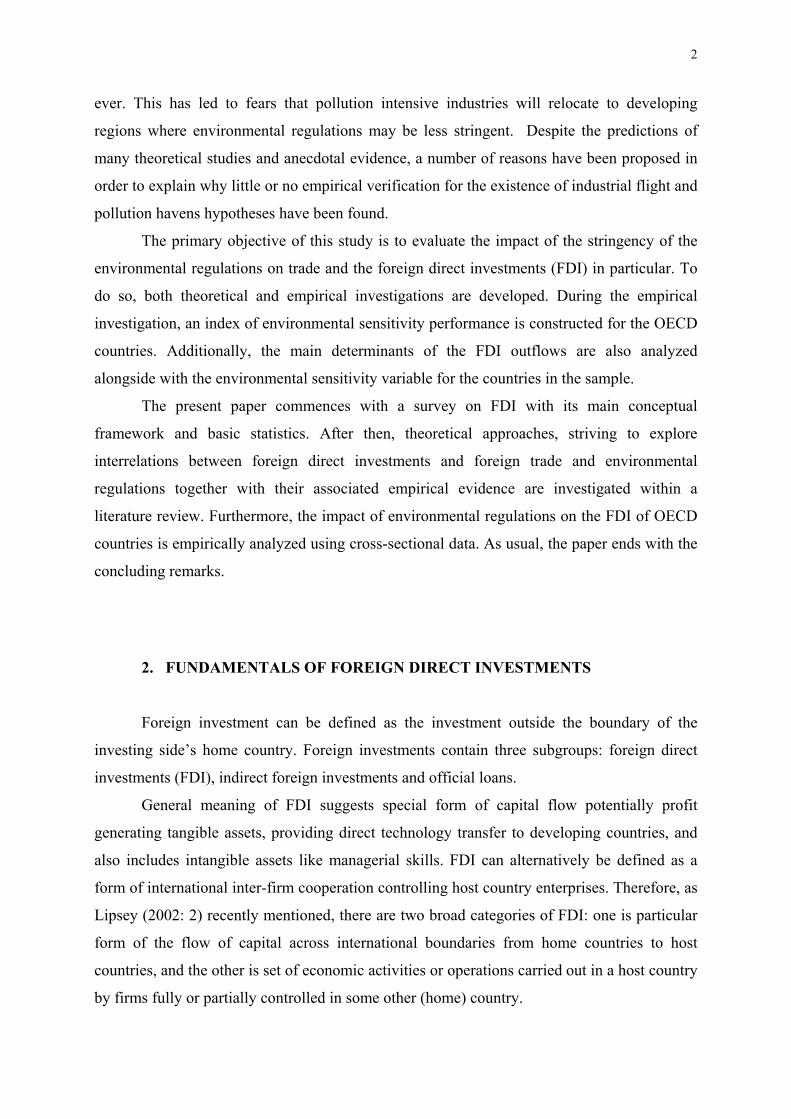
ever. This has led to fears that pollution intensive industries will relocate to developing
regions where environmental regulations may be less stringent. Despite the predictions of
many theoretical studies and anecdotal evidence, a number of reasons have been proposed in
order to explain why little or no empirical verification for the existence of industrial flight and
pollution havens hypotheses have been found.
The primary objective of this study is to evaluate the impact of the stringency of the
environmental regulations on trade and the foreign direct investments (FDI) in particular. To
do so, both theoretical and empirical investigations are developed. During the empirical
investigation, an index of environmental sensitivity performance is constructed for the OECD
countries. Additionally, the main determinants of the FDI outflows are also analyzed
alongside with the environmental sensitivity variable for the countries in the sample.
The present paper commences with a survey on FDI with its main conceptual
framework and basic statistics. After then, theoretical approaches, striving to explore
interrelations between foreign direct investments and foreign trade and environmental
regulations together with their associated empirical evidence are investigated within a
literature review. Furthermore, the impact of environmental regulations on the FDI of OECD
countries is empirically analyzed using cross-sectional data. As usual, the paper ends with the
concluding remarks.
2. FUNDAMENTALS OF FOREIGN DIRECT INVESTMENTS
Foreign investment can be defined as the investment outside the boundary of the
investing side’s home country. Foreign investments contain three subgroups: foreign direct
investments (FDI), indirect foreign investments and official loans.
General meaning of FDI suggests special form of capital flow potentially profit
generating tangible assets, providing direct technology transfer to developing countries, and
also includes intangible assets like managerial skills. FDI can alternatively be defined as a
form of international inter-firm cooperation controlling host country enterprises. Therefore, as
Lipsey (2002: 2) recently mentioned, there are two broad categories of FDI: one is particular
form of the flow of capital across international boundaries from home countries to host
countries, and the other is set of economic activities or operations carried out in a host country
by firms fully or partially controlled in some other (home) country.
3
FDI can also be classified according to the objectives that they have, such as
horizontal FDI, in which serving foreign customers is the main purpose; and vertical FDI, in
which natural resource using and/or export-orientation constitute the underlying dynamics.
Large and growing markets are the potentials for investors looking for opportunities to sell in
where they invest. This type of investment is known as market-seeking FDI coinciding with
the horizontal FDI. On the opposite side, non-market seeking FDI, where goods are produced
in the host country and sold abroad can be associated with the vertical FDI. Furthermore,
production platform-seeking FDI and resource-seeking FDI can also be considered within
this category. Main aim of production platform-seeking FDI is to provide platform for
production and sales in order to serve regional export markets1. Resource-seeking FDI,
however, possess distinct dynamics such as obtaining access to relatively scarce or low priced
natural resources.
The scale of global FDI had increased rapidly in the last two decades. As Fredriksson
et al. (2003: 1408) mentioned, the data on worldwide nominal FDI inflows had shown a rise
of nearly 18 per cent per annum from 1985 to 1997. Also, OECD data had indicated that FDI
figures for OECD countries (both inflows and outflows) had gained a serious acceleration for
the period 1997-2000. This trend, however, reversed since the beginning of the new
millennium, and a rapid decline had been observed during the 2000-2002 period for global
FDI flows mainly originating from weak economic growth, tumbling stock markets and
institutional factors such as deceleration of privatization in several countries (UNCTAD 2003:
3).
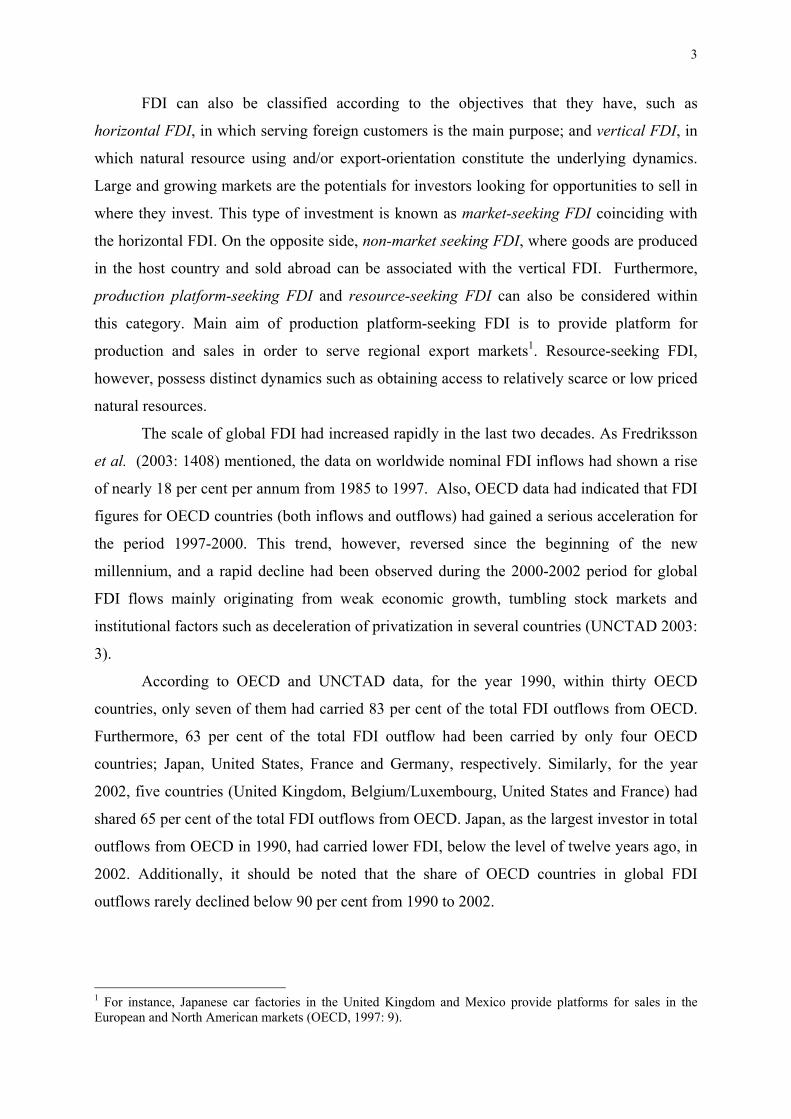
According to OECD and UNCTAD data, for the year 1990, within thirty OECD
countries, only seven of them had carried 83 per cent of the total FDI outflows from OECD.
Furthermore, 63 per cent of the total FDI outflow had been carried by only four OECD
countries; Japan, United States, France and Germany, respectively. Similarly, for the year
2002, five countries (United Kingdom, Belgium/Luxembourg, United States and France) had
shared 65 per cent of the total FDI outflows from OECD. Japan, as the largest investor in total
outflows from OECD in 1990, had carried lower FDI, below the level of twelve years ago, in
2002. Additionally, it should be noted that the share of OECD countries in global FDI
outflows rarely declined below 90 per cent from 1990 to 2002.
1 For instance, Japanese car factories in the United Kingdom and Mexico provide platforms for sales in the European and North American markets (OECD, 1997: 9).
4
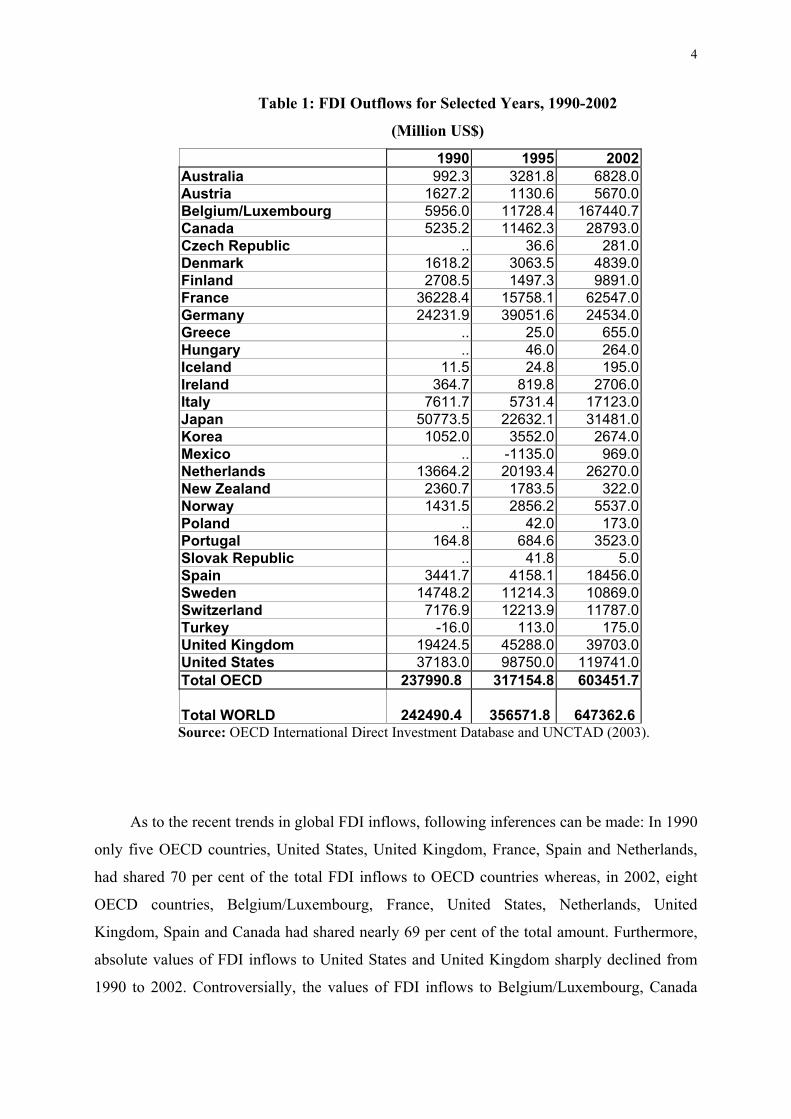
Table 1: FDI Outflows for Selected Years, 1990-2002
(Million US$)
1990 1995 2002 Australia 992.3 3281.8 6828.0 Austria 1627.2 1130.6 5670.0 Belgium/Luxembourg 5956.0 11728.4 167440.7 Canada 5235.2 11462.3 28793.0 Czech Republic .. 36.6 281.0 Denmark 1618.2 3063.5 4839.0 Finland 2708.5 1497.3 9891.0 France 36228.4 15758.1 62547.0 Germany 24231.9 39051.6 24534.0 Greece .. 25.0 655.0 Hungary .. 46.0 264.0 Iceland 11.5 24.8 195.0 Ireland 364.7 819.8 2706.0 Italy 7611.7 5731.4 17123.0 Japan 50773.5 22632.1 31481.0 Korea 1052.0 3552.0 2674.0 Mexico .. -1135.0 969.0 Netherlands 13664.2 20193.4 26270.0 New Zealand 2360.7 1783.5 322.0 Norway 1431.5 2856.2 5537.0 Poland .. 42.0 173.0 Portugal 164.8 684.6 3523.0 Slovak Republic .. 41.8 5.0 Spain 3441.7 4158.1 18456.0 Sweden 14748.2 11214.3 10869.0 Switzerland 7176.9 12213.9 11787.0 Turkey -16.0 113.0 175.0 United Kingdom 19424.5 45288.0 39703.0 United States 37183.0 98750.0 119741.0 Total OECD 237990.8 317154.8 603451.7 Total WORLD 242490.4
356571.8
647362.6
Source: OECD International Direct Investment Database and UNCTAD (2003).
As to the recent trends in global FDI inflows, following inferences can be made: In 1990
only five OECD countries, United States, United Kingdom, France, Spain and Netherlands,
had shared 70 per cent of the total FDI inflows to OECD countries whereas, in 2002, eight
OECD countries, Belgium/Luxembourg, France, United States, Netherlands, United
Kingdom, Spain and Canada had shared nearly 69 per cent of the total amount. Furthermore,
absolute values of FDI inflows to United States and United Kingdom sharply declined from
1990 to 2002. Controversially, the values of FDI inflows to Belgium/Luxembourg, Canada
5
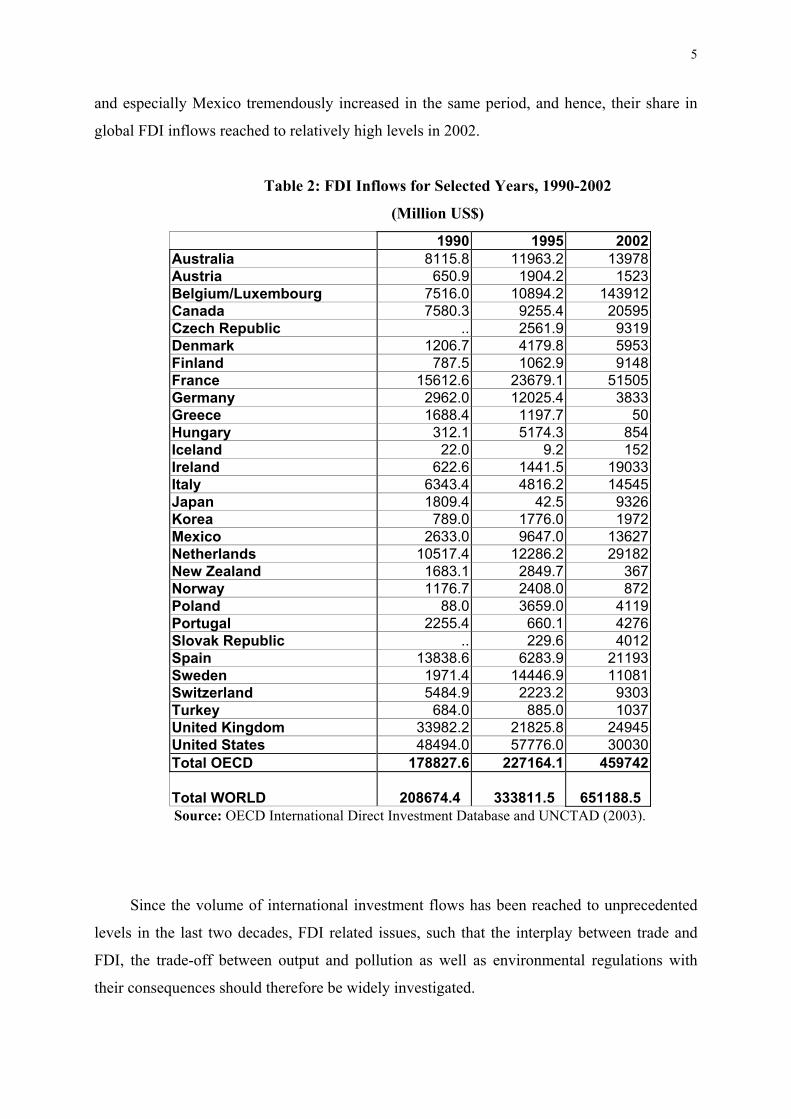
and especially Mexico tremendously increased in the same period, and hence, their share in
global FDI inflows reached to relatively high levels in 2002.
Table 2: FDI Inflows for Selected Years, 1990-2002
(Million US$)
1990 1995 2002 Australia 8115.8 11963.2 13978 Austria 650.9 1904.2 1523 Belgium/Luxembourg 7516.0 10894.2 143912 Canada 7580.3 9255.4 20595 Czech Republic .. 2561.9 9319 Denmark 1206.7 4179.8 5953 Finland 787.5 1062.9 9148 France 15612.6 23679.1 51505 Germany 2962.0 12025.4 3833 Greece 1688.4 1197.7 50 Hungary 312.1 5174.3 854 Iceland 22.0 9.2 152 Ireland 622.6 1441.5 19033 Italy 6343.4 4816.2 14545 Japan 1809.4 42.5 9326 Korea 789.0 1776.0 1972 Mexico 2633.0 9647.0 13627 Netherlands 10517.4 12286.2 29182 New Zealand 1683.1 2849.7 367 Norway 1176.7 2408.0 872 Poland 88.0 3659.0 4119 Portugal 2255.4 660.1 4276 Slovak Republic .. 229.6 4012 Spain 13838.6 6283.9 21193 Sweden 1971.4 14446.9 11081 Switzerland 5484.9 2223.2 9303 Turkey 684.0 885.0 1037 United Kingdom 33982.2 21825.8 24945 United States 48494.0 57776.0 30030 Total OECD 178827.6 227164.1 459742 Total WORLD
208674.4
333811.5
651188.5
Source: OECD International Direct Investment Database and UNCTAD (2003).
Since the volume of international investment flows has been reached to unprecedented
levels in the last two decades, FDI related issues, such that the interplay between trade and
FDI, the trade-off between output and pollution as well as environmental regulations with
their consequences should therefore be widely investigated.
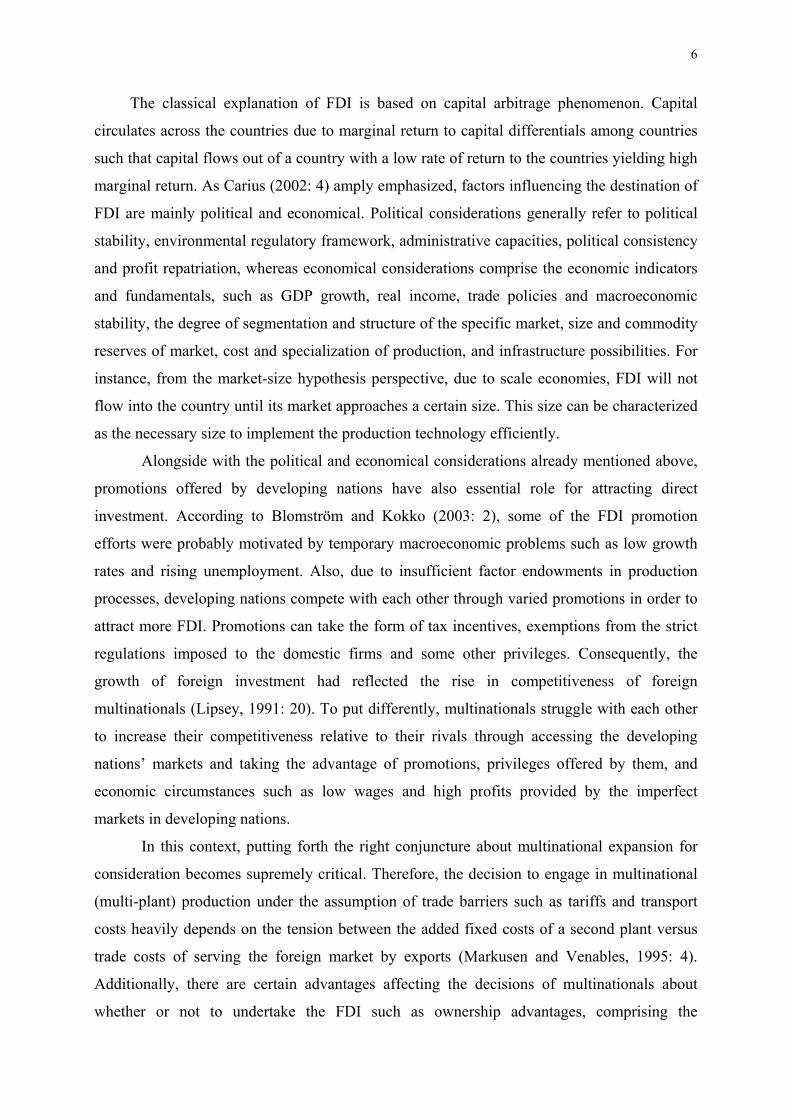
6
The classical explanation of FDI is based on capital arbitrage phenomenon. Capital
circulates across the countries due to marginal return to capital differentials among countries
such that capital flows out of a country with a low rate of return to the countries yielding high
marginal return. As Carius (2002: 4) amply emphasized, factors influencing the destination of
FDI are mainly political and economical. Political considerations generally refer to political
stability, environmental regulatory framework, administrative capacities, political consistency
and profit repatriation, whereas economical considerations comprise the economic indicators
and fundamentals, such as GDP growth, real income, trade policies and macroeconomic
stability, the degree of segmentation and structure of the specific market, size and commodity
reserves of market, cost and specialization of production, and infrastructure possibilities. For
instance, from the market-size hypothesis perspective, due to scale economies, FDI will not
flow into the country until its market approaches a certain size. This size can be characterized
as the necessary size to implement the production technology efficiently.
Alongside with the political and economical considerations already mentioned above,
promotions offered by developing nations have also essential role for attracting direct
investment. According to Blomström and Kokko (2003: 2), some of the FDI promotion
efforts were probably motivated by temporary macroeconomic problems such as low growth
rates and rising unemployment. Also, due to insufficient factor endowments in production
processes, developing nations compete with each other through varied promotions in order to
attract more FDI. Promotions can take the form of tax incentives, exemptions from the strict
regulations imposed to the domestic firms and some other privileges. Consequently, the
growth of foreign investment had reflected the rise in competitiveness of foreign
multinationals (Lipsey, 1991: 20). To put differently, multinationals struggle with each other
to increase their competitiveness relative to their rivals through accessing the developing
nations’ markets and taking the advantage of promotions, privileges offered by them, and
economic circumstances such as low wages and high profits provided by the imperfect
markets in developing nations.
In this context, putting forth the right conjuncture about multinational expansion for
consideration becomes supremely critical. Therefore, the decision to engage in multinational
(multi-plant) production under the assumption of trade barriers such as tariffs and transport
costs heavily depends on the tension between the added fixed costs of a second plant versus
trade costs of serving the foreign market by exports (Markusen and Venables, 1995: 4).
Additionally, there are certain advantages affecting the decisions of multinationals about
whether or not to undertake the FDI such as ownership advantages, comprising the
7
maximization process of unique assets giving a firm market power; internalization advantage,
under the imperfect market assumptions, determining the choice of direct investment over
licensing under the circumstances where the firm is unable to realize the full value of the asset
through the market; and locating production advantage, where international expansion is more
profitable than exporting originated from the easy access to consumers across the borders
(Chakrabarti 2003; Brainard 1993).
In this section of the paper, types of FDI, changing trends of both global FDI inflows
and outflows giving an emphasis on the OECD countries were analyzed. Furthermore, factors
affecting the FDI decisions of the multinationals were reviewed. As it is understood from this
review, on the one side, multinationals, trying to raise their competitiveness, and on the other
side, developing nations suffering economically for various reasons, and hence, striving to
attract the international capital, attempt to use FDI as a magic tool to achieve their distinct
targets. Next section concentrates on the possible linkages between FDI and foreign trade.
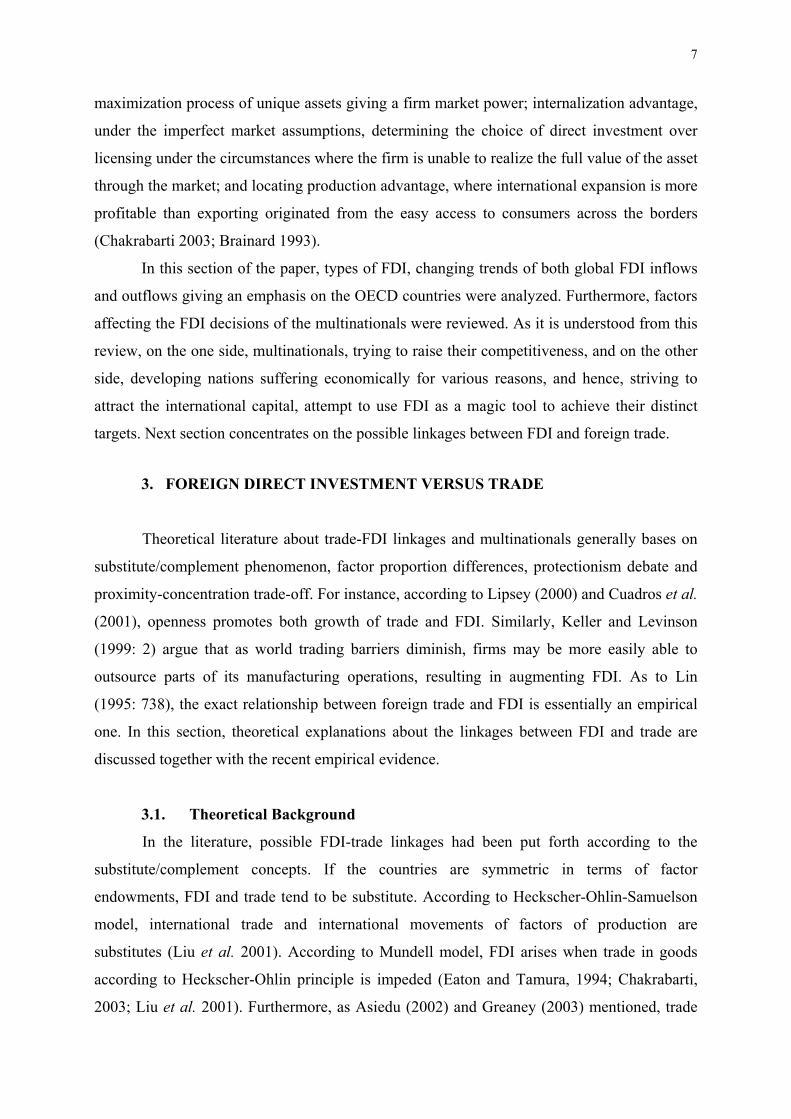
3. FOREIGN DIRECT INVESTMENT VERSUS TRADE
Theoretical literature about trade-FDI linkages and multinationals generally bases on
substitute/complement phenomenon, factor proportion differences, protectionism debate and
proximity-concentration trade-off. For instance, according to Lipsey (2000) and Cuadros et al.
(2001), openness promotes both growth of trade and FDI. Similarly, Keller and Levinson
(1999: 2) argue that as world trading barriers diminish, firms may be more easily able to
outsource parts of its manufacturing operations, resulting in augmenting FDI. As to Lin
(1995: 738), the exact relationship between foreign trade and FDI is essentially an empirical
one. In this section, theoretical explanations about the linkages between FDI and trade are
discussed together with the recent empirical evidence.
3.1. Theoretical Background
In the literature, possible FDI-trade linkages had been put forth according to the
substitute/complement concepts. If the countries are symmetric in terms of factor
endowments, FDI and trade tend to be substitute. According to Heckscher-Ohlin-Samuelson
model, international trade and international movements of factors of production are
substitutes (Liu et al. 2001). According to Mundell model, FDI arises when trade in goods
according to Heckscher-Ohlin principle is impeded (Eaton and Tamura, 1994; Chakrabarti,
2003; Liu et al. 2001). Furthermore, as Asiedu (2002) and Greaney (2003) mentioned, trade
8
restrictions and less openness have positive impact on market-seeking FDI, known as tariff-
jumping hypothesis, where trade and FDI are substitutes such that foreign firms strive to serve
local market due to high trade costs resulted from protectionist rules and laws, having an
underlying dynamic of trade-off between proximity and scale2.
Decision between trade and investment depends in part on a trade-off between
proximity and concentration. Proximity refers to avoiding transport costs by launching FDI in
foreign market resulted in overcoming trade barriers, whereas concentration implies
increasing returns to scale, and hence, maintaining capacity in multiple markets. If proximity
advantages outweigh the concentration advantages, then firms materialize more FDI rather
than trade indicating again a substitution linkage between trade and investment. On the other
hand, this approach cannot explain intra-industry trade. Factor proportions model effectively
explains one-way direct investment flows under strong asymmetry hypothesis, whereas
cannot explain two-way intra-industry investment flows between symmetric economies
(Brainard, 1993).
Trade and FDI also tend to be complementary due to huge differences in factor
endowments. Asymmetries in relative endowments between countries made existence of both
trade and FDI possible. Convergence in country characteristics initially leads to an increase in
the volume of trade, and then to a reduction with an increase in relative importance of FDI,
known as “convergence hypothesis” (Markusen and Venables, 1995; Markusen and Maskus,
1999). Moreover, Baldwin and Ottaviano (1998: 3) indicated that trade and investments are
not substitutes, such that placing a factory abroad has a trade enhancing effect in the form of
re-imports in addition to the usual trade displacing effect, displacement of exports with local
sales of foreign affiliates.
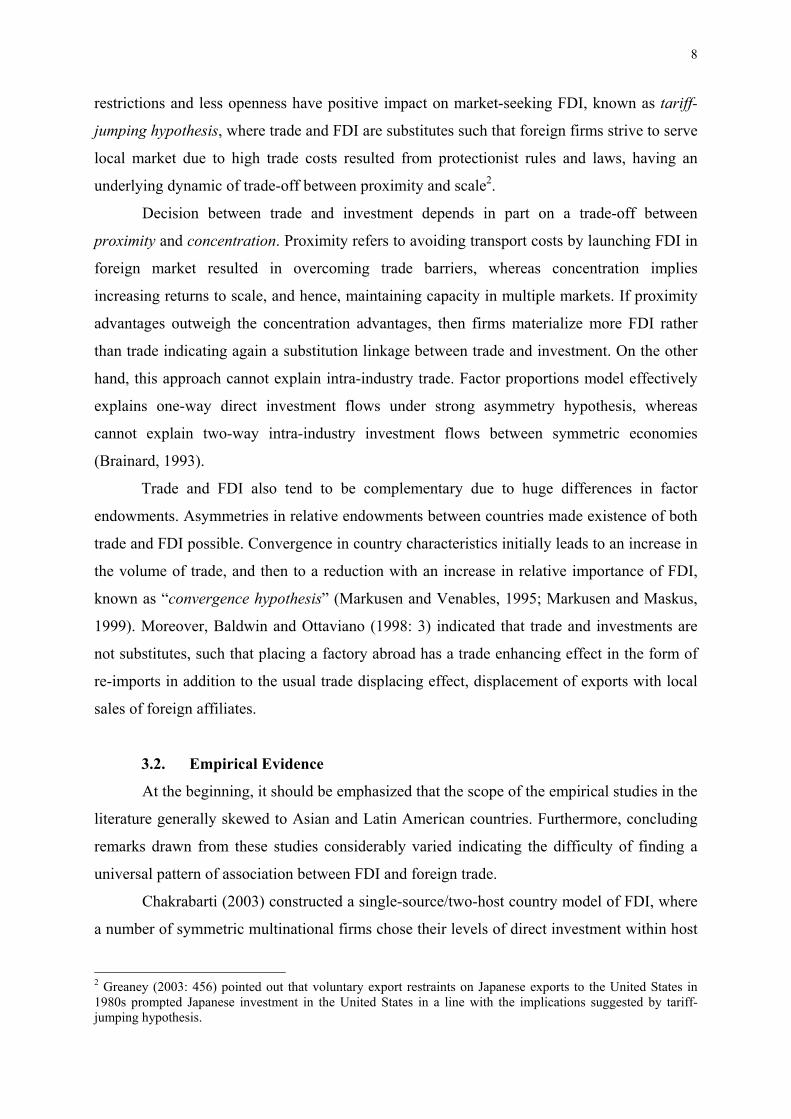
3.2. Empirical Evidence
At the beginning, it should be emphasized that the scope of the empirical studies in the
literature generally skewed to Asian and Latin American countries. Furthermore, concluding
remarks drawn from these studies considerably varied indicating the difficulty of finding a
universal pattern of association between FDI and foreign trade.
Chakrabarti (2003) constructed a single-source/two-host country model of FDI, where
a number of symmetric multinational firms chose their levels of direct investment within host
2 Greaney (2003: 456) pointed out that voluntary export restraints on Japanese exports to the United States in 1980s prompted Japanese investment in the United States in a line with the implications suggested by tariff-jumping hypothesis.
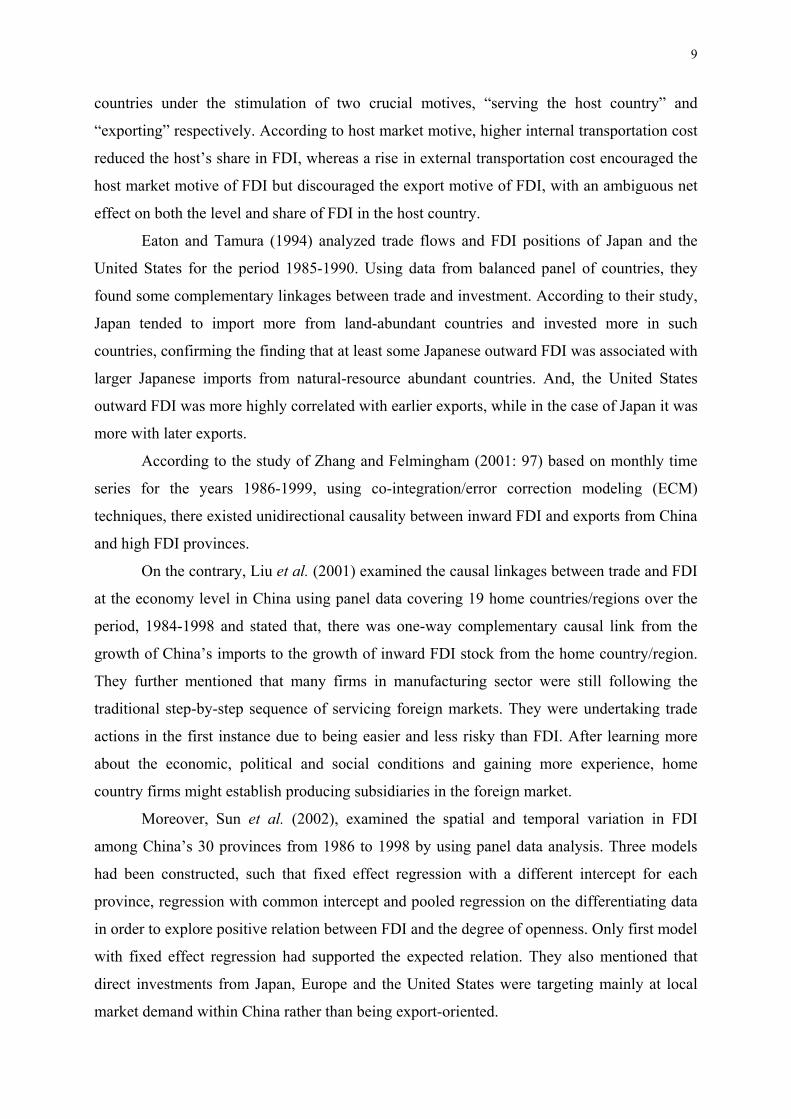
9
countries under the stimulation of two crucial motives, “serving the host country” and
“exporting” respectively. According to host market motive, higher internal transportation cost
reduced the host’s share in FDI, whereas a rise in external transportation cost encouraged the
host market motive of FDI but discouraged the export motive of FDI, with an ambiguous net
effect on both the level and share of FDI in the host country.
Eaton and Tamura (1994) analyzed trade flows and FDI positions of Japan and the
United States for the period 1985-1990. Using data from balanced panel of countries, they
found some complementary linkages between trade and investment. According to their study,
Japan tended to import more from land-abundant countries and invested more in such
countries, confirming the finding that at least some Japanese outward FDI was associated with
larger Japanese imports from natural-resource abundant countries. And, the United States
outward FDI was more highly correlated with earlier exports, while in the case of Japan it was
more with later exports.
According to the study of Zhang and Felmingham (2001: 97) based on monthly time
series for the years 1986-1999, using co-integration/error correction modeling (ECM)
techniques, there existed unidirectional causality between inward FDI and exports from China
and high FDI provinces.
On the contrary, Liu et al. (2001) examined the causal linkages between trade and FDI
at the economy level in China using panel data covering 19 home countries/regions over the
period, 1984-1998 and stated that, there was one-way complementary causal link from the
growth of China’s imports to the growth of inward FDI stock from the home country/region.
They further mentioned that many firms in manufacturing sector were still following the
traditional step-by-step sequence of servicing foreign markets. They were undertaking trade
actions in the first instance due to being easier and less risky than FDI. After learning more
about the economic, political and social conditions and gaining more experience, home
country firms might establish producing subsidiaries in the foreign market.
Moreover, Sun et al. (2002), examined the spatial and temporal variation in FDI
among China’s 30 provinces from 1986 to 1998 by using panel data analysis. Three models
had been constructed, such that fixed effect regression with a different intercept for each
province, regression with common intercept and pooled regression on the differentiating data
in order to explore positive relation between FDI and the degree of openness. Only first model
with fixed effect regression had supported the expected relation. They also mentioned that
direct investments from Japan, Europe and the United States were targeting mainly at local
market demand within China rather than being export-oriented.
10
Lin (1995) examined the bilateral trade effects of FDI between Taiwan and each of
four countries (Indonesia, Malaysia, Philippines, and Thailand), and indicated that Taiwan’s
FDI in those countries were a cause, rather than an effect of the expansion of trade. Least
squares method had been employed, and serial correlations had been taken into account for
the sample period 1972-1992. Major findings of the study can be summarized as; both current
and cumulative outward FDI had significant positive effect on exports; cumulative outward
FDI also had a significant positive effect on Taiwan’s imports from the host country except in
the case of Philippines; and current FDI showed no effect on Taiwan’s imports from the home
country, respectively. Furthermore, the trade effect of cumulative inward FDI had been found
to be inconsistent across countries in terms of sign and significance.
Goldberg and Klein (1997) presented a regression over a time series panel of direct
investment into each of the Latin American and Southeast Asian countries from either Japan
or the United States, and by using fixed effects model, cross section time series, and panel of
annual observations comprising of the period 1978-1993, and 1994, indicated that the source
of FDI had a strong influence such that in Latin American countries, neither imports from the
United States or Japan were responsive to FDI from either source. Direct investment from
both the United States and Japan significantly affected goods imported by Southeast Asian
countries. The sign of the relation between FDI and imports for the United States was
negative (substitute), whereas for Japan, it was positive (complement).
Furthermore, Cuadros et al. (2001) indicated a complementary relation between FDI
and trade by employing Granger’s concept of causality and formulating a vector
autoregressive system (VAR), comprised of exports, inward FDI, foreign income and
domestic income as being in real terms and expressed in natural logarithms, to test the
relationship between trade (export), inward FDI and output using quarterly (seasonally
adjusted) data for Argentina, Brazil and Mexico by concentrating on the period of the middle
of 1970s and 1997. Major findings confirmed a positive long-run causal relationship going
from FDI to exports in Mexico and Argentina. The Brazilian case, however, had been
supporting the existence of a negative relationship going from FDI to exports.
Helpman et al. (2003) used a multi-country, multi-sector general equilibrium model
attempting to explain the decision of heterogeneous firms to serve foreign markets either
through exports or local subsidiary sales (FDI). Testing the predictions of the model on the
United States exports and affiliate sales data covering 52 manufacturing industries and 38
countries for a single year, 1994, they indicated that firms tended to substitute FDI sales for
exports when transport costs were relatively high and when plant-level returns to scale were
11
relatively weak, and hence, confirmed the predictions of proximity-concentration trade-off
industries in which productivity levels vary highly across firms are characterized by a larger
volume of FDI sales relative to exports.
Studying on Sweden and the United States cases in order to explore impacts of FDI on
trade, Lipsey (1991) showed more positive effects on home country exports. However, the
direction of these effects is either not statistically significant or mixed.
In sum, consistent with the theoretical background, the studies covered in this section
had shown that, there were empirical findings on both being substitute and complement of
trade and foreign direct investment. Empirical evidence on trade and FDI linkages has been
changing according to the qualifications of samples, proxies used for unobservable variables,
and effects of unobserved/immeasurable factors. The essential problem is coming from hardly
observable factors and technologies, which determines the direct investment and trade
patterns. In the next section, impact of environmental regulations on FDI will be thoroughly
studied.
4. IMPACTS OF ENVIRONMENTAL REGULATIONS ON FOREIGN
DIRECT INVESTMENT
Globalization process and the concept of FDI also had brought to light environmental
regulations debate similar to the one related with the foreign trade. Actually, environmental
issues had drawn the attention of governmental and non-governmental organizations after
World War II, and particularly through the late 1950s.
From one point of view, industrialization growth and trade liberalization resulted in
environmental problems. In a line with this issue, Congleton (1992: 412) stated that countries
engaging in more production and/or more transport would, ceteris paribus, generate more
pollution. Similarly, as it is clearly pointed out by List and Co (2000: 5), economic intuition
suggested that prospective firms in pollution-intensive sectors should be more sensitive to
spatial variation in environmental rules and regulations than firms in non-pollution-intensive
industries, ceteris paribus.
Environmental regulation debate had arisen from an anxiety whether developing
countries create an unfair competition through lax regulations. While relating the factor
proportions with pollution warrants, and hence, exploring the common features of pollution
intensive industries, Cole and Elliott (2002: 6) analyzed the U.S industries and found that
sectors facing the greatest pollution abatement costs are typically more capital intensive than
12
the cleaner, less pollution intensive sectors. Furthermore, while taking the developing
countries into consideration with their common feature of being labor abundant and having
low capital accumulation, as Cole and Elliott (2002: 6-7) also implied, pollution intensive
industries would appear to be the less suitable for migration to the developing world unless
comparative advantage in pollution intensive output was driven purely by environmental
regulations.
Copeland and Taylor (1995: 716) mentioned that trade might tend to increase world
pollution by raising the scale of economic activity and by providing additional incentives for
polluting industries to locate in countries with low environmental standards. Conversely,
income gains, created by trade, might increase the pressure for tougher environmental
regulation and enforcement. From the cost perspective, Jaffe et al. (1995: 138) made a
statement that, environmental regulations affected a firm’s costs of production directly
through its own expenditures on pollution reduction, and indirectly through higher prices it
must pay for certain factors of production affected by the regulations. Also, they added that,
environmental regulations could reduce the costs for some firms and industries by lowering
input prices or by increasing the productivity of their inputs. On the way, in the following
section, existing theoretical debate consisting of the relation between environmental
regulations and FDI will be criticized.
4.1. Theoretical Background
There are two contrasting views about this debate. On the one hand, environment is
treated as another factor of production counted in the cost procedure that stringent
environmental regulations raise cost of production, known as classical comparative
advantage trade perspective in the literature. According to other view, known as neo-
technology trade perspective, it is arguable whether stringent environmental regulations
resulted in migration of dirty industries to locations with lax regulations.
Consistent with these theoretical perspectives, Jaffe et al. (1995: 133) mentioned two
types of view. One is conventional wisdom, implying environmental regulations resulted in
significant costs, slow productivity growth and loss of competitiveness reflecting declining
exports, increasing imports and long-term movement of industries’ capacity from the one
abroad (pollution-intensive) country; and the other, revisionist view, implying positive force
creating environmental regulations driving private firms and economy, stimulating
competitiveness. Nevertheless, there is little consistent empirical evidence for both
13
hypotheses. Cropper and Oates (1992: 698) indicated that costs of pollution control had not
loomed very large even in heavily polluting industries.
Moreover, with basic implications extended above and slight modifications,
differently labeled hypotheses could be encountered in the literature, such as pollution havens
versus pollution haloes hypothesis and Porter hypothesis; industrial flight/race-to-the-bottom
and race-to-the-top…etc. According to “pollution havens” hypothesis extended from
comparative advantage perspective mentioned above, in order to attract investment, less
developed countries through lax environmental regulations create comparative advantage in
pollution-intensive industries. More specifically, the countries with laxer standards –who are
mostly the less developed countries engaging in environmental dumping- seek to attract more
investments or try to get higher share from the world market by producing and exporting
pollution-intensive goods. On the other hand, the countries with tougher standards import the
pollution-intensive goods from these countries (Frankel and Rose, 2002).
Additionally, “industry flight” implies migration of polluting industries to locations
with lax environmental regulations, and hence, gives birth to “race-to-the-bottom” hypothesis
implying worsening procedure of environmental standards in the host country, whereas the
hypothesis “race-to-the-top” implies raising environmental standards, related with the
“pollution haloes” argument, indicating foreign firms pulling environmental standards upward
by using better management practices. Industry flight phenomenon mainly depended on
production cost concept. The discrepancies on production costs among countries will
encourage the industries to relocate their plants in a country providing low cost procedure.
Accordingly, lenient environmental regulations that a country impose, will give birth to low
cost situation. Controversially, according to “Porter hypothesis” extended from neo-
technology trade perspective, stringent environmental regulations stimulate the innovations
and make the regulatory country net exporter of the newly developed environmental
technologies.
Static view of environmental regulation suggests that there is a trade-off between
social benefits and private costs as well as between ecology and economy. According to
dynamic one, new paradigm that Porter and van der Linde (1995: 98) properly designed,
environmental standards can trigger innovation that may partially or more than fully offset the
costs of complying with them. On the other hand, Palmer et al. (1995) denied the mentioned
trade-off, and suggested several instances where environmental regulations operate on
pollution firms’ advantage.
14
Jaffe and Palmer (1997) put forth three extensions of the hypothesis for consideration.
First one, the “narrow version” -implying certain types of environmental regulations that
stimulate innovation- has not clear empirical implications considering the existing regulations.
Second one is “weak version” implying regulations that stimulate certain types of innovation,
whereas the last one, “strong version” suggests that regulation induces innovation whose
benefits exceed its costs making it socially desirable.
4.2. Empirical Evidence
Environmental costs do not actually constitute a crucial element in investment location
decisions. As Jaffe et al. (1995: 147) mentioned, if environmental regulations caused
industrial flight from developed countries, direct foreign investment by pollution-intensive
industries should increase over time, particularly in developing nations. According to OECD
(1997), most pollution-intensive FDI originating in industrialized countries were going to
other developed countries, rather than to developing ones3. Even in the developing countries,
the amount of inward investment in pollution-intensive industries was a smaller proportion of
total FDI receipts in 1992 than in 1972. To support the same argument, Letchumanan and
Kodama (2000: 66) underlined some empirical evidence such as no existing correlation
between FDI flows and pollution content of an industry there were, for developing countries.
According to their findings, Singapore and Thailand had negative correlation indicating that
FDI was occurring in relatively clean industries, whereas overall the United States and
Germany had higher correlation with pollution intensive industries compared to the
developing countries. Moreover, investments into the U.S. were occurring in more polluting
industries than investments from the U.S. to the rest of the world4. They also mentioned that
investments into Germany, as compared to outward investments, were occurring in cleaner
industries and outward investments from Japan were realized in less pollution intensive
industries.
On the contrary, Co et al. (2003), investigating on the United States FDI into
developed and developing countries through two manufacturing industries, by using annual
panel data on US direct investment into several countries from 1982 to 1992, and constructing
two-step selection model, confirmed that environmental regulations were influencing the U.S.
3 Table 1 and 2 also show that an immense portion of the FDI flows is allocated to the developed countries. 4 In fact, there is a burgeoning literature that examines U.S. inward FDI and plant location choice but at the country level. Among others, see for instance, Bartik (1988), Levinson (1996) and List (2001).
15
manufacturers’ investment decisions. Also, they argued that environmental standards and FDI
flows were inversely related for the average developing country. This negative relation,
however, might not be the case for all developing countries.
Furthermore, Kolstad and Xing (1998) attempted to evaluate empirically the effects of
the stringency of environmental policy on the location of the polluting industries, and
declared that the stringency of environmental regulations did matter in the case where other
determinants of FDI remained constant. Specifically, they had analyzed the relationship
between the capital outflow of several U.S. industries and the environmental policy of the
destination country. According to their analysis, there existed statistically significant negative
linear relationship between FDI of the U.S. chemical industry and the stringency of
environmental policy in a foreign host country. Nevertheless, for the less polluting industries,
the same trend could not be explored. In general, according to their study, lax environmental
policy tends to attract FDI from U.S. pollution intensive industries.
In another interesting work, Cole and Elliott (2002) had studied on the determinants of
U.S. outbound FDI within pollution intensive industries. According to their single sector and
multi-country analysis, factor endowments were found to be the main determinants of FDI
within pollution intensive sectors. However, similar conclusion could not be driven for
environmental regulations. This conclusion is evaluated as consistent with capital intensity
feature of pollution intensive sectors for U.S. industries. On the other hand, while the analysis
was employed for multi-sector and single country such for investigating the determinants of
multi-sector FDI to specific countries, namely Brazil and Mexico, which had high capital-
labor ratios and relatively low environmental regulations, Cole and Elliott (2002) found that
physical capital intensity of a sector and the pollution abatement costs within the sector were
positively related and statistically significant determinants of U.S. FDI to Brazil and Mexico.
Keller and Levinson (1999) employed a panel of annual measures of relative
regulatory stringency from 1977 to 1994, allowed to control for unobserved state
characteristics that might be correlated with both FDI and compliance costs while controlling
other characteristics of state. They found some evidence of small deterrent effects of
environmental regulations, particularly in pollution-intensive industries, but no evidence of
large or widespread effects.
Gray and Shadbegian (1998), by employing two samples of plants covering the period
1979-1990 -the full sample of 116 plants for basic analysis examining whether technology,
product mix or state regulatory stringency affects annual investment; and sub-sample of 68
plants for analyzing effects of pollution abatement investment on other investments, indicated
16
that with a sizable magnitudes, new plants in more stringent states were less likely to
incorporate the dirtier production technologies, and significant connections between pollution
abatement and production investment. Furthermore, they mentioned that firms shift their
investments towards plants facing with less stringent abatement requirements.
Levinson (1999) presented regressions of FDI on country characteristics using a time
series of data and the industry-adjusted index of environmental regulatory stringency,
industry-adjusted index of state environmental compliance costs from 1977 to 1994.
According to cross-section comparison of countries, positive correlation of FDI with
stringency was statistically insignificant, whereas in chemical industry coefficient was found
as negative and statistically significant. As they had mentioned, if countries had unobserved
characteristics correlated with both FDI and regulatory stringency cross-section results were
likely biased. In the analysis of the effect of regulatory stringency on economic activity (FDI),
time-series analyses using the industry-adjusted index had more sensible results than cross-
sectional analyses, or than analyses using the unadjusted cost index.
Smarzynska and Wei (2001) found some support for the “pollution haven” hypothesis
by using firm-level data set describing investment decision by 534 major multinational firms
in 24 countries from Central/Eastern Europe and the former Soviet Republics instead of
country/industry level. The major supportive evidence came when a country’s environmental
standard was measured by its participation in international environmental treaties. In this case,
investment from pollution-intensive multinational firms as a share of total inward FDI was
lower for host countries with higher environmental standards. On the contrary, just revealed in
other studies, support for “pollution haven” hypothesis was not robust to various sensitivity
checks5.
As a result, literature survey on environmental regulations-FDI linkage had shown that
there were few studies achieving robust and meaningful empirical evidence supporting the
theoretical background. Many findings were not robust or at least far from giving a complete
support to the analytical framework designed to capture the liaisons between international
investments and environmental regulations. Hence, meticulous studies need to be performed
in this field, and the empirical analysis elaborated in the following section might be
considered in this context.
5 For more information about the literature, see Frankel (2002).
17
5. The Impact of Environmental Regulations on the FDI of OECD Countries:
An Empirical Analysis
At the beginning of this section, the model is described. Afterwards, the data, variables
and the methodology used to conduct the empirical analysis are explained. Finally, the results
together with their interpretations are presented.
5.1. The Model
Basing on Dunning (1981; 1988)’s integrated approach, determinants of the
outward/inward FDI were collected under three groups that focus on locative advantages
(market size and potential), ownership-specific advantages (factor endowments) and,
internalization advantage (incentives and disincentives to FDI). Locative advantages are
created by the market size and potential in the market and four variables were used to proxy
the market size and potential. These are per capita GDP, share of manufactured exports in
total GDP, import growth and environmental regulations. Ownership-specific advantages are
related to the quality and quantity of factors of production. Some of the variables used are
land per capita, share of gross domestic investment in GDP, gross domestic savings over
GDP, share of research and development expenditures, labour force participation rate, labour
productivity, share of scientists and engineers in total employment, and other variables to
proxy skilled labour. Internalization advantage involves the incentives and disincentives to
FDI such as political stability, openness of the country, protection policies, indirect taxes as
percentage of GDP etc.
A number of estimation was carried out in order to see the impact of various factors on
the outward and inward FDI. Different samples (for example: bilateral FDI between
developed and developing OECD countries; bilateral FDI between all OECD countries; total
FDI inflow to the OECD countries) were used to check the consistency of the explanatory
variables. In the estimation process the common observed problem was the low level of
adjusted R-square, in spite of the obtained “expected coefficient signs” which were mostly
statistically significant. One general finding was the influence of the environmental variable
on the FDI in most of the different samples used. Only the result obtained from the FDI
outflow equation was presented in this paper, due to its relatively higher adjusted R-square
among the other equations. The specified FDI outflow equation and the expected coefficient
18
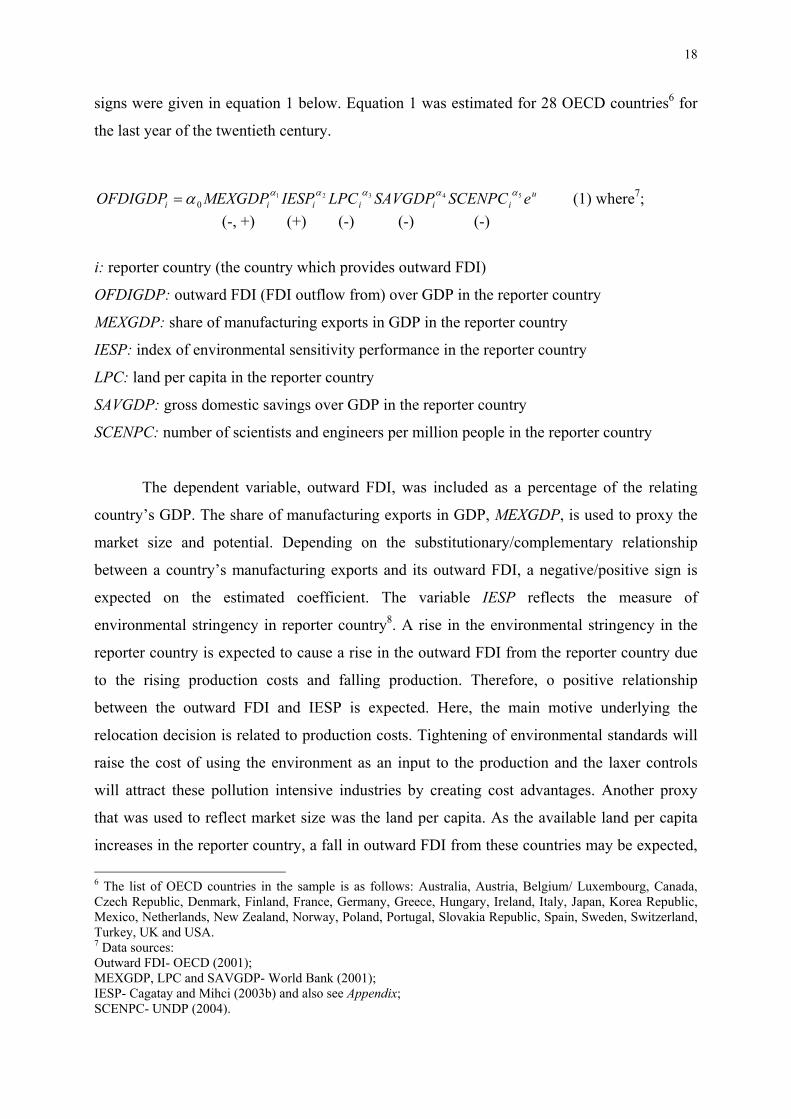
signs were given in equation 1 below. Equation 1 was estimated for 28 OECD countries6 for
the last year of the twentieth century.
uiiiiii eSCENPCSAVGDPLPCIESPMEXGDPOFDIGDP 54321
0αααααα= (1) where7;
(-, +) (+) (-) (-) (-)
i: reporter country (the country which provides outward FDI)
OFDIGDP: outward FDI (FDI outflow from) over GDP in the reporter country
MEXGDP: share of manufacturing exports in GDP in the reporter country
IESP: index of environmental sensitivity performance in the reporter country
LPC: land per capita in the reporter country
SAVGDP: gross domestic savings over GDP in the reporter country
SCENPC: number of scientists and engineers per million people in the reporter country
The dependent variable, outward FDI, was included as a percentage of the relating
country’s GDP. The share of manufacturing exports in GDP, MEXGDP, is used to proxy the
market size and potential. Depending on the substitutionary/complementary relationship
between a country’s manufacturing exports and its outward FDI, a negative/positive sign is
expected on the estimated coefficient. The variable IESP reflects the measure of
environmental stringency in reporter country8. A rise in the environmental stringency in the
reporter country is expected to cause a rise in the outward FDI from the reporter country due
to the rising production costs and falling production. Therefore, o positive relationship
between the outward FDI and IESP is expected. Here, the main motive underlying the
relocation decision is related to production costs. Tightening of environmental standards will
raise the cost of using the environment as an input to the production and the laxer controls
will attract these pollution intensive industries by creating cost advantages. Another proxy
that was used to reflect market size was the land per capita. As the available land per capita
increases in the reporter country, a fall in outward FDI from these countries may be expected, 6 The list of OECD countries in the sample is as follows: Australia, Austria, Belgium/ Luxembourg, Canada, Czech Republic, Denmark, Finland, France, Germany, Greece, Hungary, Ireland, Italy, Japan, Korea Republic, Mexico, Netherlands, New Zealand, Norway, Poland, Portugal, Slovakia Republic, Spain, Sweden, Switzerland, Turkey, UK and USA. 7 Data sources: Outward FDI- OECD (2001); MEXGDP, LPC and SAVGDP- World Bank (2001); IESP- Cagatay and Mihci (2003b) and also see Appendix; SCENPC- UNDP (2004).
19
due to the decreasing cost of land and/or to the increasing domestic market size. So, a
negative relationship between LPC and outward FDI is expected. In order to represent the
availability of investment capital, gross domestic savings over GDP in the reporter country
was used. It is expected that, a rise in the domestically available capital would decrease the
cost of that capital (so production cost) which may yield a fall in outward FDI from the
reporter country. Therefore, a negative relationship is expected between SAVGDP and
outward FDI. Finally, rate of total number of scientists and engineers in total population was
used in order to reflect the availability of the qualified labour. As in the cases of available
land and capital, a rise in the above ratio in the reporter country may impose a fall on the
outward FDI from this country again a negative sign is expected.
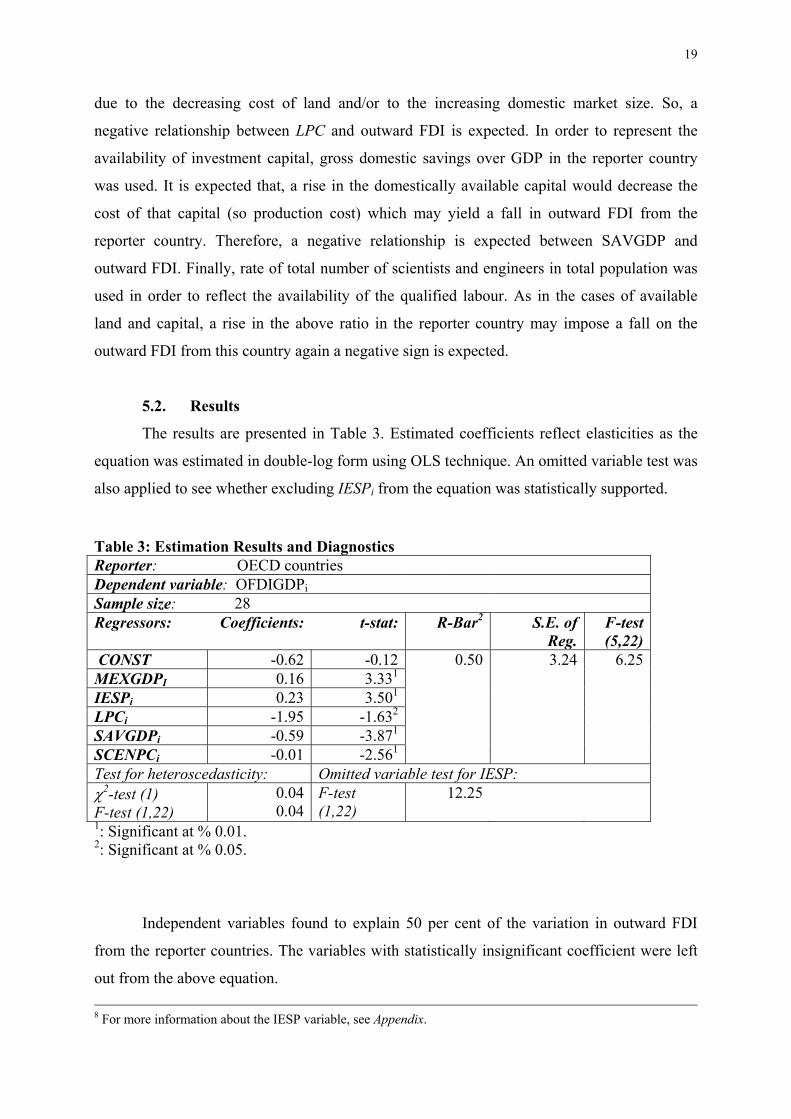
5.2. Results
The results are presented in Table 3. Estimated coefficients reflect elasticities as the
equation was estimated in double-log form using OLS technique. An omitted variable test was
also applied to see whether excluding IESPi from the equation was statistically supported. Table 3: Estimation Results and Diagnostics Reporter: OECD countries Dependent variable: OFDIGDPi Sample size: 28 Regressors: Coefficients: t-stat: R-Bar2 S.E. of
Reg. F-test (5,22)
CONST -0.62 -0.12 0.50 3.24 6.25 MEXGDPI 0.16 3.331 IESPi 0.23 3.501 LPCi -1.95 -1.632 SAVGDPi -0.59 -3.871 SCENPCi -0.01 -2.561 Test for heteroscedasticity: Omitted variable test for IESP: χ2-test (1) F-test (1,22)
0.04 0.04
F-test (1,22)
12.25
1: Significant at % 0.01. 2: Significant at % 0.05.
Independent variables found to explain 50 per cent of the variation in outward FDI
from the reporter countries. The variables with statistically insignificant coefficient were left
out from the above equation. 8 For more information about the IESP variable, see Appendix.
20
All the estimated coefficients had a priori expected signs, and for most of the variables
t-statistics of the estimated coefficients indicate statistical significance at 1 per cent level. The
F-test result, in general, rejected exclusion of the IESPi from the above equation. In other
words, omission of the IESPi would result in misspecification error. This technical finding is
consistent with theoretical expectations suggesting the inclusion of an environmental
stringency variable in a FDI model.
The results related with the IESPi variable (both in the above equation and in
equations that used different samples) merit further interpretations because with a very few
exceptions, they support the argument that environmental stringency has a considerable
impact on the FDI flows. The impact of the degree of environmental stringency on the
outward FDI is significantly positive suggesting a direct relationship between FDI outflows
and the level of environmental sensitivity performance of the countries. Moreover, it can be
argued that the rise in the relative environmental stringency of the countries influences
production structure and international competitiveness of the environmentally sensitive
manufacturing commodities by rising production costs, and hence, decreasing production
activities and increasing outward FDI.
Additionally, the positive relation between IESPi variable and FDI outflows might also
be interpreted as a sign of support for “industrial flight hypothesis” since FDI outflows seems
to increase when the level of environmental sensitivity performance of the countries rises.
Consequently, the displacement of the investment location has been observed to obtain
production cost advantages. To put differently, the rise in the stringency of domestic
environmental regulations, which adversely affects the competitive position of domestic
firms, push investments out of the national boundaries towards the countries with laxer
environmental regulations in the case of OECD countries. However, it should be noted that
the present study could only use total FDI flows statistics for each country rather than the
sectoral levels due to the lack of the available data.
On the other hand, positive sign of the estimated coefficient for the share of
manufacturing exports in GDP (MEXGDP) indicates a complementary relationship between
OECD countries’ manufacturing exports and their outward FDI rather than a substitutionary
one. In other words, for OECD countries, trade and FDI tend to be complementary due to
huge differences in factor endowments that give a support for convergence hypothesis. It may
also be argued that the countries in the sample attempt to enlarge their market size through
locative advantages. In doing so, FDI outflows play a complementary role with the
manufacturing exports.
21
The last but not the least, the results also point out the importance of the ownership-
specific advantages for the FDI flows of the OECD countries. Inverse relationships between
FDI inflows and land per capita (LPC), share of gross domestic savings in GDP (SAVGDP)
and number of scientists and engineers per million people (SCENPC) show that quality and
quantity of factors of production should be closely concerned in the international investments
decisions of the countries. In other words, the lack or inefficient allocation of the domestic
resources may stimulate FDI outflows in the case of OECD countries. This finding seems to
be also consistent with the convergence hypothesis briefly discussed above.
6. CONCLUSION
The main objective of this study has been to evaluate the impact of environmental
regulations on FDI flows of the countries. To be specific, we tested the relationship between
capital outflows of OECD countries and environmental regulations. This paper also
introduced an index which is constructed depending on the pressure, state and response
environmental indicator framework of the OECD, and which is used to measure the
environmental stringency of the OECD countries.
IESP is used in a model of foreign direct investment to explore the effects of various
degrees of environmental stringency on the foreign direct investments of the OECD countries.
The econometric analysis in this paper finds some evidence to suggest that environmental
regulations have an important impact on the FDI outflows of the OECD countries. The impact
of the degree of environmental regulations on the FDI is significantly positive implying a
direct relationship between FDI outflows and relative environmental sensitivity performance
of the nations.
Furthermore, the positive association between environmental sensitivity performance
and FDI outflows of the countries could also be apprehended as a support for industrial flight
hypothesis due to the fact that FDI outflows seem to increase when the degree of
environmental sensitivity of the countries rises. Accordingly, the displacement of the
investment location argument might be proposed.
Nevertheless, the present study should be extended to the sectoral levels, and
especially to pollution intensive industries in order to achieve more strong results. The small
size of our data set further suggests that future works should concentrate on rising number of
the countries in the sample and elaborate more detailed empirical analysis.
22
Additionally, the present paper indicated that trade, and especially manufacturing
exports, and FDI outflows tend to be complementary rather than substitute due to the
differences in factor endowments. This finding might be interpreted as the OECD countries
endeavour to enlarge their market size through locative advantages. In this process, FDI
outflows complement with the foreign trade.
Finally, empirical analysis also underlined the importance of the factors of production
while taking into account the investment decisions abroad. This means that allocational
problems in domestic resources could be considered as factors inducing FDI outflows in the
case of OECD countries.
As a conclusion, it can be stated that the current study contributed to the evidence
supporting that the degree of environmental regulations has a significant impact on the foreign
direct investment patterns of the countries. This statement is particularly valid for the FDI
outflows of the OECD countries.
APPENDIX
IESP: INDEX OF ENVIRONMENTAL SENSITIVITY PERFORMANCE
The presentation of IESP starts with the meaning and calculation of the index, and
proceeds with the main findings.
Definition and Calculation of IESP
IESP is built to measure and compare the environmental stringency of countries
based on the relative degree of pollution generated during certain industrial activities and
related efforts of economic agents to improve environmental quality. There are four main
environmental issues, sub-indices, included in IESP that are classified according to the type of
environmental damage caused by various industrial activities. These sub-indices are climate
change, acidification, use of water resources and waste management. Two main criteria are
employed to determine the coverage of the sub-indices. Firstly, the potential environmental
issues or the environmental damages based on these issues have directly to be related to an
industrial activity, as IESP is prepared to focus on different types of industrial pollution.
23
Secondly, the available data on these issues must not be too restrictive to limit the country
coverage of IESP.
The indicators for each of these sub-indices are chosen based on a conceptual
framework, which enables variety of environmental information to be structured in a cause-
effect relationship. This conceptual framework, which is first developed by the Organisation
of Economic Co-operation and Development (OECD), is mainly depended on environmental
pollution and corresponding environmental quality-improving efforts of economic agents
included under the pressure-state-response indicator framework (Hammond et al., 1995). In
this context, pressure indicators are used to determine the sources of various stresses yielding
in environmental changes, while state indicators are used for measuring the environmental
quality. Response indicators measure the efforts of certain agents in the economy to improve
the environmental quality and/or to protect the environment from different sources of
pollutive activities either by applying renouncing measures or by decreasing pollutive effects
of certain activities.
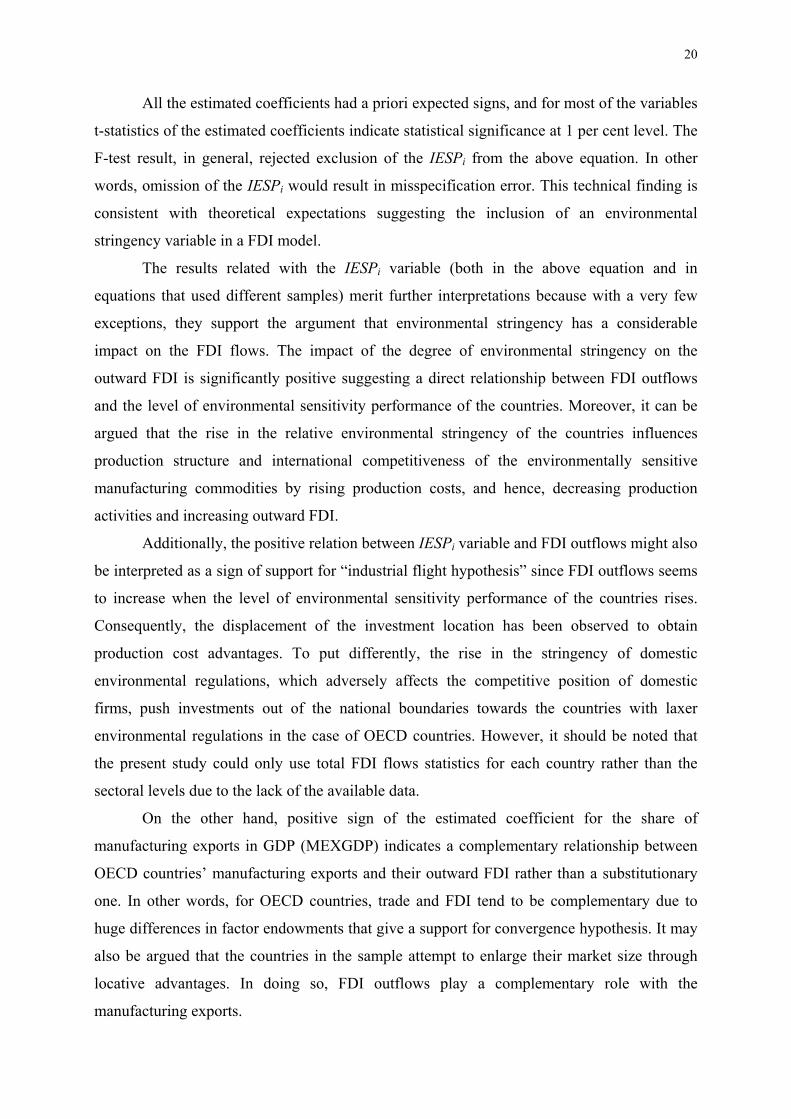
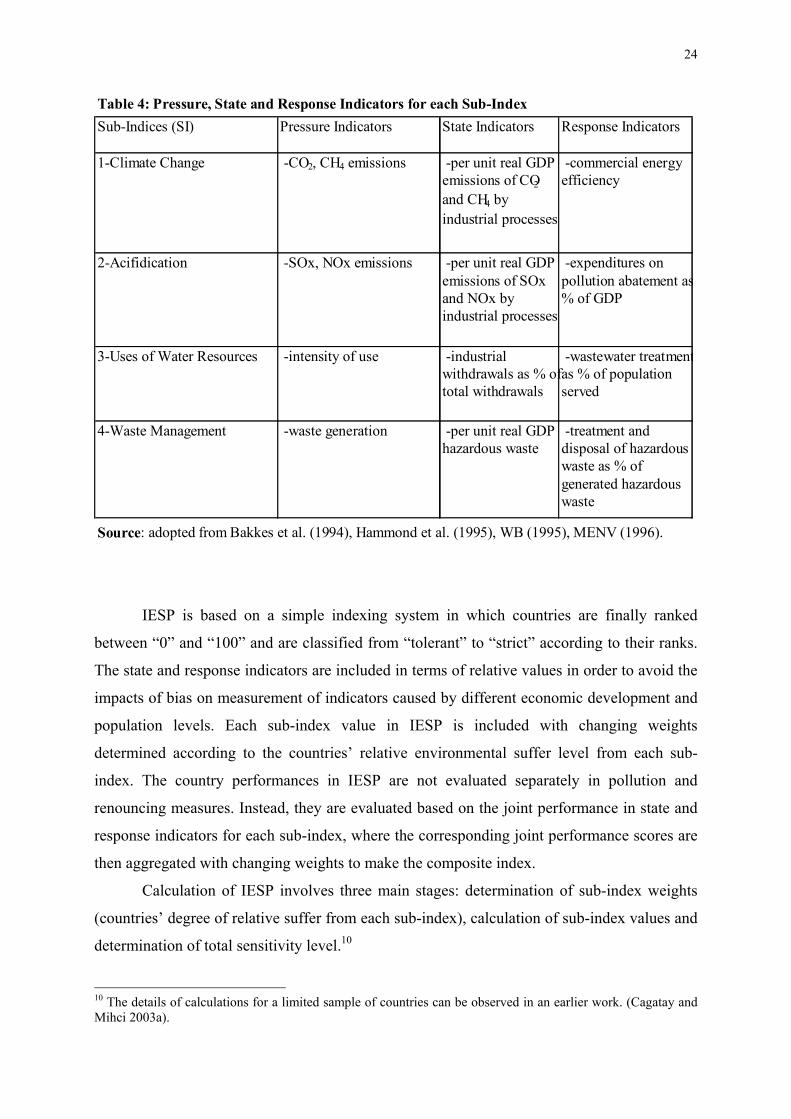
The list of pressure, state and response indicators for each sub-index are presented in
Table 49. The pollution indicators and environmental quality-improving measures are
determined based on the previous works of Bakkes et al. (1994), Hammond et al. (1995),
World Bank (1995) and MENV (1996). According to this matching, while all the state
indicators emphasize the level of environmental pollution caused by certain industrial
processes, the level of corresponding response indicators emphasizes the efforts of economic
agents to improve environmental quality. It is assumed that the higher the level of response
indicators in each sub-index, the higher the sensitiveness and strictness of public/private
agents against the environmental damage.
9 The definitions and other details related with the pressure, state and response indicators for each sub-index can be found in Cagatay and Mihci (2003a).
24
Table 4: Pressure, State and Response Indicators for each Sub-IndexSub-Indices (SI) Pressure Indicators State Indicators Response Indicators
1-Climate Change -CO2, CH4 emissions -per unit real GDPemissions of CO2
and CH4 byindustrial processes
-commercial energyefficiency
2-Acifidication -SOx, NOx emissions -per unit real GDPemissions of SOxand NOx byindustrial processes
-expenditures onpollution abatement as% of GDP
3-Uses of Water Resources -intensity of use -industrialwithdrawals as % oftotal withdrawals
-wastewater treatmentas % of populationserved
4-Waste Management -waste generation -per unit real GDPhazardous waste
-treatment anddisposal of hazardouswaste as % ofgenerated hazardouswaste
Source: adopted from Bakkes et al. (1994), Hammond et al. (1995), WB (1995), MENV (1996).
IESP is based on a simple indexing system in which countries are finally ranked
between “0” and “100” and are classified from “tolerant” to “strict” according to their ranks.
The state and response indicators are included in terms of relative values in order to avoid the
impacts of bias on measurement of indicators caused by different economic development and
population levels. Each sub-index value in IESP is included with changing weights
determined according to the countries’ relative environmental suffer level from each sub-
index. The country performances in IESP are not evaluated separately in pollution and
renouncing measures. Instead, they are evaluated based on the joint performance in state and
response indicators for each sub-index, where the corresponding joint performance scores are
then aggregated with changing weights to make the composite index.
Calculation of IESP involves three main stages: determination of sub-index weights
(countries’ degree of relative suffer from each sub-index), calculation of sub-index values and
determination of total sensitivity level.10
10 The details of calculations for a limited sample of countries can be observed in an earlier work. (Cagatay and Mihci 2003a).
25
IESP Values
The twin criterion of objectivity and unbiasedness has been taken into consideration in
the process of constructing IESP. While this consideration can be evaluated as one of the
distinguishing features of IESP from alternative measures, it also restricted the coverage of
the index to some extent in terms of environmental issues and countries.
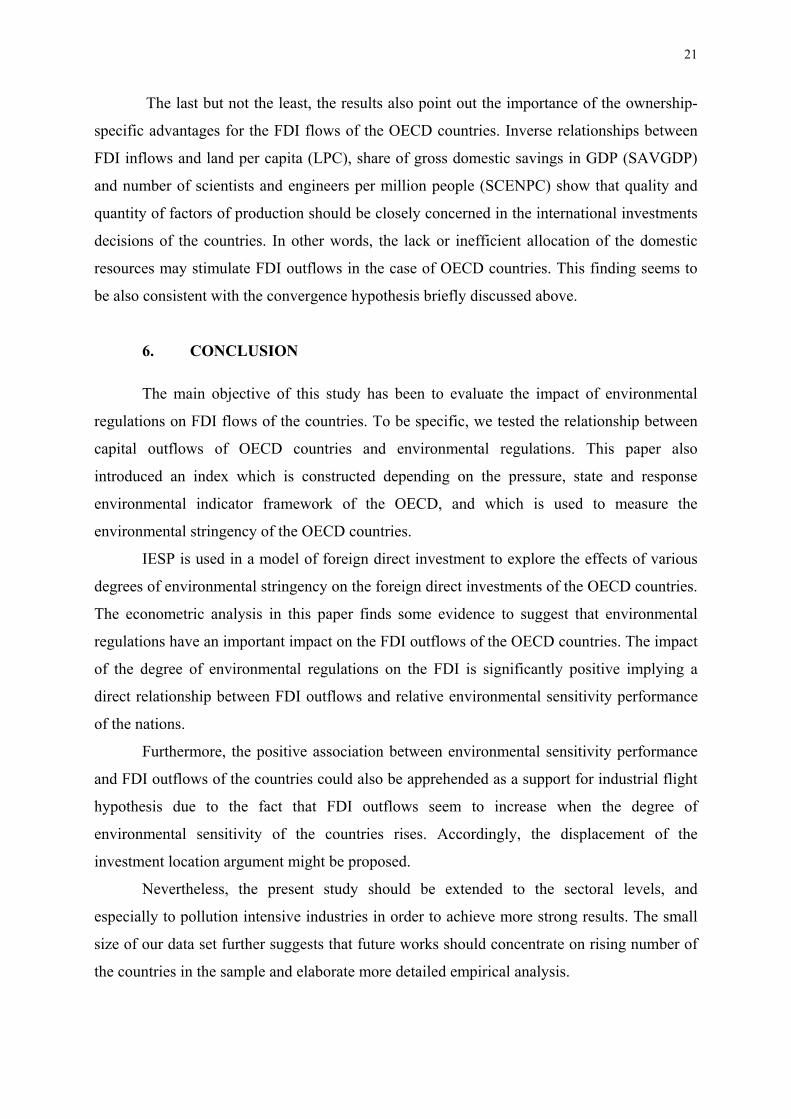
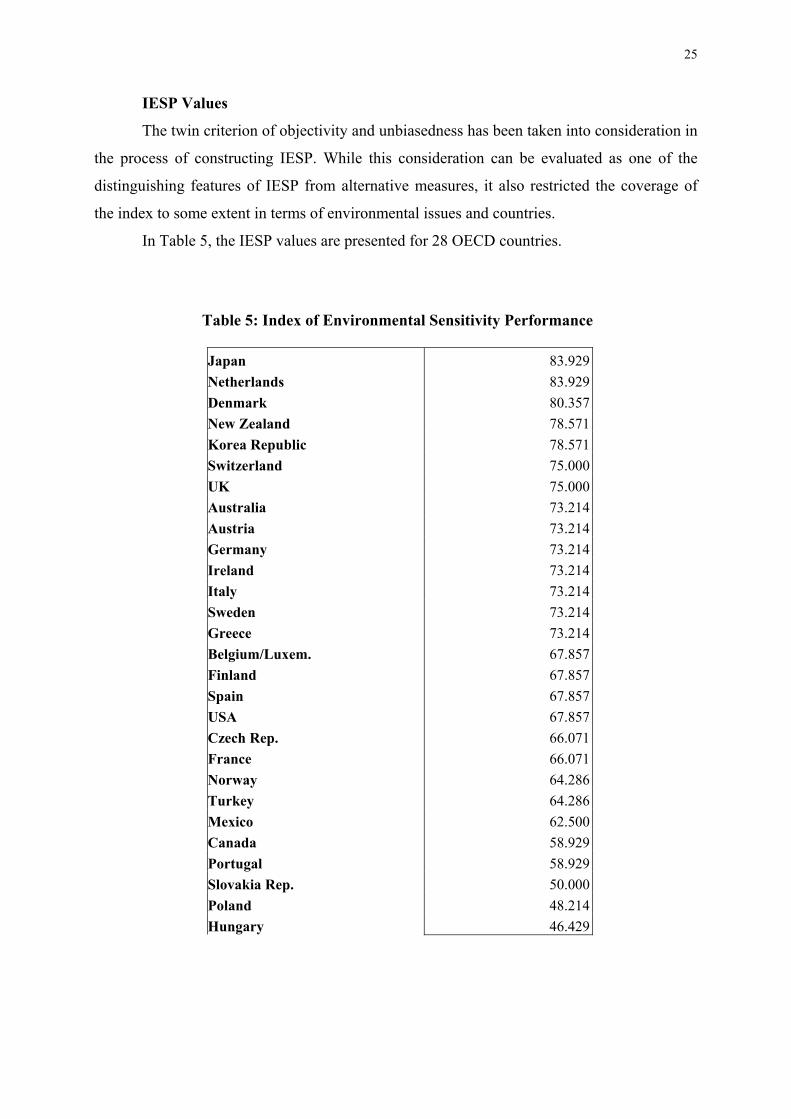
In Table 5, the IESP values are presented for 28 OECD countries.
Table 5: Index of Environmental Sensitivity Performance
Japan 83.929 Netherlands 83.929 Denmark 80.357 New Zealand 78.571 Korea Republic 78.571 Switzerland 75.000 UK 75.000 Australia 73.214 Austria 73.214 Germany 73.214 Ireland 73.214 Italy 73.214 Sweden 73.214 Greece 73.214 Belgium/Luxem. 67.857 Finland 67.857 Spain 67.857 USA 67.857 Czech Rep. 66.071 France 66.071 Norway 64.286 Turkey 64.286 Mexico 62.500 Canada 58.929 Portugal 58.929 Slovakia Rep. 50.000 Poland 48.214 Hungary 46.429
26
REFERENCES
Asiedu, E. (2002). “On the Determinants of Foreign Direct Investment to Developing Countries: Is Africa Different?”, World Development, 30, 1: 107-119.
Bakkes, J.A., van den Born, G.J., Helder, J.C., Swart, R.J., Hope, C.W., Parker, J.D.E. (1994).
An Overview of Environmental Indicators: State of the Art and Perspectives. United Nations Environmental Program (UNEP).
Baldwin, R. E. and Ottaviano, G. I. P. (1998). “Multiproduct Multinationals and Reciprocal
FDI Dumping”, NBER Working Paper: 6483. Bartik, T. (1988). “The Effects of Environmental Regulations on Business Location in the
United States, Growth and Change, 22-44. Beghin, J. and Potier, M. (1997). “Effects of Trade Liberalization on the Environment in the
Manufacturing Sector”, World Economy. 20, 4: 435-456. Blomström, M. and Kokko, A. (2003). “The Economics of Foreign Direct Investment
Incentives”, NBER Working Paper: 9489. Brainard, S. L. (1993). “A Simple Theory of Multinational Corporations and Trade with a
Trade-Off between Proximity and Concentration”, NBER Working Paper: 4269. Carius, A. (2002). “Environmental Impacts of Foreign Direct Investment in the Mining Sector
in the Newly Independent States.” Conference Paper, OECD Global Forum on International Investment: Conference on Foreign Direct Investment and the Environment. “Lessons to be learned from the Mining Sector” February 7-8, Paris: France.
Cagatay, S. and Mihci, H. (2003a). “Industrial Pollution, Environmental Suffering
And Policy Measures: An Index of Environmental Sensitivity Performance (IESP)”, Journal of Environmental Assessment Policy and Management, 5, 2: 205-245.
Cagatay, S. and Mihci, H. (2003b). “Degree of Environmental Stringency and Impact on
Trade Patterns”. Paper presented at the 5th Annual International Conference of the European Trade Study Group (ETSG) in Madrid.
Chakrabarti, A. (2003). “A Theory of the Spatial Distribution of Foreign Direct Investment”,
International Reviews of Economics and Finance, 12: 149-169. Co, C. Y., List, J. A. and Qui, L. D. (2003). “Intellectual Property Rights, Environmental
Regulations and Foreign Direct Investment” Forthcoming in Land Economics Cole, M. A. and Elliott, R. J. R. (2002). “FDI and the Capital Intensity of ‘Dirty’ Sectors: A
Missing Piece of the Pollution Haven Puzzle”, University of Birmingham, Department of Economics Discussion Paper: 02/04.
Congleton, R. D. (1992). “Political Institutions and Pollution Control”, The Review of
Economics and Statistic, 74, 3: 412-421.
27
Copeland, B. R. and Taylor, M. S. (1995). “Trade and Transboundary Pollution” The
American Economic Review, 85, 4: 716-737 Cropper, M. L. and Oates, W. E. (1992). “Environmental Economics: A Survey”, Journal of
Economic Literature, 30, 2: 675-740. Cuadros, A., Orts, V. and Alguacil, M. T. (2001). “Openness and Growth: Re-Examining
Foreign Direct Investment, Trade and Output Linkages in Latin America”, CREDIT Research Paper: 01/04.
Dunning, J. (1988). Explaining International Production. Dunning, J. (1981). International Production and the Multinational Enterprise. Sydney:
George Allen and Unwin. Eaton, J. and Tamura, A. (1994). “Bilateralism and Regionalism in Japanese and U.S. Trade
and Direct Foreign Investment Patterns”, Journal of the Japanese and International Economies, 8, 4: 478-510.
Ekholm, K., Forslid R. and Markusen, J. R. (2003). “Export-Platform Foreign Direct
Investment”, NBER Working Paper: 9517. Fredriksson, P. G., List. J. A. and Millimet, D. L. (2003). “Bureaucratic Corruption,
Environmental Policy and inbound US FDI: Theory and Evidence”, Journal of Public Economics, 87: 1407-1430.
Frankel, J.A. (2002). “TheEnvironment and Economic Globalization”, in M. Weinstein (ed.), Globalization: What is New?. Cambridge. Frankel, J.A. and Rose, A.K. (2002). “Is Trade Good or Bad for the Environment? Sorting Out the Causality”, NBER Working Paper:9201. Goldberg, L. S. and Klein, M. W. (1997). “Foreign Direct Investment, Trade and Real
Exchange Rate Linkages in Southeast Asia and Latin America” In R. Glick (Ed.), Managing Capital Flows and Exchange Rates: Perspectives from the Pacific Basin (73-100). Cambridge: Cambridge University Press.
Gray, W. B. and Shadbegian, R. J. (1998). “Environmental Regulation, Investment Timing,
and Technology Choice”, The Journal of Industrial Economics, 64, 2: 235-256 Greaney, T. M. (2003). “Reverse Importing and Asymmetric Trade and FDI: A Networks
Explanation”, Journal of International Economics, 61: 453-465. Hammond, A., Adriaanse, A., Rodenburg, E., Bryant, D., Woodward, R. (1995).
Environmental Indicators. World Resources Institute. Helpman, E., Melitz, M. J. and Yeaple, S. R. (2003). “Export versus FDI”, NBER Working
Paper: 9439.
28
Jaffe, A. B. and Palmer, K. (1997). “Environmental Regulation and Innovation: A Panel Data Study”, The Review of Economics and Statistics, 79, 4: 610-619.
Jaffe, A. B., Peterson. S. R., Portney. P. R. and Stavins. R. N. (1995). “Environmental
Regulation and the Competitiveness of U.S. Manufacturing: What Does the Evidence Tell Us?”, Journal of Economic Literature, 33, 1: 132-163.
Keller, W. and Levinson, A. (1999). “Environmental Compliance Costs and Foreign Direct
Investment Inflows to U.S. States”, NBER Working Paper: 7369. Kolstad, C. and Xing, Y. (1998). “Do Lax Environmental Regulations Attract Foreign
Investment?”, Department of Economics, UC Santa Barbara; Economics Working Paper: 1078.
Letchumanan, R. and Kodama, F. (2000). “Reconciling the Conflict Between the ‘pollution-
haven’ Hypothesis and an Emerging Trajectory of International Technology Transfer”, Research Policy, 29: 59-79.
Levinson, A. (1999). “An Industry-Adjusted Index of State Environmental Compliance
Costs”, Conference on the Distributional and Behavioral Effects of Environmental Policy, June 11-12, Milan: Italy.
Levinson, A. (1996). “Environmental Regulations and Manufacturer’s Location Choices:
Evidence from the Census of Manufacturing”, Journal of Public Economics, 61, 1:5-29.
Lin, A. (1995). “Trade effects of foreign direct investment: Evidence for Taiwan with four
ASEAN countries”, Weltwirtschaftliches Archiv, 131: 737-747. Lipsey, R. E. (2002). “Home and Host Country Effects of FDI”, NBER Working Paper:
9293. Lipsey, R. E. (2000). “Interpreting Developed Countries’ Foreign Direct Investment”, NBER
Working Paper: 7810. Lipsey, R. E. (1991). “Foreign Direct Investment in the U.S. and U.S. Trade”, NBER Working
Paper: 3623. List, J.A. (2001). “U.S. Country-Level Determinants of Inbound FDI: Evidence from a Two-
Step Modified Count Data Model”, International Journal of Industrial Organization, 19, 6:953-973.
List, J. A. and Co, C. Y. (2000). “The Effects of Environmental Regulations on Foreign
Direct Investment”, Journal of Environmental Economics and Management, 40: 1-20 Liu, X., Wang, C. and Wei, Y. (2001). “Causal Links between Foreign Direct Investment and
Trade in China”, China Economic Review, 12: 190-202. Markusen, J. R. and Maskus, K. E. (1999). “Multinational Firms: Reconciling Theory and
Evidence”, NBER Working Paper: 7163.
29
Markusen, J. R. and Venables, A. J. (1995). “Multinational Firms and the New Trade
Theory”, NBER Working Paper: 5036. MENV (Ministry of Environment) New Zealand (1996). National Environmental Indicators:
Building a Framework for a Core Set. January. OECD (2001). International Direct Investment Statistics Yearbook 1980-2000. Paris. OECD, Secreteriat. (1997). Negotiating Group on the Multilateral Agreement on Investment,
Prepared during MAI Negotiations. (1995-1998) “Foreign Direct Investment and the Environment: An Overview of the Literature”, DAFFE/MAI (97) 33, 1.
Palmer, K., Wallace. E. O. and Portney, P. R. (1995). “Tightening Environmental Standards:
The Benefit-Cost or the No-Cost Paradigm”, The Journal of Economic Perspectives, 9, 4: 119-132.
Porter, M. E. and van der Linde, C. (1995). “Toward a New Conception of the Environment-
Competitiveness Relationship”, The Journal of Economic Perspectives, 9, 4: 97-118. Smarzynska, B. K. and Wei, S-J. (2001). “Pollution Havens and Foreign Direct Investment:
Dirty Secret or Popular Myth?”, NBER Working Paper: 8465. Sun, Q., Tong, W. and Yu, Q. (2002). “Determinants of Foreign Direct Investment across
China”, Journal of International Money and Finance, 21: 79-113. UNCTAD (2003). World Investment Report 2003, FDI Policies for Development: National
and International Perspectives. New York and Geneva. UNDP (2004). Human Development Report 2004. New York. World Bank (2001). World Development Report 2000/2001. Washington D.C. World Bank (1995). Monitoring Environmental Progress, A Report on Work in Progress. Washington D.C. Zhang, Q. and Felmingham, B. (2001). “The Relationship between Inward Direct Foreign
Investment and China’s provincial Export Trade”, China Economic Review, 12: 82-99.