The impact of environmental policies on household incomes for different socio-economic classes: The...
12
ELSEVIER Ecological Economics 17 (1996) 83-94 ECOLOGICAL ECONOMICS Analysis The impact of environmental policies on household incomes for different socio-economic classes: The case of air pollutants in Indonesia Budy P. Resosudarmo a.b, Erik Thorbecke c., " Departnwnt ~/'A~,,ricultural, Resource, and Mana#erial Economics. Cornell UniverMty. Ithaca, NY 14853, USA t, Indonesian Government Agency,/~r the Assessmem. and Application (~/ Technology. Jakarta, Indonesia Department (~[ Economics, Cornell Unicersity, Ithaca, NY 14853. USA Received 15 May 1995: accepted 6 December 1995 Abstract With outdoor air pollutants in Indonesia as a case study, this paper expands a Social Accounting Matrix to include the link flom the economy to the environment, as well as the link from the environment to the economy. This paper explores the relationship between production activities, pollution, and human health problems. It utilizes the Constrained Fixed Price Multipliers method to analyze the impact of policies designed to reduce the amount of pollutants in the air on household incomes for different socio-economic classes in Indonesia. The results show that if policies designed to reduce the amount of pollutants in the air do not decrease the output of production sectors, then the policies also improve income distribution. Keywords: Social Accounting Matrix model: Environmental economics: International development; Public policy 1. Introduction Today the argument that environmental degrada- tion will reduce future benefits from economic activ- ities is well accepted. Most countries consider im- provement of environmental quality an integral part of their overall objectives (Lutz, 1993). For develop- ing countries, however, strong economic growth and better income distribution are still the immediate " Corresponding author: 215 Savage Hall, Cornell University, hhaca, NY 14853, USA. Elsevier Science B.V. SSDI 0921-8009(95)001 13-1 goals. These countries view with disfavor policies that sacrifice economic objectives simply to improve environmental quality. Literature concerning the relationship between en- vironmental quality and economic activities has been available since 1970. In that year Leontief (1970) expanded an input-output table to include pollution generation and abatement. Denison (1979) was also a pioneer in the subject of environmental quality and economic activities. He used a growth accounting model to analyze the impact of pollution abatement policies on US economic growth between 1929 and 1978. Since then, many studies have focused on the
-
Upload
independent -
Category
Documents
-
view
2 -
download
0
Transcript of The impact of environmental policies on household incomes for different socio-economic classes: The...
ELSEVIER Ecological Economics 17 (1996) 83-94
ECOLOGICAL ECONOMICS
Analysis
The impact of environmental policies on household incomes for different socio-economic classes:
The case of air pollutants in Indonesia
Budy P. Resosudarmo a.b, Erik Thorbecke c., " Departnwnt ~/'A~,,ricultural, Resource, and Mana#erial Economics. Cornell UniverMty. Ithaca, NY 14853, USA
t, Indonesian Government Agency,/~r the Assessmem. and Application (~/ Technology. Jakarta, Indonesia Department (~[ Economics, Cornell Unicersity, Ithaca, NY 14853. USA
Received 15 May 1995: accepted 6 December 1995
Abstract
With outdoor air pollutants in Indonesia as a case study, this paper expands a Social Accounting Matrix to include the link flom the economy to the environment, as well as the link from the environment to the economy. This paper explores the relationship between production activities, pollution, and human health problems. It utilizes the Constrained Fixed Price Multipliers method to analyze the impact of policies designed to reduce the amount of pollutants in the air on household incomes for different socio-economic classes in Indonesia. The results show that if policies designed to reduce the amount of pollutants in the air do not decrease the output of production sectors, then the policies also improve income distribution.
Keywords: Social Accounting Matrix model: Environmental economics: International development; Public policy
1. Introduct ion
Today the argument that environmental degrada- tion will reduce future benefits from economic activ- ities is well accepted. Most countries consider im- provement of environmental quality an integral part of their overall objectives (Lutz, 1993). For develop- ing countries, however, strong economic growth and better income distribution are still the immediate
" Corresponding author: 215 Savage Hall, Cornell University, hhaca, NY 14853, USA.
Elsevier Science B.V.
SSDI 0921-8009(95)001 13-1
goals. These countries view with disfavor policies that sacrifice economic objectives simply to improve environmental quality.
Literature concerning the relationship between en- vironmental quality and economic activities has been available since 1970. In that year Leontief (1970) expanded an input-output table to include pollution generation and abatement. Denison (1979) was also a pioneer in the subject of environmental quality and economic activities. He used a growth accounting model to analyze the impact of pollution abatement policies on US economic growth between 1929 and 1978. Since then, many studies have focused on the
84 B.P. Reso~mlarmo. E. 7h,Jr/)v~ '/,e / f:'c'o/o.g, i t a l I-,~ ' o m u n '('~ 17 (1996) (";,? 94
relationship between environmental quality and eco- nomic activities. Examples include the studies devel- oped by Bergman (1990), Jorgenson and Wilcoxen (1990), and Duchin and Lange (1994).
Most of this literature locuses on the relationship between economic growth and the environment, but neglects the important relationship betw'een the envi- romnent and income distribution. This literature also shows the link from economic activities to environ- mental quality, but not the link from environmental quality feeding back to the economy. The first goal of this paper is to present a methodology linking the economy to the environment as well as feedback from the environment to the economy. The second goal is to analyze the impact of environlnental qual- ity improvement policies on household incomes for different socio-economic classes.
This paper uses outdoor air pollution in Indonesia as a case study. This case study was chosen for the following reasons: 1. The air pollution level
Indonesia has become years. For example, in air pollution level is
in several large cities in alarming in the last few' some parts of Jakarla, the far above the allowable
national standard for air quality. The particle (SPM) concentration can reach 270 # g / m ~, while the Indonesian standard is 90 / x g / m ~. The lead concentration can reach 2 / z g / m ~, while the stan- dard is I / z g / m ~. The NO, concentration can reach 250 # g / m 3, while the standard is 100 / x g / m 3 (Soedomo et al., 1991 ).
2. Since 1992 the Indonesian government has been preparing a national clean air program to improve air quality by regulating the sources of air poilu- rants. The government plans to start implementing this program in the very near future (Lubis, 1994). This paper is divided into six sections. The
methodology section presents a method to expand a Social Accounting Matrix (SAM) to include the link between production activities, ambient level of {out- door) air pollutants, and human health problems. This same section also presents a method to analyze the impact of policies designed to improve air qual- ity on household incomes for different socio-eco- nomic classes. The health cost section presents a procedure to estimate the number of health problems and the health cost associated with air pollutants. The Indonesian Social and Environmental Account-
ing Matrix section describes the procedure to modify and to expand the Indonesian SAM to incorporate the health effects associated with air pollutants. The next section discusses several scenarios designed to simulate the Indonesia clean air program. It is as- sumed that this clean air program successfully re- duces lead emissions by up to 62 percent, NO~ and SPM emissions from the transportation sector by up to 50 percent, and NO. and SPM emissions from industrial sectors and open burning of municipal wastes by up to 30 percent. The results section shows the impact of this air quality program on household incomes. The paper ends with a discus- sion and concluding section.
2. M e t h o d o l o g y
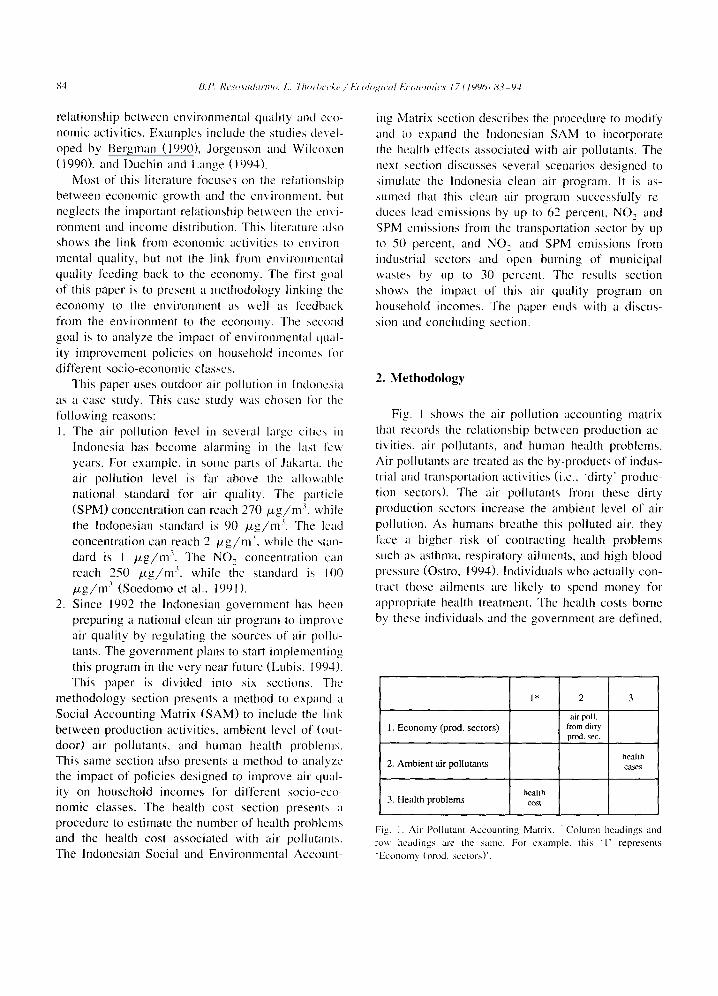
Fig. I shows the air pollution accounting matrix that records the relationship between production ac- tivities, air pollutants, and human health problems. Air pollutants are treated as the by-products of indus- trial and transportation activities (i.e., "dirty' produc- tion sectors). The air pollutants from these dirty production sectors increase the ambient level of air pollution. As humans breathe this polluted air, they face a hi~her~ risk of contracting" " health problems such as asthma, respiratory aihnents, and high blood pressure (Ostro, 1994). Individuals who actually con- tract those ailments are likely to spend money for appropriate health treatment. The health costs borne by these individuals and the govermnent are defined,
l. Economy (prod. sectors)
2. Ambient air pollutants
3. Health problems
l* 2 3
air poll. from dirty prod. sec.
health cases
health COSt
Fig. I. Air Pollutanl Accounting Matrix. Column headings and r o w headings are the SalllC. For CxLInlple, this "l" represenls "Econonly (prod. seclors)'.
B.P. Resosudarmo. E. Thorbecke / Ecological Economics 17 (1996) 83- 94 85
1" 2 3.a. 3.b. 3.c. 4 T O T A L
1. Factors Tl~. T13b tl3c t14 y~
2. Institutions T21 T22 t24 y2
3.a. Dirty prod. s e c t o r s T3.2 T3~a T3a3b t3a3c t3a4 y3a
3.b. Clean prod. s e c t o r s W362 T3b3a T3b3b t3b3c t3b4 y3b
3.c. Air Pollutant-Health t3c2 y3c
4. R O W t4t t42 t43a t43b t43c 3/4
T O T A L y~' y2' y3a' y3b' y3c' y4'
5. Amb. air pollutants
6. Health problems m63 c
5 6
M3a5
M56
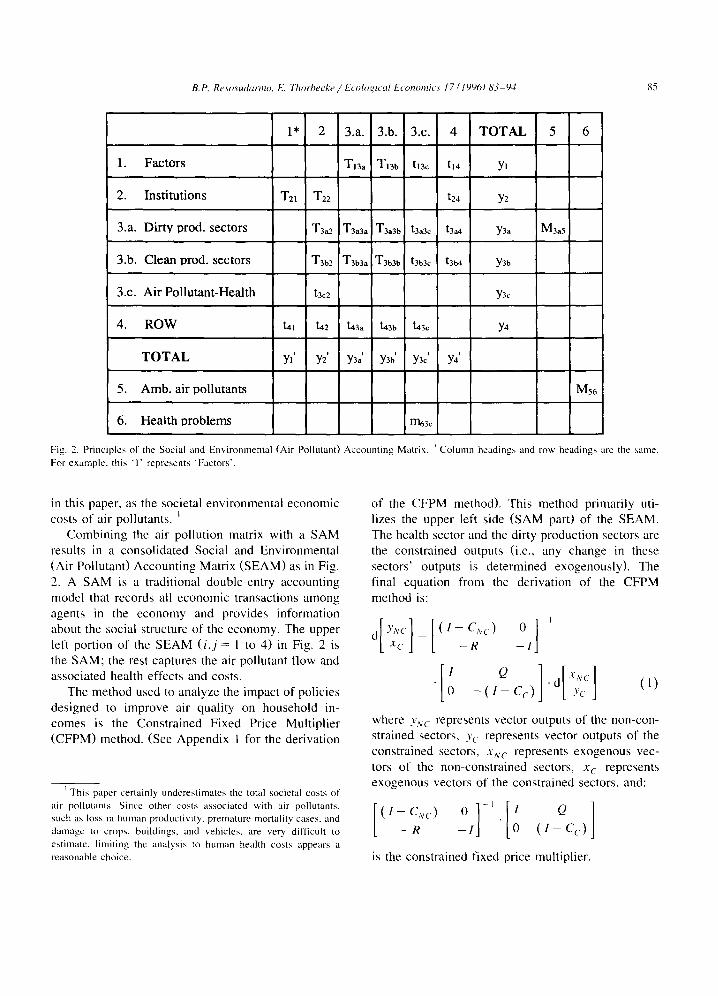
Fig. 2. Principles of the Social and Environmental (Air Pollutant) Accounting Matrix. Column headings and row headings are the same. For example, this '1" represents "Factors'.
in this paper, as the societal environmental economic costs of air pollutants, L
Combining the air pollution matrix with a SAM results in a consolidated Social and Environmental (Air Pollutant) Accounting Matrix (SEAM) as in Fig. 2. A SAM is a traditional double-entry accounting model that records all economic transactions among agents in the economy and provides information about the social structure of the economy. The upper left portion of the SEAM ( i , j = 1 to 4) in Fig. 2 is the SAM; the rest captures the air pollutant flow and associated health effects and costs.
The method used to analyze the impact of policies designed to improve air quality on household in- comes is the Constrained Fixed Price Multiplier (CFPM) method. (See Appendix 1 for the derivation
r This paper certainly underestimates the total societal costs of air pollutants. Since other costs associated with air pollutants, such as loss in human productivity, premature mortality cases, and damage to crops, buildings, and vehicles, are very difficult to estimate, limiting the analysis to human health costs appears a reasonable choice.
of the CFPM method). This method primarily uti- lizes the upper left side (SAM part) of the SEAM. The health sector and the dirty production sectors are the constrained outputs (i.e., any change in these sectors' outputs is determined exogenously). The final equation from the derivation of the CFPM method is:
°l l , 0 - ( I - C c ) [ yc j
where YNC represents vector outputs of the non-con- strained sectors, Yc represents vector outputs of the constrained sectors, XNC represents exogenous vec- tors of the non-constrained sectors, x c represents exogenous vectors of the constrained sectors, and:
- R - - I 0 ( 1 - - Cc)
is the constrained fixed price multiplier.

86 B.P. Resosudarmo. E. Thorbecke / Ecolo~,,ical Economics 17 (1996) 83- 94
The procedure to apply the CFPM method is as follows: 1. Determine the impact of air pollutant reduction on
the output of the sector that produces the air pollutants. For example, air pollutant reduction can decrease the sector 's output. 2
2. Formulate a new matrix of constrained fixed price multipliers. The reduction of ambient air pollu- tants will alleviate health problems, and therefore reduce health costs associated with air pollutants. Urban households and the government will spend this 'extra income' for other goods and services. ~ This behavior will produce a new matrix of con- strained fixed price multipliers.
3. Calculate the relationship (1) using the new con- strained fixed price multiplier matrix, the new health costs, and the new output of dirty produc- tion sectors. The impact of ambient air pollutant reduction on household incomes of different so- cio-economic classes can then be observed.
3. Est imat ion of the health cost associated with air pol lutants
This paper uses the 1990 SAM from Indonesia, which is the latest Indonesian SAM available. The health cost that is estimated is also from 1990.
In his recent work, 4 0 s t r o (1994) summarized the impact of air pollutants on health. From epidemio- logical literature, he collected the dose- response functions that relate health impacts to ambient levels of air pollution. The general form he used to estimate health impacts is:
d H i = b~. POP'- d A (2)
where dH~ is the change in number of people that contract health effect i, b~ is the slope of the d o s e -
2 For the justification of this example, see the explanation of the Pessimistic Setting. Another possibility is the Optimistic Set- ting. Both Settings are explained in the Simulation Scenario section.
3 Households spend this "extra income' in accordance with their marginal expenditure propensities.
40stro estimated the health effects of air pollutants in Jakarta. His estimates have been accepted by several researchers in the Indonesian Ministry of Health and the Environmental hnpact Management Agency (Lubis, 1994).
response curve, POP, is the population within the polluted area under consideration (i.e., the popula- tion at risk of health effect i), and d A is the change in air pollution under consideration.
The health cost of pollutants under consideration is:
d T C = v , V i . d H i (3)
where V, is the treatment cost of health effect i. As Ostro suggested, in applying the dose - r e -
sponse functions this paper will assume that there exists a threshold level of air pollution, below which unfavorable health effects do not occur. The thresh- old level, or the allowable air pollutants level, used in this paper is the Indonesian Air Pollutant Standard (Ostro. 1994). The d A in the relationship (2) is the ambient level of pollutants in the air over and above the Indonesian Standard.
From the dose- response functions collected by Ostro, this paper limits itself to the dose- response functions for particulate matter (SPM), NO 2, and lead. The reason for choosing these three types of air pollutants is that the relevant data are relatively available in contrast with the scarcity of intormation relating to other air pollutants. Although the data for SO~ is also available, the SO 2 ambient level in Indonesia is still below the standard. Therefore, this paper assumes that no significant health problem associated with SO, exists.
To estimate the health effects of air pollution, maps of air pollutant levels (isopleths of annual average air pollutants) are used. The Indonesian Agency for the Assessment and Application of Tech- nology (BPPT) collaborated with the German Min- istry of Technology (BPPT and KFA, 1993) to pub- lish maps of air pollutant levels on the island of Java in 1990. These maps indicate that three cities on Java have air pollutant levels above the Indonesian Stan- dard. The three cities are Jakarta, Bandung, and Surabaya, with respective populations of 8.0 million, 1.9 million, and 2.3 million in 1990. In addition to these air pollution maps of Java, detailed city maps of air pollutants for Jakarta, Bandung, and Surabaya in 1989 developed by the Bandung Institute of Tech- nology (Soedomo et al., 1991) were used. These maps show ambient levels of air pollutants in the different neighborhoods in each city. It is assumed that the ambient level of air pollutants in the three
B.P. Resosudarmo, E. Thorbecke / Ecological Economics 17 (1996) 83-94
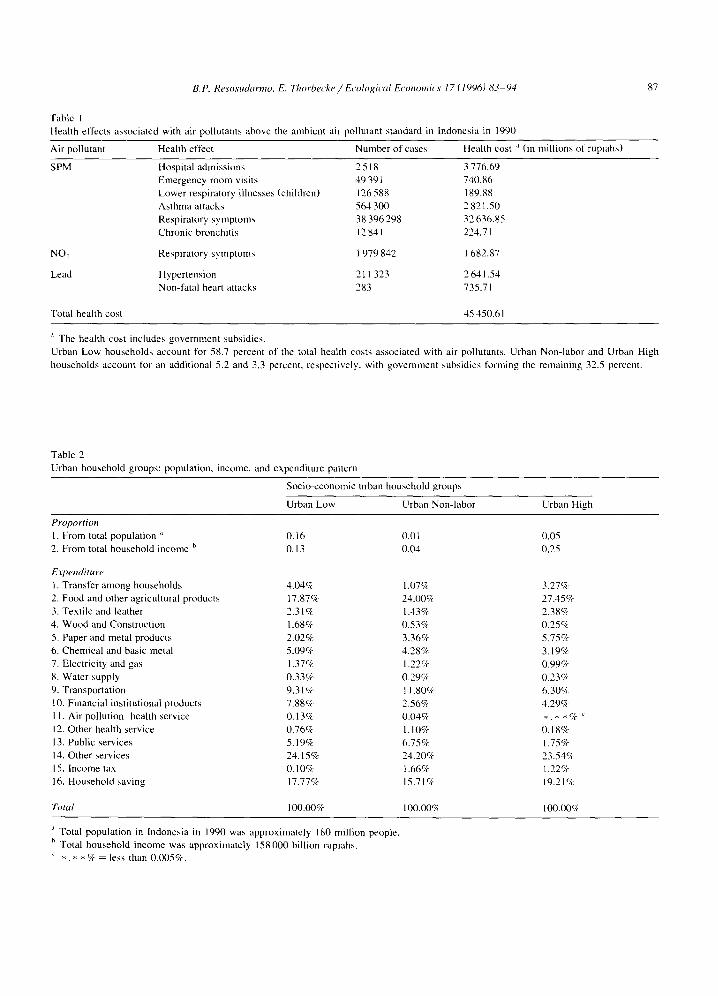
Table 1 Health effects associated with air pollutants above the ambient air pollutant standard in Indonesia in 1990
87
Air pollutant Health effect Number of cases Health cost ~ (in millions of rupiahs)
SPM Hospital admissions 2 518 3 776.69 Emergency room visits 49 391 740.86 Lower respiratory illnesses (children) 126 588 189.88 Asthma attacks 564 300 2 821.50 Respiratory symptoms 38 396 298 32 636.85 Chronic bronchitis 12 841 224.7 I
NO, Respiratory symptoms 1 979 842 1 682.87
Lead Hypertension 21 I 323 2 641.54 Non-fatal heart attacks 283 735.71
Total health cost 45 450.61
'~ The health cost includes government subsidies. Urban Low households account for 58.7 percent of the total health costs associated with air pollutants. Urban Non-labor and Urban High households account for an additional 5.2 and 3.3 percent, respectively, with government subsidies forming the remaining 32.5 percent.
Table 2 Urban household groups: population, income, and expenditure pattern
Socio-economic urban household groups
Urban Low Urban Non-labor Urban High
Proportion 1. From total population '̀ 0.16 0.01 0.05 2. From total household income b 0.13 0.04 0.25
Expenditure I. Transfer among households 4.04% 1.07% 3.27% 2. Food and other agricultural products 17.87% 24.00% 27.45% 3. Textile and leather 2.31% 1.43% 2.38% 4. Wood and Construction 1.68% 0.53c~ 0.25c~ 5. Paper and metal products 2.02% 3.36% 5.75% 6. Chemical and basic metal 5.09~7~ 4.28% 3.19% 7. Electricity and gas 1.37% 1.22% 0.99%
8. Water supply 0.33% 0.29% 0.23% 9. Transportation 9.31% I1.80c/~ 6.30% 10. Financial institutional products 7.88% 2.56% 4.29% 11. Air pollution-health service 0.13% 0.04% *. * * % ~
12. Other health service 0.76% 1.10% 0.18% 13. Public services 5.19% 6.75% 1.75% 14. Other services 24.15% 24.20% 23.54% 15. Income tax 0.10% 1.66% 1.22% 16. Household saving 17.77% 15.71 c/~ 19.2 1%
Total 100.00% 100.00% 100.00%
" Total population in Indonesia in 1990 was approximately 180 million people. h Total household income was approximately 158 000 billion rupiahs.
*. * * % = less than 0.005%.
88 B.P. Resosudarmo, E. Thorbecke / Ecolog, ical Economics 17 (1996)&~ 94
cities in 1990 was at the same level as in 1989. Based on these maps, population distribution data, and the dose - response functions, the number of health cases associated with air pollutants in Jakarta, Bandung, and Surabaya can be estimated in it de- tailed way.
For regions outside Java, an approximation must be made. The most heavily populated city outside Java is Medan. It boasts a 1990 population o1" 1.8 million. Since the population of Medan is close to that of Bandung, Medan is assumed to have as many cases of health problems associated with air pollu- tants as Bandung. The next most populated city outside Java is Palembang. In 1990 its population was 1.1 million. According to BPPT's air pollutant maps, Javanese cities with populations around 1.1 million, such as Semarang and Bogor, do not have serious health problems associated with air pollu- tants. All cities outside Java besides Medan, hence, are assumed to have no serious health problems associated with air pollutants. The total number of health problems associated with air pollutants in Indonesia for 1990 can be seen in Table 1.
The information on the cost of medica l /hea l th treatments (including the information on government subsidies) is based on interviews with medical doc- tors working in public hospitals and public health centers in Jakarta. Table 1 also shows the total health cost paid by patients and government. Table 2 pro- vides information on the size of this health cost associated with air pollutants relative to household spending on other goods and services.
4. Indonesian social and environmental account- ing matrix
The estimate of how much different urban socio-eco- nomic classes of households have to pay in health costs associated with air pollutants is based on re- search conducted by Achmadi (1989). Basing his study on people 's occupations in Jakarta, he esti- mated the health risks associated with air pollutants.
The information needed to determine which pro- duction sectors are responsible for polluting the air and how much each sector contributes to this pollu- tion is available from the World Bank (1993). The World Bank estimated the air pollution contribution of industrial, land transportation, electric utility, and open burning of municipal waste sectors in Jakarta for 1990.
5. Simulation scenarios
Since 1992 the Indonesian government has been preparing a national clean air program called the Blue Sky Program (BSP) to improve air quality by regulating the sources of air pollutants. The BSP is divided into two programs. The goal of the first program is to control air pollutants from mobile sources such as motor vehicles. The Indonesian gov- ernment expects to launch this program in the near future. The second program, expected to follow the first program, will attempt to control air pollutants from stationary sources such as factories and open
5 burning of municipal wastes. Policies considered by the Indonesia government
to control air pollutants from vehicles (the first pro- gram of BSP) include: 1. Reduc ing the l ead con ten t o f ' g a s o l i n e : The lead
content of gasoline in Indonesia is presently about 0.40 g / l . The government plans to first reduce
The modification of the original SAM published by the Indonesian Central Bureau of Statistics sepa- rates the Air Pol lu tant-Heal th Service sector (health service activities associated with air pollutants) from the Public Service sector. The previous section esti- mated the total health cost associated with air pollu- tants (i.e., the total income of the Air Pol lutant- Health Service sector). The spending pattern of that sector is estimated using the spending pattern of public health; the latter pattern is available in the 161 × 161 Indonesian Input -Output Table for 1990.
5 Several government agencies participate in the preparation of BSP. The Environmental hnpact Management Agency. an agency under the Ministry of Enviromnent, is in charge of coordinating the efforts of government agencies. The Ministry of Transporta- tion, Jakarta Regional Government. Ministry of Health, and Agency for the Assessment and Application of Technology are currently involved in designing the first program of BSP. The second BSP program is in its very early stages. The Ministry of Industry. Ministry of Energy, and regional govermnents are ex- pected to be actively involved in the preparation of this second BSP program.
B.P. Resosudarmo, E. Thorbecke / Ecoloq, icc I Economics 17 (1996) 83- 94 89
the lead content to 0,15 g/1 (low lead gasoline), and then to 0.04 g / l ('unleaded' gasoline).
2, Promoting the recocerv ~)f capor emissions: The goal is to reduce the amount of gasoline vapors that are emitted into the atmosphere when gaso- line tanks are filled.
3. Introducing emissions standards for new cehicles: Besides gradually reducing pollutants in the air, this policy aims to limit the growth of air pollu- tants as vehicle numbers rise.
4. Phasing out two-stroke engines: The reason for this policy is that two-stroke engines generate approximately 40 percent more pollution than four-stroke engines of the same size (World Bank, 1993).
6 5. Establishing a roadside inspection program: This policy is designed to control air pollutants from vehicles in use. It is suspected that the 10 percent worst polluting vehicles generate about half of the pollution (World Bank, 1993). To control air pollutants from factories (the sec-
ond program of BSP) the Indonesian government, among other things, plans, on: 1. Promoting energy e~'iciency technologies: A mid-
1980s survey of 67 industrial establishments iden- tified an energy efficiency improvement potential of about 23 percent in Indonesia (World Bank, 1993).
2. Phasing out coal use in urban areas: As a substi- tute for coal, the government plans to promote the use of natural gas.
3. Facilitating the decelopment (#~ combined heat and power generation (CHP): It is estimated that up to 18 percent of factories in Indonesia could potentially adopt this technology. CHP could re- duce fuel requirements by 10 to 30 percent (World Bank, 1993).
4. Introducing industrial emission standard." Factory owners would be asked to gradually reduce their air pollutants to a certain standard. For the open burning of municipal wastes, the
government plans to build incinerators in big cities and to encourage the participation of private en- trepreneurs in building these incinerators.
~' As a complement of this program, an emission standard for
in-use vehicles will also be introduced.
This paper attempts to analyze the short-run im- pacts of the BSP on the Indonesian economy. Note that in the SEAM all vehicles are pooled in the Land Transportation sector, factories in the industrial sec- tors, and open burning of municipal wastes in the Public Service sector. The scenarios in this paper are: I. First Stage of BSP: The Land Transportation
sector reduces its lead emissions by 62 percent (using low lead gasoline) and reduces its NO~ and SPM emissions by 50 percent; 7 air pollutants from other sectors are assumed constant.
2. Second Stage of BSP: First Stage of BSP is implemented; also, the industrial sectors reduce their NOo and SPM emissions by 30 percent; air pollutants from the Public Service sector are as- sumed constant.
3. Third Stage of BSP: Second Stage of BSP is implemented; in addition, the Public Service sec- tor reduces its NO~ and SPM emissions by 30 percent. In conducting the three scenarios (the numbers
below refer to the three scenarios--i.e., the stages of BSP), this paper will simulate two extreme settings: 1. Optimistic Setting (Scenarios la, 2a. and 3a):
This first extreme setting assumes that the reduc- tion in ambient air pollutants can be achieved with no reduction in the sectors' output (la as- sumes that land transportation output is unaf- fected; 2a assumes that both land transportation and industrial sectors' output remain constant; and 3a assumes that, in addition to 2a, public sector output remains constant). This situation can be interpreted as if there were technological im- provements available to reduce air pollutants at relatively inexpensive cost. All vehicles and fac- tories would then be able to reduce their air
v The information on approximately how much the BSP is expected to reduce the ambient level of air pollutants in the short run is based on several interviews with government officers and researchers at the Environmental Impact Management Agency, Agency for the Assessment and Application of Technology. and Jakarta Regional Government.
This emission reduction decreases the ambient level of air pollutants in the four biggest cities in Indonesia. The estimates of health problems, hence, have to be recalculated using the dose- re - sponse functions.
90 B.P. Resosu&~lvno. E. Thorhe{'ke / Ecologica I Economi~'s 17 (1996) 83 - 94
pollutant emissions as foreseen by the govern- ment.
2. Pessimistic Setting (Scenarios lb, 2b, and 3b): In Scenario l b, it is assumed that the reduction in air pollutants can only be achieved through a 10 percent reduction in the Land Transportation sec- tor's output. The justification for this assumption is that approximately 10 to 15 percent of vehicles in Indonesia are at least 15 years old and generate considerable pollution. The pessimistic setting presumes that these vehicles could not be modi- fied to achieve the emission standard and owners would not be able to replace them with new vehicles. In Scenarios 2b and 3b, it is further assumed that, in addition to the above l0 percent drop in the Land Transportation sector's output, the reduction in air pollutants can only be achieved through a 5 percent drop in the industrial sectors" output. Since the government has not imple- mented strict regulations concerning types of technology that can be applied in the industrial sectors, many factory owners have adopted tech- nologies that generate significant amounts of pol- lution per unit of production. Underlying these scenarios is the assumption that some of the existing pollution-generating technologies could not be modified to achieve the emission standard.
6. Results of simulations
The results of all simulations can be seen in Table 3 which shows the absolute and relative changes in total incomes due to the implementation of air pollu- tant regulations. These total income changes are listed for each socio-economic class of household.
6. I. First stage o f BSP
In Scenario la (Optimistic Setting), household incomes for all agricultural and rural classes in- crease. Household incomes for all urban classes fall. The links below illustrate how improvement in air" quality affects household incomes: • The improvement in air quality reduces the num-
ber of health problems associated with air pollu- tants. This reduction in the number of health problems, in turn, leads to a fall in the output as
well as the income of the Air Pollutant-Health Service sector. Clerical Paid Urban laborers, Pro- fessional Paid Urban laborers, and Chemical and Basic Metal sectors suffer the most from the reduction in Air Pollutant-Health Service activi- ties. Clerical Paid Urban laborers belong mostly to the Urban High and Low households, respec- tively. Professional Paid Urban workers are found mostly among the Urban High households. The drop in income affecting the Chemical and Basic Metal sector decreases significantly the rent re- ceived by the Unincorporated Capital Urban sec- tor. Since the Urban Non-labor households (i.e., the retired, students and rentiers) receive incomes mostly from that sector, they are negatively af- fected. "
• The reduction in the number of health problems associated with air pollutants allows urban house- holds to spend more of their incomes on goods and services other than Air Pollutant-Health Ser- vices. This increasing demand for goods and ser- vices boosts domestic production activities (ex- cept land transportation and 'dirty' industrial sec- tors >) and raises household incomes. For Urban High, Non-labor, and Low households, however, the income benefits from the increase in domestic production activities resulting from a shift away from health expenditures to expenditures on other goods and services (e.g., food) cannot compen- sate for their income reduction caused by the decrease in Air Pollutant-Health activities. In Scenario l b (Pessimistic Setting), all household
incomes fall. Urban households bear the major bur- den of this environmental regulation. In particular, the total income of the Urban Non-labor class is reduced by almost I percent. The link between Land Transportation and Unincorporated Capital Urban sectors explains why the total income of Urban Non-labor households decreases the most. The reduc- tion in the output of land transportation activities lowers the rent received by the Unincorporated Capi-
'~ These various links and relationships can be read off from the matrix of marginal expenditure propensities of SEAM.
m The Land Transportation and 'dirty" industrial sectors are the
constrained sectors.
B.P. Reso~udarmo, E. Thorbecke / Ecolo~,,ical Economic,~ 17 (1996) 83- 94 91
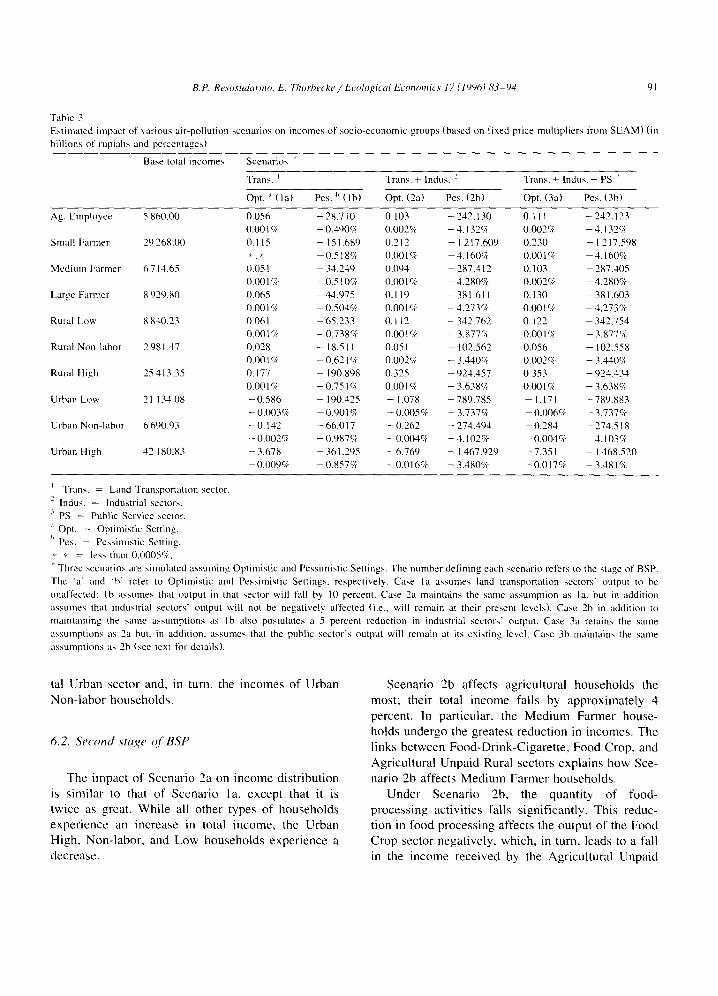
Table 3 Estimated impact of various air-pollution scenarios on incomes of socio-economic groups (based on fixed price multipliers |?ore SEAM) (in billions of rupiahs and percentages)
Base total incomes Scenarios
Trans. L Trans. + Indus. : Trans. + Indus. + PS
Opt. '~ ( la) Pes. h (Ib) Opt. (2a) Pes. (2b) Opt. (3a) Pes. (3b)
Ag. Employee 5860.00 0.056 -28 .710 0.103 -242.130 0. I l l -242.123 0.001% - 0.490cA 0.002% -4.132% 0.002% -4.132%
Small Farmer 29268.0(I 0.115 - 151.689 0.212 - I 217,609 0.230 - 1 217,598 *.* - 0,518c/~ 0.001% -4 .160% 0.001% -4 .160%
Medium Farmer 6714.65 0.051 -34 .249 0.094 -287.412 0.103 -287.405 0,001 c/~ -0.510% 0.001% - 4.280c~ 0.002% - 4.280c~
Large Farmer 8929.80 0,065 -44.975 0.119 -381.611 0.130 -381.603
0.00 VA - 0.504c/~ 0.001% -4 .273% 0.001% -4.273% Rural Low 8840.23 0.061 -65 .233 0.112 -342.762 0.122 -342,754
0.001% - 0.738c/~ 0.001 c/~ -3 .877% 0.001% -3 .877%
Rural Non-labor 2981.47 0.028 - 18.511 0.051 - 102.562 0.056 - 102.558 0.001% - 0.621% 0.002~7~ - 3.440~ 0.002% - 3.440c~
Rural High 25413,35 0.177 - 190.898 0,325 -924.457 0.353 -924.434 0.001% -0 .751% 0,001% -3 .638% 0.001% - 3.638~
Urban Low 21 134,08 -0 .586 - 190.425 - 1.078 -789.785 - 1 . 1 7 1 -789.883 - 0.003c/~ - 0.901 ~ - 0.005% - 3.737c/~ - 0.006% - 3.737r7~
Urban Non-labor 6690.93 -0 .142 -66 .017 -0 .262 -274.494 -0 .284 -274.518 -0 .002% - 0.987c/~ - 0.0049~ -4 .102% - 0.004c/~ -4 .103%
Urban High 42 180.83 -3 .678 -361.295 -6 .769 - I 467.929 -7.351 - 1 468.520 -0 .009% -0.857% -0 .016% - 3.480'7~ -0 .017% -3 .481%
i Trans. = Land Transportation sector.
2 Indus. = Industrial sectors.
PS = Public Service sector. ~ Opt. = Optimistic Setting. h Pes. = Pessimistic Setting. *,* = less than 0,0005c/~.
Three scenarios are simulated assuming Optimistic and Pessimistic Settings. The number defining each scenario refers to the stage of BSP. The "a" and "b' refer to Optimistic and Pessimistic Settings, respectively. Case la assumes land transportation sectors' output to be unaffected; Ib assumes that output in that sector will fall by 10 percent. Case 2a maintains the same assumption as la, but in addition ;lssumes that industrial sectors" output will not be negatively affected (i.e., will remain at their present levels). Case 2b in addition to maintaining the same assumptions as Ib also postulates a 5 percent reduction in industrial sectors' output. Case 3a retains the same assumptions as 2a but, in addition, assumes that the public sector's output will remain at its existing level. Case 3b maintains the same assumptions as 2b (see text for details).
tal U r b a n s e c t o r and , in tu rn , the i n c o m e s o f U r b a n
N o n - l a b o r h o u s e h o l d s .
6.2. S e c o n d s tage (~f B S P
T h e i m p a c t o f S c e n a r i o 2a on i n c o m e d i s t r i b u t i o n
is s i m i l a r to t h a t o f S c e n a r i o l a, e x c e p t t h a t i t is
t w i c e as g r ea t . W h i l e a l l o t h e r t y p e s o f h o u s e h o l d s
e x p e r i e n c e an i n c r e a s e in to ta l i n c o m e , the U r b a n
H i g h , N o n - l a b o r , a n d L o w h o u s e h o l d s e x p e r i e n c e a
d e c r e a s e .
S c e n a r i o 2b a f f e c t s a g r i c u l t u r a l h o u s e h o l d s the
m o s t ; t h e i r t o t a l i n c o m e f a l l s b y a p p r o x i m a t e l y 4
p e r c e n t . In p a r t i c u l a r , t h e M e d i u m F a r m e r h o u s e -
h o l d s u n d e r g o the g r e a t e s t r e d u c t i o n in i n c o m e s , T h e
l i n k s b e t w e e n F o o d - D r i n k - C i g a r e t t e , F o o d C r o p , a n d
A g r i c u l t u r a l U n p a i d R u r a l s e c t o r s e x p l a i n s h o w S c e -
n a r i o 2b a f f e c t s M e d i u m F a r m e r h o u s e h o l d s .
U n d e r S c e n a r i o 2b , the q u a n t i t y o f f o o d -
p r o c e s s i n g a c t i v i t i e s f a l l s s i g n i f i c a n t l y , T h i s r e d u c -
t i o n in f o o d p r o c e s s i n g a f f e c t s t he o u t p u t o f t he F o o d
C r o p s e c t o r n e g a t i v e l y , w h i c h , in tu rn , l e a d s to a fa l l
in the i n c o m e r e c e i v e d by the A g r i c u l t u r a l U n p a i d
9 2 B.P. Resosu&wnu~, E. Thm4~e~'ke / Ecolo,eical Economics 17 (1996) 83- 94
Rural class, largely represented by medium-size farmers.
6.3. Third stage of BSP
The impact of Scenario 3a on income distribution is similar to that of Scenario 2a. Again, while other households benefit from this scenario, the total in- comes of the Urban High, Non-labor and Low households decline.
The impact of Scenario 3b on income distribution is also similar to that of Scenario 3a. With this scenario, the owners of medium farms experience the greatest decrease in incomes.
7. Discussion and conclusion
This paper develops a procedure to expand a SAM into a Social Environmental Accounting Ma- trix (SEAM), capturing the link between production activities, ambient level of air pollutants, and associ- ated human health problems. Thus in the SEAM and the policy simulations based on it, the health costs borne by individuals and the government resulting from air pollution (above the standards) are defined as the societal environmental costs of air pollutants. As such the methodology used in this paper underes- timates the total societal costs of air pollutants. ~ If more information on the societal costs of air pollu- tion were available, a more sophisticated SEAM could be developed using the same procedure as that presented in this paper.
This paper relies on the use of the Constrained Fixed Price Multiplier (CFPM) method to analyze the impact of alternative policies designed to im- prove air quality on household incomes for different socio-economic classes, Although this method re- stricts the number of possible scenarios that can be developed (in particular those relating to taxing pol- lution activities), this simple mathematical method yields valuable information.
Three scenarios were designed to simulate the Indonesian clean air program--i .e . , the Blue Sky
I i F o r m o r e d e t a i l , s e e F o o t n o t e 1.
Program (BSP). The first scenario (representing the First Stage of BSP) assumes that this clean air program successfully reduces lead emissions by up to 62 percent, NO~, and SPM emissions from the transportation sector by up to 50 percent. The second scenario (representing the Second Stage of BSP) maintains the same assumption as the first scenario but, in addition, assumes that NO, and SPM emis- sions from industrial sectors drop by 30 percent. The third scenario (representing the Third Stage of BSP) retains the same assumption as the second scenario but, in addition, assumes that NO~ and SPM emis- sions from open burning of municipal wastes decline by 30 percent. The three scenarios are simulated under Optimistic and Pessimistic Settings, respec- tively. The Optimistic Setting postulates that im- provement in air quality can be achieved with no reduction in the sectors' output through the adoption of available alternative technologies. The Pessimistic Setting. in contrast, presumes that implementing air pollution regulation on Land Transportation sector reduces land transportation output by 10 percent, and implementing air pollution regulation on industrial sectors reduces industrial output by 5 percent.
Table 3 summarizes the estimated impact of the various simulated anti-pollution scenarios--under the optimistic and pessimistic set t ings--on the incomes of the ten socio-economic household groups. It can be seen that under the optimistic scenarios (la, 2a, 3a) the relative impact of the anti-pollution policies on household groups' incomes would be negligible. On the other hand, under the pessimistic scenarios, the relative negative impact is significant--ranging from - 0 . 5 to almost - 1 percent for Case Ib and from - 3 . 4 to - 4 . 3 percent for Cases 3b and 3c, respectively. It is noteworthy that the urban high income and rural high income households are some- what less negatively affected than the other socio- economic groups. This suggests that if the Pes- simistic Settings were to prevail, the income distribu- tion would become more unequal.
Under the Optimistic Setting, simultaneously im- plementing the BSP in all dirty sectors benefits all socio-economic classes of households, except the urban households. Since the average income of urban households on a per capita basis is higher than that of agricultural and rural households, a drop in aver- age income in the former category combined with a

B.P. Resosudarmo. E. Thorbecke / Ecological Economics 17 (1996) 83-94 93
rise in average income in the latter should contribute to a more equal income distribution.
To determine which type of households will be affected the most by the implementation of air pollu- tant regulations, it is important to know whether the Optimistic Setting or the Pessimistic Setting is more likely to prevail. There are no studies yet within the context of Indonesia shedding any light on this ques- tion. However, in 1994, BPPT conducted a survey on the availabili ty of technologies to reduce air pollutants in Indonesia (Nurrohim et al., 1994). BPPT concluded that such technologies are relatively avail- able. This would suggest that the actual outcomes of the simulated policies are likely to fall within the range bounded by the optimistic and pessimistic settings, but closer to the former.
These results should be appropriately qualified, First, the use of a national SAM, rather than a regional SAM, might underestimate the impact of improvements in air quality on household incomes in Jakarta, Bandung, Surabaya, and Medan. On the other hand, the use of a national SAM might overes- timate the impact of improvements in air quality on household incomes outside the large cities just men- tioned. Secondly, although households have been classified into ten different socio-economic classes, each household category covers a range of incomes and socioeconomic characteristics. Consequently, some households in a particular class might be af- fected more than others in the same class.
Acknowledgements
The authors wish to thank the referees for their useful comments and critiques. The first author also wishes to thank Bryce All ison Isham for her con- structive suggestions. Any mistakes in this paper are the authors' responsibili ty.
End. Acc. Sum Exog. Acc. Sum Total 1. Factors 2. Institutions endogenous n injection x y,, 3. Prod. activities transactions 4. Government 5. Capital accounts leakages l exogenous t y~ 6. Net indirect taxes 7. Rest of the world Total 3'i, 3'i,
Algebraical ly the table above can be written as:
y , , = n + x ( A I )
Under the assumption that prices are fixed, it follows from the relationship ( A I ) above:
dy,, = dn + d x ( 1 2 )
dy,, = C, "dy,, + d x (A3)
or
d y , = ( I - C , , ) - ' " d x ( 1 3 ' )
where C,, is a matrix of marginal expenditure propensities. This matrix of marginal expenditure propensities shows, for each sector, how much ex- penditures on goods and services change when in- come marginally changes from the initial condition.
To obtain C,;, this paper uses the work of Keun- ing and Thorbecke (1992). For the Indonesian case, they were able to estimate the expenditure elasticities needed to convert a matrix of average expenditure propensities to a matrix of marginal expenditure propensities. Expenditure elasticity is the ratio be- tween marginal expenditure propensity and average expenditure propensity. A matrix of average expendi- ture propensities, which can be found from the SAM, shows the average changes of expenditure on goods and services when income changes.
To conduct a constrained multiplier analysis, C,, is partit ioned into a matrix of non-constrained marginal expenditure propensities ( C x c ) and a ma- trix of constrained marginal expenditure propensities (Co)" ~2 Note that in this paper the constrained sectors are the dirty production sectors and the Air
Appendix A. Constrained fixed price multiplier method
The SAM can be simplified as below (Pyatt and Round, 1979):
t2 The underlying methodology on constrained fixed price multi- pliers as well as applications to concrete cases are given in Lewis and Thorbecke (1992) and Parikh and Thorbecke { 1995).
94 B.P. Resosu&lrmo. E. Thorlwcke / Ecolo~,,ical Economics 17 (1996)83 94
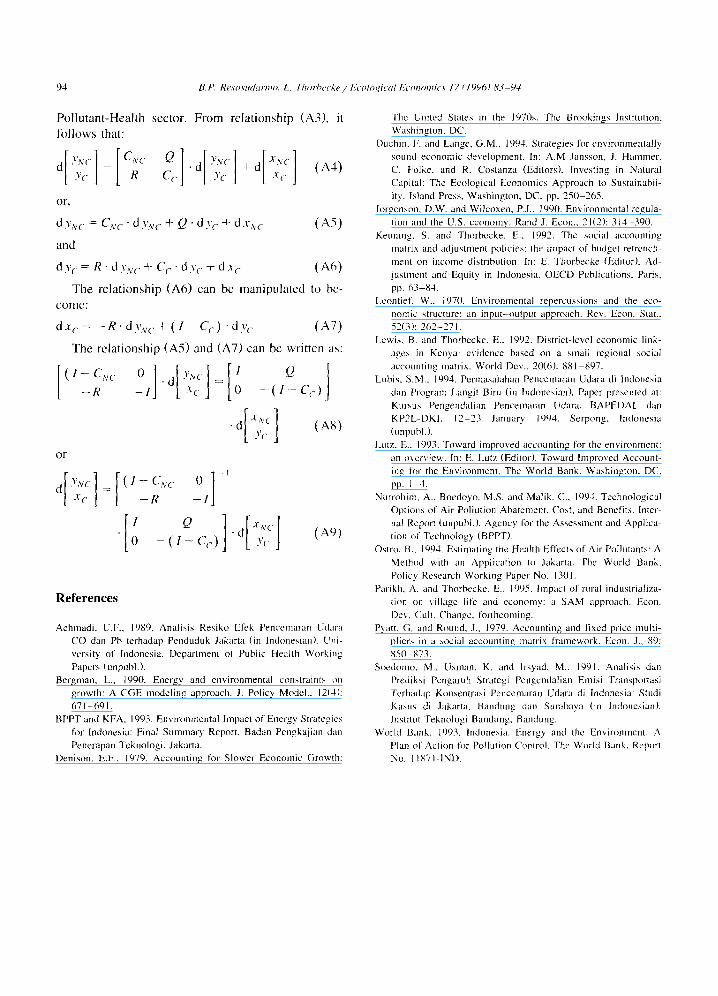
P o l l u t a n t - H e a l t h s ec to r . F r o m r e l a t i o n s h i p ( A 3 ) , it
f o l l o w s that :
or ,
d Y N e = CNc • dy ,v c + Q • d y c + d x x c ( A 5 )
a n d
d y c = R • d v v c + C c - d Y c + d x c ( A 6 )
T h e r e l a t i o n s h i p ( A 6 ) c a n be m a n i p u l a t e d to be -
c o m e :
d x c = - R . d Y , v c + ( l - C c ) . d y c ( A 7 )
T h e r e l a t i o n s h i p ( A 5 ) a n d ( A 7 ) c a n be w r i t t e n as :
[ ][::::][' l ( I - CNC 0 • d =
- R - I 0 - ( l - C o )
• d [ x N c ] ( A S ) [ :'~ i
o r
• _ [
dI' cl=I ' ° 1 [ xc I - g - I
1 I Q XNC ( A 9 )
References
Achmadi. U.F., 1980. Analisis Resiko Efek Pencemaran Udara CO dan Pb terhadap Penduduk Jakarta (in Indonesian). Uni- versity of Indonesia, Department of Public Health Working Papers (unpubh).
Bergman, L., 1990. Energy and environmental constraints on growth: A CGE modeling approach. J. Policy Model., 12(4): 671-69 I.
BPPT and KFA. 1993. Environmental hnpact of Energy Strategies for Indonesia: Final Summary Report• Badan Pengkajian dan Penerapan Teknologi, Jakarta.
Denison, E.F., 1979. Accounting for Slower Economic Growth:
The United States in the 1970s. The Brookings Institution, Washington. DC.
Duchin, F. and Langc, G.M., 1994. Strategies lk)r environmentally sound economic development. In: A.M Jansson, J. Hammer, C, Folke. and R. Costanza (Editors). Investing in Natural Capital: The Ecological Economics Approach to Sustainabil- ity. Island Press, Washington, DC. pp. 250-265.
Jorgenson, D.W. and Wilcoxen, P.J., 1990. Environmental regula- tion and the U.S. economy. Rand J. Econ., 21(2): 314-390.
Keuning. S. and Thorbecke, E., 1992. The social accounting matrix and adjustment policies: the impact of budget retrench- ment on income distribution. In: E. Thorbecke (Editor). Ad- justment and Equity in Indonesia. OECD Publications. Paris, pp. 63-84.
Leontief. W.. 1970. Environmental repercussions and the eco- nomic structure: an input-output approach. Rev. Econ. Slat.. 52(3): 262-271.
Lewis, B, and Thorbecke. E., 1992. District-level economic link- ages in Kenya: evidence based on a small regional social accounting matrix. World Dev., 20(6): 881-897.
Lubis, S.M., 1994. Permasalahan Pencemaran Udara di Indonesia dan Program Langit Biru (in Indonesian). Paper presented at: Kursus Pengendalian Pencemaran Udara, BAPEDAL dan KP2L-DKI. 12-23 January 1994, Serpong, Indonesia (unpubl.).
Lutz, E.. 1993. Toward improved accounting for the enviromnent: an overview. In: E. Lutz (Editor), Toward Improved Account- ing for the Environment. The World Bank. Washington, DC. pp. 1 4.
Nurrohim, A,, Boedoyo, M.S. and Malik, C., 1994. Technological Options of Air Pollution Abatement. Cost, and Benefits• Inter- nal Report (unpubl.), Agency for the Assessment and Applica- tion of Technology (BPPT).
Oslro, B.. 1994. Estimating the Health Effects of Air Pollutants: A Method with an Application to Jakarta. The World Bank, Policy Research Working Paper No. 1301.
Parikh, A. and Thorbecke, E.. 1995. hnpact of rural industrializa- tion on village liI;e and economy: a SAM approach, Econ. Dev. Cult• Change. forthcoming.
Pyatt, G. and Round, J., 1979. Accounting and fixed price multi- pliers in a social accounting matrix framework. Econ. J., 89: 850 873.
Soedomo, M.. Usman. K. and lrsyad, M.. 199l. Analisis dan Prediksi Pengaruh Strategi Pengendalian Emisi Transportasi Terhadap Konsentrasi Pencemaran Udara di Indonesia: Studi Kasus di Jakarta, Bandung dan Surabaya (in Indonesian). lnstitut Teknologi Bandung. Bandung.
World Bank, 1993. Indonesia. Energy and the Environment: A Plan of Action fi~r Pollution Control. The World Bank, Report No, 11871-1ND.