
Top Incomes and Wealth in Sociological Research - CiteSeerX
12
Social Currents 2014, Vol. 1(1) 13–24 © The Southern Sociological Society 2014 Reprints and permissions: sagepub.com/journalsPermissions.nav DOI: 10.1177/2329496513510900 scu.sagepub.com The one percent—those at the top of the income and wealth distributions—are essential for understanding social stratification and mobility, but they attract little sociological attention. Recent protests, including Occupy Wall Street (OWS) and related movements, raised awareness of the one percent by arguing that they enjoy enormous advantages because of their control of financial and other resources and that they are relatively insulated from eco- nomic downturns of the sort that stressed the U.S. economy between 2007 and 2009. During that recession, wage and salary growth for workers slowed to a 20-year low (Bureau of Labor Statistics 2012); 8.5 million jobs were eliminated, and unemployment reached a 26-year high of 10 percent (Bureau of Labor Statistics 2012; Hout, Levanon, and Cumberworth 2011); home values fell by about one-third, and foreclosures and personal bankruptcies rose dramatically (Fligstein and Goldstein 2011; Grusky, Western, and Wimer 2011; Treas 2010); and many middle- and working-class families had to use already lim- ited savings to cover basic living expenses (Wolff, Owens, and Burak 2011). Yet, the share of total income going to top earners had risen continuously since the 1980s and was higher in 2007 than it had been since the Great Depression (Congressional Budget Office 2011). Moreover, top net worth owners have seen rapid increases in their wealth following the recession as stock values have begun to rise, yet most households continue to experi- ence declining net worth as housing values have been slow to recover (Taylor 2013). 510900SCU XX X 10.1177/2329496513510900Social CurrentsKeister and Lee research-article 2014 1 Duke University, Durham, NC, USA Corresponding Author: Lisa A. Keister, Department of Sociology, Duke University, Box 90088, Durham, NC 27708, USA. Email: [email protected] The One Percent: Top Incomes and Wealth in Sociological Research Lisa A. Keister 1 and Hang Young Lee 1 Abstract The one percent, those at the top of the income and wealth distributions, are fundamental to understanding social and economic inequality and mobility, but sociologists rarely focus research attention on this group. This article presents updated evidence showing that both income and wealth are very highly concentrated in the United States but that the concentration of wealth, particularly financial wealth, is extremely high. We focus on the one percent of wealth owners and identify patterns in asset ownership, liabilities, and demographic traits that are relevant to sociological research. Findings show, for example, that those in the one percent have unique asset and debt portfolios that, to some extent, insulated them from the ill effects of the recent recession; however, patterns reported also highlight inheritance and suggest that mobility into the one percent is possible. The article concludes with suggestions for future research. Keywords inequality, poverty and mobility, race, gender, and class, wealth at PENNSYLVANIA STATE UNIV on May 9, 2016 scu.sagepub.com Downloaded from
-
Upload
khangminh22 -
Category
Documents
-
view
2 -
download
0
Transcript of Top Incomes and Wealth in Sociological Research - CiteSeerX
Social Currents2014, Vol. 1(1) 13 –24© The Southern Sociological Society 2014Reprints and permissions:sagepub.com/journalsPermissions.nav DOI: 10.1177/2329496513510900scu.sagepub.com
The one percent—those at the top of the income and wealth distributions—are essential for understanding social stratification and mobility, but they attract little sociological attention. Recent protests, including Occupy Wall Street (OWS) and related movements, raised awareness of the one percent by arguing that they enjoy enormous advantages because of their control of financial and other resources and that they are relatively insulated from eco-nomic downturns of the sort that stressed the U.S. economy between 2007 and 2009. During that recession, wage and salary growth for workers slowed to a 20-year low (Bureau of Labor Statistics 2012); 8.5 million jobs were eliminated, and unemployment reached a 26-year high of 10 percent (Bureau of Labor Statistics 2012; Hout, Levanon, and Cumberworth 2011); home values fell by about one-third, and foreclosures and personal bankruptcies rose dramatically (Fligstein and
Goldstein 2011; Grusky, Western, and Wimer 2011; Treas 2010); and many middle- and working-class families had to use already lim-ited savings to cover basic living expenses (Wolff, Owens, and Burak 2011). Yet, the share of total income going to top earners had risen continuously since the 1980s and was higher in 2007 than it had been since the Great Depression (Congressional Budget Office 2011). Moreover, top net worth owners have seen rapid increases in their wealth following the recession as stock values have begun to rise, yet most households continue to experi-ence declining net worth as housing values have been slow to recover (Taylor 2013).
510900 SCUXXX10.1177/2329496513510900Social CurrentsKeister and Leeresearch-article2014
1Duke University, Durham, NC, USA
Corresponding Author:Lisa A. Keister, Department of Sociology, Duke University, Box 90088, Durham, NC 27708, USA. Email: [email protected]
The One Percent: Top Incomes and Wealth in Sociological Research
Lisa A. Keister1 and Hang Young Lee1
AbstractThe one percent, those at the top of the income and wealth distributions, are fundamental to understanding social and economic inequality and mobility, but sociologists rarely focus research attention on this group. This article presents updated evidence showing that both income and wealth are very highly concentrated in the United States but that the concentration of wealth, particularly financial wealth, is extremely high. We focus on the one percent of wealth owners and identify patterns in asset ownership, liabilities, and demographic traits that are relevant to sociological research. Findings show, for example, that those in the one percent have unique asset and debt portfolios that, to some extent, insulated them from the ill effects of the recent recession; however, patterns reported also highlight inheritance and suggest that mobility into the one percent is possible. The article concludes with suggestions for future research.
Keywordsinequality, poverty and mobility, race, gender, and class, wealth
at PENNSYLVANIA STATE UNIV on May 9, 2016scu.sagepub.comDownloaded from
14 Social Currents 1(1)
The one percent can be defined by either their income or their wealth, two terms that are often used interchangeably but that have very different meanings and implications for under-standing resource concentration. Income is a flow of funds into a household over time from wages, salaries, businesses, interest/dividend, capital gains, government transfer payments, and other sources. Wealth is usually measured as net worth or total household assets less total debts. Assets include real assets (e.g., the fam-ily home, other real estate, businesses) and financial assets (e.g., cash accounts, stocks, retirement accounts). Debts are any liabilities to others (e.g., mortgages, consumer debt, stu-dent loans). Income and wealth are related, but the correlation between the two is relatively low, and each has unique advantages, suggest-ing that studying both is important. Total income and net worth are correlated at about .50 to .60, reflecting a large variety of house-hold financial situations including retirees with high wealth and low income as well as high-income individuals who do not save. Income is essential for current spending on both necessary and desirable goods and ser-vices; it also provides some social and political advantages. When income is saved, it becomes wealth that has even more advantages. For instance, both real estate and businesses can provide current financial advantages and long-term investment benefits. Wealth can also improve educational and occupational out-comes, provides a buffer against emergencies, can be reinvested to create more wealth, and can be passed to others and extend these ben-efits often across generations.
We propose that the one percent are an important group that sociologists might use-fully study more closely, and we identify some patterns that are worth exploring. We start by briefly summarizing recent research on resource concentration that focuses on growth in top wage incomes. We then compare income and wealth distributions and show that both are very unequally distributed, but the concentra-tion of wealth is particularly extreme. We dis-cuss wealth concentration patterns and highlight issues worthy of additional research attention. Specifically, we compare the finan-cial traits of those in the top one percent to
other households, including both the next 9 percent and the remaining 90 percent. We show that these three groups have distinct asset and debt portfolios that are both likely to explain trends in wealth concentration and to predict future patterns. We then summarize demographic traits of the one percent and other households and discuss the extent to which inheritance accounts for wealth concen-tration. We conclude with a brief discussion of specific areas on which future research might concentrate.
Our empirical estimates are from the Survey of Consumer Finances (SCF), a unique data set that is ideal for exploring issues related to the one percent because it includes information on cross sections of households as well as highly accurate information about top income earners and wealth owners. Because both the income and wealth distributions are highly skewed, having data on those at the top is critical to producing accurate distributional estimates. The SCF is a triennial survey of U.S. house-holds collected by the Federal Reserve System since 1983 that contains detailed information about household income, assets, debts, demo-graphics, relationships with financial institu-tions, and related information (Johnson and Moore 2005). Particularly noteworthy is that the SCF uses a dual-frame sample design to adequately represent all households, including top incomes and wealth: (1) a multistage national area probability sample and (2) a sam-ple of high-income households identified with Internal Revenue Service data (Johnson and Moore 2005; Kennickell 2008). We report val-ues for 2001, 2004, 2007, and 2010, the most recent years for which SCF data are available, and show values for the top one percent, the next 9 percent, and the remaining 90 percent to highlight the unique characteristics of those in the top of the income and wealth distributions. The SCF contains five imputed cases for each observed household as part of its effort to accurately represent income and wealth (Kennickell 2008, 2011). Consistent with the strategy used by other researchers (Kennickell 2003, 2008), we use the five imputations as independent observations to take into account uncertainties in imputation, and we use ana-lytic weights to correct for oversampling and
at PENNSYLVANIA STATE UNIV on May 9, 2016scu.sagepub.comDownloaded from
Keister and Lee 15
differential patterns of nonresponse. Because the SCF oversamples top income and wealth owners, confirms higher nonresponse rates of top wealth owners, and has many missing val-ues for wealth or income variables, the combi-nation of multiple imputation and analytic weights generates robust estimates. We use the consumer price index (CPI-U) to inflate values to 2010 dollars. For a review of alternative data sources that include top income earners and wealth owners, see Keister (forthcoming).
Resource Concentration: Growing Top Incomes
Income concentration in the United States has grown dramatically since the early 1980s, reaching record high levels by the early 2000s (Atkinson 2010; Kopczuk, Saez, and Song 2010). Between 1913 and the mid-1970s, the general trend in income inequality was down-ward, and correspondingly, the share of wage and salary income earned by the top one per-cent declined. This pattern reversed after 1980, and top wage/salary earners began to receive
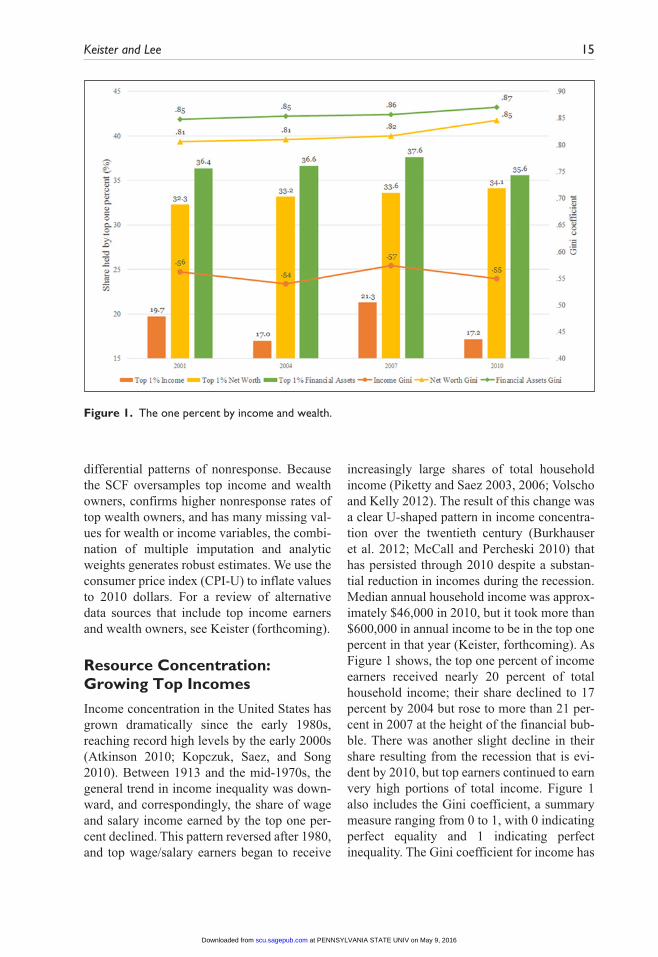
increasingly large shares of total household income (Piketty and Saez 2003, 2006; Volscho and Kelly 2012). The result of this change was a clear U-shaped pattern in income concentra-tion over the twentieth century (Burkhauser et al. 2012; McCall and Percheski 2010) that has persisted through 2010 despite a substan-tial reduction in incomes during the recession. Median annual household income was approx-imately $46,000 in 2010, but it took more than $600,000 in annual income to be in the top one percent in that year (Keister, forthcoming). As Figure 1 shows, the top one percent of income earners received nearly 20 percent of total household income; their share declined to 17 percent by 2004 but rose to more than 21 per-cent in 2007 at the height of the financial bub-ble. There was another slight decline in their share resulting from the recession that is evi-dent by 2010, but top earners continued to earn very high portions of total income. Figure 1 also includes the Gini coefficient, a summary measure ranging from 0 to 1, with 0 indicating perfect equality and 1 indicating perfect inequality. The Gini coefficient for income has
Figure 1. The one percent by income and wealth.
at PENNSYLVANIA STATE UNIV on May 9, 2016scu.sagepub.comDownloaded from
16 Social Currents 1(1)
risen since the early 1980s, but as Figure 1 shows, it was relatively stable ranging from .54 to .57 between 2001 and 2010.
Social scientists pay close attention to income concentration at least in part because of the significant change that occurred in recent decades, and they offer several explana-tions for this dramatic reversal. Economists point to rent seeking behavior by top manag-ers: Because top CEOs are able to manipulate the boards of directors that oversee them, they have been increasingly able to drive up their own incomes leading to rapid growth in top salaries (Bebchuk and Fried 2003; Bebchuk, Fried, and Walker 2002; Bebchuk and Grinstein 2005). Other economists propose that some firms, particularly large ones, are now more able to pay large salaries for scarce CEO talent (Gabaix and Landier 2008). Others suggest that benchmarking, or the use of peer groups in setting CEO salaries, can lead to dispropor-tionately large increases in top incomes that reflect social—rather than market—processes (DiPrete, Eirich, and Pittinsky 2010). Still oth-ers argue that rising income concentration reflects rightward shifts in Congress, which have lowered taxes on high incomes (Domhoff 2013a; Hacker and Pierson 2010; Phillips 2002; Volscho and Kelly 2012), while declin-ing labor union power and slow wage labor growth have weakened the income position of most Americans (Bartels 2008; McCall and Percheski 2010; Volscho and Kelly 2012). Finally, there is some evidence that the finan-cialization of the U.S. economy and the advan-tages enjoyed by a small group of people who benefit from the flow of resources into this sec-tor (Epstein and Jayadev 2005; Irvin 2008; Tomaskovic-Devey and Lin 2013).
Wealth Concentration: Extreme and Persistent
Although income is highly concentrated and changing patterns provide useful insight into the dynamics of inequality, the concentration of wealth is much more extreme and persistent. Thus, sociologists might usefully direct more research attention to the top one percent of
wealth owners. As Figure 1 shows, the top one percent of wealth owners (i.e., those with net worth exceeding $6.8 million in 2010) have held approximately one-third of the total net worth since 2001. In 2010, the top one percent owned more than 34 percent of total net worth (Figure 1), and the next 9 percent owned an additional 40 percent (not shown), leaving just over 25 percent of it, including housing assets, for the remaining households. Notably, the Gini coefficient for net worth is extremely high, exceeding .81 in each of the years pic-tured in Figure 1. Naturally, there were impor-tant changes in net worth following the recession, but the top one percent retained their massive share of the total despite the economic shock. The figure also shows that the top one percent of financial asset owners hold even higher portions of these assets. Their share of total financial assets exceeds 35 percent in each year included in Figure 1, and it was par-ticularly high at the height of the financial bubble when it exceeded 37 percent. The one percent’s share declined by 2010, but it still exceeded 35 percent. The Gini coefficient for financial assets is extremely high: It is greater than .85 in each year included in Figure 1. The Gini rose to .87 in 2010 reflecting a decrease in the share of financial assets owned by the top one percent (Figure 1) but an increase in the share owned by the next 9 percent (not shown).
Financial Portfolios: Unique Assets and Debts for Top Wealth Owners
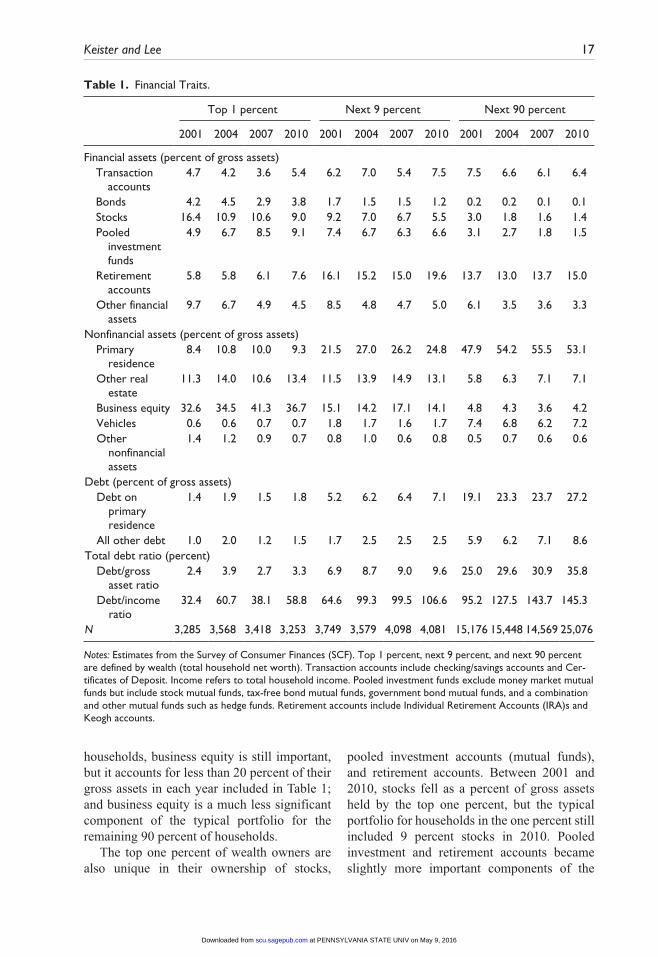
Asset ownership and debt levels provide some insight into the reasons for high levels of wealth concentration. Table 1 highlights the unique financial status of the one percent by comparing the percent of gross household assets accounted for by various assets for the top one percent, the next 9 percent, and the remaining 90 percent of households. Most notably, business equity is the most significant asset owned by the top one percent: Between 2001 and 2010, business equity accounted for 32 percent to more than 41 percent of gross assets for this group. For the next 9 percent of
at PENNSYLVANIA STATE UNIV on May 9, 2016scu.sagepub.comDownloaded from
Keister and Lee 17
households, business equity is still important, but it accounts for less than 20 percent of their gross assets in each year included in Table 1; and business equity is a much less significant component of the typical portfolio for the remaining 90 percent of households.
The top one percent of wealth owners are also unique in their ownership of stocks,
pooled investment accounts (mutual funds), and retirement accounts. Between 2001 and 2010, stocks fell as a percent of gross assets held by the top one percent, but the typical portfolio for households in the one percent still included 9 percent stocks in 2010. Pooled investment and retirement accounts became slightly more important components of the
Table 1. Financial Traits.
Top 1 percent Next 9 percent Next 90 percent
2001 2004 2007 2010 2001 2004 2007 2010 2001 2004 2007 2010
Financial assets (percent of gross assets) Transaction accounts
4.7 4.2 3.6 5.4 6.2 7.0 5.4 7.5 7.5 6.6 6.1 6.4
Bonds 4.2 4.5 2.9 3.8 1.7 1.5 1.5 1.2 0.2 0.2 0.1 0.1 Stocks 16.4 10.9 10.6 9.0 9.2 7.0 6.7 5.5 3.0 1.8 1.6 1.4 Pooled investment funds
4.9 6.7 8.5 9.1 7.4 6.7 6.3 6.6 3.1 2.7 1.8 1.5
Retirement accounts
5.8 5.8 6.1 7.6 16.1 15.2 15.0 19.6 13.7 13.0 13.7 15.0
Other financial assets
9.7 6.7 4.9 4.5 8.5 4.8 4.7 5.0 6.1 3.5 3.6 3.3
Nonfinancial assets (percent of gross assets) Primary residence
8.4 10.8 10.0 9.3 21.5 27.0 26.2 24.8 47.9 54.2 55.5 53.1
Other real estate
11.3 14.0 10.6 13.4 11.5 13.9 14.9 13.1 5.8 6.3 7.1 7.1
Business equity 32.6 34.5 41.3 36.7 15.1 14.2 17.1 14.1 4.8 4.3 3.6 4.2 Vehicles 0.6 0.6 0.7 0.7 1.8 1.7 1.6 1.7 7.4 6.8 6.2 7.2 Other nonfinancial assets
1.4 1.2 0.9 0.7 0.8 1.0 0.6 0.8 0.5 0.7 0.6 0.6
Debt (percent of gross assets) Debt on primary residence
1.4 1.9 1.5 1.8 5.2 6.2 6.4 7.1 19.1 23.3 23.7 27.2
All other debt 1.0 2.0 1.2 1.5 1.7 2.5 2.5 2.5 5.9 6.2 7.1 8.6Total debt ratio (percent) Debt/gross asset ratio
2.4 3.9 2.7 3.3 6.9 8.7 9.0 9.6 25.0 29.6 30.9 35.8
Debt/income ratio
32.4 60.7 38.1 58.8 64.6 99.3 99.5 106.6 95.2 127.5 143.7 145.3
N 3,285 3,568 3,418 3,253 3,749 3,579 4,098 4,081 15,176 15,448 14,569 25,076
Notes: Estimates from the Survey of Consumer Finances (SCF). Top 1 percent, next 9 percent, and next 90 percent are defined by wealth (total household net worth). Transaction accounts include checking/savings accounts and Cer-tificates of Deposit. Income refers to total household income. Pooled investment funds exclude money market mutual funds but include stock mutual funds, tax-free bond mutual funds, government bond mutual funds, and a combination and other mutual funds such as hedge funds. Retirement accounts include Individual Retirement Accounts (IRA)s and Keogh accounts.
at PENNSYLVANIA STATE UNIV on May 9, 2016scu.sagepub.comDownloaded from
18 Social Currents 1(1)
portfolios of the one percent during the decade included in Table 1, reflecting both changing relative values of the accounts and continued investments particularly in retirement accounts. The financial holdings of the next 9 percent of the distribution are notably different than those of the top one percent. For the next 9 percent, pooled investment funds and retirement accounts are still important, but the primary residence and retirement accounts make up a much larger portion of the typical portfolio.
For the remaining 90 percent of the popula-tion, the primary residence is absolutely criti-cal: Home equity accounts for more than half of the typical portfolio for these families even as housing values declined during the reces-sion. Retirement accounts are also important for the bottom 90 percent, a pattern that is new since the 1990s, but the primary residence is still the most significant resource these house-holds own. These patterns are suggestive of both the reasons people are in the top one per-cent and the degree to which they can with-stand future financial crises.
Household liabilities or debts are also criti-cally important indicators of well-being; indeed, they were liabilities, particularly mort-gage debt, that were at the heart of the financial crisis, and liabilities continue to distinguish top wealth holders from the rest of the popula-tion. Table 1 shows that debt is a relatively low and constant percent of total gross assets for the top one percent, ranging from 1 to 2 per-cent between 2001 and 2010. Debt on the pri-mary residence as a percentage of gross assets is higher for those in the next 9 percent, but this ratio is particularly high for households in the remaining 90 percent of the distribution. Moreover, debt on the primary residence increased significantly from 19.1 percent in 2001 to more than 27 percent in 2010 follow-ing the financial and housing crisis.
Most striking in this table is the extremely high and growing debt to income ratios evident for most households. While the top one percent saw an increase in their debt to income ratio between 2001 and 2010, those in the rest of the distribution watched their debt balloon relative to their income. For those in the next 9 percent, this ratio grew from 64.6 percent to more than
106 percent, and for those in the remaining 90 percent of the distribution, this ratio grew from more than 95 percent to more than 145 percent. Indeed, as the Financial Crisis Inquiry Commission (FCIC) concluded, mortgage bro-kers capitalized on households’ willingness to take on additional debt during this decade, and, ultimately, Americans took more than $2 tril-lion out of their home equity between 2000 and 2007. Households took more than $334 billion in home equity loans in 2006 alone, more than seven times the amount they took in 1996 (FCIC 2011). Although there are some impor-tant exceptions (Rugh and Massey 2010), household debt is relatively understudied in sociology.
Creating Top Wealth: Demographics and Inheritance
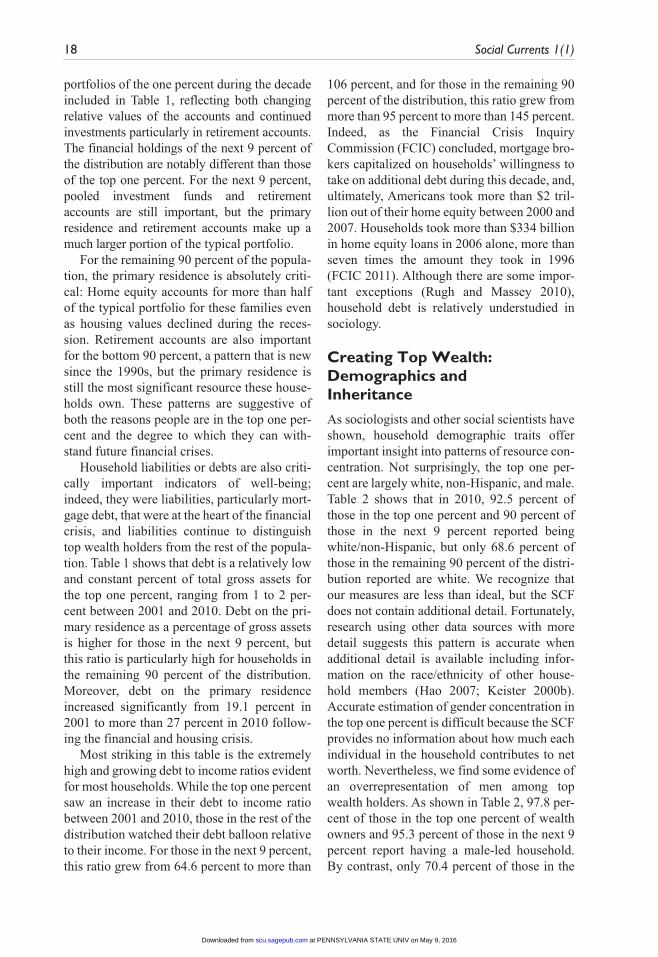
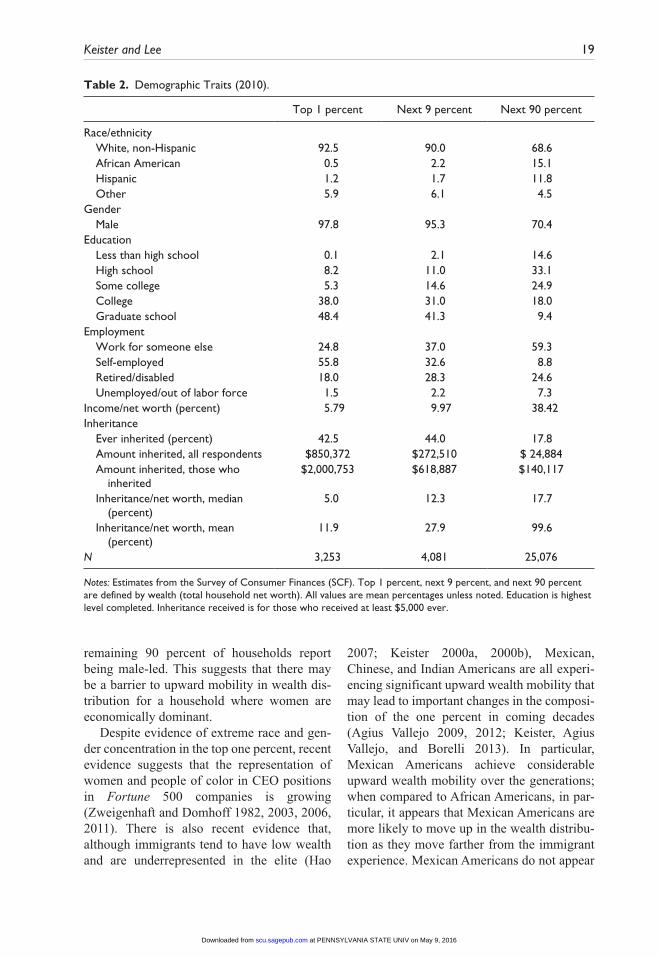
As sociologists and other social scientists have shown, household demographic traits offer important insight into patterns of resource con-centration. Not surprisingly, the top one per-cent are largely white, non-Hispanic, and male. Table 2 shows that in 2010, 92.5 percent of those in the top one percent and 90 percent of those in the next 9 percent reported being white/non-Hispanic, but only 68.6 percent of those in the remaining 90 percent of the distri-bution reported are white. We recognize that our measures are less than ideal, but the SCF does not contain additional detail. Fortunately, research using other data sources with more detail suggests this pattern is accurate when additional detail is available including infor-mation on the race/ethnicity of other house-hold members (Hao 2007; Keister 2000b). Accurate estimation of gender concentration in the top one percent is difficult because the SCF provides no information about how much each individual in the household contributes to net worth. Nevertheless, we find some evidence of an overrepresentation of men among top wealth holders. As shown in Table 2, 97.8 per-cent of those in the top one percent of wealth owners and 95.3 percent of those in the next 9 percent report having a male-led household. By contrast, only 70.4 percent of those in the
at PENNSYLVANIA STATE UNIV on May 9, 2016scu.sagepub.comDownloaded from
Keister and Lee 19
remaining 90 percent of households report being male-led. This suggests that there may be a barrier to upward mobility in wealth dis-tribution for a household where women are economically dominant.
Despite evidence of extreme race and gen-der concentration in the top one percent, recent evidence suggests that the representation of women and people of color in CEO positions in Fortune 500 companies is growing (Zweigenhaft and Domhoff 1982, 2003, 2006, 2011). There is also recent evidence that, although immigrants tend to have low wealth and are underrepresented in the elite (Hao
2007; Keister 2000a, 2000b), Mexican, Chinese, and Indian Americans are all experi-encing significant upward wealth mobility that may lead to important changes in the composi-tion of the one percent in coming decades (Agius Vallejo 2009, 2012; Keister, Agius Vallejo, and Borelli 2013). In particular, Mexican Americans achieve considerable upward wealth mobility over the generations; when compared to African Americans, in par-ticular, it appears that Mexican Americans are more likely to move up in the wealth distribu-tion as they move farther from the immigrant experience. Mexican Americans do not appear
Table 2. Demographic Traits (2010).
Top 1 percent Next 9 percent Next 90 percent
Race/ethnicity White, non-Hispanic 92.5 90.0 68.6 African American 0.5 2.2 15.1 Hispanic 1.2 1.7 11.8 Other 5.9 6.1 4.5Gender Male 97.8 95.3 70.4Education Less than high school 0.1 2.1 14.6 High school 8.2 11.0 33.1 Some college 5.3 14.6 24.9 College 38.0 31.0 18.0 Graduate school 48.4 41.3 9.4Employment Work for someone else 24.8 37.0 59.3 Self-employed 55.8 32.6 8.8 Retired/disabled 18.0 28.3 24.6 Unemployed/out of labor force 1.5 2.2 7.3Income/net worth (percent) 5.79 9.97 38.42Inheritance Ever inherited (percent) 42.5 44.0 17.8 Amount inherited, all respondents $850,372 $272,510 $ 24,884 Amount inherited, those who inherited
$2,000,753 $618,887 $140,117
Inheritance/net worth, median (percent)
5.0 12.3 17.7
Inheritance/net worth, mean (percent)
11.9 27.9 99.6
N 3,253 4,081 25,076
Notes: Estimates from the Survey of Consumer Finances (SCF). Top 1 percent, next 9 percent, and next 90 percent are defined by wealth (total household net worth). All values are mean percentages unless noted. Education is highest level completed. Inheritance received is for those who received at least $5,000 ever.
at PENNSYLVANIA STATE UNIV on May 9, 2016scu.sagepub.comDownloaded from
20 Social Currents 1(1)
to be reaching parity with whites, perhaps reflecting continued racialized processes that differentially affect people of color (Keister et al. 2013). Future research could usefully explore these patterns in more detail.
Education and work patterns also suggest reasons for high levels of wealth concentration. Education is clearly correlated with having high wealth: 38 percent of those in the top one per-cent are college graduates, and an additional 48.4 percent have professional degrees in sharp contrast to other households. We carefully note that this is an association rather than calling the relationship causal, although evidence that edu-cation provides access to unique, high-income occupational opportunities is clear (Cookson and Persell 1985; Domhoff 2013b).
Notably and consistent with our claim above regarding the wealth benefits of entre-preneurship and business ownership, Table 2 shows that self-employment is particularly high among those in the top one percent of wealth owners. An important, related pattern shown in Table 2 is the income/net worth ratio. The table shows that for those in the top one percent of wealth owners, the income/net worth ratio is less than 6 percent, and for those in the next 9 percent, the ratio is less than 10 percent. However, for the remaining 90 per-cent of the population, this ratio is more than 38 percent, suggesting that for the very wealthy, income becomes a much less signifi-cant resource than assets.
Inheritance is also an important factor con-tributing to top wealth ownership, and as Table 2 shows, there are substantial differences between the top one percent and other house-holds in inheriting. The SCF asked respon-dents to report the total value of up to four inheritances received and the dates on which they received those inheritances; dates are recorded for the first three instances, and the fourth includes all other funds inherited. In Table 2, ever inherited refers to the percentage of respondents who received an inheritance at any time. Inheritance values are the sum of the four reported inheritances inflated to 2010 dol-lars from the appropriate years and making the conservative assumption that the “all other” inheritances occurred in 2010 (and are, thus,
not inflated). The table shows that 42.5 percent of those in the top one percent of the wealth distribution and 44 percent of those in the next 9 percent inherited some amount at least once. In contrast, only 17.8 percent of those in the remaining 90 percent have inherited.
The table also shows the average inheri-tance for all respondents in each segment of the distribution and the average for just those who have inherited. The most striking differ-ence here is that for top wealth owners, the average inheritance received is more than $2 million, while for even those in the next 9 per-cent, the average is only $618,000, less than one-third the amount received by those at the top of the distribution. As we mentioned above, the threshold for being included in the top one percent of wealth holders is $6.8 million, mak-ing inheritance a significant but not majority portion of the wealth owned at the top.
Inheritance nevertheless constitutes a small portion of existing wealth for the top one per-cent; as the last lines in Table 2 show, the median inheritance/net worth ratio is 5.0 per-cent and the mean ratio is 11.9 percent for the top one percent. The true meaning of this is difficult to ascertain because inheritance can take the form of financial assets, real assets, or business assets. Moreover, dramatic rises in stock values since the mid-1990s suggest that concluding that a small ratio of inheritance to net worth could be misleading when trying to understand current net worth, but the pattern certainly deserves additional attention.
Conclusion and Future Research
OWS and related protest movements brought popular attention to the differences between those at the top of the income and wealth dis-tributions and the rest of the population. The movement’s slogan—we are the 99 percent—was both a rallying cry and an important reminder that a very small portion of the popu-lation controls large portions of total income and wealth and, as a result, is comparatively insulated from economic downturns.
We proposed that sociologists might use-fully direct more research attention to the one
at PENNSYLVANIA STATE UNIV on May 9, 2016scu.sagepub.comDownloaded from
Keister and Lee 21
percent in their efforts to understand inequal-ity. We distinguished income from wealth (net worth) and used data from the SCF to show that both are very unequally distributed, but wealth inequality is particularly high. We then summarized patterns in the concentration of wealth that are worth additional research atten-tion. We found that top wealth owners’ control of business equity and stocks was extremely high over the decade surrounding the recent financial crisis, and although top wealth own-ers experienced changes in their holdings dur-ing these years, they were relatively able to withstand the crisis. Similarly, we found that the debt-to-income ratio of most households rose steeply during the recession while top wealth holders were much less leveraged. We then summarized some important demographic traits of the one percent and showed that they tend to be white, highly educated, and rela-tively likely to be self-employed. Finally, we showed that relatively high portions of top wealth holders have inherited and that, when they did inherit, they inherited large sums. Yet, we stressed that inheritance appears to consti-tute a fairly small portion of current wealth for the top one percent suggesting that inheritance may be only part of the financial story for these privileged households.
The patterns we have shown suggest there is room for considerable sociological attention to the one percent. In particular, we showed that both income and wealth are highly concen-trated, but we did not explore the degree to which the same households control both income and net worth (the joint distribution), an impor-tant measure of influence and advantage. We did not discuss the possibility that membership in the one percent changes over time, and it is likely that there are important differences here that would provide insight into our understand-ing of stratification and inequality. In addition, although sociologists have increasingly consid-ered housing wealth in their work on inequality (Campbell and Kaufman 2006; Hao 2007; Myers 2008), our estimates showed that this is sensible because the primary residence contin-ues to be an important resource for most house-holds. However, our estimates suggested that
financial and business asset ownership is also an important outcome that can provide important insight into inequality and resource concentration.
There is a rich tradition of sociological research on the determinants of business entry (Fairlie and Robb 2008; Robles and Cordero-Guzman 2007; Valdez 2011), but sociologists might consider whether financial and business asset ownership are necessary for entry into the one percent and whether there are barriers to ownership of these assets that preclude own-ership in systematic ways. Similarly, house-hold debt attracts little attention, but patterns such as the extraordinarily high debt-to-income ratios that characterize the financial situations of most American households and the role of debt in creating the recent financial crisis sug-gest that liabilities are worth additional research attention.
Sociologists have focused a good deal of attention on the role race and ethnicity play in creating and maintaining inequalities, but the racial and ethnic characters of the one percent and its importance to understanding the distri-bution of economic power have thus far gar-nered little attention. There are exceptions (Zweigenhaft and Domhoff 2003, 2006, 2011), of course, but these have been focused on CEOs and could usefully be supplemented with work on the role of race and ethnicity in top incomes and wealth. Similarly, gender dif-ferences in income are widely studied, but the degree to which gender affects saving, asset accumulation, and debt attracts very little attention. Again, there are important excep-tions (Chang 2010; Zweigenhaft and Domhoff 2006); however, because wealth is a household concept, it can be challenging to identify asset ownership and debts by gender, but creative approaches to comparing the net worth and portfolios of unmarried and married people can provide insight into both gendered social processes and wealth inequality.
Finally, although inheritance is absolutely central to understanding inequality, it attracts virtually no attention in sociology. Of course, sociologists since Blau and Duncan’s seminal work on inherited socioeconomic status have
at PENNSYLVANIA STATE UNIV on May 9, 2016scu.sagepub.comDownloaded from
22 Social Currents 1(1)
been aware of the importance of intergenera-tional processes in generating inequality, but the most basic form of inheritance—the trans-fer of resources across generations—has attracted very little attention. Our estimates showed that the one percent inherit at high rates and, when they inherit, they receive rela-tively large sums. However, our estimates also suggested that there might be room for mobil-ity into the one percent. Our analyses do not show whether wealth accumulation is primar-ily based on inheritance or other factors, but future research could usefully fill this gap.
Declaration of Conflicting Interests
The author(s) declared no potential conflicts of interest with respect to the research, authorship, and/or publication of this article.
Funding
The author(s) received the following financial sup-port for the research, authorship, and/or publication of this article: Lisa A. Keister acknowledges a grant from the National Science Foundation (SES-1322738) that supported this research.
References
Agius Vallejo, Jody. 2009. “Latina Spaces: Middle-Class Ethnic Capital and Professional Associations in the Latino Community.” City and Community 8:129–54.
Agius Vallejo, Jody. 2012. Barrios to Burbs: The Making of the Mexican-American Middle Class. Palo Alto, CA: Stanford University Press.
Atkinson, Anthony B. 2010. Top Incomes: A Global Perspective. Oxford, UK: Oxford University Press.
Bartels, Larry M. 2008. Unequal Democracy: The Political Economy of the New Gilded Age. Princeton, NJ: Princeton University Press.
Bebchuk, Lucian Arye and Jesse M. Fried. 2003. “Executive Compensation as an Agency Problem.” Journal of Economic Perspectives 17:71–92.
Bebchuk, Lucian Arye, Jesse M. Fried, and E. I. Walker. 2002. “Managerial Power and Rent Extraction in the Design of Executive Compensation.” University of Chicago Law Review 69:751–846.
Bebchuk, Lucian Arye and Yaniv Grinstein. 2005. “The Growth of Executive Pay.” Oxford Review of Economic Policy 21:283–303.
Bureau of Labor Statistics. 2012. Spotlight on Statistics of the Recession of 2007–2009. Washington, DC: Bureau of Labor Statistics.
Burkhauser, Richard V., Shuaizhang Feng, Stephen P. Jenkins, and Jeff Larrimore. 2012. “Recent Trends in Top Income Shares in the United States: Reconciling Estimates from March CPS and IRS Tax Return Data.” Review of Economics and Statistics 94:371–88.
Campbell, Lori Ann and Robert L. Kaufman. 2006. “Racial Differences in Household Wealth: Beyond Black and White.” Research in Social Stratification and Mobility 24:131–52.
Chang, Mariko. 2010. Shortchanged: Why Women Have Less Wealth and What Can Be Done about It. New York: Oxford University Press.
Congressional Budget Office. October 25, 2011. Trends in the Distribution of Income. Washington, DC: Congressional Budget Office.
Cookson, Peter W. and Caroline Hodges Persell. 1985. Preparing for Power: America’s Elite Boarding Schools. New York: Basic Books.
DiPrete, Thomas A., Gregory M. Eirich, and Matthew Pittinsky. 2010. “Compensation Benchmarking, Leapfrogs, and the Surge in Executive Pay.” American Journal of Sociology 115:1671–712.
Domhoff, G. William. 2013a. The Myth of Liberal Ascendancy. Boulder, CO: Paradigm.
Domhoff, G. William. 2013b. Who Rules America? The Triumph of the Corporate Rich. New York: McGraw-Hill.
Epstein, Gerald A. and Arjun Jayadev. 2005. “The Rise of Rentier Income in OECD Countries: Financialization, Central Bank Policy, and Labor Solidarity.” Pp. 46–74 in Financialization and the World Economy, edited by A. E. Gerald. Northampton, MA: Edward Elgar Press.
Fairlie, Robert W. and Alice M. Robb. 2008. Race and Entrepreneurial Success: Black-, Asian-, and White-Owned Businesses in the United States. Cambridge, MA: MIT Press.
Financial Crisis Inquiry Commission. 2011. The Financial Crisis Inquiry Report. Washington, DC: Financial Crisis Inquiry Commission.
Fligstein, Neil and Adam Goldstein. 2011. “The Roots of the Great Recession.” Pp. 21–56 in The Great Recession, edited by D. B. Grusky, B. Western, and C. Wimer. New York: Russell Sage Foundation.
Gabaix, Xavier and Augustin Landier. 2008. “Why Has CEO Pay Increased So Much?” Quarterly Journal of Economics 123:49–100.
at PENNSYLVANIA STATE UNIV on May 9, 2016scu.sagepub.comDownloaded from
Keister and Lee 23
Grusky, David B., Bruce Western, and Christopher Wimer. 2011. “The Consequences of the Great Recession.” Pp. 3–20 in The Great Recession, edited by D. B. Grusky, B. Western, and C. Wimer. New York: Russell Sage Foundation.
Hacker, Jacob S. and Paul Pierson. 2010. “Winner-Take-All Politics: Public Policy, Political Organization, and the Precipitous Rise of Top Incomes in the United States.” Politics & Society 38:152–204.
Hao, Lingxin. 2007. Color Lines, Country Lines: Race, Immigration, and Wealth Stratification in America. New York: Russell Sage Foundation.
Hout, Michael, Asaf Levanon, and Erin Cumberworth. 2011. “Job Loss and Unem-ployment.” Pp. 59–81 in The Great Recession, edited by D. B. Grusky, B. Western, and C. Wimer. New York: Russell Sage Foundation.
Irvin, George. 2008. Super Rich: The Rise of Inequality in Britain and the United States. Malden, MA: Polity Press.
Johnson, Barry and Kevin Moore. 2005. Consider the Source: Differences in Estimates of Income and Wealth from Survey and Tax Data. Washington DC: Federal Reserve Board.
Keister, Lisa A. 2000a. “Race and Wealth Inequality: The Impact of Racial Differences in Asset Ownership on the Distribution of Household Wealth.” Social Science Research 29:477–502.
Keister, Lisa A. 2000b. Wealth in America: Trends in Wealth Inequality. New York: Cambridge University Press.
Keister, Lisa A. 2005. Getting Rich: America’s New Rich and How They Got that Way. New York: Cambridge University Press.
Keister, Lisa A. Forthcoming. “The One Percent.” Annual Review of Sociology. Volume 40.
Keister, Lisa A., Jody Agius Vallejo, and E. Paige Borelli. 2013. “Mexican American Mobility: An Exploration of Wealth Trajectories.” Duke University Department of Sociology Working Paper.
Kennickell, Arthur B. 2003. “A Rolling Tide: Changes in the Distribution of Wealth in the U.S., 1989-2001.” Federal Reserve Board Working Paper.
Kennickell, Arthur B. 2008. “The Role of Over-sampling of the Wealthy in the Survey of Consumer Finances.” Washington DC: Federal Reserve Board working paper.
Kennickell, Arthur B. 2011. Look Again: Editing and Imputation of SCF Panel Data. Washington DC: Federal Reserve Board.
Kopczuk, Wojciech, Emmanuel Saez, and Jae Song. 2010. “Earnings Inequality and Mobility in the United States: Evidence from Social Security Data since 1937.” Quarterly Journal of Economics 125:91–128.
McCall, Leslie and Christine Percheski. 2010. “Income Inequality: New Trends and Research Directions.” Annual Review of Sociology 36:329–47.
Myers, Dowell. 2008. Immigrants and Boomers: Forging a New Social Contract for the Future of America. New York: Russell Sage Foundation.
Phillips, Kevin P. 2002. Wealth and Democracy: A Political History of the American Rich. New York: Broadway Books.
Piketty, Thomas and Emmanuel Saez. 2003. “Income Inequality in the United States, 1913–2002.” Quarterly Journal of Economics 118:1–39.
Piketty, Thomas and Emmanuel Saez. 2006. “The Evolution of Top Incomes: A Historical and International Perspective.” American Economic Review 9:200–205.
Robles, Barbara J. and Hector Cordero-Guzman. 2007. “Latino Self-Employment and Entrepre-neurship in the United States: An Overview of the Literature and Data Sources.” The Annals of the American Academy of Political and Social Science 613:18–31.
Rugh, Jacob S. and Douglas S. Massey. 2010. “Racial Segregation and the American Foreclosure Crisis.” American Sociological Review 75:629–51.
Taylor, Paul. 2013. An Uneven Recovery, 2009–2011: A Rise in Wealth for the Wealthy; Declines for the Lower 93%. Washington, DC: Pew Research Center.
Tomaskovic-Devey, Donald and Ken-Hou Lin. 2013. “Income Dynamics, Economic Rents, and the Financialization of the U.S. Economy.” American Sociological Review 76:538–59.
Treas, Judith. 2010. “The Great American Recession: Sociological Insights on Blame and Pain.” Sociological Perspectives 53:3–18.
Valdez, Zulema. 2011. The New Entrepreneurs: How Race, Class, and Gender Shape American Enterprise. Palo Alto, CA: Stanford University Press.
Volscho, Thomas W. and Nathan J. Kelly. 2012. “The Rise of the Super-Rich: Power Resources, Taxes, Financial Markets, and the Dynamics of the Top 1 Percent, 1949 to 2008.” American Sociological Review 77:679–99.
at PENNSYLVANIA STATE UNIV on May 9, 2016scu.sagepub.comDownloaded from

24 Social Currents 1(1)
Wolff, Edward N., Lindsay A. Owens, and Esra Burak. 2011. “How Much Wealth Was Destroyed in the Great Recession?” Pp. 127–58 in The Great Recession, edited by D. B. Grusky, B. Western, and C. Wimer. New York: Russell Sage Foundation.
Zweigenhaft, Richard L. and G. William Domhoff. 1982. Jews in the Protestant Establishment. New York: Praeger Publishers.
Zweigenhaft, Richard L. and G. William Domhoff. 2003. Blacks in the White Elite: Will the
Prog ress Continue? Lanham, MD: Rowman & Littlefield.
Zweigenhaft, Richard L. and G. William Domhoff. 2006. Diversity in the Power Elite: Have Women and Minorities Reached the Top? New Haven, CT: Yale University Press.
Zweigenhaft, Richard L. and G. William Domhoff. 2011. The New CEOs: Women, African American, Latino, and Asian American Leaders of Fortune 500 Companies. Lanham, MD: Rowman & Littlefield.
at PENNSYLVANIA STATE UNIV on May 9, 2016scu.sagepub.comDownloaded from