Atlas of Ocean Wealth
124
Ocean Wealth Atlas of MARK SPALDING, ROBERT D. BRUMBAUGH AND EMILY LANDIS
-
Upload
khangminh22 -
Category
Documents
-
view
3 -
download
0
Transcript of Atlas of Ocean Wealth

Ocean WealthAtlas of
MARK SPALDING, ROBERT D. BRUMBAUGH AND EMILY LANDIS

that is as old as the oceans themselves, We are telling a story
but we are re-telling it from a new vantage point –
Ocean Wealth

that is as old as the oceans themselves,
Ocean Wealth
Mission
The mission of The Nature Conservancy is to conserve the lands and waters on which all life depends.
Vision
The Nature Conservancy envisions a world where the diversity of life thrives, and people act to conserve nature for its own sake and its ability to fulfill our needs and enrich our lives.
Values
Integrity beyond reproach
Respect for people, communities and cultures
Commitment to diversity
One Conservancy
Tangible, lasting results
The Nature Conservancy
4245 North Fairfax Drive, Suite 100Arlington, VA 22203-1606Phone: 703-841-5300Website: www.nature.org
Suggested Citation
Spalding, MD; Brumbaugh RD; and Landis, E (2016). Atlas of Ocean Wealth. The Nature Conservancy. Arlington, VA.
© 2016 The Nature Conservancy, All rights reserved. ISBN-13: 978-0-9977069-1-8
The designations employed and the presentation of material in this publication do not imply the expression of any opinion whatsoever on the part of The Nature Conservancy or the authors of this report concerning the legal status of any country, territory, city or area or of its authorities, or concerning the delimitation of its frontiers or boundaries. The global administrative boundaries used in the atlas maps are from the GADM database of administrative areas, available here: http://gadm.org/about

Informed by science,
communications and
policy work, Mapping
Ocean Wealth illustrates
all that the ocean does for
us today, so that we make
smarter decisions for the
ocean of tomorrow.

The Nature Conservancy would like to recognize the contribution of the following organizations.
The Mapping Ocean Wealth initiative along with the Atlas of Ocean Wealth was made possible by the generosity of the following institutions and individuals. We would particularly like to thank The World Bank Group and Lyda Hill Foundation for early support to conceptualize and launch the Mapping Ocean Wealth Initiative, as well as Diane Van Wyck, Carnival Foundation and Microsoft for ongoing support.

Contributing Authors ...................................................................................................................................................................iii
Acknowledgments ............................................................................................................................................................................. iv
Foreword ........................................................................................................................................................................................................viiLyda Hill and Maria Damanaki
Executive Summary ...........................................................................................................................................................................1
Introduction .................................................................................................................................................................................................6
Part 1: A Host of Services .......................................................................................................................................................11
Making Fish ................................................................................................................................................................................................ 12
Breaking Waves ...................................................................................................................................................................................34
Cleaning Up .............................................................................................................................................................................................. 46
Storing Carbon ......................................................................................................................................................................................50
The Value of Visitors .....................................................................................................................................................................56
The Value of Just Being There .........................................................................................................................................66
Part 2: Changing the Way We See Nature ................................................................................................73
Bringing Natural Values to Bear ................................................................................................................................... 74
Adding Up the Benefits .............................................................................................................................................................76
Managing and Protecting Services ......................................................................................................................... 80
Paying What is Owed .................................................................................................................................................................94
A Future Vision ................................................................................................................................................................................. 100
Sources and Technical Notes ......................................................................................................................................102
Table of Contents
Table of Contents i

Contributing AuthorsForeword
Lyda Hill (Lyda Hill Foundation)
Maria Damanaki (The Nature Conservancy)
Making Fish
Philine zu Ermgassen (University of Cambridge), Jonathan Grabowski (Northeastern University), Alistair Harborne (University of Queensland), Alison Green (The Nature Conservancy), Andrew F. Johnson (Scripps Institution of Oceanography), Marcia Moreno-Báez (Centro de Biodiversidad Marina y Conservación), Andrés Cisneros Montemayor (The University of British Columbia), Alvin Suárez (Scripps Institution of Oceanography), Octavio Aburto-Oropeza (Scripps Institution of Oceanography)
Breaking Waves
Michael W. Beck (The Nature Conservancy), Iñigo Losada (IH Cantabria), Borja Reguero (The Nature Conservancy), Pelayo Menendez (IH Cantabria), Lauretta Burke (World Resources Institute)
Cleaning Up
Boze Hancock (The Nature Conservancy) and Philine zu Ermgassen (University of Cambridge)
Storing Carbon
Leah Glass (Blue Ventures)
The Value of Visitors
Lauretta Burke (World Resources Institute), Cara Daneel (University of Cambridge), Mariana Walther Mendoza (The Nature Conservancy), Glaudy Perdanahardja (The Nature Conservancy)
Bringing Natural Values to Bear
Pawan Patil (World Bank Group)
Adding Up the Benefits
Linwood Pendleton (Duke University), Evangalia Drakou (University of West Brittany)
Managing and Protecting Services
Joanna Smith (TNC Canada)
Enhancing Services
Boze Hancock (The Nature Conservancy)
Paying What is Owed
Peter Wheeler (The Nature Conservancy)
Contributing Authors iii

The Mapping Ocean Wealth team is a global partnership of ecosystem services specialists composed of many organizations and individuals that provided advice, support and contributions to this Atlas of Ocean Wealth.
Atlas Production
Map preparation: Rick Tingey (Spatial Support Systems, LLC), Zach Ferdaña (The Nature Conservancy), Laura Flessner (The Nature Conservancy)
Book design: Paul Gormont (Apertures Inc.)
Copy-editor: Andrew Myers
Coordination, planning, design: Caroline Spruill (The Nature Conservancy)
Mapping Ocean Wealth’s Advisory Team:
Lauretta Burke (WRI), Marea Hatziolos, Elaine Heldewier (Carnival Corporations & plc), Carter Ingram (EY), Les Kaufmann (Boston University), Steven Lutz (GRID-Arendal), Christian Neumann (GRID-Arendal), Pawan G Patil (World Bank Group), Linwood Pendleton (Duke University), Tracy Rouleau (NOAA), Rashid Sumaila (University of British Columbia).
The Nature Conservancy’s Ocean Wealth Steering Committee:
Charles Bedford, Shannon Crownover, Dietmar Grimm, Lynne Hale, Julia Kashkashian, Marianne Kleiberg, Skyli McAfee, Jen Molnar, Aurelio Ramos, Lynn Scarlett, Chrissy Schwinn, Peter Wheeler
Acknowledgments
The Mapping Ocean Wealth Central Team
Rob Brumbaugh (The Nature Conservancy. Project Director), Mark Spalding (The Nature Conservancy. Senior Scientist), Emily Landis (The Nature Conservancy. Project Manager), Vera Agostini (The Nature Conservancy. Pelagic), Mike Beck (The Nature Conservancy. Coastal Protection), Boze Hancock (The Nature Conservancy. Shellfish), Philine zu Ermgassen (University of Cambridge. Fisheries), James Byrne (The Nature Conservancy. Caribbean), Chris Gillies (The Nature Conservancy. Australia), Jennifer Greene (The Nature Conservancy. U.S. Atlantic Coast), Glaudy Perdanahardja (The Nature Conservancy. Indonesia), Elizabeth Terk (The Nature Conservancy. Micronesia), Mariana Walther Mendoza (The Nature Conservancy. Gulf of California), Katie Mandes (The Nature Conservancy. Communications).
Expert Contributions
The following individuals are in addition to the considerable input provided by contributing authors and central team members.
Joscelyn Ashpole (University of Cambridge. Tourism), Dominique Benzaken (GLISPA Policy), Tanya Bryan (GRID- Arendal. Ecosystem Services), Jesse Cleary (Duke University. EBSAs), Bryan DeAngelis (The Nature Conservancy. Shellfish), Fanny Douvere (UNESCO. Intrinsic Value), Kirsten Evans (The Nature Conservancy. Policy), Zach Ferdaña (The Nature Conservancy. Coastal Protection, Mapping), Laura Flessner (The Nature Conservancy. Coastal Protection, Mapping), Emma Garnett (University of Cambridge. Fisheries), Patrick Halpin (Duke University. EBSAs), James Hutchison (University of Cambridge, Fisheries and Tourism), Steven Katona (CI. Ocean Health Index), James Kay (TripAdvisor. Tourism), Jihyun Lee (Convention on Biological Diversity. EBSA), Tom McCann (The Nature Conservancy. Communications), Anna McIvor (University of Cambridge, Coastal Protection),
Bruce McKenney (TNC, Biodiversity offsets), Amanda Wrona-Meadows (The Nature Conservancy. Communications), Imen Meliane (Policy), Johanna Polsenberg (CI. Ocean Health Index), Elizabeth Schuster (The Nature Conservancy. Shellfish), Fernando Secaira (The Nature Conservancy. Coastal Protection), Caroline Spruill (The Nature Conservancy. Communications), Spencer Wood (Natural Capital Project. Tourism), J.E.N. Veron (Coral Reef Research, Intrinsic Value, Coral Diversity Map)
Expert Contributions on Regional Ecosystem Services
The following individuals are in addition to the considerable input provided by contributing authors and central team members.
Muhammad Imran Amin (The Nature Conservancy. Indonesia), Luki Andrianto (PKSPL IPB. Indonesia), Pablo Arenas (Instituto Nacional de Pesca. Gulf of California) Diana Bermudez (The Nature Conservancy. Gulf of California), Juan Bezaury (The Nature Conservancy. Gulf of California), Eddie Game (The Nature Conservancy. Micronesia), Alfredo Girón Nava (Scripps Institution of Oceanography. Gulf of California), Yimnang Golbuu (Palau International Coral Reef Center. Micronesia), Natalie Holland (The Nature Conservancy. Australia), Peter Houk (University of Guam. Micronesia), Alan Koropitan (Surya University. Indonesia), Cristina Lasch (The Nature Conservancy. Gulf of California), Trina Leberer (The Nature Conservancy. Micronesia), Maria Lascurain Leon (The Nature Conservancy. Gulf of California), Steve Lindfield (University of Guam. Micronesia), Peter Mumby (University of Queensland. Micronesia), Mirza Pedju (The Nature Conservancy. Indonesia), Nate Peterson (The Nature Conservancy. Micronesia), Hugh Possingham (University of Queensland. Micronesia), Gondan Renosari (The Nature Conservancy. Indonesia), Steve Schill (The Nature Conservancy. Caribbean), Lida Pet Soede (Hatfield Indonesia. Indonesia), Steven Victor (The Nature Conservancy. Micronesia).
Acknowledgments vAcknowledgments v

M A K I N G F I S H

Oceans were the crucible from which life emerged, billions of years ago.
Over the course of human history, oceans have nourished people, provided a byway for goods and travelers across vast distances, and allowed humans to develop, innovate, and flourish as a species. We exist, because oceans provide for us.
In our lifetime, the oceans have changed from being viewed as an inexhaustible resource to an imperiled one. The food, energy, and enjoyment that oceans offer—long taken for granted—are no longer a certainty. Scientists and fishers alike have pointed to signs of trouble, from declining fish catches, to warming ocean temperatures, to disappearing habitats. Our seas are rising in response to a changing climate, encroaching onto land, threatening some of our greatest cities and placing hundreds of millions of people at risk from storms. All of this jeopardizes human economic well-being.
While the challenges are urgent, they are not insurmountable. Solving them, however, will require bold new commitments and partnerships to preserve ocean habitats and the benefits they provide to humanity. It also will require a new and deeper understanding of the way oceans do that; a new kind of ocean knowledge that shows us not just how these benefits are produced, but also where.
Developing this new knowledge alone is not sufficient. It must be made widely available, adopted, and applied to shape future investments in economic development. Doing so will help lift people out of poverty, in ways that sustain, rather than diminish, the oceans’ ability to produce benefits for people and nature.
Mapping Ocean Wealth is an initiative born from this commitment—to clarify the role of ocean habitats in supporting human well-being, using new approaches and new thinking by scientists from leading organizations around the world. This effort is about more than just developing innovative science. It is about ensuring that this science is harnessed, focused, and applied to support the important work of ocean stewards, business leaders, investors, and communities around the world. The World Bank, Carnival Corporation & PLC, and the U.S. National Oceanic and Atmospheric Administration (NOAA), among other
Foreword
Lyda Hill, Chairman
LH Holdings, Inc. & Lyda Hill Foundation
Maria Damanaki, Managing Director for Oceans
The Nature Conservancy
early adopters, are providing pathways to integrate this knowledge into economic development funding, private-sector investment, and informed management to protect oceans globally.
We have taken the important first steps with the Mapping Ocean Wealth initiative and already have a new understanding of oceans, along with new insights, about where to focus our attention going forward. This Atlas of Ocean Wealth provides a glimpse at this new knowledge—and new ways of applying it—that will help secure oceans’ wealth and our collective future.
Foreword viivii


The Atlas of Ocean Wealth is the largest collection to date of information about the economic, social and cultural values of coastal and marine habitats from all over the world. It is a synthesis of innovative science, led by The Nature Conservancy (TNC), with many partners around the world. Through these efforts, we’ve gathered vast new datasets from both traditional and less likely sources.
The work includes more than 35 novel and critically important maps that show how nature’s value to people varies widely from place to place. They also illustrate nature’s potential. These maps show that we can accurately quantify the value of marine resources. Further, by enumerating such values, we can encourage their protection or enhancement for the benefit of people all around the world. In summary, it clearly articulates not just that we need nature, but how much we need it, and where.
What’s Inside?The Atlas of Ocean Wealth illuminates a great array of benefits: from fish production to tourism, water purification to coastal protection. It distills findings from a host of experts working around the world who have generated novel models and detailed maps of these benefits.
Ecosystem service values are not distributed uniformly throughout the world. Our work shows, over and over, that some places produce more “ocean wealth” from a particular service than others. Understanding and applying this fundamentally new kind of knowledge is critical for future management of ocean space.
Broadly, the Atlas is divided into two sections: Part 1 explores the benefits that natural ecosystems provide to people, sequentially exploring individual ecosystem services; Part 2 considers the approaches for applying such information in the world of marine resource and environmental management, economics and financing.
Part 1: A Host of Services
Making Fish
Many habitats generate fish or enhance fish populations that provide nutrition and economic benefits. We have learned much about how that production can vary across habitats, space and even across time. Our conceptual approach is, first, to understand the natural processes of fish generation (standing stock or production) and enhancement by particular habitats, and then to model and map the social and economic forces which generate fishing pressure and catch value.
Over 200 million people live close to mangroves. Our first global model shows that the countries generating the largest overall fish catches are Nigeria, Indonesia, Brazil and Mexico, but some of the most productive mangroves by area include the extensive mangroves in Central and West Africa, Central America, and even the few remaining mangroves of China and Viet Nam.
A new study by our team shows that a single hectare of seagrass in southern Australia will generate an additional 30,000 fish into a bay or estuary every year, with a commercial fishery enhancement value of some US$24,000. Our own work on saltmarshes is still in development, but existing studies suggest that a hectare of saltmarsh will generate 235 kilograms of shrimp and 170 kilograms of blue crab—both highly valuable fishery species—in the Gulf of Mexico each year.
Oyster habitats are among the most threatened habitats globally, and 85 percent have been lost, but we now know that a single hectare of oyster reef adds 3,200 adult blue crabs to the fishery each year in the Gulf of Mexico and, further, that across the 31 major bays and estuaries of the US for which we have data, remaining oyster habitat is still generating an additional 185,000 metric tons of fish annually.
Working at more local scales, we have supported completely unique exercises to map critical fish habitats, including both rocky reef and seaweeds in both the Gulf of California and the Gulf of Maine. In both cases, we are also generating data on fish communities from both field and fisheries data. In the Gulf of California, some 23,000 small-scale fishers
Executive Summary
Executive Summary 1

are catching 28,000 metric tons of fish worth US$19 million annually, but such catch is not sustainable. New maps produced by Mapping Ocean Wealth work will be invaluable in helping to better manage these fisheries. Further offshore, our work in the Lesser Sunda Islands, Indonesia is helping to show the linkage between sea temperature and local ocean productivity for important pelagic species such as tuna, and to show how this fish productivity is highly concentrated in certain places at particular times.
Coral reefs are celebrated for their abundance of fish and indeed people from the world’s coral reef nations eat 50 percent more seafood than the global average. Our global model reveals that the highest catches are in places where populations and markets are most concentrated, but also that high-value species are targeted even on the world’s most remote coral reefs. To look more closely, we supported a ground-breaking new study of reef fish in Micronesia: mapping fishing pressure and fish stocks using ecological survey data from over 1,100 locations and directly showed the considerable variation both in background productivity of reefs and in fishing pressure. Combining models, we can show areas of likely gains from reduced fishing—high value target species, such as grouper and snapper, will increase by 100-350 percent in heavily fished areas in the absence of fishing
Breaking Waves
The coastal zone is a place of high impact from natural hazards—insurers have paid out more than US$300 billion in damages from coastal storms in the past 10 years, but the role of coastal ecosystems in reducing impacts has been largely overlooked or ignored. They influence three key processes: 1) wave attenuation; 2) storm surge attenuation; and 3) maintaining shoreline elevation. Working with the World Bank, we have developed Expected Damage Function models to predict additional damage to people and infrastructure from the loss of natural habitat barriers.
Among Mangroves forests, just 100 meters of mangrove barrier can reduce wave heights by two-thirds.
Building oyster reefs adjacent to shore in the USA can reduce the cost of every meter of coastal protection by over US$750, compared to other engineering options. The Nature Conservancy has developed an online Risk Explorer tool enabling users to identify optimal places for oyster reef restoration along the US Gulf of Mexico in order to maximum risk reduction gains.
Coral reefs provide some level of shelter along over 150,000 kilometers of the world’s tropical coastlines, benefitting some 63 million people in over 100 countries. Using new high-resolution modeling of flood hazards, we can develop estimates of the benefits of reefs under different conditions. Thus, for Indonesia, Philippines, Malaysia and Mexico, the annual expected benefit of reefs exceeds US$450 million per year.
Cleaning Up
Many ecosystems can help reduce the volumes of both sediment and of pollution in estuarine and coastal waters. This is especially important in a world where the numbers and extent of dead zones are increasing and damaging both fishing and the tourism industry.
A single oyster can filter 180 liters of water a day, but while oysters once had the capacity to filter almost all water coming into bays and estuaries in the US, this capacity has collapsed on the Pacific coast and declined by more than 80 percent along the US East Coast and Gulf of Mexico coast.
Storing Carbon
Mangroves, saltmarshes and seagrass beds are among the most productive habitats on the planet. They not only store large amounts of carbon in their living biomass, they also sequester it long-term in the surrounding soil. The addition of dead plant matter to the soil represents long-term removal of carbon dioxide from the atmosphere.
Since 1990, coastal wetlands have sequestered 9.6 metric Gigatons of CO2e, equivalent to the emissions of France over the same period. Unfortunately, these habitats are being quickly lost resulting in 0.15–1.02 billion metric tons of CO2 released annually (equivalent to burning 112 billion gallons of gasoline).
Mangroves have over double the mean biomass of tropical forests, per unit area, in general. Indonesia is by far the largest mangrove carbon nation, with over 700 million metric tons of above-ground biomass, but even small countries, such as Palau, Brunei, Darussalam and the Solomon Islands, have very high biomass per unit area, averaging over 250 metric tons of biomass per hectare. Groups such as Blue Ventures are leading the charge to link mangrove conservation activities to international recognition of carbon credits.
Atlas of Ocean Wealth2
The Value of Visitors
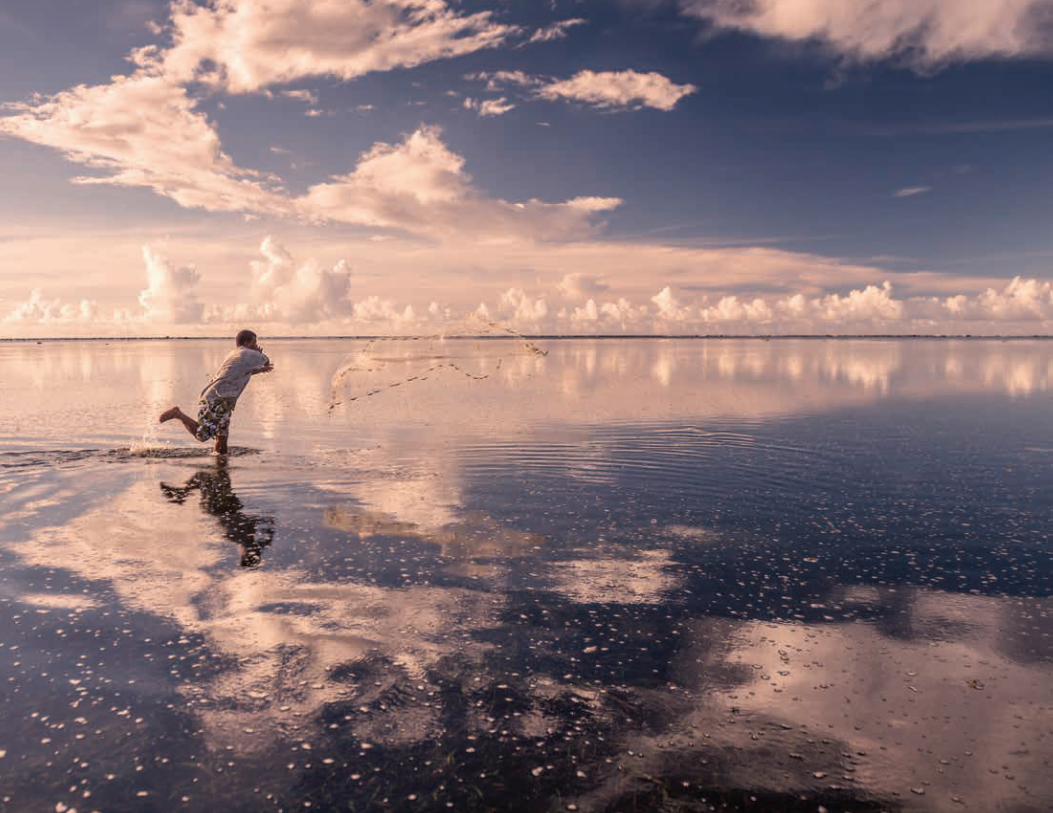
Travel and tourism are one of the world’s largest industries, and coastal tourism is one of the largest components of this industry. Much depends on nature, although this dependency—for clean water, superlative views, white sand beaches, seafood and more—is often overlooked. Nature-based tourism, including fishing, diving and wildlife watching, represents a particularly strong and fast-growing sector.
For coral reefs, we built up a unique, high-resolution view using a compilation of large datasets including locations of national spending, hotels, dive sites and photographs uploaded to the Internet. This shows that reef related tourism is widespread in 102 of the 117 countries and territories with coral reefs, with over 350 million people annually travelling to the coral reef coasts of the world. This value, estimated at US$37.8 billion each year, is only generated by about 30 percent of all the world’s coral reefs. The rest are currently too remote for visitors.
Mangroves are less well known as tourism destinations, but we developed a novel analytical technique, retrieving 150,000 reviews from TripAdvisor that mention mangroves. From these, we located over 2,000 attractions in 86 countries where visitors regularly enjoy mangroves for boat tours, boardwalks, kayaking, fishing and other activities.
Direct experience of wildlife watching for charismatic species, such as whales and turtles, are also increasingly high-value components of tourism. Some 600,000 people have been estimated to spend over US$300 million annually to watch sharks, securing some 10,000 jobs worldwide. Our regional studies in the Gulf of California quantified nearly 900,000 nature-based visits a year generating over half-a-billion US dollars. In Indonesia, aggregations of manta rays in just 11 sites are supporting nearly US$10 million in annual dive expenditures.
The Value of Just Being There
The more “intrinsic” or non-use values of nature include cultural, traditional, spiritual and well-being-related values which have proved difficult to quantify. Scientific value is another important component and considerable importance has been attached to mapping aspects of biodiversity. Informed by biodiversity information, expert-led processes have identified over 200 ecologically or biologically significant marine areas (EBSAs) under the Convention on Biological Diversity, while 47 marine and coastal World Heritage sites have been singled out for their “Outstanding Universal Value.”
Part 2: Bringing Natural Values to BearIn Part 2, we used a different set of lenses to assess how ocean wealth information could inform management decisions, investments and conservation outcomes.
Adding Up the Benefits
The coastal areas of the world are among the fastest growing and most densely populated, while a host of new economic opportunities are arising on and offshore. Many of the world’s nations are embracing the concept of a “Blue Economy,” where sustainability is at the heart of marine and coastal development, with ecosystem services protected or enhanced.
Assessments of individual ecosystem services are an important base for compatibility and trade-off analyses. However, only in accounting for the bundling of multiple services in any location can we truly place the full value of ecosystem services into a planning and management context. The benefits that people receive from ecosystems may accrue far from where they are produced, and mapping these service flows can identify distant stakeholders with an interest in a given location or habitat.
Managing, Protecting and Enhancing Services
Given the clamor of different interests, users and stakeholders to operate in the sea, nations are increasingly turning to ocean-use planning to develop rational and sustainable allocation of ocean space for various purposes, and nearly 30 percent of the world’s EEZs are predicted to have approved marine spatial plans by 2025. It will be critical to build reliably quantified and mapped ecosystem service values into this planning. To this end, decision-support tools are increasingly available to aid the utilization of marine ecosystem services information, including the online Atlas of Ocean Wealth at www.oceanwealth.org.
As an example, in Belize, ecosystem services were an integral part of zoning and management planning that used the Natural Capital Project’s InVEST ecosystem services models and input from stakeholders to evaluate alternative scenarios that included diverse services such as spiny lobster fisheries, tourism, recreation and coastal protection from storms and floods.
The conservation of ecosystem services has always had a central role in the marine protected areas agenda, but we have shown that the
Executive Summary 3
placement of the current global array of over 10,000 sites does not always overlap with the most important areas for ecosystem services generation.
With the new mapping efforts highlighted in this work, it may be possible to begin to identify Areas of Critical Importance for Ecosystem Services and to build these in to prioritization processes. Such knowledge might also help to inform efforts at the national level, including those being encouraged by regional initiatives such as the Micronesia Challenge, Caribbean Challenge and Coral Triangle Initiative.
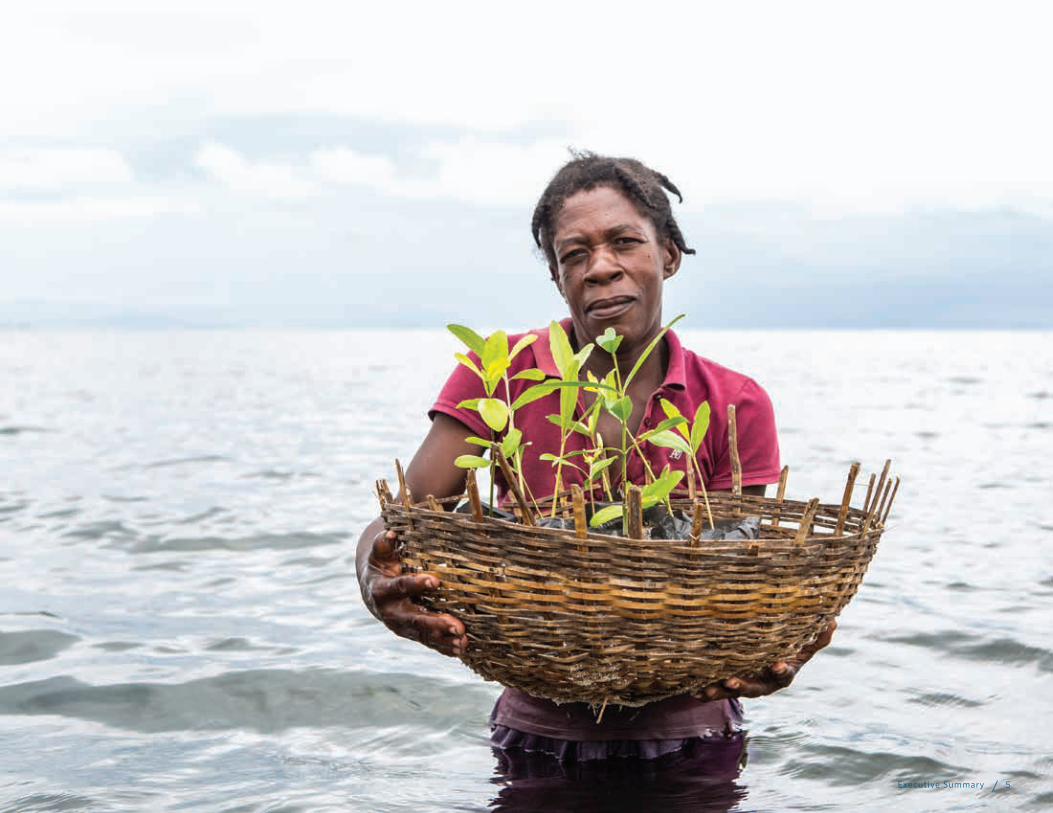
The possibility for large-scale restoration of coastal and marine habitats has grown rapidly in recent years. Ecosystem service valuation can provide considerable impetus for such efforts by enabling the accounting of returns on restoration investment. Such returns can be quite high: in Alabama, USA, oyster reefs are reducing coastal erosion while generating significant returns to local fisheries. In the state of West Bengal, India, mangrove restoration is providing both local benefits, in the form of shoreline projection and flood risk reduction, as well as global benefits, in the form of carbon storage. In the Florida Keys, USA, the business community is directly funding coral restoration, making the direct link between ecosystem quality and tourism value.
Paying What is Owed
Value can be expressed in many ways, including jobs, food security, health and, of course, monetary metrics. Many of our initial models focus on defining and mapping the ecological production function, which may be measured in metric tons of carbon stored, kilograms of fish caught, numbers of visitors received and so on. Ultimately, however, monetization of such values can be critical in ensuring their uptake and use in mainstream planning and policy. Thankfully, a host of techniques are available to support the development of such values.
The coastal defense role of nature is one area where there may be considerable opportunities and The Nature Conservancy is now engaged with the reinsurance sector to support the incorporation of natural coastal protection into insurance models. Globally, we spend 400-times more on coastal gray infrastructure than we do on coastal conservation, but if the protective role of reefs and mangrove belts could be worked into the insurance models there could be a change of perspective, with more widespread efforts to maintain or enhance ecosystems that can provide highly effective, low-cost coastal defense.
The quantification of ecosystem services provides an enormous opportunity for supporting innovative financing for conservation. If their potential market value is clearly demonstrated, many ecosystems can hold their own in a market setting when placed alongside alternatives that may lead to ecosystem degradation or destruction. Attractive financial returns identified by this type of valuation will likely have far greater influence on many business/investment actors than appeals to less-defined qualitative measures of importance.
Simple, market-based approaches are already widespread, including fisheries licensing to visitor fees for protected areas. The development of novel markets represents an opportunity that is somewhat nascent, but carbon markets may provide a significant opportunity for the protection and restoration of coastal wetlands. The development of blue bonds may present another opportunity. It might simply include the incorporation of marine and coastal projects into existing green bond portfolios—investment-ready projects where returns were clearly expected, enabling conservation or sustainable blue development to access novel funding sources.
Concluding Thoughts
The world’s oceans are at a crossroads. Economic investment and development pose considerable risks, but also great opportunities for sustaining the oceans, if the interests of society and nature are aligned.
The size and scope of the information gathered here is unprecedented and represents a major leap forward in understanding how and where ocean benefits are produced. The new knowledge represented in the Atlas of Ocean Wealth should drive a sea change in attitudes toward marine and coastal ecosystems, and needs to be used to create a similar drive for their protection and conservation for our own sakes. In an era of blue growth, and a rapid expansion of more holistic management of our oceans, we have an opportunity to place ecosystems and the benefits they provide for people at the core of planning management. There is no time to waste.
Atlas of Ocean Wealth4
Executive Summary 5

Nature’s Benefits
Ecosystem services are the benefits natural ecosystems provide to people. That broad definition covers a vast array—from the fish sold in a market or served in a family home, to the invisible influence of a seagrass meadow removing some of the world’s excess carbon dioxide, subtly shifting the chemical balance of both the water and the air above.
Documenting these benefits has never been more important, in large part because they are being lost at unprecedented rates. This comes as nature itself is being profoundly altered through direct conversion from economic development, pollution and ineffective management. The cost of losing natural benefits may be immense—for example, poorly-managed fisheries worldwide cost an estimated US$83 billion every year.
This Atlas of Ocean Wealth shows that it is possible to quantify these services spatially, enabling a much clearer picture of not only where these benefits are produced, but how much they vary from place to place. With such detailed information, it is then possible to know what could be lost in specific locations, depending on the decisions being made today and tomorrow. This kind of knowledge is new and, hopefully, can drive a sea change in perception about the ‘limitless’ ocean and enable a greater sense of shared ownership of Ocean Wealth.
Improved understanding of the processes underpinning ecosystem services can also reveal what services have already been lost, and indeed what could be gained in the future. Our groundbreaking work on the historic and present extent of oyster reefs has enabled us, for example, to show the extraordinary filtration power that has been lost due to the demise of oyster reef ecosystem in the bays and estuaries of the USA (p. 48). But similar approaches can also be used to drive, and to prioritize, investments in restoration, as described in Part 2 (p. 90).
The dependence of people on nature, and the need to protect nature to ensure continued benefits, are central tenets of international agreements and policy recommendations, such as the Sustainable Development Goals. They were also called out in the more detailed assessments such as the
IntroductionIn a rapidly urbanizing world, it is often easy for people to forget how dependent we are on nature. Outside our homes, schools and work places,
nature is constantly at work, creating the wealth of our planet, and our lives. It’s easy to overlook this, particularly when this wealth is in the ocean, where it can seem both remote and inexhaustible. It is neither.
Ecosystem services (tan boxes) are often defined as the benefits obtained by people from nature. They are derived from a series of “supporting services” (multi-colored circles), which are key elements of the complex patterns and interactions that lie at the heart of every ecosystem
Millennium Ecosystem Assessment and The Economics of Environment and Biodiversity (TEEB) reports.
The various benefits provided by nature are often classed into three broad groupings. Provisioning services are those that provide tangible, harvestable goods: in the oceans these include fish and shellfish for food, but also timber from mangroves, algae and health products. Regulating services are the benefits obtained from the role that ecosystems play in regulating our environment—these include coastal protection and the prevention of erosion, water purification and carbon storage, among others.
Ecosystem: Species,
Structures and Processes
Ecosystem Services
Water Quality EnhancementRemoval of pollutants or toxins,
improved water clarity
Other ProductsTimber, biofuels, fibre,
biogenic sand, aquarium fish,pearls, coral
Coastal ProtectionReduction of waves, flood
mitigation, elevation of landat coastal margins
Carbon Storageand Sequestration
Carbon held in living biomass, in soil and o�shore in water column
and deep sediments
Cultural and Spiritual Identities Existence of biodiversity,
seascapes, iconic species, vistas insupport of cultural or faith-based
beliefs and identities Tourism and Recreation
EnhancementDiving, whale-watching, fishing plus
beaches, vistas, clean calm water
Biochemicals/PharmaceuticalsComponents of medicinal/health products (fish oils), discoveries
of pharmaceuticals
Food ProductionFish, shellfish, algaeWater
Chemistry Modification
Wave Modification
SoilFormation
Habitat Construction
Primary Production
Evolution & Species Diversity
Secondary Production
6 Atlas of Ocean Wealth | Part One

Finally, cultural services are the many non-material benefits that are derived from nature, including recreation, spiritual, intellectual and cultural benefits.
Underpinning these different benefits are the ecosystems themselves—complex matrixes of plants and animals that both respond to and directly modify their surrounding physical and chemical environments through a complex and dynamic series of interactions. Many of these processes and interactions—such as primary production, nutrient cycling, oxygen production—are described as supporting services, which, in turn and by definition, enable other ecosystem services to arise. At the same time, it is important to realize that these processes continue unabated, even when there are no human beneficiaries to use them.
Ecosystem service values may be measured in many ways—the sustainable catch of fish in kilograms per year, the percentage a wave’s energy may be reduced, the metric tons of carbon sequestered in a saltmarsh. Such numbers depend on both the local ecology and on the social and economic settings in which the ecosystems exist. They vary enormously from place to place, but they are still calculable numbers, and from a growing host of field studies we are able to tell a bigger story. We can map ocean wealth.
The Mapping Ocean Wealth Approach
Scientists working within The Nature Conservancy have been engaged with the challenge of quantifying ecosystem service values for a number of years. Early work included a focus on understanding the ecological and economic benefits of oyster reef conservation and restoration in the USA, where significant investments have been made over the fifteen years in a partnership with the NOAA Restoration Center. More recently areas of focus include understanding the role of mangroves and coral reefs in breaking waves, reducing the energy that otherwise causes erosion, flooding and damage to structures along the shore.
REVIEW MODEL MAP
Through this work, and incorporating and building on the work of others in the field, we recognized a common three-stage approach for the larger-scale quantification and mapping of benefits.
1 – Review – to ensure we find ALL of the best possible information—field data and expert knowledge from around the world—to understand and describe a particular ecosystem service
2 – Model – use this information in the most effective way to develop a model that describes in quantitative terms what is known about the processes supporting ecosystem services
3 – Map – develop a map using the underlying drivers of a service, or the best possible proxies for them, to present a continuous image of the value of that service over geographic space
This approach brings forth an important observation that, while we can always improve our work with more data, there is often enough information out there to serve as the raw materials from which we can build models and maps.
The work gave birth to the Mapping Ocean Wealth approach. The vision was to move beyond individual studies of single ecosystems and services towards a multifaceted approach, building on these previous studies to map a range of services for a suite of ecosystems. Working across different scales and engaging expert partners from around the world refined and validated this approach. Thanks in particular to some visionary funders, we were able to build out a program of work that included global-scale studies and regional support to TNC and partners in Indonesia, the Caribbean, the USA, Micronesia, and Mexico (Gulf of California). Initially, a large part of this work has focused on building large-scale models for individual ecosystem-service and habitat pairings—mangrove-carbon, oyster reef-fish enhancement, coral reef-tourism, and so on. In most cases, this is work that has never been done before, so we have broken new ground—on multiple fronts simultaneously. In parallel, the engagement of regional teams and collaborators has meant that we have begun at least to understand how higher resolution information and more focused engagement may have a role to play in supporting management decisions on the ground. Although we are still at early stages, our work in the Gulf of California, Gulf of Maine, Indonesia and Micronesia are already proving to be of direct interest in the processes of ocean and coastal management.
Introduction 7

Reporting “Value”
There is often a default assumption that value implies a monetary metric, but this is not always the case. Monetary values are important, but they are not the sole—nor often the best—metric. Judged by dollar values, the major commercial fisheries would dominate many reviews. The world’s tuna fisheries alone are estimated to be worth over US$40 billion annually. By contrast, in terms of employment, small-scale fisheries are vastly more important. There are an estimated 39.4 million marine capture fishers in the world, of which 99 percent are small-scale and even these vast numbers fail to do justice to the critical nutritional, health and security functions provided by such small-scale fisheries, often in places where alternative livelihoods and food-sources are limited.
In this work we have sought to think about value in broader terms. If we can tell, for example, how many fish are caught from an oyster reef, then that can form a fundamental base for considering different values—jobs, social security, local income, tax revenues or foreign exchange earnings. We call these numbers the ecological production functions—those components of the ecosystem output that generate value as human benefits.
The Atlas of Ocean Wealth
This Atlas provides a broad review of marine and coastal ecosystem services, with a particular focus on the initial findings from the first phase of work on Mapping Ocean Wealth. In pausing at this juncture, we are able to compile and display spatial ocean ecosystem services maps around an array of ecosystems and geographies, and illuminate how these maps are created.
Part 1 summarizes current understanding of the value of marine and coastal ecosystem services. It progresses through six broad classes of ecosystem services: food production (1 - Making Fish), coastal protection (2 - Breaking Waves), water purification (3 - Cleaning Up), carbon storage and sequestration (4 - Storing Carbon), tourism and recreation (5 - the Value of Visitors), as well as a range of non-use values (6 - the Value of Just Being There). While we do not purport to provide a comprehensive coverage, we provide details in each of these sufficient to give a powerful impression of not only the ecosystem benefits, but also the approaches for quantifying and mapping them.
FamiliesFed
FishingJobs
MarketSale
ForeignExchange, Tax
Kilogramsof Protein
Inspiration,Science, Culture
TouristExpenditure
Jobs inTourism Sector
Numberof Visitors
The value of a coral reef can be told in a multitude of ways. A simplistic dollar value based upon a single use may threaten the lives and livelihoods of others who see or use the reef in a different way.
FisheriesEnhancement
CoastalProtection
Water QualityImprovement
Carbon Storageand Sequestration
Nature DependentRecreation
and Tourism
Mangrove
Coral Reef
Rocky Reef
Saltmarsh
Seagrass
ShellfishEcosystems
PelagicEcosystems
p.14 p.38 p.52, 54 p.60
X X p.58
p.18, p.24
p.28, 30 p.42, 44
X X X p.64
p.20 p.40
p.20 p.38 X
p.22 p.40 p.48 X X
p.26 X X p.62, 64
The Science Matrix
A matrix of some of the main ecosystems and the main services they provide. Page numbers refer to sections in Part 1 of this book and shading indicates that these have received some level of review under Mapping Ocean Wealth. X denotes services that are not provided to any significant degree by these ecosystems.
8 Atlas of Ocean Wealth | Part One

Working Together
The work to map ocean wealth could not possibly be undertaken by a single organization. Many others have already been working in this field for years and are already well advanced in particular aspects. The Mapping Ocean Wealth project has nevertheless enabled considerable new work, and the forging of new partnerships and collaborations. The pages of this Atlas are a testament to this—with contributors from universities, NGOs, governments, private sector companies and international agencies working in a network in countries around the world to build out the information and models enabling us to better describe the incredible wealth of the oceans.
Future work needs to communicate ecosystem services value to many audiences, including the many beneficiaries themselves all the way through to the planners and policy makers. This starts with the knowledge already compiled, but will also require greater efforts to explore other services, to build out other mechanisms for understanding values, monetizing values, and bringing values to bear in wider settings. More examples are needed of the application of ecosystem services into planning processes, and into the possibilities for financing the protection and enhancement of ecosystem services. As these develop, they can influence uptake in other places.
The Atlas is a thus waypoint, but more remains to be done. The work here is critically important in showing what can be done, and in illustrating the power of information, at different scales and in different settings, as a means to drive change and to secure a sustainable productive future for our oceans.
The many maps, and the underpinning models, demonstrate clearly that we already know enough to build ecosystem services into the wider discussions of society around resource use and investments in economic development. We bring this into sharper focus in Part 2, exploring how we can bring the maps to bear in a wider context, to influence how we perceive, use, and manage ecosystems and the benefits they produce. This requires us to move from the atomized view of individual services to the holistic vision of ecosystem service bundles overlapping and interacting. It requires us to think about how values themselves move across geographic space. It challenges us to think how to bring values into wider management of marine and coastal resources, including the use of ecosystem services as a driver for ecosystem restoration. And it considers how we develop economic valuation, not only as a metric of worth, but also as a means to inspire new funding for the protection and enhancement of ecosystem services from coasts and oceans.
Online Resources
Beyond this static Atlas, an online version of the Atlas of Ocean Wealth is available to enable deeper exploration of much of the data held in this Atlas. The online Atlas includes customized web apps which enable users to explore specific datasets around blue carbon, fisheries, natural coastal protection, recreation and tourism, and ecosystem restoration. It also links to social and economic data enabling users to look at aspects of human population, infrastructure and management alongside ecosystem services. These online datasets and apps are freely available to the open-source community, readily adopted by partners, and further customized to support ocean planning, nature-based adaptation or mitigation solutions.
The online Atlas and apps are also regularly enhanced and updated. As this happens, so the scope for using these as tools in planning will become more apparent, enabling users to overlay multiple services and to understand trade-offs inherent in decision-making. Learn more at http://oceanwealth.org/mapping.
The online Atlas of Ocean Wealth provides a robust data-viewing framework with a series of customized web apps designed to enable the visualization of coastal and marine ecosystem services. In some cases, it is possible to visualize multiple scenarios and develop tailored outputs.
Introduction 9

Part One
A Host of ServicesPart One
Part One 11
ake a journey in a submarine across the coastal seabed almost anywhere in the world. Dropped in at random, you will probably drift down to a featureless
plain—mud, gravel or sand extending into the distance in all directions. As you start your journey, your eyes are drawn quickly to any feature, a strand of algae, a few rocks, the occasional fish or sea urchin. Then, a dark shadow appears ahead. Out of the gloom, it suddenly comes into full visibility—a reef, a bank of seagrass, or an oyster bed. Suddenly, you are startled out of your reverie by an explosion of life. Fish dart and hover, crabs and lobsters nestle in the recesses, clams and oysters hold tight.
Fishers could have told us about such places, even centuries ago. For them, the same dark shadows on the seabed were the best places to lay lines or traps. Traditional societies across the Pacific Ocean had long learned that certain prominent features on the reef front were spawning grounds for fish. Many exploited them, but a smart few learned to temper that exploitation. By looking after such places, a rich supply of food could be secured, year-after-year, from generation to generation.
Modern fisheries managers have begun to recognize this same importance of key habitats—US fisheries policy calls for the management and protection of “essential fish habitat,” while many other countries are calling for “ecosystem-based” fishery management. Unfortunately, there remains a vital knowledge gap. We do not know where the most important places are, nor how they function.
The Mapping Ocean Wealth Approach
In order to understand the value of key habitats for fisheries, we needed to answer two broad questions:
How many fish are being generated in a place?
This is an ecological question. We already knew that certain habitats produce more fish than others. Our aim was to understand far, far more. Within any habitat there is huge variation in fish abundance from place to place. This might
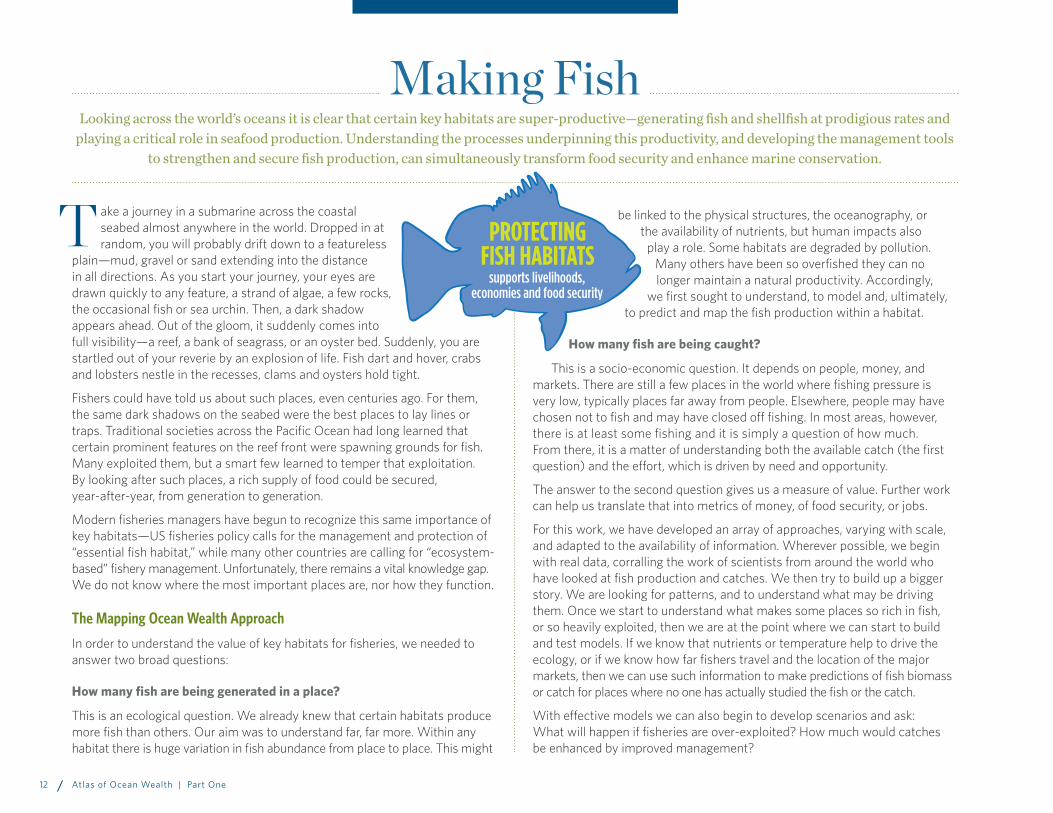
Making FishLooking across the world’s oceans it is clear that certain key habitats are super-productive—generating fish and shellfish at prodigious rates and
playing a critical role in seafood production. Understanding the processes underpinning this productivity, and developing the management tools to strengthen and secure fish production, can simultaneously transform food security and enhance marine conservation.
T be linked to the physical structures, the oceanography, or the availability of nutrients, but human impacts also
play a role. Some habitats are degraded by pollution. Many others have been so overfished they can no longer maintain a natural productivity. Accordingly,
we first sought to understand, to model and, ultimately, to predict and map the fish production within a habitat.
How many fish are being caught?
This is a socio-economic question. It depends on people, money, and markets. There are still a few places in the world where fishing pressure is very low, typically places far away from people. Elsewhere, people may have chosen not to fish and may have closed off fishing. In most areas, however, there is at least some fishing and it is simply a question of how much. From there, it is a matter of understanding both the available catch (the first question) and the effort, which is driven by need and opportunity.
The answer to the second question gives us a measure of value. Further work can help us translate that into metrics of money, of food security, or jobs.
For this work, we have developed an array of approaches, varying with scale, and adapted to the availability of information. Wherever possible, we begin with real data, corralling the work of scientists from around the world who have looked at fish production and catches. We then try to build up a bigger story. We are looking for patterns, and to understand what may be driving them. Once we start to understand what makes some places so rich in fish, or so heavily exploited, then we are at the point where we can start to build and test models. If we know that nutrients or temperature help to drive the ecology, or if we know how far fishers travel and the location of the major markets, then we can use such information to make predictions of fish biomass or catch for places where no one has actually studied the fish or the catch.
With effective models we can also begin to develop scenarios and ask: What will happen if fisheries are over-exploited? How much would catches be enhanced by improved management?
PROTECTINGFISH HABITATS
supports livelihoods,economies and food security
Atlas of Ocean Wealth | Part One12
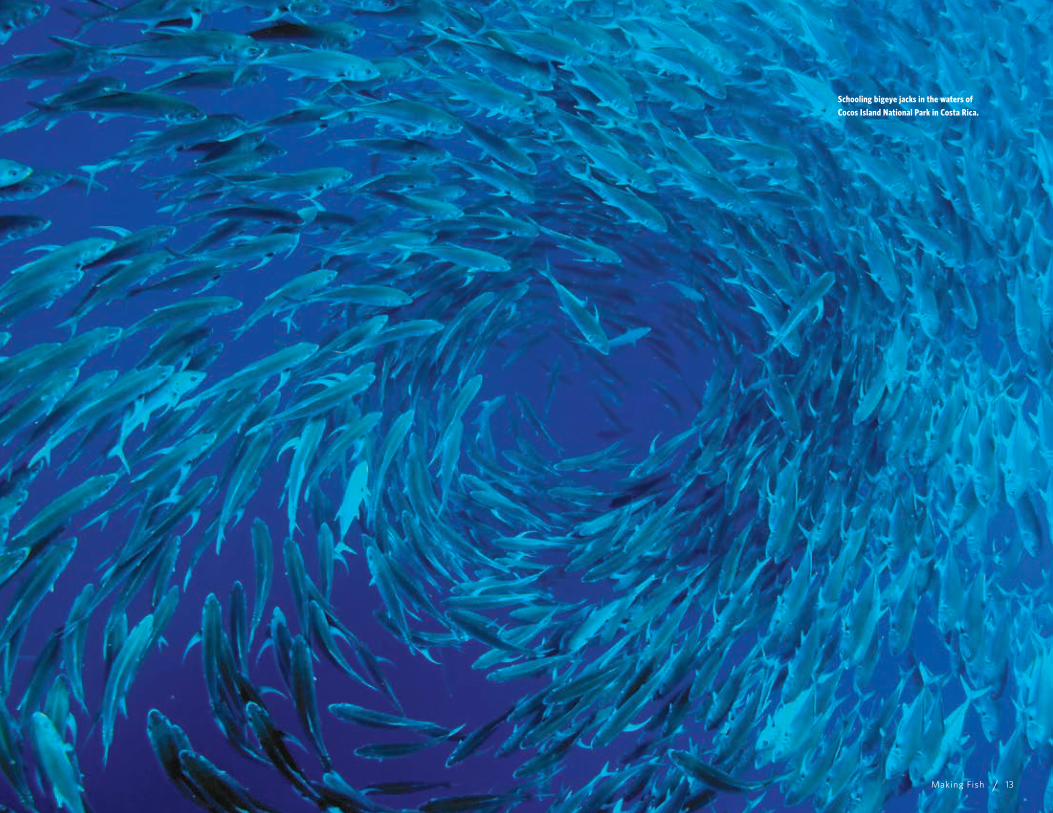
Schooling bigeye jacks in the waters of Cocos Island National Park in Costa Rica.
Making Fish 13
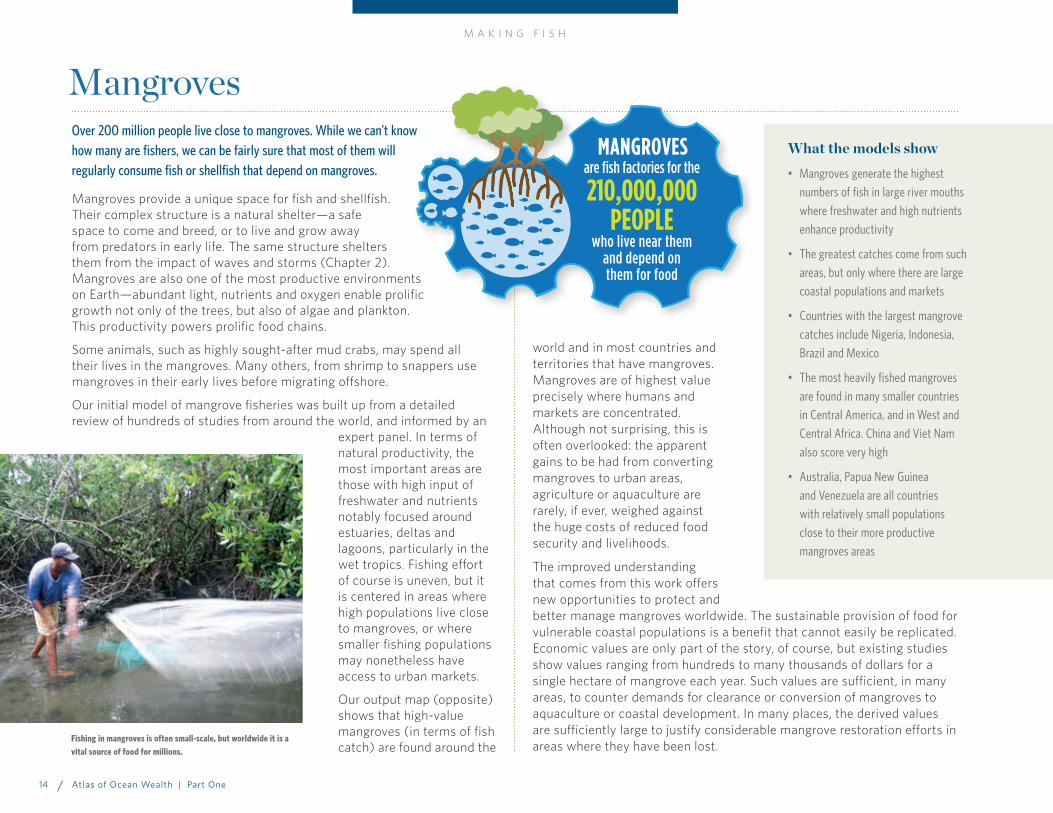
What the models show• Mangroves generate the highest
numbers of fish in large river mouths where freshwater and high nutrients enhance productivity
• The greatest catches come from such areas, but only where there are large coastal populations and markets
• Countries with the largest mangrove catches include Nigeria, Indonesia, Brazil and Mexico
• The most heavily fished mangroves are found in many smaller countries in Central America, and in West and Central Africa. China and Viet Nam also score very high
• Australia, Papua New Guinea and Venezuela are all countries with relatively small populations close to their more productive mangroves areas
Over 200 million people live close to mangroves. While we can’t know how many are fishers, we can be fairly sure that most of them will regularly consume fish or shellfish that depend on mangroves.
Mangroves provide a unique space for fish and shellfish. Their complex structure is a natural shelter—a safe space to come and breed, or to live and grow away from predators in early life. The same structure shelters them from the impact of waves and storms (Chapter 2). Mangroves are also one of the most productive environments on Earth—abundant light, nutrients and oxygen enable prolific growth not only of the trees, but also of algae and plankton. This productivity powers prolific food chains.
Some animals, such as highly sought-after mud crabs, may spend all their lives in the mangroves. Many others, from shrimp to snappers use mangroves in their early lives before migrating offshore.
Our initial model of mangrove fisheries was built up from a detailed review of hundreds of studies from around the world, and informed by an
expert panel. In terms of natural productivity, the most important areas are those with high input of freshwater and nutrients notably focused around estuaries, deltas and lagoons, particularly in the wet tropics. Fishing effort of course is uneven, but it is centered in areas where high populations live close to mangroves, or where smaller fishing populations may nonetheless have access to urban markets.
Our output map (opposite) shows that high-value mangroves (in terms of fish catch) are found around the
Fishing in mangroves is often small-scale, but worldwide it is a vital source of food for millions.
world and in most countries and territories that have mangroves. Mangroves are of highest value precisely where humans and markets are concentrated. Although not surprising, this is often overlooked: the apparent gains to be had from converting mangroves to urban areas, agriculture or aquaculture are rarely, if ever, weighed against the huge costs of reduced food security and livelihoods.
The improved understanding that comes from this work offers new opportunities to protect and better manage mangroves worldwide. The sustainable provision of food for vulnerable coastal populations is a benefit that cannot easily be replicated. Economic values are only part of the story, of course, but existing studies show values ranging from hundreds to many thousands of dollars for a single hectare of mangrove each year. Such values are sufficient, in many areas, to counter demands for clearance or conversion of mangroves to aquaculture or coastal development. In many places, the derived values are sufficiently large to justify considerable mangrove restoration efforts in areas where they have been lost.
210,000,000PEOPLE
are fish factories for the
who live near themand depend onthem for food
MANGROVES
MangrovesM A K I N G F I S H
Atlas of Ocean Wealth | Part One14

The modeled fish catch from the world’s mangrove forests. High catches are widespread wherever there are significant coastal populations, and enhanced near larger markets, but are also influenced by the productivity of mangroves in different places.
Modeled Fish Catch from the World’s Mangrove Forests
1 2 3 4 5 6 7 8 9 10
MODELED FISH BIOMASS
HIGHESTLOWESTLOWEST HIGHEST
RELATIVE FISHERY VALUE
Making Fish 15

Mangroves provide both food and shelter in abundance, making them a vital habitat for fish and invertebrates.
Many mangrove fishers are artisanal—fishing small volumes to feed their families and earn small amounts of cash at markets. They use traps, lines and cast-nets to gather a mixed haul of fish, shrimps and crabs. Such fisheries can generate 100 to 1,000 kilograms of fish per hectare every year. Other fishers target key and high-value species, notably crabs, cockles, oysters and shrimp. These generate lower volumes but high values, particularly if they are close to important markets. Some fishing grounds, from Fiji to Hong Kong, generate over US$2,000 per hectare year on year, and one mixed crab and mollusc fishery in Brazil has been estimated to generate almost US$10,000 per hectare per year.
Many of these fishers are fully aware of their reliance on mangroves, however, they do not always have the political influence to halt the destruction or conversion of mangroves to other uses, such as aquaculture, which can generate high incomes in the short term, but at the cost of multiple incomes, food security and jobs in the artisanal fishing sector.
Larger commercial fisheries operating in offshore waters often overlook the mangroves on which they depend. Key among these is the offshore shrimp industry. Vast quantities of shrimp are trawled from the seabed in areas from Northern Australia and Malaysia to French Guyana. All depend heavily on the supply of adult shrimp that began their lives as larvae amongst the tangled roots of coastal mangroves.
M A K I N G F I S H
Atlas of Ocean Wealth | Part One16
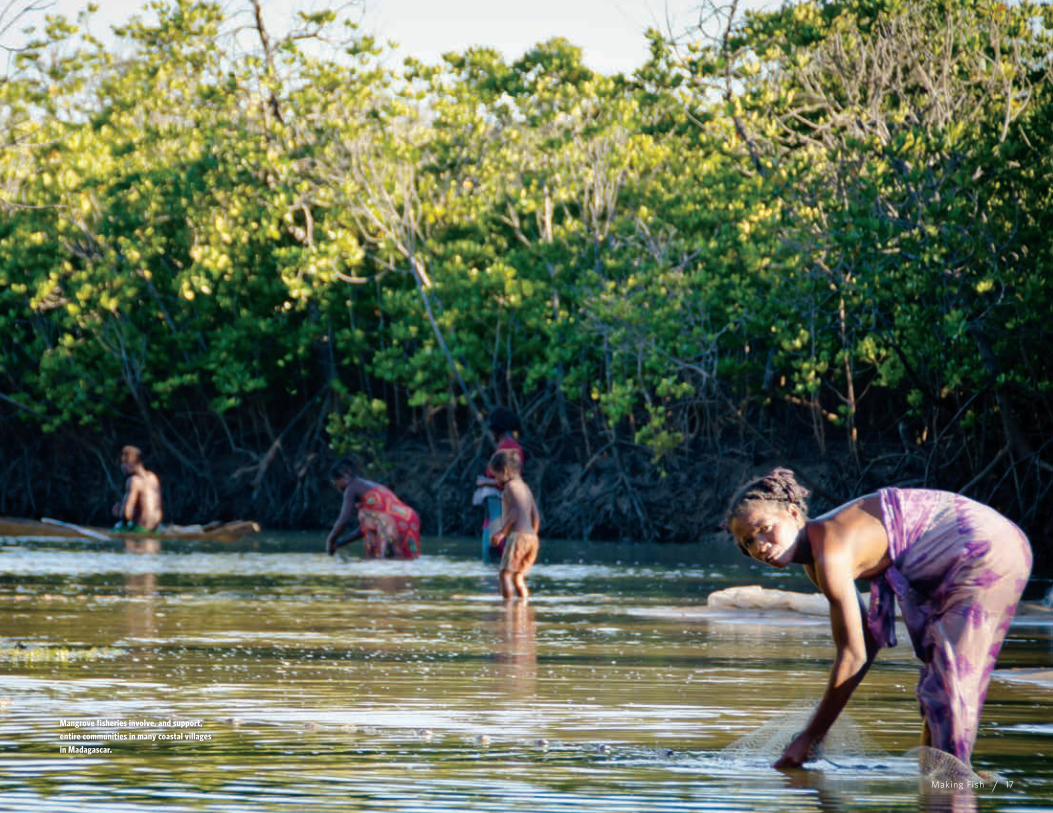
Mangrove fisheries involve, and support, entire communities in many coastal villages in Madagascar.
Making Fish 17
What the models show• There is relatively little overlap
between mangroves and rocky reefs, while sargassum is often linked to rocky reefs, particularly in the north
• Underwater, the areas of highest fish biomass are consistently in the southern half of the Gulf
• The highest economic values for fish (partly related to biomass, but also determined by species), are clustered around the Midriff Islands in the north-central Gulf, around the southeast peninsula, and around Puerto Vallarta
• Initial estimates suggest that the artisanal fishing fleet is unsustainable, reducing the net value of fish biomass by two percent each year
• At this rate, the economic worth of the Gulf’s fish biomass may well be comparatively exhausted and negligible within 40 years
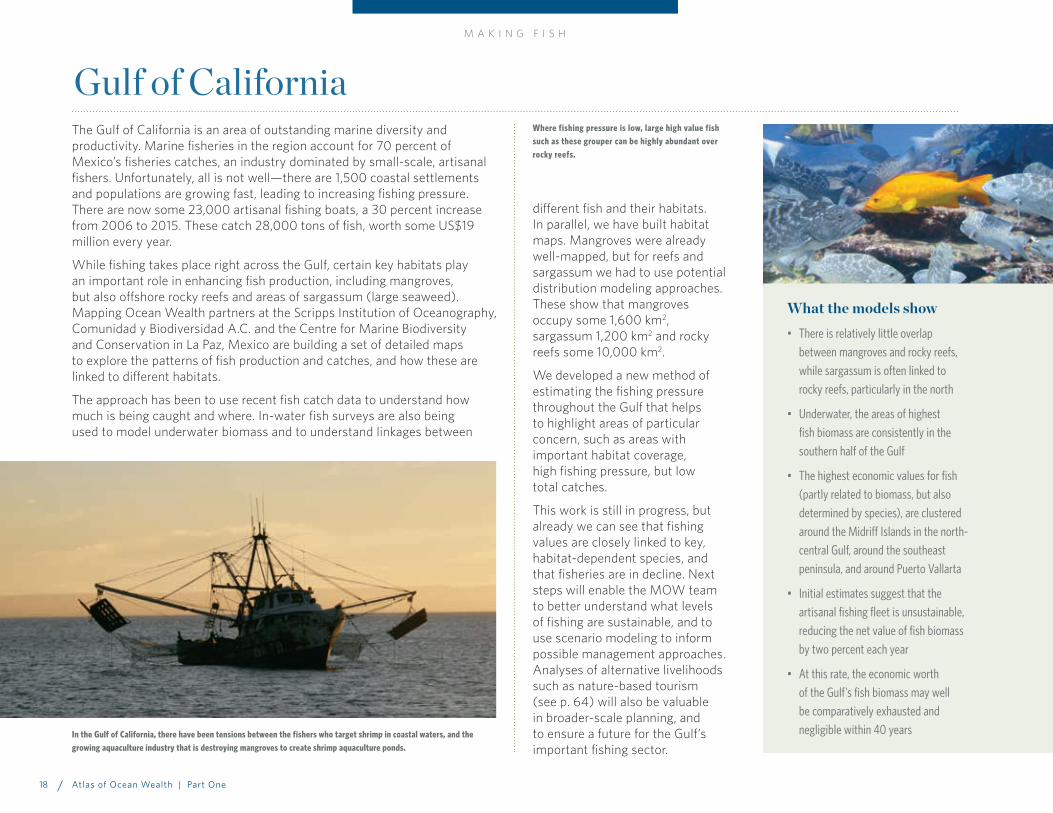
The Gulf of California is an area of outstanding marine diversity and productivity. Marine fisheries in the region account for 70 percent of Mexico’s fisheries catches, an industry dominated by small-scale, artisanal fishers. Unfortunately, all is not well—there are 1,500 coastal settlements and populations are growing fast, leading to increasing fishing pressure. There are now some 23,000 artisanal fishing boats, a 30 percent increase from 2006 to 2015. These catch 28,000 tons of fish, worth some US$19 million every year.
While fishing takes place right across the Gulf, certain key habitats play an important role in enhancing fish production, including mangroves, but also offshore rocky reefs and areas of sargassum (large seaweed). Mapping Ocean Wealth partners at the Scripps Institution of Oceanography, Comunidad y Biodiversidad A.C. and the Centre for Marine Biodiversity and Conservation in La Paz, Mexico are building a set of detailed maps to explore the patterns of fish production and catches, and how these are linked to different habitats.
The approach has been to use recent fish catch data to understand how much is being caught and where. In-water fish surveys are also being used to model underwater biomass and to understand linkages between
Where fishing pressure is low, large high value fish such as these grouper can be highly abundant over rocky reefs.
In the Gulf of California, there have been tensions between the fishers who target shrimp in coastal waters, and the growing aquaculture industry that is destroying mangroves to create shrimp aquaculture ponds.
different fish and their habitats. In parallel, we have built habitat maps. Mangroves were already well-mapped, but for reefs and sargassum we had to use potential distribution modeling approaches. These show that mangroves occupy some 1,600 km2, sargassum 1,200 km2 and rocky reefs some 10,000 km2.
We developed a new method of estimating the fishing pressure throughout the Gulf that helps to highlight areas of particular concern, such as areas with important habitat coverage, high fishing pressure, but low total catches.
This work is still in progress, but already we can see that fishing values are closely linked to key, habitat-dependent species, and that fisheries are in decline. Next steps will enable the MOW team to better understand what levels of fishing are sustainable, and to use scenario modeling to inform possible management approaches. Analyses of alternative livelihoods such as nature-based tourism (see p. 64) will also be valuable in broader-scale planning, and to ensure a future for the Gulf’s important fishing sector.
Gulf of California M A K I N G F I S H
Atlas of Ocean Wealth | Part One18

Maps 1 and 2 – Abundance of Rocky Reefs (1) and Sargassum (2) estimated from predictive modeling methods. Map 3 – Mangroves based on actual distribution in 2010. Map 4 – Potential Fishing Effort (PFE), a prediction of fishing pressure. Map 5 – Average fish biomass underwater (tons per hectare) between 1999 and 2010, estimated from long-term monitoring programs. Map 6 – Average dollar value of fish biomass estimated using average market price per fish species.
0.15-0.5 0.5-0.75 0.75-1 1-2 >2
$25-500 $500-1,000$1,000-2,500$2,500-7,500>$7,5000
(NB this is total per pixel, not per hectare)
Estimated dollar value of fishbiomass (US$1000)
Map 5Biomass(Tonnes / Ha)
Map 4Potential FishingEffort
0 - 12 - 45 - 1112 - 2425 - 77
25 - 5556 - 7778 - 161162 - 424425 - 1912
01 - 910 - 2425 - 104105 - 935
Map 1Rocky Reefs (Ha)
Map 2Sargassum (Ha) Map 3
MangrovePresence
GULF OF CALIFORNIA: HABITATS, FISHING EFFORT, DOLLAR VALUE
Important Habitats and Fisheries in the Gulf of California
Making Fish 19

Seagrasses
Gently undulating green meadows of grass-like plants carpet vast areas of calm shallow seabeds in both tropical and temperate regions. Just like grasslands on terra firma, these seagrass beds capture the sun’s energy, generating food and oxygen, and providing a critical home for fish and other creatures. Lacking the drama of vertiginous reefs, they are often overlooked and many have been lost to pollution, torn up by trawlers scraping the seabed for flatfish and shrimp, or scoured by anchors and the propellers of pleasure boaters.
We still have much to learn about seagrasses. Indeed, the best global map of seagrasses is simply a patchwork of local studies, full of gaps where no one has really looked. Scientists still disagree on matters such as scale. There may be as little as 170,000 km2 of seagrass in the world, or as much as 600,000 km2. To understand global values, we need first to focus and understand exactly what seagrasses may be delivering locally.
A juvenile snapper hides among the fronds of a shallow seagrass bed in the Bahamas.
Set against this data paucity, we located 11 studies from the coastal waters of temperate Australia. All of these
had looked at the differences in abundance of fish over seagrass beds compared to unvegetated adjacent waters. Focusing on just 12 commercially important species, the results are astonishing. Each year, a single hectare of seagrass generates
some 30,000 additional fish to the community, equivalent to 1 kilogram of fish for every square meter. Using simple market values, such a seagrass bed just one hectare in size would
generate a commercial fishery enhancement worth some US$24,000 annually.
Saltmarsh
Large areas of the world’s temperate shores are fringed by marshes. Too cold for mangroves, these are dominated by shrubs, herbs or grasses, growing over deep mud, cut through by myriad winding channels. Although exposed to the air for much of the day, they are occasionally covered by tides. Countless fish and shellfish benefit from their shelter and their rich productivity.
The MOW team is beginning to study the relevance of saltmarshes to fish production, but thus far the best knowledge comes from the work of others. One example comes from a team working in Galveston Bay looking at the abundance of three crustacean species. The brown shrimp and the white shrimp are among the most important commercial shrimp species in the USA. They are harvested from vast trawling grounds around the Gulf of Mexico and off of the east coast of the USA, with a total harvest of over 100,000 metric tons each year. A third species is the blue crab, whose commercial harvest around the shores of the Atlantic coasts of the Americas is of tremendous importance, but which also supports a large recreational fishery. Adults of all three species tend to spawn in waters near the coast, and young larvae float in the plankton before settling on the seabed right up in the coast and in estuaries.
Studies have shown that these three crustaceans all benefit immensely from the presence of saltmarsh—each hectare of marsh in Galveston Bay is estimated to be generating an extra 235 kilograms of shrimp and 170 kilograms of blue crab compared to the shallow waters nearby.
One hectare of
producesSEAGRASS
$24,000 more per year in commercially-important fish than bare seafloor
Seagrass and SaltmarshM A K I N G F I S H
Atlas of Ocean Wealth | Part One20
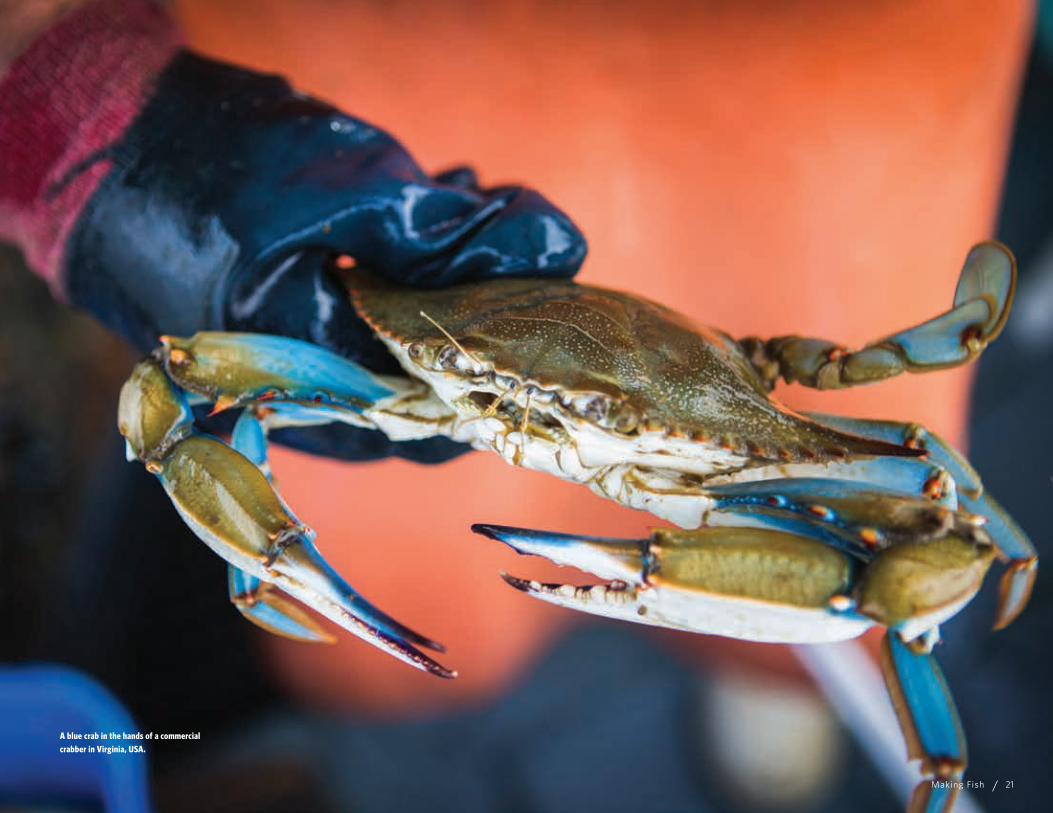
A blue crab in the hands of a commercial crabber in Virginia, USA.
Making Fish 21

What the models show• The most significant contribution that
oyster reefs play is enhancing the reproductive success and early survival of many fish, what we call “recruitment enhancement”
• Among the most commercially important species are gag grouper and sheepshead on the East Coast, and stone crab, blue crab and sheepshead in the Gulf of Mexico
• Commercially and recreationally important species such as black drum, red drum and striped bass also benefit from oyster reefs as adults
• Just one hectare of oyster reef in the Gulf of Mexico would add 3,200 adult blue crabs to the population every year
• Across the 31 major bays and estuaries of our studies, the remaining oyster reefs are generating an additional 185,000 metric tons of fish annually
Oysters have the capacity to form large banks and reefs which play a critical role as a habitat. Scientists from The Nature Conservancy have shown that such habitats were once widespread worldwide, but that at least 85 percent have been lost, making them one of the most threatened habitats on earth.
Early European settlers found the Chesapeake Bay, on the eastern coast of the USA, to be a critical safe haven after crossing the Atlantic, but their early descriptions are of a remarkably different place from the Bay today. America’s largest estuarine embayment was then crystal clear and heaving with fish—striped bass and sheepshead, shad and sturgeon. As the early navigators also reported, however, it was a navigational challenge, with huge banks of oysters rising meters above the seabed and capable of grounding a boat and gouging its hull. In between, vast swathes of seagrass smothered the seabed, wafting with the currents and shifting tides.
The Chesapeake now runs muddy with only a few shadows hinting at the presence of the last oyster reefs. The fisheries are managed better than they have been for several decades, but we are managing a degraded system.
Some of those last meager reefs around the US have a critical message for us. Fishers still linger around their margins, and a few scientists have joined them. The fishers catch, and the scientists count. Both have noted how many more fish there are around the reefs than in the areas where the reefs are all gone. Piecing together this work we have been able to tell a remarkable story.
Our work compared the numbers of fish and crustaceans in or directly adjacent to oyster reefs to those away from reefs. This approach enables us to quantify the “enhancement” role that the reefs play. The same species still survive without the oysters, but where there are healthy reefs
they thrive and there are many many more of them. Often, the throngs of fish around oyster reefs are larvae, or sub-adults. Many species find refuge here in their early life. Thus even fish caught far from oysters may still depend on the complex sheltering structure of the oysters. With our models we sought to quantify this life-long enhancement benefit from oyster reefs. Uniquely, we also sought to build a model that would capture the variability in this enhancement, and enable us to build the same uncertainty into our estimates.
We found that nineteen species were enhanced by oyster reefs in the Gulf of Mexico, while twelve species were enhanced on the Eastern Seaboard. One hectare of oyster reef in an estuary in the Gulf of Mexico will generate millions of extra larvae to the ecosystem. Only a fraction will reach adulthood, but a fraction of a very large number is still a large number. From the perspective of fishers it looks like this: one hectare of healthy oyster reef in a place like Matagorda Bay will generate an extra 3,200 crabs of fishable age. All this from just one patch of oysters 100 meters square.
Scaling up to the bays and estuaries on the Gulf of Mexico and the Eastern Seaboard of the US, we have a good picture of the total oyster reef extent in 31 of the major bays, and from these alone we find that oyster reefs are generating in the order of 185,000 (plus or minus 45,000) metric tons of fish to the ecosystem, year on year. These are additional to populations that would occur in the absence of such reefs.
Oyster Habitats
A crabbing boat heads out into the waters of Virginia USA. Crab stocks are greatly enhanced by oyster reefs which provide shelter and food, especially for younger crabs.
M A K I N G F I S H
Atlas of Ocean Wealth | Part One22
23
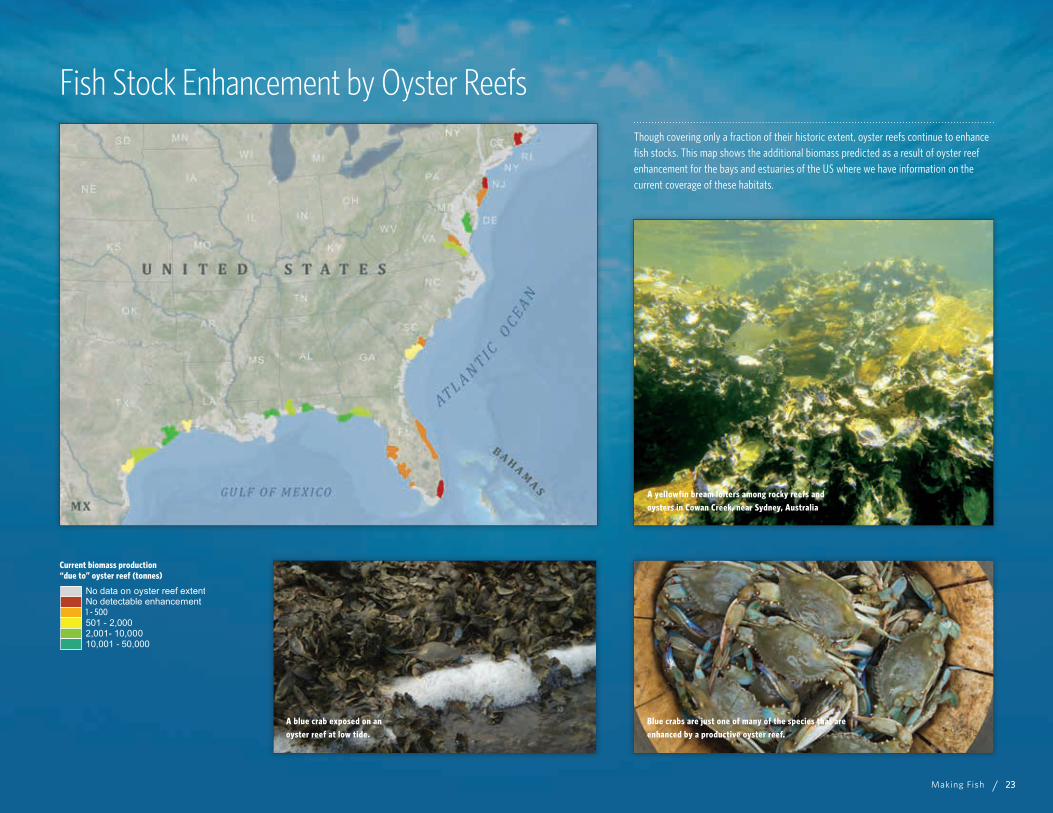
Though covering only a fraction of their historic extent, oyster reefs continue to enhance fish stocks. This map shows the additional biomass predicted as a result of oyster reef enhancement for the bays and estuaries of the US where we have information on the current coverage of these habitats.
Fish Stock Enhancement by Oyster Reefs
No data on oyster reef extentNo detectable enhancement1 - 500501 - 2,0002,001- 10,00010,001 - 50,000
Current biomass production “due to” oyster reef (tonnes)
A yellowfin bream loiters among rocky reefs and oysters in Cowan Creek, near Sydney, Australia
Blue crabs are just one of many of the species that are enhanced by a productive oyster reef.
A blue crab exposed on an oyster reef at low tide.
Making Fish 23
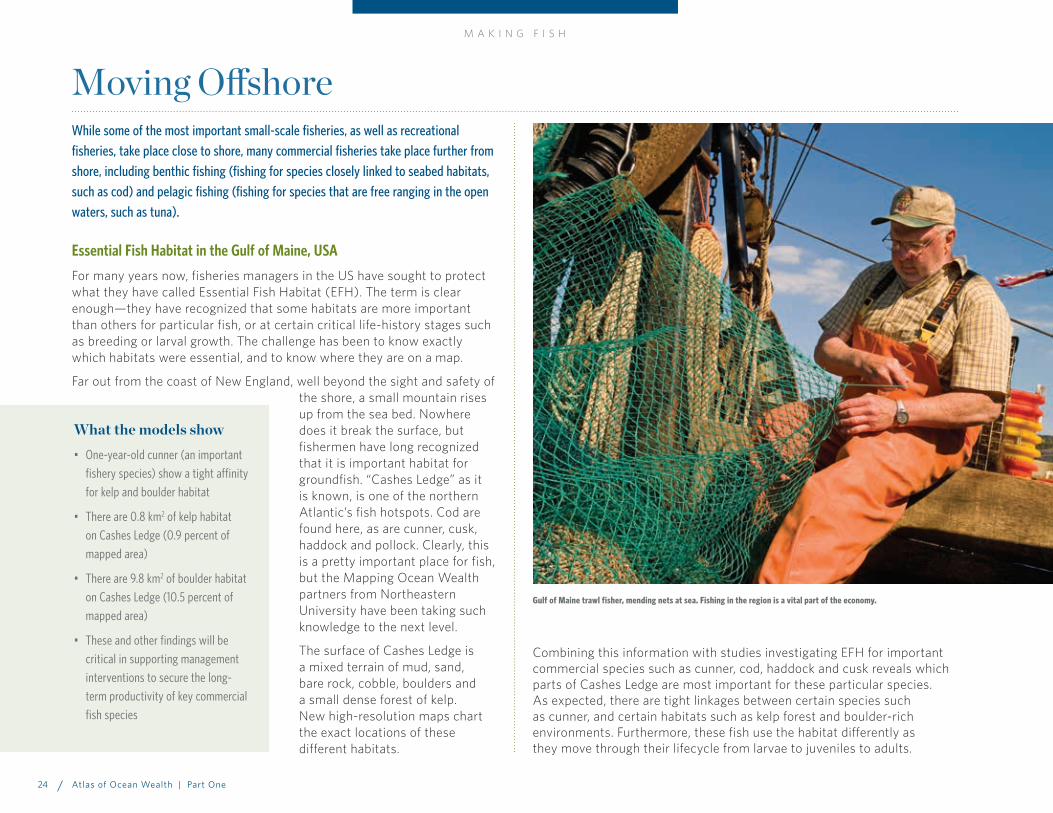
While some of the most important small-scale fisheries, as well as recreational fisheries, take place close to shore, many commercial fisheries take place further from shore, including benthic fishing (fishing for species closely linked to seabed habitats, such as cod) and pelagic fishing (fishing for species that are free ranging in the open waters, such as tuna).
Essential Fish Habitat in the Gulf of Maine, USA
For many years now, fisheries managers in the US have sought to protect what they have called Essential Fish Habitat (EFH). The term is clear enough—they have recognized that some habitats are more important than others for particular fish, or at certain critical life-history stages such as breeding or larval growth. The challenge has been to know exactly which habitats were essential, and to know where they are on a map.
Far out from the coast of New England, well beyond the sight and safety of the shore, a small mountain rises up from the sea bed. Nowhere does it break the surface, but fishermen have long recognized that it is important habitat for groundfish. “Cashes Ledge” as it is known, is one of the northern Atlantic’s fish hotspots. Cod are found here, as are cunner, cusk, haddock and pollock. Clearly, this is a pretty important place for fish, but the Mapping Ocean Wealth partners from Northeastern University have been taking such knowledge to the next level.
The surface of Cashes Ledge is a mixed terrain of mud, sand, bare rock, cobble, boulders and a small dense forest of kelp. New high-resolution maps chart the exact locations of these different habitats.
Combining this information with studies investigating EFH for important commercial species such as cunner, cod, haddock and cusk reveals which parts of Cashes Ledge are most important for these particular species. As expected, there are tight linkages between certain species such as cunner, and certain habitats such as kelp forest and boulder-rich environments. Furthermore, these fish use the habitat differently as they move through their lifecycle from larvae to juveniles to adults.
Gulf of Maine trawl fisher, mending nets at sea. Fishing in the region is a vital part of the economy.
Moving Offshore
What the models show• One-year-old cunner (an important
fishery species) show a tight affinity for kelp and boulder habitat
• There are 0.8 km2 of kelp habitat on Cashes Ledge (0.9 percent of mapped area)
• There are 9.8 km2 of boulder habitat on Cashes Ledge (10.5 percent of mapped area)
• These and other findings will be critical in supporting management interventions to secure the long-term productivity of key commercial fish species
M A K I N G F I S H
Atlas of Ocean Wealth | Part One24

25
Far left: High-resolution surveys produce a detailed map of the different habitats making up the shallow waters of Cashes Ledge.
Left: Mapping Ocean Wealth work has identified elements of this habitat of critical importance for key species at different stages of their lives, as shown here for one-year-old cunner (right).
Essential Fish Habitat on Cashes Ledge, Gulf of Maine
KelpRockBoulderGravel/shellSand/mud
Cashes EFH Maps DescriptionsKelpBoulderGravel/shell, Sand/mud, Rock
Cashes EFH Maps DescriptionsKelpRockBoulderGravel/shellSand/mud
Cashes EFH Maps DescriptionsKelpBoulderGravel/shell, Sand/mud, Rock
Cashes EFH Maps Descriptions
Making Fish 25

Up until now, Cashes Ledge was just a place with a lot of fish, but the Mapping Ocean Wealth work has enabled us to discern which parts of that place are the critical fish habitats, and, more importantly, why. Our next efforts will be to use the knowledge gained here to build a model for essential fish habitat for cod over the entire Gulf of Maine. The end-game is simple: by determining the areas that enhance productivity, we can focus conservation efforts around producing more fish—enhancing values to people while increasing ecological stability.
Pelagic Fish Production in the Lesser Sunda Islands, Indonesia
While much of the Mapping Ocean Wealth work has focused on structured habitats found near coasts, the importance of the waters of the open ocean in fisheries is also critical. These “pelagic” habitats are a place
of continuous change as water moves freely from place to place. They lack clear boundaries, but they are far from uniform. Strong patterns in productivity indicate the importance of particular places and phenomenon in much the same way as more structured habitat. We began exploring such patterns in the Lesser Sunda Ecoregion. This region encompasses the southern margin of the Indonesian Through-Flow—the only deep-water connection between the Pacific and Indian Oceans. In this region, patterns of water flow reverse seasonally, but more importantly the water movements also drive a powerful upwelling, particularly in the Southeast Monsoon (April to November).
The Mapping Ocean Wealth Team in Indonesia, working with partners in the Center for Coastal
and Marine Resources Studies (CCMRS) and with Bogor Agricultural University (IPB), developed a model of pelagic productivity using data on temperature and sea-surface productivity. This model clearly shows the tremendously important role of monsoon upwelling in driving pelagic productivity in the Southeast Monsoon. Such knowledge will be of considerable value in developing management tools for the highly important tuna fisheries, which take place both in these waters and in adjacent international waters of the eastern Indian Ocean.
Pelagic tuna, remain important as a source of food for local coastal communities, but they also support a very high value global trade.
Juvenile skipjack tuna. While these are still relatively abundant in many areas, the capture of juvenile fish before they have had a chance to breed is leading to declines in many areas.
M A K I N G F I S H
Moving Offshore
Atlas of Ocean Wealth | Part One26

27
Using data describing sea-surface productivity and temperature, together with information about pelagic fish species, we can model the fish biomass for different seasons and highlight the enormous importance of certain areas and at different times for pelagic fish production.
JANUARY
JULY
Modeled Fish Biomass in the Lesser Sunda Islands
1 2 3 4 5 6 7 8 9 10
MODELED FISH BIOMASS
HIGHESTLOWESTLOWEST HIGHEST
MODELED FISH BIOMASS
Making Fish 27
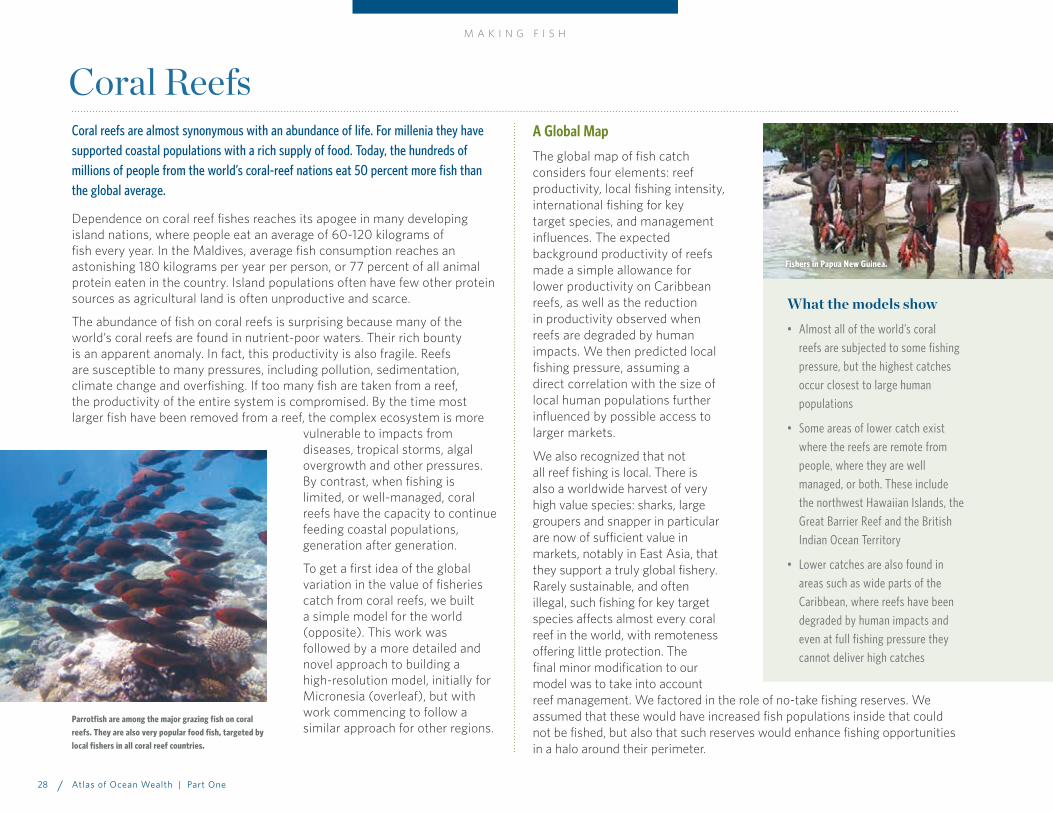
Coral reefs are almost synonymous with an abundance of life. For millenia they have supported coastal populations with a rich supply of food. Today, the hundreds of millions of people from the world’s coral-reef nations eat 50 percent more fish than the global average.
Dependence on coral reef fishes reaches its apogee in many developing island nations, where people eat an average of 60-120 kilograms of fish every year. In the Maldives, average fish consumption reaches an astonishing 180 kilograms per year per person, or 77 percent of all animal protein eaten in the country. Island populations often have few other protein sources as agricultural land is often unproductive and scarce.
The abundance of fish on coral reefs is surprising because many of the world’s coral reefs are found in nutrient-poor waters. Their rich bounty is an apparent anomaly. In fact, this productivity is also fragile. Reefs are susceptible to many pressures, including pollution, sedimentation, climate change and overfishing. If too many fish are taken from a reef, the productivity of the entire system is compromised. By the time most larger fish have been removed from a reef, the complex ecosystem is more
vulnerable to impacts from diseases, tropical storms, algal overgrowth and other pressures. By contrast, when fishing is limited, or well-managed, coral reefs have the capacity to continue feeding coastal populations, generation after generation.
To get a first idea of the global variation in the value of fisheries catch from coral reefs, we built a simple model for the world (opposite). This work was followed by a more detailed and novel approach to building a high-resolution model, initially for Micronesia (overleaf), but with work commencing to follow a similar approach for other regions.
Parrotfish are among the major grazing fish on coral reefs. They are also very popular food fish, targeted by local fishers in all coral reef countries.
A Global Map
The global map of fish catch considers four elements: reef productivity, local fishing intensity, international fishing for key target species, and management influences. The expected background productivity of reefs made a simple allowance for lower productivity on Caribbean reefs, as well as the reduction in productivity observed when reefs are degraded by human impacts. We then predicted local fishing pressure, assuming a direct correlation with the size of local human populations further influenced by possible access to larger markets.
We also recognized that not all reef fishing is local. There is also a worldwide harvest of very high value species: sharks, large groupers and snapper in particular are now of sufficient value in markets, notably in East Asia, that they support a truly global fishery. Rarely sustainable, and often illegal, such fishing for key target species affects almost every coral reef in the world, with remoteness offering little protection. The final minor modification to our model was to take into account reef management. We factored in the role of no-take fishing reserves. We assumed that these would have increased fish populations inside that could not be fished, but also that such reserves would enhance fishing opportunities in a halo around their perimeter.
Coral Reefs
What the models show• Almost all of the world’s coral
reefs are subjected to some fishing pressure, but the highest catches occur closest to large human populations
• Some areas of lower catch exist where the reefs are remote from people, where they are well managed, or both. These include the northwest Hawaiian Islands, the Great Barrier Reef and the British Indian Ocean Territory
• Lower catches are also found in areas such as wide parts of the Caribbean, where reefs have been degraded by human impacts and even at full fishing pressure they cannot deliver high catches
Fishers in Papua New Guinea.
M A K I N G F I S H
Atlas of Ocean Wealth | Part One28

Top: The model includes ecological components of available catch, driven by natural productivity and human impact, combined with likely fishing pressure driven largely by population and markets. This model does not identify areas where high catch may be unsustainable.
Inset: Western Indian Ocean –high-but-variable catches can be seen along the continental coasts, while low catches are recorded from areas such as the uninhabited reefs and islands of the southwestern Seychelles. Even such remote reefs, however, are still the target of focused catches for high-value species.
Modeled Fish Catch from the World’s Coral Reefs
1 2 3 4 5 6 7 8 9 10
MODELED FISH BIOMASS
HIGHESTLOWESTLOWEST HIGHEST
MODELED FISH CATCH
Local speargun fisherman in the Federated States of Micronesia.
Making Fish 29

In building a detailed model for coral reef fisheries, we had an opportunity to develop an unique approach. Coral reefs are among the best studied of all marine ecosystems. While many other fisheries are quantified by assessment of fish catches, because in situ surveys are very difficult, coral reef fishes have been counted and measured on reefs by scores of marine biologists around the world. Such studies do not disturb the ecosystem, and they allow scientists to study reefs across the spectrum from highly degraded to near-pristine.
Initial work, led by the University of Queensland, compiled fish survey data from over 1,100 locations across the extensive reefs and island chains of five jurisdictions in Micronesia (in the Federated States of Micronesia, Marshall Islands, Palau, Guam and the Northern Mariana Islands) in the Pacific Ocean. Almost any level of fishing leaves a clear signal: unfished reefs have a rich abundance of larger fishes, such as parrotfishes, groupers, snappers and sharks. Such species remain where there is still some fishing, but the larger individuals are lost. As fishing pressure increases, the average fish size declines, and gradually some species are lost completely and disappear from the community.
Using these ecological data alongside a host of other information on natural, social or economic variables, we built two models. One modeled cumulative fishing pressure using the average size of parrotfishes from the survey data. We assumed that more fishing would reduce average size. Parrotfish average size was closely linked both to human population density and to the distance to the nearest port. The second model examined the biomass of fish (or standing stock) currently present on the forereef slopes of Micronesia. This is strongly influenced of course by fishing pressure, but many other factors played a part including sea surface temperature, oceanic productivity, upstream larval supply, depth and coral cover.
From these models we generated, for the first time, continuous high resolution maps of fishing pressure and predicted standing stock for Micronesia. Now that we have built the models, we can do so much more.
For example, we can use the models to generate hypothetical scenarios to show what the reefs would look like if there was no fishing at all (potential standing stock). This map shows how, even in the absence of humans,
standing stock varies considerably among reefs. We can also see how areas differ in terms of their ability to cope with fishing pressure. For example, Guam has some of the highest fishing pressure, but also appears to naturally support fewer fishes, making it highly vulnerable to overfishing. By contrast, some reefs around Palau also have high fishing pressure, but they still have high standing stock because they naturally have more fish and can withstand more fishing pressure.
By comparing the differences between current and potential standing stock, we can also show the likely benefits of improved management. For example, some of the first species to be taken from reefs are the top predators such as larger groupers, snappers and jacks. Our model is
CORAL REEFS
Healthy and well-managed
generateof fish per square kilometer per year5 to 10 TONS
Coral Reefs: Micronesia
The Problem of OverfishingFishing gives us all our last glimpse of our ancient past—wild creatures being caught for food, but now on an eye-watering scale. Eighty million metric tons of fish and shellfish are caught in the sea each year by some 18 million marine fishers. Lines, nets, trawls and traps from over three million boats delve into almost every corner of the globe. Tens of millions of additional jobs are generated through the processing, trading, cooking and serving of fish products, and the trade delivers an average of over 10 kilograms of marine fish and shellfish per year for everyone on the planet. Nutritionally, these are beyond compare—providing not only protein, but essential amino acids, vitamins, minerals and unique fatty acids that have immense benefits for human health and development.
Humans need seafood, and yet fish catches have been flat-lining since the mid 1990s, despite ever-increasing efforts, ever-more-sophisticated fishing gears, and increasing distances covered by fishing boats. In many areas, fisheries collapses are leading to worsening diets, job losses and decreased food security. The Food and Agriculture Organization has reported for years on the world’s main fisheries, but new studies on the less-well-studied fisheries, including many small-scale coastal fisheries, indicate that they may be even more impacted.
M A K I N G F I S H
Atlas of Ocean Wealth | Part One30

Ioanis Mihkel, in Pohnpei, Federated States of Micronesia, catching a parrotfish. These fish are both for subsistence, and to sell at the local village markets.
Making Fish 31

sufficiently robust for us to model their recovery, and in the more heavily fished areas around Guam and Pohnpei, we predict increases of 100-350 percent in standing stock of these species in the absence of fishing.
The strength and utility of these maps is considerable and field practitioners are already asking for specific outputs to support planning for improved fisheries management and Protected Area Network design in Micronesia. These same maps could also make a critical contribution to government commitments to undertake the Micronesia Challenge—a commitment by all five jurisdictions to effectively conserve 30 percent of their marine resources by 2020.
Following the success of this approach in Micronesia, we have now been asked to modify and refine our models to develop coral reef fisheries maps to support conservation and management in other regions.
What the models show• 58 percent of reefs areas were
predicted to have low fishing pressure, 27 percent were predicted to have medium fishing pressure, and only 15 percent were predicted to have high fishing pressure
• In contrast with many parts of the world, the majority of reefs in Micronesia appear to be relatively healthy with biomass being more than 50 percent of potential biomass
• Approximately half of the reefs in the region are predicted to increase their fish standing stock by more than 30 percent if fishing stopped
• Recovery of fish populations on more heavily fished reefs could take 10 to 50 years, highlighting the immediate need to establish no-take reserves or other fisheries management tools
• Guam has some of the highest fishing pressure, but is further affected by a naturally low carrying capacity, making it highly vulnerable to overfishing
Local fisherman, Kirino Olpet spearfishing in the waters of Ant Atoll, Pohnpei, Federated States of Micronesia.
M A K I N G F I S H
Atlas of Ocean Wealth | Part One32
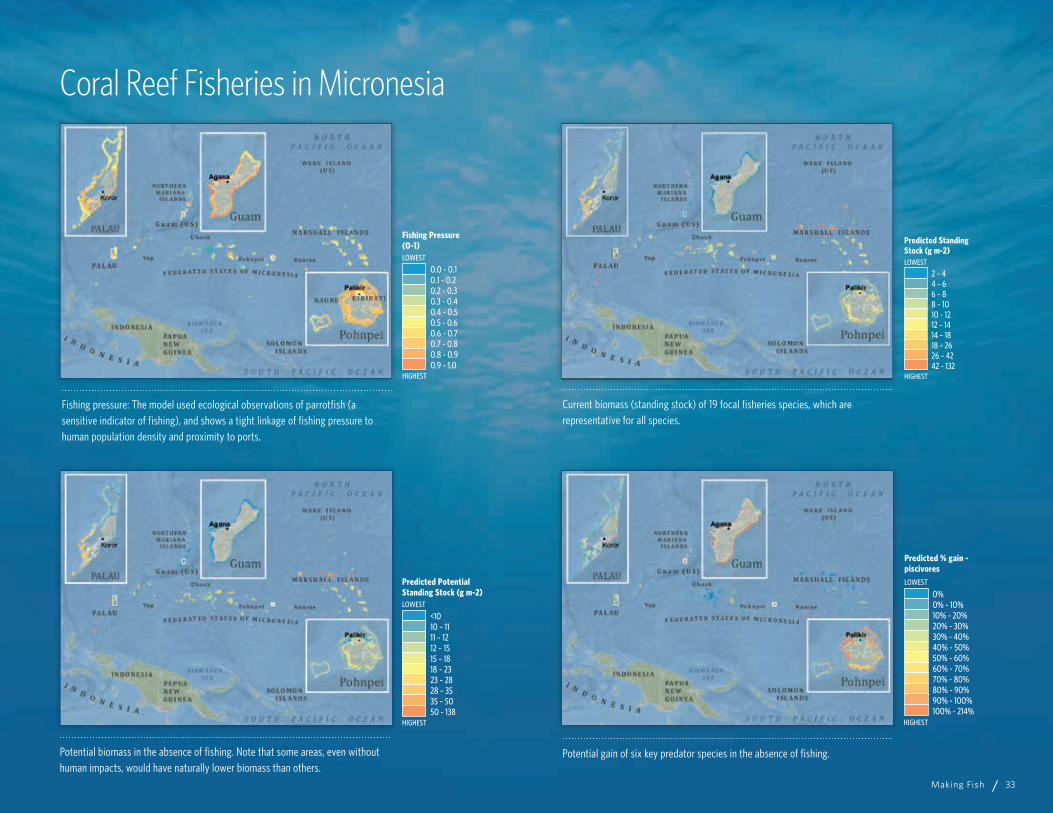
Current biomass (standing stock) of 19 focal fisheries species, which are representative for all species.
LEAST MOST
PREDICTED % GAIN - PISCIVORES
Predicted % gain - piscivores
-14.32% - 0%
0.01% - 10%
10.01% - 20%
20.01% - 30%
30.01% - 40%
40.01% - 50%
50.01% - 60%
60.01% - 70%
70.01% - 80%
80.01% - 90%
90.01% - 100%
100.01% - 214.36%
0%0% - 10%10% - 20%20% - 30%30% - 40%40% - 50%50% - 60%60% - 70%70% - 80%80% - 90%90% - 100%100% - 214%
Predicted % gain - piscivoresLOWEST
HIGHEST
Fishing pressure: The model used ecological observations of parrotfish (a sensitive indicator of fishing), and shows a tight linkage of fishing pressure to human population density and proximity to ports.
Potential biomass in the absence of fishing. Note that some areas, even without human impacts, would have naturally lower biomass than others.
0.0 - 0.10.1 - 0.20.2 - 0.30.3 - 0.40.4 - 0.50.5 - 0.60.6 - 0.70.7 - 0.80.8 - 0.90.9 - 1.0
Fishing Pressure(0-1)LOWEST
HIGHEST
LEAST MOST
PREDICTED POTENTIAL STANDING STOCK (G M-2)
Predicted Potential Standing Stock (g m-2)
3.51 - 10.00
10.01 - 11.00
11.01 - 12.00
12.01 - 15.00
15.01 - 18.00
18.01 - 23.00
23.01 - 28.00
28.01 - 35.00
35.01 - 50.00
50.01 - 138.07
<1010 – 1111 – 1212 – 1515 – 1818 – 2323 – 2828 – 3535 – 5050 - 138
Predicted Potential Standing Stock (g m-2)LOWEST
HIGHEST
Potential gain of six key predator species in the absence of fishing.
Coral Reef Fisheries in Micronesia
LEAST MOST
PREDICTED STANDING STOCK (G - M2)
Predicted Standing Stock (g m-2)
2.05 - 4
4.01 - 6.00
6.01 - 8.00
8.01 - 10.00
10.00 - 12.00
12.01 - 14.00
14.01 - 18.00
18.01 - 26.00
26.01 - 42.00
42.01 - 131.74
2 – 44 – 66 – 88 – 1010 - 1212 – 1414 – 1818 – 2626 – 4242 - 132
Predicted StandingStock (g m-2)LOWEST
HIGHEST
Making Fish 33
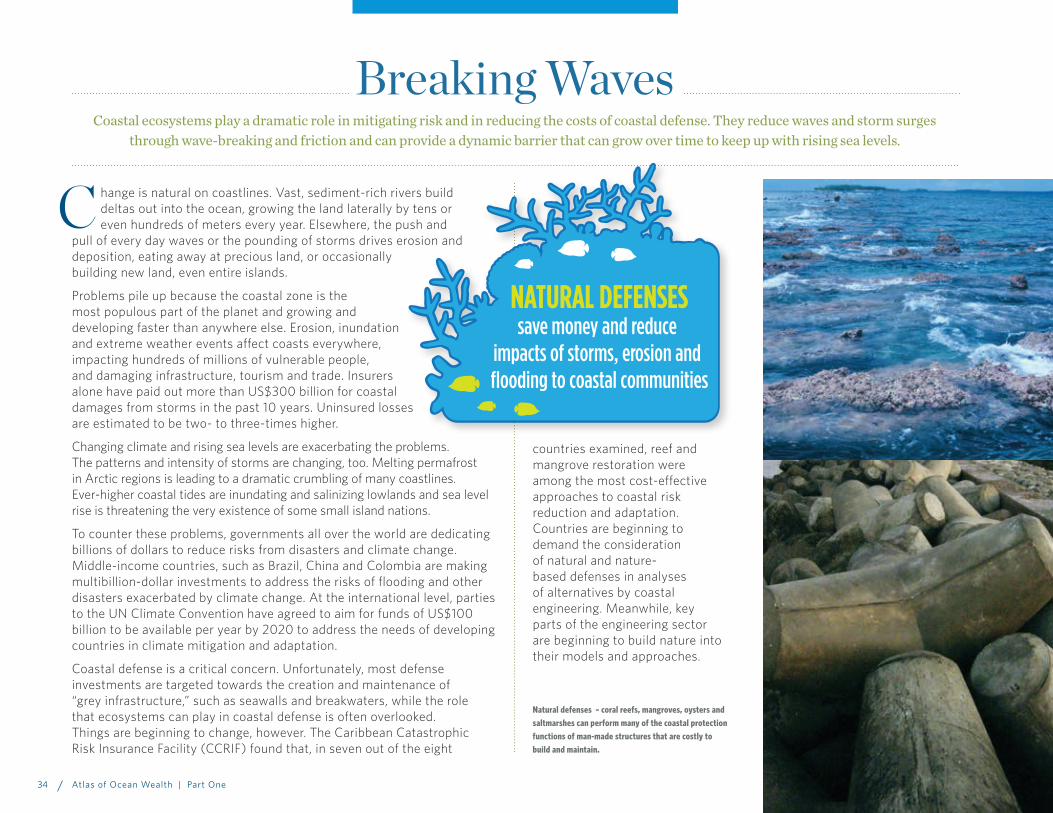
Breaking WavesCoastal ecosystems play a dramatic role in mitigating risk and in reducing the costs of coastal defense. They reduce waves and storm surges
through wave-breaking and friction and can provide a dynamic barrier that can grow over time to keep up with rising sea levels.
hange is natural on coastlines. Vast, sediment-rich rivers build deltas out into the ocean, growing the land laterally by tens or even hundreds of meters every year. Elsewhere, the push and
pull of every day waves or the pounding of storms drives erosion and deposition, eating away at precious land, or occasionally building new land, even entire islands.
Problems pile up because the coastal zone is the most populous part of the planet and growing and developing faster than anywhere else. Erosion, inundation and extreme weather events affect coasts everywhere, impacting hundreds of millions of vulnerable people, and damaging infrastructure, tourism and trade. Insurers alone have paid out more than US$300 billion for coastal damages from storms in the past 10 years. Uninsured losses are estimated to be two- to three-times higher.
Changing climate and rising sea levels are exacerbating the problems. The patterns and intensity of storms are changing, too. Melting permafrost in Arctic regions is leading to a dramatic crumbling of many coastlines. Ever-higher coastal tides are inundating and salinizing lowlands and sea level rise is threatening the very existence of some small island nations.
To counter these problems, governments all over the world are dedicating billions of dollars to reduce risks from disasters and climate change. Middle-income countries, such as Brazil, China and Colombia are making multibillion-dollar investments to address the risks of flooding and other disasters exacerbated by climate change. At the international level, parties to the UN Climate Convention have agreed to aim for funds of US$100 billion to be available per year by 2020 to address the needs of developing countries in climate mitigation and adaptation.
Coastal defense is a critical concern. Unfortunately, most defense investments are targeted towards the creation and maintenance of “grey infrastructure,” such as seawalls and breakwaters, while the role that ecosystems can play in coastal defense is often overlooked. Things are beginning to change, however. The Caribbean Catastrophic Risk Insurance Facility (CCRIF) found that, in seven out of the eight
C
countries examined, reef and mangrove restoration were among the most cost-effective approaches to coastal risk reduction and adaptation. Countries are beginning to demand the consideration of natural and nature-based defenses in analyses of alternatives by coastal engineering. Meanwhile, key parts of the engineering sector are beginning to build nature into their models and approaches.
NATURAL DEFENSES save money and reduce
impacts of storms, erosion and flooding to coastal communities
Natural defenses – coral reefs, mangroves, oysters and saltmarshes can perform many of the coastal protection functions of man-made structures that are costly to build and maintain.
34 Atlas of Ocean Wealth | Part One
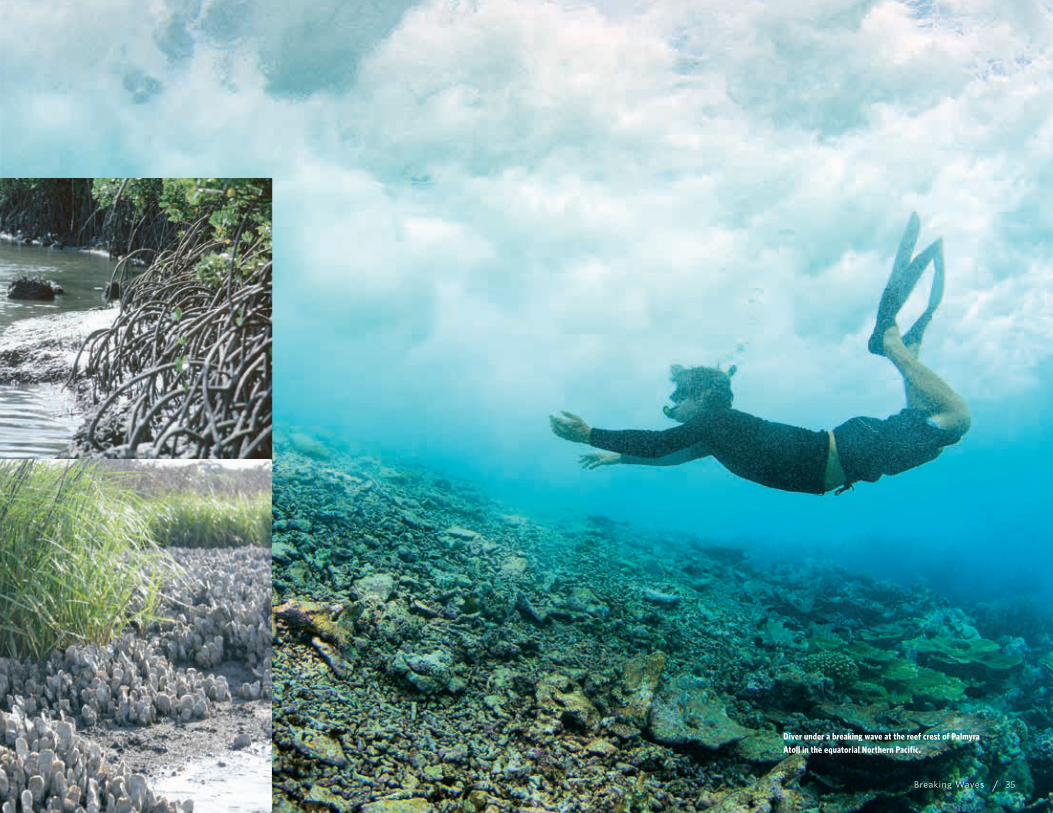
Diver under a breaking wave at the reef crest of Palmyra Atoll in the equatorial Northern Pacific.
Breaking Waves 35

Three Key Processes
Coastal ecosystems play a remarkable role in shaping the physical structure of our coastlines and, in so doing, provide critical services to people in reducing the physical impacts of erosion, storm-damage and flooding. These ecosystems support three key processes: wave attenuation, storm surge reduction and shoreline elevation.
Wave Attenuation
Wind and swell waves scour the seabed and can drive erosion and the shifting of sediments. Larger waves can overtop beaches, dunes and artificial barriers such as seawalls, causing flooding. Physical features of the seabed can quickly change the nature of waves and natural habitats are critical in this regard.
The complex tangle of shoots, roots, shells or skeletons cause friction, rapidly diminishing waves’ energy, while the hard concretions of reefs or mangrove roots, and the tight binding of saltmarsh and seagrass ecosystems help to prevent the scour of waves on the seabed.
Storm Surge Attenuation
Major storms and typhoons typically create a storm surge, a rise in the water level along tens or hundreds of kilometers of
coastline, caused by both the low atmospheric pressure and the process of onshore winds piling up water on shallow coastal shelves. Wind waves are super-imposed on this elevated sea level and the end result can be devastating floods.
During storms, ecosystems continue to reduce incoming overlying wind and swell waves, but where they are sufficiently extensive they also provide resistance to the landward flow of the storm surge itself. Large mangrove forests, extensive reef flats and wide salt marshes can effectively slow the flow of water toward the land. This way, even a partial reduction in surge heights can prevent large areas of flooding.
Maintaining Shoreline Elevation
On average, sea levels are now rising by over three millimeters per year with considerable local variation. Such rates are set to continue or increase over coming decades. While no human engineering can alter this fact, many coastal ecosystems have a capacity to “grow” vertically, raising the elevation of the seabed or land on which they are growing. Coral reefs, oyster reefs, saltmarshes and mangroves have all been shown to be able to keep up with rising sea levels. Such processes are not guaranteed, however, as they can be countered by other natural processes of erosion or natural subsidence, but in at least some places they can make a remarkable difference. Reefs, mangroves, marshes and seagrass meadows can become dynamic self-maintaining barriers and coastal defenses.
Around coral atolls, such as here in the British Indian Ocean Territory, the living walls of coral reefs transform the power of oceanic swells into tranquil waters over just a few metres.
The Science of Coastal ProtectionB R E A K I N G W A V E S
Natural coastal defense. The upper image illustrates how the complex structures of coral reefs, mangroves and other ecosystems can play an important role in reducing wave heights and protecting communities. When degraded or lost (lower image) this capacity to reduce waves is greatly diminished and the threat of flooding and erosion increases.
36 Atlas of Ocean Wealth | Part One

37
The Coasts@Risk index identifies countries most at-risk to coastal hazards based on their exposure to storms and sea level rise and on the social vulnerability of their communities, which includes susceptibility, coping capacity and adaptive capacity. Superimposed on these country scores is an image of the hazard presented by storms.
Hazards and Risk
Very Low Low Medium High Very High
COASTS AT RISK INDEX Very Low Low Medium High Very High
LOWEST HIGHEST
CYCLONE FREQUENCY
Quantifying Value—Expected Damage FunctionThe coastal protection benefits from various coastal habitats are predicted to be substantial, but prior to our work, these benefits had only been quantified rigorously in a few places. Without sufficient knowledge or reliable models, such benefits are not being properly used to inform decisions in development, risk reduction and conservation (World Bank 2016). This is risky business—potential benefits are not being included, and potential assets are being damaged, potentially at vast cost to society.
New guidelines developed for the World Bank offer a rigorous approach for quantifying the annual expected benefits of natural protection services and developing values that can be incorporated into national accounts and other economic considerations. At the center of this approach is the calculation of the Expected Damage Function (EDF). This approach is adapted from the tools commonly used in risk analyses by engineers and insurance risk modelers. It requires the modeling and mapping of flooding levels at present and then assessing flooding levels if habitat barriers were lost. The value of the social and built capital between these lines is the expected benefit from keeping these habitats in place.
Breaking Waves 37

A mere 100 meters of mangroves can reduce wave height by two-thirds, while very wide mangrove forests can significantly reduce flooding from storm surges.
Along vast stretches of the world’s warm coastlines, mangrove forests form extensive, even continuous belts. They grow particularly vigorously in river-mouths and deltas, places that are often of critical importance to human dwelling and commerce. These strange forests, growing between the tides, can appear impenetrable with a combination of aerial roots and low branches. It is precisely this
combination that forms the mangroves’ critical barrier to waves and flooding.
The Mapping Ocean Wealth team, working with the University of Cambridge, the United Nations University, the University of California, Santa Cruz and the World Bank, has undertaken detailed reviews of all the existing research into the role of mangroves in coastal protection. We have described how a 100-meter-wide belt of mangroves can reduce wave heights between 13 and 66 percent, and up to 100 percent where mangroves reach 500 meters or more in width. If mangrove forests are sufficiently large, they can reduce storm
surge peak water levels between 4 and
48 centimeters per kilometer of mangrove.
In low-lying areas, even such
relatively small reductions in
peak water levels can reduce flooding and prevent
property damage.
During these extreme events
mangroves play multiple roles—they may reduce the
height of the storm surge, they reduce the wind-waves that top the storm surge, they reduce wind-speed across the water surface, which can prevent waves re-forming, and they can even provide some mechanisms for trapping debris that is a major cause of death and injury during storms. Studies following an extreme cyclone in Orissa, India showed that villages that had maintained mangroves as a barrier to the sea had a lower death toll from the storm.
Other MOW-linked studies looking at the costs of natural versus engineered sea defenses have shown that restoring mangroves can be two- to five-times cheaper than building a concrete breakwater, yet provides the same degree of protection.
Seagrass
Submerged seagrass ecosystems
have received far less attention
than intertidal mangroves and
saltmarshes, and indeed we know
far less about these ecosystems
generally. The few reviews that exist
on the role of seagrass in reducing
waves all point to them having some
effect on waves, although generally
this is thought to be much less
than the other coastal wetlands.
They are most effective where they
are in shallow water and form dense,
long-lived beds over wide areas that
are not subject to seasonal variation.
Alone, they have only a limited value,
but seagrass is rarely found alone,
and it is perhaps more in the addition
of roles that they are most important,
beginning a process of wave-energy
reduction that is then completed by
mangroves, saltmarshes or reefs.
Mangroves
The dense aerial roots and low branches of mangroves form a complex frictional barrier, slowing water flow and rapidly reducing the energy of incoming waves.
REDUCE 66%of wave height –
easing erosion andflood risk
MANGROVES
B R E A K I N G W A V E S
38 Atlas of Ocean Wealth | Part One

Ann Harvey, a teacher on Union Island in Grenada, has been a vocal local witness to the role of mangroves – she tells how her school was protected from Hurrican Ivan in 2004 by the existence of mangroves.
Living with Risk
It is impossible to remove risk entirely from coastal zones. Even in an ideal world, engineers and planners develop structures to avoid a certain level of risk, a once-in-a-hundred-year storm for example, while a residual risk remains. Ecosystems too have their limits and quantifying these is a critical element of building their acceptability in the coastal planning progress. A further key element is not to rely on a single approach of risk avoidance. With storms and tsunamis, early warning and evacuation plans are critical to avoiding loss of life. Over the longer term, recognition of high risk zones and the development of building codes to prevent development in such areas is of great importance in avoiding loss of infrastructure. Ecosystems need to be incorporated into this wider risk-reduction framework.
Wave energy can be quickly dissipated around the roots and shoots of mangrove vegetation.
Breaking Waves 39

Oyster Reefs
Dense packed beds and reefs of oysters form a natural breakwater, dramatically cutting wave height. They are both found sub-tidally and in intertidal areas where they provide a form of shoreline armor, preventing erosion and protecting marshes.
Prior to centuries of overharvesting, oysters were superabundant in bays and estuaries around the world, in places forming large banks rising high above the seabed. Losses have been so great that it is difficult to find areas of native original reefs to study, however the
value of such reefs is such that extensive efforts have been undertaken to restore oyster reefs (see Part Two), mostly in the USA.
TNC experts working with the Natural Capital Project have developed a model of wave attenuation by oyster reefs. We have also used these models to look at the value of newly restored coastal oyster reefs in reducing coastal erosion in the Gulf of Mexico. Such reefs can prevent the need for more intrusive engineering solutions, such as bulkheads and revetments, saving over US$750 for every meter of reef constructed. Through this collaboration, we have also built interactive apps for planners to consider how and where oyster reef restoration can best protect shorelines.
Saltmarshes
Away from the tropics, saltmarshes cover vast extents of low-lying coasts, often in close juxtaposition with human communities, urban areas and valuable farmland. Many have been lost, often replaced by high-value property and infrastructure in what are the lowest lying and riskiest areas, places regularly subject to erosion and inundation.
While saltmarshes lack the high physical structures of mangroves, in the face of smaller waves and surges their dense vegetation structure actually makes them more effective in wave attenuation than mangroves. The tight-packed vegetation creates strong frictional resistance to waves, while the aboveground plants and their dense root systems stabilize sediment and reduce erosion.
Several studies show attenuation of as much as 50 percent of smaller waves even by a barrier of just 10 meters—rates of attenuation that are typically more than double that of unvegetated mudflats. There is considerable variation in how effective they are, influenced by the density and structure of the vegetation, but all studies point to the importance of such marshes, particularly in the first few meters of shore where attenuation is greatest.
Temperate Shores
per year per hectare when used in place of
artificial breakwaters
save communities
$85,000OYSTER REEFS
Oysters provide a complex three-dimensional structure which provides strong frictional resistance to waves.
Constructed or restored oyster reefs, like these in Alabama, USA, can reduce erosion and allow adjacent marshes to flourish.
B R E A K I N G W A V E S
40 Atlas of Ocean Wealth | Part One

Areas at highest risk to coastal hazards across the Gulf of Mexico considering exposure to storms and sea level rise and the social vulnerability of communities (e.g., % below poverty). The inset shows locations identified by TNC’s Risk Explorer where oyster reef restoration may have the greatest risk reduction.
Coastal Risks in the Northern Gulf of Mexico and the Potential of Oyster-Based Mitigation
Northern Gulf of Mexico off the coast of Coffee Island in Portersville Bay, AL.
1 2 3 4 5
LOWEST HIGHEST
AREAS OF HIGHEST RISK TO COASTAL HAZARDS
Priority oyster restoration areas
Breaking Waves 41
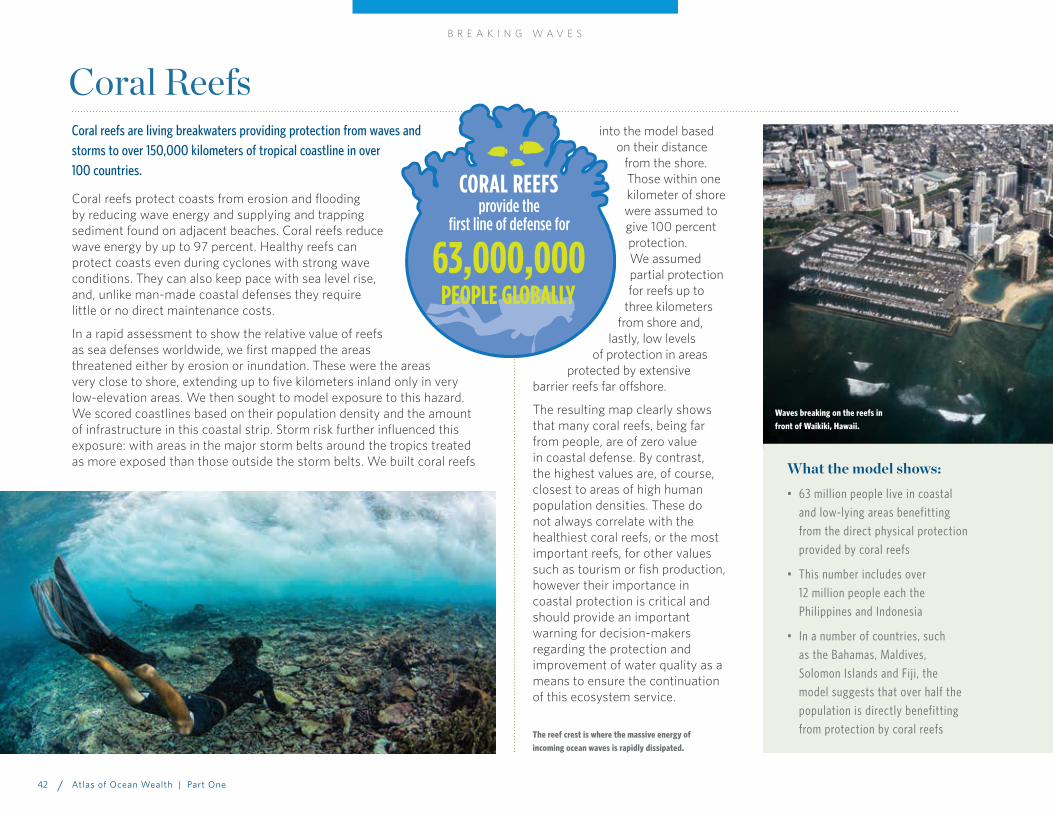
Coral reefs are living breakwaters providing protection from waves and storms to over 150,000 kilometers of tropical coastline in over 100 countries.
Coral reefs protect coasts from erosion and flooding by reducing wave energy and supplying and trapping sediment found on adjacent beaches. Coral reefs reduce wave energy by up to 97 percent. Healthy reefs can protect coasts even during cyclones with strong wave conditions. They can also keep pace with sea level rise, and, unlike man-made coastal defenses they require little or no direct maintenance costs.
In a rapid assessment to show the relative value of reefs as sea defenses worldwide, we first mapped the areas threatened either by erosion or inundation. These were the areas very close to shore, extending up to five kilometers inland only in very low-elevation areas. We then sought to model exposure to this hazard. We scored coastlines based on their population density and the amount of infrastructure in this coastal strip. Storm risk further influenced this exposure: with areas in the major storm belts around the tropics treated as more exposed than those outside the storm belts. We built coral reefs
into the model based on their distance
from the shore. Those within one kilometer of shore were assumed to give 100 percent protection. We assumed partial protection for reefs up to
three kilometers from shore and,
lastly, low levels of protection in areas
protected by extensive barrier reefs far offshore.
The resulting map clearly shows that many coral reefs, being far from people, are of zero value in coastal defense. By contrast, the highest values are, of course, closest to areas of high human population densities. These do not always correlate with the healthiest coral reefs, or the most important reefs, for other values such as tourism or fish production, however their importance in coastal protection is critical and should provide an important warning for decision-makers regarding the protection and improvement of water quality as a means to ensure the continuation of this ecosystem service.
What the model shows:• 63 million people live in coastal
and low-lying areas benefitting from the direct physical protection provided by coral reefs
• This number includes over 12 million people each the Philippines and Indonesia
• In a number of countries, such as the Bahamas, Maldives, Solomon Islands and Fiji, the model suggests that over half the population is directly benefitting from protection by coral reefs
Coral Reefs
CORAL REEFS
63,000,000provide the
first line of defense for
PEOPLE GLOBALLY
The reef crest is where the massive energy of incoming ocean waves is rapidly dissipated.
Waves breaking on the reefs in front of Waikiki, Hawaii.
B R E A K I N G W A V E S
42 Atlas of Ocean Wealth | Part One

This simple model highlights reefs based on their proximity to shore, human populations and infrastructure. Reefs far from people are rated as having no value.
Inset: The main Hawaiian Islands—modeled values are higher nearest to urban coastlines such as Honolulu, which may not be considered the best reefs for other services such as fish production or tourism.
Modeled Value of Reefs in Coastal Defense
1 2 3 4 5 6 7 8 9 10
MODELED FISH BIOMASS
HIGHESTLOWESTLOWEST HIGHEST
COASTAL PROTECTION FROM CORAL REEFS
Breaking Waves 43
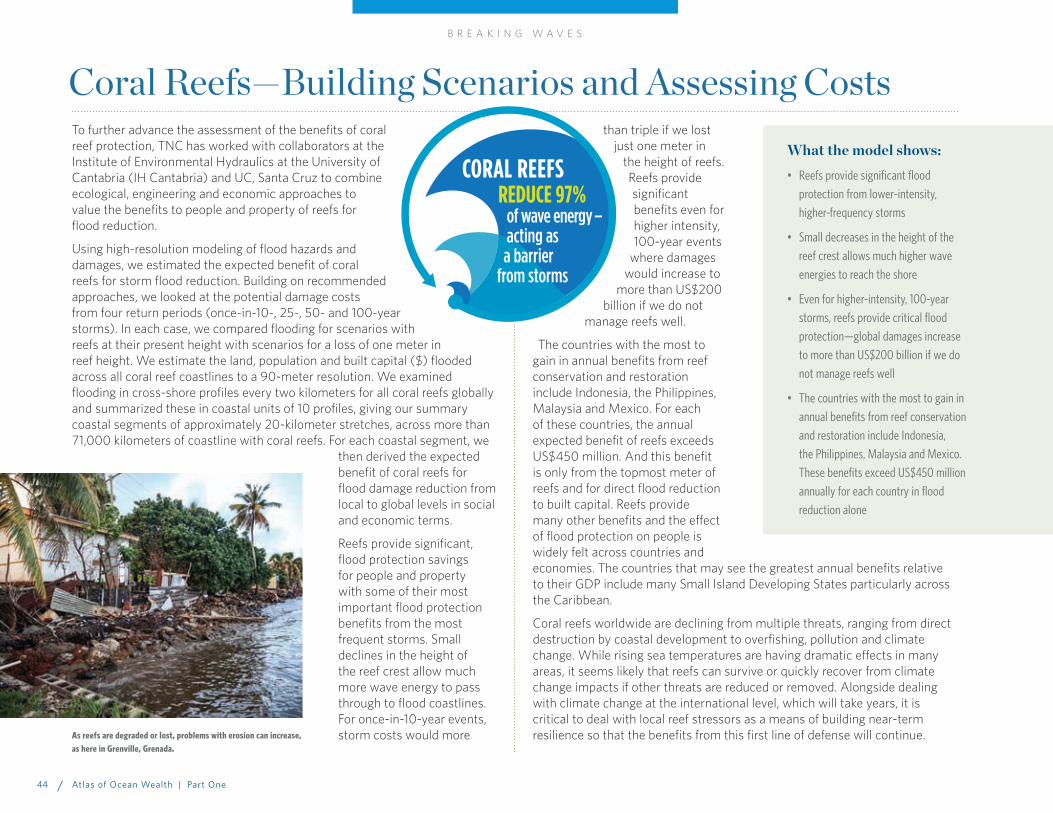
To further advance the assessment of the benefits of coral reef protection, TNC has worked with collaborators at the Institute of Environmental Hydraulics at the University of Cantabria (IH Cantabria) and UC, Santa Cruz to combine ecological, engineering and economic approaches to value the benefits to people and property of reefs for flood reduction.
Using high-resolution modeling of flood hazards and damages, we estimated the expected benefit of coral reefs for storm flood reduction. Building on recommended approaches, we looked at the potential damage costs from four return periods (once-in-10-, 25-, 50- and 100-year storms). In each case, we compared flooding for scenarios with reefs at their present height with scenarios for a loss of one meter in reef height. We estimate the land, population and built capital ($) flooded across all coral reef coastlines to a 90-meter resolution. We examined flooding in cross-shore profiles every two kilometers for all coral reefs globally and summarized these in coastal units of 10 profiles, giving our summary coastal segments of approximately 20-kilometer stretches, across more than 71,000 kilometers of coastline with coral reefs. For each coastal segment, we
then derived the expected benefit of coral reefs for flood damage reduction from local to global levels in social and economic terms.
Reefs provide significant, flood protection savings for people and property with some of their most important flood protection benefits from the most frequent storms. Small declines in the height of the reef crest allow much more wave energy to pass through to flood coastlines. For once-in-10-year events, storm costs would more
than triple if we lost just one meter in
the height of reefs. Reefs provide significant benefits even for higher intensity, 100-year events
where damages would increase to
more than US$200 billion if we do not
manage reefs well.
The countries with the most to gain in annual benefits from reef conservation and restoration include Indonesia, the Philippines, Malaysia and Mexico. For each of these countries, the annual expected benefit of reefs exceeds US$450 million. And this benefit is only from the topmost meter of reefs and for direct flood reduction to built capital. Reefs provide many other benefits and the effect of flood protection on people is widely felt across countries and economies. The countries that may see the greatest annual benefits relative to their GDP include many Small Island Developing States particularly across the Caribbean.
Coral reefs worldwide are declining from multiple threats, ranging from direct destruction by coastal development to overfishing, pollution and climate change. While rising sea temperatures are having dramatic effects in many areas, it seems likely that reefs can survive or quickly recover from climate change impacts if other threats are reduced or removed. Alongside dealing with climate change at the international level, which will take years, it is critical to deal with local reef stressors as a means of building near-term resilience so that the benefits from this first line of defense will continue.
What the model shows:• Reefs provide significant flood
protection from lower-intensity, higher-frequency storms
• Small decreases in the height of the reef crest allows much higher wave energies to reach the shore
• Even for higher-intensity, 100-year storms, reefs provide critical flood protection—global damages increase to more than US$200 billion if we do not manage reefs well
• The countries with the most to gain in annual benefits from reef conservation and restoration include Indonesia, the Philippines, Malaysia and Mexico. These benefits exceed US$450 million annually for each country in flood reduction alone
Coral Reefs—Building Scenarios and Assessing Costs
CORAL REEFS REDUCE 97% of wave energy – acting as a barrier from storms
As reefs are degraded or lost, problems with erosion can increase, as here in Grenville, Grenada.
B R E A K I N G W A V E S
44 Atlas of Ocean Wealth | Part One

The benefits of coral reefs in flood-protection savings for the Caribbean and Southeast Asia. They show the additional cost that would be incurred in terms of damage to built capital from a once-in-a-100-year storm if just one meter of reef height was lost from current reef heights. Units are in 2011 US$ for coastal segments which are approximately 20 kilometers in length.
Flood Protection by Coral Reefs
<0.10.1-11-1010-100100- 10001000 - 10,000> 10,000
1234567
Category 2011 (US$ million)LEAST
MOST
Seawall, manmade barrier in Grenada, Grenada.
Breaking Waves 45
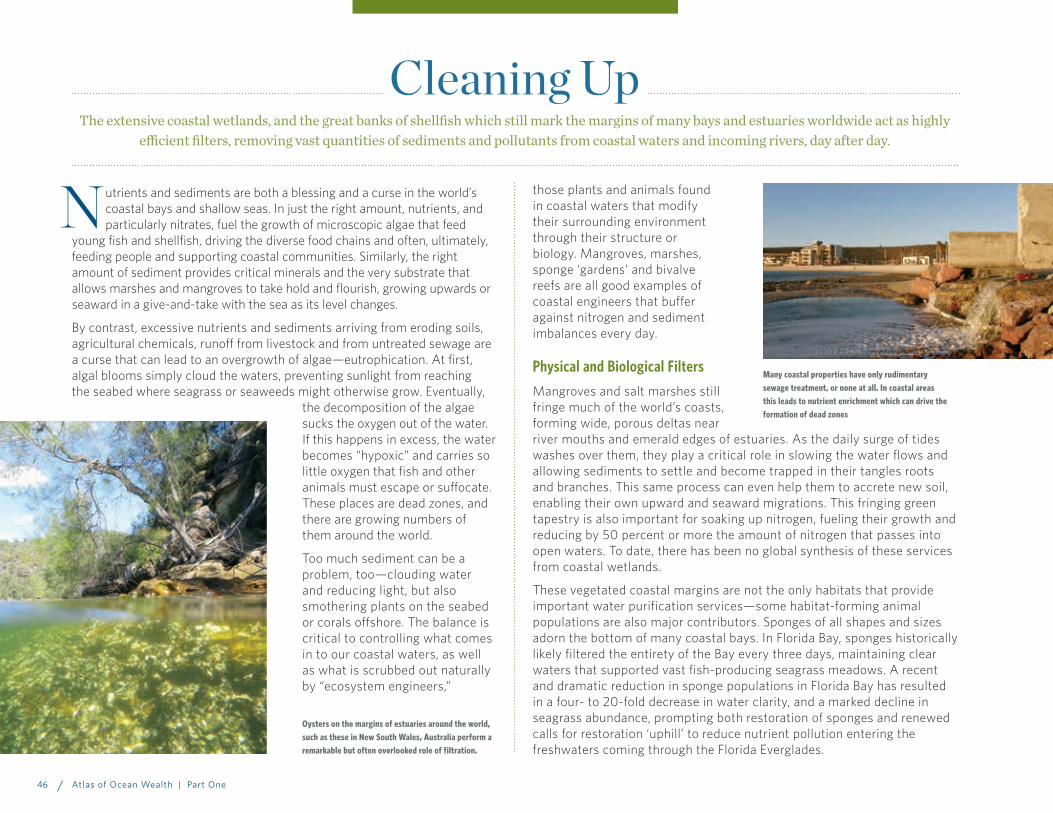
Cleaning UpThe extensive coastal wetlands, and the great banks of shellfish which still mark the margins of many bays and estuaries worldwide act as highly
efficient filters, removing vast quantities of sediments and pollutants from coastal waters and incoming rivers, day after day.
utrients and sediments are both a blessing and a curse in the world’s coastal bays and shallow seas. In just the right amount, nutrients, and particularly nitrates, fuel the growth of microscopic algae that feed
young fish and shellfish, driving the diverse food chains and often, ultimately, feeding people and supporting coastal communities. Similarly, the right amount of sediment provides critical minerals and the very substrate that allows marshes and mangroves to take hold and flourish, growing upwards or seaward in a give-and-take with the sea as its level changes.
By contrast, excessive nutrients and sediments arriving from eroding soils, agricultural chemicals, runoff from livestock and from untreated sewage are a curse that can lead to an overgrowth of algae—eutrophication. At first, algal blooms simply cloud the waters, preventing sunlight from reaching the seabed where seagrass or seaweeds might otherwise grow. Eventually,
the decomposition of the algae sucks the oxygen out of the water. If this happens in excess, the water becomes “hypoxic” and carries so little oxygen that fish and other animals must escape or suffocate. These places are dead zones, and there are growing numbers of them around the world.
Too much sediment can be a problem, too—clouding water and reducing light, but also smothering plants on the seabed or corals offshore. The balance is critical to controlling what comes in to our coastal waters, as well as what is scrubbed out naturally by “ecosystem engineers,”
N those plants and animals found in coastal waters that modify their surrounding environment through their structure or biology. Mangroves, marshes, sponge ‘gardens’ and bivalve reefs are all good examples of coastal engineers that buffer against nitrogen and sediment imbalances every day.
Physical and Biological Filters
Mangroves and salt marshes still fringe much of the world’s coasts, forming wide, porous deltas near river mouths and emerald edges of estuaries. As the daily surge of tides washes over them, they play a critical role in slowing the water flows and allowing sediments to settle and become trapped in their tangles roots and branches. This same process can even help them to accrete new soil, enabling their own upward and seaward migrations. This fringing green tapestry is also important for soaking up nitrogen, fueling their growth and reducing by 50 percent or more the amount of nitrogen that passes into open waters. To date, there has been no global synthesis of these services from coastal wetlands.
These vegetated coastal margins are not the only habitats that provide important water purification services—some habitat-forming animal populations are also major contributors. Sponges of all shapes and sizes adorn the bottom of many coastal bays. In Florida Bay, sponges historically likely filtered the entirety of the Bay every three days, maintaining clear waters that supported vast fish-producing seagrass meadows. A recent and dramatic reduction in sponge populations in Florida Bay has resulted in a four- to 20-fold decrease in water clarity, and a marked decline in seagrass abundance, prompting both restoration of sponges and renewed calls for restoration ‘uphill’ to reduce nutrient pollution entering the freshwaters coming through the Florida Everglades.
Oysters on the margins of estuaries around the world, such as these in New South Wales, Australia perform a remarkable but often overlooked role of filtration.
Many coastal properties have only rudimentary sewage treatment, or none at all. In coastal areas this leads to nutrient enrichment which can drive the formation of dead zones
46 Atlas of Ocean Wealth | Part One

Filtration of particles in the water is further enhanced by bacterial processes of denitrification, which take place on the protected seafloor around oyster beds, mangroves and other wetlands. Here in Charlotte Harbor, Florida, oysters and mangroves combine forces to provide these underappreciated services.
Cleaning Up 47

Oyster reefs and other bivalve aggregations are among the most effective of all the cleaners of coastal waters, filtering vast amounts of water from which they collect and digest microscopic algae for food. A single oyster can filter 180 liters of water each day. Great banks of oysters can thus yield measurably clearer waters, and the resulting transparency supports underwater grasses and other plants that need light to survive. These plants, in turn, yield additional benefits, like fish production and carbon storage. It is something of a virtuous cycle.
As they filter water and feed, oysters also deposit waste material onto surrounding sediments where it fuels growth of helpful bacteria that digest this nitrate-rich waste. These bacteria release nitrogen back to the atmosphere as harmless gas (78 percent of the air we breathe is inert nitrogen gas) through a process called ‘denitrification.’ It is no wonder, then, that between their filtration and removal of nitrogen pollution, oyster reefs are becoming recognized as a critically important part of our estuaries. Scientist call oysters a ‘keystone species’ in recognition of their important role in estuaries.
Unfortunately, in our quest to harvest these delectable bivalves, and in our haste to develop the lands and waters they call home, oyster reefs have become the most imperiled marine ecosystem on Earth, with an estimated 85 percent loss globally. Improved understanding and appreciation of their importance in coastal waters may be slowly changing this situation. There is a growing movement to restore oyster habitat (see Section 2). Water quality is a primary motivation for this movement, and the ability to quantify these benefits is the key to scaling restoration investments for a real and measurable impact.
In our efforts to better quantify the benefits provided by oysters, and to further motivate both conservation and restoration, MOW scientists have built unique models of oysters and water filtration. We need to know ‘how much is enough?’ to make an appreciable difference to the water quality of any given bay. One approach for answering that question is to have enough oysters to filter the volume of water in a bay in about the same time it takes the tide and river flow to replace this water over time. This is known as the ‘residence time’ of water in an estuary. At this level of abundance and filtration, oysters are grazing and feeding at a rate that is probably sufficient to clear the water and keep algae blooms in check.
To understand the variability in the extent of filtration by oysters in the bays and estuaries of the US, we constructed a mathematical model that
estimates filtration based on individual oyster size, abundance and reef area, as well as water temperature. Temperature controls the rate at which oysters feed, grow and respire, and this is one parameter that is rather well documented in many bays. Understanding the average size and abundance, as well as the area over which oysters are distributed, is a more complex undertaking as the methods used to sample oysters vary from place to place. Moreover, they have changed over time. Nevertheless, with a careful review of the literature, it was possible to find data about present and past oyster abundance for numerous bays and estuaries going back in time over 100 years, including maps of extent and information on oyster size. This information is sufficient, in fact, to feed into models of filtration capacity.
With this, we were able to look at not only present-day filtration capacity, but also to quantify changes in filtration over time. The picture that emerged was perhaps predictably disappointing, with most bays falling far short of the filtration rate/residence-time equilibrium. Apalachicola Bay, Florida, was one ‘bright spot’ with filtration appearing to have increased in the past century or so, which likely reflects the rather conservative management approach that has been employed there over time. As disappointing as the filtration rates are for other bays, the model provides an important baseline from which progress can be measured, and by which to set targets for restoration. Add in the nitrogen removal, the reduction of coastal erosion and enhancement of fish populations that come along with oyster reefs, and oyster reef conservation becomes convincing. And, while data may only be available for the US at the present time, the science is, in fact, so compelling that countries around the world are starting to ask what filtering bivalves may be doing for them.
What the model shows:• Oyster reef filtration in most bays
along the US East Coast and Gulf of Mexico coast has declined by more than 80 percent on average
• Only one bay—Apalachicola Bay, Florida—showed increased filtration capacity by oyster reefs. This likely reflects a conservative approach to management of the oyster fishery there, relative to many other estuaries
• Water filtration capacity is a straightforward and understandable metric that can be used to establish meaningful management goals and scale restoration investments
Oysters and Clean Water C L E A N I N G U P
48 Atlas of Ocean Wealth | Part One
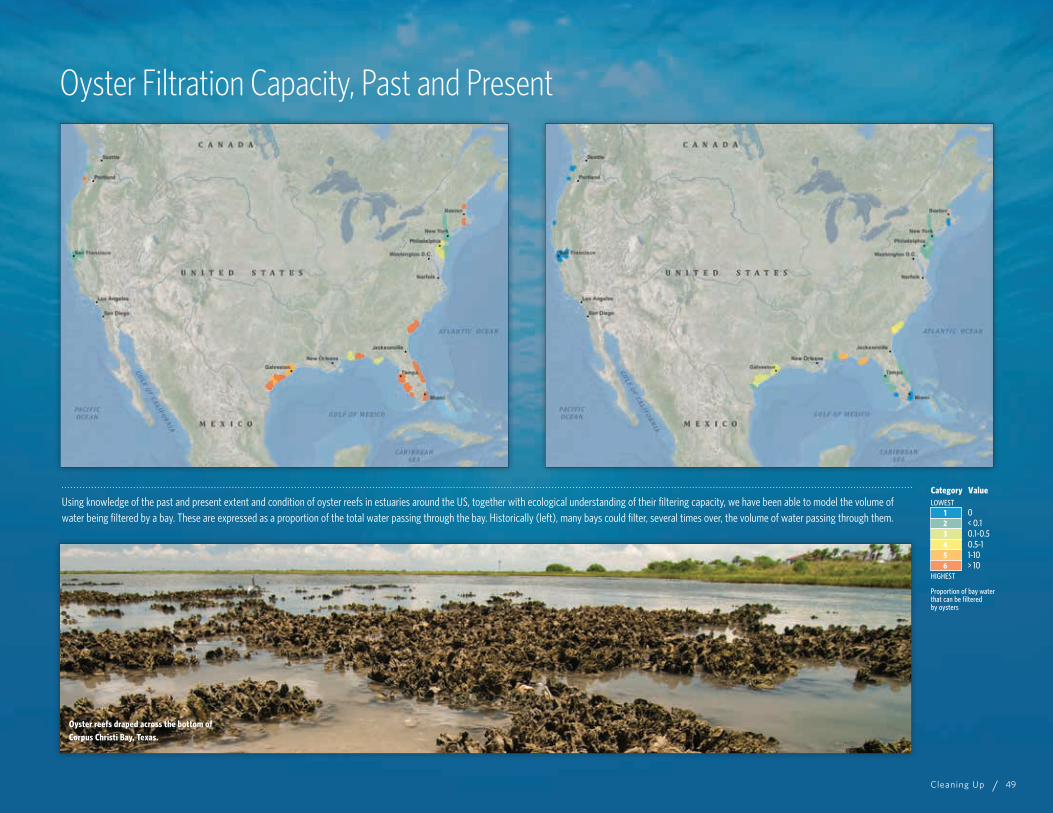
Using knowledge of the past and present extent and condition of oyster reefs in estuaries around the US, together with ecological understanding of their filtering capacity, we have been able to model the volume of water being filtered by a bay. These are expressed as a proportion of the total water passing through the bay. Historically (left), many bays could filter, several times over, the volume of water passing through them.
Oyster Filtration Capacity, Past and Present
0
Proportion of bay waterthat can be filteredby oysters
< 0.10.1-0.50.5-11-10> 10
123456
Category ValueLOWEST
HIGHEST
Oyster reefs draped across the bottom of Corpus Christi Bay, Texas.
Cleaning Up 49
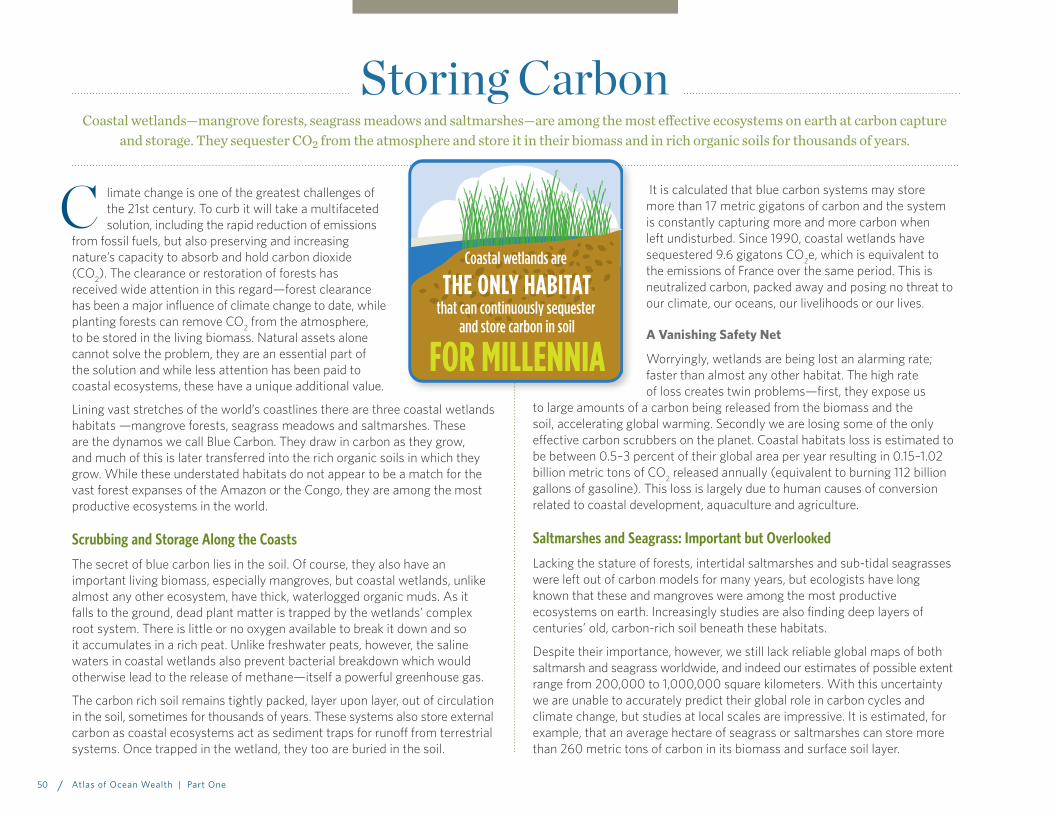
Storing CarbonCoastal wetlands—mangrove forests, seagrass meadows and saltmarshes—are among the most effective ecosystems on earth at carbon capture
and storage. They sequester CO₂ from the atmosphere and store it in their biomass and in rich organic soils for thousands of years.
limate change is one of the greatest challenges of the 21st century. To curb it will take a multifaceted solution, including the rapid reduction of emissions
from fossil fuels, but also preserving and increasing nature’s capacity to absorb and hold carbon dioxide (CO2). The clearance or restoration of forests has received wide attention in this regard—forest clearance has been a major influence of climate change to date, while planting forests can remove CO2 from the atmosphere, to be stored in the living biomass. Natural assets alone cannot solve the problem, they are an essential part of the solution and while less attention has been paid to coastal ecosystems, these have a unique additional value.
Lining vast stretches of the world’s coastlines there are three coastal wetlands habitats —mangrove forests, seagrass meadows and saltmarshes. These are the dynamos we call Blue Carbon. They draw in carbon as they grow, and much of this is later transferred into the rich organic soils in which they grow. While these understated habitats do not appear to be a match for the vast forest expanses of the Amazon or the Congo, they are among the most productive ecosystems in the world.
Scrubbing and Storage Along the Coasts
The secret of blue carbon lies in the soil. Of course, they also have an important living biomass, especially mangroves, but coastal wetlands, unlike almost any other ecosystem, have thick, waterlogged organic muds. As it falls to the ground, dead plant matter is trapped by the wetlands’ complex root system. There is little or no oxygen available to break it down and so it accumulates in a rich peat. Unlike freshwater peats, however, the saline waters in coastal wetlands also prevent bacterial breakdown which would otherwise lead to the release of methane—itself a powerful greenhouse gas.
The carbon rich soil remains tightly packed, layer upon layer, out of circulation in the soil, sometimes for thousands of years. These systems also store external carbon as coastal ecosystems act as sediment traps for runoff from terrestrial systems. Once trapped in the wetland, they too are buried in the soil.
C It is calculated that blue carbon systems may store more than 17 metric gigatons of carbon and the system is constantly capturing more and more carbon when left undisturbed. Since 1990, coastal wetlands have sequestered 9.6 gigatons CO2e, which is equivalent to the emissions of France over the same period. This is neutralized carbon, packed away and posing no threat to our climate, our oceans, our livelihoods or our lives.
A Vanishing Safety Net
Worryingly, wetlands are being lost an alarming rate; faster than almost any other habitat. The high rate of loss creates twin problems—first, they expose us
to large amounts of a carbon being released from the biomass and the soil, accelerating global warming. Secondly we are losing some of the only effective carbon scrubbers on the planet. Coastal habitats loss is estimated to be between 0.5–3 percent of their global area per year resulting in 0.15–1.02 billion metric tons of CO2 released annually (equivalent to burning 112 billion gallons of gasoline). This loss is largely due to human causes of conversion related to coastal development, aquaculture and agriculture.
Saltmarshes and Seagrass: Important but Overlooked
Lacking the stature of forests, intertidal saltmarshes and sub-tidal seagrasses were left out of carbon models for many years, but ecologists have long known that these and mangroves were among the most productive ecosystems on earth. Increasingly studies are also finding deep layers of centuries’ old, carbon-rich soil beneath these habitats.
Despite their importance, however, we still lack reliable global maps of both saltmarsh and seagrass worldwide, and indeed our estimates of possible extent range from 200,000 to 1,000,000 square kilometers. With this uncertainty we are unable to accurately predict their global role in carbon cycles and climate change, but studies at local scales are impressive. It is estimated, for example, that an average hectare of seagrass or saltmarshes can store more than 260 metric tons of carbon in its biomass and surface soil layer.
THE ONLY HABITATthat can continuously sequester
and store carbon in soil
Coastal wetlands are
FOR MILLENNIA
Atlas of Ocean Wealth | Part One50
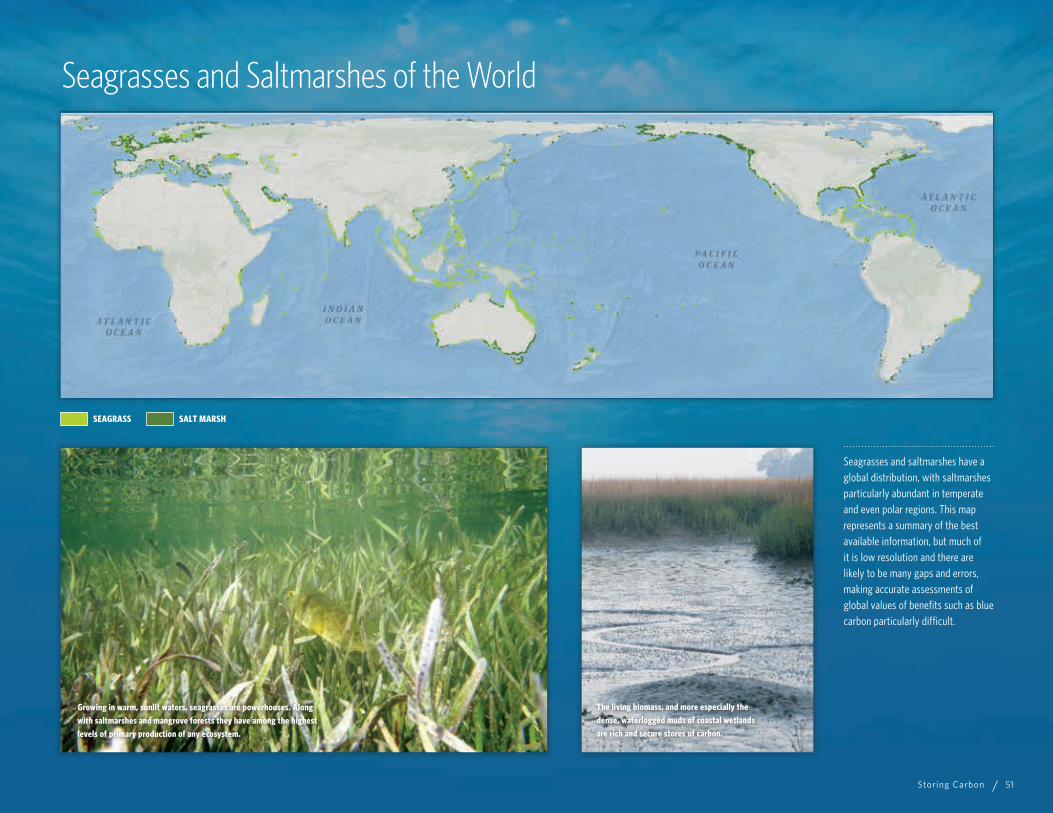
Seagrasses and saltmarshes have a global distribution, with saltmarshes particularly abundant in temperate and even polar regions. This map represents a summary of the best available information, but much of it is low resolution and there are likely to be many gaps and errors, making accurate assessments of global values of benefits such as blue carbon particularly difficult.
Growing in warm, sunlit waters, seagrasses are powerhouses. Along with saltmarshes and mangrove forests they have among the highest levels of primary production of any ecosystem.
Seagrasses and Saltmarshes of the World
SEAGRASS SALT MARSH
The living biomass, and more especially the dense, waterlogged muds of coastal wetlands are rich and secure stores of carbon.
Storing Carbon 51
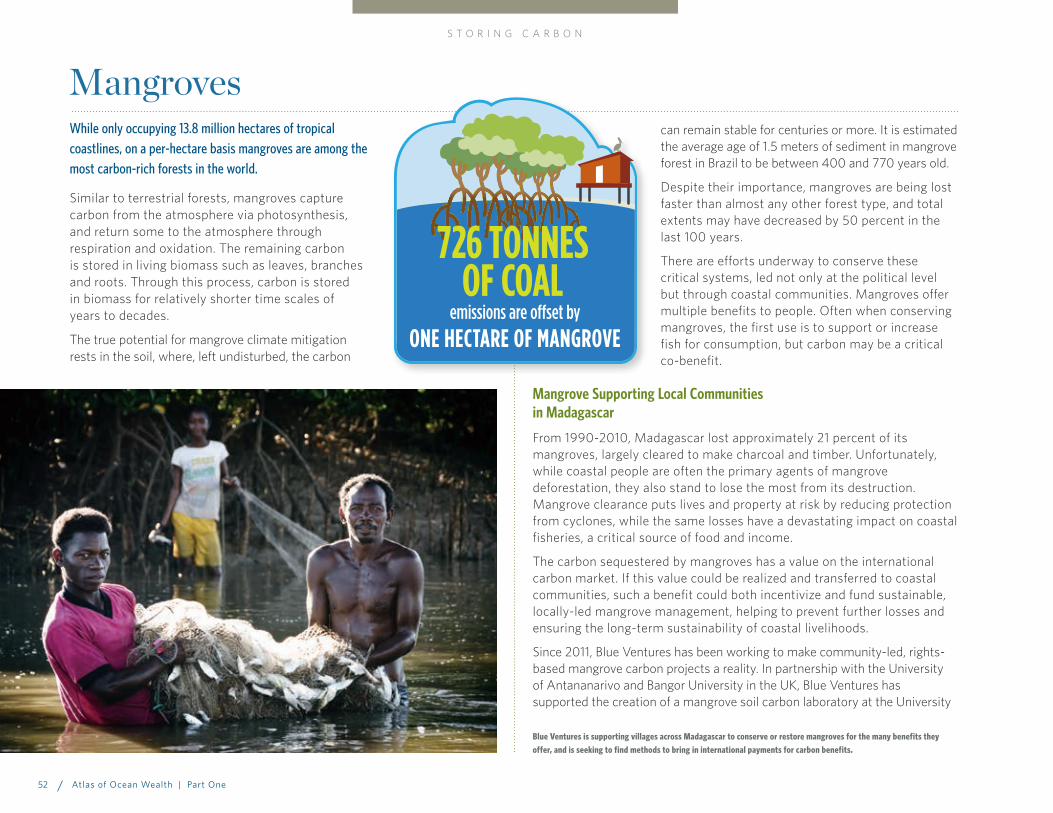
While only occupying 13.8 million hectares of tropical coastlines, on a per-hectare basis mangroves are among the most carbon-rich forests in the world.
Similar to terrestrial forests, mangroves capture carbon from the atmosphere via photosynthesis, and return some to the atmosphere through respiration and oxidation. The remaining carbon is stored in living biomass such as leaves, branches and roots. Through this process, carbon is stored in biomass for relatively shorter time scales of years to decades.
The true potential for mangrove climate mitigation rests in the soil, where, left undisturbed, the carbon
can remain stable for centuries or more. It is estimated the average age of 1.5 meters of sediment in mangrove forest in Brazil to be between 400 and 770 years old.
Despite their importance, mangroves are being lost faster than almost any other forest type, and total extents may have decreased by 50 percent in the last 100 years.
There are efforts underway to conserve these critical systems, led not only at the political level but through coastal communities. Mangroves offer multiple benefits to people. Often when conserving mangroves, the first use is to support or increase fish for consumption, but carbon may be a critical co-benefit.
Mangrove Supporting Local Communities in Madagascar
From 1990-2010, Madagascar lost approximately 21 percent of its mangroves, largely cleared to make charcoal and timber. Unfortunately, while coastal people are often the primary agents of mangrove deforestation, they also stand to lose the most from its destruction. Mangrove clearance puts lives and property at risk by reducing protection from cyclones, while the same losses have a devastating impact on coastal fisheries, a critical source of food and income.
The carbon sequestered by mangroves has a value on the international carbon market. If this value could be realized and transferred to coastal communities, such a benefit could both incentivize and fund sustainable, locally-led mangrove management, helping to prevent further losses and ensuring the long-term sustainability of coastal livelihoods.
Since 2011, Blue Ventures has been working to make community-led, rights-based mangrove carbon projects a reality. In partnership with the University of Antananarivo and Bangor University in the UK, Blue Ventures has supported the creation of a mangrove soil carbon laboratory at the University
emissions are o�set byONE HECTARE OF MANGROVE
726 TONNESOF COAL
Blue Ventures is supporting villages across Madagascar to conserve or restore mangroves for the many benefits they offer, and is seeking to find methods to bring in international payments for carbon benefits.
Mangroves S T O R I N G C A R B O N
Atlas of Ocean Wealth | Part One52

United Nations Framework Convention on Climate Change
At the Conference of Parties of the United Nations Framework Convention
on Climate Change (UNFCCC) in December 2015, 195 countries pledged to
curb climate change by keeping the global average temperature increase
to “well below” 2 degrees Celsius. This is important.
The UNFCCC may be critical in changing the way we view and address
the role of coastal wetlands for climate change. It sets the overall
mechanisms for internationally agreed greenhouse gas (GHG) reductions
measures and the details on how to monitor, and to allocate funds to
support mitigation activities.
To inform the process, technical assessments and accounting approaches
have been developed so that countries can comprehensively account
for their carbon emissions and ongoing sequestration from a variety of
sources (or sectors), including land uses and natural ecosystems.
Until the International Panel on Climate Change (IPCC) issued a 2013
Wetlands Supplement, there were no specific mechanisms to include
blue carbon in the UNFCCC. Now there are opportunities to include them
in GHG accounting and financial opportunities. For example, reducing
emissions from deforestation and forest degradation (REDD+) is an
initiative for reducing and removing GHG emissions caused by forest
loss, and is intended to provide financial aid to developing countries
to enhance forest management. In some countries, mangroves are
considered a ‘forest’ and therefore can be eligible for funding to support
REDD+ carbon offsets.
Working together, mangroves and seagrass in shallow waters off the coast of Haiti.
of Antananarivo and have trained local staff in soil analysis, and in the field inventory, enabling the quantification of carbon stored of key mangrove regions in Madagascar. Further work is now ongoing to establish further details on the nature and dynamics of carbon sequestration and fluxes.
This science, in addition to fundamental, community-led management, has formed the foundations for two mangrove projects which will generate payments to the local communities in return for mangrove conservation. Blue Ventures is maintaining strong communications with national institutions in support of potential mangrove conservation projects that will integrate into Madagascar’s national strategy to generate funds from the formal UN-supported carbon scheme (REDD+, see Box). By engaging local management associations in project planning, management and monitoring, safeguards are being put in place to ensure coastal communities participate meaningfully in blue carbon and gain an equitable share of the benefits.
For more information: blueventures.org
Storing Carbon 53
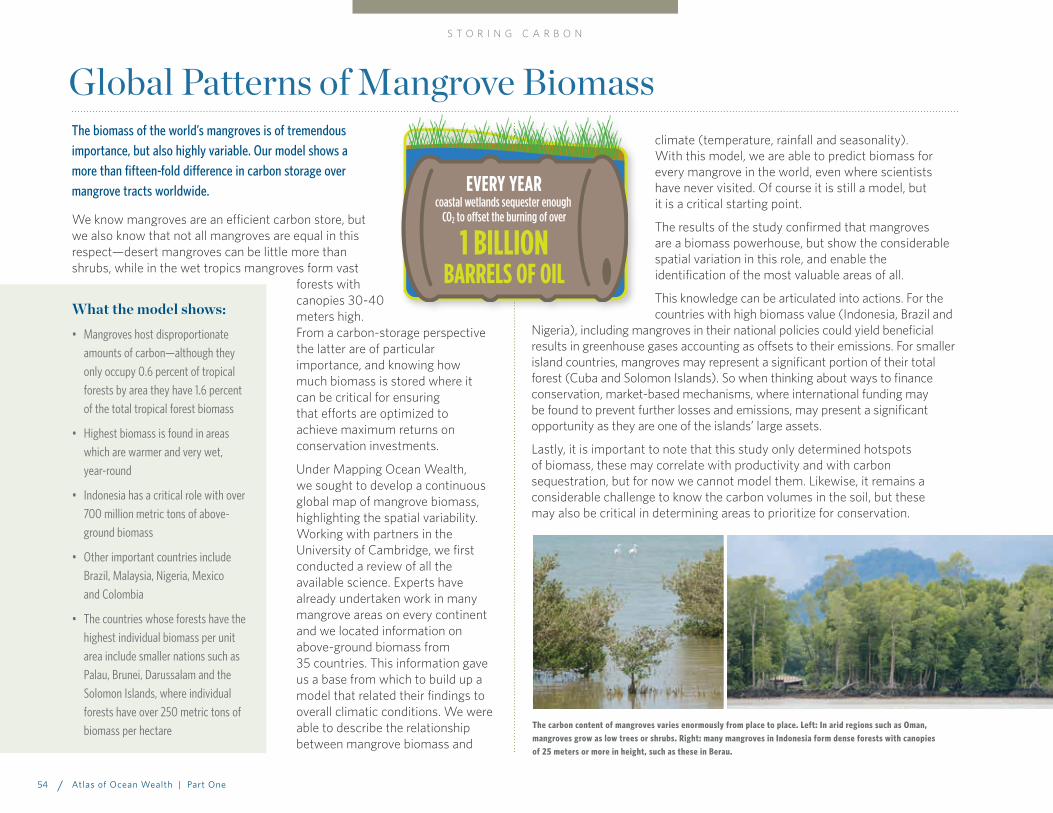
The biomass of the world’s mangroves is of tremendous importance, but also highly variable. Our model shows a more than fifteen-fold difference in carbon storage over mangrove tracts worldwide.
We know mangroves are an efficient carbon store, but we also know that not all mangroves are equal in this respect—desert mangroves can be little more than shrubs, while in the wet tropics mangroves form vast
forests with canopies 30-40 meters high. From a carbon-storage perspective the latter are of particular importance, and knowing how much biomass is stored where it can be critical for ensuring that efforts are optimized to achieve maximum returns on conservation investments.
Under Mapping Ocean Wealth, we sought to develop a continuous global map of mangrove biomass, highlighting the spatial variability. Working with partners in the University of Cambridge, we first conducted a review of all the available science. Experts have already undertaken work in many mangrove areas on every continent and we located information on above-ground biomass from 35 countries. This information gave us a base from which to build up a model that related their findings to overall climatic conditions. We were able to describe the relationship between mangrove biomass and
climate (temperature, rainfall and seasonality). With this model, we are able to predict biomass for every mangrove in the world, even where scientists have never visited. Of course it is still a model, but it is a critical starting point.
The results of the study confirmed that mangroves are a biomass powerhouse, but show the considerable spatial variation in this role, and enable the identification of the most valuable areas of all.
This knowledge can be articulated into actions. For the countries with high biomass value (Indonesia, Brazil and
Nigeria), including mangroves in their national policies could yield beneficial results in greenhouse gases accounting as offsets to their emissions. For smaller island countries, mangroves may represent a significant portion of their total forest (Cuba and Solomon Islands). So when thinking about ways to finance conservation, market-based mechanisms, where international funding may be found to prevent further losses and emissions, may present a significant opportunity as they are one of the islands’ large assets.
Lastly, it is important to note that this study only determined hotspots of biomass, these may correlate with productivity and with carbon sequestration, but for now we cannot model them. Likewise, it remains a considerable challenge to know the carbon volumes in the soil, but these may also be critical in determining areas to prioritize for conservation.
What the model shows:• Mangroves host disproportionate
amounts of carbon—although they only occupy 0.6 percent of tropical forests by area they have 1.6 percent of the total tropical forest biomass
• Highest biomass is found in areas which are warmer and very wet, year-round
• Indonesia has a critical role with over 700 million metric tons of above-ground biomass
• Other important countries include Brazil, Malaysia, Nigeria, Mexico and Colombia
• The countries whose forests have the highest individual biomass per unit area include smaller nations such as Palau, Brunei, Darussalam and the Solomon Islands, where individual forests have over 250 metric tons of biomass per hectare The carbon content of mangroves varies enormously from place to place. Left: In arid regions such as Oman,
mangroves grow as low trees or shrubs. Right: many mangroves in Indonesia form dense forests with canopies of 25 meters or more in height, such as these in Berau.
Global Patterns of Mangrove Biomass
1 BILLIONBARRELS OF OIL
coastal wetlands sequester enough CO2 to o�set the burning of over
EVERY YEAR
S T O R I N G C A R B O N
Atlas of Ocean Wealth | Part One54

The living, above-ground biomass of the world’s mangroves is highly variable. In our models, we showed a range from under 30 to over 280 metric tons per hectare. Highest biomass is found in areas which are warm and wet, year-round.
Patterns in Mangrove Biomass Worldwide
1 2 3 4 5 6 7 8 9 10
MODELED FISH BIOMASS
HIGHESTLOWESTLOWEST (<50 TONNES/HA) (>250 TONNES/HA) HIGHEST
MANGROVE ABOVE GROUND BIOMASS
Storing Carbon 55

The Value of VisitorsTravel and tourism are worth over nine percent of global GDP and support over 100 million jobs—one of the world’s largest industries.
Within the industry, coastal tourism is one of the largest components.
ature plays a direct role in drawing visitors to the world’s coasts. Coastal ecosystems generate clean, calm water, pristine beaches, superlative
seafood and stunning vistas. Many visitors come for nature-based tourism, such as fishing, snorkeling on coral reefs or whale-watching. Others come to enjoy the less-direct benefits of swimming in calm waters, or lying on white sandy beaches. By accurately differentiating and assessing the value of these benefits, it will be far easier to encourage this industry to safeguard its own future, alongside building increased levels of protection for nature.
Within this study we differentiate two broad categories of coastal tourism—nature-dependent tourism and nature-based tourism.
N Nature-dependent tourism includes all tourism that depends on natural ecosystems to provide key benefits.
Much of this dependency is overlooked, or taken for granted. Thousands of popular tropical beaches are
dependent on nearby coral reefs, which provide sand and turquoise waters and which break the incoming waves, creating calm clear waters. Elsewhere, water quality is widely enhanced by filtering and microbial cleansing linked to saltmarshes, mangroves and oyster reefs. Even the rich seafood enjoyed by millions of travelers
depends on the health of the ecosystems nearby.
Better understood are the benefits from nature-based tourism, which are more directly reliant on healthy
ecosystems. Here, activities include wildlife watching, boating in natural habitats, fishing and scuba-diving. One study
estimated that some 121 million people worldwide took part in at least some of these activities (not including boating) in 2003, a number which by now surely has grown considerably.
Recreational fishing is heavily dependent on the presence of healthy ecosystems. If well-managed, such fishing can be sustainable, while also generating much greater benefits to local communities than commercial fishing. For example, fly fishing for bonefish, permit and tarpon is regarded as one of the premium classes of sport fishing. It depends specifically on the presence of calm “flats,” or shallow water areas linked to seagrass or mangrove areas. Such fishing was estimated to be worth US$56.5 million to Belize alone in 2007 and US$141 million to the Bahamas in 2008.
Scuba-diving is another leading form of nature-based marine tourism. Some 6 million people are regular divers worldwide, but many more try diving as a one-off holiday activity, and many others consider the potential for diving when weighing potential travel destinations.
in the Caribbean Islands –1 in 10 Residents
2,000,000 PEOPLE directly employs
TOURISM
Tourists from around the world penguin-watching in Cape Town, South Africa.
56 Atlas of Ocean Wealth | Part One

Top: Exploring a mangrove nature reserve in Java, Indonesia. Right: Divers in the Cabo Pulmo Marine National Park, Gulf of California, Mexico. This remarkable Park was closed off to all fishing with the support of the adjacent fishing village and it has become one of the world’s top diving destinations, generating far greater incomes for the former fishing community.
Tourists choose their destinations for many different reasons, ranging from climate and sandy coasts, to cuisine and culture, to history to nature-based activities. The “dependence” on nature varies between tourists, but ecosystems help to form the land and seascapes on which many of them, consciously or unconsciously, have come to enjoy.
Mapping nature-dependent tourism presents novel challenges. Value is not solely driven by ecology, but by a complex interaction of history, culture, infrastructure, politics and economics. The development of predictive models is therefore challenging, but at the same time, vast amounts of data—from government statistics to hotel and airline data—are available to support the development of actual maps of use and value.
Under Mapping Ocean Wealth, we have also been able to work with others on novel approaches to draw information from social media and crowd-sourced databases to provide indicators of tourist activities. Billions of photographs and traveler experiences can be found via social media, providing geographically located information about the places that people visit. Elsewhere, specialist datasets are being compiled by special interest groups such as scuba divers. We have used a variety of these to develop unique approaches to map nature-dependent tourism at global scales.
The Value of Visitors 57

Over 350 million people annually travel to the coral reef coasts of the world. Many come to snorkel or scuba dive and view nature directly, while others are drawn by the by-products of reefs—calm seas, turquoise waters, bright white-sand beaches and healthy seafood.
Coral reefs are the poster-child of nature-based tourism. Many come specifically to visit the reefs themselves, to swim over shimmering gardens of coral amongst hordes of fish, but many more are unknowing beneficiaries of the reefs as producers of sand, coastal protection, food and remarkable vistas. Their travels support whole industries—hotels, shops, tours, airlines, and supply chains to cater to their needs, from dive equipment to food supply.
Our global map of coastal tourism in the tropics is built from a unique and highly innovative approach in which we pulled together multiple large datasets and used them to build, correct and refine one another. Our starting point was national statistics on tourist arrivals and spending, including both national and international tourists and visitors. Our first stage was to separate out the coastal component of these numbers. To do this, we used two large datasets to understand the spread of visitors: data from over 125,000 hotels, including location and hotel size, and the geographic location of photographs uploaded onto the social media site, Flickr. These two layers both provide independent estimates for visitation and use. We used them, along with the coral reef map, to filter the national tourism statistics, and to capture only those areas away from large towns and cities, within two kilometers of the coast and within 30 kilometers of a coral reef.
Clearly only part of the tourism close to coral reefs is linked to the reefs. We conservatively assigned 10 percent of this tourism expenditure to what we called “reef adjacent” tourism. This is the “added value” we consider that reefs bring through the provision of calm water, white-sand beaches, top seafood and beautiful views. We then sought to develop an estimate focused specifically on the “on-reef” tourism. This is the direct “use” of reefs, primarily for diving and snorkeling. We estimated this using two further datasets: the location of dive shops/centers and the location of underwater photographs on Flickr. Both, independently, help us to approximate the amount of “on-reef” activities. Where there are higher numbers of dive centers per hotel, or where underwater photos make up a higher proportion of all photos, then we can
Coral Reefs
infer that diving and snorkeling will be an important part of the tourism agenda.
The final stage of the mapping work was to link the values of the two components of tourism back out to the reefs that provide this value. To do this, we used a combination of proximity measures (for the reef-adjacent values) and direct-use locations derived from both the underwater photos and from a large crowd-sourced dataset of dive sites worldwide.
The results show many reefs (about 70 percent of the world total) are likely not important for coral-reef tourism, but that elsewhere the values are highly variable. Many leading coral-reef tourism destinations are developing economies such as the Solomon Islands, Fiji, Belize and Honduras. Many are also small island nations with few other economic alternatives. For them, reef tourism is a lifeline, giving a critical boost to local economies.
What the model shows:• Tourism is widespread in 102 of the
117 countries and territories with coral reefs
• Only about 30 percent of all the world’s coral reefs are generating reef tourism values, with many others being too remote and not being accessed even by live-aboard dive vessels
• The global value of such reef tourism is estimated at US$37.8 billion each year
• There are 26 territories that derive more than a quarter of their total GDP from tourism, including many small island states such as the Maldives, Solomon Islands, Palau and the Comoros
drive up to
$30 BILLION
CORAL REEFS
per year globallyin tourism revenue
The frenzy of life and color on a coral reef is a magnet for first-time and seasoned divers and snorkelers all over the world.
T H E V A L U E O F V I S I T O R S
58 Atlas of Ocean Wealth | Part One
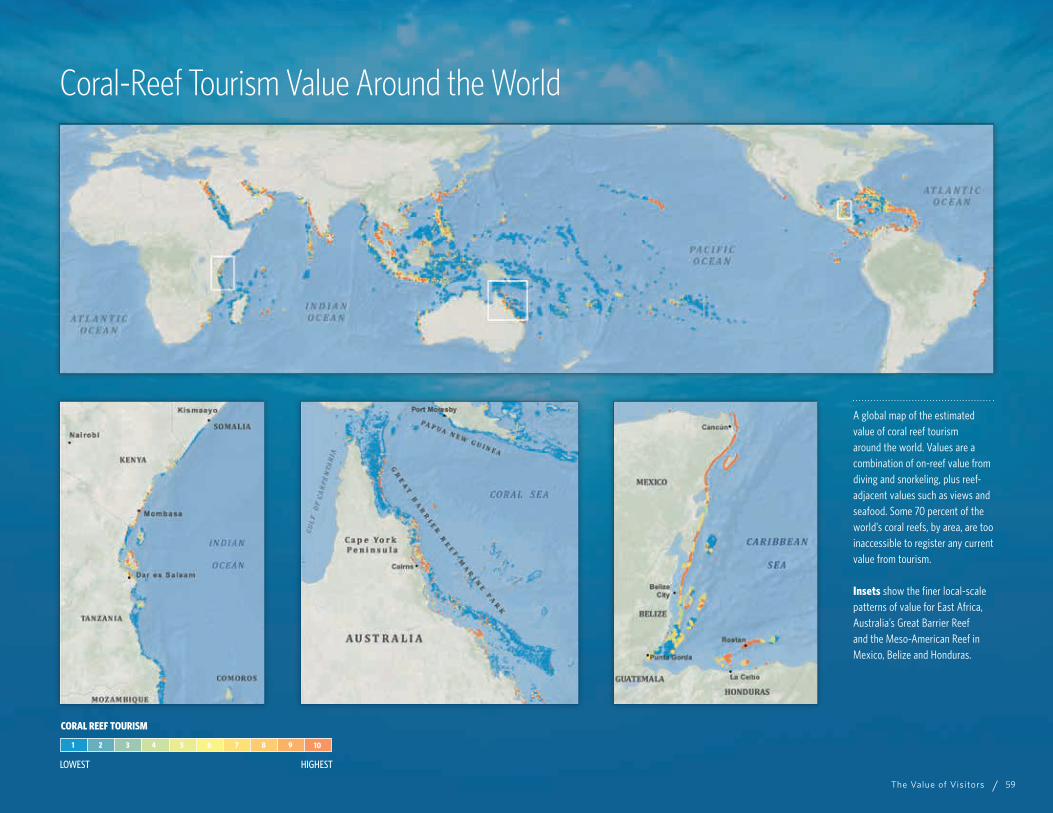
A global map of the estimated value of coral reef tourism around the world. Values are a combination of on-reef value from diving and snorkeling, plus reef-adjacent values such as views and seafood. Some 70 percent of the world’s coral reefs, by area, are too inaccessible to register any current value from tourism.
Insets show the finer local-scale patterns of value for East Africa, Australia’s Great Barrier Reef and the Meso-American Reef in Mexico, Belize and Honduras.
Coral-Reef Tourism Value Around the World
1 2 3 4 5 6 7 8 9 10
MODELED FISH BIOMASS
HIGHESTLOWESTLOWEST HIGHEST
CORAL REEF TOURISM
The Value of Visitors 59

Mangrove forests are often overlooked as tourist attractions, but we have mapped some 2,000 attractions and operators in 86 countries worldwide where people come for boating, fishing, hiking and nature watching.
Mangrove forests might not be at the forefront of attention when it comes to tourism. Some, at least, have a reputation for both biting insects and thick mud, but there is another vision of mangroves which is quite different. Every day thousands of visitors
crisscross mangroves all around the world, following boardwalks, taking guided boat tours, or in kayaks. They see manatees and alligators in the Florida Everglades; proboscis monkeys in Borneo; crocodiles, deer and sometimes even tigers in the Sundarbans. Can Gio mangroves near Ho Chi Minh City in Viet Nam host over 500,000 visitors a year. Every evening, boats head out to see the arrival of roosting scarlet ibis in Trinidad’s Caroni swamp, or to witness fireflies in Southeast Asia, or the bioluminescence in Puerto Rico.
Recreational fishers are equally drawn to mangrove forests. In Australia, barramundi and mangrove jacks are among the most sought-after recreational fishing targets. In the Caribbean, the best fishing guides are paid US$200 per day or more to take fly fishers out into the
“flats” among the mangrove and seagrass to catch bonefish, permit or tarpon. These recreational fisheries depend on wilderness, and on healthy mangroves, but they also create considerable economic incentives to look after mangroves and the waters around them.
For our initial work on mapping, we turned to the popular travel website, TripAdvisor, to search for mangrove related “attractions.” A key part of our interest in using TripAdvisor was to look beyond simply where people are visiting these ecosystems to explore what they might be doing there. We were able, for example, to call out reviews of attractions that contained keywords such as boardwalk, visitor center, kayaking and so on.
While mangrove tourism is unlikely to compete with some of the larger mass-tourism attractions, this initial work provides a critical caution to coastal developers, and highlights potential opportunities. Mangroves have many values and adding tourism to the list may help countries to secure a future for a habitat that also feeds, protects and stores carbon.
What the model shows:• Some 2,000 attractions in the
English TripAdvisor web-pages include mangroves. From these, we searched over 150,000 user reviews. Several hundred additional sites are still to be logged from non-English TripAdvisor sites
• These attractions are found across 86 countries
• Boat trips are a feature in over 1,600 attractions (78 countries) with kayaking mentioned in 784 (59 countries)
• Boardwalks are listed in over 230 attractions (33 countries), and lookout towers in 140 (30 countries)
• 75 percent of analyzed reviews of mangrove attractions give a 5-star rating
Tourism: A threat and a promiseTourism isn’t always a good thing. The impact of tourism on nature can be considerable. Hotel development has destroyed wide areas of mangrove forests or sensitive beach vegetation. Marinas and cruise ports have destroyed offshore habitats. Incomplete sewage treatment pollutes coastal waters. Travel itself is a potent sources of greenhouse gas emissions.
Even nature-based tourism can be damaging. Overfishing leads to poorer fishing for future visitors. Harassment of marine mammals or turtles can affect their behavior, reducing their feeding or breeding success. Anchor damage can destroy corals or carve up seagrass beds.
It is against this backdrop that the concept of sustainable tourism becomes critical. While tourism can cause harm, it doesn’t need to. Where tourism can be made sustainable it can enhance visitor experiences and generate long-term security for local populations. Furthermore, tourists are often highly supportive of additional charges, such as park entrance fees when these are clearly going to support conservation.
Developing a clearer understanding of the specific local value of nature-dependent tourism, and of the role of nature even in mainstream tourism is critical. It will help shape both industry and government attitudes and investments, and ensure tourism is placed on a sustainable footing. That way, tourism becomes a part of the solution, not an additional threat.
Mangrove Forests
MANGROVEScontributes
per year toward Florida’s economy$1 BILLION
Recreational fishing around
T H E V A L U E O F V I S I T O R S
60 Atlas of Ocean Wealth | Part One
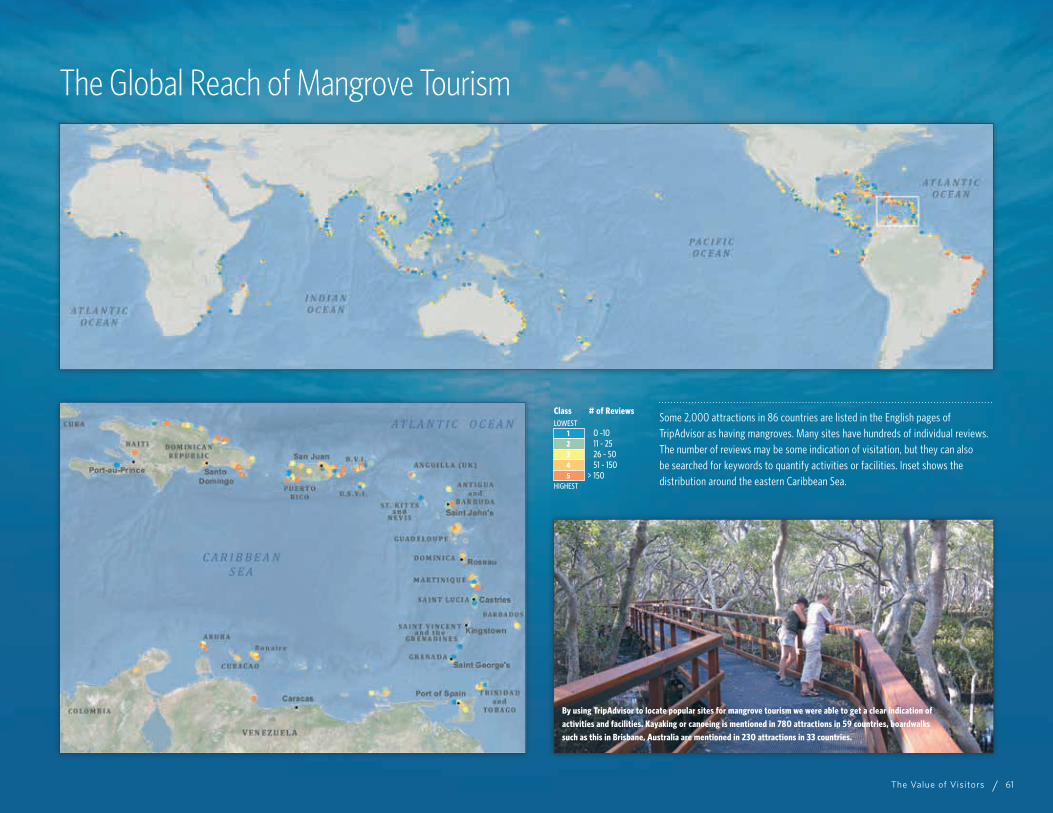
Some 2,000 attractions in 86 countries are listed in the English pages of TripAdvisor as having mangroves. Many sites have hundreds of individual reviews. The number of reviews may be some indication of visitation, but they can also be searched for keywords to quantify activities or facilities. Inset shows the distribution around the eastern Caribbean Sea.
The Global Reach of Mangrove Tourism
>
0 -1011 - 2526 - 5051 - 150150
12345
Class # of ReviewsLOWEST
HIGHEST
By using TripAdvisor to locate popular sites for mangrove tourism we were able to get a clear indication of activities and facilities. Kayaking or canoeing is mentioned in 780 attractions in 59 countries, boardwalks such as this in Brisbane, Australia are mentioned in 230 attractions in 33 countries.
The Value of Visitors 61
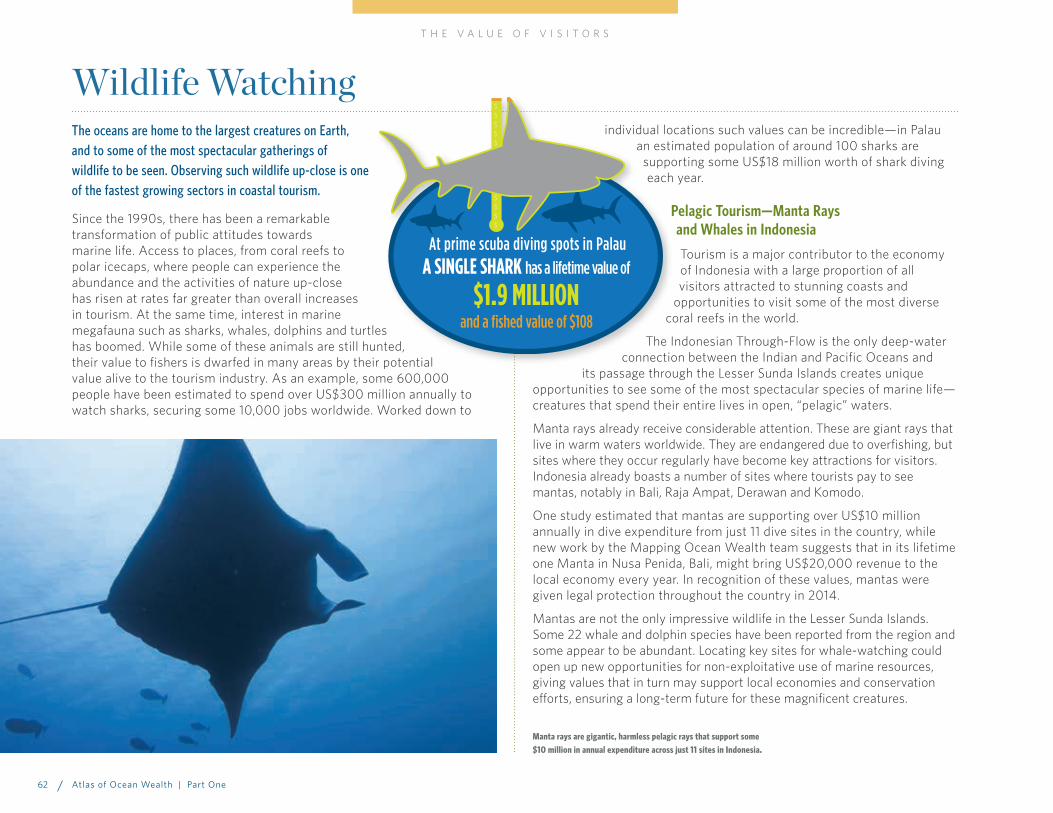
The oceans are home to the largest creatures on Earth, and to some of the most spectacular gatherings of wildlife to be seen. Observing such wildlife up-close is one of the fastest growing sectors in coastal tourism.
Since the 1990s, there has been a remarkable transformation of public attitudes towards marine life. Access to places, from coral reefs to polar icecaps, where people can experience the abundance and the activities of nature up-close has risen at rates far greater than overall increases in tourism. At the same time, interest in marine megafauna such as sharks, whales, dolphins and turtles has boomed. While some of these animals are still hunted, their value to fishers is dwarfed in many areas by their potential value alive to the tourism industry. As an example, some 600,000 people have been estimated to spend over US$300 million annually to watch sharks, securing some 10,000 jobs worldwide. Worked down to
individual locations such values can be incredible—in Palau an estimated population of around 100 sharks are
supporting some US$18 million worth of shark diving each year.
Pelagic Tourism—Manta Rays and Whales in Indonesia
Tourism is a major contributor to the economy of Indonesia with a large proportion of all visitors attracted to stunning coasts and
opportunities to visit some of the most diverse coral reefs in the world.
The Indonesian Through-Flow is the only deep-water connection between the Indian and Pacific Oceans and
its passage through the Lesser Sunda Islands creates unique opportunities to see some of the most spectacular species of marine life—creatures that spend their entire lives in open, “pelagic” waters.
Manta rays already receive considerable attention. These are giant rays that live in warm waters worldwide. They are endangered due to overfishing, but sites where they occur regularly have become key attractions for visitors. Indonesia already boasts a number of sites where tourists pay to see mantas, notably in Bali, Raja Ampat, Derawan and Komodo.
One study estimated that mantas are supporting over US$10 million annually in dive expenditure from just 11 dive sites in the country, while new work by the Mapping Ocean Wealth team suggests that in its lifetime one Manta in Nusa Penida, Bali, might bring US$20,000 revenue to the local economy every year. In recognition of these values, mantas were given legal protection throughout the country in 2014.
Mantas are not the only impressive wildlife in the Lesser Sunda Islands. Some 22 whale and dolphin species have been reported from the region and some appear to be abundant. Locating key sites for whale-watching could open up new opportunities for non-exploitative use of marine resources, giving values that in turn may support local economies and conservation efforts, ensuring a long-term future for these magnificent creatures.
Wildlife Watching$$$$$$$$$$$$$$
A SINGLE SHARK has a lifetime value ofAt prime scuba diving spots in Palau
and a fished value of $108$1.9 MILLION
Manta rays are gigantic, harmless pelagic rays that support some $10 million in annual expenditure across just 11 sites in Indonesia.
T H E V A L U E O F V I S I T O R S
62 Atlas of Ocean Wealth | Part One
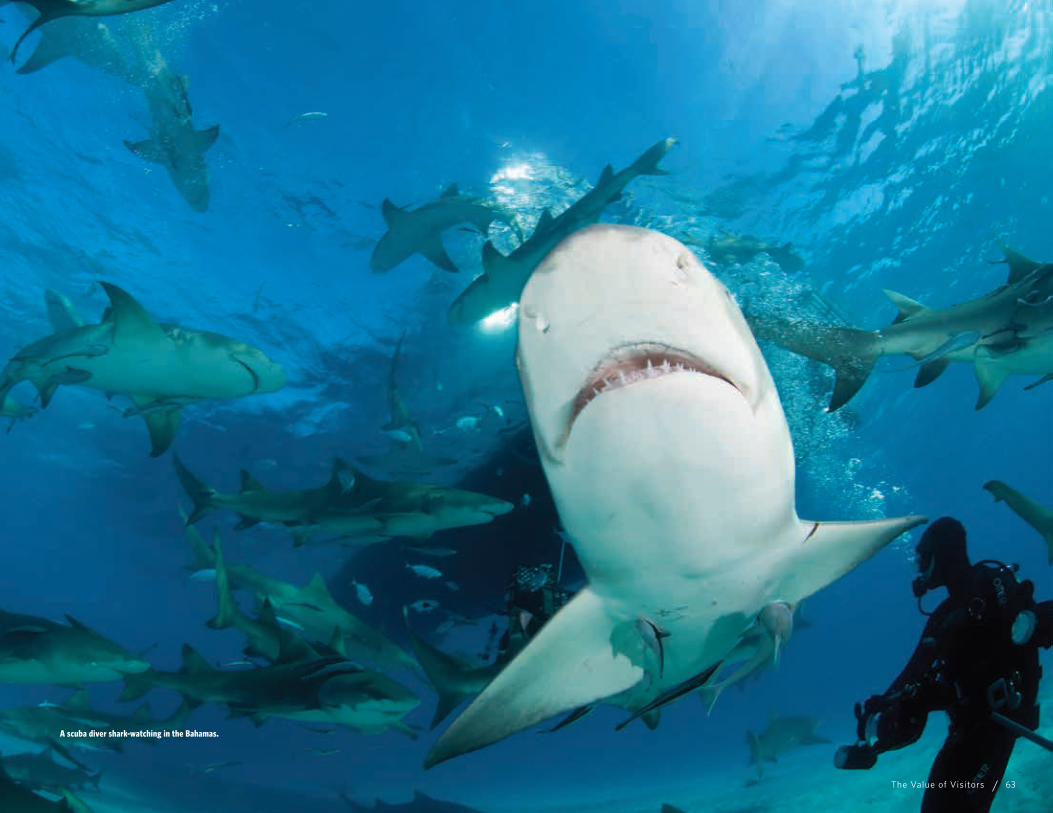
A scuba diver shark-watching in the Bahamas.
The Value of Visitors 63

Ecotourism in Baja California
Across Mexico, 29 million tourists a year help provide over 2 million jobs. Coastal tourism predominates, and the coasts around the Gulf of California and Baja California Peninsula are a key destination, receiving 3.8 million visitors annually.
The Mapping Ocean Wealth team in Mexico, in collaboration with partners in the University of British Columbia, quantified the importance of nature-based tourism in this region, combining data from national and local governments with new information gathered through interviews with tour operators and the tourists themselves. This region is renowned for its coastal and marine ecosystems with remarkable diving and snorkelling, game-fishing, kayaking and wildlife watching opportunities. Abundant marine life includes iconic whale nurseries, sea lions, whale sharks and pelagic fish.
Based on initial analyses, we have found that the region supports nearly 900,000 nature-based visitors a year, generating over half a billion
US dollars. We recorded over 250 nature-based tourism operators, employing more than 3,500 people, but, of course, such numbers account for only a small part of the social and economic influence of this tourism, which certainly also supports hotels, restaurants, shops, as well as the maintenance of infrastructure, boat-building and more. Nature-based tourism reaches its greatest share of the market in the south of the region where is supports some 60 percent of total spending.
What the model shows:• The region supports nearly 900,000
nature-based visits a year generating over half-a-billion US dollars
• There are some 256 registered nature-based tour operators supporting 3,575 direct jobs
• Specifically, in the state of Baja California Sur, nature-based tourism supports 136 operators, over 2,000 direct jobs, and 60 percent of total expenditures (US$314 million per year)
• The list of species considered most important by the tour operators includes sea lions, whale sharks, marlin, grey whales, dorado, dolphins and jacks
T H E V A L U E O F V I S I T O R S
Great whales, including humpback whales (pictured) and gray whales, gather in large numbers each year on the Pacific coast of Baja California, and now support a large whale-watching industry.
64 Atlas of Ocean Wealth | Part One

Annual expenditure on nature-based tourism in the Gulf of California and Baja California Peninsula. While there is some spending almost everywhere, the greatest concentration is in the south of the region where sport-fishing, diving and whale-watching are all major attractions for international visitors.
Estimated Annual Expenditure on Nature-Based Tourism
ECOTOURISM EXPENDITURE(US$ million)
< 1
1 - 5
5 - 10
10 - 15
15 - 25
25 - 50
50 - 100
> 100
!
!
!
!
!
!
!
!
A boat load of tourists explore the rugged coast of Mexico's Isla Espiritu Santo in the Gulf of California off the state of Baja California Sur.
The Value of Visitors 65

The Value of Just Being ThereThe value of nature to people cannot always be easily quantified in dollars, jobs, yields or visitor numbers. A whole suite of benefits exist that are
deeply important—culturally, spiritually, even scientifically—but which remain hard to quantify or value.
mong the most challenging ecosystem services to describe, and indeed to account for, are a set of values that have variously been described as “non-use”, “existence” or “intrinsic” values. These are values that people
clearly ascribe to an ecosystem, although they may never directly use or benefit from them. Such values can be easily overlooked. Other times they are given partial consideration when they have some level of measurable metric, from health benefits to options for future use. But at its core the idea of existence values embraces much more: from cultural and spiritual inspiration, to the “right” to existence of other life, to the wonder and interest associated with the complexity of life and the functions and interactions of ecosystems.
A Cultural and Spiritual Value
The cultural importance of nature is widely held, and can be seen in the support for key places and species. Iconic places, such as the Great Barrier Reef or the Galapagos Islands, have a place in a globally recognized heritage, as have many marine species: whales and dolphins, seahorses, sharks and myriad others. This association runs throughout human history—from rock art and paintings from Easter Island, Baja California and Australia to the marine creatures adorning the vases of the ancient Greeks and the frescoed tombs of Egyptian pharaohs.
In many traditional societies, nature is simply part of life and culture, accepted and embedded into all aspects of living and celebrated in song, dance, story, dress and so much more. In more modern cultures, experiences of nature can be more remote, but the place of nature is still strong as inspiration in art and songs, books and broadcasting, and in symbols, logos, mascots and much more.
Few may get to see dugongs or dolphins, or to visit the famed shores of tropical reefs, but they still have a place in our minds and our world views. In perhaps a light-hearted attempt to quantify this place for the oceans in our cultural life, one study found some 15,000 popular songs that give reference to coral reefs or atolls, with over 15 million downloads between them from 2003 to 2014. While such a quantification may sound more amusing than serious, it points to a deep place for nature entering into the hearts and minds, even of people quite disconnected from nature.
Respect and love of nature form an integral part of most of the world’s faiths and creeds. In a few cases, a clear and tight linkage is found to holy or spiritual places. In marine settings it is perhaps best exemplified in the tabu areas observed in many traditional Pacific cultures, but it is more widely expressed through broader attitudes to nature. Respect for all living creatures is foremost in the preaching of many in Hindu and Buddhist traditions. In 2014 Pope Francis, together with fellow Christian
Traditional leaders from Kofiau Island, Raja Ampat give offerings to the gods and goddesses of the ocean to guard the sea through a ritual called Kakes. This was held after a ceremony where the Kofiau traditional elders gave a support letter to the Raja Ampat government declaring the zoning system for the Kofiau Marine Protected Area.
Atlas of Ocean Wealth | Part OneAtlas of Ocean Wealth66

leaders from the Orthodox churches led a powerful call for respect for nature in the Papal Encyclical Laudato Si. They made it clear that, for over a billion Christians worldwide, it is a moral imperative to care for nature, not a choice or a luxury. In part this exhortation is linked to the recognition that many of the world’s poorest suffer as their environment is degraded, hence a clear link to ecosystem services.
But for these and many others it is not simply a requirement, or a duty to care for nature. They also draw inspiration from nature—this is clearly expressed in holy scriptures, but should also be experienced firsthand. The lives of all are enriched by nature, and it is held that believers can experience or
come close to God or divinity in the created realm of nature, which can, in turn, support faith and enrich lives.
Many people without any clear adherence to a specified religious faith share similar views on the importance of nature, or of the rights of animals, species, ecosystems or natural processes simply to exist. Indeed, such existence values are considered to hold, whether these species or ecosystems are observed or even beneficial to humans in any way at all. A large elephant seal in Northern California.
The aesthetic, cultural or spiritual values of the ocean can be hard to quantify, but few would deny their importance.
Alongside spiritual and cultural values, there is a strong sense of the value of nature for health and well-being. A part of this array of values is perhaps captured in studies such as ours of the recreational uses of nature. Likewise, a small but growing number of studies are also showing the considerable health benefits of nature. Much has focused on proximity to green-space and parks, but the sea is equally important. One UK study, for example, showed that individuals living near the coast are generally healthier and happier than those living inland. This effect was strongest in more deprived coastal communities and so was not a simple function of wealth and health being linked to expensive coastal properties.
The Value of Just Being There 67

In contrast to the efforts to model and map spiritual and cultural values, the science behind understanding the value of nature in terms of biodiversity is a relatively advanced field.
Biodiversity refers to the variety of life on Earth—and it is highlighted, often alongside ecosystem services as a target for conservation attention in many international agreements such as the Convention on Biological Diversity. Simple interpretations of the term typically use species as units of value and the sum of species as a quantification of biodiversity. Importance is thus often assigned to areas with the most species, but many modifications can and have been added to such approaches—notably through prioritizing places across a framework of biogeographic patterns, and thus enabling important areas to be spread and to cover a much greater total number of species. Others have drawn attention to rarity or to endemism, pointing out that threatened species or those with very restricted distributions, may be in greater need.
The conservation community has directed further attention to other aspects of natural ecosystems, including functional values such a productivity, and to measures of naturalness, or wilderness. Given the range of possible measures for natural importance, there has been a clear move in the conservation community to combine and interpret these measures.
The World Wildlife Fund took the lead in identifying a number of the world’s most important ecoregions for conservation in their list of the Global 200 Ecoregions, including 43 marine and coastal ecoregions based on richness or endemism of species or higher taxa, unusual ecological or evolutionary phenomena, and the global rarity the main habitat types.
Such approaches have been given broader backing under the Convention on Biological Diversity (CBD) The Secretariat of the CBD has facilitated the description of areas meeting the scientific criteria for ecologically or biologically significant marine areas (EBSAs), through the organization of a series of regional workshops, in collaboration with countries and other organizations. Since 2011, twelve regional workshops on EBSAs have been organized for most of the world’s ocean areas (nearly 74 percent by area), both within and beyond national jurisdictions, with most remaining areas to be covered in near future.
Top: Waved Albatross on Espanola Island, the sole breeding location for this critically endangered species in Galapagos Islands. Below: The Aldabra sacred ibis in the mangroves of Aldabra atoll, a blue-eyed endemic sub-species found only on this remote coral atoll, in the Seychelles.
Scientific Value—Biodiversity and BeyondT H E V A L U E O F J U S T B E I N G T H E R E
68 Atlas of Ocean Wealth | Part One
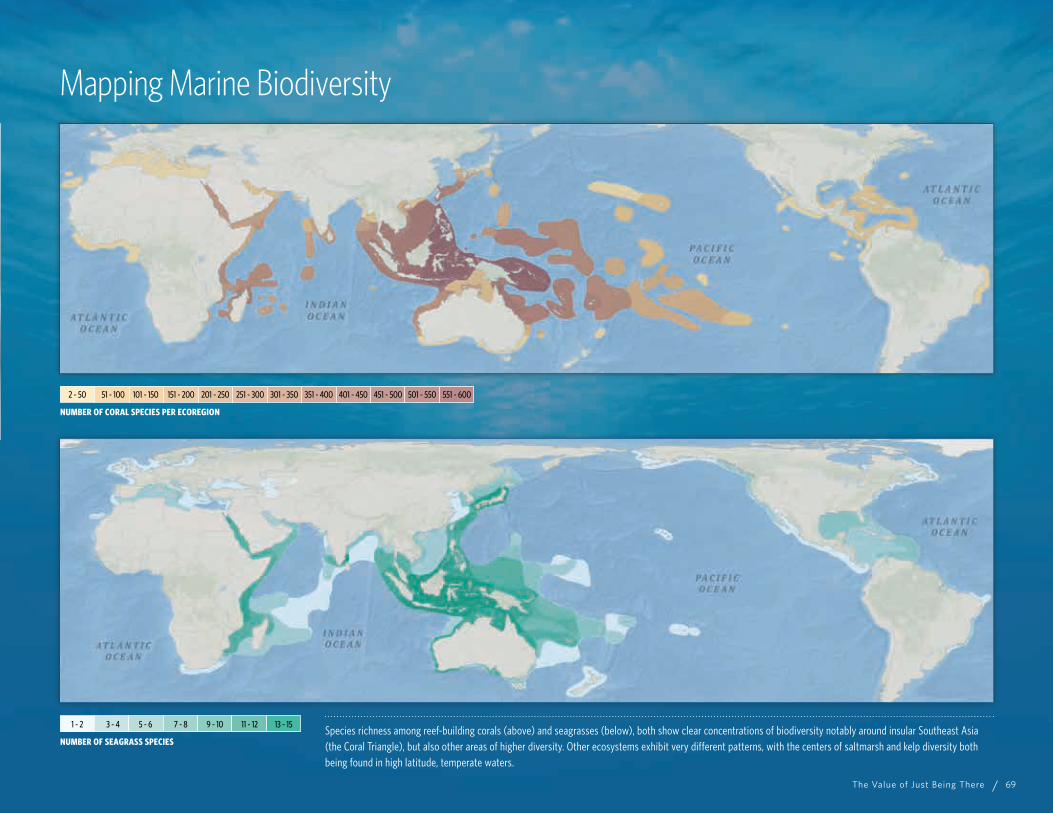
Species richness among reef-building corals (above) and seagrasses (below), both show clear concentrations of biodiversity notably around insular Southeast Asia (the Coral Triangle), but also other areas of higher diversity. Other ecosystems exhibit very different patterns, with the centers of saltmarsh and kelp diversity both being found in high latitude, temperate waters.
Mapping Marine Biodiversity
2 - 50 551 - 600501 - 550451 - 500401 - 450351 - 400301 - 350251 - 300201 - 250151 - 200101 - 15051 - 100
NUMBER OF CORAL SPECIES PER ECOREGION
1 - 2 13 - 1511 - 129 - 107 - 85 - 63 - 4
NUMBER OF SEAGRASS SPECIES
The Value of Just Being There 69
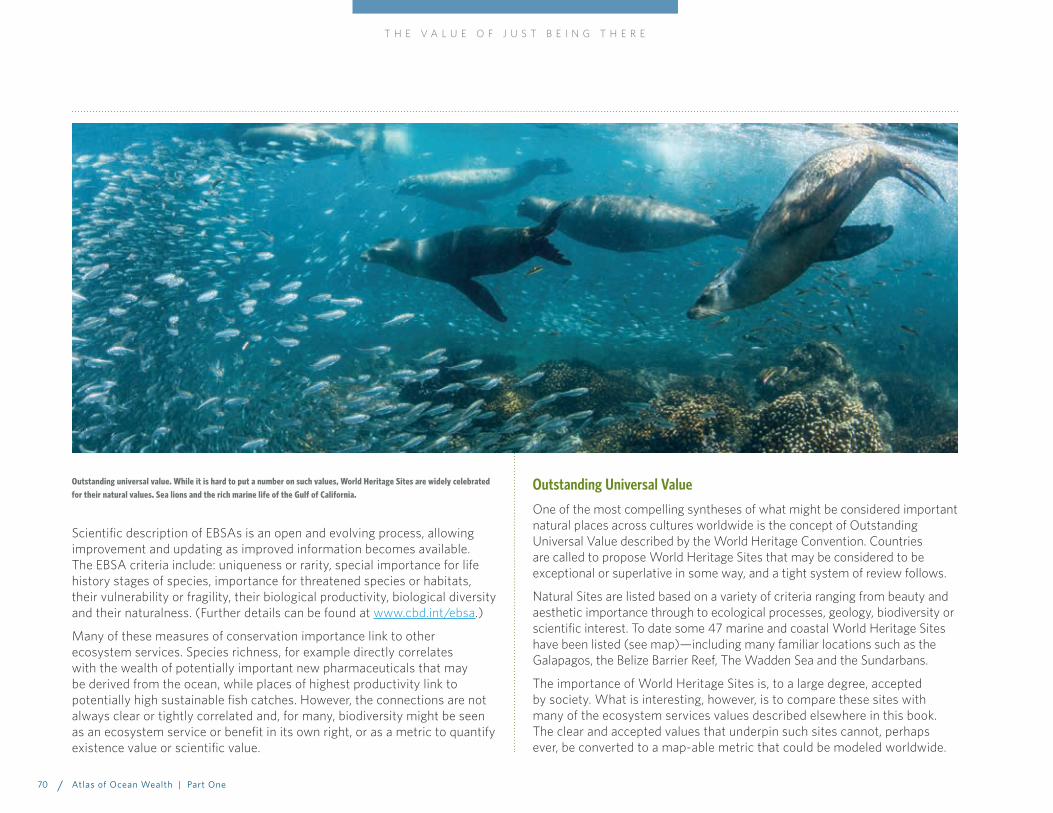
Scientific description of EBSAs is an open and evolving process, allowing improvement and updating as improved information becomes available. The EBSA criteria include: uniqueness or rarity, special importance for life history stages of species, importance for threatened species or habitats, their vulnerability or fragility, their biological productivity, biological diversity and their naturalness. (Further details can be found at www.cbd.int/ebsa.)
Many of these measures of conservation importance link to other ecosystem services. Species richness, for example directly correlates with the wealth of potentially important new pharmaceuticals that may be derived from the ocean, while places of highest productivity link to potentially high sustainable fish catches. However, the connections are not always clear or tightly correlated and, for many, biodiversity might be seen as an ecosystem service or benefit in its own right, or as a metric to quantify existence value or scientific value.
Outstanding Universal Value
One of the most compelling syntheses of what might be considered important natural places across cultures worldwide is the concept of Outstanding Universal Value described by the World Heritage Convention. Countries are called to propose World Heritage Sites that may be considered to be exceptional or superlative in some way, and a tight system of review follows.
Natural Sites are listed based on a variety of criteria ranging from beauty and aesthetic importance through to ecological processes, geology, biodiversity or scientific interest. To date some 47 marine and coastal World Heritage Sites have been listed (see map)—including many familiar locations such as the Galapagos, the Belize Barrier Reef, The Wadden Sea and the Sundarbans.
The importance of World Heritage Sites is, to a large degree, accepted by society. What is interesting, however, is to compare these sites with many of the ecosystem services values described elsewhere in this book. The clear and accepted values that underpin such sites cannot, perhaps ever, be converted to a map-able metric that could be modeled worldwide.
Outstanding universal value. While it is hard to put a number on such values, World Heritage Sites are widely celebrated for their natural values. Sea lions and the rich marine life of the Gulf of California.
T H E V A L U E O F J U S T B E I N G T H E R E
70 Atlas of Ocean Wealth | Part One

Natural Importance and Outstanding Universal Value
ECOLOGICALLY OR BIOLOGICALLY SIGNIFICANT MARINE AREAS
GLOBAL 200 MARINE ECOREGIONS
ECOLOGICALLY OR BIOLOGICALLY SIGNIFICANT MARINE AREAS
GLOBAL 200 MARINE ECOREGIONS
Above: Ecologically and Biologically Significant Marine Areas, and the Global 200 marine ecoregions identified by WWF have both been defined by a combination of scientific knowledge and expert interpretation. Many of the very large areas described to meet the EBSA criteria represent dynamic oceanographic/ecological features that migrate or form seasonally within the described area. Below: The 47 marine and coastal World Heritage Sites approved by 2015. These are recognized and protected for their outstanding universal value (only a representative selection of sites are labeled).
MARINE AND COASTAL WORLD HERITAGE SITES
The Value of Just Being There 71
Part Two

Changing the Way We See NaturePart Two
Part Two 73
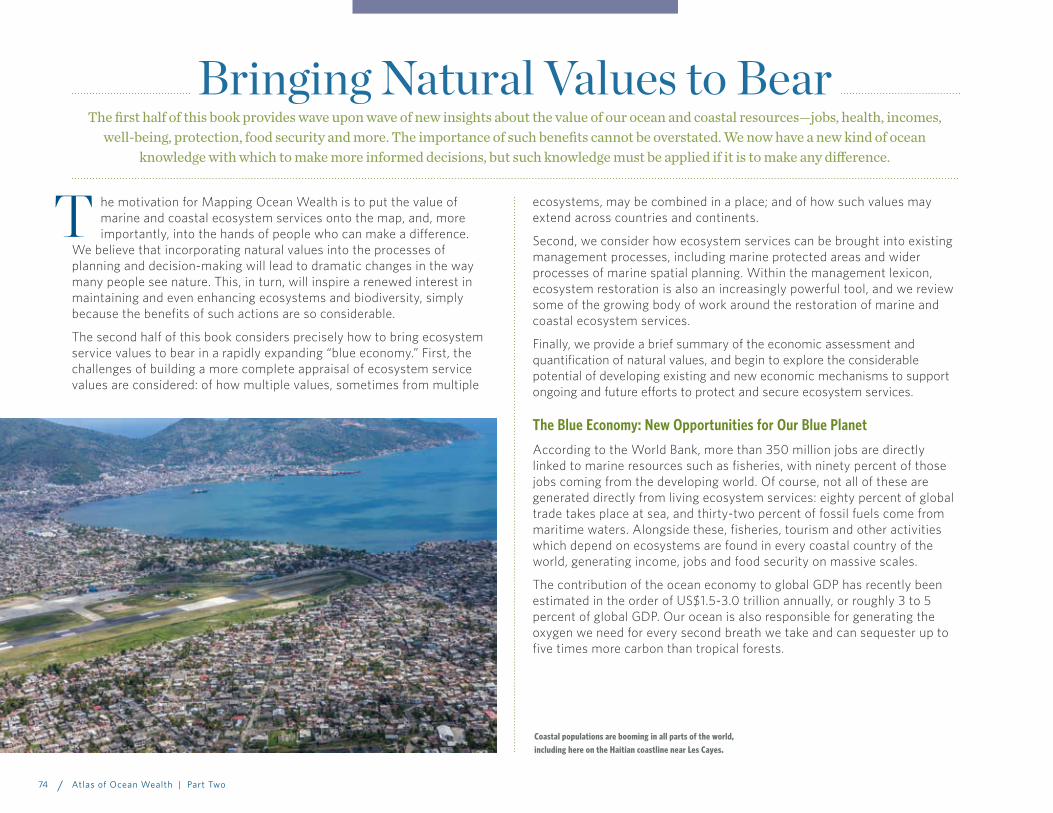
Bringing Natural Values to BearThe first half of this book provides wave upon wave of new insights about the value of our ocean and coastal resources—jobs, health, incomes,
well-being, protection, food security and more. The importance of such benefits cannot be overstated. We now have a new kind of ocean knowledge with which to make more informed decisions, but such knowledge must be applied if it is to make any difference.
he motivation for Mapping Ocean Wealth is to put the value of marine and coastal ecosystem services onto the map, and, more importantly, into the hands of people who can make a difference.
We believe that incorporating natural values into the processes of planning and decision-making will lead to dramatic changes in the way many people see nature. This, in turn, will inspire a renewed interest in maintaining and even enhancing ecosystems and biodiversity, simply because the benefits of such actions are so considerable.
The second half of this book considers precisely how to bring ecosystem service values to bear in a rapidly expanding “blue economy.” First, the challenges of building a more complete appraisal of ecosystem service values are considered: of how multiple values, sometimes from multiple
ecosystems, may be combined in a place; and of how such values may extend across countries and continents.
Second, we consider how ecosystem services can be brought into existing management processes, including marine protected areas and wider processes of marine spatial planning. Within the management lexicon, ecosystem restoration is also an increasingly powerful tool, and we review some of the growing body of work around the restoration of marine and coastal ecosystem services.
Finally, we provide a brief summary of the economic assessment and quantification of natural values, and begin to explore the considerable potential of developing existing and new economic mechanisms to support ongoing and future efforts to protect and secure ecosystem services.
The Blue Economy: New Opportunities for Our Blue Planet
According to the World Bank, more than 350 million jobs are directly linked to marine resources such as fisheries, with ninety percent of those jobs coming from the developing world. Of course, not all of these are generated directly from living ecosystem services: eighty percent of global trade takes place at sea, and thirty-two percent of fossil fuels come from maritime waters. Alongside these, fisheries, tourism and other activities which depend on ecosystems are found in every coastal country of the world, generating income, jobs and food security on massive scales.
The contribution of the ocean economy to global GDP has recently been estimated in the order of US$1.5-3.0 trillion annually, or roughly 3 to 5 percent of global GDP. Our ocean is also responsible for generating the oxygen we need for every second breath we take and can sequester up to five times more carbon than tropical forests.
Coastal populations are booming in all parts of the world, including here on the Haitian coastline near Les Cayes.
T
Atlas of Ocean Wealth | Part Two74

As more countries look to the ocean as a new economic frontier and new source of industrialization and growth, the ecosystems upon which many ocean economic activities depend are also changing at an unprecedented rate, and not necessarily for the better. Ensuring ocean health is now synonymous with maintaining ocean wealth. Sustainably developing ocean spaces for any nation’s economic advancement and growth is the cornerstone of the economic benefit from its blue economy, and driving blue growth.
The 2014 UN Conference on Sustainable Development helped to draw attention to the notion of a “blue economy” and the need to stimulate “blue growth,” for island nations and developing countries with significant coastlines and/or maritime areas. Just as the green economy and green growth were once on the frontier of development planning and investment, their maritime-based equivalents have captured the imagination of policy makers, the United Nations, OECD, development finance organizations such as the World Bank, and NGOs alike.
While stimulating short-term economic growth in ocean areas may be relatively easy to accomplish, the challenges of developing a truly blue economy, with sustainability at its core, may be much greater. Developing ocean spaces for economic growth and development while maintaining (or improving) ocean ecosystem health and integrity could provide a new era of economic opportunity for ocean-facing countries. However, with each promise of ocean-based economic reward comes a real risk to future generations. According to a 2016 OECD study, many ocean-based industries have the potential to outperform the growth of the global economy as a whole, including boosting employment, further predicting that the ocean economy could more than double its economic contribution to GDP by 2030. Only one year earlier, however, in 2015, the G7 Science Academies issued a statement of scientific consensus, informing the world that human activities are leading to changes in the ocean that will significantly impact societies and well-being.
The great challenge for ocean-facing countries and small island developing states around the world will be to square these twin challenges—growing the ocean economy while supporting ocean ecosystems that are critical to their very value. Better understanding of ocean ecosystems, and particularly of the value of natural marine assets and ecosystem services to both ecological processes and economic activity, will help to assess a nation’s ocean wealth, and, in so doing, better define a pathway to support the growth of a country’s blue economy. Sydney Harbour, Australia, with cruise ship. Rapid coastal development is transforming coastlines, but the need for
sustainability and a blue economy is strongly expressed by citizens and travelers.
Bringing Natural Values to Bear 75
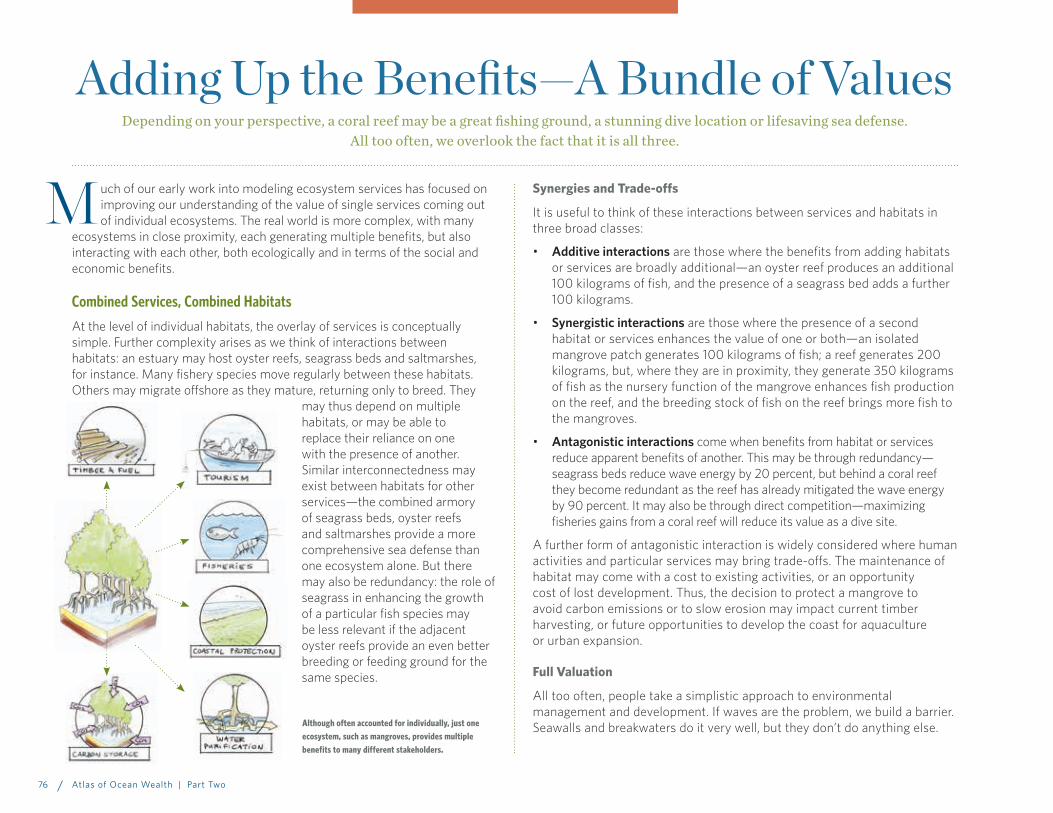
uch of our early work into modeling ecosystem services has focused on improving our understanding of the value of single services coming out of individual ecosystems. The real world is more complex, with many
ecosystems in close proximity, each generating multiple benefits, but also interacting with each other, both ecologically and in terms of the social and economic benefits.
Combined Services, Combined Habitats
At the level of individual habitats, the overlay of services is conceptually simple. Further complexity arises as we think of interactions between habitats: an estuary may host oyster reefs, seagrass beds and saltmarshes, for instance. Many fishery species move regularly between these habitats. Others may migrate offshore as they mature, returning only to breed. They
may thus depend on multiple habitats, or may be able to replace their reliance on one with the presence of another. Similar interconnectedness may exist between habitats for other services—the combined armory of seagrass beds, oyster reefs and saltmarshes provide a more comprehensive sea defense than one ecosystem alone. But there may also be redundancy: the role of seagrass in enhancing the growth of a particular fish species may be less relevant if the adjacent oyster reefs provide an even better breeding or feeding ground for the same species.
Although often accounted for individually, just one ecosystem, such as mangroves, provides multiple benefits to many different stakeholders.
Adding Up the Benefits—A Bundle of ValuesDepending on your perspective, a coral reef may be a great fishing ground, a stunning dive location or lifesaving sea defense.
All too often, we overlook the fact that it is all three.
Synergies and Trade-offs
It is useful to think of these interactions between services and habitats in three broad classes:
• Additive interactions are those where the benefits from adding habitats or services are broadly additional—an oyster reef produces an additional 100 kilograms of fish, and the presence of a seagrass bed adds a further 100 kilograms.
• Synergistic interactions are those where the presence of a second habitat or services enhances the value of one or both—an isolated mangrove patch generates 100 kilograms of fish; a reef generates 200 kilograms, but, where they are in proximity, they generate 350 kilograms of fish as the nursery function of the mangrove enhances fish production on the reef, and the breeding stock of fish on the reef brings more fish to the mangroves.
• Antagonistic interactions come when benefits from habitat or services reduce apparent benefits of another. This may be through redundancy—seagrass beds reduce wave energy by 20 percent, but behind a coral reef they become redundant as the reef has already mitigated the wave energy by 90 percent. It may also be through direct competition—maximizing fisheries gains from a coral reef will reduce its value as a dive site.
A further form of antagonistic interaction is widely considered where human activities and particular services may bring trade-offs. The maintenance of habitat may come with a cost to existing activities, or an opportunity cost of lost development. Thus, the decision to protect a mangrove to avoid carbon emissions or to slow erosion may impact current timber harvesting, or future opportunities to develop the coast for aquaculture or urban expansion.
Full Valuation
All too often, people take a simplistic approach to environmental management and development. If waves are the problem, we build a barrier. Seawalls and breakwaters do it very well, but they don’t do anything else.
M
Atlas of Ocean Wealth | Part Two76

Areas of Critical Importance for Ecosystem Services As is apparent from our maps, not all areas are equally important for ecosystem services. Likewise, different services will show different patterns of importance. Understanding the overlap between ecosystem service importance is a key element of planning and, in many settings, decisions on conservation and management of services will be driven by local factors of need and stakeholder interest. A broader perspective may also be useful however, particularly to inform international agendas, such as the Convention on Biological Diversity’s call for the conservation of areas of importance for biodiversity and ecosystem services. For such audiences, there may be considerable merit in developing maps of general importance. Areas of Critical Importance for Ecosystem Services (ACIES) might parallel EBSAs (see p. 68-69) as a guide for conservation effort. Guided by expert interpretation, they would require a science-driven, map-based input to inform identification. They might include areas currently providing maximum benefits to people (with benefits described in economic or non-monetary metrics), as well as areas with high potential values (through improved management or restoration). Further focus might distinguish areas of absolute highest value for individual ecosystem services (e.g., the most important blue carbon stores) or areas where multiple services and or multiple ecosystems provide combined high value.
Mangroves in Thailand – Convert or Conserve? The graphic to the left explains how the conversion of mangroves could be justified in Thailand with a simplistic view of mangroves providing only one service (forest products), compared to an apparently unassailable value of conversion to shrimp aquaculture ponds. However shrimp aquaculture is subject to multiple subsidies paid from the public purse. Adjusted for these, the value difference becomes marginal (central graphic). In the right-hand graphic account is finally made for the full suite of ecosystem services provided by mangroves and conversion to aquaculture, even ignoring subsidies, becomes a very poor economic option.
By typically delivering multiple benefits, ecosystems are different. The challenge, however, is to bring these multiple values into markets where narrower visions often hold sway. A seawall may be more effective than a saltmarsh at wave reduction, but if the saltmarsh is lost, fish production and carbon sequestration are also lost. The knock-on effects on fisheries are rarely the concern of engineers designing seawalls. Someone else pays the price.
Timeframes are also often missing from coastal planning. Conversion of mangrove to aquaculture can bring massive profits (at least to a few) for a few years, but the majority of such aquaculture ponds become unprofitable in short order, leaving an unprotected, unproductive coast and a population
with few employment options. Similarly, seawalls that are built to protect current coastlines, are rarely designed with sea level rise in mind.
Well-managed, ecosystems should have the capacity to continue delivering benefits over very long timescales. More remarkable still, when damaged they have a capacity for self-repair, with virtually no maintenance cost. In some places, coastal wetlands and reefs even have a capacity to grow vertically with sea level rise.
A critical task for coastal managers, planners, industry, conservation and, indeed, all coastal stakeholders is to build a more holistic coastal and marine planning process (see p. 82) to reduce perverse and costly losses of ecosystem services, and to ensure that we maintain, restore and utilize nature to its full effect.
$25,000
Decision: Convert Decision: Convert Decision: Conserve
$20,000
$15,000
$10,000
$5,000
$955 $955 $1,349
$21,456
$10,649$10,649
$0
Value ofmangrove
Value ofconverted mangrove
Value ofmangrove
Value ofconverted mangrove
Value ofmangrove
Value ofconverted mangrove
Valu
e pe
r hec
tare
in d
olla
rs
Carbon sequestration
Fish Habitat
Coastal protection from storms
SCENARIO 1:Accounting only
for marketed products
SCENARIO 2:Accounting only for marketed
products, adjusted for subsidies
SCENARIO 3:Accounting for the
total value of the mangrove
Wood and non-wood products
Shrimp farming
Never quite as simple as the textbooks – here in Cuba, mangroves, seagrasses and corals grow in close proximity forming an interconnected ecosystem, and a juvenile snapper shelters among them.
Adding Up the Benefits—A Bundle of Values 77

Of the benefits provided by ecosystems, some accrue to people within the ecosystem boundaries. In many cases, however, key ecosystem services accrue to people far from the provisioning ecosystem, either outside the ecosystem boundaries or even in other parts of the globe.
Consider the Following Sequence:
The value of a reef in coastal protection is most strongly felt where people or infrastructure are spared the impacts of waves, flooding or erosion—this may be hundreds of meters to a few kilometers away.
A mud crab from a mangrove, may be transported by boat or road to a market tens-of-kilometers from where it was caught, but its value may not end there. The crab may be sold on, generating additional value to shops and restaurants across a wide geographic space, before it is finally consumed.
More complex still, consider tourists diving with sea lions in the Gulf of California. Their spending supports jobs and provides income to dive shops, hotels, boats, and restaurants locally. Meanwhile, airlines, hotel chains, car hire companies, diving equipment and camera suppliers often carry their profits to other countries, and such profits are spread to shareholders, investors, even to pension-holders worldwide. Accordingly, a nature-based adventure trip to Mexico can provide benefits around the world.
This concept of value flows is important not only for the development of a full understanding of the entire worth of an ecosystem service, but also to help draw attention to the full range of beneficiaries of nature and natural values. The Mapping Ocean Wealth team includes partners from Duke University and the University of West Brittany who have developed new approaches to look into value flows and, particularly, at the potential to quantify and map these “extra-local” services whose benefits are enjoyed far from the initial ecosystem.
Extra-Local Services—Mangroves and Carbon Stocks
The term extra-local ecosystem service is used here to describe a service or benefit that is accrued far from the ecosystem that generates it. One of the clearest conceptual examples can be found in blue carbon.
Indonesia has the largest extent of mangrove forests in the world. They are also among the most carbon-rich mangroves, with tall, dense forests growing in rich soils. Using updated estimates by Dan Alongi and colleagues, we calculated the median level of carbon storage from an Indonesian mangrove to be almost 1,000 metric tons of carbon per hectare.
Unfortunately, Indonesia is also losing its mangroves faster than many other countries. In some of the largest remaining mangrove areas in Indonesia, such as those in South Papua, single tracts of mangrove forest are of global significance. Standing, they represent a significant carbon stock as well as an ongoing sink. Cleared for new aquaculture or palm oil plantations, however, and they will release their existing carbon into the atmosphere, becoming a potent source of greenhouse gases.
The potential profits to be had from clearing mangroves are often felt relatively locally, sometimes by just one or a few individuals or corporations. The costs, too, may be felt locally in terms of lost fisheries or reduced coastal protection. The societal cost of CO2 release, however, is extra-local (i.e., it extends beyond the mangrove ecosystem boundaries). Its costs will be shared by the global community in terms of its contribution to climate change.
A number of models are being developed to estimate the “social cost of carbon,” which is a monetary value for the cost of climate change taking into account its multiple impacts on society and infrastructure. The most updated estimates give a value of US$220 per metric ton of CO2. Using such models, and based on the estimates of carbon stored in the Mimika area of South Papua, we calculated that the loss of one large mangrove tract there, could cost some US$450 billion to the global economy.
In a linked approach, using one of the existing models that assess the social cost of carbon (SCC), we considered how that value might be spread, country by country, using a model that allowed for regional differences—both in social and economic conditions (RICE) and in their vulnerability to climate change—and were able to produce a global map.
This tract of mangroves, largely unheard of and remote from large populations and markets, is of immense value to the world. What is lacking is a means to realize that value and promote it, or indeed to ensure that such extra-local values, more broadly, can be protected and enhanced without driving unfair local costs on the owners of the ecosystem.
Ecosystem Services FlowsA D D I N G U P T H E B E N E F I T S — A B U N D L E O F V A L U E S
Atlas of Ocean Wealth | Part Two78
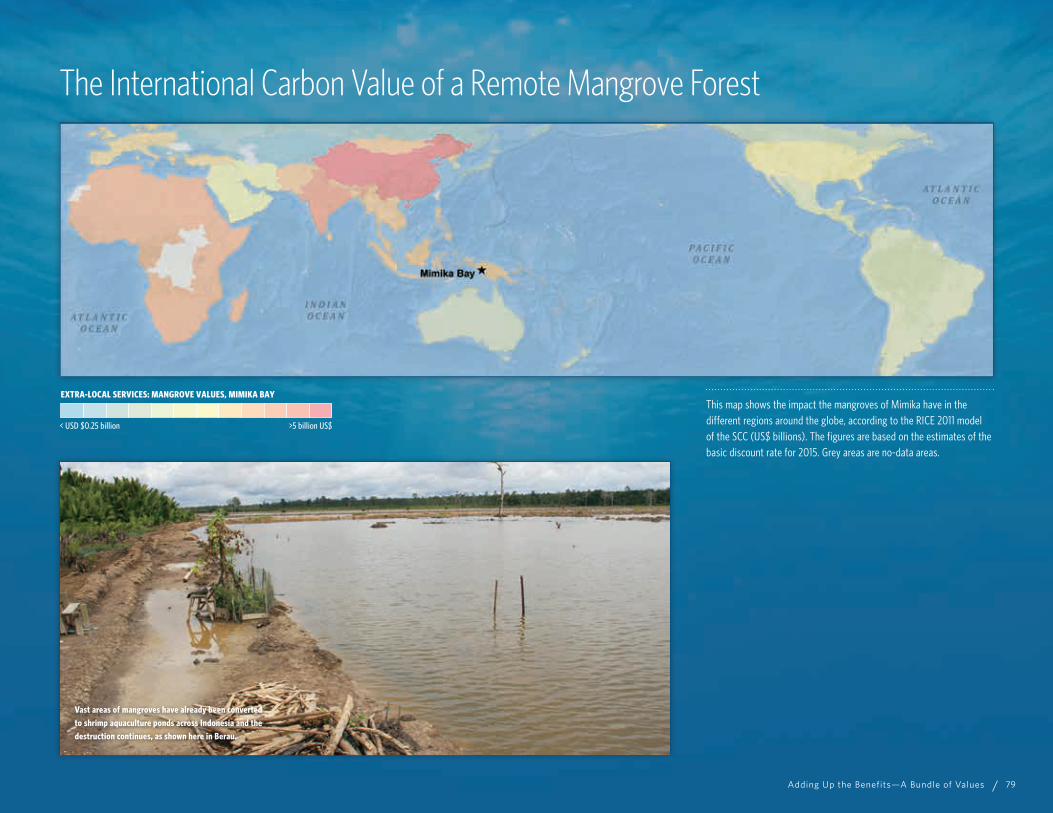
This map shows the impact the mangroves of Mimika have in the different regions around the globe, according to the RICE 2011 model of the SCC (US$ billions). The figures are based on the estimates of the basic discount rate for 2015. Grey areas are no-data areas.
The International Carbon Value of a Remote Mangrove Forest
Vast areas of mangroves have already been converted to shrimp aquaculture ponds across Indonesia and the destruction continues, as shown here in Berau.
EXTRA-LOCAL SERVICES: MANGROVE VALUES, MIMIKA BAY
>5 billion US$< USD $0.25 billion
Adding Up the Benefits—A Bundle of Values 79

Artisanal fishers scour mudflats for seafood against a backdrop of the heavily industrialized coast of southern China.
Managing, Protecting and Enhancing ServicesDemands for marine resources and ocean space are accelerating, leading to conflicts and resource depletion.
Holistic planning approaches are increasingly being used to address conflicts and to maximize the net benefits from the ocean. Ecosystem services can provide valuable information to strengthen these approaches.
he value of the ocean is felt or experienced very differently in different places and by different people. For some, the value is highest in prime fishing grounds. For others, it may be the best beaches or the best diving
spots. Industrial or development interests may see value in returns from hydrocarbon or aggregate extraction, renewable wind or tide energy, or the conversion of mangroves to real estate or aquaculture ponds. Such values, as we have seen, may be expressed in dollars, jobs, safety, or in more intangible aspects such as beauty, diversity or wilderness.
Economic development often takes place sector by sector without engagement with other sectors or input from stakeholders in the decisions. Marine spatial planning (MSP) describes the process of allocating marine and coastal space for ecological, economic and social objectives, engaging stakeholders and the public under the auspices of a planning authority. The term has a clear overlap with integrated coastal zone management and other ongoing work that aims to consider the holistic management of terrestrial and marine spaces, including issues of land-based sources of marine degradation. While MSP approaches are expanding rapidly worldwide (see map on p. 83), one of the great challenges facing MSP is to ensure that ecosystems and ecosystem services are properly accounted for in the wider planning process.
Approaches to MSP must be both technical and political in nature, simultaneously concerned with ocean health, the use of the environment and people’s economic and social well-being. In general, marine planning processes use similar methodologies. The model approach is one in which governments create a framework for decision-making that is transparent, inclusive and participatory. Stakeholders are central to MSP and their engagement in setting the overall goals of the process, in articulating shared objectives and values, and in determining the most critical uses to account for now and in the future is generally what sets these holistic approaches apart from other forms of planning. Data provided by the stakeholders and others are also critical and need to cover current, potential and future uses, and should include scientific and commercial data as well as traditional and local knowledge. Stakeholders provide and verify information, scenarios are developed with stakeholder input, and decisions are made for the final plan.
One of the more challenging components of MSP has been the incorporation of reliable ecosystem services values and maps, often because of a lack of information or awareness of the importance of ecosystems in providing key benefits. Addressing such challenges is one of the primary motivations for the Mapping Ocean Wealth initiative. It is imperative that we better quantify and map the contributions that ecosystems make to human well-being and economic prosperity, but equally that we incorporate these values into coastal and ocean management discussions and decisions. To succeed, ecosystem service data must stand alongside other values used to inform economic development and conservation actions.
While the maps in this volume illustrate approaches, it is important that the same information, and the underlying models, are available for practical applications at different scales. The online Atlas of Ocean Wealth offers many of the same datasets for more in-depth exploration of specific ecosystem services (http://maps.oceanwealth.org, see p. 85). This digital atlas provides a platform for people to visualize global, regional, and local ecosystem benefits for use in ocean planning and policy decisions. At the same time, the science and the tools can be developed in other ways to support planning, as illustrated on the following spread.
T
Atlas of Ocean Wealth | Part Two80

Willie Atu (on left), Project Manager for The Nature Conservancy's Solomon Islands program showing a map of the conserved and threatened areas of the Solomons to the Mothers Union (the Mothers Union is a group of Kia women who have worked with the Conservancy to raise conservation awarness).
Managing, Protecting and Enhancing Services 81
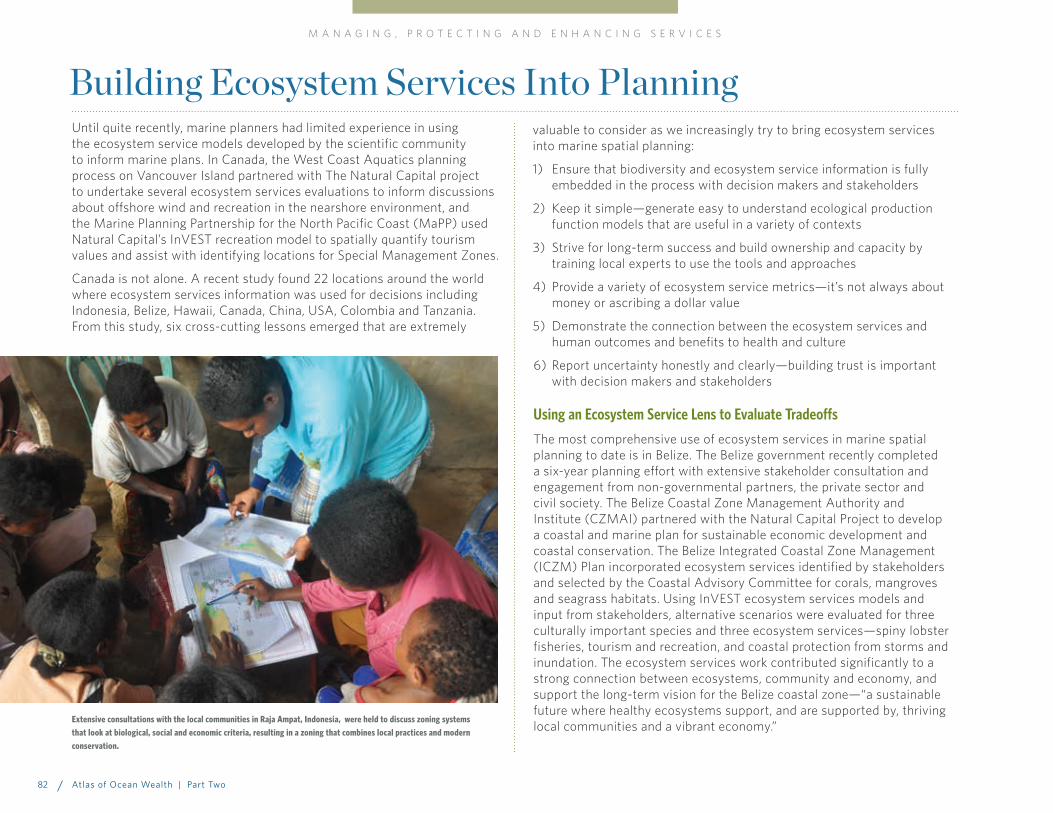
Until quite recently, marine planners had limited experience in using the ecosystem service models developed by the scientific community to inform marine plans. In Canada, the West Coast Aquatics planning process on Vancouver Island partnered with The Natural Capital project to undertake several ecosystem services evaluations to inform discussions about offshore wind and recreation in the nearshore environment, and the Marine Planning Partnership for the North Pacific Coast (MaPP) used Natural Capital’s InVEST recreation model to spatially quantify tourism values and assist with identifying locations for Special Management Zones.
Canada is not alone. A recent study found 22 locations around the world where ecosystem services information was used for decisions including Indonesia, Belize, Hawaii, Canada, China, USA, Colombia and Tanzania. From this study, six cross-cutting lessons emerged that are extremely
valuable to consider as we increasingly try to bring ecosystem services into marine spatial planning:
1) Ensure that biodiversity and ecosystem service information is fully embedded in the process with decision makers and stakeholders
2) Keep it simple—generate easy to understand ecological production function models that are useful in a variety of contexts
3) Strive for long-term success and build ownership and capacity by training local experts to use the tools and approaches
4) Provide a variety of ecosystem service metrics—it’s not always about money or ascribing a dollar value
5) Demonstrate the connection between the ecosystem services and human outcomes and benefits to health and culture
6) Report uncertainty honestly and clearly—building trust is important with decision makers and stakeholders
Using an Ecosystem Service Lens to Evaluate Tradeoffs
The most comprehensive use of ecosystem services in marine spatial planning to date is in Belize. The Belize government recently completed a six-year planning effort with extensive stakeholder consultation and engagement from non-governmental partners, the private sector and civil society. The Belize Coastal Zone Management Authority and Institute (CZMAI) partnered with the Natural Capital Project to develop a coastal and marine plan for sustainable economic development and coastal conservation. The Belize Integrated Coastal Zone Management (ICZM) Plan incorporated ecosystem services identified by stakeholders and selected by the Coastal Advisory Committee for corals, mangroves and seagrass habitats. Using InVEST ecosystem services models and input from stakeholders, alternative scenarios were evaluated for three culturally important species and three ecosystem services—spiny lobster fisheries, tourism and recreation, and coastal protection from storms and inundation. The ecosystem services work contributed significantly to a strong connection between ecosystems, community and economy, and support the long-term vision for the Belize coastal zone—“a sustainable future where healthy ecosystems support, and are supported by, thriving local communities and a vibrant economy.”
Building Ecosystem Services Into Planning
Extensive consultations with the local communities in Raja Ampat, Indonesia, were held to discuss zoning systems that look at biological, social and economic criteria, resulting in a zoning that combines local practices and modern conservation.
M A N A G I N G , P R O T E C T I N G A N D E N H A N C I N G S E R V I C E S
Atlas of Ocean Wealth | Part Two82

Globally, there is a rapidly growing interest in marine spatial planning. It is estimated that by 2025, approved marine plans will cover more than 45 million square kilometers of ocean in 35 countries. Legend: Implemented – plans are being implemented under the authority of policy, regulation or law; Approved – plans are signed and approved by the governing authority, and implementation mechanisms, such as funding and laws, are either complete or underway; Completed – plans are complete and awaiting approval; Underway – planning has started, or there are strong indications from the government that they will start by 2025.
Current and Projected Marine Spatial Planning Efforts Worldwide
IMPLEMENTED
APPROVED
COMPLETED
UNDERWAY; WILL HAVE BY 2025
Killer whales, whale-watching and shipping traffic for Vancouver. There is a rapidly growing need for joined-up thinking in determining how we use our coasts and oceans.
Managing, Protecting and Enhancing Services 83
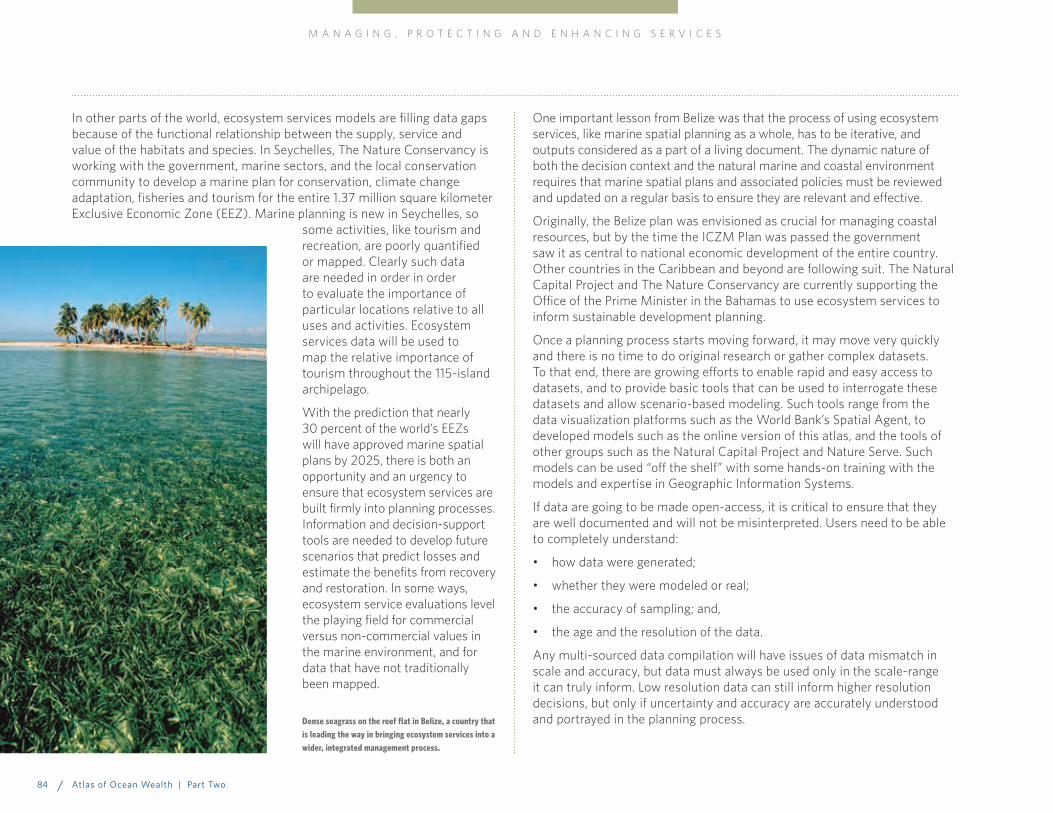
In other parts of the world, ecosystem services models are filling data gaps because of the functional relationship between the supply, service and value of the habitats and species. In Seychelles, The Nature Conservancy is working with the government, marine sectors, and the local conservation community to develop a marine plan for conservation, climate change adaptation, fisheries and tourism for the entire 1.37 million square kilometer Exclusive Economic Zone (EEZ). Marine planning is new in Seychelles, so
some activities, like tourism and recreation, are poorly quantified or mapped. Clearly such data are needed in order in order to evaluate the importance of particular locations relative to all uses and activities. Ecosystem services data will be used to map the relative importance of tourism throughout the 115-island archipelago.
With the prediction that nearly 30 percent of the world’s EEZs will have approved marine spatial plans by 2025, there is both an opportunity and an urgency to ensure that ecosystem services are built firmly into planning processes. Information and decision-support tools are needed to develop future scenarios that predict losses and estimate the benefits from recovery and restoration. In some ways, ecosystem service evaluations level the playing field for commercial versus non-commercial values in the marine environment, and for data that have not traditionally been mapped.
One important lesson from Belize was that the process of using ecosystem services, like marine spatial planning as a whole, has to be iterative, and outputs considered as a part of a living document. The dynamic nature of both the decision context and the natural marine and coastal environment requires that marine spatial plans and associated policies must be reviewed and updated on a regular basis to ensure they are relevant and effective.
Originally, the Belize plan was envisioned as crucial for managing coastal resources, but by the time the ICZM Plan was passed the government saw it as central to national economic development of the entire country. Other countries in the Caribbean and beyond are following suit. The Natural Capital Project and The Nature Conservancy are currently supporting the Office of the Prime Minister in the Bahamas to use ecosystem services to inform sustainable development planning.
Once a planning process starts moving forward, it may move very quickly and there is no time to do original research or gather complex datasets. To that end, there are growing efforts to enable rapid and easy access to datasets, and to provide basic tools that can be used to interrogate these datasets and allow scenario-based modeling. Such tools range from the data visualization platforms such as the World Bank’s Spatial Agent, to developed models such as the online version of this atlas, and the tools of other groups such as the Natural Capital Project and Nature Serve. Such models can be used “off the shelf” with some hands-on training with the models and expertise in Geographic Information Systems.
If data are going to be made open-access, it is critical to ensure that they are well documented and will not be misinterpreted. Users need to be able to completely understand:
• how data were generated;
• whether they were modeled or real;
• the accuracy of sampling; and,
• the age and the resolution of the data.
Any multi-sourced data compilation will have issues of data mismatch in scale and accuracy, but data must always be used only in the scale-range it can truly inform. Low resolution data can still inform higher resolution decisions, but only if uncertainty and accuracy are accurately understood and portrayed in the planning process.
M A N A G I N G , P R O T E C T I N G A N D E N H A N C I N G S E R V I C E S
Dense seagrass on the reef flat in Belize, a country that is leading the way in bringing ecosystem services into a wider, integrated management process.
Atlas of Ocean Wealth | Part Two84
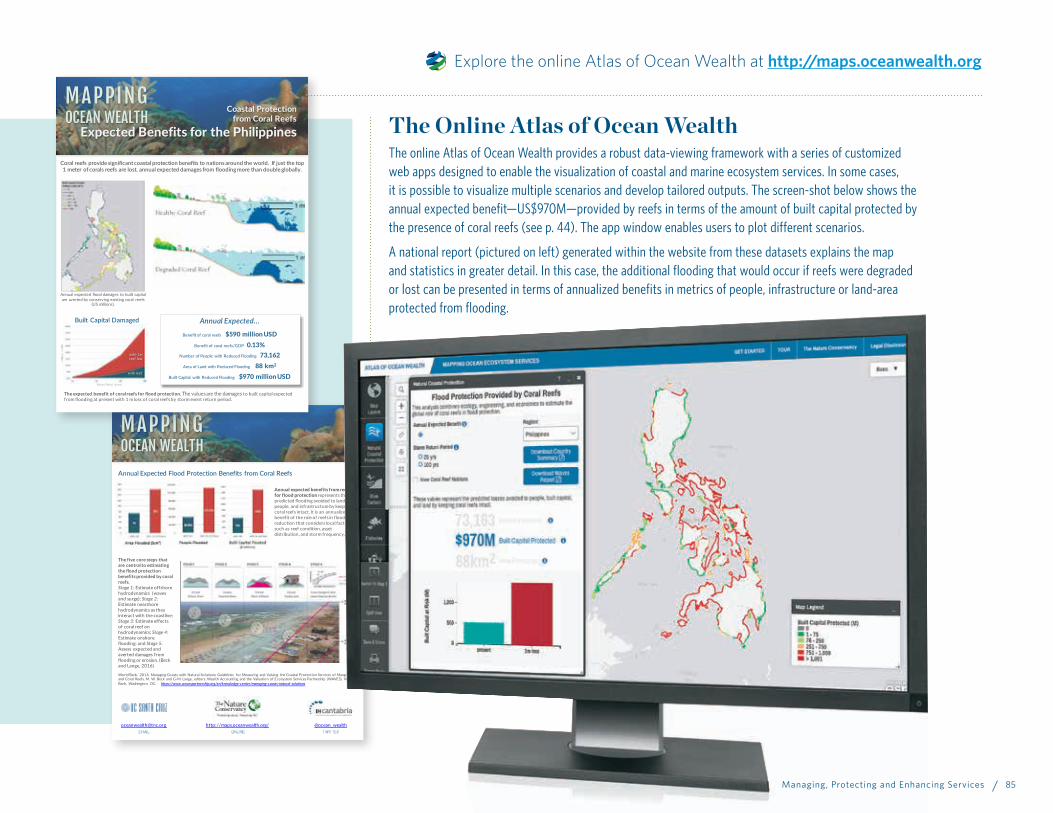
The Online Atlas of Ocean Wealth The online Atlas of Ocean Wealth provides a robust data-viewing framework with a series of customized web apps designed to enable the visualization of coastal and marine ecosystem services. In some cases, it is possible to visualize multiple scenarios and develop tailored outputs. The screen-shot below shows the annual expected benefit—US$970M—provided by reefs in terms of the amount of built capital protected by the presence of coral reefs (see p. 44). The app window enables users to plot different scenarios.
A national report (pictured on left) generated within the website from these datasets explains the map and statistics in greater detail. In this case, the additional flooding that would occur if reefs were degraded or lost can be presented in terms of annualized benefits in metrics of people, infrastructure or land-area protected from flooding.
MAPPINGOCEAN WEALTH
[email protected] EMAIL ONLINE
http://maps.oceanwealth.org/ @ocean_wealthTWITTER
Annual expected benefits from reefs for flood protection represents the predicted flooding avoided to land, people, and infrastructure by keeping coral reefs intact. It is an annualized benefit of the role of reefs in flood reduction that considers local factors such as reef condition, asset distribution, and storm frequency.
Annual Expected Flood Protection Benefits from Coral Reefs
The five core steps that are central to estimating the flood protection benefits provided by coral reefs. Stage 1: Estimate offshore
hydrodynamics (waves
and surge); Stage 2:
Estimate nearshore
hydrodynamics as they
interact with the coastline;
Stage 3: Estimate effects
of coral reef on
hydrodynamics; Stage 4:
Estimate onshore
flooding; and Stage 5:
Assess expected and
averted damages from
flooding or erosion. (Beck
and Lange, 2016)
World Bank. 2016. Managing Coasts with Natural Solutions: Guidelines for Measuring and Valuing the Coastal Protection Services of Mangroves
and Coral Reefs. M. W. Beck and G-M. Lange, editors. Wealth Accounting and the Valuation of Ecosystem Services Partnership (WAVES), World
Bank, Washington, DC. https://www.wavespartnership.org/en/knowledge-center/managing-coasts-natural-solutions
MAPPINGOCEAN WEALTH
Coastal Protection from Coral Reefs
Expected Benefits for the Philippines
Coral reefs provide significant coastal protection benefits to nations around the world. If just the top 1 meter of corals reefs are lost, annual expected damages from flooding more than double globally.
Annual expected flood damages to built capital are averted by conserving existing coral reefs
(US millions).
Annual Expected…
Benefit of coral reefs $590 million USDBenefit of coral reefs/GDP 0.13%
Number of People with Reduced Flooding 73,162Area of Land with Reduced Flooding 88 km2
Built Capital with Reduced Flooding $970 million USD
The expected benefit of coral reefs for flood protection. The values are the damages to built capital expected from flooding at present with 1 m loss of coral reefs by storm event return period.
Built Capital Damaged
with reef
with 1m reef loss
Return Period (years)
Milli
ons
(USD
)
Explore the online Atlas of Ocean Wealth at http://maps.oceanwealth.org
Managing, Protecting and Enhancing Services 85

Marine Protected Areas (MPAs) are often the tool of choice for marine conservation initiatives and they can play a critical role in safeguarding ecosystem services. Unfortunately, at the present time, many MPAs are placed quite far from the most important areas for ecosystem services.
What Can MPAs Do?
MPAs come in many forms, from strict nature reserves which prohibit all extractive activities, through to loosely managed marine spaces where certain activities continue with only minor measures to build sustainability or prevent damage. Clearly, different management approaches are needed for securing or enhancing different services and in different settings. The closure of a mangrove forest to timber harvest halts any benefits from sustainable silviculture, but may serve to enhance carbon storage and fish production. Fisheries closures can have a mixed effect, but there is a large body of literature pointing to the benefits of strict “no-take” areas in fisheries management. Such sites can safeguard large populations of breeding fish and so export disproportionate numbers of young, together with a regular spillover of adults. Most coral reef studies have shown that closures of 20-40 percent of all reef areas in a location can lead to net gains in overall catches from remaining areas.
In this way, MPAs offer a suite of management tools, which, when appropriately used, can greatly enhance ecosystem service provision. They can also simply serve to focus management attention, and thereby helping to secure the long-term survival of natural resources. Take the example of Indonesia, which has over one-fifth of all the world’s mangroves, but which has also suffered some of the most dramatic losses. A recent study has shown that mangrove losses have been significantly slowed in its network of MPAs. This translates to avoided losses of some 14,000 hectares or 13 million metric ton of carbon dioxide emissions.
How Well Are We Doing?
While MPAs, overall, are still only approaching a coverage of four percent of the world’s ocean surface, they are concentrated in coastal waters where they already cover over 10 percent of areas under state jurisdictions. Further, over 30 percent of certain key ecosystems, such as mangrove forests and coral reefs, already fall within MPAs. Given that many critical ecosystem services are focused in these coastal water and key ecosystems, it would
at first appear that we are at least targeting MPAs at the right places.
Under the Mapping Ocean Wealth project, and with partners from the Cambridge Conservation Initiative and the World Resources Institute we undertook an assessment to look at the correlation between MPAs and those areas most important for ecosystem services for both mangroves and coral reefs. Our findings show a mixed array—while protected areas appear to match well with the coral reefs most important for tourism, they are disproportionately under-protecting the reefs needed for coastal defense. While 32 percent of the world’s reefs are in MPAs, only 17 percent of their value for coastal protection was covered. For the most important areas for fisheries, MPAs are falling short in many of the most important areas of both mangroves and coral reefs.
The conservation of ecosystem services is clearly called for under international agreements such as the Convention on Biological Diversity, and so further effort is clearly needed to protect areas identified for their ecosystem service importance. More important, however, will be the direct benefits that accrue from such conservation. If ecosystem services can be conserved where they achieve the greatest benefit for people, then the results will be more keenly felt and may, in turn, encourage further efforts at ecosystem service conservation.
Conservation and Protected Areas
A sign posted on the shore notifying people that they are in the Eastern Tarobi Bay zone of the locally managed marine area (LMMA) in Kimbe Bay in Papua New Guinea, and informing them of specific activities not allowed in the LMMA. Local ownership and involvement can be critical to MPA success.
M A N A G I N G , P R O T E C T I N G A N D E N H A N C I N G S E R V I C E S
Atlas of Ocean Wealth | Part Two86

The map of the world’s protected areas highlights sites that overlap marine or coastal areas. Inset: Marine Protected Areas overlaid on our maps of three ecosystem services: mangrove biomass values in West Africa (left); coastal protection by coral reefs in the main Hawaiian Islands (center); and mangrove fisheries in the Greater Antilles (right).
Marine Protected Areas and Ecosystem Services
PROTECTED AREAS (Coastal and Marine) PROTECTED AREAS (Inland)
1 2 3 4 5 6 7 8 9 10
MANGROVE ABOVE GROUND BIOMASS
HIGHESTLOWEST
1 2 3 4 5 6 7 8 9 10
COASTAL PROTECTION FROM CORAL REEFS
HIGHESTLOWEST
1 2 3 4 5 6 7 8 9 10
RELATIVE FISHERY VALUE
HIGHESTLOWEST
PROTECTED AREA BOUNDARIES
PROTECTED AREAS (Coastal and Marine) PROTECTED AREAS (Inland)
1 2 3 4 5 6 7 8 9 10
MANGROVE ABOVE GROUND BIOMASS
HIGHESTLOWEST
1 2 3 4 5 6 7 8 9 10
COASTAL PROTECTION FROM CORAL REEFS
HIGHESTLOWEST
1 2 3 4 5 6 7 8 9 10
RELATIVE FISHERY VALUE
HIGHESTLOWEST
PROTECTED AREA BOUNDARIESPROTECTED AREAS (Coastal and Marine) PROTECTED AREAS (Inland)
1 2 3 4 5 6 7 8 9 10
MANGROVE ABOVE GROUND BIOMASS
HIGHESTLOWEST
1 2 3 4 5 6 7 8 9 10
COASTAL PROTECTION FROM CORAL REEFS
HIGHESTLOWEST
1 2 3 4 5 6 7 8 9 10
RELATIVE FISHERY VALUE
HIGHESTLOWEST
PROTECTED AREA BOUNDARIES
PROTECTED AREAS (Coastal and Marine) PROTECTED AREAS (Inland)
1 2 3 4 5 6 7 8 9 10
MANGROVE ABOVE GROUND BIOMASS
HIGHESTLOWEST
1 2 3 4 5 6 7 8 9 10
COASTAL PROTECTION FROM CORAL REEFS
HIGHESTLOWEST
1 2 3 4 5 6 7 8 9 10
RELATIVE FISHERY VALUE
HIGHESTLOWEST
PROTECTED AREA BOUNDARIES
Managing, Protecting and Enhancing Services 87

Coastal habitats have seen some of the most extensive losses of any habitats on Earth. But recent years have also seen the appearance of numerous points of hope as restoration projects are returning nature, and ecosystem services, to their earlier vitality.
Habitat losses in coastal waters have been immense. Coastal marshes and mangroves, once perceived only as breeding grounds for mosquitos or places unsuitable for building, have been ditched, drained or filled to “reclaim” land to enable coastal development. Oyster reefs, once a dominant feature in estuaries, were mined away for food, construction materials and fertilizer. Coral reefs have been infilled to create land, bombed to extract fish, or dredged away to make room for ship channels and port facilities.
The maps and models in the first half of this Atlas provide some clues as to the likely cost that these losses may have incurred on society. The filtration capacity of oysters around the coast of the USA, for example, has declined by 80 percent and we can assume this has, in turn, led to the clouding of water, loss of fish-producing seagrasses, and prevented the removal of nutrient pollution that today plagues many of our coastal bays and estuaries.
More recently, however, an encouraging new trend toward restoration has emerged and in coastal waters around the world there are a few places where nature is being encouraged to recover or being actively restored. Mangroves were the first part of this movement, but now examples are widespread for seagrass, saltmarsh, oyster reef and coral reef restoration. Mangrove restoration efforts already extended to nearly 4,000 square kilometers by 2010, and figures will greatly exceed this in the years since. The restoration of oyster reefs has received greatest focus in the USA where the National Oceanic and Atmospheric Administration (NOAA) has funded more than 531 bivalve restoration projects, mostly focused on restoring oyster reefs. Tens-of-millions of dollars have been invested by NOAA and others, and this does not include in-kind and volunteer contributions. The Nature Conservancy alone has engaged nearly 20,000 volunteers on this work in the past decade.
The reasons for restoration are varied. Sometimes it can just be a simple desire to replace what has been lost, but more typically there are strong and clearly stated motivations to restore ecosystem services. Whether regaining lost services or, in some instances, creating new “natural infrastructure” to generate novel benefits, this building of habitat is a new and important tool for coastal management.
Enhancing Services
Restored oyster beds at low tide in the Virginia Coast Reserve, USA. A natural cultch was added to the soft muddy seabed and has been densely colonized by natural oyster settlement, leaving a habitat almost indistinguishable from natural formations, and once again providing critical ecosystem services.
Restoring marine habitats is not always easy, but considerable advances are being made. Here a volunteer collects eelgrass shoots containing ripe seeds. The shoots are measured into water tanks, and the seeds are cured, separated, and prepared for planting later in the year.
M A N A G I N G , P R O T E C T I N G A N D E N H A N C I N G S E R V I C E S
Atlas of Ocean Wealth | Part Two88

As part of a public-private sector partnership, Wetlands International is developing innovative natural barriers to encourage the stabilization of muddy shores in Java, Indonesia. Permeable brushwood dams enable sediments to settle, providing a substrate for natural mangrove growth in eroding aquaculture ponds.
Managing, Protecting and Enhancing Services 89

Multiple Benefits from Oyster Reef Enhancement
Coastlines are dynamic places, their shape is ever-changing under the influence of waves, tides and fluctuating sea level. For coastal communities, this fluctuation brings uncertainty, and economic consequences, as homes and infrastructure are threatened by erosion and inundation, whether from storms or from the regular tug of wind-driven waves and boat wakes at the shoreline. Some of these impacts have, in fact, been greatly exacerbated by past losses of ecosystems, which once baffled and broke the incoming waves and even held back storm surges (see p. 40). In response, many homeowners, businesses and municipal governments have turned to engineered solutions, so-called “gray infrastructure” like concrete walls, rock embankments and submerged offshore breakwaters to reflect waves and stem losses. An unfortunate consequence of such “hardening” of shorelines is further loss of shallow water habitats, such as marshes and seagrass beds.
There is, however, now a small but growing movement to use “natural infrastructure” such as oyster reefs, saltmarshes, mangroves and coral reefs to provide wave-breaking benefits expected of traditional gray
infrastructure. Ecosystems can provide many of the same benefits, but, of course, come with the concomitant advantages of generating other services, and the unique advantage in some cases of being able to grow vertically upwards in the face of sea level rise.
In Mobile Bay, Alabama, large-scale efforts are now underway to construct living breakwaters along shorelines facing rapid erosion. Through the American Recovery and Reinvestment Act (ARRA), federal “stimulus funding” has been used to construct more than two kilometers of submerged breakwaters, which are designed to support the rapid settlement of oysters and so gradually morph into living reefs.
Design is a key element—the reefs must serve a function: protecting adjacent marshes and seagrass beds from their prior state of rapid erosion, and so also defending roads and valuable coastal property. One of the important criteria for this project was the creation of jobs—short-term employment during the design and construction phase, but more beside that. Economists have found other returns on the investment in the fisheries sector. Recent research shows that for every new hectare of oyster reef created in Mobile Bay, we can expect an additional 3,200 adult blue crabs every year.
Local and Global Benefits from Mangrove Restoration
The Sundarbans is a vast mangrove forest in the Ganges Brahmaputra Delta, spanning the border between India and Bangladesh. Some of these mangroves have been sustainably managed and harvested for timber for well over 100 years, but elsewhere they have been lost and the threat of inundation is rising, particularly in the face of sea level rise. In one large-scale restoration effort in the state of West Bengal, India, The Nature Environment and Wildlife Society (NEWS), an Indian NGO, and the Livelihoods Fund are working with the local communities to restore mangrove forests by planting more than 16 million individual mangroves covering 5,500 hectares. The mangroves will strengthen the man-made embankments that have been constructed to protect the communities’ homes and farmlands against rapidly encroaching waters in the delta. They will produce fish and shellfish to bring additional income and nutritional value to the communities. Over the next twenty years, the mangroves will also provide an anticipated 700,000 metric tons of carbon offsets for corporate partners involved in financing the project. Such projects also have important social development aspects. NEWS is training the women from local communities to establish mangrove nurseries, and to
Restoration in Action
TNC scientist Judy Haner inspects a newly constructed oyster reef, designed to reduce coastal erosion, in Mobile Bay, Alabama, USA.
M A N A G I N G , P R O T E C T I N G A N D E N H A N C I N G S E R V I C E S
Atlas of Ocean Wealth | Part Two90

Ken Nedimyer and Stephanie Roach of Coral Restoration Foundation attach newly fragmented corals to a line nursery in their nursery east of Key Largo, Florida.
Managing, Protecting and Enhancing Services 91

oversee the planting and management of mangrove trees in the field. This knowledge and new skills elevates their status in the local communities and empowers them with a sense of pride through their involvement in a project with both local and global benefits. Others are focusing attention on restoration and conservation of this vast extent of mangroves, including the government of India and World Wildlife Fund, underscoring the value of these ecosystems to the communities in the Sundarbans.
Mangrove restoration on more rapidly eroding coastlines can be considerably more challenging. Huge areas of mangroves in Southeast Asia have been converted to shrimp aquaculture ponds, but, typically, after a few years these become unproductive. Without active maintenance the pond margins begin to erode—in parts of Thailand, Vietnam and Indonesia the sea is moving landwards at tens-to-hundreds of meters every year. In such settings, mangroves cannot simply be planted, but scientists are refining techniques developed centuries ago in northern Europe. By supporting local communities to build natural, semi-permeable barriers, they break the incoming water flows and allow the stabilization of the sediments. Mangrove recovery can then be rapid and, once established, it is possible to break the cycles of erosion that were rapidly eroding the very territories of these countries and threatening homes and farmland.
Restoring Corals
The southern tip of Florida is sheltered by an extensive tract of coral reef, providing important benefits for more than 5 million people who live in its lee. Tourists visiting Florida spend more than US$4 billion on fishing and diving along the reef each year, supporting more than 80,000 jobs. For the Florida Keys, south of Miami, it is safe to say the reef is the primary engine for the local economy. Like reefs in many other parts of the region, the reefs along Florida’s coast have suffered from various stresses, including poor water quality, storms, warming waters, and direct impacts from tourism activities and coastal development. Florida's reefs now receive some protection through the Florida Keys National Marine Sanctuary, Biscayne Bay and Dry Tortugas National Parks and state level laws, but restoration is becoming a clear priority within the region. Two coral species in particular— staghorn and elkhorn—which once played a critical role in reef-building, have become rare, affecting the overall structure and vitality of very large areas of the reef. There is a growing movement to actively restore these species throughout the Florida reef tract, driven in large measure by the desire to restore the reef's overall function.
The approach to restoring these species has been pioneered in the Keys and taken to scale by a coalition of conservation organizations, state and federal agencies and research institutions. One partner is one of the key beneficiaries of healthy reefs. Fury Watersports, the largest tourism operator in Key West, is donating a portion of the fee for every snorkel trip passenger to Mote Marine Laboratory, a science and research institute that is involved in coral restoration. This reflects the company’s recognition that there is a direct link between the integrity of local coral reefs and their long-term business success.
To date, more than 14,000 coral colonies have been grown and transplanted to 100 sites throughout the Florida reef tract. Similar approaches are being developed worldwide. By 2013 at least 86 coral species and over 100,000 colonies had been raised in nurseries across the Caribbean, Southeast Asia and the Pacific and Indian Oceans. Restoration efforts are driven by deep concerns for the fate of reefs in the face of increasing declines, and by the desire to maintain or restore the many critical benefits they provide.
M A N A G I N G , P R O T E C T I N G A N D E N H A N C I N G S E R V I C E S
Outplanted staghorn coral in the U.S. Virgin Islands after one year of growth.
Atlas of Ocean Wealth | Part Two92

Some 14,000 coral colonies have been grown in nurseries and transplanted to 100 sites along the Florida reef tract. Similar projects are found in the US Virgin Islands, and around the world.
Coral Nurseries and Out-Planting Locations in Florida and the US Virgin Islands
A diver studies Perfection Reef, the site of elkhorn coral outplanting by The Nature Conservancy in Dry Tortugas National Park.
CORAL NURSERIES OUTPLANT SITES
Managing, Protecting and Enhancing Services 93

Under the Economics of Coastal Adaptation app in the coastalresilience explorer, users are able to develop a cost-benefit curve under different scenarios for different coastal defense interventions. In many cases the restoration of key coastal habitats, including barrier islands, wetlands and oyster reefs not only provide significant averted damages, but also some of the highest benefit: cost ratios.
Paying What is OwedNew and better information about the function and benefits of ecosystems can inform business decisions, spur investment in conservation and
help shape economic development agendas worldwide.
arine systems suffer from many anthropogenic stressors—habitat loss, degradation, overconsumption among others—which, in turn, significantly affect the ecological functions of marine systems. What
is not always easily captured, however, are the economic losses associated with ecosystem degradation. Even many coastal resource managers overlook ecosystem values when making decisions around development or the extraction of natural goods to be sold in marketplaces. This accounting failure leads to perverse decisions, where habitat loss and degradation ultimately hurt communities and economies. It also leads to opportunities to capture economic returns while enhancing natural capital systems—the ultimate “win-win”—to be overlooked. To correct the problem, there must be a paradigm shift in the way we conduct economic accounting.
In this section, we first consider elements of economic valuation and how these can be worked into wider economic planning and accounting. On the following pages, we explore the many and growing opportunities to increase investment and expand financing opportunities to support the conservation or, indeed the enhancement of marine and coastal ecosystem services.
Finding the Economic Value
In previous chapters, we have explained the various values that nature provides in mostly ecological and biophysical terms—a reef produces so many metric tons of fish or a mangrove reduces wave energy by so many percent. But what does that mean in economic terms? Further, how might that translate into a financial investment opportunity? Direct-use benefits, like fish production, are relatively easy to monetize: they have market prices and can be traded. Non-use regulating services, such as coastal protection and climate stabilization, are harder to monetize even though they have an economic benefit to people. Further challenges arise when it comes to telling the story of the multiple overlapping values provided by marine systems. It may be critical when making a development decision to factor in all the benefits that come with an ecosystem and the economic and social costs if it was lost.
We employ a range of methods to develop fair and comparable economic values. Simplest is the market price. While often presented as the value
that might be received in a market, adjusted market price is a more useful metric, which takes out the disparities in pricing that might come from subsidies and taxes or other distortions relating to sustainability and supply. Market-type calculations also form the basis for avoided cost and replacement cost estimates which have proved useful for ascertaining the value of regulating services such as coastal protection. They provide a value for the cost of building a seawall, for instance, that would perform the same function as the ecosystem and assign that as a value to the ecosystem itself.
Other times, the value of a service can be inferred from values and expenditure. We call this revealed preference as seen, for example, in the additional value assigned to environmental quality (hedonic price), such as the higher house prices associated with sea views. Value can also be revealed by travel cost methods which simply look at how far, or for how long, people are willing to travel to get to a place. A final class of metrics tries to ascertain how much people think a service may be worth.
M
Atlas of Ocean Wealth | Part Two94

Market prices are simple to determine for fish and other harvested resources, although taxes and subsidies can distort such values, particularly in trying to understand international values.
Such stated preference approaches are often a method of last resort, but are useful to assess value where no other methods may be available, including many non-material values, such as cultural or spiritual importance.
To place ecosystem services into broader economic and investment frameworks, valuation approaches need to be transparent, honest and trusted. It is important that they can be placed directly alongside values from other sectors of the economy, which may impinge upon marine and coastal ecosystem service delivery. At the same time, it is important to broaden the scope of such economic discussions. The world of economic theory and modeling, and indeed the world of economic transactions, is often constrained by regulatory or other controls which focus on short timeframes and narrow sections of society and commerce. Innovative approaches may allow new markets, and greater recognition for long-term costs, or other market and societal sectors.
Consider the prospect of converting a mangrove forest to aquaculture ponds. Often, the short-term income that can be captured from such a conversion will be immense, especially if land costs or fuel costs are subsidized or not internalized in the business. Such incomes, however, are concentrated in the hands of only a few people. The net impact can be a loss of productivity leading to job losses and income losses for many, with only a few finding work in aquaculture. Further, the long-term returns for aquaculture are often very poor. If investment models only look to short-term cash generation, or are modeled without proper weighting to the future values of natural capital assets, they will always appear to be a financially sound option.
Incorporating Ecosystem Service Benefits of Nature into Risks Models
In the last three years, thirty-two million people have been displaced by natural disasters. As we continue to experience more intense storms and sea level rise, this number will only increase. Billions of dollars are now being spent on risk reduction from coastal hazards. These actions create both threats and opportunities for natural systems. The vast majority of these investments go toward built infrastructure, such as seawalls and levees. Globally, we spend 400-times more on coastal gray infrastructure than we do on coastal conservation. While gray infrastructure may be the only solution in many settings, there is a growing awareness that green infrastructure, or gray-green combinations, can by highly effective at relatively low cost.
This is a significant opportunity to engage with the reinsurance and engineering sector to incorporate nature into risk- and cost-effectiveness models. This would inform insurers and consequently the buyers of insurance, but it could also influence lenders and development banks seeking better assessment of risk in their climate investment portfolios.
The Nature Conservancy is working with the insurance industry and its customers to improve their models of risk by incorporating ecosystems risk mitigation. Where natural infrastructure serves an important protective value this could potentially reduce insurance premiums, which could incentivize private businesses and governments to invest in natural infrastructure as a way to reduce the cost of insurance.
Under a joint initiative, Swiss Re (a reinsurance company) and The Nature Conservancy assessed climate risk and quantified the costs and benefits of coastal adaptation options across the Gulf of Mexico, USA. Coastal hazards from rising sea levels and changes in storm patterns contribute the most to future risk. After quantifying climate risk and its drivers, the cost and benefits of coastal adaptation options were assessed Gulf-wide, including nature-based or green options (e.g., wetland restoration), gray or artificial defenses (e.g., seawalls) and policy alternatives (elevation of homes). While risk reduction is best achieved through a combination of strategies, in many places nature-based options were found to be among the most cost effective means at avert significant future damages.
Paying What Is Owed 95

The detailed modeling and quantification of ecosystem services provides an entirely new opportunity to support nature conservation using market and investment mechanisms. These cannot replace traditional donor funding, but they can play a critical complementary role and massively increase the pool of capital available for the conservation of important resources.
Despite widespread recognition of the many problems facing natural resources, and despite growing recognition of the direct value of nature to people, funding for nature conservation efforts falls far short of needs and of commitments made under international agreements, and ecosystems continue to be lost at alarming rates. New and additional funding is thus urgently needed, and there is growing interest and opportunity to look beyond traditional conservation funding, which typically comes from a combination of national government allocations, overseas development assistance, grants and private philanthropy.
The quantification of ecosystem services is a critical precondition for effective conservation financing. If their potential market value is clearly demonstrated, many ecosystems can hold their own in a market setting when placed alongside alternatives that may lead to ecosystem degradation or destruction. Attractive financial returns identified by this type of valuation will likely have far greater influence on many business/investment actors than appeals to less-defined qualitative measures of importance. At their simplest these approaches may be little more than an expansion of what is already recognized in various payments for the services rendered by nature—payments for ecosystem services (PES). Beyond such approaches, however, there are innovative approaches that may enable the raising of capital or the trading of services or costs in a market-based setting.
Licensed Access
In the presence of a clear and valued good (a “Resource”) and a mechanism to control access, the option to control (or limit) access can be achieved through licensing, with fees clearly showing a direct value for the good or service. In many cases, the income from licensing can be directly used to help manage the Resource. This is most clearly observed in fisheries licensing, where vessels can buy, often through a bidding process, licenses for access on a time-limited basis, often further constrained by catch limits (Total Allowable Catch, TAC). In extensive waters of the eight countries of the Pacific Nauru Agreement, for example, purse seine fishing vessels buy
the right to fish, and total effort is capped to a fixed number of vessel fishing days. A single-vessel fishing day license cost US$8,000 in 2015, but some licenses were trading for as much as US$10,000 per day.
Another example concerns the franchising of particular wildlife watching activities. Whale-watching operations are strictly controlled in many countries, such as South Africa, Mexico, Tonga and Australia, and operators hoping to work in these areas must pay for, or even bid for, licenses, which can be restricted with a competitive tendering process beginning to appear in some countries. In some settings permits can be traded.
Innovative Financing
Large tuna purse seine fishing boats in Micronesia, off-loading their catches to trampers that will keep the tuna frozen as they move to ports in China and Japan. These vessels pay large daily license fees to the countries of the Pacific Nauru Agreement in order to fish in these productive waters.
P A Y I N G W H A T I S O W E D
Atlas of Ocean Wealth | Part Two96
Payments for Ecosystem Services
Payments for Ecosystem Services (PES) uses market mechanisms to pay people to sustainably manage their natural resources so the ecosystem is able to function and deliver valuable ecosystem services. The payments go directly to those that are providing the service (i.e., protection or restoration of the ecosystem) rather than fees that are managed by government agencies where a portion of the funds are diverted to other places or initiatives. Putting the money directly in the hands of the local communities gives them a sense of ownership of their natural assets and can allow them to raise capital based on their ability to provide funders with monetized returns.
Visitor Fees
Visitor fees are charges levied on tourists and can be collected at a wide range of levels—from national- to site-based. This source of funding can be used for conservation in countries where tourism is driven by nature-based tourism, or “ecotourism.” This is especially important in countries where tourism is a significant part of their gross domestic product (GDP). Funding is often best run through an independently administered trust, providing grants for conservation and sustainable infrastructure to reduce the strain that tourism can place on natural ecosystems. This structure can run parallel to the underlying property/hospitality returns typically captured in a commercial structure.
Market Mechanisms
Developing or adapting existing markets can be a highly efficient means to solve environmental problems. The “cap and trade” approach adopted under an amendment to the US Clean Air Act in 1990 is one of the best examples. Here government regulation limited emissions of sulphur dioxide, a major driver of acid rain. The electrical utilities who were generating this pollutant were then issued with permit to emit sulphur dioxide up to certain limits. These permits could be traded with other polluters. A market quickly emerged with the cleaner, more-efficient companies able to reduce their emissions and sell their surplus permits to less-efficient firms who were unable or unwilling to invest in new, low-emissions equipment. Speculators entered the market to bet on future prices. It was predicted that this would be the cheapest means to move towards an overall emissions cut, and indeed rapid cuts were achieved at one-tenth of the predicted cost.
In a similar way, carbon markets could, in the future, create a significant investment opportunity for coastal wetlands with their high per-hectare carbon value. A carbon offset is any instrument that represents the avoided emissions of one metric ton of carbon dioxide equivalent (CO2e, which can be carbon dioxide or the equivalent value of other greenhouse gases such as methane) and can be used under offset or trading schemes (such as the EU Emissions Trading Scheme) to balance out the equivalent “surplus” emissions elsewhere in the system—typically arising from burning fossil fuels for power generation or transport or in industrial processes. The voluntary market is driven by companies and individuals that are offsetting their emissions without needing to meet a regulatory ceiling (i.e., emissions offsets from an airplane ride). Compliance offset markets, on the other hand, are driven by mandated caps imposed by regulatory agencies. The United Nations Clean Development Mechanisms is the largest carbon compliance market regulated by the United Nations and the market is one of the sources of offsets for Kyoto Protocol Signatory Countries, but other regulated markets attracting interest include the introduction of a regulated cap-and-trade system in California operating since 2013 and the planned implementation of a national cap-and-trade scheme in China in 2017, building on three years of experience with seven provincial pilot schemes.
Biodiversity offset markets were developed to allow development projects that cause a loss to biodiversity to be undertaken on a ‘no net loss’ basis. In order to be counted, the project needs to first demonstrate it has undergone all possible actions to mitigate the chance of biodiversity loss. Once it is determined that an offset is required, the biodiversity conservation purchased must be at least equal to the loss. The Business and Biodiversity Offsets Programme (BBOP) is an example of a biodiversity market composed of 80 leading companies, financial institutions, government agencies and non-profits. While currently biodiversity markets do not exist for purely marine systems, coastal wetlands do qualify.
Mitigation Payments
For natural resource economies, one of the more innovative sources of funding for marine conservation is payments from development activities (extractive industry or other) based on a calculated dollar value of environmental impact. This contrasts with offsets, where company is responsible for protecting or restoring an equivalent area. In the USA alone, development mitigation payments generate over US$4 billion each year. These can be mandated
Paying What Is Owed 97

through government regulation or contributed through both voluntary and regulatory programs. In particular, given the expected growth of offshore activities such as oil and gas, renewable energy and seabed mining, there is an opportunity to require and enforce mitigation activities.
“Blue Bonds”
Green bonds are an asset class issued in order to raise finance for conservation activities. The market for green bonds is growing exponentially, reaching US$42 billion in new issuance in 2015 and with expectations of US$100 billion in 2016. The concept is for banks, governments and companies to fund investments that will have specific environmental benefits. The use of proceeds is designated to support “green” projects, but the obligation to pay interest and principal remains, in most cases, a “full faith and credit” obligation of the issuer (i.e., it is not specifically tied to the performance of the projects). Green project investment is very broadly defined (some would say too broadly) and includes everything from new solar and wind power generation projects to funding auto loans for hybrid and electric vehicles. The market has been extremely successful and there are opportunities to tap into it for marine projects, with the development of “blue bonds” in sectors
ranging from offshore renewables to sustainable maritime industries, fisheries and natural infrastructure. While there are some countries looking at bonds to fund marine conservation (see Seychelles debt for adaptation), uptake has been limited to date. Even so, this market would be available today to any government or company with a portfolio of “shovel ready” marine conservation or protection projects ready to absorb bond issuance proceeds.
Words of Caution
Some in the conservation community express concern that the monetizing of nature is a high-risk approach. What will happen when ecosystems have a lower market value than alternatives? By exposing them to the marketplace we may hasten their demise. This is certainly an issue that must be taken seriously. Perhaps the most important response is that these market-based approaches will likely only benefit conservation as a whole if they are seen as additive to the existing arguments for conservation efforts, and if the funding they bring is additional to existing funding.
Additionally, just having the money is not enough for conservation. It is also about how effectively the money is spent, how well benefits are provided to local stakeholders and how well monitored are the natural sites.
Galapagos penguins and snorkeler in the Galapagos, Ecuador. The government in the Galapagos charges every tourist upon arrival a fee that goes to conservation activities.
P A Y I N G W H A T I S O W E D
Atlas of Ocean Wealth | Part Two98

Seychelles: Debt for Nature
The Seychelles is an archipelago nation of 115 islands in the Western
Indian Ocean about 100 miles off the coasts of East Africa and north
of Madagascar. With an Exclusive Economic Zone of 1,374,000 square
kilometers it is not surprising that ocean and coastal areas occupy a
major place in the identity, and the daily life of Seychellois and in the
country’s economic activity, most importantly fisheries and tourism.
Both sectors are relying on healthy marine and coastal ecosystems and
are highly vulnerable to climate change impacts, such as tropical storms,
at very high costs to the country’s economy and environment.
To help finance marine conservation and climate adaptation, the
Government of Seychelles and its Paris Club creditors designed a debt
swap to help the government redirect a portion of its debt payments
towards marine conservation and climate adaptation.
A combination of impact investment funds and grants raised US$15.2
million in impact capital loans and US$5 million in grants to buy back
US$21.6 million of Seychelles debt. The cash flow from the restructured
debt is payable to and managed by an independent, nationally based,
public-private trust fund called the Seychelles Conservation and Climate
Adaptation Trust (SeyCCAT).
This innovative financial tool will allow Seychelles to restructure its debt,
freeing capital streams it can direct toward climate change adaptation
and marine conservation activities to the benefit of their fisheries and
tourism industries and ultimately the livelihoods of their citizens.
With a small land area, but a vast ocean territory, and an economy highly dependent on fisheries and tourism, it is critical for this country to manage marine resources for the long-term.
Paying What Is Owed 99

A Future VisionThroughout this book, we have shown that protecting or restoring ecosystem services is the commonsense option. Through maps and models,
we can now quantify the many values of nature, and we can explore the variation in values from place to place. This is critical knowledge to bring ecosystem services into the processes of planning, financing and management. Failing to do this threatens not only biodiversity, but also
the lives and livelihoods of hundreds of millions of people around the world.
n exciting phenomenon is spreading from community to community in countries as far afield as Chile and Vanuatu. Empowered with local ownership of marine resources, and supported by new knowledge
from recent ecological research, local communities have learned, or in some cases re-learned, that by setting aside portions of the seabed under their jurisdiction they create fish factories. Selection of the right place counts: the best parts of a rocky reef, or a coral reef, will be breeding grounds and nursery grounds. The most important part of this story, however is not the science, or the ecology, it is the uptake and application by people with the interest and authority to act. Science and tradition provided the knowledge, policy-makers provided an enabling environment, and communities and stakeholders shared the responsibility for changing the status quo. In this way, the phenomenon took hold. Hundreds of communities in Chile, Vanuatu and elsewhere are establishing no-take fishing reserves, not directly based on scientific or governmental advice, but because they have learned from their neighbors, by word-of-mouth, or have seen with their own eyes the benefits of protecting fish production.
For millennia humans have benefited from food and materials from the oceans and from the hidden benefits of storm protection and climate mitigation. These same ecosystems, and their benefits, have been treasured in cultural and spiritual settings generation after generation. But ocean and coastal areas today are at a crossroads: with vast and still rapidly expanding coastal populations, and with new activities crowding in on traditional uses, there have never been so many pressures. Many ocean ecosystems are in decline, and many decision makers are unaware of the benefits being threatened and lost by an accelerating race to exploit this space. In this setting, there is a real and urgent need to re-tell the story of the value of nature.
The goal of quantifying ecosystem services is to bring a series of important truths to bear in modern social and economic settings. Work is growing in many sectors to do this. Concepts such as ecosystem-based fisheries management and the protection of essential fish habitat are being applied and leading to renewal of fisheries in a growing number of countries.
Rudimentary efforts are being made to encourage financial support for maintaining the carbon benefits from mangrove forests. Coral reefs and oyster reefs are being restored, driven by the perceptions of human benefits. These and other benefits all show strong spatial patterns and drivers, but our knowledge and application of these remains hampered by a lack of information.
Through the Mapping Ocean Wealth initiative, we have convened some of the best minds and some of the largest ecosystem services datasets ever assembled to address this challenge. The Atlas of Ocean Wealth illustrates a remarkable advance from qualitative to quantitative understanding—from conceptual to quantitative models, and from large-scale averages to detailed maps showing spatial distribution of ocean benefits. While work is continuing, we have already laid out a compelling array of information. We see, in wave upon wave of examples, numerous ecosystem benefits that we need to maintain and restore, for our own good.
It is critical both to describe ecosystem values, and to ensure that these values are accounted for in the increasingly competitive demands for the use of ocean space. The many partners and contributors to this work are also agents for change. In Micronesia, Mexico and Indonesia, The Nature Conservancy is already working with governments and stakeholders to develop management plans that inform future decisions. Our partners at the World Resources Institute, the World Bank, Blue Solutions and others such as the Natural Capital Project, are likewise already working with their own networks and partners to achieve similar influence. On a separate front, the work is beginning to lead to changes in the views and approaches of the global academic community, and our partnerships with leading universities in the Australia, USA, Mexico, France, Spain, the UK, and Indonesia are helping to lead and to inform this process. Our commitments to sharing our data and our models should accelerate this process. Finally, at the level of influencing wider policy and opinion, our partnerships with key communicators and policy leaders, including GRID-Arendal, the World Bank, the Marine Ecosystem Services Partnership and other NGOs are also helping to shift public attitudes and to bring ecosystem services into international policy.
A
Atlas of Ocean Wealth | Part Two100

But more is needed.
The case for protecting and restoring ecosystem services is already compelling, but there is still much we do not know. There are services and benefits we have barely touched on here. Others exist where deeper analyses will strengthen and improve decisions. “More research is needed” is a regular refrain from the academic community, but our approach has been to make the most of what exists, synthesizing information and reconfiguring it into models to produce an entirely new form of ocean knowledge. More data is certainly needed, but by extending our approach on the volumes of existing data and the accumulated knowledge of experts around the world, there has been enough to make a powerful start. And enough remains to fuel many more studies, on tourism, on water purification, on blue carbon, and on the challenges of quantifying non-use values.
Equally important is to increase the uptake and application of what we now know. We need to do far more to build the holistic application of this knowledge—to build models and maps that incorporate the "bundles" of services that exist in a given location and across multiple ecosystems. We need to better understand the interplay between these and alternative scenarios of ocean use: of trade-offs and opportunity costs. There are new opportunities to be explored and developed in the rapidly growing arena of financing, including novel financial mechanisms to generate funding to secure ecosystem services, and novel markets to support sound management or restoration.
Communication is central to this uptake and application. Exciting scientific revelations change nothing if they cannot be used to change perceptions and attitudes. And such communication will be enriched if we have examples to learn from and to leverage. This needs to include examples of application—of communities benefitting from ecosystem services, and of societies that have developed the means to put such services into coastal planning and management.
We are telling a story that is as old as the oceans themselves, but we are re-telling it from a new vantage point. The urgency could not be greater. The truths about our dependence on nature are compelling. Building this new knowledge into decisions and action will safeguard the lives and livelihoods of millions, and enrich our planet for generations to come.
Celtic Sea, Northeast Atlantic.
A Future Vision 101

The sources listed below are the main published or publicly available sources for the text and maps. In a few cases, the maps are still under development or in review. Where this is the case, we have noted below and this work represents the primary source. Readers are advised to research the recent literature to see when the final maps are published, particularly as such maps may be improved or refined over time.
Where contributing authors are listed, they have typically been closely involved with the work, in some cases they have led the work, or have contributed substantially to the content of this book through review, revision or the drafting of small sections.
IntroductionFAO. 2014. The State of World Fisheries and Aquaculture 2014. Food and Agriculture Organization of the United Nations: Rome; p. 197.
Galland G, Rogers A & Nickson A. 2016. Netting Billions: A Global Valuation of Tuna. The Pew Charitable Trusts.
Kumar PB. 2010. The Economics of Ecosystems and Biodiversity: Ecological and Economic Foundations. In Environment and Development Economics. Earthscan: London and Washington; p. 410.
Millennium Ecosystem Assessment. 2005. Ecosystems and Human Well-Being: Synthesis. In Millennium Ecosystem Assessment Series. Island Press: Washington DC.
Swartz W, Sumaila R & Watson R. 2012. Global Ex-vessel Fish Price Database Revisited: A New Approach for Estimating ‘Missing’ Prices. In Environmental and Resource Economics. Springer Netherlands; 56: p. 467–480.
The World Bank. 2015. Brief: The Sunken Billions Revisited: Progress and Challenges in Global Marine Fisheries. The World Bank: Washington DC.
Part 1 A Host of Services
Making FishContributing author: Philine zu Ermgassen
Mangroves
The global map presented represents an interim map (albeit published, referenced below). A revised version is under development.
Hutchison J, Spalding M & zu Ermgassen P. 2014. The Role of Mangroves in Fisheries Enhancement. The Nature Conservancy and Wetlands International; p. 54.
Hutchison J, Philipp DP, Claussen JE, Aburto-Oropeza O, Carrasquilla-Henao M, Castellanos-Galindo GA, Costa MT, Daneshgar PD, Hartmann HJ, Juanes F, Khan MN, Knowles L, Knudsen E, Lee SY, Murchie KJ, Tiedemann J, zu Ermgassen P & Spalding M. 2015. Building an expert-judgement based model of mangrove fisheries. In American Fisheries Society Symposium; 83: p. 17-42.
Gulf of California
Contributors: Andrew F. Johnson, Marcia Moreno-Báez, Andrés Cisneros Montemayor, Alvin Suárez, Octavio Aburto-Oropeza.
Work still in preparation, report expected.
Johnson, AF (in rev) Estimating the extent of natural resource extractions in data-poor scenarios
Seagrasses and Saltmarshes
Further regional studies for the US coast are under development for both habitats, in partnership with NOAA.
Blandon A & Zu Ermgassen P. 2014. Quantitative estimate of commercial fish enhancement by seagrass habitat in southern Australia. In Estuarine, Coastal and Shelf Science; 141: p. 1-8.
Sources and Technical Notes
Atlas of Ocean Wealth102

Minello TJ, Matthews GA, Caldwell PA & Rozas LP. 2008. Population and Production Estimates for Decapod Crustaceans in Wetlands of Galveston Bay, Texas. In Transactions of the American Fisheries Society. 137: p. 129-146.
Oyster Reefs
A further publication on the economic value of oyster enhancement is in preparation.
zu Ermgassen PSE, Grabowski JH, Gair JR & Powers SP. 2015. Quantifying fish and mobile invertebrate production from conservation and restoration of threatened nursery habitats. In Journal of Applied Ecology; 53: p. 596-606.
Gulf of Maine
Contributing author: Jonathan Grabowski
Unpublished work, further maps and outputs under development and in preparation.
Pelagic Fish
Contributing author: Glaudy Perdanahardja
Unpublished work.
Coral Reefs
Contributing authors: Alistair Harborne, Alison Green, Lauretta Burke (global)
The global map is unpublished. The Micronesia maps are available in report form (reference below) and a publication is in preparation.
Harborne AR. 2016. Modeling and Mapping Fishing Pressure and the Current and Potential Standing Stock of Coral Reef Fishes in Five Jurisdictions of Micronesia. Marine Spatial Ecology Lab, University of Queensland: Brisbane, Australia; p. 80.
Breaking WavesContributing authors: Mike Beck, Iñigo Losada, Borja Reguero, Pelayo Menendez, Lauretta Burke
Beck M & Lange G-M. 2016. Managing Coasts with Natural Solutions: Guidelines for Measuring and Valuing the Coastal Protection Services of Mangroves and Coral Reefs. Wealth Accounting and the Valuation of Ecosystem Services Partnership (WAVES), World Bank: Washington, DC; p. 166.
Beck MW. 2014. Coasts at Risk: An Assessment of Coastal Risks and the Role of Environmental Solutions. United Nations University - Institute for Environment and Human Security (UNU-EHS), The Nature Conservancy (TNC) and the Coastal Resources Center (CRC) at the University of Rhode Island Graduate School of Oceanography: Bonn, Germany; Arlington, Virginia; and Narragansett, Rhode Island; p. 149.
Narayan S, Beck MW, Reguero BG, Losada IJ, van Wesenbeeck B, Pontee N, Sanchirico JN, Ingram JC, Lange G-M & Burks-Copes KA. 2016. The Effectiveness, Costs and Coastal Protection Benefits of Natural and Nature-Based Defences. In PLoS ONE. Public Library of Science; e0154735.
Spalding MD, McIvor AL, Beck MW, Koch EW, Möller I, Reed DJ, Rubinoff P, Spencer T, Tolhurst TJ, Wamsley TV, Wesenbeeck BKv, Wolanski E & Woodroffe CD. 2013. Coastal ecosystems: a critical element of risk reduction. Conservation Letters; 7: p. 293-301.
Mangroves
McIvor, A.L., Spencer, T., Möller, I. and Spalding. M. (2013) The response of mangrove soil surface elevation to sea level rise. Natural Coastal Protection Series: Report 3. Cambridge Coastal Research Unit Working Paper 42. The Nature Conservancy and Wetlands International. p. 59.
McIvor A.L, Möller I, Spencer T & Spalding M. 2012. Reduction of Wind and Swell Waves by Mangroves. Natural Coastal Protection Series: Report 1. The Nature Conservancy, University of Cambridge, and Wetlands International: Cambridge, UK; p. 27.
McIvor A.L, Möller I, Spencer T & Spalding M. 2013. Mangroves as a sustainable coastal defence. In 7th International Conference on Asian and Pacific Coasts (APAC). The Nature Conservancy, University of Cambridge, and Wetlands International: Bali, Indonesia, September 24-26; p. 8.
Technical Notes 103
https://www.conservationgateway.org/ConservationPractices/Marine/crr/library/Pages/coastsatrisk.aspx

Narayan S et al. 2016. The Effectiveness, Costs and Coastal Protection Benefits of Natural and Nature-Based Defences. In PLoS ONE. Public Library of Science; e0154735.
McIvor A, Spencer T, Spalding M, Lacambra C & Möller I. 2015. Mangroves, tropical cyclones and coastal hazard risk reduction. In Coastal and Marine Hazards, Risks, and Disasters, Ellis JT, Sherman DJ (eds). Elsevier: Amsterdam; p. 403-429.
Seagrass
Anderson ME, Smith JM & McKay SK. 2011. Wave Dissipation by Vegetation. Coastal and Hydraulics Engineering Technical Note ERDC/CHL CHETN-I-82. In Coastal and Hydraulics Engineering Technical Note. U.S. Army Engineer Research and Development Center: Vicksburg, MS; p. 22.
Ondiviela B, Losada IJ, Lara JL, Maza M, Galván C, Bouma TJ & van Belzen J. in press. The role of seagrasses in coastal protection in a changing climate. In Coastal Engineering; 83: p. 158-168.
Temperate Shores
Kroeger T & Guannel G. 2014. Fishery enhancement, coastal protection and water quality services provided by two restored Gulf of Mexico oyster reefs. In Valuing Ecosystem Services - Methodological Issues and Case Studies, Ninan KN (ed). Edward Elgar Publishing: Cheltenham, UK; p. 334-357.
Anderson ME et al. 2011. Wave Dissipation by Vegetation. Coastal and Hydraulics Engineering Technical Note ERDC/CHL CHETN-I-82. In Coastal and Hydraulics Engineering Technical Note. U.S. Army Engineer Research and Development Center: Vicksburg, MS; p. 22.
Grabowski JH et al. 2012. Economic valuation of ecosystem services provided by oyster reefs. In Bioscience; 62: p. 900-909.
Narayan S et al. 2016. The Effectiveness, Costs and Coastal Protection Benefits of Natural and Nature-Based Defences. In PLoS ONE. Public Library of Science; e0154735.
Shepard CC, Crain CM & Beck MW. 2011. The protective role of coastal marshes: a systematic review and meta-analysis. In PLoS ONE; e27374.
Coral Reefs
Contributing author: Lauretta Burke
Alvarez-Filip L, Dulvy NK, Gill JA, Côté IM & Watkinson AR. 2009. Flattening of Caribbean coral reefs: region-wide declines in architectural complexity. In Proceedings of the Royal Society B: Biological Sciences; 276: p. 3019-3025.
Beck M & Lange G-M. 2016. Managing Coasts with Natural Solutions: Guidelines for Measuring and Valuing the Coastal Protection Services of Mangroves and Coral Reefs. Wealth Accounting and the Valuation of Ecosystem Services Partnership (WAVES), World Bank: Washington, DC; p. 166.
Burke L, Reytar K, Spalding M & Perry AL. 2011. Reefs at Risk Revisited. World Resources Institute, The Nature Conservancy, WorldFish Center, International Coral Reef Action Network, UNEP World Conservation Monitoring Centre and Global Coral Reef Monitoring Network: Washington, D.C.; p. 114.
Ferrario F, Beck MW, Storlazzi CD, Micheli F, Shepard CC & Airoldi L. 2014. The effectiveness of coral reefs for coastal hazard risk reduction and adaptation. In Nature Communications; 5: p. 9.
Cleaning UpContributing authors: Boze Hancock, Philine zu Ermgassen
Oyster Reefs
Zu Ermgassen PSE, Gray MW, Langdon CJ, Spalding MD & Brumbaugh R. 2013. Quantifying the historic contribution of Olympia oysters to filtration in Pacific Coast (USA) estuaries, and the implications for restoration objectives. In Aquatic Ecology. ; 47: p. 149-161.
Zu Ermgassen PSE, Spalding MD, Grizzle R & Brumbaugh R. 2013. Quantifying the loss of a marine ecosystem service: filtration by the Eastern Oyster in US estuaries. In Estuaries and Coasts; 36: p. 36-43.
Zu Ermgassen PSE, Spalding MD & Brumbaugh R. 2015. Estimates of historic ecosystem service provision can guide restoration efforts. In Applying Marine Historical Ecology to Conservation and Management: Using the Past to Manage for the Future, Kittinger JN, McClenachan L, Gedan KB, Blight LK (eds); p. 187-206.
Atlas of Ocean Wealth104

Storing CarbonThe global saltmarsh map is a synthesis drawn from the low-resolution mosaic map developed by TNC and UNEP-WCMC that combines locational data from multiple sources.
Seagrasses are from:
UNEP-WCMC, Short FT (2005). Global distribution of seagrasses (version 3.0). Third update to the data layer used in Spalding et al (2003). Cambridge (UK): UNEP World Conservation Monitoring Centre.
Mangroves
New work on carbon content of mangrove soils is in preparation.
Contributing author: Leah Glass
Hutchison J, Manica A, Swetnam R, Balmford A & Spalding M. 2013. Predicting global patterns in the carbon storage of mangrove forests. In Conservation Letters; 7: p. 233-240.
The Value of VisitorsContributing author: Lauretta Burke
Cisneros-Montemayor AM & Sumaila UR. 2010. A global estimate of benefits from ecosystem-based marine recreation: potential impacts and implications for management. In Journal of Bioeconomics; 12: p. 245-268.
DEMA. 2015. Fast Facts: Recreational Scuba Diving and Snorkeling. Diving Equipment and Marketing Association; p. 8.
Hutchison J, Spalding M & zu Ermgassen P. 2014. The Role of Mangroves in Fisheries Enhancement. The Nature Conservancy and Wetlands International; p. 54
WTTC. 2014. Travel & Tourism. Economic Impact 2014: World. World Travel and Tourism Council: London.
Coral Reefs
The coral reef tourism map is unpublished, but a paper is in prep.
Wood SA, Guerry AD, Silver JM & Lacayo M. 2013. Using social media to quantify nature-based tourism and recreation. In Scientific Reports.
WTTC. 2014. Travel & Tourism. Economic Impact 2014: World. World Travel and Tourism Council: London.
Mangroves
Contributing author: Cara Daneel
English language versions of TripAdvisor included some 2,000 reviews. Subsequent searches found around 500 attractions each in the French, Spanish and Portuguese language pages of TripAdvisor, including many additional sites, particularly in South and Central America. At press, these had not been combined and the more-detailed review was restricted to English language attractions. The mangrove map is unpublished, but a paper is in preparation.
Watching Wildlife
Contributing authors: Mariana Walther Mendoza, Glaudy Perdanahardja
Cisneros-Montemayor AM, Barnes-Mauthe M, Al-Abdulrazzak D, Navarro-Holm E & Sumaila UR. 2013. Global economic value of shark ecotourism: implications for conservation. In Oryx; 47: p. 381-388.
O’Malley MP, Lee-Brooks K & Medd HB. 2013. The Global Economic Impact of Manta Ray Watching Tourism. In PLoS ONE. Public Library of Science; e65051.
Vianna GMS, Meekan MG, Pannell DJ, Marsh SP & Meeuwig JJ. 2012. Socio-economic value and community benefits from shark-diving tourism in Palau: A sustainable use of reef shark populations. In Biological Conservation; 145: p. 267-277.
Technical Notes 105
The Value of Just Being There
Cultural and Spiritual
Coscieme L. 2015. Cultural ecosystem services: The inspirational value of ecosystems in popular music. In Ecosystem Services; 16: p. 121-124.
Francesco. 2015. Laudato Si. Encyclical letter on Care for our Common Home. In Libreria Editrice Vaticana.
White MP, Pahl S, Wheeler BW, Fleming LEF & Depledge MH. 2016. The ‘Blue Gym’: What can blue space do for you and what can you do for blue space? In Journal of the Marine Biological Association of the United Kingdom; 96: p. 5-12.
Biodiversity and Beyond
Seagrass:
Spalding MD, Taylor ML, Ravilious C, Short FT & Green EP. 2003. Global overview: the distribution and status of seagrasses. In World Atlas of Seagrasses, Green EP, Short FT (eds). University of California Press: Berkeley, USA; p. 5-26, 262-286.
Coral diversity data with special thanks to Charlie Veron:
Veron JEN, Devantier LM, Turak E, Green AL, Kininmonth S, Stafford-Smith M & Peterson N. 2009. Delineating the Coral Triangle. In Galaxea, Journal of Coral Reef Studies; 11: p. 91-100.
Global 200 marine ecoregions are from
Olson DM & Dinerstein E. 2002. The Global 200: priority ecoregions for conservation. Annals of the Missouri Botanical Garden; 89: p. 199-224.
EBSA map, kindly provided by the Secretariat of the CBD. Further details can be found at www.cbd.int/ebsa. See also:
CBD. 2008. COP 9 - Ninth Meeting of the Conference of the Parties to the Convention on Biological Diversity. Bonn, 19–30 May 2008. Decision IX/20. Marine and coastal biodiversity. United Nations Environment Programme.
Part 2 Bringing Natural Values to Bear/ Changing the Way We See Nature
Bringing Natural Values to BearContributing author: Pawan Patil
OECD. 2016. The Ocean Economy in 2030. OECD Publishing: Paris.
Patil PG & Virdin J. 2016 forthcoming. Perspectives on Moving Towards A Blue Economy. World Bank: Washington DC.
Adding Up the Benefits – A Bundle of ValuesAtkinson SC, Jupiter SD, Adams VM, Ingram JC, Narayan S, Klein CJ & Possingham HP. 2016. Prioritising Mangrove Ecosystem Services Results in Spatially Variable Management Priorities. In PLoS ONE. Public Library of Science; e0151992.
Barbier EB. 2012. Ecosystem services and wealth accounting. In Inclusive Wealth Report 2012. Measuring progress toward sustainability., UNU-IHDP, UNEP (eds). Cambridge University Press: Cambridge, UK; 165-194.
Spalding M, Meliane I, Bennett N, Dearden P, Patil P & Brumbaugh R. in press. Building towards the marine conservation end-game: consolidating the role of MPAs in a future ocean. In Aquatic Conservation: Marine And Freshwater Ecosystems.
World Bank. 2012. Moving Beyond GDP. How to factor natural capital into economic decision making. Wealth Accounting and Valuation of Ecosystem Services (WAVES), The World Bank: Washington DC.
Patterns and Flows
Contributing authors: Linwood Pendleton, Evangalia Drakou
A publication for this work is in review.
Atlas of Ocean Wealth106
Managing and Protecting Services
Building Services into Marine Spatial Planning
The map shows the approximate boundaries of marine plans that have been implemented, approved, completed, underway and will be completed by 2025, based on information provided by Charles Ehler, Marine Planning Consultant for UNESCO, and available for individual marine plans.
Spatial Agent is a mobile app built at The World Bank to visualize and map thousands of public domain datasets, including statistical information, ground-based monitoring, satellite earth observation and model outputs (e.g., climate change projections). See http://apps.worldbank.org/.
Arkema KK, Verutes GM, Wood SA, Clarke-Samuels C, Rosado S, Canto M, Rosenthald A, Ruckelshaus M, Guannel G, Toft J, Fariesa J, Silvera JM, Griffina R & Anne D. Guerry. 2015. Embedding ecosystem services in coastal planning leads to better outcomes for people and nature. In PNAS; 112: p. 7390-7395.
Bernhardt J, Guerry A, McKenzie E, Toft J, Wood S. InVEST Scenarios case study: Vancouver Island, Canada, Natural Capital Project.
CZMAI. 2016. Belize integrated coastal zone management plan. Institute CZMAa (ed): Belize City; p. 282.
Ehler C & Douvere F. 2009. Marine Spatial Planning: a step-by-step approach toward ecosystem-based management. Intergovernmental Oceanographic Commission and Man and the Biosphere Programme, UNESCO: Paris.
Guerry AD, Ruckelshaus MH, Arkema KK, Bernhardt JR, Guannel G, Kim C-K, Marsik M, Papenfus M, Toft JE, Verutes G, Wood SA, Beck M, Chan F, Chan KMA, Gelfenbaum G, Gold BD, Halpern BS, Labiosa WB, Lester SE, Levin PS, McField M, Pinsky ML, Plummer M, Polasky S, Ruggiero P, Sutherland DA, Tallis H, Day A & Spencer J. 2012. Modeling benefits from nature: using ecosystem services to inform coastal and marine spatial planning. In International Journal of Biodiversity Science, Ecosystem Services & Management; 8: p. 107-121.
Marine Planning Partnership Initiative. 2015. North Vancouver Island Marine Plan.
Marine Planning Partnership Initiative. 2015. North Coast Marine Plan.
Ruckelshaus M, McKenzie E, Tallis H, Guerry A, Daily G, Kareiva P, Polasky S, Ricketts T, Bhagabati N, Wood SA & Bernhardt J. 2015. Notes from the field: Lessons learned from using ecosystem service approaches to inform real-world decisions. In Ecological Economics; 115: p. 11-21.
Conservation and Protected Areas
Although some of the findings are available in report form (Spalding et al., 2014), a publication is also in preparation.
Miteva DA, Murray BC & Pattanayak SK. 2015. Do protected areas reduce blue carbon emissions? A quasi-experimental evaluation of mangroves in Indonesia. In Ecological Economics; 119: p. 127-135.
PISCO. 2007. The Science of Marine Reserves (2nd Edition, International Version). The Partnership for Interdisciplinary Studies of Coastal Oceans: Santa Barbara, USA; p. 22.
Spalding M, Burke L, Hutchison J, Ermgassen Pz, Thomas H, Ashpole J, Balmford A, Butchart S, McIvor A, McOwen C, McSharry B, Merriman J & Spencer T. 2014. Attaining Aichi Target 11: How well are marine ecosystem services covered by protected areas? Policy brief prepared for the World Parks Congress, Sydney, November, 2014.
Enhancing services
Lewis R & Brown B. 2014. Ecological mangrove rehabilitation – a field manual for practitioners. Mangrove Action Project, Canadian International Development Agency, and OXFAM; p. 275.
Livelihoods. 2016. News - India. www.livelihoods.eu.
Mascarelli A. 2014. Climate-change adaptation: Designer reefs. In Nature News; 508: p. 444-446.
Schmitt K, Albers T, Pham TT & Dinh SC. 2013. Site-specific and integrated adaptation to climate change in the coastal mangrove zone of Soc Trang Province, Viet Nam. In Journal of Coastal Conservation. ; 17: p. 545-558.
Schrack E, Beck M, Brumbaugh R, Crisley K & Hancock B. 2012. Restoration works: Highlights from a decade of partnership between The Nature Conservancy and the National Oceanic and Atmospheric Administration’s Restoration Center. The Nature Conservancy: Arlington, VA; p. 83.
Technical Notes 107

Spalding MD, Kainuma M & Collins L. 2010. World Atlas of Mangroves. Earthscan, with International Society for Mangrove Ecosystems, Food and Agriculture Organization of the United Nations, The Nature Conservancy, UNEP World Conservation Monitoring Centre, United Nations Scientific and Cultural Organisation, United Nations University: London.
Winterwerp JC, Erftemeijer PLA, Suryadiputra N, Eijk Pv & Zhang L. 2013. Defining eco-morphodynamic requirements for rehabilitating eroding mangrove mud coasts. In Wetlands; 33: p. 515-526.
zu Ermgassen P, Hancock B, DeAngelis B, Greene J, Schuster E, Spalding M & Brumbaugh R. 2016. Setting Objectives for Oyster Habitat Restoration Using Ecosystem Services: A Manager’s Guide. The Nature Conservancy: Arlington, VA; p. 76.
Paying What is OwedBeck M & Lange G-M. 2016. Managing Coasts with Natural Solutions: Guidelines for Measuring and Valuing the Coastal Protection Services of Mangroves and Coral Reefs. Wealth Accounting and the Valuation of Ecosystem Services Partnership (WAVES), World Bank: Washington, DC; p. 166.
Yeeting AD, Bush SR, Ram-Bidesi V & Bailey M. 2016. Implications of new economic policy instruments for tuna management in the Western and Central Pacific. In Marine Policy; 63: p. 45-52.
A Future VisionBartlett CY, Pakoa K & Manua C. 2009. Marine reserve phenomenon in the Pacific islands. In Marine Policy; 33: p. 673–678.
Moreno A & Revenga C. 2014. The System of Territorial Use Rights in Fisheries in Chile. The Nature Conservancy: Arlington, Virginia; p. 88.
MapsThe different map layers throughout this work have been developed by Mapping Ocean Wealth partners and contributors. Sources or key publications are listed under each section above.
Please note: most of the maps illustrated in the Atlas of Ocean Wealth can also be explored online in our digital atlas at: http://maps.oceanwealth.org
Output maps for the printed volume were prepared by Rick Tingey (Spatial Support Systems, LLC), and additional background layers for these maps are based on ESRI’s Ocean Basemap (www.arcgis.com), which includes the General Environmental Bathymetric Chart of the Oceans (www.gebco.net) for bathymetry.
Atlas of Ocean Wealth108

Photo CreditsFront Cover: Jeff Yonover; Inside Front Cover: Jeff Yonover; Supporters Page: Jeff Yonover; Table of Contents Page: Nick Hall; table of contents: Nick Hall; Page ii: Ethan Daniels; Page iv: Carlton Ward Jr; Page vi: Bridget Besaw; Page viii: Je Yonover; Page 5: Tim Calver; Page 8 (left) The Nature Conservancy (Mark Spalding); Page 10: Ami Vitale; Page 13: Jeff Yonover; Page 14: The Nature Conservancy (Mark Spalding); Page 16: The Nature Conservancy (Mark Spalding); Page 17: Brian Jones/Blue Ventures; Page 18: (left) The Nature Conservancy (Mark Spalding) (right) The Nature Conservancy (Mark Spalding); Page 20: The Nature Conservancy (Mark Spalding); Page 21: Jason Houston; Page 22: Peter Frank Edwards; Page 23: (top) The Nature Conservancy (Mark Spalding) (left) The Nature Conservancy (Shelley Beville) (right) Peter Frank Edwards; Page 24: Bridget Besaw; Page 26: (left) Nick Hall (right) Nick Hall; Page 28: (left) The Nature Conservancy (Mark Spalding) (right) The Nature Conservancy (Mark Spalding); Page 29: Nick Hall; Page 31: Nick Hall; Page 32: Nick Hall; Page 34: (top) The Nature Conservancy (Mark Spalding) (bottom) The Nature Conservancy (Mark Spalding); Page 35: (top left) The Nature Conservancy (Mark Spalding) (bottom left) The Nature Conservancy (Mark Spalding) (right) Tim Calver; Page 36: The Nature Conservancy (Mark Spalding); Page 38: The Nature Conservancy (Mark Spalding); Page 39: (left) Tracy Ko (right) The Nature Conservancy (Mark Spalding); Page 40: (left) The Nature Conservancy (Mark Spalding) (right) The Nature Conservancy (Mark Spalding); Page 41: Hunter Nichols; Page 42: (left) Tim Calver (right) The Nature Conservancy (Mark Spalding); Page 44: Marjo Aho; Page 45: Marjo Aho; Page 46: (left) The Nature Conservancy (Mark Spalding) (right) The Nature Conservancy (Mark Spalding); Page 47: Carlton Ward Jr; Page 49: Erika Nortemann; Page 51: (left) The Nature Conservancy (Mark Spalding) (right) The Nature Conservancy (Mark Spalding); Page 52: Brian Jones/Blue Ventures; Page 53: Tim Calver; Page 54: (left) The Nature Conservancy (Mark Spalding) (right) The Nature Conservancy (Mark Spalding); Page 56: The Nature Conservancy (Mark Spalding); Page 57: (left) The Nature Conservancy (Mark Spalding) (right) The Nature Conservancy (Mark Spalding); Page 58: Jeff Yonover; Page 61: The Nature Conservancy (Mark Spalding); Page 62: The Nature Conservancy (Mark Spalding) ; Page 63: Jeff Yonover; Page 64: The Nature Conservancy (Mark Spalding); Page 65: The Nature Conservancy (Mark Godfrey); Page 66: Nanang Sujana; Page 67 (left) The Nature Conservancy (Mark Spalding) (right) The Nature Conservancy (Mark Spalding); Page 68: (top) Bradley Wilkenson (bottom) The Nature Conservancy (Mark Spalding); Page 70: The Nature Conservancy (Mark Spalding); Pages 72-73: Carlos Aguilera Calderón; Page 74: Tim Calver; Page 75: The Nature Conservancy (Mark Spalding); Page 76: Wetlands International; Page 77: The Nature Conservancy (Mark Spalding); Page 79: The Nature Conservancy (Mark Spalding); Page 80: The Nature Conservancy (Mark Spalding); Page 81: Bridget Besaw; Page 82: The Nature Conservancy; Page 83: The Nature Conservancy (Mark Spalding); Page 84: Lynda Richardson; Page 86: The Nature Conservancy (Mark Godfrey); Page 88: (top) The Nature Conservancy (Mark Spalding) (bottom) The Nature Conservancy (Mark Godfrey); Page 89: Wetlands International/Nanang Sujana; Page 90: Ami Vitale; Page 91: Tim Calver; Page 92: The Nature Conservancy (Kemit Amon- Lewis); Page 93: Carlton Ward Jr.; Page 95: The Nature Conservancy (Mark Spalding); Page 96: Nick Hall; Page 98: Greg Miller; Page 99: BlueOrange Studio/Flickr; Page 101: The Nature Conservancy (Mark Spalding); Back Cover: Ethan Daniels (right) Nick Hall.
Printed in Chantilly, Virginia, by C and R Printing on Forest Stewardship Council®-certified Mowhawk Options - 100% post-consumer-waste paper, produced with 100% Green-e-certified renewable energy.
F S C L O G O H O R I Z O N T A L
P L E A S E

The Nature Conservancy
4245 North Fairfax Drive, Suite 100Arlington, VA 22203-1606
Phone: 703-841-5300Website: www.nature.org