The Impact of Childhood and Adult SES on Physical, Mental, and Cognitive Well-Being in Later Life
16
The Impact of Childhood and Adult SES on Physical, Mental, and Cognitive Well-Being in Later Life Ye Luo and Linda J. Waite Center on Aging, University of Chicago/National Opinion Research Center, Illinois. Abstract Objectives—To examine the relationships between socioeconomic status (SES) and health across the life course and their variations by gender and race/ethnicity. Methods—The sample included 19,949 respondents aged 50 or over from the 1998 Health and Retirement Study. Results—Lower childhood SES was associated with worse health outcomes in later life. Part of the effect of childhood SES on adult health occurred through childhood health. The impact of childhood SES on education and income in adulthood explained an even larger share of this effect. We also found a stronger effect of adult SES for those with lower childhood SES than for those with more advantaged childhoods. Moreover, childhood SES had a similar impact on health in later life for women and men and for Whites and non-Whites. However, college education seemed more important for women’s later health, whereas income seemed more important for men’s health. Education appeared to have a weaker effect on adult health for Blacks and Hispanics than for Whites. Discussion—Both childhood and adult SES are important for health. The negative impact of low childhood SES can be partially ameliorated if people from a low SES position during childhood mobilize to higher status in adulthood. Numerous studies have confirmed that people of higher socioeconomic status (SES) tend to have better health and that SES differences in adult health are evident for both men and women, across a range of health measures and across different societies (Feinstein, 1993; Gilman, Kawachi, Fitzmaurice, & Buka, 2002). Most scholars hold that SES differences in health are causally produced as a result of various health-related factors such as living and working conditions, access to health services, social relationships, and diversified life styles, which are unequally distributed across the social hierarchy (Feinstein, 1993; Luo & Wen, 2002). SES differentials in health may also result from health selection. People with pre-existing illness drift down the social scale: Those with poor health are selected into lower SES through decreased labor force participation or through withdrawal from paid work, thereby decreasing their wage income and inhibiting wealth accumulation (Williams, 1990). Although it is well recognized that the process of health selection can start in early childhood, the impact of childhood health on adult SES attainment and health outcomes in later life is rarely examined (Blackwell, Hayward, & Crimmins, 2001; Lundberg, 1991; Power, Stansfeld, Matthews, Manor, & Hope, 2002). Interest in the relationship between SES in early life and health inequalities in adulthood has grown in the last few decades. Extension of the classic status attainment model views adult health as one of the outcomes of intergenerational transmission of social status (Reynolds & Ross, 1998). More recently, researchers have argued that a life course approach is necessary Address correspondence to Dr. Ye Luo, 1155 E. 60 St., Suite 049, Chicago, IL 60637. E-mail: [email protected]. NIH Public Access Author Manuscript J Gerontol B Psychol Sci Soc Sci. Author manuscript; available in PMC 2008 August 11. Published in final edited form as: J Gerontol B Psychol Sci Soc Sci. 2005 March ; 60(2): S93–S101. NIH-PA Author Manuscript NIH-PA Author Manuscript NIH-PA Author Manuscript
-
Upload
independent -
Category
Documents
-
view
5 -
download
0
Transcript of The Impact of Childhood and Adult SES on Physical, Mental, and Cognitive Well-Being in Later Life

The Impact of Childhood and Adult SES on Physical, Mental, andCognitive Well-Being in Later Life
Ye Luo and Linda J. WaiteCenter on Aging, University of Chicago/National Opinion Research Center, Illinois.
AbstractObjectives—To examine the relationships between socioeconomic status (SES) and health acrossthe life course and their variations by gender and race/ethnicity.
Methods—The sample included 19,949 respondents aged 50 or over from the 1998 Health andRetirement Study.
Results—Lower childhood SES was associated with worse health outcomes in later life. Part ofthe effect of childhood SES on adult health occurred through childhood health. The impact ofchildhood SES on education and income in adulthood explained an even larger share of this effect.We also found a stronger effect of adult SES for those with lower childhood SES than for those withmore advantaged childhoods. Moreover, childhood SES had a similar impact on health in later lifefor women and men and for Whites and non-Whites. However, college education seemed moreimportant for women’s later health, whereas income seemed more important for men’s health.Education appeared to have a weaker effect on adult health for Blacks and Hispanics than for Whites.
Discussion—Both childhood and adult SES are important for health. The negative impact of lowchildhood SES can be partially ameliorated if people from a low SES position during childhoodmobilize to higher status in adulthood.
Numerous studies have confirmed that people of higher socioeconomic status (SES) tend tohave better health and that SES differences in adult health are evident for both men and women,across a range of health measures and across different societies (Feinstein, 1993; Gilman,Kawachi, Fitzmaurice, & Buka, 2002). Most scholars hold that SES differences in health arecausally produced as a result of various health-related factors such as living and workingconditions, access to health services, social relationships, and diversified life styles, which areunequally distributed across the social hierarchy (Feinstein, 1993; Luo & Wen, 2002). SESdifferentials in health may also result from health selection. People with pre-existing illnessdrift down the social scale: Those with poor health are selected into lower SES throughdecreased labor force participation or through withdrawal from paid work, thereby decreasingtheir wage income and inhibiting wealth accumulation (Williams, 1990). Although it is wellrecognized that the process of health selection can start in early childhood, the impact ofchildhood health on adult SES attainment and health outcomes in later life is rarely examined(Blackwell, Hayward, & Crimmins, 2001; Lundberg, 1991; Power, Stansfeld, Matthews,Manor, & Hope, 2002).
Interest in the relationship between SES in early life and health inequalities in adulthood hasgrown in the last few decades. Extension of the classic status attainment model views adulthealth as one of the outcomes of intergenerational transmission of social status (Reynolds &Ross, 1998). More recently, researchers have argued that a life course approach is necessary
Address correspondence to Dr. Ye Luo, 1155 E. 60 St., Suite 049, Chicago, IL 60637. E-mail: [email protected].
NIH Public AccessAuthor ManuscriptJ Gerontol B Psychol Sci Soc Sci. Author manuscript; available in PMC 2008 August 11.
Published in final edited form as:J Gerontol B Psychol Sci Soc Sci. 2005 March ; 60(2): S93–S101.
NIH
-PA Author Manuscript
NIH
-PA Author Manuscript
NIH
-PA Author Manuscript

to understand social variations in health, and they called for examining the relationship betweenboth childhood and adult SES and health (Wadsworth, 1997). The life course approach impliesa reciprocal relationship between SES and health and also makes room for the possibility thatfavorable circumstances can compensate for the effects of earlier disadvantage (Graham,2002). At the same time, the theory of cumulative advantage/disadvantage suggests thatindividuals within a cohort increasingly diverge over the life course in characteristics likemoney and health, as large initial endowments lead to large additional gains and initialdisadvantage causes further decline, regardless of the source of early advantage/disadvantage(Dannefer, 2003).
Some evidence has emerged that childhood SES is an important determinant of health in laterlife, with poorer health among those from lower SES backgrounds (Lynch, 2000; Turrell et al.,2002). However, empirical studies on the relative contributions of earlier and later SESconditions to health and how accumulations and interactions of these conditions affect healthare rare and the findings inconsistent. Some studies have shown that health variations in adultsare attributed to both early and later life circumstances (Gilman et al., 2002; Turrell et al.,2002), suggesting that childhood SES has lasting effects on health beyond its impact on laterstatus attainment. Others do not find a significant association between childhood SES and laterhealth once adult SES is taken into account (Marmot, Shipley, Brunner, & Hemingway,2001), suggesting that childhood SES determines the living and working conditions in adultlife and it is these circumstances that give rise to social inequalities in health. It is difficult todraw conclusions because these studies vary in sample selection and geographic coverage.Moreover, from a life course perspective, SES mobility may influence health outcomes, withupward mobility decreasing risk and partially compensating for earlier disadvantages anddownward mobility increasing risk (Graham, 2002), but this idea has not been thoroughlyassessed (Lynch, 2000; Mare, 1990; Turrell et al., 2002). Although recent reviews on socialrelations and health have called for the inclusion of multiple health outcomes in the same study(Seeman, 1996), previous investigations of the effects of childhood SES on health tend to focusexclusively on physical health, especially certain types of disease. It is unclear whether theserelationships also hold for mental health and cognitive functioning (Gilman et al., 2002; Turrellet al., 2002).
Research on gender and race differences in the linkages between SES and health is scarce andinconclusive (Gilman et al., 2002; Nystrom Peck, 1994; Veijola, Puukka, Lehtinen, Moring,Lindholm, & Vaisanen, 1998). Some studies show that women and non-Whites report poorerphysical health and women also report poorer mental well-being, largely due to theirdisadvantaged SES (Bebbington, 1998; Johnson & Wolinsky, 1994). The question remains ofwhether women and non-Whites receive the same health benefits from SES as do men andWhites. Given the societal discrimination that devalues SES attainment among women andnon-Whites, we would expect that women and non-Whites receive fewer health benefits fromSES, especially SES attainment in adult life, than men and Whites.
This study examined the relationship between SES and health in childhood and later life usinga nationally representative sample of the U.S. population 50 years of age or over. By assessingSES and health in childhood and adulthood, this study addressed both the social causation andthe health selection hypotheses. More specifically, it addressed the following six questions:(1) Does childhood SES have lasting effects on physical, mental, and cognitive well-being inlater life? (2) Does childhood health mediate the transfer of SES status from childhood to adultlife? (3) Do SES advantages accumulate, so that childhood SES, educational attainment, andhousehold income each add to later health advantages? (4) Does SES mobility from childhoodto adulthood affect health, such that upward mobility decreases risk of poor health anddownward mobility increases this risk? (5) Does the impact of childhood SES and health onhealth in adulthood differ for men and women? (6) Does it differ for racial and ethnic groups?
Luo and Waite Page 2
J Gerontol B Psychol Sci Soc Sci. Author manuscript; available in PMC 2008 August 11.
NIH
-PA Author Manuscript
NIH
-PA Author Manuscript
NIH
-PA Author Manuscript

METHODSData
Data for this study came from the 1998 Health and Retirement Study (HRS), a longitudinalsurvey of older Americans. It began in 1992–1993 as two separate samples: the original HRSfocusing on 1931–1941 birth cohorts and the Assets and Health Dynamics Among the OldestOld (AHEAD) focusing on 1890–1923 birth cohorts. In 1998, the two samples (wave 4 of HRSand wave 3 of AHEAD) were merged, and two new cohorts—Children of the Depression Age(1924–1930 cohorts) and War Babies (1942–1947 cohorts)—were added. The spouses werealso interviewed irrespective of their age. The combined sample of 21,384 respondents isrepresentative of all Americans born between 1890 and 1947 and their spouses. We excluded935 spouses born after 1947. We also excluded those with missing information on keyvariables; the 500 excluded cases did not differ significantly on basic demographics from the19,949 respondents in the analytical sample. Sample sizes varied slightly between the variousmodels of adult health because the number of cases with missing information differed.
Measures of HealthWe examined six measures of physical, mental, and cognitive well-being in adulthood. Table1 presents descriptive statistics.
Self-rated health—Respondents were asked to rate their health on a 5-point scale rangingfrom poor to excellent (M = 3.06, SD = 1.18). This measure captures respondents’ overallassessment of their own medical and functional status. Previous research shows that self-ratedhealth correlates well with physician-assessed health and correlates better with mortality thanphysician assessments (Idler & Kasl, 1991).
Functional limitations—The number of functional limitations was calculated by summingresponses to 12 items assessing whether the respondent had difficulties with specific forms ofambulation such as walking a block and climbing a flight of stairs or muscle movements suchas moving a large chair or picking up a dime from the table (Wallace & Herzog, 1995). Itranged from 0 to 12 (M = 2.60, SD = 3.15) with alpha reliability of 0.88. Respondents who“don’t do” these activities were dropped. In additional analyses, we imputed these cases basedon their responses to other health measures and nonmissing functional limitation items andfound similar results.
Chronic conditions—Respondents were asked if a doctor had ever told them that they haddiabetes, heart disease, lung disease, cancer, hypertension, or stroke. The number of chronicconditions was the total number of conditions reported, ranging from 0 to 6 (M = 1.11, SD =1.06).
Depressive symptoms—HRS included a short version of the Center for EpidemiologicalStudies Depression Scale, designed specifically for interviews with older respondents. Thescale is intended to assess depressive symptoms and has satisfactory psychometric properties(Turvey, Wallace, & Herzog, 1999). Each item on the scale was a question about how therespondent felt in the last week. The form of the questions reads “Much of the time in the lastweek I felt …” with a response set of yes or no. The number of depressive symptoms was acount of the affirmative responses, with two items tapping positive affect reverse coded. Itranged from 0 to 8 (M = 1.61, SD = 1.94) with alpha reliability of 0.78.
Self-rated memory—Respondents were asked to rate their memory on a 5-point scaleranging from poor to excellent (M = 3.11, SD = 0.95). Self-rated memory taps the respondent’sglobal perceptions of his or her quick thinking (Wallace & Herzog, 1995).
Luo and Waite Page 3
J Gerontol B Psychol Sci Soc Sci. Author manuscript; available in PMC 2008 August 11.
NIH
-PA Author Manuscript
NIH
-PA Author Manuscript
NIH
-PA Author Manuscript

Cognitive functioning—This variable was the total score of a series of tests based on amodified version of the Telephone Interview for Cognitive Status. There were four memoryand two executive functioning tasks asked, yielding a maximum of 35 points, with higher scoresindicating better functioning. These tasks included (a) an immediate recall test, which requiredrecalling as many words as possible from a list of 10 commonly used words immediately afterthe interviewer read the list (10 points); (b) a delayed recall test of the same list (10 points);(c) naming the day of the week and the date (i.e., month, day, and year; 4 points); (d) namingthe object that people usually use to cut paper, the kind of prickly plant that grows in the desert,the president of the United States, and the vice president (4 points); (e) a serial 7s test thatrequired subtracting 7 from 100 five times (5 points); and (f) counting backward from 20 for10 consecutive numbers (2 points). Following Herzog and Wallace (1997), we assignedrespondents who refused at the inception of the task a score of 0 and those who refused duringthe task the score they had obtained up until their refusal (M = 22.98, SD = 5.27).
Childhood health—The respondent’s rating of his or her health as a child was coded on a5-point scale ranging from poor to excellent. Although retrospective reports of childhood healthare subject to recall bias and measurement error, the previous study of a small module of HRSrespondents in 1996 found a high level of internal consistency between the reports of generalhealth and specific long-term health limitations in childhood (Elo, 1998). The respondentsgenerally reported good health in childhood (M = 4.15, SD = 1.00).
In our sample, self-rated health was more strongly correlated with functional limitations andchronic conditions (r =−0.59, −0.47) than with depressive symptoms, self-rated memory, orcognitive functioning scores (r = −0.39, 0.32, 0.30). Self-rated memory and cognitivefunctioning scores were moderately correlated with each other (r = 0.24) and with other healthmeasures (r = −0.13 to 0.32). Self-rated health in childhood and self-rated health in adulthoodwere moderately correlated (r = 0.24).
Measures of Socioeconomic PositionsChildhood SES—Childhood SES included four items: whether the respondent’s parents had≥8 years of education, whether the respondent’s father had a white-collar job, and whether thefamily was financially pretty well off, about average, or poor (see Table 1). Preliminaryanalyses showed that respondents who were missing on parents’ education (mother: 11%;father: 14.8%) and father’s occupation (5.5%) had similar characteristics to those in low statuscategories, and thus they were combined with low status categories. Deleting these cases leftsubstantive conclusions unaffected. Parents’ education was ≥8 years for more than half of therespondents (mother: 62%; father: 55%). Nearly one-fourth reported that their father had awhite-collar job. More than half of the respondents rated their family’s financial well-being asaverage (61%), and few rated their family’s financial well-being as well-off (6%).
Adult SES—Adult SES was measured by respondent’s own education and household income.Education was measured in years (M = 11.87, SD = 3.40). Household income was the totalhousehold income in the year prior to the survey. The values were log transformed to correctfor positive skewness (M = 10.19, SD = 1.47).
Cumulative SES—To create the variable measuring cumulative SES across the life course,we first created a childhood SES index, which was the average of standardized parents’education, father’s occupation, and family financial well-being. We then dichotomized thisindex at the median. We also dichotomized the respondent’s education and household incomeaccording to whether the respondent attended college and whether the respondent’s householdincome was above average. The combinations of dichotomized childhood SES, adulteducation, and household income were grouped into four categories: low position on all three
Luo and Waite Page 4
J Gerontol B Psychol Sci Soc Sci. Author manuscript; available in PMC 2008 August 11.
NIH
-PA Author Manuscript
NIH
-PA Author Manuscript
NIH
-PA Author Manuscript

measures (coded 0; 29%); low position on two measures, high on one (coded 1; 29%); lowposition on one measure, high on two (coded 2; 24%); and high position on all three measures(coded 3; 18%). This variable is cumulative because it taps multiple dimensions of SES overthe life course, with education completed before midlife for most respondents and householdincome measuring current position (Turrell et al., 2002).
SES mobility pattern—Based on SES measures, we created five SES mobility trajectories:(1) stable low: below median childhood SES, no college education, and below median income(29%); (2) downward: above median childhood SES, no college education, and below medianincome (12%); (3) mixed: no consistent upward or downward pattern of mobility fromchildhood to adulthood (33%); (4) upward: below median childhood SES, college education,and above median income (8%); and (5) stable high: above median childhood SES, collegeeducation, and above median income (18%). This measure is strongly correlated withcumulative SES (r = 0.96) because stable low and stable high are lowest and highest incumulative SES. However, the mixed split evenly on two values (1 and 2) of cumulative SES.
CovariatesGender, race/ethnicity, and age were controlled in multivariate analyses. The average age was66.87 years (SD = 10.40). More than half of the respondents were female (57%). There werefour race/ethnicity categories: White (77%), Black (14%), Hispanic (7%), and other (2%).
Statistical ProceduresWe regressed childhood health, adult SES, and adult health on the independent variables, usingordinary least squares regression. We first regressed childhood health on childhood SESvariables, controlling for gender, race/ethnicity, and age, to assess the relationship betweenchildhood SES and health in childhood. Second, we regressed adult SES variables on childhoodSES and childhood health to examine the effect of childhood SES and health conditions onSES attainment in adulthood. Next, a series of regression models were run for each adult healthoutcome. Model I included childhood SES and control variables. Model II added childhoodhealth, and Model III added adult SES variables. By comparing change in coefficients forchildhood SES from Model I to Model II and from Model II to Model III, we can see howmuch of the effect of childhood SES was mediated by childhood health and adult SES variables.Finally, regression models were estimated with cumulative SES status and measures of SESmobility as predictors of adult health outcomes.
RESULTSChildhood SES, Childhood Health, and Adult SES
We begin by examining the relationship between childhood SES and childhood health andbetween childhood SES and adult SES. Net of gender, age, race/ethnicity, and other childhoodSES variables, all childhood SES variables were significantly associated with childhood health(Table 2). Family financial well-being had the largest effect: Children from average/well-offfamilies rated their health in childhood 0.19/0.25 higher than children from poor families.Respondents also rated their health in childhood higher if their parents were better educatedor if their father had a white-collar job (b = 0.06–0.10).
All childhood SES variables were significant predictors of adult education (see Table 2).Respondents had 0.57–1.40 more years of education if their parents were better educated, iftheir father had a white-collar job, or if their family’s financial well-being was average or aboveaverage (Model I). These effects were attenuated by 2–11% with the addition of childhoodhealth, confirming a mediating effect of childhood health on transition from childhood SES to
Luo and Waite Page 5
J Gerontol B Psychol Sci Soc Sci. Author manuscript; available in PMC 2008 August 11.
NIH
-PA Author Manuscript
NIH
-PA Author Manuscript
NIH
-PA Author Manuscript

adult education (Model II). Childhood health had a statistically significant positive effect onadult education (b = 0.31).
Childhood SES and health also significantly predicted adult income (Table 2). Income washigher for respondents whose parents were better educated, whose father had a white-collarjob, and who came from average or well-off families (Model I). The addition of childhoodhealth attenuated these effects by 4–14%, confirming a mediating effect of childhood healthon transition from childhood SES to adult income (Model II). We saw greater attenuation ofthe effects when adult education was added (Model III); family financial well-being was nolonger significant, and the effects of parents’ education and father’s occupation dropped morethan half. The effect of childhood health on adult income dropped by one-third once wecontrolled for adult education but remained statistically significant (Model III).
Effects of Childhood and Adult SES on Health in Later LifeNext, we address the question: Does childhood SES have lasting effects on physical, mental,and cognitive well-being in later life? Childhood SES variables were strongly associated withall six health outcomes (see Table 3, Model I). With few exceptions, people with higherchildhood SES had higher self-rated health (b = 0.16–0.28), lower functional limitations (b =−0.20 to −0.45), fewer chronic conditions (b = −0.07 to −0.12), fewer depressive symptoms(b = −0.17 to −0.32), higher self-rated memory (b = 0.05–0.27), and higher cognitivefunctioning scores (b = 0.75–1.20). With gender, age, and race/ethnicity controlled, childhoodSES explained an additional 1–4% of the variance in adult health measures. The healthdifferentials between people from average families and people from wealthy families appearmost clearly for self-rated health and self-rated memory, with improvements in adult healthwith each increase in childhood financial well-being. But for other health measures, those fromaverage families seemed to fare as well as those from wealthy families. Finally, family financialcondition had no independent effect on cognitive functioning.
We address the mediating effect of childhood health by adding childhood health to the modelsof adult health. Childhood health was strongly associated with all adult health outcomes in theexpected direction (Model II). Most coefficients of childhood SES variables were attenuatedby 0–20% but remained statistically significant, but the effect of the highest level of familyfinancial status on functional limitations and chronic conditions became insignificant.
As Model III shows, both educational attainment and household income were strong predictorsof all health outcomes, with both associated with better health, and adding them substantiallyattenuated the effects of childhood SES on all health measures. Reductions in the size of thecoefficients were 48–65% for mother’s education, 18–95% for father’s education, 57–77% forfather’s occupation, 21–38% for average family financial status, and 25–41% for well-offfamily financial status. Also, some childhood SES variables were no longer significant. Forexample, the effects of father’s occupation on functional limitations or chronic conditions, offather’s education and well-off family financial status on depressive symptoms, and of father’seducation and occupation on self-rated memory were no longer significant.
Across all health outcomes, the positive relationship between childhood health and adult SESled to reductions in the size of the effect of childhood health status once adult SES was takeninto account. Most of the reductions were 10–20% with the exception of cognitive functioningscores, for which the effects of childhood health were attenuated by nearly half.
Cumulative SES and HealthOur third question asks if advantages in childhood and adulthood tend to accumulate, with thehealth differential widening over the life course as those with early advantage tend to
Luo and Waite Page 6
J Gerontol B Psychol Sci Soc Sci. Author manuscript; available in PMC 2008 August 11.
NIH
-PA Author Manuscript
NIH
-PA Author Manuscript
NIH
-PA Author Manuscript
accumulate more. If childhood SES, adult education, and income all improve health in laterlife, we should observe a cumulative effect of status on health. Table 4 shows adjusted meansof each health measure by cumulative SES. The results indicated strong and consistent gradedassociations between cumulative SES and health. The worst health outcomes appeared amongthose who grew up in a family with relatively low SES, who also attained relatively low levelsof education and income in adulthood, whereas the best health outcomes appeared among thosewho were advantaged in both childhood and adulthood, with those advantaged on somedimensions but not on all falling in between.
SES Mobility and HealthFigure 1 shows the adjusted means for each health measure for the five SES mobilitytrajectories from childhood to adulthood. This figure highlights the importance of SES mobilityover the life course for health in later life. Those who had a low childhood SES and thenexperienced upward mobility had better health outcomes than those with similar childhoodSES but limited or no upward mobility. For instance, people with low childhood SES who thenexperienced upward mobility in adulthood had 2.05 functional limitations, significantly fewerthan people with stable low SES status (3.72). In contrast, those who had high SES in childhoodbut who then experienced downward mobility in adulthood had worse health outcomes thanthose with stable high SES. For example, people with high childhood SES who experienceddownward mobility as older adults had 3.17 functional limitations, significantly higher than1.93 for people with stable high SES. Also, adult SES was more important for current healththan childhood SES: Those with downward mobility were always close to the stable low andthe upwardly mobile were always close to the stable high.
In addition, high SES in adulthood had larger health benefits for children from low SES familiesthan for those who had more privileged childhoods (see Figure 1). With the exception of chronicconditions, the health differentials between upwardly mobile respondents and those with stablelow SES were significantly greater than the health differentials between respondents with stablehigh SES and respondents who had high childhood SES but experienced downward mobility.For example, for respondents with low childhood SES, the difference in self-rated healthbetween those who had high education and income and those who had low education andincome is 0.69, which is significantly higher than the difference in self-rated health betweenthose who had high education and income and those who had low education and income forrespondents with high childhood SES (0.60). Additional regression analyses includinginteractions of high childhood SES with college education and above median household incomeshowed that these interactions were statistically significant for self-rated health, functionallimitations, depressive symptoms, and cognitive functioning (not shown). All these suggestthat the effects of adult SES on health were stronger for people with low childhood SES thanfor people with high childhood SES.
Gender and RaceTo answer the question about whether childhood SES, childhood health, and adult SES havethe same health benefits for women and men, we added interactions of gender with each SESvariable and childhood health to Model III in Table 3 (results not shown). Of the 30 interactionsbetween gender and childhood SES, only 1 was significant, likely by chance. Of the sixinteractions of gender and childhood health, three were significant; childhood health was morestrongly associated with functional limitations, chronic conditions, and depressive symptomsfor women than for men. Gender interacted significantly with adult education for threeoutcomes: Educational attainment had larger effects on chronic conditions, depressivesymptoms, and cognitive functioning scores for women than for men. Gender interacted withadult income for two outcomes: Adult income had smaller effects on self-rated memory andcognitive functioning scores for women than for men. Thus, whereas childhood SES had
Luo and Waite Page 7
J Gerontol B Psychol Sci Soc Sci. Author manuscript; available in PMC 2008 August 11.
NIH
-PA Author Manuscript
NIH
-PA Author Manuscript
NIH
-PA Author Manuscript

similar effects on health for women and men, adult education seems more important for womenand adult income seems more important for men.
Next, we added interactions of race/ethnicity to Model III in Table 3 to determine whether thehealth benefits of childhood SES, childhood health, and adult SES differ by race/ethnicity(results not shown). The effects of childhood SES variables rarely varied by race/ethnicity: Of90 interaction terms between race/ethnicity and childhood SES (30 each for Blacks, Hispanic,and other race/ethnicity), only 5 were significant, about what would be expected by chance.However, the health benefits of adult education clearly varied with race/ethnicity. Most of theinteractions showed fewer health benefits of adult education for non-Whites than for Whites.Five of the six interactions of Black with education were significant: Four of them showedweaker effects of education on self-rated health, functional limitations, chronic conditions, andself-rated memory for Blacks than for Whites; one showed a stronger effect of education oncognitive functioning scores for Blacks than for Whites. All six interactions of Hispanics witheducation were significant: They showed weaker effects of education on all health measuresfor Hispanics than for Whites. Four of 18 interactions of race/ethnicity with household incomewere significant: Three showed that compared with Whites, income had weaker effects ondepressive symptoms for Blacks, on self-rated health for Hispanics, and on chronic conditionsfor other race/ethnic minorities; one showed a stronger effect of income on cognitivefunctioning scores for Blacks.
DISCUSSIONThis study examined the relationships between SES and health in childhood and later life andvariations by gender and race/ethnicity. We found that childhood SES and adult SES hadindependent effects on most health outcomes. People who grew up in relatively disadvantagedfamilies had poorer health outcomes than people with more privileged childhoods. ChildhoodSES appeared to affect health in later life partly by affecting health in childhood. But a muchlarger proportion of the effect of childhood SES on adult health operated through its effect oneducational attainment and household income in adulthood. Our results also suggest that thenegative impact of low childhood SES can be ameliorated if people from a low childhood SESposition achieve higher status in adulthood. Moreover, the effects of childhood SES wereremarkably similar for women and men and for Whites and non-Whites. However, collegeeducation seemed more important for women’s health, while income seemed more importantfor men’s health. Education appeared to have fewer health benefits for Blacks and Hispanicsthan for Whites.
This study has several limitations. First, because the only measure of childhood health availablein the HRS is self-rated childhood health, we do not know how a history of illness, emotionalwell-being, or cognitive functioning, for example, might be linked to adult SES and health inlater life. Second, both childhood SES and health were obtained through retrospective reports.Although some studies have shown that for more objective items, such as parents’ educationand occupation, retrospective reports are fairly reliable, we need more research on the accuracyof retrospective reports of more subjective items, such as self-rated childhood health. Third,because of the limited information on childhood and the period between childhood and lateradulthood, it is difficult to establish possible pathways between childhood SES and health inlater life, other than adult educational attainment and household income.
Despite these limitations, this study contributes to our understanding of the relationship of SESand health over the life course. We have found very similar patterns of the relationships betweenchildhood SES and health and measures of adult health across three dimensions of health,physical health, emotional well-being, and cognitive function, suggesting that the impact ofchildhood SES conditions is pervasive.
Luo and Waite Page 8
J Gerontol B Psychol Sci Soc Sci. Author manuscript; available in PMC 2008 August 11.
NIH
-PA Author Manuscript
NIH
-PA Author Manuscript
NIH
-PA Author Manuscript

This study has confirmed that the relationship between SES and health is reciprocal, thuslending support to both social causation and health selection hypotheses. It showed thatchildhood SES affected health at early ages, that childhood health affected SES attainment inadult life, and that adult SES affected health in later life. Although there was a clear pathwayfrom childhood SES to childhood health, to adult SES, and to health in later life, the directlinks from childhood SES to adult SES (e.g., education), from childhood SES to adult health,and from childhood health to adult health remained significant. These findings, which areconsistent with other studies (Power, Manor, & Matthews, 1999; Turrell et al., 2002), suggestthat childhood SES and health can have lasting direct effects on adult health in addition to theirimpact on SES attainment in adult life.
One unexpected result is that, net of parents’ education and father’s occupation, the effects offamily financial well-being on most health outcomes did not follow a clear gradient. With theexception of self-rated health and self-rated memory, people from average families reportedsimilar or even better health than people from wealthy families. It is worth noting that onlyabout 6% of respondents said that their family was well-off; thus, they represented childrengrowing up in wealthy families. Our finding suggests that the marginal utility of additionalincome in childhood for health in adulthood is quite small at the very top of the incomedistribution. It is also possible that the respondents who grew up during the Great Depressioncould have distorted the “normal” role of income during childhood.
Our results also show that family financial well-being made little difference in cognitivefunctioning. Rather it was parents’ education and occupation that remained significant evenwhen childhood health and adult SES were accounted for. Susan Mayer reaches a similarconclusion about other adult outcomes in What Money Can’t Buy: Family Income andChildren’s Life Chances (1997). A study of men’s cognitive functioning in late middle agealso pointed to the importance of parents’ education and occupation (Turrell et al., 2002).
This study demonstrates the importance of social mobility for health. We see some evidencethat adult SES is more important for those from a disadvantaged family background than forthose from more privileged families. Similar mobility patterns were found for mortality (Mare,1990), cognitive functioning (Turrell et al., 2002), and some health behaviors (Lynch, 2000).Together, these findings suggest that childhood is important, but that not all types of adultchronic disease are inevitably set or programmed in childhood (Turrell et al., 2002). Childhooddisadvantage can be alleviated to some extent through upward mobility later in life.
Our findings also suggest that both women and men can benefit from social mobility throughbetter education and better economic attainment, although the pathways may be somewhatdifferent. The effects of childhood SES and adult SES on health were remarkably similar forwomen and men, as were the effects of social mobility on health. However, women had feweropportunities for upward mobility, and they also had poorer physical and mental health. Giventhe similar health benefits of upward mobility for women and men, efforts to reduce genderinequality in SES could reduce gender inequality in health.
ACKNOWLEDGMENTS
This research was funded by grant P01 AG 18911 from the Office of the Demography of Aging, Behavioral and SocialResearch Program, National Institute on Aging. A previous draft was presented at the 56th Annual Scientific Meetingof the Gerontological Society of America, San Diego, California, November 21–25, 2003.
REFERENCESBebbington PE. Sex and depression. Psychological Medicine 1998;28:1–8. [PubMed: 9483678]Blackwell DL, Hayward MD, Crimmins EM. Does childhood health affect chronic morbidity in later
life? Social Science & Medicine 2001;52:1269–1284. [PubMed: 11281409]
Luo and Waite Page 9
J Gerontol B Psychol Sci Soc Sci. Author manuscript; available in PMC 2008 August 11.
NIH
-PA Author Manuscript
NIH
-PA Author Manuscript
NIH
-PA Author Manuscript

Dannefer D. Cumulative advantage/disadvantage and the life course: Cross-fertilizing age and socialscience theory. Journal of Gerontology: Social Sciences 2003;58B:S327–S337.
Elo, IT. Childhood conditions and adult health: Evidence from the Health and Retirement Study.Philadelphia: Population Aging Research Center, University of Pennsylvania; 1998. Working PaperSeries, WPS 98-3
Feinstein JS. The relationship between socioeconomic status and health: A review of literature. MilbankQuarterly 1993;71:279–322. [PubMed: 8510603]
Gilman SE, Kawachi I, Fitzmaurice GM, Buka SL. Socioeconomic status in childhood and the lifetimerisk of major depression. International Journal of Epidemiology 2002;31:359–367. [PubMed:11980797]
Graham H. Building an inter-disciplinary science of health inequalities: The example of lifecourseresearch. Social Science & Medicine 2002;55:2005–2016. [PubMed: 12406467]
Herzog AR, Wallace RB. Measures of cognitive functioning in the AHEAD Study. Journals ofGerontology: Psychological Sciences and Social Sciences 1997;52B:37–48.
Idler EL, Kasl S. Health perceptions and survival: Do global evaluations of health status really predictmortality? Journal of Gerontology: Social Sciences 1991;46B:S55–S65.
Johnson R, Wolinsky F. Gender, race, and health: The structure of health status among older adults. TheGerontologist 1994;34:24–35. [PubMed: 8150305]
Lundberg O. Childhood living conditions, health status, and social mobility: A contribution to the healthselection debate. European Sociological Review 1991;7:149–162.
Luo Y, Wen M. Can we afford better health? A study of the health differentials in China. Health2002;6:471–500.
Lynch, JW. Socioeconomic factors in the behavioral and psychosocial epidemiology of cardiovasculardisease. In: Schneiderman, N.; Gentry, J.; da Silva, JM.; Speers, M.; Tomes, H., editors. Integratingbehavioral and social sciences with public health. Washington, D.C.: American PsychologicalAssociation; 2000. p. 51-71.
Mare, RD. Socioeconomic careers and differential mortality among older men in the United States. In:Vallin, J.; D’Souza, S.; Palloni, A., editors. Measurement and analysis of mortality: New approaches.New York: Clarendon Press; 1990. p. 362-387.
Marmot M, Shipley M, Brunner E, Hemingway H. Relative contribution of early life and adultsocioeconomic factors to adult morbidity in the Whitehall II Study. Journal of Epidemiology &Community Health 2001;55:301–307. [PubMed: 11297647]
Mayer, SE. What money can’t buy: Family income and children’s life chances. Cambridge, MA: HarvardUniversity Press; 1997.
Nystrom Peck M. The importance of childhood socio-economic group for adult health. Social Science& Medicine 1994;39:553–562. [PubMed: 7973855]
Power CP, Manor OP, Matthews SM. The duration and timing of exposure: Effects of socioeconomicenvironment on adult health. American Journal of Public Health 1999;89:1059–1065. [PubMed:10394316]
Power C, Stansfeld SA, Matthews S, Manor O, Hope S. Childhood and adulthood risk factors for socio-economic differentials in psychological distress: Evidence from the 1958 British birth cohort. SocialScience & Medicine 2002;55:1989–2004. [PubMed: 12406466]
Reynolds JR, Ross CE. Social stratification and health: Education’s benefit beyond economic status andsocial origins. Social Problems 1998;45:221–247.
Seeman TE. Social ties and health: The benefits of social integration. Annals of Epidemiology1996;6:442–451. [PubMed: 8915476]
Turrell G, Lynch JW, Kaplan GA, Everson SA, Helkala E-L, Kauhanen J, et al. Socioeconomic positionacross the lifecourse and cognitive function in late middle age. Journal of Gerontology: SocialSciences 2002;57B:S43–S51.
Turvey CL, Wallace RB, Herzog R. A revised CES-D measure of depressive symptoms and a DSM-based measure of major depressive episodes in the elderly. International Psychogeriatrics1999;11:139–148. [PubMed: 11475428]
Luo and Waite Page 10
J Gerontol B Psychol Sci Soc Sci. Author manuscript; available in PMC 2008 August 11.
NIH
-PA Author Manuscript
NIH
-PA Author Manuscript
NIH
-PA Author Manuscript

Veijola J, Puukka P, Lehtinen V, Moring J, Lindholm T, Vaisanen E. Sex differences in the associationbetween childhood experiences and adult depression. Psychological Medicine 1998;28:21–27.[PubMed: 9483680]
Wadsworth MEJ. Health inequalities in the life course perspective. Social Science & Medicine1997;44:859–869. [PubMed: 9080567]
Wallace RB, Herzog AR. Overview of the health measures in the Health and Retirement Study. Journalof Human Resources 1995;30:S84–S107.
Williams DR. Socioeconomic differentials in health: A review and redirection. Social PsychologyQuarterly 1990;53:81–99.
Luo and Waite Page 11
J Gerontol B Psychol Sci Soc Sci. Author manuscript; available in PMC 2008 August 11.
NIH
-PA Author Manuscript
NIH
-PA Author Manuscript
NIH
-PA Author Manuscript
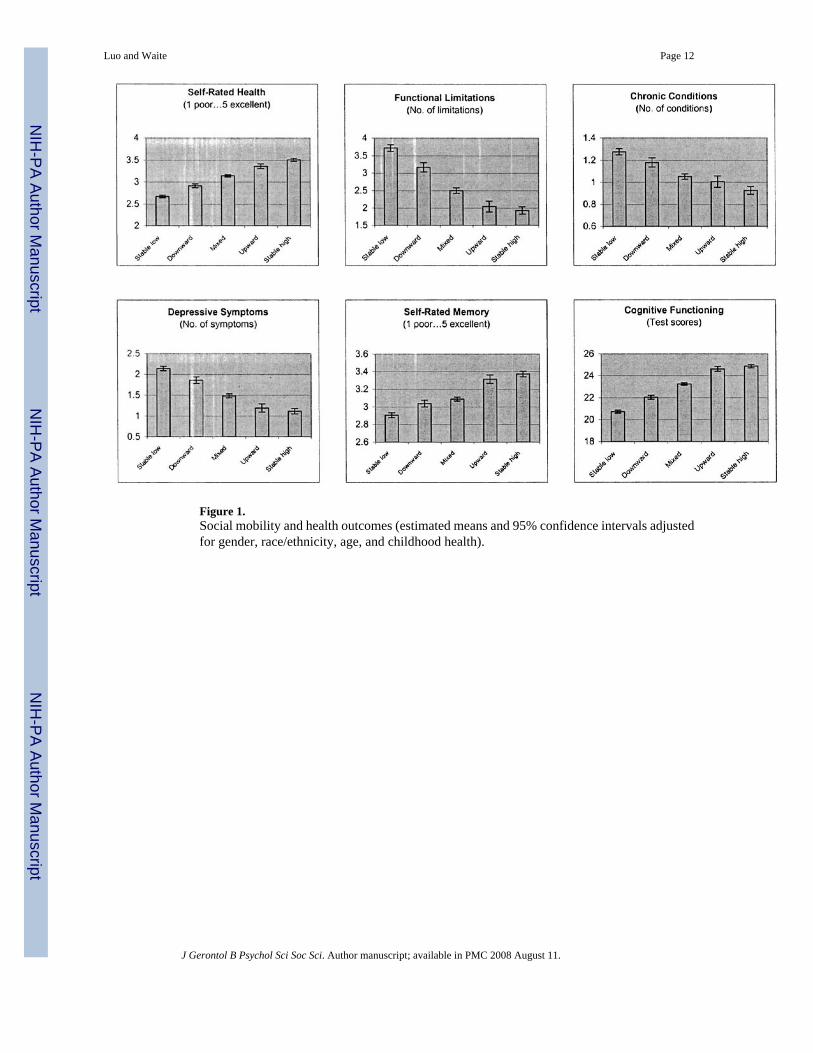
Figure 1.Social mobility and health outcomes (estimated means and 95% confidence intervals adjustedfor gender, race/ethnicity, age, and childhood health).
Luo and Waite Page 12
J Gerontol B Psychol Sci Soc Sci. Author manuscript; available in PMC 2008 August 11.
NIH
-PA Author Manuscript
NIH
-PA Author Manuscript
NIH
-PA Author Manuscript

NIH
-PA Author Manuscript
NIH
-PA Author Manuscript
NIH
-PA Author Manuscript
Luo and Waite Page 13
Table 1Descriptive Statistics of Variables (N = 19,949)
Characteristic M SD
Adult health Self-rated health (1–5)a 3.06 1.18 Functional limitations (0–12)a 2.60 3.15 Chronic conditions (0–6)a 1.11 1.06 Depressive symptoms (0–8)a 1.61 1.94 Self-rated memory (1–5)a 3.11 0.95 Cognitive functioning (0–35)a 22.98 5.27Adult SES Education (years) 11.87 3.40 Household income (log) 10.19 1.47Childhood health Self-rated health (1–5) 4.15 1.00Childhood SES (%) Mother education ≥ 8 years 62 Father education ≥ 8 years 55 Father white-collar job 24 Family financial well-being Poor 33 Average 61 Well-off 6Demographics (%) Female 57 Race/ethnicity White 77 Black 14 Hispanic 7 Other 2 Age (years) 66.87 10.40
Note: SES = socioeconomic status.
aThe number of cases varies for these variables owing to missing values.
J Gerontol B Psychol Sci Soc Sci. Author manuscript; available in PMC 2008 August 11.

NIH
-PA Author Manuscript
NIH
-PA Author Manuscript
NIH
-PA Author Manuscript
Luo and Waite Page 14Ta
ble
2U
nsta
ndar
dize
d O
LS R
egre
ssio
n C
oeff
icie
nts o
f Chi
ldho
od S
ES, C
hild
hood
Hea
lth, a
nd A
dult
SES
(N =
19,
949)
Cha
ract
eris
tic
Chi
ldho
od H
ealth
Adu
lt E
duca
tion
Adu
lt H
ouse
hold
Inco
me
II
III
IIII
I
Dem
ogra
phic
s
Fem
ale
−0.0
4**−0
.14**
−0.1
3**−0
.34**
−0.3
3**−0
.32**
R
ace
B
lack
(vs W
hite
)−0
.09**
−1.0
6**−1
.04**
−0.6
4**−0
.63**
−0.5
1**
His
pani
c (v
s Whi
te)
−0.1
5**−3
.45**
−3.4
0**−0
.80**
−0.7
9**−0
.40**
O
ther
(vs W
hite
)−0
.03
−0.3
4*−0
.33*
−0.4
7**−0
.47**
−0.4
3**
Age
−0.0
0**−0
.05**
−0.0
5**−0
.02**
−0.0
2**−0
.02**
Chi
ldho
od S
ES
Mot
her e
duca
tion ≥8
yrs
0.10
**1.
29**
1.26
**0.
27**
0.26
**0.
12**
Fa
ther
edu
catio
n ≥8
yrs
0.08
**0.
84**
0.81
**0.
15**
0.14
**0.
05*
Fa
ther
whi
te-c
olla
r job
0.06
**1.
40**
1.38
**0.
24**
0.23
**0.
07**
Fa
mily
fina
ncia
l wel
l-bei
ng
Ave
rage
(vs p
oor)
0.19
**0.
57**
0.51
**0.
08**
0.07
**0.
01
Wel
l-off
(vs p
oor)
0.25
**1.
38**
1.30
**0.
21**
0.18
**0.
03
Chi
ldho
od h
ealth
0.31
**0.
09**
0.06
**A
dult
educ
atio
n0.
11**
C
onst
ant
4.21
**13
.51**
12.2
1**11
.72**
11.3
4**9.
96**
R2
0.03
0.34
0.35
0.14
0.14
0.19
Not
es: O
LS =
ord
inar
y le
ast s
quar
es; S
ES =
soci
oeco
nom
ic st
atus
.
* p <
.05
**p
< .0
1.
J Gerontol B Psychol Sci Soc Sci. Author manuscript; available in PMC 2008 August 11.

NIH
-PA Author Manuscript
NIH
-PA Author Manuscript
NIH
-PA Author Manuscript
Luo and Waite Page 15
Table 3Unstandardized OLS Regression Coefficients of Health Outcomes on ChildhoodSES, Childhood Health, and Adult SES
Notes: OLS = ordinary least squares; SES = socioeconomic status.
*p < .05
**p < .01.
J Gerontol B Psychol Sci Soc Sci. Author manuscript; available in PMC 2008 August 11.

NIH
-PA Author Manuscript
NIH
-PA Author Manuscript
NIH
-PA Author Manuscript
Luo and Waite Page 16Ta
ble
4C
umul
ativ
e SE
S an
d H
ealth
Out
com
es
Cum
ulat
ive
SES
Self-
Rat
ed H
ealth
Func
tiona
l Lim
itatio
nsC
hron
ic C
ondi
tions
Dep
ress
ive
Sym
ptom
sSe
lf-R
ated
Mem
ory
Cog
nitiv
e Fu
nctio
ning
02.
67 (2
.64–
2.70
)3.
72 (3
.63–
3.82
)1.
28 (1
.25–
1.31
)2.
14 (2
.09–
2.19
)2.
91 (2
.88–
2.93
)20
.75
(20.
62–2
0.88
)1
3.00
(2.9
8–3.
03)
2.83
(2.7
4–2.
91)
1.12
(1.1
0–1.
15)
1.67
(1.6
2–1.
73)
3.04
(3.0
1–3.
06)
22.6
1 (2
2.48
–22.
73)
23.
26 (3
.23–
3.29
)2.
29 (2
.20–
2.38
)1.
02 (0
.99–
1.05
)1.
34 (1
.29–
1.40
)3.
20 (3
.17–
3.22
)23
.84
(23.
71–2
3.97
)3
3.51
(3.4
7–3.
54)
1.94
(1.8
3–2.
04)
0.93
(0.8
9–0.
96)
1.12
(1.0
5–1.
18)
3.37
(3.3
4–3.
41)
24.8
7 (2
4.71
–25.
02)
Not
es: N
umbe
rs a
re e
stim
ated
mea
ns (9
5% c
onfid
ence
inte
rval
) adj
uste
d fo
r gen
der,
race
/eth
nici
ty, a
ge, a
nd c
hild
hood
hea
lth. S
ES =
soci
oeco
nom
ic st
atus
.
J Gerontol B Psychol Sci Soc Sci. Author manuscript; available in PMC 2008 August 11.