
The impact of capital subsidies: new estimations under continuous treatment
26
Giornale degli Economisti e Annali di Economia Volume 66 - N. 1 (Marzo 2007) pp. 67-92 THE IMPACT OF CAPITAL SUBSIDIES: NEW ESTIMATIONS UNDER CONTINUOUS TREATMENT V ALENTINA ADORNO, CRISTINA BERNINI AND GUIDO PELLEGRINI* Department of Statistics, University of Bologna Received: March 2007; accepted: April 2007 Most of the relevant literature on the evaluation of the impact of public subsidies to private firms deals with the estimation of causal effects of a binary treatment. Howev- er, several policies allow for different levels of subsidies, depending on the investment project, the firm dimension, the region and also on the firms’ choice. The aim of the paper is to evaluate the causal effect of a policy intervention in the case of a continu- ous treatment, exploring the impact of differences in treatment level on policy outcome. As an empirical application, we estimated the impact of subsidies allocated by L. 488/1992, the main regional policy in Italy, in the southern regions of the country in the period 1996-2000. We compare two estimation methods: a parametric method, based on a more traditional DID estimator adapted to the continuous treatment case, and a non parametric estimator, based on a novel two-step matching method developed in our recent work (Adorno, Bernini and Pellegrini, 2007a). On average, our results sup- port the conclusions derived from methods based on the binary treatment: subsidies have a positive and often statistically significant effect on employment, fixed assets and turnover. However, the strong heterogeneity of the treatment outcome with respect to different levels of treatment is highlighted. We find that higher the level of incentive, higher the policy effect until a certain point, from which the marginal impact decreases. The results are robust to changes in the estimation method. JEL Classification: R38, C14 and H71 Keywords: Continuous treatment, Matching estimator, Industrial policy eval- uation, Subsidies to capital accumulation. 1. INTRODUCTION Most of the relevant literature on the evaluation of the impact of pub- lic subsidies to private firms deals with the estimation of causal effects of *Acknowledgment: We are grateful to participants at seminars in Venezia, Rome and Firenze, expecially Fabrizia Mealli, Enrico Rettore and Alessandro Sembenelli for helpful discussions on a previous version of the paper. An anonymous referee gave us substantial suggestions. However, we have full responsibility for any remaining errors. Founding from Ministero dell’Università e della Ricerca Scientifica e Tecnologica, Research Project “Sta- tistical methods for the evaluation of educational, training, and development policies”, is gratefully acknowledged. 03 - adorno 12-06-2007 9:50 Pagina 67
-
Upload
independent -
Category
Documents
-
view
2 -
download
0
Transcript of The impact of capital subsidies: new estimations under continuous treatment

Giornale degli Economisti e Annali di EconomiaVolume 66 - N. 1 (Marzo 2007) pp. 67-92
THE IMPACT OF CAPITAL SUBSIDIES: NEW ESTIMATIONSUNDER CONTINUOUS TREATMENT
VALENTINA ADORNO, CRISTINA BERNINI AND GUIDO PELLEGRINI* Department of Statistics, University of Bologna
Received: March 2007; accepted: April 2007
Most of the relevant literature on the evaluation of the impact of public subsidies to
private firms deals with the estimation of causal effects of a binary treatment. Howev-
er, several policies allow for different levels of subsidies, depending on the investment
project, the firm dimension, the region and also on the firms’ choice. The aim of the
paper is to evaluate the causal effect of a policy intervention in the case of a continu-
ous treatment, exploring the impact of differences in treatment level on policy outcome.
As an empirical application, we estimated the impact of subsidies allocated by L.
488/1992, the main regional policy in Italy, in the southern regions of the country in
the period 1996-2000. We compare two estimation methods: a parametric method,
based on a more traditional DID estimator adapted to the continuous treatment case,
and a non parametric estimator, based on a novel two-step matching method developed
in our recent work (Adorno, Bernini and Pellegrini, 2007a). On average, our results sup-
port the conclusions derived from methods based on the binary treatment: subsidies
have a positive and often statistically significant effect on employment, fixed assets and
turnover. However, the strong heterogeneity of the treatment outcome with respect to
different levels of treatment is highlighted. We find that higher the level of incentive,
higher the policy effect until a certain point, from which the marginal impact decreases.
The results are robust to changes in the estimation method.
JEL Classification: R38, C14 and H71Keywords: Continuous treatment, Matching estimator, Industrial policy eval-uation, Subsidies to capital accumulation.
1. INTRODUCTION
Most of the relevant literature on the evaluation of the impact of pub-lic subsidies to private firms deals with the estimation of causal effects of
*Acknowledgment: We are grateful to participants at seminars in Venezia, Rome andFirenze, expecially Fabrizia Mealli, Enrico Rettore and Alessandro Sembenelli for helpfuldiscussions on a previous version of the paper. An anonymous referee gave us substantialsuggestions. However, we have full responsibility for any remaining errors. Founding fromMinistero dell’Università e della Ricerca Scientifica e Tecnologica, Research Project “Sta-tistical methods for the evaluation of educational, training, and development policies”, isgratefully acknowledged.
03 - adorno 12-06-2007 9:50 Pagina 67

68 VALENTINA ADORNO - CRISTINA BERNINI - GUIDO PELLEGRINI
a binary treatment on one or more outcomes, as employment and invest-ments (Bronzini and De Blasio, 2006, and Bernini, Centra and Pellegrini,2006, for Italy; Roper and Hewitt-Dundas, 2001, for Ireland). However, sev-eral policies allow for different levels of subsidies, depending on the in-vestment project, the firm dimension, the region and also on the firms’choice. This is the case of the subsidies allocated by Law 488/1992, the mostimportant policy intervention to subsidise private capital accumulation inthe poorest Italian regions in the last decade. In the dose-response analysisjargon, the subsidized firms by L. 488 are exposed to different levels or dos-es of treatment. Therefore, studying the impact of such treatment as if itwas binary, not only neglects its heterogeneity, but can also hide some im-portant features of the policy intervention. For instance, policy makersmight be interested in the different effects related to differences in the lev-el of the treatment.
The aim of the paper is to evaluate the causal effect of a policy inter-vention in the case of a continuous treatment. We want to explore the im-pact of differences in treatment level on policy outcome. We confront twoestimation methods: a parametric method, based on a more traditional dif-ference-in-differences (DID) estimator adapted to the continuous treatmentcase, and a non parametric estimator, based on a two-step matching methodrecently developed (Adorno, Bernini and Pellegrini, 2007a). The novel esti-mator matches treatment and comparison units that are similar in terms oftheir observable characteristics in both selection processes, related to thechoice to be exposed to the treatment and to the choice about the level ofthe treatment: in the first step, treated and not treated units are matched onthe basis of a set of covariates; in the second step, among matched units inthe first step, another matching procedure pairs units with similar treatmentlevel. The main empirical advantages of the method is that we can easily in-corporate in the matching procedure some recognized restrictions on the re-lation between the two processes, avoiding matching between units withsimilar values in the variables that specify one process but with different val-ues in the others.1 These features are very important in the empirical appli-cation, because several policy instruments, as the case of L. 488, have in-stitutional characteristics affecting the typology of firms that can have ac-cess to specific subsidization levels.
As an empirical application, we estimated the impact of subsidies allo-
1We are also evaluating the statistical properties of the two-step matching estimator inthe case of continuous treatment, using a Montecarlo experiment (Adorno, Bernini and Pel-legrini, 2007b). The preliminary results show slightly better finite sample properties of theproposed estimator if institutional rules define the level of treatment with respect to thecharacteristic of the treated units.
03 - adorno 12-06-2007 9:50 Pagina 68

THE IMPACT OF CAPITAL SUBSIDIES 69
cated by L. 488 in the southern regions of Italy in the period 1996-2000. Theliterature concerning the ex-post evaluation of the impact of L. 488 is re-cently growing: positive effects of L. 488 on investment are found in Bronzi-ni and De Blasio (2006) and Bernini, Centra and Pellegrini (2006). Pellegri-ni and Carlucci (2003) present empirical evidence of a positive employmenteffect, Bernini, Centra and Pellegrini (2006) also on turnover but not on pro-ductivity. Bronzini and De Blasio (2006) indicate the presence of (moderate)intertemporal substitution: financed firms slowdown significantly their in-vestment activity in the years following the program. All the previous papersconsider the L. 488 as a case of a binary treatment, and do not exploit therichness of the data set that includes information on the level of the subsidyby firm. In our paper we also check if the previous results are confirmed us-ing a continuous treatment estimator. Moreover, the application includes theestimation of the empirical dose-response function related to the L. 488 sub-sidies, i.e. the entire function of average treatment effects over all possiblevalues of the treatment levels.2 Also this function is estimated by paramet-ric and non parametric methods, using a flexible functional form. Thereforewe can determine the fraction of treatment effect heterogeneity that can beattributed to the different levels of treatment.
The paper is structured as follows. Section 2 contains a brief descrip-tion of the L. 488 and of its selection mechanism. In Section 3 we presenta concise analysis of the relevant literature on programme evaluation witha continuous treatment, evidencing the pros and cons of the main pro-posed methods; Section 4 describes the continuous treatment estimators,explaining the modified DID estimator and two-step matching approachproposed in the paper. Section 5 illustrates the data and Section 6 the em-pirical findings. Finally, Section 7 offers some concluding remarks.
2. THE LAW 488/1992: THE INSTITUTIONAL FRAMEWORK AND THE SUBSIDIES ALLO-CATION MECHANISM
State aids to manufacturing and to service sectors, in the form ofgrants and subsidies, have been for many years a key component of re-gional policy in European countries. The use of such policy instruments
2 As will be explained below, the function correctly identifies the impact of all differenttreatment levels to the treated firms. However, it cannot infer how much a change in theamount of subsidy affects the magnitude of its impact. In fact, the dose-response functionis affected by a composition effect: firms at different level of treatment could have dissimi-lar characteristics, and discrepancies in the level of treatment can be imputed to this hete-rogeneity.
03 - adorno 12-06-2007 9:50 Pagina 69

70 VALENTINA ADORNO - CRISTINA BERNINI - GUIDO PELLEGRINI
has been aimed at influencing the regional allocation of investments andemployment, in order to increase competitiveness, self-sustaining growth,and new employment in low income regions. L. 488 was developed in thispolicy framework, as a instrument to subsidize investment in the so-calleddisadvantaged areas, founding private capital accumulation by project-re-lated capital grants.3
The L. 488 allocates subsidies through a “rationing” system based on anauction mechanism which guarantees compatibility of subsidies demandand supply. Auctions are run usually on a yearly basis and take the form ofa project-related capital grant. The first auction was run in 1996, the last auc-tion took place in 2006. In our paper we consider the first four actions (pe-riod 1996-2000), which projects were concluded in the period 1998-2003.
Bernini, Centra and Pellegrini (2006) indicate three main features of L.488 important for evaluation analysis: i) the L. 488 makes clear the targetsof the policy intervention; ii) the selection mechanism of L. 488 identifiesprojects that are viable but cannot be subsidized due to limited financial re-sources; iii) the law operates at a regional level.
L. 488 is basically a regional tender for incentives where the subsidiesallocation is based on general criteria expressing the policy preference. Ineach regional auction the investment projects are ranked using five pre-de-termined criteria:4 1) quota of owner capital invested in the project; 2) num-ber of new employees per unit of investment; 3) ratio between the subsidyrequested by the firm and the higher subsidy applicable, given the rules de-termined by area by the EU Commission; 4) a score related to the prioritiesof the region in relation to location, project type and sector; 5) a score re-lated to the environmental impact of the project. The first three criteria car-ry equal weight: the values related to each criteria are normalized, stan-dardised and added up to produce a single score. The latter two indicatorsare basically additional points to be added to the score if the project is inline with regional and environmental priorities. The total score determinesthe position of the project in the regional ranking. The rankings are drawn
3 The L. 488 auctions are run usually on a yearly basis and take the form of a project-related capital grants. Eligible for assistance are manufacturing and extractive firms; star-ting from 2001, the L. 488 scheme has been extended though separate auctions to the tou-rism and transport sectors. Investment qualified for the intervention by the L. 488 are: set-ting-up, extension, modernization, restructuring, reactivation and relocation. For a de-scription of L. 488 mechanism see, among others, Bronzini and De Blasio (2006) and Pel-legrini and Carlucci (2005).
4 The criteria 4 and 5 were introduced starting from the 1998 (3rd auction).
03 - adorno 12-06-2007 9:50 Pagina 70
THE IMPACT OF CAPITAL SUBSIDIES 71
up through the decreasing order of the score awarded to each project andthe subsidies are allocated to projects until the financial resources grantedto each region are exhausted.5
The five indicators are an explicit expression of the policymakers’ pref-erences. The share of the own funds invested in the project can be consid-ered an (imperfect) proxy of the entrepreneur assessment of the project vi-ability and success: higher the share, greater the commitment of the ownerto the project (Chiri and Pellegrini, 1995). The number of new jobs per unitof total investment is used to re-equilibrate the negative substitution effectof the capital subsidy to the firm labour demand. The policy makers expressa preference for new projects and for labour-intensive investments. Theamount of aid applied for by the firm, relative to ceilings established by theEuropean Union, is the key indicator that transforms the allocation proce-dure to an auction mechanism.
The second interesting feature of the auction mechanism is the presenceof a set of firms willing to invest and having a valid investment project, aschecked by a preliminary screening carried over by a set of appointed banks,but not subsidized. They were admitted into the ranking, but they did notreceive any subsidies because their scores were too low in the ranking. More-over, the administrative data set contains several information on these firms.
Another important feature of L. 488 is that the financial resources to beallocated in every auction are different across regions. Consequently, forevery auction exists a specific regional ranking and a regional allocationthreshold. This characteristic implies that firms with the same propensity tobe financed can be subsidized or rejected, depending on region, size of thefirm and auction.
The institutional framework is important also for the choice about thelevel of the treatment. The maximum amount of subsidy (relative to the lev-el of investment) allowable to a project depends on both the region wherethe investment is localised and the size of the firm. Therefore, it exists someinstitutional constrains related to the level of subsidies received by each firm,depending on some of its characteristics. This aspect can be fully exploitedin the estimation of the treatment level decision.
The selection procedure of L. 488 can help in policy evaluation analysis.The procedure uses the indicators as selection variables: most part of the dif-ference between the group of subsidized firms and the group of non subsi-dized firms is explained by the indicators. Therefore, the indicators can be
5 There are also special rankings for large projects and reserved lists for small and me-dium-sized firms
03 - adorno 12-06-2007 9:50 Pagina 71

72 VALENTINA ADORNO - CRISTINA BERNINI - GUIDO PELLEGRINI
very helpful in the construction of the counterfactual scenario in the evalu-ation analysis: the selection processes can be reconstructed, and the selec-tion effect in the control group estimated. The idea is that controlling for ob-servable differences (in performances and characteristics) allows to controlfor pre-program not observable temporary shocks affecting the probabilityof being subsidized. In this contest the not subsidized firms are eligible tobe part of a control group, as they show both a propensity for investmentand a need to invest very similar to the subsidised firms (Brown et al.,1995;Pellegrini and Carlucci, 2003; Bronzini and De Blasio, 2006).
Another important feature is the expected absence of a double subsidi-sation or the use of other public subsidies by subsidized firms. Actually, theL. 488 regulation imposes that firms financed by L. 488 have to give up toother public subsidies, because the subsidy can not be combined with oth-er source of public financing.
The presence of multiple ranking by region produced by L. 488 is a fun-damental element in implementing the evaluation analysis. As previously not-ed, firms with the same selection variables are subsidized or not subsidizeddepending on the regional threshold, and on the regional amount of finan-cial resources dedicated to the intervention. If the matching procedure is ap-plied by auction and region, a common support problem arises, the match-ing estimator is not adequate and the regression discontinuity design shouldbe applied. Instead, in our case, by pooling the projects by region and auc-tion, an overlapping area of firms with the same propensity to be subsidisedthat are in both the treated group and in the control group is available. Es-sentially, the probability of being subsidized in a single auction depends alsoon “local” conditions, related to the interaction between individual firm andthe “group of peers” in the same auction, as the score of all the participantsto the auction or the amount the top ranked projects applied for.6 The iden-tification assumption used in the matching procedure is that the “local” con-ditions do not affect the outcome of the policy instrument. Therefore, pool-ing the projects by region and auction is an adequate procedure for identify-ing the instrument effects, because we can contrast firms with the same char-acteristics but with different selection results, as the matching evaluationtechnique requires. L. 488 mechanism allows to mimic the treatment groupamong the non treated, re-establishing the experimental conditions in a non-experimental setting, and to construct a reasonable counterfactual scenariofor the evaluation analysis by both the non parametric matching method andthe parametric approach (the DID estimator).
6 We thank an anonymous referee to make clear this point.
03 - adorno 12-06-2007 9:50 Pagina 72

THE IMPACT OF CAPITAL SUBSIDIES 73
3. DIFFERENT APPROACHES TO PROGRAMME EVALUATION WITH CONTINUOUS TREAT-MENT
In the last ten years the interest on the generalization of the programmeevaluation framework from a binary treatment setting to a more generalstructure for the treatments has increased rapidly. The most important rea-son was the growing implementations of public policies or interventionscharacterised by a more complicate structure than the binary one. These arethe cases in which the policy consists of a variety of different programmes,or different discrete levels of treatment, or a strictly continuous treatment.In these situations the continuous treatment setting allows to investigate theform of the entire function of average treatment effects over all possible val-ues of the treatment levels and to study if the effects change when the levelof the treatment changes.
The continuous treatment setting is appropriate in the case of firm in-centive programs, where firms receive different amounts of subsidies. Evenmore, in this situation, it is not so unlikely to find non random treatmentlevel assignment. That is, we are away from an experimental data frameworkbecause there is a non random selection process not only on the participa-tion decision but also with respect to the treatment level assignment. Thismeans the policy instrument (as L. 488) determines a deliberate selectionprocess, and the subsequent selection bias problem has to be tackled usingan appropriate estimation method.
The common approach followed from the evaluation literature in ana-lyzing a binary treatment is the potential outcome approach developed byRubin (1974). It might be easily extended to the continuous case: yi(T) rep-resents the set of potential outcomes, for each unit i, and T represents thecontinuous variable indicating the treatment level. The extension of the po-tential outcome approach represents the basis of all the studies on the pro-gram evaluation in a continuous treatment framework. The recent studies,viewed as extensions of the binary treatment framework, might be classifiedwith respect to the adopted approach: parametric versus non parametric.
In the first group may enter all the works which propose a generaliza-tion of the propensity score approach in a regression contest. It is the caseof the work of Imbens (1999), and Hirano and Imbens (2004), where thepropensity score method is extended in a continuous treatment setting. Theydefine the Generalized Propensity Score (GPS) as the conditional density ofthe treatment given the covariates. In the practical implementation they usea flexible parametric approach: after a specification of the GPS has been cho-sen, they model the conditional expectation of the outcome variable ϒ giventhe treatment variable T and the estimated GPS. Finally, estimates of aver-
03 - adorno 12-06-2007 9:50 Pagina 73

74 VALENTINA ADORNO - CRISTINA BERNINI - GUIDO PELLEGRINI
age potential outcomes at the treatment levels of interest t, E[ϒt], are ob-tained by averaging on the covariates values X entering in the GPS function,at the level t. A parametric approach, allowing for a continuous treatmentvariable in a industrial subsidies context, it is also followed by Bondonio andGereenBaum (2006). They estimate a parametric DID model to measuremean employment impacts of the “Objective 2”, using the value of these sub-sidies as the treatment variable.
On the other side, a non parametric approach is followed by Imai and VanDyk (2004). They develop the theoretical properties of the propensity function,which is a generalization of the propensity score of Rosenbaum and Rubin(1983). Subclassification or matching estimators, given this propensity func-tion, are suggested to estimate E[ϒ(t)]. The non parametric approach pro-posed by Flores (2004) is different with respect to the parameter of interest.He focuses on the entire curve of average potential outcomes or dose-responsefunction, the treatment dose at which the curve is maximized and the maxi-mum value achieved by the curve. The analysis starts by following a non-parametric regression approach. Then, to deal with the problem of “dimen-sionality” when there are a large number of covariates, the paper discusses theuse of GPS. Different approaches are proposed such as matching and weight-ing. A matching approach is also followed by Behrman, Cheng and Todd(2004). Estimation of the expected values for participants and non-partici-pants, conditional on the X and on the level t of treatment, are obtained usinglocal nonparametric regression methods. In estimating average treatment ef-fect on the treated, they propose to use a matching approach over the regionof common overlapping support between the estimated expected values forparticipants and non-participants. A similar matching approach is the one pro-posed by Hornik et al. (2001). The difference regards comparison among units:matching is carried out among units who are similar in terms of baseline char-acteristics, but receive different exposures to the programme. They propose adistance measure that decreases both as the propensity scores become simi-lar and as the assigned treatments become dissimilar.
As mentioned before, the case of L. 488 firm incentive programs maywell be placed in these continuous treatment contests. Also in our case, theidea is to start from the methods developed in the traditional literature onthe binary treatment setting in order to widen their applicability to the caseof the continuous treatment policy instrument. In particular we will focuson two particular methods: we will compare a parametric approach (DID)with a non parametric solution (matching). The main difference with themethods proposed in the continuous treatment literature regards the type ofthe effects we are interested in. While the previous methods mainly focus onthe comparison among treated individuals, in this paper we propose a com-
03 - adorno 12-06-2007 9:50 Pagina 74

THE IMPACT OF CAPITAL SUBSIDIES 75
parison between units treated at different levels and non-treated units. It fol-lows that the selection process that identifies participants versus non-par-ticipants becomes a fundamental source of non-random selection in theidentification of any policy effects, together with the process governing par-ticipation into alternative program doses. Furthermore, as regards the quan-tity to estimate, there are two important considerations that might be point-ed out. First, when the focus is on estimation of policy effects, there is oftenan underestimation of the continuity dimension; the information given bythe continuous treatment variable is lost because what is estimated is an av-erage effect among different levels of treatment. On the other side, when theestimation is a function of the doses, the parameter of interest is the poten-tial outcome ϒ(t) rather than the difference ϒ(t)–ϒ(0).
Starting from these considerations, in our analysis we investigate thepolicy effects on the treated versus the non-treated units at different treat-ment level. Thus, the idea is to compare participants with non-participants,in order to estimate the effects of an intervention for each level of treatment.Furthermore, the analysis allows to evaluate how these effects are relatedwith the continuous treatment variable, identifying the empirical relationamong treatment levels and treatment effects. This approach implies ananalysis of the heterogeneity of the effects with respect to the level of treat-ment, consistently with the recent literature on the heterogeneity of the ef-fects in the program evaluation contest (Athey and Imbens, 2006). Themethodology is explained in the next paragraph.
4. THE CONTINUOUS TREATMENT ESTIMATORS
The common potential outcome approach followed by the evaluation lit-erature in a continuous treatment framework remains also valid in our con-test: yi(T) represents the set of potential outcomes, for each unit i, given arandom sample indexed by i=1…N and T represents the continuous variableindicating the treatment level. Furthermore, the general observed outcomeϒ can be written as:
(1)
where D is a dummy variable indicating the treatment status: in particularD=1 if the individual has been treated and D=0 otherwise, and yi(ti) is theparticular potential outcome at the observed level ti. In practice, when D=1we observe yi(ti), when D=0 we observe yi(0).
Selection into treatment determines both the treatment status di and thetreatment level ti. The participation decision assignment will determine the
y d y t d yi i i i i i= + −( ) ( ) ( )1 0
03 - adorno 12-06-2007 9:50 Pagina 75
76 VALENTINA ADORNO - CRISTINA BERNINI - GUIDO PELLEGRINI
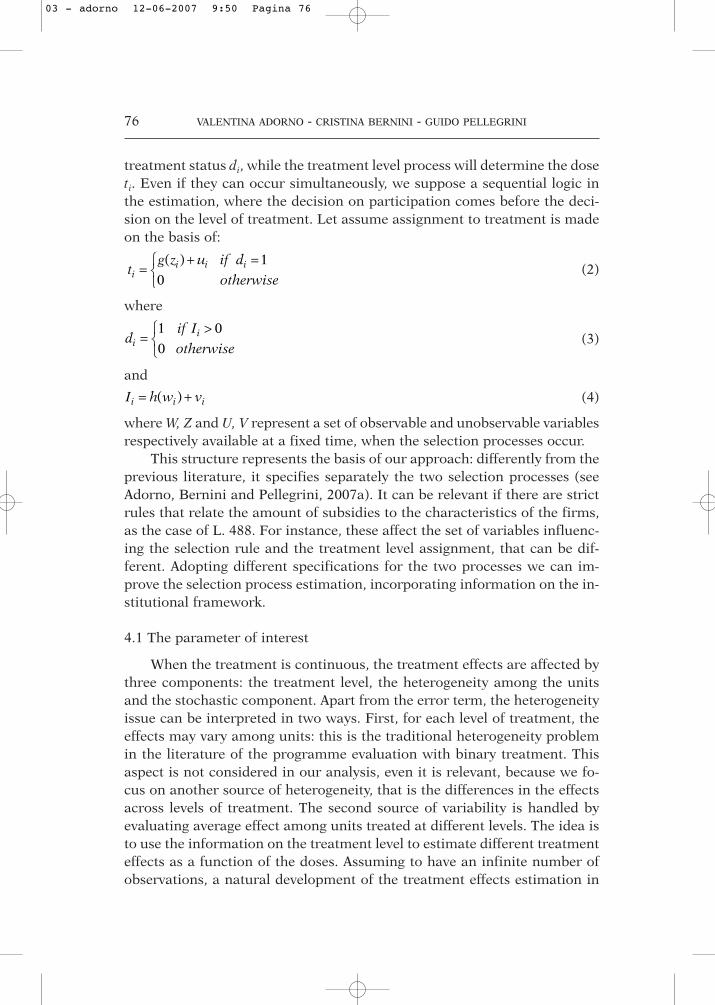
treatment status di, while the treatment level process will determine the doseti. Even if they can occur simultaneously, we suppose a sequential logic inthe estimation, where the decision on participation comes before the deci-sion on the level of treatment. Let assume assignment to treatment is madeon the basis of:
(2)
where
(3)
and
(4)
where W, Z and U, V represent a set of observable and unobservable variablesrespectively available at a fixed time, when the selection processes occur.
This structure represents the basis of our approach: differently from theprevious literature, it specifies separately the two selection processes (seeAdorno, Bernini and Pellegrini, 2007a). It can be relevant if there are strictrules that relate the amount of subsidies to the characteristics of the firms,as the case of L. 488. For instance, these affect the set of variables influenc-ing the selection rule and the treatment level assignment, that can be dif-ferent. Adopting different specifications for the two processes we can im-prove the selection process estimation, incorporating information on the in-stitutional framework.
4.1 The parameter of interest
When the treatment is continuous, the treatment effects are affected bythree components: the treatment level, the heterogeneity among the unitsand the stochastic component. Apart from the error term, the heterogeneityissue can be interpreted in two ways. First, for each level of treatment, theeffects may vary among units: this is the traditional heterogeneity problemin the literature of the programme evaluation with binary treatment. Thisaspect is not considered in our analysis, even it is relevant, because we fo-cus on another source of heterogeneity, that is the differences in the effectsacross levels of treatment. The second source of variability is handled byevaluating average effect among units treated at different levels. The idea isto use the information on the treatment level to estimate different treatmenteffects as a function of the doses. Assuming to have an infinite number ofobservations, a natural development of the treatment effects estimation in
I h w vi i i= +( )
dif I
otherwiseii=
>1
0
0
tg z u if d
otherwiseii i i=
+
=( )
0
1
03 - adorno 12-06-2007 9:50 Pagina 76

THE IMPACT OF CAPITAL SUBSIDIES 77
the continuous case is the difference between the outcome of the units treat-ed at each level with the outcome of the untreated units. Therefore the av-erage treatment effect on the treated at the t-th level is estimated as:
(5)
for a person randomly drawn from the subpopulation of the participants atthe level t. This parameter α(T) is the average treatment level effect (ATLE).ATLE can be estimated using two different approaches: a matching estima-tor and a DID estimator. We propose a comparison between the two meth-ods, as a robustness analysis of our estimation.
4.2 Treatment level effects: a two-step matching approach
The estimator proposed considers the two different processes statedabove, estimating the ATLE by a two step procedure. The first step will iden-tify the participation decision rule and units will be matched on the basis ofsimilar value of the set of covariates identifying this process. Amongmatched units in the first step, another matching procedure (the secondstep) will pair units with similar value in the covariates identifying the treat-ment level assignment. Then, participants and non participants are compa-rable in the sense that the only difference between the two groups is pro-gramme participation. A general form for the proposed two-step matchingestimator is given by:
(6)
where C represents the comparison group, ti stands for the observed level oftreatment for the i-th unit and the expected value is among units at the sametreatment level ti. nt is the number of observations for which ti=t. This meansthat the estimator can be computed only at the observed treatment levels t.mij is the weight placed on comparison observations j for individual i thatcomes from the two matching procedures. In particular,
(7)
where w1ij and w2
ij are the weight placed on comparison observations j forindividual i, respectively in the first and second matching. The matching es-timator can be easily extended into a matching DID estimator, as it will bein the next application.
The first step of the proposed procedure, related to the participation de-cision process, uses the propensity score matching. Rosenbaum and Rubin
mw w
w wij
ij ij
ij ijj C
=
∈∑
1 2
1 2
ˆ( ) ( ) ( )|
α tn
y t m yt
i i ij ij Ci t ti
= −
∈=∑∑1
0
α( ) ( ) ( ) |T E Y T Y T t= − =[ ]0
03 - adorno 12-06-2007 9:50 Pagina 77

78 VALENTINA ADORNO - CRISTINA BERNINI - GUIDO PELLEGRINI
(1983) show that the conditional independence assumption, required for theestimator identification, is also valid if controlling for the propensity scorep(w) = P(Di/Wi) instead of W. The sequential structure of the proposedmatching procedure requires the choice of an algorithm that assigns morethan one control unit to a single treated unit. However, in literature there isa wide choice among this kind of procedures (Becker and Ichino, 2002).
The second step regards the treatment level selection process. We extendthe propensity score method applying it to a continuous treatment regime inorder to reduce the dimension of the covariates set Z. Following the work ofImai and Van Dyk (2004), what is proposed here is to find an appropriate“propensity” function of the variables Z to model the treatment variable T. Letθ(Z)=E(TZ) the parameter that uniquely represents the propensity function.The authors show that the conditional independence assumption holds withZ replaced by the propensity function. Matching on the propensity functioncan be easily accomplished by matching on θ, regardless of the dimension ofZ. The difference with the matching strategies proposed by Hornik et al. (2001)regards the groups on which the pairs are accomplished. In particular, whilethe authors suggest matching pairs among the group of treated units on thebasis of similar values of θ but dissimilar values of the treatment dose, herepairs are performed among the group of treated versus non treated group. Ourmethod is able to estimate the causal effect due to the participation, ruling outthe differences between these two groups. However, there could be some dif-ferences among treated units (at different levels of treatment). Participantsmight be different not only with respect to the level of treatment, but also withrespect to other covariates. Therefore, we evaluate if there is some hetero-geneity with respect to treatment level. However, differences in impacts relat-ed to different treatment levels cannot be attributed only to dissimilarities inthe level of treatment. Differences in impacts can be interpreted as a causaltreatment effects only with respect to the non-treatment status.
We do not exclude that the two selection processes are in some way re-lated. In particular, it is reasonable to argue that the treatment level assign-ment might depend on the participation decision rule. It is the case of L. 488:given the auction mechanism, higher is the probability of receiving the sub-sidy, lower is the amount of requested subsidies. Therefore, the treatmentlevel assignment is conditioned to the participation decision rule. Empiri-cally, the function of the observable variables Z, used to model the treatmentvariable T, is conditioned to the propensity score:
(8)
and θ becomes the new parameter that uniquely represents the propensityfunction modelling the treatment variable T.
θ( ) = ( | , ( ))Z E T Z p W
03 - adorno 12-06-2007 9:50 Pagina 78

THE IMPACT OF CAPITAL SUBSIDIES 79
4.3 Treatment level effects: a DID approach
DID estimators are become an increasingly popular way to estimate theeffects of a public policy. DID estimation consists of identifying a specific in-tervention or treatment and then comparing the difference in outcomes be-fore and after the intervention for groups affected by it to this for unaffect-ed groups. If the (non observable) differences among subsidized and nonsubsidized firms are constant over time, the DID estimator can capture theoutcome changes caused by the policy intervention.
DID estimator can be useful represented in a regression framework(Blundell and Costa Dias, 2002). Formally, let assume that the performanceof a firm i in period r, denoted yir , is given by
(9)
where di is a dummy variable which is one if the i firm is subsidized and ze-ro otherwise, r is a time dummy which is 0 when firm is observed in the pre-treatment period and 1 in the post-treatment period. dir is equal to 1 if firmi participates in the program and is observed in the post-period treatment;0 otherwise. εir represents temporary fluctuations in unobservables. This rep-resentation also allows to control for observable covariates X which affectthe outcome and vary between the two groups reducing the selection bias.The correlation between εir and the probability to be selected into the in-centive program produces the well know selection bias problem. In presenceof a positive temporary shock to a specific sector, firms in this sector aremore willing to invest and to apply for the subsidy. In this case there is a pos-itive relation between the firms that apply to the scheme and the short termmarket perspectives, and the DID method tends to overestimate the effect ofthe policy intervention. The recent econometric literature has suggested thatthis kind of selection bias can be reduced by augmenting the DID estimatorand incorporating conditioning variables reflecting the pre-program per-formance (Heckman et al., 1999; Klette, Møen and Griliches, 2000; Blundelland Costa Dias, 2000 and 2002). The idea is that conditioning for the ob-servable differences (in performances but also in characteristics), we shouldcontrol for pre-program temporary shocks that influence the probability ofbeing subsidized.
The main parameter of interest is the coefficient of the interaction termαDID that gives the DID estimate of the treatment effect. Assuming that dataare available before and after the subsidized firms have received the subsidy,i.e., at times r0 and r1, this gives the estimator
(10)ˆ ( ) ( )αDIDS
rS
rNS
rNS
rS NSy y y y y y= − − − = −1 0 1 0 ∆ ∆
y d r d r Xir i DID i ir ir= + + + + +β β β α β ε0 1 2 ( )
03 - adorno 12-06-2007 9:50 Pagina 79

80 VALENTINA ADORNO - CRISTINA BERNINI - GUIDO PELLEGRINI
where are the average changes in performance from before toafter the incentive scheme was operating, and the superscripts S and NS re-fer to the subsidized and non-subsidized firms, respectively. The estimatedparameter represents the average effect of the subsidy on the subsidizedfirms (also known as ATT in this literature), and it could not be extended tothe not subsidized firms.
The DID estimator can easily be developed in the continuous frameworkevaluating the average changes in performance from before to after the in-centive scheme for different range of the treatment level,
(11)
where is the average change in performance from before toafter the incentive scheme was operating, for the subsidized firms which lev-el of treatment is in the interval [th,tk]. The idea is to use the information onthe treatment level to select group of subsidizes firms (homogenous by grantamount) and to estimate their average treatment effects with respect to thewhole control group.
5. THE DATA
The data used in the analysis are collected in two different surveys: theL. 488 administrative dataset and the AIDA, which contains the budgets de-livered by a subset of Italian firms to Chambers of Commerce. The integra-tion among the different sets of data has required a complex process ofcleaning and merging. The final dataset used in this paper is the same pre-sented in Bernini, Centra and Pellegrini (2006).
The final dataset consists of 665 financed projects and 1.228 non fi-nanced projects in the years 1996-2000. For the validation of the controlgroup, a comparison of the main characteristics of the projects and of theranking indicators in the sample of subsidized and non subsidized firms ispresented (Table 1). As far as the distribution of projects is concerned, a sub-stantial homogeneity between the two groups is found, according to rank-ing indicators, regions and investment typologies. Some difference are foundwith respect to different auctions, that can be attributed to the dissimilarityin the levels of financial resources allocated among waves of auctions, thatdetermines a different share of subsidized firms with respect of the totalnumber of applicants.
Similarities in the two sample referring to budgetary data for year be-fore the start of the project are evaluated. We use this information on theyears of the effective beginning and the effective end of the investment proj-
∆y t t tSh i k( )< <
ˆ ( ) ( ) ( )αDIDS
h i kNSt y t t t y= < < −∆ ∆ 0
∆ ∆y yS NS and
03 - adorno 12-06-2007 9:50 Pagina 80
THE IMPACT OF CAPITAL SUBSIDIES 81
ect to better interpreter the impact of the subsidy comparing the balancesheet the year before the project is really started and the year after the in-vestment is really concluded.7 The alternative would be to choose a fixed in-vestment time for all firms, and to evaluate the policy effects at this time.This procedure could generate serious problem in the interpretation of theestimated impacts, due to the strong heterogeneity in the investment timelengths among firms. A correct matching procedure requires to impute anending date also for the not subsidized firms. We assume that the endingdate for the scheduled investment in not subsidized firms is equal to the datescheduled for the investment beginning, augmented by the average invest-ment period by auction, estimated for the subsidized firms sample.
7 The final estimated impact has to be read as the effect of the subsidy on the projectoutcome one year after the investment is concluded. In order to consider the different timespan we use dummy variables for each year (that is each auction) and deflate variables bythe investment deflator.
TABLE 1 – Summary of the project and ranking indicators in the final dataset
MEDIAN
NOT FINANCED FINANCED TOTAL
Investment(Euro)* 1.358.452 1.415.674 1.372.096
RankingOwn capital indicator 0,448 0,560 0,484Employment indicator 0,003 0,004 0,003
IndicatorSubsidy share indicator 1,333 1,351 1,333
auction 1 0,65% 10,98% 4,28%auction 2 12,70% 44,96% 24,04%
Auction auction 3 57,08% 22,26% 44,85%auction 4 29,40% 21,80% 26,73%Total 100,00% 100,00% 100,00%
Area area 1 (Calabria) 8,71% 6,17% 7,82%area 2 (Basilicata, Sicilia, Campania, Sardegna, Puglia) 88,76% 86,47% 87,96%area 3 (Molise) 2,52% 7,37% 4,23%Total 100,00% 100,00% 100,00%
Modernization 17,67% 13,83% 16,32%Extension 42,18% 53,08% 46,01%Setting up 34,28% 28,27% 32,17%
Project Reactivation 0,08% 0,45% 0,21%typology Reconversion 0,24% 0,00% 0,16%
Restructuring 5,46% 4,36% 5,07%Relocation 0,08% 0,00% 0,05%Total 100,00% 100,00% 100,00%
Source: our elaboration on L. 488 e AIDA data.
* We have deflated profitability and leverage variables by the investment deflator (base=2000)
03 - adorno 12-06-2007 9:50 Pagina 81

82 VALENTINA ADORNO - CRISTINA BERNINI - GUIDO PELLEGRINI
The median values of the covariates do not show strong differences be-tween the two samples in the budgetary data (Table 2). The subsidized firmsare slightly greater, more profitable and more capital intensive, as expected,than the non subsidized firms.
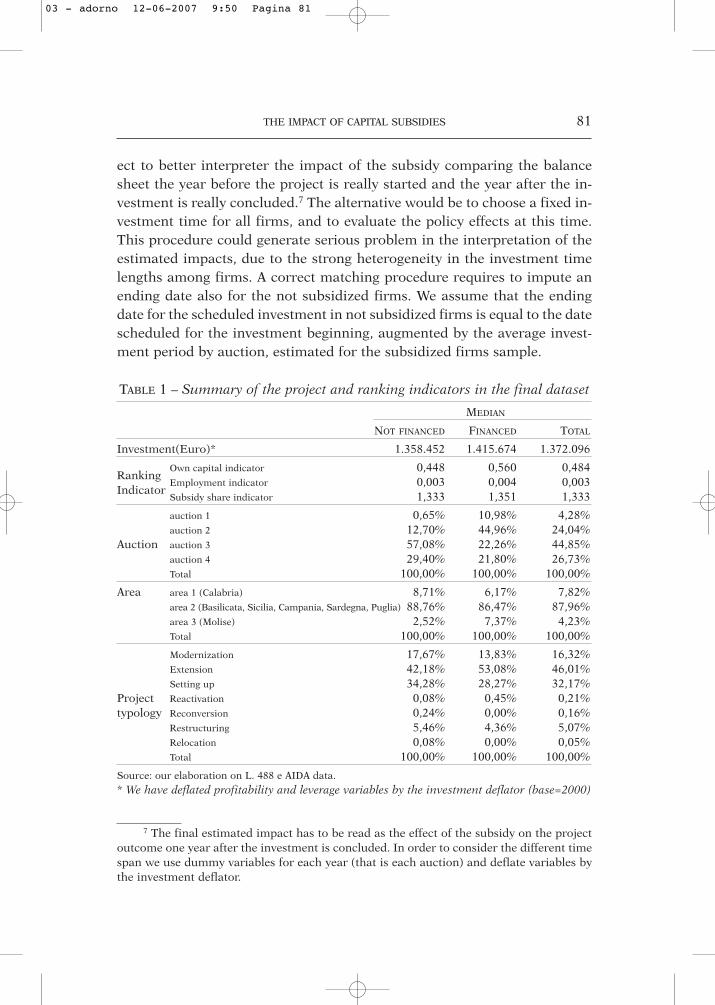
As treatment variable, in order to reduce variability and to limit itsrange, what is proposed here is to use the ratio of the subsidies on the in-vestment (named “quota”), instead of amount of incentives expressed in lev-els: in this way the treatment variable takes value in the interval [0,1]. As out-come variables, on which we want to estimate the treatment effects, threefirm growth variables are considered in the analysis: turnover, number ofemployees and fixed assets, expressed in growth rates terms between subsi-dized and non subsidized firms. The sample homogeneity is put at risk bythe presence of several anomalous data, therefore we trim the subsidized andnon subsidized firm samples at the 10th and 90th percentiles of each of theoutcome variables. Figure 1 shows the distributional graphs of the treatmentvariable, for treated units, and of outcomes variable for the full sample offirms. The share of capital grants seems to have a symmetric distribution
TABLE 2 – Summary of the main covariates in the final dataset
MEDIAN
NOT FINANCED FINANCED TOTAL
Turnover 3.541.644 4.125.601 3.746.266Employees 25 30 26Fixed assets 1.244.287 1.537.239 1.302.372Gr. margin / Turnover 0,09 0,10 0,09
Year 0ROI 4,20 5,57 4,58ROE 4,02 6,99 5,05 Fin. charges / Turnover 0,03 0,03 0,03 Turnover / Employees 169.380 159.485 165.399 Fin. charges / Debt 0,05 0,05 0,05 Value Added 928.895 1.203.206 1.000.404
Turnover 4.680.689 5.863.183 5.090.816 Employees 29 42 32 Fixed assets 1.984.960 3.054.411 2.412.743 Gr. margin / Turnover 0,09 0,10 0,09
Year 1ROI 3,47 3,26 3,37 ROE 2,61 1,93 2,30 Fin. Charges / Turnover 0,02 0,03 0,02 Turnover / Employees 185.048 154.387 169.901 Fin. Charges / Debt 0,03 0,03 0,03 Value Added 1.135.065 1.778.691 1.335.058
Source: our elaboration on L. 488 e AIDA data.
* We have deflated profitability and leverage variables by the investment deflator (base=2000)
03 - adorno 12-06-2007 9:50 Pagina 82

THE IMPACT OF CAPITAL SUBSIDIES 83
over its mean value, equal to 46%. The outcomes variable shows a non sym-metric distribution, with an higher density of values corresponding to low-er growth rates.
6. THE EMPIRICAL FINDINGS
6.1 The two-step matching approach
The first step in the evaluation procedure is the specification of thepropensity score model. We adopt a logit specification of the treatment vari-ables. For the covariates identification, we take advantage of the selectionmechanism that is used to allocate the incentives under the L. 488 by in-cluding the selection indicators in the equation of the propensity score. Themain ranking indicators are introduced, either in level or squared and cubed.Dummy variables relative to the different auctions are considered, being al-so a proxy of the investment year. Moreover, the interaction between main
.002
.008
ytisne
D
0 100 200 300 400 500
Fixed assets
0
.005
.015
ytisneD
-50 0 50 100 1500
2
4
0 .2 .4 .6
0
.002
-100 0 100 200 300Employees
.01
ytisneD
Share of capital grants on the total investment
ytisneD
.006
Turnover
FIGURE 1 - Distribution of the treatment and the growth rate of the outcome variables
03 - adorno 12-06-2007 9:50 Pagina 83
84 VALENTINA ADORNO - CRISTINA BERNINI - GUIDO PELLEGRINI
indicators and dimension (large dimension by European Union Commissiondefinition) is introduced in the model specification, together with regionaland sectorial indicators. To test the “balancing hypothesis” we follow the pro-cedure proposed in Becker and Ichino (2002). Splitting the sample bypropensity score values and imposing a common support restriction, we testthat the balancing hypothesis is satisfied.
The second step of the evaluation procedure is the specification of thetreatment level model. Conditioning of the treatment level assignment onparticipation decision is obtained by estimating the (share of) subsidy at dif-ferent point of the propensity score distribution. Empirically, we have splitthe sample in equal average propensity score values between treated and nontreated units and estimate a linear regression model for the share of subsi-dies, for each chosen blocks of the propensity score. In order to select thecovariates to include in the analysis, the standard goodness of fit statisticstogether with the common specification model tests have been carried out.Some covariates are common for each model: they mainly refer to the vari-able reflecting the subsidies limitation imposed by the law (firm size and ar-eas). In same cases other variables may be found in some specification butnot in others: they are the sectorial dummies, the kind of investment quali-fied for the intervention or the amount of debts charges on debts stock. Giv-en the estimated coefficients of the models and the values of covariates, thepredicted values are also computed for the group of the non-participants, inorder to use this variable to compute the second step of the proposed match-ing procedure. To test the “balancing hypothesis” we follow the same pro-cedure proposed in Becker and Ichino, (2002). We test that the balancing hy-pothesis is satisfied for each model.
Once estimated the two models we compute the two-step matching(DID) procedure, as described above, choosing as outcome variables the firmgrowth rates. Among the matching with replacement methods proposed inliterature we chose, for each step, the radius matching, with four differentsize for the radius. The average treatment level effects are estimated by eq.(6). The average treatment effects on the treated are reported in Table 3.
As expected, the growth impact of 488 on subsidized firms is positiveand statistically significant: the turnover decreases from 12 to 9 points low-er in the subsidized firms than in non subsidized ones, depending on the ra-dius of the matching algorithm; the number of employees decreases from 25to 11 per cent points lower and the fixed assets decrease to 25 per centpoints. The results confirm the findings reported in Pellegrini and Carlucci(2003) using a parametric approach and the results of Bernini, Centra andPellegrini (2006) using a matching approach but in a binary case. The effectsof the L. 488 are in line with the (explicit or less explicit) targets: the subsi-
03 - adorno 12-06-2007 9:50 Pagina 84
THE IMPACT OF CAPITAL SUBSIDIES 85
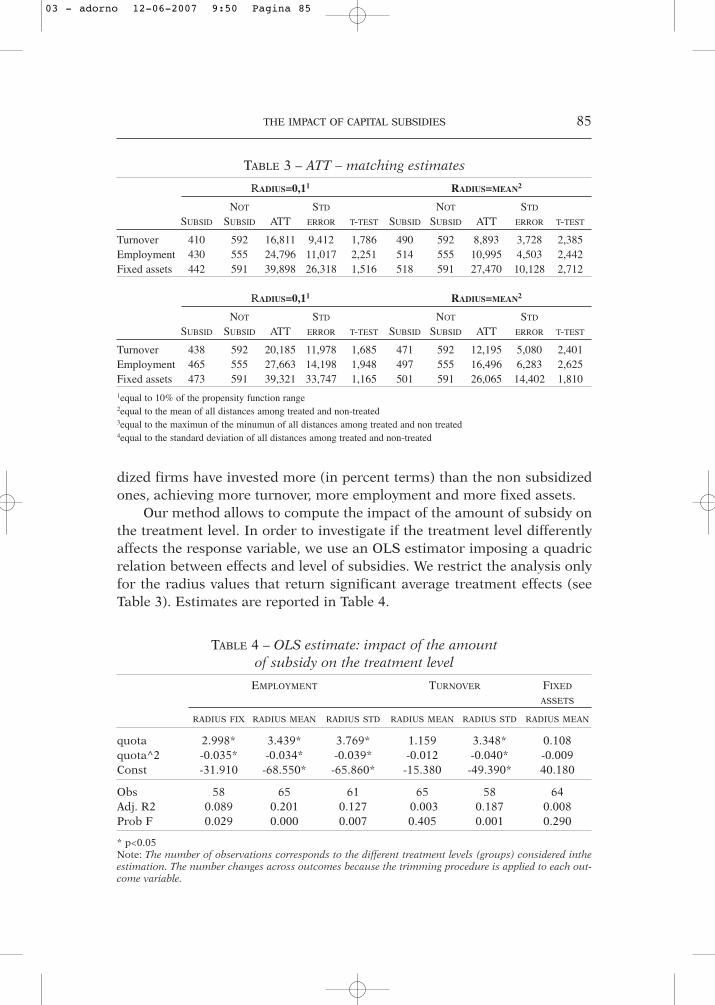
dized firms have invested more (in percent terms) than the non subsidizedones, achieving more turnover, more employment and more fixed assets.
Our method allows to compute the impact of the amount of subsidy onthe treatment level. In order to investigate if the treatment level differentlyaffects the response variable, we use an OLS estimator imposing a quadricrelation between effects and level of subsidies. We restrict the analysis onlyfor the radius values that return significant average treatment effects (seeTable 3). Estimates are reported in Table 4.
TABLE 3 – ATT – matching estimates
RADIUS=0,11 RADIUS=MEAN2
NOT STD NOT STD
SUBSID SUBSID ATT ERROR T-TEST SUBSID SUBSID ATT ERROR T-TEST
Turnover 410 592 16,811 9,412 1,786 490 592 8,893 3,728 2,385Employment 430 555 24,796 11,017 2,251 514 555 10,995 4,503 2,442Fixed assets 442 591 39,898 26,318 1,516 518 591 27,470 10,128 2,712
RADIUS=0,11 RADIUS=MEAN2
NOT STD NOT STD
SUBSID SUBSID ATT ERROR T-TEST SUBSID SUBSID ATT ERROR T-TEST
Turnover 438 592 20,185 11,978 1,685 471 592 12,195 5,080 2,401Employment 465 555 27,663 14,198 1,948 497 555 16,496 6,283 2,625Fixed assets 473 591 39,321 33,747 1,165 501 591 26,065 14,402 1,8101equal to 10% of the propensity function range2equal to the mean of all distances among treated and non-treated3equal to the maximun of the minumun of all distances among treated and non treated4equal to the standard deviation of all distances among treated and non-treated
TABLE 4 – OLS estimate: impact of the amount of subsidy on the treatment level
EMPLOYMENT TURNOVER FIXED
ASSETS
RADIUS FIX RADIUS MEAN RADIUS STD RADIUS MEAN RADIUS STD RADIUS MEAN
quota 2.998* 3.439* 3.769* 1.159 3.348* 0.108quota^2 -0.035* -0.034* -0.039* -0.012 -0.040* -0.009Const -31.910 -68.550* -65.860* -15.380 -49.390* 40.180
Obs 58 65 61 65 58 64Adj. R2 0.089 0.201 0.127 0.003 0.187 0.008Prob F 0.029 0.000 0.007 0.405 0.001 0.290
* p<0.05Note: The number of observations corresponds to the different treatment levels (groups) considered intheestimation. The number changes across outcomes because the trimming procedure is applied to each out-come variable.
03 - adorno 12-06-2007 9:50 Pagina 85

86 VALENTINA ADORNO - CRISTINA BERNINI - GUIDO PELLEGRINI
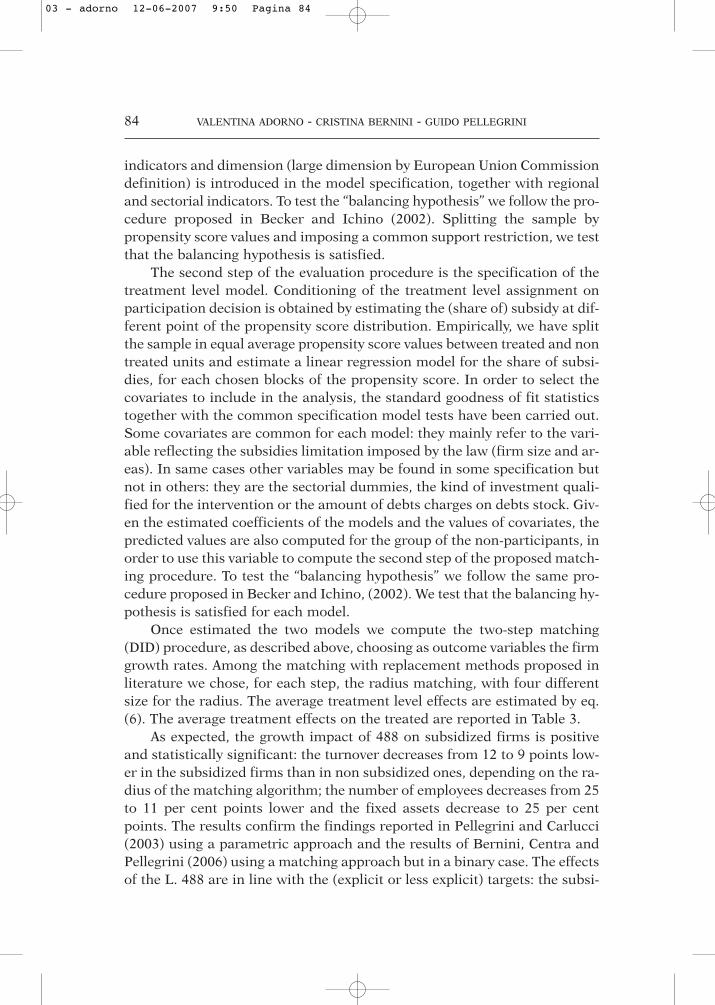
The results show a significant quadratic relation between effects andtreatment levels for turnover and employment. In particular, given the signof the coefficient for the level (quota), the analysis evidences an increasingpositive impact of the amount of incentives for low values of treatment lev-el with respect to non treated firms. After reaching a maximum level, the ef-fect of the subsides on the outcomes decreases. Figure 2 shows the graphsof the predicted values of these OLS estimates.
This result is also confirmed by adopting a non parametric estimator forthe relation between effects and treatment levels. Figure 3 shows the resultsof the non parametric mean regression estimator using the Nadayara-Wat-son kernel estimator (Nadayara, 1964) for the outcome variables. Again, theresults confirm heterogeneity of the treatment outcome with respect to dif-ferent levels of treatment, with an increasing relation for low values of sub-sidies. This evidence confirms that the level of the treatment affects differ-ently the performance of firms with respect to non treated firms. In partic-ular, the graphical analysis evidences an increasing positive impact of the
08-06-
04-02-
002
htw
org revonrut
no evitn
ecni fo tceff
E
0 20 40 60 80 100Incentive
The impact of the ratio of incentive on treatment
06-04-
02-0
02htwor g t
nen
myol
pme no evit
necni fo tceffe
0 20 40 60 80 100Incentive
The impact of the ratio of incentive on treatment
Turnover Employment
02-0
0204
htwor
g stes sa dexi f
no e vi tn
ecn i fo t ceff
E
0 20 40 60 80 100Incentive
The impact of the ratio of incentive on treatment
Fixed assets
FIGURE 2 - Predicted OLS estimates for impact of the amount of subsidy on the treatment level
03 - adorno 12-06-2007 9:50 Pagina 86

THE IMPACT OF CAPITAL SUBSIDIES 87
amount of incentives until a peak is reached. After that, the effect of the sub-sides on the outcomes is decreasing. The value, on which this maximumrefers to, is different for the three outcome variables: for turnover it is be-tween 40 and 50% of the share of subsidies on the investment. For employ-ment the impact is increasing until the grant is equal to 50-60% of the totalinvestment. For fixed asset this peak is not so relevant, and also the OLS es-timator returns not significant values for the coefficients.
6.2 The parametric DID estimator
The analysis of the effects of the treatment level on outcomes is also per-formed using a parametric technique, as DID, extended in the continuousframework. We use the specification of eq. (9), where the outcomes are ex-
The impact of the ratio of incentive on treatment
Eff
ect o
f in
cent
ive
on tu
rnov
er g
row
th
Incentive
Turnover
The impact of the ratio of incentive on treatment
Eff
ect o
f in
cent
ive
on e
mpl
oym
ent g
row
thIncentive
Employment
The impact of the ratio of incentive on treatment
Eff
ect o
f in
cent
ive
on f
ixed
ass
et g
row
th *
E2
Incentive
Fixed assets
FIGURE 3 - Kernel estimates for impact of the amount of subsidy on the treatment level
03 - adorno 12-06-2007 9:50 Pagina 87

88 VALENTINA ADORNO - CRISTINA BERNINI - GUIDO PELLEGRINI
pressed in log terms. For the covariates, we select the same subset of ob-servable variables used in the Propensity Score function previously de-scribed; we also introduce in the model specification the investment timelength, in order to control for the different time span of the projects.
The model is estimated on the whole sample of treatment and controlgroups and with respect to different range of the treatment level. The vari-able quota is split in six intervals: 10-30%, 30-40%, 40-50%, 50-60% andmore than 60% (Table 5).
TABLE 5 – ATLE - DID regression estimates
EMPLOYMENT TURNOVER FIXED ASSET
Quota ATT P>|t| n Adj-R2 ATT P>|t| n Adj-R2 ATT P>|t| n Adj-R2
Wholesample 0,220 0,000 665 0,318 0,164 0,000 665 0,295 0,423 0,000 665 0,350
10-30% 7,50 0,692 49 0,323 -3,50 0,860 44 0,277 -14,80 0,535 46 0,35630-40% 18,80 0,201 82 0,326 9,80 0,506 80 0,295 31,20 0,088 82 0,35540-50% 24,10 0,017 197 0,303 26,20 0,009 198 0,289 56,70 0,000 199 0,35850-60% 25,40 0,021 154 0,315 14,40 0,185 157 0,298 53,10 0,000 157 0,356>60% 23,70 0,092 89 0,316 14,90 0,282 90 0,289 28,20 0,099 89 0,359
-0,200
-0,100
0,000
0,100
0,200
0,300
0,400
0,500
0,600
0,700
10-30% 30-40% 40-50% 50-60% >60%
Quota
DID_
EL
TA
Employment Turnover Fixed Asset
FIGURE 4 - ATLE- DID parameters plot with respect to the treatment level
03 - adorno 12-06-2007 9:50 Pagina 88

THE IMPACT OF CAPITAL SUBSIDIES 89
Estimates on the whole sample are very close to those found with thematching approach and highly significant. The results of DID estimation ofthe relation between the outcomes and the level of subsidy confirm the het-erogeneity of the treatment outcome with respect to different levels of treat-ment. The analysis evidences an increasing positive impact of the amount ofincentives, especially for fixed asset, until the grant is the 40-50% of the to-tal investment. After this peak, the effect of the subsides on the outcomes isdecreasing: firms investing in the project less than the half of their capitalachieve less favourable performance. In general, the effect of very small andvery large grants with respect to the level of the firm’s investment is positivebut low.
The results are robust to different estimators: the comparison of thematching and DID estimates shows that the average treatment effects on theoutcomes are similar. In both cases the profile of the outcome effects on thesubsidies is non linear, with a initial increasing phase up to a maximum: thedifference between the estimators is basically only on the peak value. Thisresult might be justified by the features of DID estimator in the case of con-tinuous treatment. By construction, DID is implemented comparing a lim-ited sample of treated firms (homogeneous in quota interval) with the wholesample of the control group: this can influence the coefficient estimates andreduce efficiency. These drawbacks are overcame by the proposed two stepmatching because of, for each treatment level, it compares treated units withthe most similar non treated firms with respect to the observable variables.Another interesting feature of the matching in the continuous case is theability to evaluate the effects at each level of the subsides and not at prede-fined treatment intervals, as in the case of DID.
7. CONCLUSION
The paper presents a comparison of parametric and non parametricmethods to the evaluation of the effects of a continuous treatment. A modi-fied DID estimator is contrasted with a novel double matching estimator,easy to apply and computationally not heavy. Both methods allow to explorethe impact of differences in treatment level on policy outcome. As an em-pirical application, we estimated the impact of subsidies allocated by L.488/1992.
Our results basically support the conclusions derived from methodsbased on the binary treatment. Using the double matching method, the im-pact of L. 488 on subsidized firms is positive and statistically significant: theturnover decreases from 12 to 9 points lower in the subsidized firms than innon subsidized ones, depending on matching algorithm; the number of em-
03 - adorno 12-06-2007 9:50 Pagina 89

90 VALENTINA ADORNO - CRISTINA BERNINI - GUIDO PELLEGRINI
ployees decreases from 25 to 11 per cent points lower and the fixed assetsdecrease to 25 per cent points. The findings are robust to different estima-tion methods: the parametric estimator gives similar results. Overall, the re-sults reported in Pellegrini and Carlucci (2003) using a parametric approachand in Bernini, Centra and Pellegrini (2006) using a matching approach butin a binary case are confirmed by our empirical analysis. The effects of theL. 488 are in line whit the (explicit or less explicit) targets: subsidized firmshave invested more (in percent terms) than the non subsidized ones, achiev-ing more turnover, more employment and more fixed assets.
However, our methods show the strong heterogeneity of the treatmentoutcome with respect to different levels of treatment. The share of the im-pact variance explained by differences in the subsides is about the 20% us-ing the non-parametric method, 30-35% using the parametric method. Wefind that higher the level of incentive, higher the policy effect until a certainpoint, from which the marginal impact is decreasing. The results confirm theempirical evidence that the additional effect of very small grants is low (Min-istero delle Attività Produttive, 2006).
Several economic policies use continuous policy variables. Therefore,both methods we used can have a wide application field. Nevertheless, thenon parametric two step matching method offers more information to theempirical instrument evaluation: a correct measure of the impact of all dif-ferent treatment levels to the treated firms can be derived; moreover, it eval-uates the effects at each level of the subsides and not at predefined treatmentintervals, as in the case of DID. In addition, the comparison between thetreated and the non treated firms is more homogeneous with respect to thetreatment level.
However, the method can explain heterogeneity but cannot suggest that,in the lower (higher) part of the curve, an increase in the amount of subsidycan increase (decrease) the impact. In fact, firms at different level of treat-ment could have dissimilar characteristics, and discrepancies in the level oftreatment can be imputed to this heterogeneity. Only if we use the same sam-ple (the same firms’ mix) at different levels of treatment this comparison ismeaningful. We left this analysis for future research.
REFERENCES
ADORNO A. - BERNINI C. AND PELLEGRINI G. (2007a), Evaluating the effect of pol-icy intervention with a continuous treatment. The case of subsidies to cap-ital accumulation, presented at Miur 40% Workshop “La valutazione del-l’impatto di interventi pubblici: metodi e studi di caso”, Università degliStudi di Firenze, January 2007.
03 - adorno 12-06-2007 9:50 Pagina 90

THE IMPACT OF CAPITAL SUBSIDIES 91
ADORNO, A. - BERNINI C. AND PELLEGRINI, G. (2007b), Comparing matchingmethods in policy evaluation, submitted to CLADAG Conference in Mac-erata (April 2007).
ATHEY, S. AND IMBENS, W. (2006), “Identification and inference in nonlineardifference-in-difference models”, Econometrica, vol. 74, n. 2, 431-497.
BECKER, S. O. AND ICHINO, A. (2002), “Estimation of average treatment effectsbased on propensity scores”, The Stata Journal, vol. 2, n. 4, 358-377.
BEHRMAN J. - CHENG, Y. AND TODD, P. (2004), “Evaluating preschool programswhen length of exposure to the program varies: a non parametric ap-proach”, Reviews of Economics and Statistics, vol. 86, n. 1, 108-132.
BERNINI, C. - CENTRA, M. AND PELLEGRINI, G. (2006), “Growth and efficiencyin subsidized firms”, presented at the Workshop The evaluation ofLabour Market, Welfare and Firms Incentive Programmes, Venice, 11-13May 2006.
BLUNDELL, R. AND COSTA DIAS, M. (2002), “Alternative Approaches to Evalu-ation in Empirical Microeconomics”, Portuguese Economic Journal, vol.1, 91-115.
BLUNDELL, R. AND COSTA DIAS, M. (2000), “Evaluation Methods for Non-Ex-perimental Data”, Fiscal Studies, vol. 21, n. 4, 427-468.
BONDONIO, D. AND GREENBAUM, ROBERT T. (2006), “Do Business Investment In-centives Promote Employment in Declining Areas? Evidence from EUObjective-2 Regions”, European Urban and Regional Studies, vol. 13, n.3, 225-244.
BRONZINI, R. AND DE BLASIO, G. (2006), “Evaluating the Impact of InvestmentIncentives: The Case of the Italy’s Law 488/1992”, Journal of Urban Eco-nomics, vol. 6, n. 2, 327-349.
BROWN, M. A. - CURLEE, R. T. AND ELLIOTT, S. R. (1995), “Evaluating Tech-nology Innovation Programs: The Use of Comparison Groups to Identi-fy Impacts”, Research Policy, vol. 24, 669-684.
CARLUCCI, C. AND PELLEGRINI, G. (2005), “Nonparametric analysis of the ef-fects on employment ofpublic subsidies to capital accumulation: thecase of law 488/92 in Italy”, presented at the Congress AIEL 2004,Modena.
CHIRI, S. AND PELLEGRINI, G. (1995), “Gli aiuti alle imprese nelle aree de-presse”, Rivista economica del Mezzogiorno, n. 3, 166-181.
FLORES, CARLOS A. (2004), “Estimation of dose response funcions and opti-mal doses with continuous treatment”, Working paper, University of Mi-ami, 2004.
HECKMAN, J.J. - LALONDE, R. AND SMITH, J. (1999), “The economics andeconometrics of active labour market programs”, in A. Ashenfelter andD. Card, Eds. Handbook of Labour Economics, vol. 3, Amsterdam.
03 - adorno 12-06-2007 9:50 Pagina 91

92 VALENTINA ADORNO - CRISTINA BERNINI - GUIDO PELLEGRINI
HIRANO, K. AND IMBENS, G. (2004), “The propensity score with continuoustreatment”. Draft of a chapter for Missing data and bayesian methods inpractise: contributions by Donald Rubin’s Statistical family, 2004, forth-coming from Wiley.
HORNIK, R. - ROSENBAUM, P.R. - LU, B. - ZANUTTO E. (2001), “Matching withdoses in an observational study of a media campaign against drug abuse”,Journal of the American Statistical Association, vol. 96, n. 456, 1245-1253.
KLETTE, T.J. - MØEN, J. AND GRILICHES, Z. (2000), “Do Subsidies to Commer-cial R&D Reduce Market Failures?”, Microeconomic Evaluation Studies,Research Policy, vol. 29, 471-495.
IMAI, K. AND VAN DYK, D. (2004), “Causal inference with general treatmentregimes: Generalizing the propensity score”, Journal of the American Sta-tistical Association, vol. 99, n. 467, 854-866.
IMBENS, G. W. (1999), “The role of the propensity score in estimating dose-response functions”. NBER Technical Working Papers 0237, National Bu-reau of Economic Research, Inc, April 1999. Available athttp://ideas.repec.org/p/nbr/nberte/0237.html.
MINISTERO DELLE ATTIVITÀ PRODUTTIVE (2006), Relazione sugli interventi disostegno alle attività economiche e produttive predisposta ai sensi del-l’art. 1 della l. 7 agosto 1997 n. 266, Roma, giugno 2006.
NADAYARA, E. A. (1964), “On estimating regression”, Theory and probabilityand its applications, vol. 9, 141-142.
PELLEGRINI, G. AND CARLUCCI, C. (2003), “Gli effetti della legge 488/92: una va-lutazione dell’impatto occupazionale sulle imprese agevolate”, RivistaItaliana degli Economisti, n. 2, 267-286.
ROPER, S. AND HEWITT-DUNDAS, N. (2001), “Grant Assistance and Small FirmDevelopment in Northern Ireland and the Republic of Ireland”, ScottishJournal of Political Economy, Scottish Economic Society, vol. 48, n. 1, 99-117.
ROSENBAUM, P. AND RUBIN D. B. (1983), “The central role of the propensityscore in observational studies for causal effects”, Biometrika, vol. 70, 41-55.
RUBIN, D. (1974), “Estimating causal effects of treatments in randomized andnon-randomized studies”, Journal of Educational Psychology, n. 66, 666-701.
03 - adorno 12-06-2007 9:50 Pagina 92