Subsidies and Fiscal Deficit in Post-Reforms India
15
Subsidies and Fiscal Deficit in Post Reforms India Jasoda Jena and Chittaranjan Nayak ABSTRACT The Government of India has been subsidising various economic goods, mainly food, fertiliser and petroleum. It is argued that subsidies are responsible for persistent high fiscal deficit over the years. The present paper attempts to study the trend of major subsidies given by the Government of India, and then examines whether all the forms of subsidies are uniformly responsible for fiscal deficit or otherwise. Based on annual time series data from 1992-93 to 2012-13, the study observes that in the post-reforms period, food and fertiliser subsidies have grown at a sharper rate than petroleum subsidies. The regression results also confirm that food and fertiliser subsidies have a positive and significant impact on fiscal deficit. The analysis of petroleum subsidies is more complicated. If we see only the explicit subsidies for petroleum products, then their rise is not significant over the post-reforms period, except for 2008-12. However, when we include the under-recoveries of Oil Marketing Companies (OMCs), the story of petroleum subsidies becomes completely different. While the effectiveness of subsidies vis-à-vis their fiscal burden need a detailed scrutiny, the present paper argues for a National Policy on Subsidies. Keywords: Subsidies, Fiscal deficit, Augmented Dickey-Fuller test 1.0 Introduction The Indian government has been subsidising many industries and products- from petrol to food-since Independence. Subsidies are given not just from social considerations but also from economic standpoint. Subsidies to consumers are basically welfare-oriented whereas production subsidies are considered to be growth-oriented. _________________________ Ms. Jasoda Jena, Department of Economics, Ravenshaw University, Cuttack. Dr. Chittaranjan Nayak, Department of Economics, Ravenshaw University, Cuttack.
-
Upload
independent -
Category
Documents
-
view
3 -
download
0
Transcript of Subsidies and Fiscal Deficit in Post-Reforms India

Subsidies and Fiscal Deficit in Post Reforms India
Jasoda Jena and Chittaranjan Nayak
ABSTRACT
The Government of India has been subsidising various economic goods, mainly
food, fertiliser and petroleum. It is argued that subsidies are responsible for
persistent high fiscal deficit over the years. The present paper attempts to study
the trend of major subsidies given by the Government of India, and then
examines whether all the forms of subsidies are uniformly responsible for fiscal
deficit or otherwise. Based on annual time series data from 1992-93 to 2012-13,
the study observes that in the post-reforms period, food and fertiliser subsidies
have grown at a sharper rate than petroleum subsidies. The regression results also
confirm that food and fertiliser subsidies have a positive and significant impact
on fiscal deficit. The analysis of petroleum subsidies is more complicated. If we
see only the explicit subsidies for petroleum products, then their rise is not
significant over the post-reforms period, except for 2008-12. However, when we
include the under-recoveries of Oil Marketing Companies (OMCs), the story of
petroleum subsidies becomes completely different. While the effectiveness of
subsidies vis-à-vis their fiscal burden need a detailed scrutiny, the present paper
argues for a National Policy on Subsidies.
Keywords: Subsidies, Fiscal deficit, Augmented Dickey-Fuller test
1.0 Introduction
The Indian government has been subsidising many industries and
products- from petrol to food-since Independence. Subsidies are given not just
from social considerations but also from economic standpoint. Subsidies to
consumers are basically welfare-oriented whereas production subsidies are
considered to be growth-oriented.
_________________________
Ms. Jasoda Jena, Department of Economics, Ravenshaw University, Cuttack.
Dr. Chittaranjan Nayak, Department of Economics, Ravenshaw University, Cuttack.

60 MANTHAN: Journal of Commerce and Management
Some recent literature has been highly critical of the ongoing subsidy
mechanism. It is argued that subsidies increase fiscal deficit and interest rates;
thereby hamper the prospect of growth of the economy. The debate continues in
the mainstream literature despite the fact that the economy is considered to be
under the grip of the neoliberal philosophy, which advocates reduction of
subsidies for fastening the growth process and bringing efficiency in the
economy. However, what has actually happened to subsidies in India is a
matter of empirical scrutiny.
The present paper attempts to examine the trend of different categories of
subsidies, and also examines if subsidies raise fiscal deficit significantly. The
remainder of the paper is organised in three sections. Section II presents a brief
review of literature. In Section III, we have given an explanation of data, key
variables and methodology. The findings of our study are presented in Section
IV, and Section V summarises.
2.0 Literature Review
The literature on the impact of different categories of subsidies on fiscal
deficit is quite divided. Some recent studies have observed that petroleum
subsidies are both “inefficient and inequitable”. They encourage
overconsumption of petroleum, delay the adoption of energy-efficient
technologies, and crowd out high-priority public spending, including spending
on physical infrastructure, education, health and social protection [Coady, et
al.2010; Anand, et al.2013; IISD, 2012, 2012a]. Corroborating the above
observation, Arze et al. (2012) find “Most of the benefits of fuel subsidies also
go to higher income groups who tend to consume more”. Recognition of these
shortcomings has led to an active debate in India as to the merits of replacing
these subsidies with better targeted measures. Therefore, fuel subsidy becomes
an inefficient instrument for protecting the poor households and ascertaining
equity (ibid).
Bhattacharya & Batra (2009) attempt to show differential impact of
international oil prices on domestic inflation and output growth in India under
two alternative scenarios. One, when domestic fuel prices are allowed a
formula-based automatic alignment with international oil prices; and two, when

Subsidies and Fiscal Deficit in Post Reforms India 61
as per the current policy, fuel prices evolve as a consequence of revisions
specified periodically by the government. By using a sophisticated vector
autoregressive framework using the technique of innovating accounting they
conclude that:
“Fuel prices if left free to adjust automatically to international price
variations will impact inflation in a more sustained fashion. The impact
of prices aligned with international oil prices in contrast with that of
government regulated prices on inflation and output growth not just lasts
longer but is also more magnified… A way out has therefore to be found
so as to implement price reform with minimum social costs.”
Sharma (2012) has analysed in detail the issues relating food subsidy in
India. He states that “food subsidy programmes in the world that has created a
relatively effective social safety net but is also under increasing criticism because
of its large contributions to government budget deficits, economic inefficiency
and poor targeting”. In order to better target food subsidies, the government had
redesigned the public distribution system, known as Targeted Public Distribution
System (TPDS), in 1997 (Mane, 2006). The Targeted Public Distribution System
invited a lot of criticisms such as exclusion of a large number of deserving
households due to problems associated with identification, exclusion and
leakages and diversion of grains, etc. (Swaminathan, 2000; Dutta & Ramaswami,
2001; Jha & Ramaswami, 2010).
As regards fertiliser subsidies, they have played an important role in
promoting use of fertilisers and contributed to significant increases in yields
although their contribution to agricultural growth and poverty reduction has
declined steadily over time (Fan et. al., 2007). Fertiliser subsidies in India have
increased significantly during the last decade. In 2008-09 India spent nearly 60
per cent of total subsidies on fertilisers and fertiliser subsidy at Rs. 99494.7 crore
was more than 3.5 times the total public investment (Rs. 28035 crore at current
prices) in agriculture (Government of India, 2012).
Different studies have taken different data and their methodologies differ.
Most of these studies have done analysis by taking absolute values of macro-
variables, which are prone to produce higher standard errors of estimation. The
present study attempts to find the inter-relationship between the growth rates of
the selected variables.

62 MANTHAN: Journal of Commerce and Management
3.0 Data and Methodology
The study begins with examining the trend and growth rates of different
explicit subsidised products, viz. petroleum subsidies (PS), food subsidies (FS)
and chemical fertiliser subsidies (CS). It may be noted that data on petroleum
subsidies are available since 1992-93. The present study, therefore, has made use
of annual time series data for the period 1992-93 to 2012-13. Fiscal deficit data
have been collected from Handbook of Statistics on Indian Economy, Reserve
Bank of India; FS and CS data from Planning Commission and Ministries of
Chemicals & Fertilisers, and Agriculture, Government of India, and PS data are
collected from www.indiastat.com cross checked from Ministry of Petroleum and
Natural Gas web site
In order to measure the annual compound growth rate we have fitted
semi-log regression models for each category of subsidies on the trend variable
„t‟. The variables have been tested for stationarity by using ADF test and we have
estimated a multiple regression model to analyse the relationships among the
growth rates of the selected variables by fitting difference of the specified
variables.
4.0 Results and Discussion
As in many developing countries, use of agricultural subsidies is a highly
political and a very sensitive issue in India because it is linked to the food
security, livelihood and welfare issues of millions of small and marginal farmers.
The government continues to allocate a significant share of budget to agricultural
subsidies. The 2012-13 budgets allocated Rs. 190015 crore to subsidies food,
fertiliser, petroleum, credit, pulses, edible oils, etc., of which the first two
accounted for bulk of resources ( about 72 per cent). However, these subsidies
have been widely criticised as being inequitable, inefficient and leading to fiscal
burden.
4.1 Trends in food subsidy
Food subsidies increased from Rs. 2,850 crore in 1991-92 to about Rs.
72,823 crore in 2011-12 (Appendix Table 1), an increase of over 25 times in 21

Subsidies and Fiscal Deficit in Post Reforms India 63
years. Consequently, the share of food subsidies in total central government
subsidies increased from 23.3 per cent to 33.7 per cent between 1991-92 and
2011-12. As a percentage of agricultural GDP, the food subsidy increased from
1.8 per cent to 5.8 per cent during 1991-92 and 2010-11. However as percentage
of the overall GDP, it has doubled from 0.4 to 0.8 per cent from 1992 to 2012
(Figure 1). Food subsidy, which increased at an annual compound growth rate of
about 17.8 per cent during the 1990s, remained stable between 2002-03 and
2006-07 mainly due to low off-take of food grains and marginal increases in food
subsidy during the last 5-6 years. But it tripled from Rs. 24,014 crore in 2006-07
to Rs. 72, 823 crore in 2011-12 and crossed Rs. 75,000 crore in 2012-13.
4.2 Trends in fertiliser subsidy
Fertiliser subsidies in India have increased significantly during the last
decade. There has been a growing concern about steep increase in the subsidy
during the last few years. Several factors have contributed to higher fertiliser
subsidy bill but more important being steady increase in consumption, sharp
increase in prices of imported fertilisers, feedstock and intermediaries, and
unchanged farm gate prices of fertilisers for a long time. Between 2007 and 2008,
prices of all three major Fertilisers i.e. urea, di-ammonium phosphate (DAP) and
muriate of potash (MOP) increased manifold. In 2008-09, India spent nearly 60
per cent of total subsidies on fertilisers and fertiliser subsidy, at Rs. 99494.7
crore, was more than 3.5 times the total investment (Rs. 28035 crore at current
prices) in agriculture (Government of India, 2012).
The Prime minister‟s Economic Advisory Council (PMEAC) in its latest
Economic Outlook 2012/13 argued for “dismantling of fertiliser subsidy because
agricultural input subsidies are progressively losing their relevance, becoming an
unbearable fiscal burden and their role in contribution to productivity
enhancement is fast disappearing”. The share of fertiliser subsidy in total
subsidies varied from about 25 per cent in 2002-03 to about 59 per cent in 2008-
09. The fertiliser subsidy reached a peak of Rs. 99495 crore in 2008-09 and then
witnessed a declining trend. After two consecutive annual decreases in 2009-10
and 2010-11, fertiliser subsidy started increasing mainly due to rise in world
prices of fertilisers and fertiliser prices in 2011 averaged 43 per cent higher than

64 MANTHAN: Journal of Commerce and Management
2010 and are expected to rise in 2012 in response to high energy prices and
strong worldwide fertiliser demand driven by rising crop prices.
Figure 1: Subsidies as per cent of GDP
Note: FS - food subsidies; CS-chemical fertiliser subsidies; PS-petroleum subsidies.
Source: FS and CS data from Planning Commission and Ministries of Chemicals & Fertilisers,
and Agriculture, Govt. of India, and PS data from www.indiastat.com cross checked from
Ministry of Petroleum and Natural Gas web site
4.3 Trend of petroleum subsidy
The unprecedented steep rise in the domestic consumption and
international prices of the crude in recent years has led to an increase in the
explicit subsidy bill for petroleum products from Rs. 5,225 crore in 2002-03 to
Rs. 68,481 crore in 2011-12. Actually the rise has been steeper during 2008-12
(Figure 1).
Diesel, kerosene and LPG together constitute almost two-third of the total
petroleum consumption in the country. Since 2002 reforms, when the
Administered Price Mechanism (APM) has been dismantled for petrol, the
government has been providing a fixed per-unit subsidy to the selected petroleum
products, viz. LPG, Kerosene and Diesel. The total petroleum subsidy shows a
0
0.2
0.4
0.6
0.8
1
1.2
1.4
1.6
Sub
sid
ies
as p
erc
en
tage
of
GD
P
FS%GDP
CS%GDP
PS%GDP
Year

Subsidies and Fiscal Deficit in Post Reforms India 65
declining trend from 1999-00 to 2008-09. The increase since 2008-09 is due to
the galloping consumption of petroleum products and international oil price rise.
The trends of subsidies are almost similar when we see them as percent of GDP
and fiscal deficit separately.
4.4 Comparison of petroleum subsidy with food and fertiliser subsidies
Food and fertiliser subsidies are considered to be the other important
types of subsidies. In order to make a comparison, we have taken these subsidies
as percent of GDP and fiscal deficit, which are presented in Figures 1 and 2.
Except for petroleum subsidy, other two subsidies witnessed sharp rise as a
percentage of GDP during 2001-08. Petroleum subsidy increased exorbitantly
during 2008-11 before a fall in 2012-13. Although owing to certain reform
measures, petroleum and fertiliser subsidies have shown symptoms of fall, food
subsidy is expected to be on the rising trajectory. Considering the recent
enactment of the National Food Security Act, this is expected to rise further.
Figure 2: Subsidies as per cent of fiscal deficit
Source: Same as Figure 1.
0
5
10
15
20
25
30
Sub
sid
ies
as p
erc
en
tage
of
FD
PS as % FD
FS as % FD
CS as % FD
Year

66 MANTHAN: Journal of Commerce and Management
The annual compound growth rates of these three categories of subsidies are
stated in table 1.
Table 1. Regression results of semilog trends of PS, FS and CS:
Dependant
variable
( )
Intercept
(p-
value)
Slope
coefficient (β1)
(p-value)
Annual compound
growth rate (r)
Adj R2
(p-value
of F)
PS -63.8
(0.368)
0.0364
(0.306)
3.71 0.0054
(0.306)
FS -302.714
(0.00)
0.15607
(0.00)
16.89 0.97
(0.00)
CS -282.065
(0.00)
0.1457
(0.00)
15.68 0.8897
(0.00) Note: FS= food subsidy, CS= (chemical) fertiliser subsidy, and PS= petroleum subsidy n=21,
β=exponential growth rate stated in proportion.
The annual compound growth rate (r)= [antilog( ) -1]. This is multiplied by 100 to express in
per cent. Source: Authors‟ own calculation from subsidy data sources stated in Figure 1.
The study found that food subsidy has experienced the highest per cent of
annual compound growth rate followed by fertiliser subsidy. Both these have
grown above 15% on an average, which are statistically significant (please see
the p-values). The growth rate of petroleum subsidy has been the lowest and
insignificant in this category.
4.5 Nature and relationship of FD with Subsidies
The impact of petroleum subsidies, food subsidies and fertiliser subsides
on fiscal deficit is examined by a Linear multiple regression model. Before
analyzing the regression, we have examined the stationarity of the variables by
using ADF test. For this test, all the variables have been taken in level forms (not
in percentage form). The results are presented in Table 2.

Subsidies and Fiscal Deficit in Post Reforms India 67
Table 2. Augmented Dickey-Fuller (ADF) Test (Trend Lag=0)
Variable Level form First difference of variables
Test
Statistic
Mackinnon
Approximate p-Value
For Z(t)
Test
Statistics
Mackinnon
approximate p-
Value For Z(t)
PS -1.149 0.6950 -3.313 0.0143
FS 2.066 0.9988 -2.044 0.2676
FD 0.351 0.9796 -4.954 0.0000
CS -0.992 0.7562 -5.415 0.000
Source: Authors‟ calculation using STATA, n=21 for level form, n=20 for first difference, trend
lag=0, PS=Petroleum subsidy, FS= food Subsidy, CS=Chemical or fertiliser subsidy and
FD=fiscal deficit
ADF test is based on the null hypotheses that there is a unit root in the
time series processes. That means the time series are non-stationary. All the
Mackinnon approximate p-values of the variables are greater than 0.1, which
indicate that these are non-stationary at level form. However, all the variables,
except for fertiliser subsidy, are stationary if we take first order difference of the
original variables. FS is not significant at any level of significance. It is to be
noted that FS is stationary at less than 5 percent level of significance if we
include drift (p value=0.0284). Thus the null hypotheses of presence of unit roots
are rejected and the variables are stationary at the first difference form.
The extent of pair-wise correlation among the selected variables is presented
through the following correlation matrix (Table 3).
Table 3. Correlation Matrix
dFD dPS dFS dCS
dFD 1.000
dPS 0.2431 1.000
dFS 0.6443* 0.2868 1.000
dCS 0.4716* -0.0113 0.0945 1.000 Source:-Author‟s calculation using STATA,
* indicates significant at 5 percent level
68 MANTHAN: Journal of Commerce and Management
The study observes that as per expectation, there is positive relationship
between petroleum subsidies, food subsidies and fertiliser subsidies with fiscal
deficit and the correlation coefficients between subsidies and fiscal deficit are
significant except for petroleum subsidy.
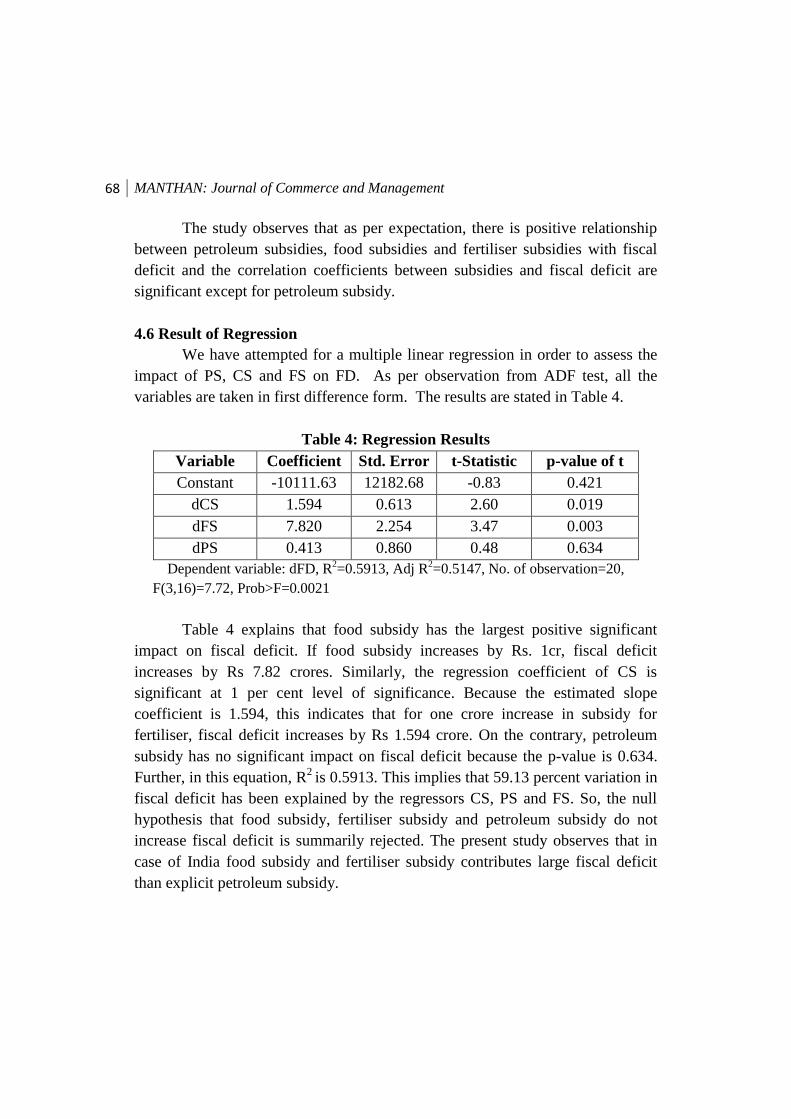
4.6 Result of Regression
We have attempted for a multiple linear regression in order to assess the
impact of PS, CS and FS on FD. As per observation from ADF test, all the
variables are taken in first difference form. The results are stated in Table 4.
Table 4: Regression Results
Variable Coefficient Std. Error t-Statistic p-value of t
Constant -10111.63 12182.68 -0.83 0.421
dCS 1.594 0.613 2.60 0.019
dFS 7.820 2.254 3.47 0.003
dPS 0.413 0.860 0.48 0.634
Dependent variable: dFD, R2=0.5913, Adj R
2=0.5147, No. of observation=20,
F(3,16)=7.72, Prob>F=0.0021
Table 4 explains that food subsidy has the largest positive significant
impact on fiscal deficit. If food subsidy increases by Rs. 1cr, fiscal deficit
increases by Rs 7.82 crores. Similarly, the regression coefficient of CS is
significant at 1 per cent level of significance. Because the estimated slope
coefficient is 1.594, this indicates that for one crore increase in subsidy for
fertiliser, fiscal deficit increases by Rs 1.594 crore. On the contrary, petroleum
subsidy has no significant impact on fiscal deficit because the p-value is 0.634.
Further, in this equation, R2
is 0.5913. This implies that 59.13 percent variation in
fiscal deficit has been explained by the regressors CS, PS and FS. So, the null
hypothesis that food subsidy, fertiliser subsidy and petroleum subsidy do not
increase fiscal deficit is summarily rejected. The present study observes that in
case of India food subsidy and fertiliser subsidy contributes large fiscal deficit
than explicit petroleum subsidy.

Subsidies and Fiscal Deficit in Post Reforms India 69
4.7 A note on under-recoveries
The discussion may be conceived as half true if we do not mention a
few lines on under-recoveries of Oil Marketing Companies (OMCs). The issue
of under-recoveries was examined in detail by the Committee on Pricing and
Taxation of Petroleum Products (Rangarajan 2006). According to this report,
the difference between the cost price and realized price represents the under-
recoveries of the OMC. In fact the fiscal subsidies are very small when
compared with these under recoveries. A large part of these under-recoveries is
compensated for by additional cash assistance from the Government (over and
above the fiscal subsidy), while another portion is covered by financial
assistance from upstream National Oil Companies (NOCs), which are engaged
in exploration and production of oil and gas. The remaining portion remains
uncompensated to the OMCs.
This is noteworthy here that there has been a significant debate in India
over the appropriateness of „under-recoveries‟ as a category for measuring the
burden of current pricing policy on OMCs. In order to lessen the burden of
under-recoveries, the central Government has developed the Equitable Burden
Sharing Mechanism (EBSM). Under this, it was agreed that India‟s upstream
public oil companies like Oil and Natural Gas Corporation (ONGC), Oil India
Limited (OIL) would shoulder one third of the burden of under-recoveries. The
present study has taken explicit petroleum subsidy without reflecting on under-
recoveries of OMCs
5.0 Summary and conclusions
The study observes that in post-reforms period food and fertiliser
subsidies have grown at a sharper rate than petroleum subsidies. The petroleum
subsidy has been fluctuating since 1992, albeit there was near stability during
2004-08 after that it increased. Further to add that petroleum subsidy has not
actually increased as fast as food and fertiliser subsidies. From a closer look of
the trends of all these three major subsidies, it may be concluded that the rise in
petroleum subsidy has been the smallest, whereas food and fertiliser subsidies
have grown in double digits on an average. The regression results also confirm
that food and fertiliser subsidies have positive and significant impact on fiscal

70 MANTHAN: Journal of Commerce and Management
deficit. The analysis of petroleum subsidies is more complicated. If we see only
the explicit subsidies for petroleum products, then their rise is not significant over
the post-reforms period, except for 2008-12. However, unless we see the under-
recovery component, it would be a lopsided conclusion to state anything about
trend in petroleum subsidies and their impact. The study calls for a National
Policy on Subsidies.
References
Anand, Rahul, Coady, David, Mohammad, Adil, Thakoor, Vimal & Walsh,
James P. (2013). The fiscal and welfare impacts. International Monetary Fund
(IMF), working paper, WP/13/128. May
Arze, Del Granado, Coady, J., D. & Gillingham, R. (2012). The unequal benefits
of fuel subsidies: A review of evidence for developing countries. World
Development, 40(11): 2234-48.
Bhattacharya, B.B. & Batra, A. (2009). Fuel pricing policy reform in India:
Implications and way forward”. Economic and Political Weekly. XLIV(29), 77-
86, July.
Coady, D., Gillingham, R., Ossowski, R., Piotrowski, J., Tareq, S. and Tyson, J.
(2010). Petroleum product subsidies: Costly, inequitable, and rising, IMF Staff
Position Note, SPN/10/0. IMF, Washington, DC. Retail price data retrieved April
12th, 2012. from www.imf.org/external/pubs/ft/spn/2010/data/spn1005.csv
Dutta B., & Ramaswami, B. (2001). Targeting and efficiency in the public
distribution system: Case of Andhra Pradesh and Maharashtra. Economic and
Political Weekly. May 5, 1524–32.
Fan, S., Gulati, A. & Thorat, S. (2007). Investment, subsidies, and pro-poor
growth in rural India”. IFPRI Discussion Paper 716. International Food Policy
Research Institute, Washington, D.C.

Subsidies and Fiscal Deficit in Post Reforms India 71
GoI (2012). Union Budget – Various Issues from 2002-03 to 2012-13. Ministry of
Finance, Government of India, New Delhi.
International Institute for Sustainable Development (2012). India‟s Fuel
Subsidies: Q & A.. Global Subsidies Initiative. IISD. Canada.
International Institute for Sustainable Development (2012a). Fossil-fuel subsidy
reform in India: Cash transfers for PDS kerosene and domestic LPG. Global
Subsidies Initiative. IISD Canada.
Jha, Shikha & Ramaswami, B. (2010). How can food subsidies work better?
Answers from India and the Philippines. ADB Economics Working Paper series
No 221, Asian Development Bank, Manila, Philippines.
Mane, Rahul Prahlad (2006). Targeting the poor or poor targeting: A case for
strengthening the Public Distribution System in India. Journal of Asian and
African Studies, 41(4): 299-317.
Ministry of Petroleum and Natural Gas. (2012). Indian Petroleum and Natural
Gas Statistics, 2010–11. New Delhi. Economic Division. Ministry of Petroleum
and Natural Gas, Government of India.
Petroleum Planning and Analysis Cell (2011). Fiscal Subsidy on PDS Kerosene
and Domestic LPG. New Delhi: Government of India. May 3. Retrieved from
http://ppac.org.in.
PMEAC (2012). Economic Outlook 2012/13. Economic Advisory Council to the
Prime Minister, New Delhi, August 2012.
Sharma, Vijay Paul (2012). Food subsidy in India: Trends, causes and policy
reform options. Working Paper 2012-08-02. IIM, Ahmedabad.
Swaminathan, M (2000). Consumer food subsidies in India: Proposals for
reform”, Journal of Peasant Studies, 27 (3): 92-114.

72 MANTHAN: Journal of Commerce and Management
Appendix Table 1. GDP, Subsidies and Fiscal Deficit (Rs. crore)
Year
GDP
Fertiliser
subsidy
Food
subsidy
Petroleum
subsidy
Fiscal
Deficit
1992-93 703723 5796 2800 5686 40173
1993-94 817961 4562 5537 6596 60257
1994-95 955385 5796 5100 6560 57703
1995-96 1118586 6735 5377 9360 60243
1996-97 1301788 7578 6066 18000 66733
1997-98 1447613 9918 7900 7480 88937
1998-99 1668739 11596 9100 8370 113348
1999-00 1847273 13244 9434 17714 104716
2000-01 1991982 9492 12010 23091 118816
2001-02 2167745 8092 17494 11140 140955
2002-03 2338200 7790 24176 5225 145072
2003-04 2622216 8521 25181 6292 123273
2004-05 2971464 10737 25798 2956 125794
2005-06 3390503 11774 23077 2683 146435
2006-07 3953276 26222 24014 2699 142573
2007-08 4582086 32490 31328 2820 126912
2008-09 5303567 76603 43751 2852 336992
2009-10 6108900 61264 58443 14951 418482
2010-11 7267000 65836 63844 38371 373592
2011-12 8353500 73790 72823 68481 515990
2012-13 9461013 65592 75000 43580 520925 Source: Fiscal deficit data from Handbook of Statistics on Indian Economy, Reserve Bank of
India; FS and CS data from Planning Commission and Ministries of Chemicals & Fertilisers, and
Agriculture, Govt. of India, and PS data from www.indiastat.com cross checked from Ministry of
Petroleum and Natural Gas web site

Subsidies and Fiscal Deficit in Post Reforms India 73
Appendix Table 2. Subsidies as per cent of GDP and Fiscal Deficit
Year FS as %
of GDP
CS as % of
GDP
PS as % of
GDP
PS as %
OF FD
FS as %
FD
CS as %
FD
1992-93 0.397 0.823 0.807 14.153 6.9698 14.427
1993-94 0.676 0.557 0.806 10.946 9.1889 7.571
1994-95 0.533 0.606 0.686 11.368 8.838 10.044
1995-96 0.480 0.602 0.836 15.537 8.925 11.1797
1996-97 0.465 0.582 1.382 26.970 9.089 11.355
1997-98 0.545 0.685 0.516 8.410 8.882 11.151
1998-99 0.545 0.694 0.501 7.384 8.028 10.230
1999-00 0.510 0.716 0.958 16.916 9.009 12.647
2000-01 0.602 0.476 1.159 19.434 10.108 7.988
2001-02 0.807 0.373 0.513 7.903 12.411 5.740
2002-03 1.033 0.333 0.223 3.601 16.664 5.369
2003-04 0.960 0.324 0.239 5.104 20.427 6.9123
2004-05 0.868 0.361 0.099 2.349 20.508 8.535
2005-06 0.680 0.347 0.079 1.832 15.759 8.0404
2006-07 0.607 0.663 0.068 1.893 16.843 18.391
2007-08 0.683 0.709 0.061 2.222 24.684 25.600
2008-09 0.824 1.444 0.053 0.846 12.982 22.731
2009-10 0.956 1.002 0.244 3.572 13.965 14.639
2010-11 0.878 0.905 0.528 10.270 17.089 17.622
2011-12 0.871 0.883 0.819 13.271 14.113 14.300
2012-13 0.792 0.693 0.460 8.365 14.397 12.591
Source: Same as Appendix Table 1