The Immune Microenvironment of Chordomas - MDPI
20
cancers Article The Immune Microenvironment of Chordomas: An Immunohistochemical Analysis Maroa Dridi 1 , Lila Krebs-Drouot 2 , David Meyronet 3,4,5 , Jean Marc Dumollard 1 , François Vassal 6 , Emmanuel Jouanneau 5,7,8 , Timothée Jacquesson 7,9 ,Cédric Barrey 5,10 , Sylvain Grange 11 , Jean Boutonnat 2 , Michel Péoc’h 1 and Georgia Karpathiou 1, * Citation: Dridi, M.; Krebs-Drouot, L.; Meyronet, D.; Dumollard, J.M.; Vassal, F.; Jouanneau, E.; Jacquesson, T.; Barrey, C.; Grange, S.; Boutonnat, J.; et al. The Immune Microenvironment of Chordomas: An Immunohistochemical Analysis. Cancers 2021, 13, 3335. https:// doi.org/10.3390/cancers13133335 Academic Editor: Claire Pecqueur Received: 1 May 2021 Accepted: 25 June 2021 Published: 2 July 2021 Publisher’s Note: MDPI stays neutral with regard to jurisdictional claims in published maps and institutional affil- iations. Copyright: © 2021 by the authors. Licensee MDPI, Basel, Switzerland. This article is an open access article distributed under the terms and conditions of the Creative Commons Attribution (CC BY) license (https:// creativecommons.org/licenses/by/ 4.0/). 1 Pathology Department, University Hospital of Saint-Etienne, 42055 Saint-Etienne, France; [email protected] (M.D.); [email protected] (J.M.D.); [email protected] (M.P.) 2 Pathology Department, University Hospital of Grenoble, 38700 Grenoble, France; [email protected] (L.K.-D.); [email protected] (J.B.) 3 East Pathology Institute, Hospices Civils de Lyon, 69677 Lyon, France; [email protected] 4 Cancer Cell Plasticity Department, Cancer Research Center of Lyon, 69373 Lyon, France 5 Claude Bernard University, Lyon 1, 69100 Lyon, France; [email protected] (E.J.); [email protected] (C.B.) 6 Neurosurgery Department, University Hospital of Saint-Etienne, 42055 Saint-Etienne, France; [email protected] 7 Department of Neurosurgery B, Neurological Hospital Pierre Wertheimer, 69500 Lyon, France; [email protected] 8 Inserm U1052, CNRS UMR5286, «Signaling, Metabolism and Tumor Progression» The Cancer Research Center of Lyon, 69373 Lyon, France 9 Department of Anatomy, Faculté de Médecine Lyon-Est, Université de Lyon, Université Claude Bernard Lyon 1, 69100 Lyon, France 10 Department of Spine and Spinal Cord Surgery, Neurological Hospital Pierre Wertheimer, 69500 Lyon, France 11 Radiology Department, University Hospital of Saint-Etienne, 42055 Saint-Etienne, France; [email protected] * Correspondence: [email protected] Simple Summary: Chordoma patients may be amenable to immunotherapy; however, the immune microenvironment of chordomas needs further investigation. We performed the immunohistochem- ical analysis of a chordoma series, showing that these tumors have a unique microenvironment characterized by the absence of PD-L1 tumor cell expression, but feature PD-L1+ immune cells playing a negative prognostic role. Abstract: Chordomas are rare sarcomas that are usually treated by surgery and/or radiotherapy since these are chemo-resistant tumors, but immunotherapy could be a possible option for chor- doma patients. However, few reports investigating the composition of the chordoma immune microenvironment exist. We immunohistochemically studied 81 chordomas regarding their immune microenvironment factors and compared them with clinicopathological data. Macrophages and CD4 cells were the most prominent inflammatory cell populations, followed by CD8 T cells, while CD20 B cells and high endothelial venules (MECA-79+) were less frequently found. PD-L1 (22C3) expression by inflammatory cells was found in 21 (26%) tumors and was associated with a larger tumor size. None of the cases showed the expression of PD-L1 by tumor cells. Survival analysis showed that younger patients had a better overall survival. Considering the immunohistochemical factors studied, higher CD8, the presence of PD-L1+ immune cells, and higher vascular density were adverse prognostic factors, but in multivariate analysis, only PD-L1+ immune cells retained prognostic significance. To conclude, chordoma tumor cells do not express PD-L1, but PD-L1+ immune cells seem to play a negative prognostic role, supporting the need for further studies in this field and the possible beneficial role of immunotherapy in these patients. Cancers 2021, 13, 3335. https://doi.org/10.3390/cancers13133335 https://www.mdpi.com/journal/cancers
-
Upload
khangminh22 -
Category
Documents
-
view
2 -
download
0
Transcript of The Immune Microenvironment of Chordomas - MDPI
cancers
Article
The Immune Microenvironment of Chordomas:An Immunohistochemical Analysis
Maroa Dridi 1, Lila Krebs-Drouot 2, David Meyronet 3,4,5, Jean Marc Dumollard 1, François Vassal 6,Emmanuel Jouanneau 5,7,8, Timothée Jacquesson 7,9 , Cédric Barrey 5,10, Sylvain Grange 11,Jean Boutonnat 2 , Michel Péoc’h 1 and Georgia Karpathiou 1,*
�����������������
Citation: Dridi, M.; Krebs-Drouot, L.;
Meyronet, D.; Dumollard, J.M.;
Vassal, F.; Jouanneau, E.; Jacquesson,
T.; Barrey, C.; Grange, S.; Boutonnat,
J.; et al. The Immune
Microenvironment of Chordomas: An
Immunohistochemical Analysis.
Cancers 2021, 13, 3335. https://
doi.org/10.3390/cancers13133335
Academic Editor: Claire Pecqueur
Received: 1 May 2021
Accepted: 25 June 2021
Published: 2 July 2021
Publisher’s Note: MDPI stays neutral
with regard to jurisdictional claims in
published maps and institutional affil-
iations.
Copyright: © 2021 by the authors.
Licensee MDPI, Basel, Switzerland.
This article is an open access article
distributed under the terms and
conditions of the Creative Commons
Attribution (CC BY) license (https://
creativecommons.org/licenses/by/
4.0/).
1 Pathology Department, University Hospital of Saint-Etienne, 42055 Saint-Etienne, France;[email protected] (M.D.); [email protected] (J.M.D.);[email protected] (M.P.)
2 Pathology Department, University Hospital of Grenoble, 38700 Grenoble, France;[email protected] (L.K.-D.); [email protected] (J.B.)
3 East Pathology Institute, Hospices Civils de Lyon, 69677 Lyon, France; [email protected] Cancer Cell Plasticity Department, Cancer Research Center of Lyon, 69373 Lyon, France5 Claude Bernard University, Lyon 1, 69100 Lyon, France; [email protected] (E.J.);
[email protected] (C.B.)6 Neurosurgery Department, University Hospital of Saint-Etienne, 42055 Saint-Etienne, France;
[email protected] Department of Neurosurgery B, Neurological Hospital Pierre Wertheimer, 69500 Lyon, France;
[email protected] Inserm U1052, CNRS UMR5286, «Signaling, Metabolism and Tumor Progression» The Cancer Research
Center of Lyon, 69373 Lyon, France9 Department of Anatomy, Faculté de Médecine Lyon-Est, Université de Lyon, Université Claude Bernard Lyon
1, 69100 Lyon, France10 Department of Spine and Spinal Cord Surgery, Neurological Hospital Pierre Wertheimer, 69500 Lyon, France11 Radiology Department, University Hospital of Saint-Etienne, 42055 Saint-Etienne, France;
[email protected]* Correspondence: [email protected]
Simple Summary: Chordoma patients may be amenable to immunotherapy; however, the immunemicroenvironment of chordomas needs further investigation. We performed the immunohistochem-ical analysis of a chordoma series, showing that these tumors have a unique microenvironmentcharacterized by the absence of PD-L1 tumor cell expression, but feature PD-L1+ immune cellsplaying a negative prognostic role.
Abstract: Chordomas are rare sarcomas that are usually treated by surgery and/or radiotherapysince these are chemo-resistant tumors, but immunotherapy could be a possible option for chor-doma patients. However, few reports investigating the composition of the chordoma immunemicroenvironment exist. We immunohistochemically studied 81 chordomas regarding their immunemicroenvironment factors and compared them with clinicopathological data. Macrophages andCD4 cells were the most prominent inflammatory cell populations, followed by CD8 T cells, whileCD20 B cells and high endothelial venules (MECA-79+) were less frequently found. PD-L1 (22C3)expression by inflammatory cells was found in 21 (26%) tumors and was associated with a largertumor size. None of the cases showed the expression of PD-L1 by tumor cells. Survival analysisshowed that younger patients had a better overall survival. Considering the immunohistochemicalfactors studied, higher CD8, the presence of PD-L1+ immune cells, and higher vascular densitywere adverse prognostic factors, but in multivariate analysis, only PD-L1+ immune cells retainedprognostic significance. To conclude, chordoma tumor cells do not express PD-L1, but PD-L1+immune cells seem to play a negative prognostic role, supporting the need for further studies in thisfield and the possible beneficial role of immunotherapy in these patients.
Cancers 2021, 13, 3335. https://doi.org/10.3390/cancers13133335 https://www.mdpi.com/journal/cancers
Cancers 2021, 13, 3335 2 of 20
Keywords: PD-L1; CD8; CD4; CD20; macrophages; MECA-79; vascular density; immunohistochem-istry; prognosis
1. Introduction
The tumor immune microenvironment has become a major subject of recent literature,revealing important pathophysiological pathways in various tumors [1,2]. Treatmentsintervening in the tumor microenvironment with the aim to boost the cytotoxic effects ofpatients’ immune responses have gained great interest after showing efficacy in numerousmalignancies [3]. Fewer data exist regarding the details of the immune microenviron-ment of sarcomas [4]. Sarcomas are generally considered immune-quiescent tumors sincethey have a low mutational burden, but recent data suggest that some sarcomas are im-munogenic [4]. Chordomas are rare sarcomas that usually affect the axial skeleton—theskull base, the sacrum, and the spine—and are believed to be derived from notochordalremnants [5]. Surgical resection and radiotherapy are cornerstone treatments in this areasince these are chemo-resistant tumors [5]. However, immunotherapy could be a possibleoption for chordoma patients, as for patients with other types of sarcomas [6], with somepromising results being shown in the rare cases reported [7]. Currently, a phase I trialof nivolumab with or without stereotactic radiosurgery in chordoma patients is takingplace (ClinicalTrials.gov Identifier: NCT02989636). However, few reports investigating thecomposition of the chordoma immune microenvironment exist.
To the best of our knowledge, one of the first reports on the interaction betweenchordomas and the host immune system was conducted in chordoma cell lines and chor-doma tissues from 10 patients, showing PD-L1 and PD-1 expression in some immune cellsof the chordoma tissues but no PD-L1 expression in tumor cells [8]. Another study onchordoma cell lines and tumor microarrays published almost at the same time showedPD-L1 expression in more than 90% of the cases studied [9]. The same study evaluatedthe presence of immune cells on morphological grounds and found a statistical trend oftumors being highly infiltrated by immune cells and showing a worse prognosis. Later, animmunohistochemical and immunofluorescence study of 54 chordoma samples for PD-1,PD-L1, CD3, CD8, CD4, CD20, and FOXP3 expression showed PD-L1 tumor cell expressionin almost 70% of the cases and suggested that the higher infiltration of CD3, CD8, and CD4T cells is a positive prognostic factor [10–14].
Thus, given the rarity of these tumors and the limited and often contradictory resultsin the literature, we aimed to investigate a chordoma series for the expression of immunemicroenvironment factors and compare it with the clinicopathological characteristics.
2. Materials and Methods
In this multicenter retrospective cohort study, we included 91 patients with a histolog-ically confirmed chordoma diagnosis between 1998 and 2020. The Local Ethics Committeeapproved the study (IRBN702020/CHUSTE). Diagnosis was based on clinicoradiologicaldata, typical morphological features, and S100/cytokeratin expression, and it was centrallyreviewed by a specialized soft-tissue pathologist (Michel Péoc’h).
Only conventional chordomas, and not dedifferentiated or poorly differentiated sub-types, were included for homogeneity reasons. Follow-up data were available for 85 pa-tients, and tissue was not sufficient for another 4 patients; thus, tissues from 81 patientswere further studied by immunohistochemistry. The age of the archival tissue and itsdecalcification were recorded to assure quality issues.
Whole-tumor sections were studied by immunohistochemistry for PD-L1 (22C3, DakoAgilent, Santa Clara, CA, USA 1/40), CD8 (C8/144B, Dako Agilent, Santa Clara, CA,USA 1/100), CD4 (SP35, Abcam, Cambridge, UK 1/50), CD20 (L26, Dako Agilent, SantaClara, CA, USA 1/200), CD163 (10D6, Novocastra, Newcastle upon Tyne, UK 1/200),CD34 (QBEnd10, Dako Agilent, Santa Clara, CA, USA 1/800), and MECA-79 (MECA-79,
Cancers 2021, 13, 3335 3 of 20
Santa Cruz Biotechnology, Dallas, TX, USA, 1/750) (a high endothelial venule markerassociated with tertiary lymphoid structures [4]) expression. It was performed in one of ourdepartments using an automated staining system (OMNIS, Dako-Agilent, Santa Clara, CA,USA) and the EnVision FLEX kit (OMNIS, Dako, Denmark) according to the manufacturer’sprotocol. Positive immunoreactions were visualized using 3,3′-diaminobenzidine as thechromogenic substrate and HRP magenta (Dako, Agilent) as the second chromogen fordouble immunostains (PD-L1 with CD8 and PD-L1 with CD163).
Immunohistochemical evaluation for CD8, CD4, CD20, CD163, and PD-L1 expressionby immune cells was performed, as previously described, in a semiquantitative manner: 0,no cells; 1, few cells (<10%); 2, a moderate number of positive cells (≥10% and <40%); and3, abundant cells (≥40%). A binary system of low (scores 0 and 1) and high (scores 2 and3) scores for CD8, CD4, CD20, and CD163 was used for further statistical analysis [3,11],while a system of absent (score 0) or present (score 1–3) was used for PD-L1+ immunecells. Immune cells were predominantly found in the peritumoral compartment, andassessment was performed for this immune cell compartment. The quantification of thenumber of CD34+ and MECA-79+ blood vessels (mean vessel density, hereafter calledvascular density) was performed on 5 high-power 20× (1 mm2) fields per section that werecounted and averaged, as previously proposed [15]. They were further classified into twogroups using the median as the cut off value.
Data were analyzed using the StatView software version 5 (Abacus Concepts, Berkley,CA, USA). We used the χ2 test (confirmed by Fisher’s exact test) to explore any relation-ship between two groups for categorical data. Survival probability was estimated byKaplan–Meier analysis with log-rank product limit estimation. For all analyses, statisticalsignificance was indicated at a p value of <0.05.
3. Results
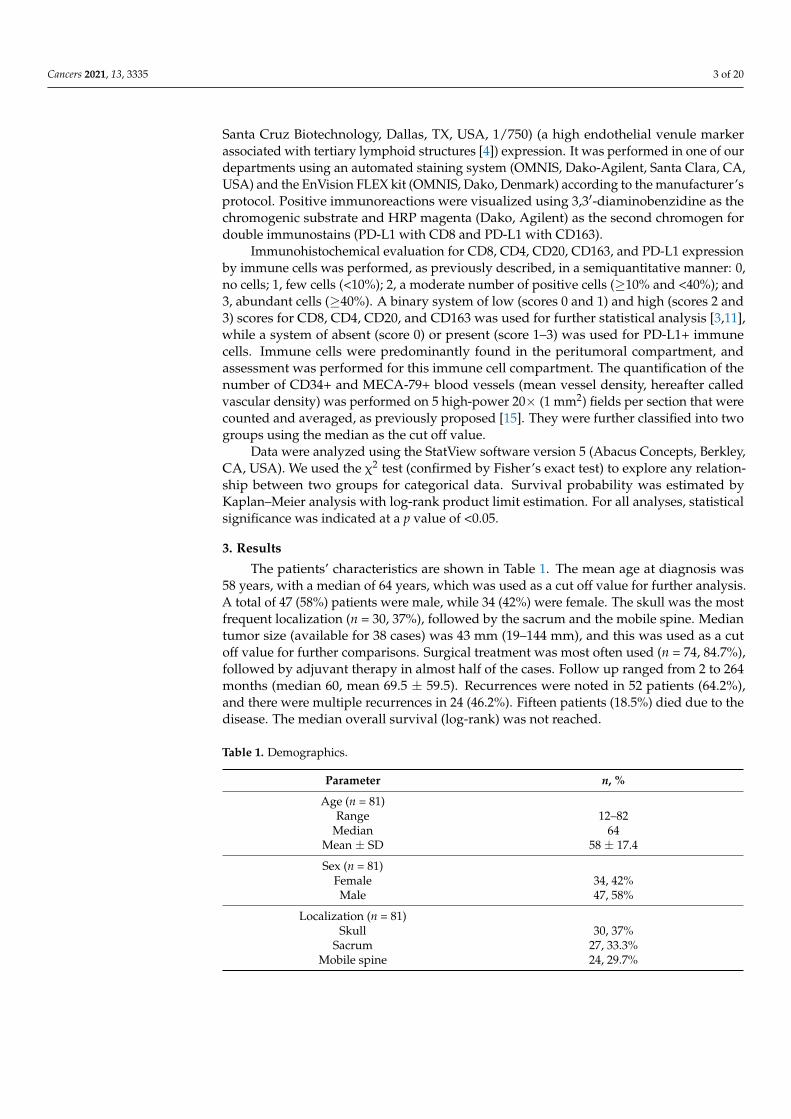
The patients’ characteristics are shown in Table 1. The mean age at diagnosis was58 years, with a median of 64 years, which was used as a cut off value for further analysis.A total of 47 (58%) patients were male, while 34 (42%) were female. The skull was the mostfrequent localization (n = 30, 37%), followed by the sacrum and the mobile spine. Mediantumor size (available for 38 cases) was 43 mm (19–144 mm), and this was used as a cutoff value for further comparisons. Surgical treatment was most often used (n = 74, 84.7%),followed by adjuvant therapy in almost half of the cases. Follow up ranged from 2 to 264months (median 60, mean 69.5 ± 59.5). Recurrences were noted in 52 patients (64.2%),and there were multiple recurrences in 24 (46.2%). Fifteen patients (18.5%) died due to thedisease. The median overall survival (log-rank) was not reached.
Table 1. Demographics.
Parameter n, %
Age (n = 81)Range 12–82
Median 64Mean ± SD 58 ± 17.4
Sex (n = 81)Female 34, 42%Male 47, 58%
Localization (n = 81)Skull 30, 37%
Sacrum 27, 33.3%Mobile spine 24, 29.7%
Cancers 2021, 13, 3335 4 of 20
Table 1. Cont.
Parameter n, %
Recurrence (n = 81)Yes 52, 64.2%No 29, 35.8%
Multiple recurrences (n = 80)Yes 24, 30%No 56, 70%
Tumor size (in mm **)Range 19–144
Median 43Mean ± SD 50.6 ± 27.5
Principal treatment at diagnosis (n = 85)Surgical 72, 84.7%
Radiotherapy 10, 11.8%Palliative 3, 3.5%
Adjuvant therapy (n = 40)Radiotherapy 36, 90%
Surgical 3, 7.5%immunotherapy 1, 2.5%
Follow-up (n = 81)Range 2–264
Median 60Mean ± SD 69.5 ± 59.5
Patient status (n = 81)Alive 66, 81.5%
Dead * 15, 18.5%
Overall survival (n = 81)Range 2–264
Median (log-rank) Not reached* = only disease-associated deaths. n denotes the number of cases with available data. ** = size was available foronly 38 cases, while tumor volume was not available.
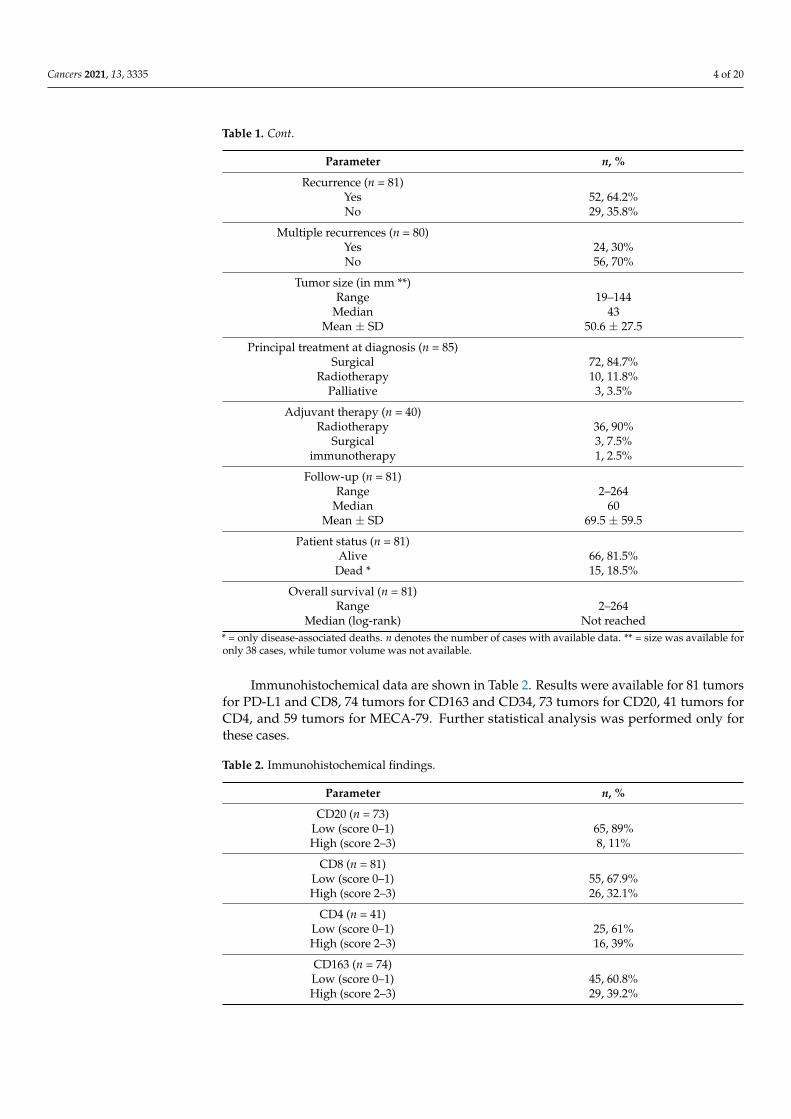
Immunohistochemical data are shown in Table 2. Results were available for 81 tumorsfor PD-L1 and CD8, 74 tumors for CD163 and CD34, 73 tumors for CD20, 41 tumors forCD4, and 59 tumors for MECA-79. Further statistical analysis was performed only forthese cases.
Table 2. Immunohistochemical findings.
Parameter n, %
CD20 (n = 73)Low (score 0–1) 65, 89%High (score 2–3) 8, 11%
CD8 (n = 81)Low (score 0–1) 55, 67.9%High (score 2–3) 26, 32.1%
CD4 (n = 41)Low (score 0–1) 25, 61%High (score 2–3) 16, 39%
CD163 (n = 74)Low (score 0–1) 45, 60.8%High (score 2–3) 29, 39.2%
Cancers 2021, 13, 3335 5 of 20
Table 2. Cont.
Parameter n, %
PD-L1 inflammatory cells (n = 81)No (score 0) 60, 74%
Yes (score 1–3) 21, 26%
CD34 vascular density (n = 74)Range 1–22
Median (High and Low, n,%) 3.5 (37, 50% and 37, 50%)Mean ± SD 5.8 ± 5.7
MECA-79 vessels (n = 59)High 5, 8.5%Low 54, 91.5%
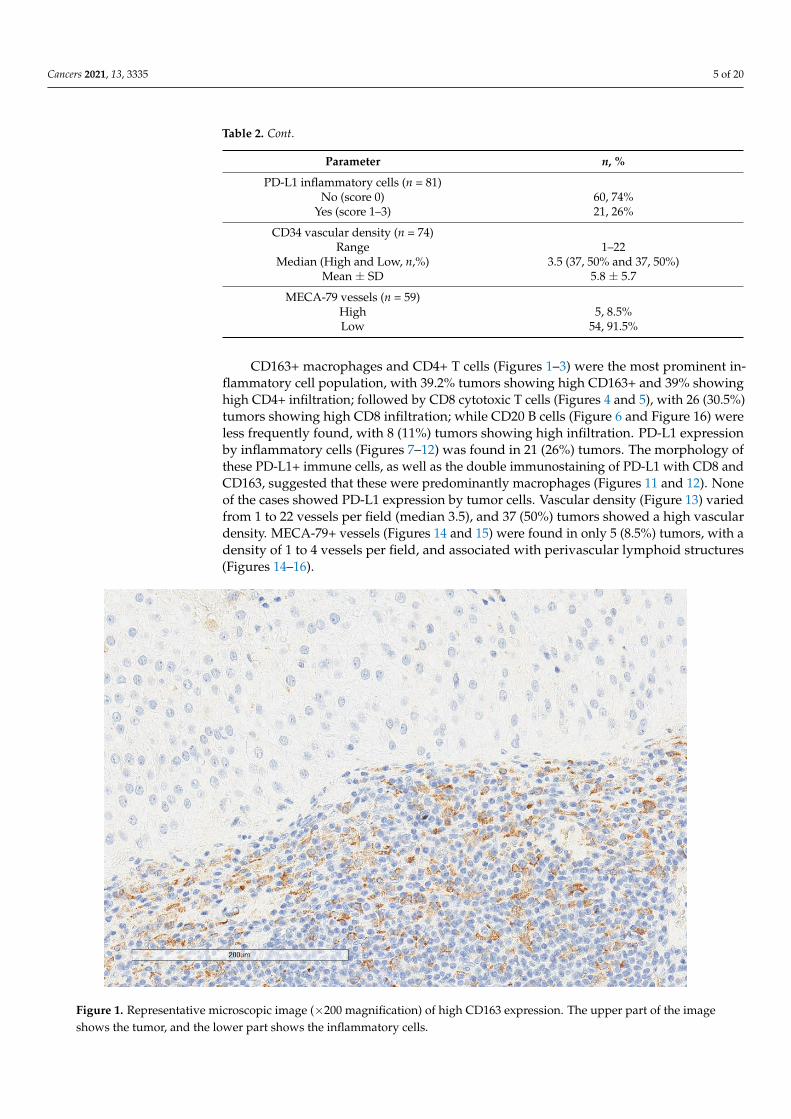
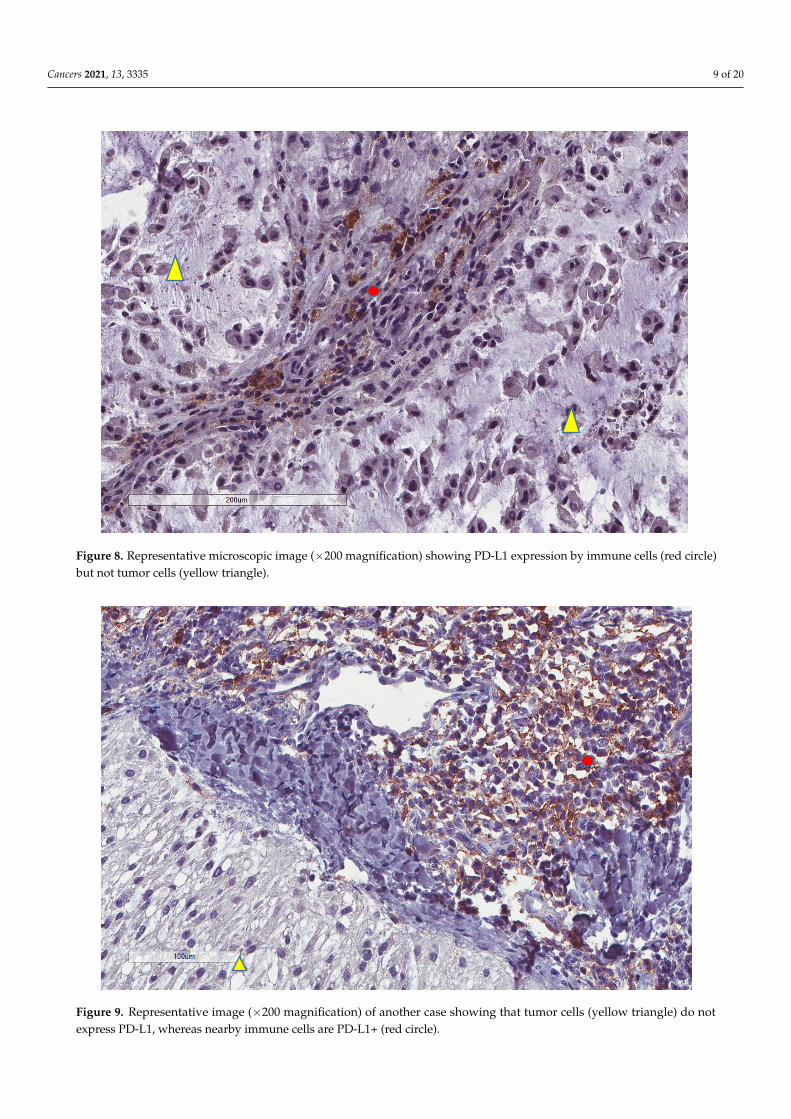
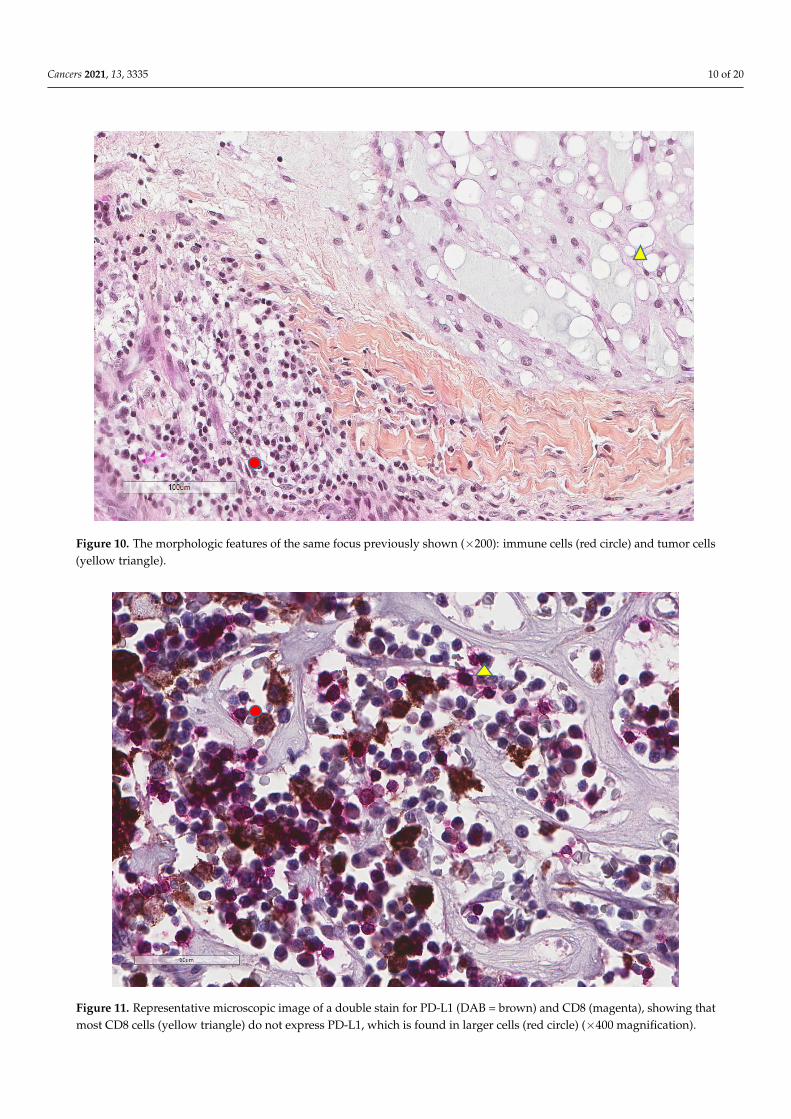
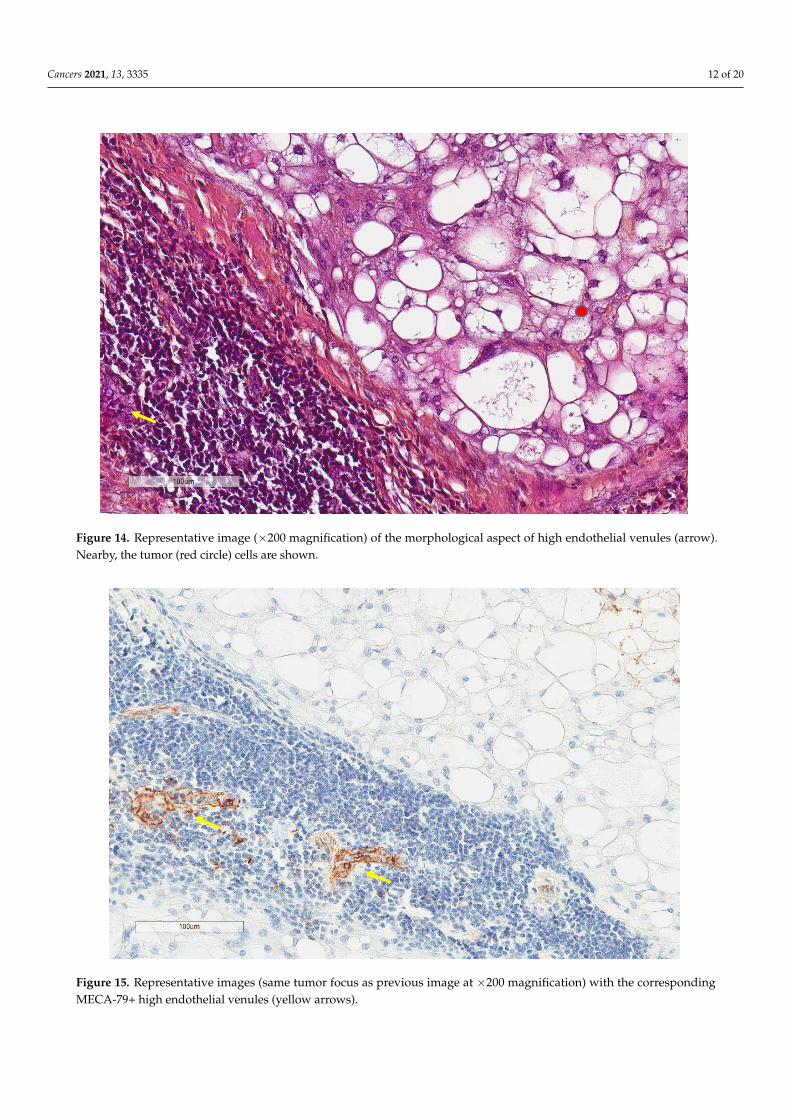
CD163+ macrophages and CD4+ T cells (Figures 1–3) were the most prominent in-flammatory cell population, with 39.2% tumors showing high CD163+ and 39% showinghigh CD4+ infiltration; followed by CD8 cytotoxic T cells (Figures 4 and 5), with 26 (30.5%)tumors showing high CD8 infiltration; while CD20 B cells (Figure 6 and Figure 16) wereless frequently found, with 8 (11%) tumors showing high infiltration. PD-L1 expressionby inflammatory cells (Figures 7–12) was found in 21 (26%) tumors. The morphology ofthese PD-L1+ immune cells, as well as the double immunostaining of PD-L1 with CD8 andCD163, suggested that these were predominantly macrophages (Figures 11 and 12). Noneof the cases showed PD-L1 expression by tumor cells. Vascular density (Figure 13) variedfrom 1 to 22 vessels per field (median 3.5), and 37 (50%) tumors showed a high vasculardensity. MECA-79+ vessels (Figures 14 and 15) were found in only 5 (8.5%) tumors, with adensity of 1 to 4 vessels per field, and associated with perivascular lymphoid structures(Figures 14–16).
Cancers 2021, 13, x FOR PEER REVIEW 6 of 21
Figure 1. Representative microscopic image (×200 magnification) of high CD163 expression. The upper part of the image
shows the tumor, and the lower part shows the inflammatory cells.
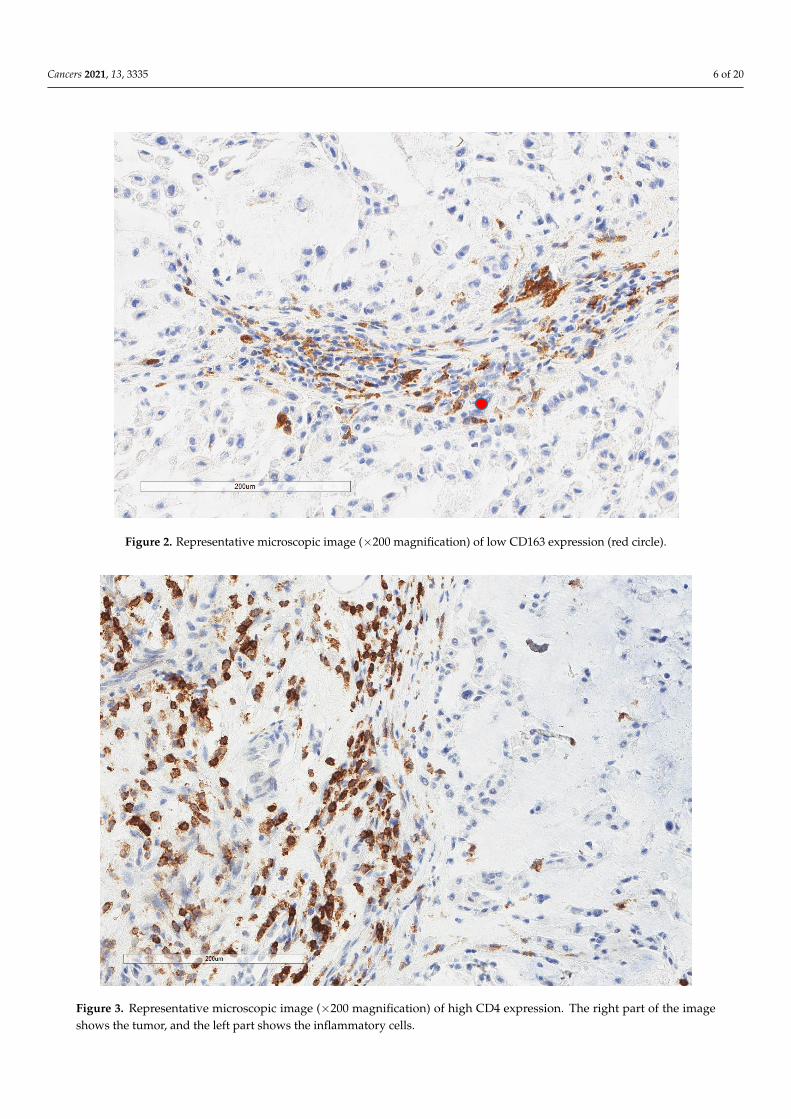
Figure 2. Representative microscopic image (×200 magnification) of low CD163 expression (red circle).
Figure 1. Representative microscopic image (×200 magnification) of high CD163 expression. The upper part of the imageshows the tumor, and the lower part shows the inflammatory cells.
Cancers 2021, 13, 3335 6 of 20
Cancers 2021, 13, x FOR PEER REVIEW 6 of 21
Figure 1. Representative microscopic image (×200 magnification) of high CD163 expression. The upper part of the image
shows the tumor, and the lower part shows the inflammatory cells.
Figure 2. Representative microscopic image (×200 magnification) of low CD163 expression (red circle). Figure 2. Representative microscopic image (×200 magnification) of low CD163 expression (red circle).Cancers 2021, 13, x FOR PEER REVIEW 7 of 21
Figure 3. Representative microscopic image (×200 magnification) of high CD4 expression. The right part of the image
shows the tumor, and the left part shows the inflammatory cells.
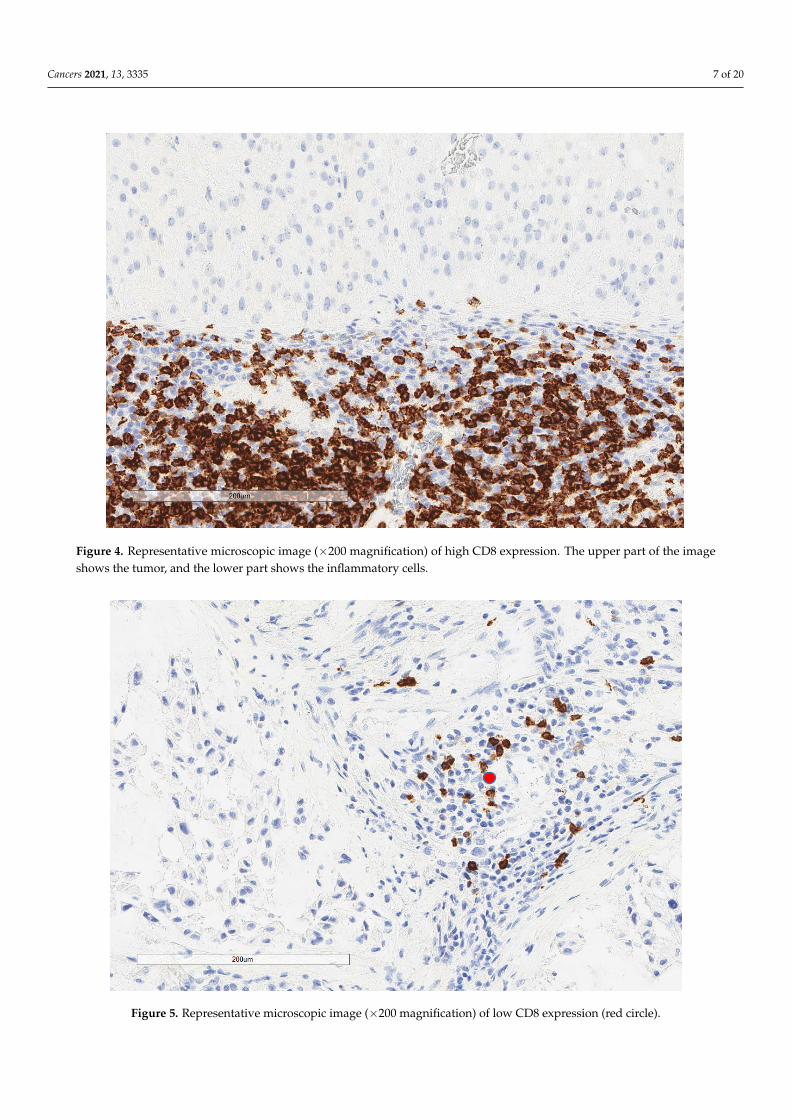
Figure 4. Representative microscopic image (×200 magnification) of high CD8 expression. The upper part of the image
shows the tumor, and the lower part shows the inflammatory cells.
Figure 3. Representative microscopic image (×200 magnification) of high CD4 expression. The right part of the imageshows the tumor, and the left part shows the inflammatory cells.
Cancers 2021, 13, 3335 7 of 20
Cancers 2021, 13, x FOR PEER REVIEW 7 of 21
Figure 3. Representative microscopic image (×200 magnification) of high CD4 expression. The right part of the image
shows the tumor, and the left part shows the inflammatory cells.
Figure 4. Representative microscopic image (×200 magnification) of high CD8 expression. The upper part of the image
shows the tumor, and the lower part shows the inflammatory cells. Figure 4. Representative microscopic image (×200 magnification) of high CD8 expression. The upper part of the imageshows the tumor, and the lower part shows the inflammatory cells.
Cancers 2021, 13, x FOR PEER REVIEW 8 of 21
Figure 5. Representative microscopic image (×200 magnification) of low CD8 expression (red circle).
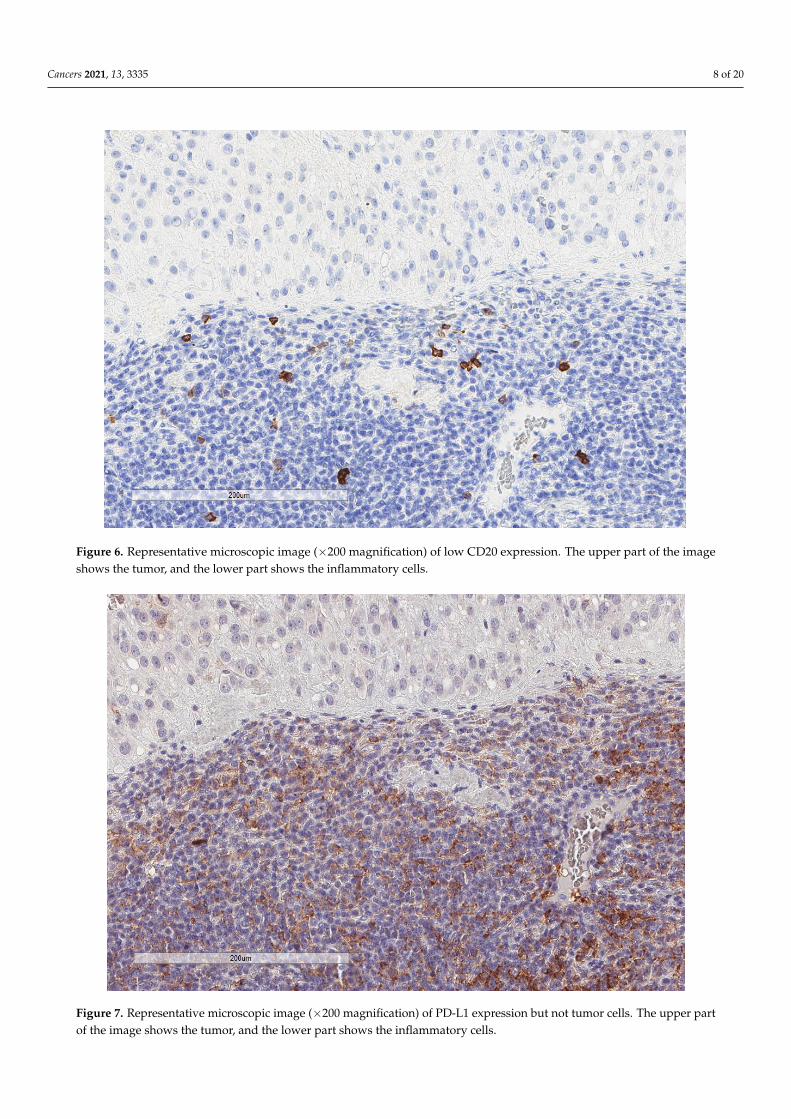
Figure 6. Representative microscopic image (×200 magnification) of low CD20 expression. The upper part of the image
shows the tumor, and the lower part shows the inflammatory cells.
Figure 5. Representative microscopic image (×200 magnification) of low CD8 expression (red circle).
Cancers 2021, 13, 3335 8 of 20
Cancers 2021, 13, x FOR PEER REVIEW 8 of 21
Figure 5. Representative microscopic image (×200 magnification) of low CD8 expression (red circle).
Figure 6. Representative microscopic image (×200 magnification) of low CD20 expression. The upper part of the image
shows the tumor, and the lower part shows the inflammatory cells. Figure 6. Representative microscopic image (×200 magnification) of low CD20 expression. The upper part of the imageshows the tumor, and the lower part shows the inflammatory cells.
Cancers 2021, 13, x FOR PEER REVIEW 9 of 21
Figure 7. Representative microscopic image (×200 magnification) of PD-L1 expression but not tumor cells. The upper part
of the image shows the tumor, and the lower part shows the inflammatory cells.
Figure 8. Representative microscopic image (×200 magnification) showing PD-L1 expression by immune cells (red circle)
but not tumor cells (yellow triangle).
Figure 7. Representative microscopic image (×200 magnification) of PD-L1 expression but not tumor cells. The upper partof the image shows the tumor, and the lower part shows the inflammatory cells.
Cancers 2021, 13, 3335 9 of 20
Cancers 2021, 13, x FOR PEER REVIEW 9 of 21
Figure 7. Representative microscopic image (×200 magnification) of PD-L1 expression but not tumor cells. The upper part
of the image shows the tumor, and the lower part shows the inflammatory cells.
Figure 8. Representative microscopic image (×200 magnification) showing PD-L1 expression by immune cells (red circle)
but not tumor cells (yellow triangle). Figure 8. Representative microscopic image (×200 magnification) showing PD-L1 expression by immune cells (red circle)but not tumor cells (yellow triangle).
Cancers 2021, 13, x FOR PEER REVIEW 10 of 21
Figure 9. Representative image (×200 magnification) of another case showing that tumor cells (yellow triangle) do not
express PD-L1, whereas nearby immune cells are PD-L1+ (red circle).
Figure 10. The morphologic features of the same focus previously shown (×200): immune cells (red circle) and tumor cells
(yellow triangle).
Figure 9. Representative image (×200 magnification) of another case showing that tumor cells (yellow triangle) do notexpress PD-L1, whereas nearby immune cells are PD-L1+ (red circle).
Cancers 2021, 13, 3335 10 of 20
Cancers 2021, 13, x FOR PEER REVIEW 10 of 21
Figure 9. Representative image (×200 magnification) of another case showing that tumor cells (yellow triangle) do not
express PD-L1, whereas nearby immune cells are PD-L1+ (red circle).
Figure 10. The morphologic features of the same focus previously shown (×200): immune cells (red circle) and tumor cells
(yellow triangle). Figure 10. The morphologic features of the same focus previously shown (×200): immune cells (red circle) and tumor cells(yellow triangle).
Cancers 2021, 13, x FOR PEER REVIEW 11 of 21
Figure 11. Representative microscopic image of a double stain for PD-L1 (DAB = brown) and CD8 (magenta), showing
that most CD8 cells (yellow triangle) do not express PD-L1, which is found in larger cells (red circle) (×400 magnification).
Figure 12. Representative microscopic image of a double stain for PD-L1 (DAB = brown) and CD163 (magenta), showing
that most CD163 cells also express PD-L1 (yellow triangle), while the background lymphocytes (red circle) are negative
(×400 magnification, same focus as in the previous figure).
Figure 11. Representative microscopic image of a double stain for PD-L1 (DAB = brown) and CD8 (magenta), showing thatmost CD8 cells (yellow triangle) do not express PD-L1, which is found in larger cells (red circle) (×400 magnification).

Cancers 2021, 13, 3335 11 of 20
Cancers 2021, 13, x FOR PEER REVIEW 11 of 21
Figure 11. Representative microscopic image of a double stain for PD-L1 (DAB = brown) and CD8 (magenta), showing
that most CD8 cells (yellow triangle) do not express PD-L1, which is found in larger cells (red circle) (×400 magnification).
Figure 12. Representative microscopic image of a double stain for PD-L1 (DAB = brown) and CD163 (magenta), showing
that most CD163 cells also express PD-L1 (yellow triangle), while the background lymphocytes (red circle) are negative
(×400 magnification, same focus as in the previous figure).
Figure 12. Representative microscopic image of a double stain for PD-L1 (DAB = brown) and CD163 (magenta), showingthat most CD163 cells also express PD-L1 (yellow triangle), while the background lymphocytes (red circle) are negative(×400 magnification, same focus as in the previous figure).
Cancers 2021, 13, x FOR PEER REVIEW 12 of 21
Figure 13. Representative image of CD34 vascular density (×100).
Figure 14. Representative image (×200 magnification) of the morphological aspect of high endothelial venules (arrow).
Nearby, the tumor (red circle) cells are shown.
Figure 13. Representative image of CD34 vascular density (×100).
Cancers 2021, 13, 3335 12 of 20
Cancers 2021, 13, x FOR PEER REVIEW 12 of 21
Figure 13. Representative image of CD34 vascular density (×100).
Figure 14. Representative image (×200 magnification) of the morphological aspect of high endothelial venules (arrow).
Nearby, the tumor (red circle) cells are shown. Figure 14. Representative image (×200 magnification) of the morphological aspect of high endothelial venules (arrow).Nearby, the tumor (red circle) cells are shown.
Cancers 2021, 13, x FOR PEER REVIEW 13 of 21
Figure 15. Representative images (same tumor focus as previous image at ×200 magnification) with the corresponding
MECA-79+ high endothelial venules (yellow arrows).
Figure 16. Representative image (same tumor focus as previous image at ×200 magnification) showing CD20+ B cells (yel-
low arrows).
A comparison between the immunohistochemical factors studied (Table 3, χ2 test
confirmed by Fisher’s exact test) showed a positive correlation between CD8 and CD20
cells (p = 0.01) and a strong trend (p = 0.05) for positive CD8 and CD163 correlation. The
Figure 15. Representative images (same tumor focus as previous image at ×200 magnification) with the correspondingMECA-79+ high endothelial venules (yellow arrows).
Cancers 2021, 13, 3335 13 of 20
Cancers 2021, 13, x FOR PEER REVIEW 13 of 21
Figure 15. Representative images (same tumor focus as previous image at ×200 magnification) with the corresponding
MECA-79+ high endothelial venules (yellow arrows).
Figure 16. Representative image (same tumor focus as previous image at ×200 magnification) showing CD20+ B cells (yel-
low arrows).
A comparison between the immunohistochemical factors studied (Table 3, χ2 test
confirmed by Fisher’s exact test) showed a positive correlation between CD8 and CD20
cells (p = 0.01) and a strong trend (p = 0.05) for positive CD8 and CD163 correlation. The
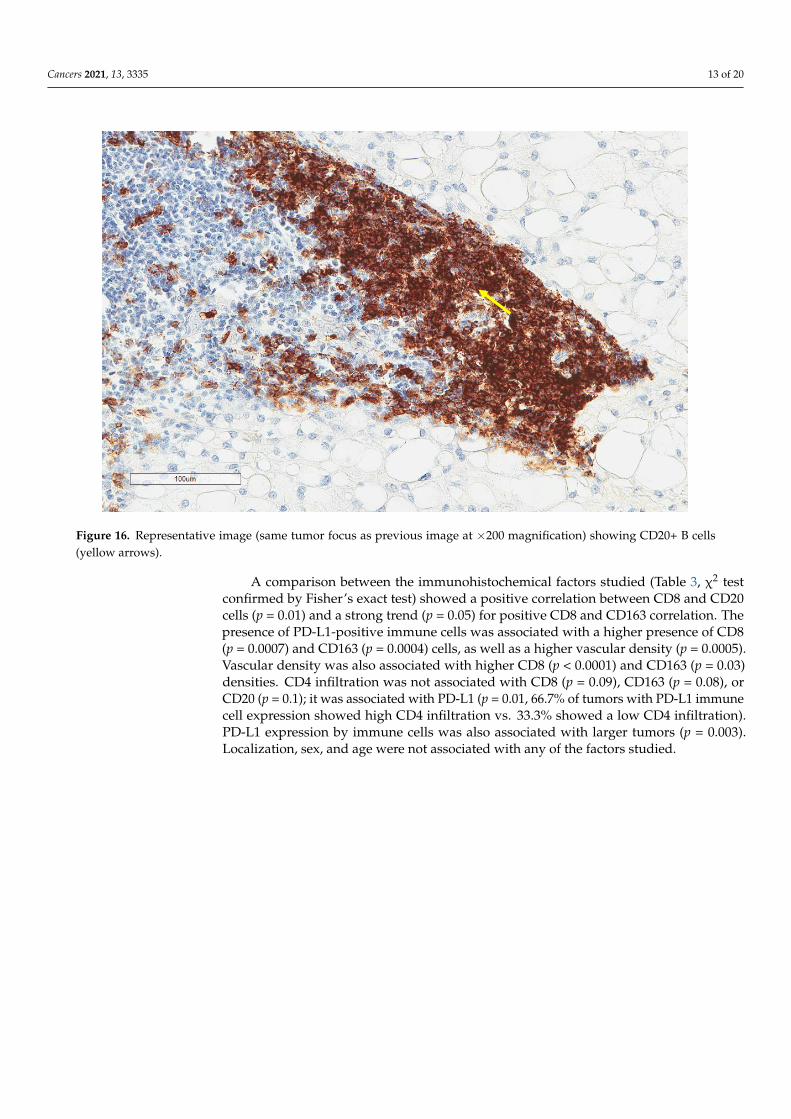
Figure 16. Representative image (same tumor focus as previous image at ×200 magnification) showing CD20+ B cells(yellow arrows).
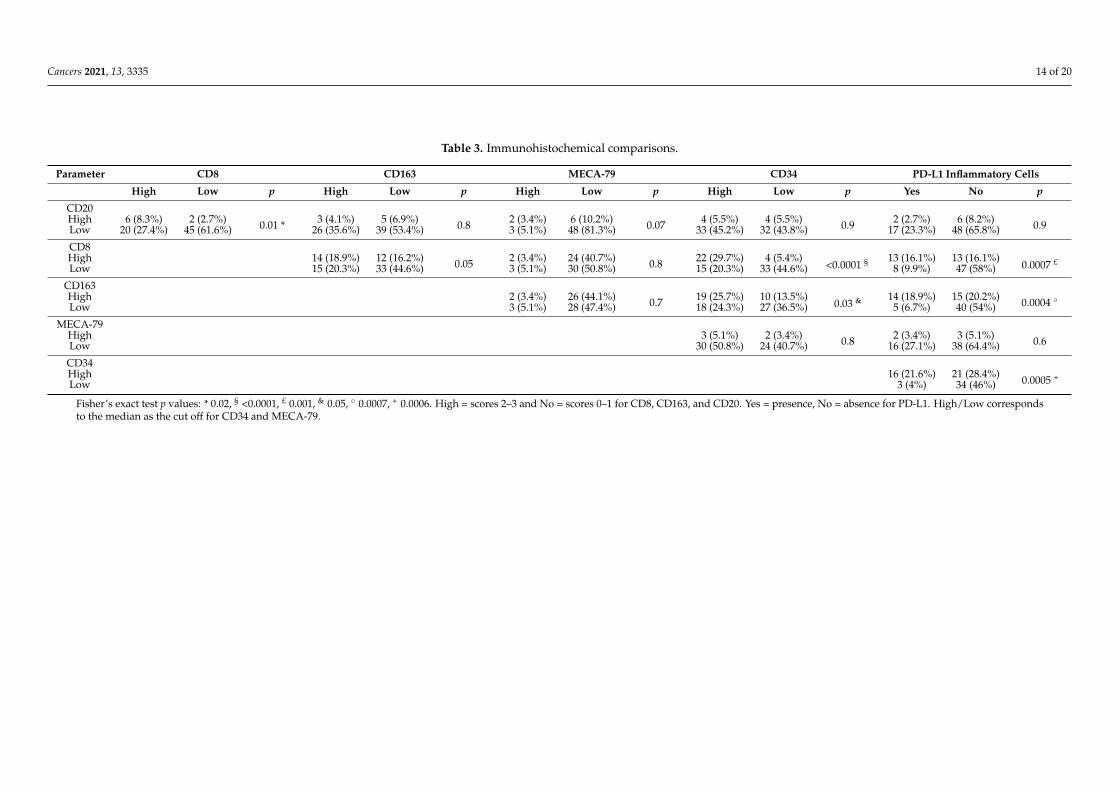
A comparison between the immunohistochemical factors studied (Table 3, χ2 testconfirmed by Fisher’s exact test) showed a positive correlation between CD8 and CD20cells (p = 0.01) and a strong trend (p = 0.05) for positive CD8 and CD163 correlation. Thepresence of PD-L1-positive immune cells was associated with a higher presence of CD8(p = 0.0007) and CD163 (p = 0.0004) cells, as well as a higher vascular density (p = 0.0005).Vascular density was also associated with higher CD8 (p < 0.0001) and CD163 (p = 0.03)densities. CD4 infiltration was not associated with CD8 (p = 0.09), CD163 (p = 0.08), orCD20 (p = 0.1); it was associated with PD-L1 (p = 0.01, 66.7% of tumors with PD-L1 immunecell expression showed high CD4 infiltration vs. 33.3% showed a low CD4 infiltration).PD-L1 expression by immune cells was also associated with larger tumors (p = 0.003).Localization, sex, and age were not associated with any of the factors studied.
Cancers 2021, 13, 3335 14 of 20
Table 3. Immunohistochemical comparisons.
Parameter CD8 CD163 MECA-79 CD34 PD-L1 Inflammatory Cells
High Low p High Low p High Low p High Low p Yes No p
CD20High 6 (8.3%) 2 (2.7%) 0.01 * 3 (4.1%) 5 (6.9%) 0.8 2 (3.4%) 6 (10.2%) 0.07 4 (5.5%) 4 (5.5%) 0.9 2 (2.7%) 6 (8.2%) 0.9Low 20 (27.4%) 45 (61.6%) 26 (35.6%) 39 (53.4%) 3 (5.1%) 48 (81.3%) 33 (45.2%) 32 (43.8%) 17 (23.3%) 48 (65.8%)
CD8High 14 (18.9%) 12 (16.2%) 0.05 2 (3.4%) 24 (40.7%) 0.8 22 (29.7%) 4 (5.4%)
<0.0001 § 13 (16.1%) 13 (16.1%)0.0007 £
Low 15 (20.3%) 33 (44.6%) 3 (5.1%) 30 (50.8%) 15 (20.3%) 33 (44.6%) 8 (9.9%) 47 (58%)
CD163High 2 (3.4%) 26 (44.1%) 0.7 19 (25.7%) 10 (13.5%)
0.03 & 14 (18.9%) 15 (20.2%) 0.0004 ◦Low 3 (5.1%) 28 (47.4%) 18 (24.3%) 27 (36.5%) 5 (6.7%) 40 (54%)
MECA-79High 3 (5.1%) 2 (3.4%) 0.8 2 (3.4%) 3 (5.1%) 0.6Low 30 (50.8%) 24 (40.7%) 16 (27.1%) 38 (64.4%)
CD34High 16 (21.6%) 21 (28.4%) 0.0005 +Low 3 (4%) 34 (46%)
Fisher’s exact test p values: * 0.02, § <0.0001, £ 0.001, & 0.05, ◦ 0.0007, + 0.0006. High = scores 2–3 and No = scores 0–1 for CD8, CD163, and CD20. Yes = presence, No = absence for PD-L1. High/Low correspondsto the median as the cut off for CD34 and MECA-79.
Cancers 2021, 13, 3335 15 of 20
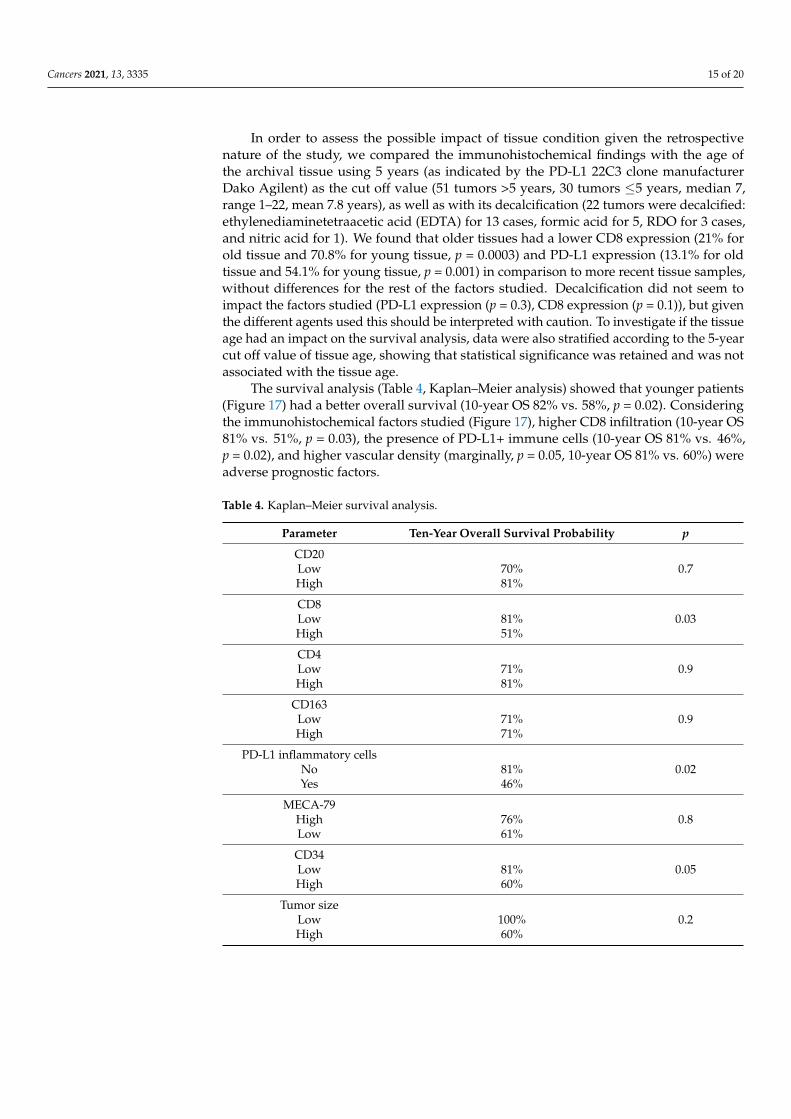
In order to assess the possible impact of tissue condition given the retrospectivenature of the study, we compared the immunohistochemical findings with the age ofthe archival tissue using 5 years (as indicated by the PD-L1 22C3 clone manufacturerDako Agilent) as the cut off value (51 tumors >5 years, 30 tumors ≤5 years, median 7,range 1–22, mean 7.8 years), as well as with its decalcification (22 tumors were decalcified:ethylenediaminetetraacetic acid (EDTA) for 13 cases, formic acid for 5, RDO for 3 cases,and nitric acid for 1). We found that older tissues had a lower CD8 expression (21% forold tissue and 70.8% for young tissue, p = 0.0003) and PD-L1 expression (13.1% for oldtissue and 54.1% for young tissue, p = 0.001) in comparison to more recent tissue samples,without differences for the rest of the factors studied. Decalcification did not seem toimpact the factors studied (PD-L1 expression (p = 0.3), CD8 expression (p = 0.1)), but giventhe different agents used this should be interpreted with caution. To investigate if the tissueage had an impact on the survival analysis, data were also stratified according to the 5-yearcut off value of tissue age, showing that statistical significance was retained and was notassociated with the tissue age.
The survival analysis (Table 4, Kaplan–Meier analysis) showed that younger patients(Figure 17) had a better overall survival (10-year OS 82% vs. 58%, p = 0.02). Consideringthe immunohistochemical factors studied (Figure 17), higher CD8 infiltration (10-year OS81% vs. 51%, p = 0.03), the presence of PD-L1+ immune cells (10-year OS 81% vs. 46%,p = 0.02), and higher vascular density (marginally, p = 0.05, 10-year OS 81% vs. 60%) wereadverse prognostic factors.
Table 4. Kaplan–Meier survival analysis.
Parameter Ten-Year Overall Survival Probability p
CD20Low 70% 0.7High 81%
CD8Low 81% 0.03High 51%
CD4Low 71% 0.9High 81%
CD163Low 71% 0.9High 71%
PD-L1 inflammatory cellsNo 81% 0.02Yes 46%
MECA-79High 76% 0.8Low 61%
CD34Low 81% 0.05High 60%
Tumor sizeLow 100% 0.2High 60%
Cancers 2021, 13, 3335 16 of 20
Table 4. Cont.
Parameter Ten-Year Overall Survival Probability p
Patient ageLow 82% 0.02High 58%
Tissue ageLow 71% 0.9High 71%
Bold denotes statistical significance.
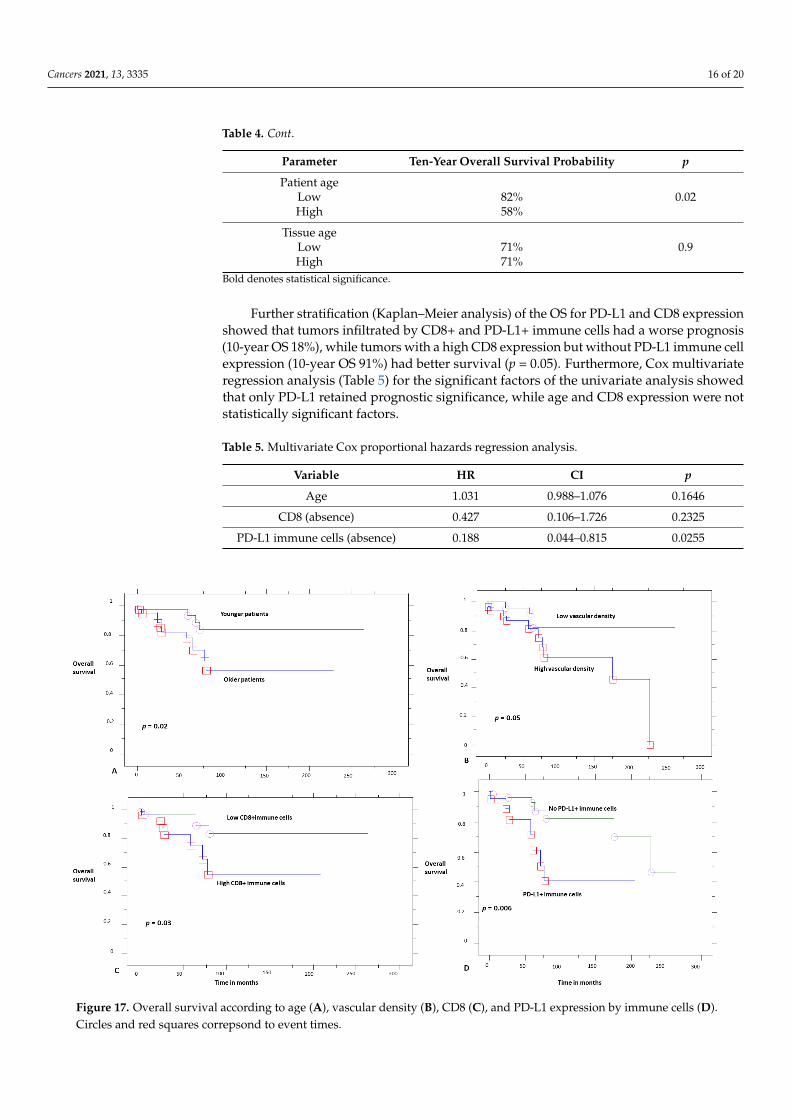
Further stratification (Kaplan–Meier analysis) of the OS for PD-L1 and CD8 expressionshowed that tumors infiltrated by CD8+ and PD-L1+ immune cells had a worse prognosis(10-year OS 18%), while tumors with a high CD8 expression but without PD-L1 immune cellexpression (10-year OS 91%) had better survival (p = 0.05). Furthermore, Cox multivariateregression analysis (Table 5) for the significant factors of the univariate analysis showedthat only PD-L1 retained prognostic significance, while age and CD8 expression were notstatistically significant factors.
Table 5. Multivariate Cox proportional hazards regression analysis.
Variable HR CI p
Age 1.031 0.988–1.076 0.1646
CD8 (absence) 0.427 0.106–1.726 0.2325
PD-L1 immune cells (absence) 0.188 0.044–0.815 0.0255Cancers 2021, 13, x FOR PEER REVIEW 18 of 21
Figure 17. Overall survival according to age (A), vascular density (B), CD8 (C), and PD-L1 expression by immune cells
(D). Circles and red squares correpsond to event times.
4. Discussion
The current series is one of the largest in chordomas, investigating their immune mi-
croenvironment. We show that PD-L1 is not expressed by tumor cells in these tumors,
which is a striking difference from two previous studies: Feng et al. reported PD-L1 tumor
cell expression in 94.9% of their cases, as studied in tissue microarrays [9], while Zou et
al. found PD-L1 expression by tumor cells in 68.5% of 54 cases studied, as reported in four
different studies [10,11,13,14], and 66.7% in their validation series of 60 patients [12]. On
the contrary, our results confirm the observations of Mathios et al. who reported no PD-
L1 expression by tumor cells in 10 samples studied [8].
We believe that the most plausible explanation for these discrepancies is the different
immunohistochemical techniques used, especially for PD-L1, which is known to vary
even between well-established clones [16]. We used an antibody (22C3) that is often used
in many clinical trials and in routine practice for theranostic reasons. Mathios et al. used
a 5H1 clone [8], while Feng et al. did not report a reference for the antibody used [9]. Zou
et al. used a monoclonal antibody with the reference ab174838 in the first report [13], while
in the three next reports of the same samples they referred to the clone 28-8 [10,11,14]
(ab205921, which replaces the ab174838 clone, which was discontinued as denoted in the
company site); in their last report of the same cohort and the validation cohort, they re-
ferred to their previous works for protocol details [12], so this is probably the 28-8 clone.
These discrepancies between the various studies highlight the difficulties in immuno-
histochemical techniques and justify the need for more studies in different patient popu-
lations and using different techniques. We also considered possible the tissue age, and
thus its antigenicity, as a parameter of variability, given the retrospective nature of the
study, despite the fact that the previous studies were also retrospective and, when men-
tioned, the inclusion time was also large in these studies (2002–2015 for the 54 samples of
Zou et al. [10,11,13,14] and 2006–2018 for their validation cohort [12]). This question of
Figure 17. Overall survival according to age (A), vascular density (B), CD8 (C), and PD-L1 expression by immune cells (D).Circles and red squares correpsond to event times.
Cancers 2021, 13, 3335 17 of 20
4. Discussion
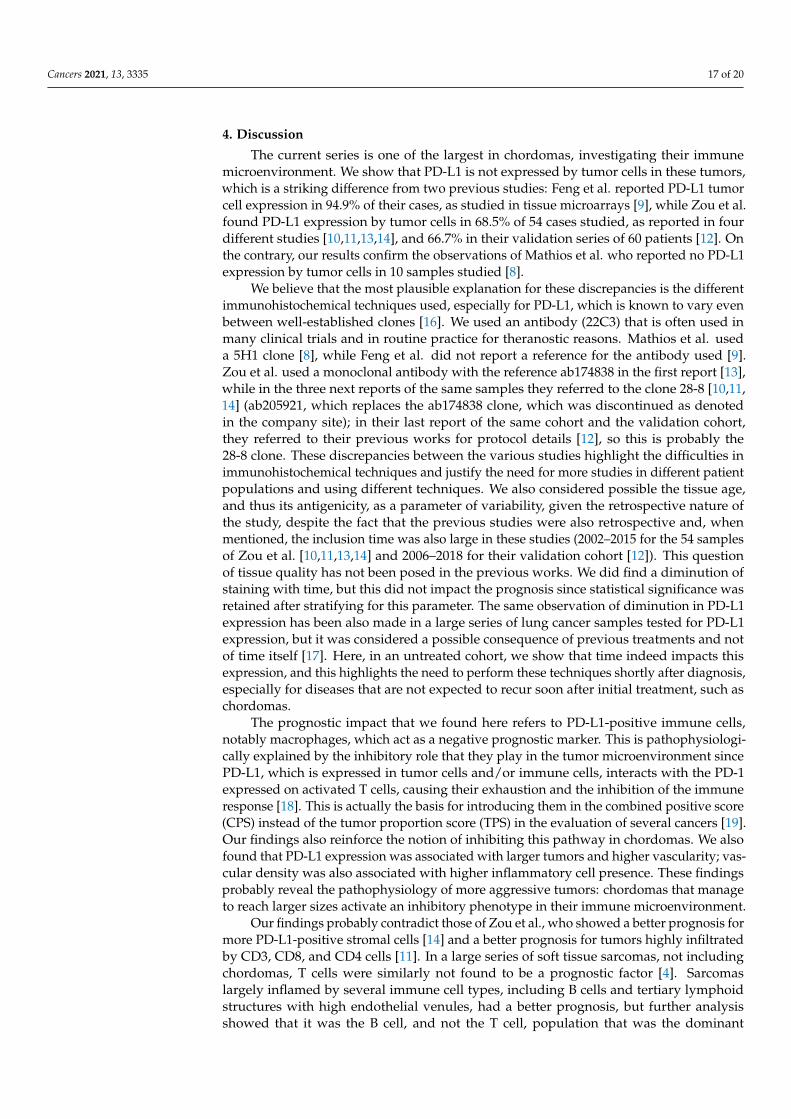
The current series is one of the largest in chordomas, investigating their immunemicroenvironment. We show that PD-L1 is not expressed by tumor cells in these tumors,which is a striking difference from two previous studies: Feng et al. reported PD-L1 tumorcell expression in 94.9% of their cases, as studied in tissue microarrays [9], while Zou et al.found PD-L1 expression by tumor cells in 68.5% of 54 cases studied, as reported in fourdifferent studies [10,11,13,14], and 66.7% in their validation series of 60 patients [12]. Onthe contrary, our results confirm the observations of Mathios et al. who reported no PD-L1expression by tumor cells in 10 samples studied [8].
We believe that the most plausible explanation for these discrepancies is the differentimmunohistochemical techniques used, especially for PD-L1, which is known to vary evenbetween well-established clones [16]. We used an antibody (22C3) that is often used inmany clinical trials and in routine practice for theranostic reasons. Mathios et al. useda 5H1 clone [8], while Feng et al. did not report a reference for the antibody used [9].Zou et al. used a monoclonal antibody with the reference ab174838 in the first report [13],while in the three next reports of the same samples they referred to the clone 28-8 [10,11,14] (ab205921, which replaces the ab174838 clone, which was discontinued as denotedin the company site); in their last report of the same cohort and the validation cohort,they referred to their previous works for protocol details [12], so this is probably the28-8 clone. These discrepancies between the various studies highlight the difficulties inimmunohistochemical techniques and justify the need for more studies in different patientpopulations and using different techniques. We also considered possible the tissue age,and thus its antigenicity, as a parameter of variability, given the retrospective nature ofthe study, despite the fact that the previous studies were also retrospective and, whenmentioned, the inclusion time was also large in these studies (2002–2015 for the 54 samplesof Zou et al. [10,11,13,14] and 2006–2018 for their validation cohort [12]). This questionof tissue quality has not been posed in the previous works. We did find a diminution ofstaining with time, but this did not impact the prognosis since statistical significance wasretained after stratifying for this parameter. The same observation of diminution in PD-L1expression has been also made in a large series of lung cancer samples tested for PD-L1expression, but it was considered a possible consequence of previous treatments and notof time itself [17]. Here, in an untreated cohort, we show that time indeed impacts thisexpression, and this highlights the need to perform these techniques shortly after diagnosis,especially for diseases that are not expected to recur soon after initial treatment, such aschordomas.
The prognostic impact that we found here refers to PD-L1-positive immune cells,notably macrophages, which act as a negative prognostic marker. This is pathophysiologi-cally explained by the inhibitory role that they play in the tumor microenvironment sincePD-L1, which is expressed in tumor cells and/or immune cells, interacts with the PD-1expressed on activated T cells, causing their exhaustion and the inhibition of the immuneresponse [18]. This is actually the basis for introducing them in the combined positive score(CPS) instead of the tumor proportion score (TPS) in the evaluation of several cancers [19].Our findings also reinforce the notion of inhibiting this pathway in chordomas. We alsofound that PD-L1 expression was associated with larger tumors and higher vascularity; vas-cular density was also associated with higher inflammatory cell presence. These findingsprobably reveal the pathophysiology of more aggressive tumors: chordomas that manageto reach larger sizes activate an inhibitory phenotype in their immune microenvironment.
Our findings probably contradict those of Zou et al., who showed a better prognosis formore PD-L1-positive stromal cells [14] and a better prognosis for tumors highly infiltratedby CD3, CD8, and CD4 cells [11]. In a large series of soft tissue sarcomas, not includingchordomas, T cells were similarly not found to be a prognostic factor [4]. Sarcomaslargely inflamed by several immune cell types, including B cells and tertiary lymphoidstructures with high endothelial venules, had a better prognosis, but further analysisshowed that it was the B cell, and not the T cell, population that was the dominant
Cancers 2021, 13, 3335 18 of 20
factor impacting survival [4]. We did not find an association between survival and highB cell expression or high endothelial venules, but both factors were rather uncommonin chordomas, probably reflecting their limited role in these bone sarcomas. In Ewing’ssarcoma family of tumors [20] and in osteosarcomas [21], CD8 was not found to be aprognostic factor either. Similarly, another study of osteosarcomas did not show prognosticsignificance for CD8 infiltration in the whole cohort, but it was found to be a positiveprognostic factor for patients treated with an osteoclast inhibitor [22]. In other cancer types,CD8 T cells can be a positive [2] or negative prognostic factor [23]. These results probablyhighlight the complexity of the immune microenvironment and suggest that it shouldbe studied as a complex ecosystem, in a tumor- and context-dependent manner, wheremore than one type of molecule and cell intervenes. We also found a trend for highlyvascularized tumors to be associated with worse prognosis, which is in line with the resultsof Zou et al. [14], and this further substantiates the recent and promising results of patientstreated with apatinib, a small-molecule tyrosine kinase inhibitor that selectively binds toVEGFR2, decreasing tumor vascular density [24].
5. Conclusions
Our study suffers from limitations associated with its retrospective design, suchas those attributed to the aforementioned immunohistochemical techniques. However,retrospective studies are often the only means to expand our knowledge of this rare disease,which, given its nature, requires a very long follow up. Similarly, despite being a largeseries for such a rare disease, this remains a small series regarding the strengths of thestatistical analysis in the various subgroups.
To conclude, in the current chordoma series, we found no tumor cell PD-L1 expression,but we did find a negative prognostic role for PD-L1+ immune cells, supporting the needfor further studies in this field and the notion of a possible beneficial role of immunotherapyin these patients.
Author Contributions: Conceptualization, G.K. and M.P.; Data curation, G.K., M.D., L.K.-D., F.V.,E.J., T.J., C.B., S.G., J.M.D., D.M. and J.B.; Formal analysis, G.K., M.D., D.M., J.B. and M.P.; Fundingacquisition, G.K.; Investigation, G.K., M.D., E.J., T.J., C.B., J.M.D., D.M., J.B. and M.P.; Methodology,G.K., J.M.D., D.M., J.B. and M.P.; Project administration, G.K. and M.P.; Resources, G.K., F.V., T.J., C.B.and M.P.; Software, G.K.; Supervision, G.K., F.V., E.J., T.J., J.M.D., D.M. and M.P.; Validation, G.K. andM.P.; Visualization, G.K.; Writing—original draft, G.K., M.D.,; Writing—review & editing, F.V., E.J.,T.J., C.B., S.G., J.M.D., D.M., J.B. and M.P. All authors have read and agreed to the published versionof the manuscript.
Funding: Direction des Affaires Médicales et de la Recherche, CHU Saint-Etienne, France, REF20CH028.
Institutional Review Board Statement: The local ethics committee approved the study (IRBN702020/CHUSTE); 12/05/2020; the acquisition of written informed consent was waived by the institutionalreview board given the retrospective nature of the study and the anonymization of all data. Thestudy was performed according to the Declaration of Helsinki.
Informed Consent Statement: Patient consent was waived by the institutional review board giventhe retrospective nature of the study and the anonymization of all data.
Data Availability Statement: Data are available upon reasonable request.
Acknowledgments: The authors would like to thank Philippe Cosmo from the Tumorothèque/Centrede Ressources Biologiques de CHU Saint-Etienne (BRIF no. BB-0033-00041), as well as Martine Lavaland Emmanuel Mical for their excellent technical assistance.
Conflicts of Interest: The authors declare no conflict of interest.
Cancers 2021, 13, 3335 19 of 20
References1. Suzuki, K.; Kachala, S.S.; Kadota, K.; Shen, R.; Mo, Q.; Beer, D.G.; Rusch, V.W.; Travis, W.D.; Adusumilli, P.S. Prognostic Immune
Markers in Non–Small Cell Lung Cancer. Clin. Cancer Res. 2011, 17, 5247–5256. [CrossRef] [PubMed]2. Karpathiou, G.; Casteillo, F.; Giroult, J.-B.; Forest, F.; Fournel, P.; Monaya, A.; Froudarakis, M.; Dumollard, J.M.; Prades, J.M.;
Peoc’h, M. Prognostic impact of immune microenvironment in laryngeal and pharyngeal squamous cell carcinoma: Immune cellsubtypes, immuno-suppressive pathways and clinicopathologic characteristics. Oncotarget 2017, 8, 19310–19322. [CrossRef]
3. Camy, F.; Karpathiou, G.; Dumollard, J.M.; Magne, N.; Perrot, J.L.; Vassal, F.; Picot, T.; Mobarki, M.; Forest, F.; Casteillo, F.; et al.Brain metastasis PD-L1 and CD8 expression is dependent on primary tumor type and its PD-L1 and CD8 status. J. Immunother.Cancer 2020, 8, e000597. [CrossRef] [PubMed]
4. Petitprez, F.; de Reyniès, A.; Keung, E.Z.; Chen, T.W.-W.; Sun, C.-M.; Calderaro, J.; Jeng, Y.-M.; Hsiao, L.-P.; Lacroix, L.; Bougoüin,A.; et al. B cells are associated with survival and immunotherapy response in sarcoma. Nature 2020, 577, 556–560. [CrossRef]
5. Walcott, B.P.; Nahed, B.V.; Mohyeldin, A.; Coumans, J.-V.; Kahle, K.T.; Ferreira, M.J. Chordoma: Current concepts, management,and future directions. Lancet Oncol. 2012, 13, e69–e76. [CrossRef]
6. Klemen, N.D.; Kelly, C.M.; Bartlett, E.K. The emerging role of immunotherapy for the treatment of sarcoma. J. Surg. Oncol. 2021,123, 730–738. [CrossRef]
7. Migliorini, D.; Mach, N.; Aguiar, D.; Vernet, R.; Landis, B.N.; Becker, M.; McKee, T.; Dutoit, V.; Dietrich, P.-Y. First report ofclinical responses to immunotherapy in 3 relapsing cases of chordoma after failure of standard therapies. Oncoimmunology 2017,6, e1338235. [CrossRef]
8. Mathios, D.; Ruzevick, J.; Jackson, C.M.; Xu, H.; Shah, S.; Taube, J.M.; Burger, P.C.; McCarthy, E.F.; Quinones-Hinojosa, A.; Pardoll,D.M.; et al. PD-1, PD-L1, PD-L2 expression in the chordoma microenvironment. J. Neurooncol. 2015, 121, 251–259. [CrossRef][PubMed]
9. Feng, Y.; Shen, J.; Gao, Y.; Liao, Y.; Cote, G.; Choy, E.; Chebib, I.; Mankin, H.; Hornicek, F.; Duan, Z. Expression of programmedcell death ligand 1 (PD-L1) and prevalence of tumor-infiltrating lymphocytes (TILs) in chordoma. Oncotarget 2015, 6, 11139–11149.[CrossRef]
10. Zou, M.-X.; Guo, K.-M.; Lv, G.-H.; Huang, W.; Li, J.; Wang, X.-B.; Jiang, Y.; She, X.-L. Clinicopathologic implications ofCD8+/Foxp3+ ratio and miR-574-3p/PD-L1 axis in spinal chordoma patients. Cancer Immunol. Immunother. 2018, 67, 209–224.[CrossRef] [PubMed]
11. Zou, M.-X.; Lv, G.-H.; Wang, X.-B.; Huang, W.; Li, J.; Jiang, Y.; She, X.-L. Clinical Impact of the Immune Microenvironment inSpinal Chordoma: Immunoscore as an Independent Favorable Prognostic Factor. Neurosurgery 2019, 84, E318–E333. [CrossRef][PubMed]
12. Zou, M.; Pan, Y.; Huang, W.; Zhang, T.; Escobar, D.; Wang, X.; Jiang, Y.; She, X.; Lv, G.; Li, J. A four-factor immune risk scoresignature predicts the clinical outcome of patients with spinal chordoma. Clin. Transl. Med. 2020, 10, 224–237. [CrossRef][PubMed]
13. Zou, M.-X.; Peng, A.-B.; Lv, G.-H.; Wang, X.-B.; Li, J.; She, X.-L.; Jiang, Y. Expression of programmed death-1 ligand (PD-L1) intumor-infiltrating lymphocytes is associated with favorable spinal chordoma prognosis. Am. J. Transl. Res. 2016, 8, 3274–3287.
14. Zou, M.-X.; Zheng, B.-W.; Liu, F.-S.; Wang, X.-B.; Hu, J.-R.; Huang, W.; Dai, Z.-H.; Zhang, Q.-S.; Liu, F.-B.; Zhong, H.; et al. TheRelationship Between Tumor-Stroma Ratio, the Immune Microenvironment, and Survival in Patients With Spinal Chordoma.Neurosurgery 2019, 85, E1095–E1110. [CrossRef] [PubMed]
15. Ruscetti, M.; Morris, J.P.; Mezzadra, R.; Russell, J.; Leibold, J.; Romesser, P.B.; Simon, J.; Kulick, A.; Ho, Y.; Fennell, M.; et al.Senescence-Induced Vascular Remodeling Creates Therapeutic Vulnerabilities in Pancreas Cancer. Cell 2020, 181, 424–441.[CrossRef]
16. Torlakovic, E.; Lim, H.J.; Adam, J.; Barnes, P.; Bigras, G.; Chan, A.W.H.; Cheung, C.C.; Chung, J.-H.; Couture, C.; Fiset, P.O.; et al.“Interchangeability” of PD-L1 immunohistochemistry assays: A meta-analysis of diagnostic accuracy. Mod. Pathol. 2020, 33, 4–17.[CrossRef]
17. Boothman, A.-M.; Scott, M.; Ratcliffe, M.; Whiteley, J.; Dennis, P.A.; Wadsworth, C.; Sharpe, A.; Rizvi, N.A.; Garassino, M.C.;Walker, J. Impact of Patient Characteristics, Prior Therapy, and Sample Type on Tumor Cell Programmed Cell Death Ligand1 Expression in Patients with Advanced NSCLC Screened for the ATLANTIC Study. J. Thorac. Oncol. 2019, 14, 1390–1399.[CrossRef] [PubMed]
18. Paver, E.C.; Cooper, W.A.; Colebatch, A.J.; Ferguson, P.M.; Hill, S.K.; Lum, T.; Shin, J.-S.; O’Toole, S.; Anderson, L.; Scolyer,R.A.; et al. Programmed death ligand-1 (PD-L1) as a predictive marker for immunotherapy in solid tumours: A guide toimmunohistochemistry implementation and interpretation. Pathology 2021, 53, 141–156. [CrossRef]
19. Emancipator, K.; Huang, L.; Aurora-Garg, D.; Bal, T.; Cohen, E.E.W.; Harrington, K.; Soulières, D.; Le Tourneau, C.; Licitra, L.;Burtness, B.; et al. Comparing programmed death ligand 1 scores for predicting pembrolizumab efficacy in head and neck cancer.Mod. Pathol. 2021, 34, 532–541. [CrossRef] [PubMed]
20. Machado, I.; López-Guerrero, J.A.; Scotlandi, K.; Picci, P.; Llombart-Bosch, A. Immunohistochemical analysis and prognosticsignificance of PD-L1, PD-1, and CD8+ tumor-infiltrating lymphocytes in Ewing’s sarcoma family of tumors (ESFT). VirchowsArch. 2018, 472, 815–824. [CrossRef]
21. Zhang, C.; Zheng, J.-H.; Lin, Z.-H.; Lv, H.-Y.; Ye, Z.-M.; Chen, Y.-P.; Zhang, X.-Y. Profiles of immune cell infiltration andimmune-related genes in the tumor microenvironment of osteosarcoma. Aging 2020, 12, 3486–3501. [CrossRef] [PubMed]

Cancers 2021, 13, 3335 20 of 20
22. Gomez-Brouchet, A.; Illac, C.; Gilhodes, J.; Bouvier, C.; Aubert, S.; Guinebretiere, J.-M.; Marie, B.; Larousserie, F.; Entz-Werlé,N.; de Pinieux, G.; et al. CD163-positive tumor-associated macrophages and CD8-positive cytotoxic lymphocytes are powerfuldiagnostic markers for the therapeutic stratification of osteosarcoma patients: An immunohistochemical analysis of the biopsiesfromthe French OS2006 phase 3 t. Oncoimmunology 2017, 6, e1331193. [CrossRef] [PubMed]
23. Fusco, N.; Vaira, V.; Righi, I.; Sajjadi, E.; Venetis, K.; Lopez, G.; Cattaneo, M.; Castellani, M.; Rosso, L.; Nosotti, M.; et al.Characterization of the immune microenvironment in malignant pleural mesothelioma reveals prognostic subgroups of patients.Lung Cancer 2020, 150, 53–61. [CrossRef] [PubMed]
24. Liu, C.; Jia, Q.; Wei, H.; Yang, X.; Liu, T.; Zhao, J.; Ling, Y.; Wang, C.; Yu, H.; Li, Z.; et al. Apatinib in patients with advancedchordoma: A single-arm, single-centre, phase 2 study. Lancet Oncol. 2020, 21, 1244–1252. [CrossRef]