The hyper-IgE syndrome is not caused by a microdeletion syndrome
14
ORIGINAL PAPER The hyper-IgE syndrome is not caused by a microdeletion syndrome Dietmar Pfeifer & Cristina Woellner & Astrid Petersen & Maria Cristina Pietrogrande & Josè Luis Franco & Mehdi Yeganeh & Stephan Ehl & Nuria Matamoros & Eli Sprecher & Jennifer M. Puck & Hendrik Veelken & Bodo Grimbacher Received: 25 July 2007 / Accepted: 23 October 2007 / Published online: 14 November 2007 # Springer-Verlag 2007 Abstract The hyper-immunoglobulin E syndrome (HIES) is a rare primary immunodeficiency characterized by recurrent infections, elevated serum IgE-levels, and in- volvement of the soft- and bony tissues. We speculated that this complex disease may be caused by a microdeletion syndrome. We therefore analyzed 30 sporadic HIES patients for the presence of chromosomal imbalances using Affymetrix 50k XbaI and 23 of the 30 patients with the higher-resolution 250k StyI SNP mapping arrays. We detected only eight different copy number alterations in six patients with the 50k approach, and seven of these presented known polymorphic regions not associated with Immunogenetics (2007) 59:913–926 DOI 10.1007/s00251-007-0257-z Dietmar Pfeifer and Cristina Woellner contributed equally to the work and are considered aequo loco. D. Pfeifer : A. Petersen : H. Veelken Department of Hematology and Oncology, University Hospital Freiburg, Hugstetterstrasse 55, 79106 Freiburg, Germany C. Woellner : B. Grimbacher Division Rheumatology and Clinical Immunology, University Hospital Freiburg, Breisacherstrasse 66, 79106 Freiburg, Germany M. C. Pietrogrande Department of Pediatrics, University of Milan, Fondazione Policlinico IRCCS, Via Commenda 9, 20122 Milano, Italy J. L. Franco Group of Primary Immunodeficiencies, University of Antioquia, Medellín, Colombia M. Yeganeh Immunology, Asthma and Allergy Research Institute, Children Medical Centre, Tehran University of Medical Sciences, No.62, Dr. Gharib St, Keshavarz Blvd, 14194 Tehran, Iran S. Ehl Department of Pediatrics and Adolescent Medicine, University Hospital Freiburg, Mathildenstrasse 1, 79106 Freiburg, Germany N. Matamoros Servicio de Inmunologia, Hospital Son Dureta, Andrea Doria 55, 07014 Palma de Mallorca, Spain E. Sprecher Department of Dermatology, Rambam Medical Center, Haifa, Israel J. M. Puck Department of Pediatrics, University of California, San Francisco, CA, USA B. Grimbacher Department of Immunology and Molecular Pathology, Royal Free Hospital, University College London, London, UK B. Grimbacher (*) UCL Immunology Consortium, Royal Free Hospital and University College London, Pond Street, London NW3-2QG, UK e-mail: [email protected]
-
Upload
independent -
Category
Documents
-
view
0 -
download
0
Transcript of The hyper-IgE syndrome is not caused by a microdeletion syndrome

ORIGINAL PAPER
The hyper-IgE syndrome is not causedby a microdeletion syndrome
Dietmar Pfeifer & Cristina Woellner & Astrid Petersen &
Maria Cristina Pietrogrande & Josè Luis Franco &
Mehdi Yeganeh & Stephan Ehl & Nuria Matamoros &
Eli Sprecher & Jennifer M. Puck & Hendrik Veelken &
Bodo Grimbacher
Received: 25 July 2007 /Accepted: 23 October 2007 / Published online: 14 November 2007# Springer-Verlag 2007
Abstract The hyper-immunoglobulin E syndrome (HIES)is a rare primary immunodeficiency characterized byrecurrent infections, elevated serum IgE-levels, and in-volvement of the soft- and bony tissues. We speculated thatthis complex disease may be caused by a microdeletionsyndrome. We therefore analyzed 30 sporadic HIES
patients for the presence of chromosomal imbalances usingAffymetrix 50k XbaI and 23 of the 30 patients with thehigher-resolution 250k StyI SNP mapping arrays. Wedetected only eight different copy number alterations insix patients with the 50k approach, and seven of thesepresented known polymorphic regions not associated with
Immunogenetics (2007) 59:913–926DOI 10.1007/s00251-007-0257-z
Dietmar Pfeifer and Cristina Woellner contributed equally to the workand are considered aequo loco.
D. Pfeifer :A. Petersen :H. VeelkenDepartment of Hematology and Oncology,University Hospital Freiburg,Hugstetterstrasse 55,79106 Freiburg, Germany
C. Woellner :B. GrimbacherDivision Rheumatology and Clinical Immunology,University Hospital Freiburg,Breisacherstrasse 66,79106 Freiburg, Germany
M. C. PietrograndeDepartment of Pediatrics, University of Milan,Fondazione Policlinico IRCCS,Via Commenda 9,20122 Milano, Italy
J. L. FrancoGroup of Primary Immunodeficiencies, University of Antioquia,Medellín, Colombia
M. YeganehImmunology, Asthma and Allergy Research Institute,Children Medical Centre, Tehran University of Medical Sciences,No.62, Dr. Gharib St, Keshavarz Blvd,14194 Tehran, Iran
S. EhlDepartment of Pediatrics and Adolescent Medicine,University Hospital Freiburg,Mathildenstrasse 1,79106 Freiburg, Germany
N. MatamorosServicio de Inmunologia, Hospital Son Dureta,Andrea Doria 55,07014 Palma de Mallorca, Spain
E. SprecherDepartment of Dermatology, Rambam Medical Center,Haifa, Israel
J. M. PuckDepartment of Pediatrics, University of California,San Francisco, CA, USA
B. GrimbacherDepartment of Immunology and Molecular Pathology,Royal Free Hospital, University College London,London, UK
B. Grimbacher (*)UCL Immunology Consortium,Royal Free Hospital and University College London,Pond Street,London NW3-2QG, UKe-mail: [email protected]

disease. However, one patient showed a unique gain onchromosome 20p. 250k array analysis identified this gain asa rare polymorphism segregating in the patient’s family, butnot associated with the HIES phenotype. In addition, 265known and novel copy number variants (CNVs) wereidentified with the 250k arrays, but no recurrent imbalancesreminescent of a microdeletion syndrome were found. Wealigned the identified CNVs with loci that have beenassociated with HIES or phenotypically overlapping syn-dromes. Doing so, a 2-Mb deletion spanning the PEPDgene on 19q13.11 was identified on one allele of onepatient. Homozygous mutations in PEPD are responsiblefor the autosomal-recessive prolidase deficiency whichresembles HIES in some aspects. Sequencing of the healthyallele, however, revealed a wild-type sequence. In summa-ry, our results suggest that HIES is not likely to be amicrodeletion syndrome.
Keywords Hyper-IgEsyndrome .Microdeletion syndrome .
Primary Immunodeficiency . SNP-chip analysis .
PEPD . prolidase D
Introduction
The hyper-immunoglobulin E syndrome (HIES) [alsocalled Job’s syndrome; (OMIM) nos. 147060 and 243700]is a rare primary immunodeficiency (prevalence <1:1million), characterized by the clinical triad of recurrentstaphylococcal skin abscesses, recurrent pneumonia withpneumatocele formation, and serum IgE levels of>2,000 IU/ml. HIES usually manifests in childhood andhas a highly variable expressivity (Grimbacher et al. 2005).
Both autosomal dominant (AD) and autosomal recessive(AR) inheritance have been described; however, most casesare sporadic. The AD form of HIES and most sporadiccases have extra-immune manifestations, defining HIES asa multisystem disease. Skeletal abnormalities such ashyperextensibility of the joints, scoliosis, and multiple bonefractures can be variably seen in patients with HIES(Grimbacher et al. 1999b). In addition, many patients showa typical facial appearance and have retained primary teeth.Importantly, the clinical phenotype of individual patients ishighly variable.
In contrast to this syndromic character of AD HIES, theAR variant is characterized by recurrent viral infections,extreme eosinophilia, and neurological complications,whereas skeletal and dental abnormalities are absent(Renner et al. 2004). Minegishi et al. (2006) recentlyreported the first monogenetic defect in a single patientfrom consanguineous parents with clinical features of ARHIES. The patient had a homozygous defect in the receptor-associated cytoplasmatic tyrosine kinase TYK2, indicating
that some AR HIES cases may be due to a disorder of the Tlymphocyte/IL-12/interferon axis. Even more recently, thesame group has identified mutations in STAT3 in 8 of 18patients with HIES (Minegishi et al. 2007). Our researchconsortium on HIES could confirm this finding (Holland etal. 2007).
Previously, a sporadic HIES patient with an ADphenotype presenting an additional mental retardation wasfound to carry an interstitial deletion of 15–20 cM onchromosome 4q (Grimbacher et al. 1999a). Linkageanalysis of 19 AD HIES families demonstrated linkage tomarkers on chromosome 4. However, six of these 19families did not demonstrate linkage to this region,suggesting genetic heterogeneity (Grimbacher et al. 1999c).
Here, we hypothesized that HIES might be associatedwith a genetic disorder such as a contiguous gene deletionor an amplification of a small chromosomal region. Severalimmunodeficiency syndromes and the 22q11.2 deletionsyndrome or the Williams syndrome were shown to becaused by microdeletions. To investigate, whether sporadicHIES also might be due to genetic alterations such ascontiguous gene deletion, we analyzed a group of 30 HIESpatients for the presence of chromosomal gains and losseson a genome-wide level by using a single nucleotidepolymorphism (SNP) chip approach.
Patients and methods
DNA samples
Thirty sporadic HIES patients were diagnosed according topublished criteria (Grimbacher et al. 1999c). Seventeen ofthese patients originate from Europe, eight from Columbiaand five from Iran. Twenty-five showed HIES scores [6]above 40 and five patients had scores between 20 and 40,indicating that these patients may have a variant of HIES.
The genomic DNA of the patients was extracted fromperipheral blood leukocytes using standard protocols.
Fig. 1 a Copy number profiles from chromosome 20 (left panel) andchromosome 19 (right panel) of patient no. 30 and his first-degreerelatives. Each panel consists of eight subpanels (top down: Father,mother, patient, and five healthy siblings) with the plots of the hiddenMarkov model-derived copy number states. The numbering on the leftgives the copy number states (1 Deletion, 2 normal diploid copynumber, 3 gain). The x-axis shows the physical position (numberingfrom left (p-arm) to right (q-arm) and an ideogram of the respectivechromosome. b Physical map of the 19q13 deletion in patient no. 30.Copy number states from the CNAT test analysis module were loadedinto the USCS Genome browser (http://genome.ucsc.edu/) anddisplayed in the context of genes and known structural variations.The section shown corresponds to the predicted size of the deletion asanalyzed by GEMCA (see Table 1). Note the difference in predicteddeletion size of GEMCA (outer boundaries) and the CNAT program(drop in copy number state from 2 to 1) as well as the overlap with aknown structural variation
b
914 Immunogenetics (2007) 59:913–926

Mother
Father
Patient
Healthy
Siblings
gain 20p12 del 19q13Copy number
state
2
3
2
3
2
3
2
3
2
3
2
3
2
3
Copy number
state
1
2
Chromosome 19
2
3
Chromosome 20
a
b
Immunogenetics (2007) 59:913–926 915

SNP mapping
SNP mapping was performed using Affymetrix 50k XbaI andthe 250k StyI SNP mapping arrays containing probes for thedetection of around 5×10⁴ and 2.38×10⁵ single nucleotidepolymorphisms (SNPs), respectively. Their genome-widedistribution allows for a large-scale genotype and copynumber analysis (Bignell et al. 2004; Huang et al. 2004). Themedian Inter-SNP-distance is 63 kb for the 50k XbaI and5 kb for the 250k StyI SNP array. The two arrays have only6,617 SNPs in common. The SNP mapping assays were per-formed according to the protocol of the manufacturer(Affymetrix; Santa Clara, CA). The mean genotype call rateswere 93.53% for the 50k array and 94.77% for the 250k arrays.
Copy number analysis
Copy number analysis was done by using the Affymetrixcopy number analysis Tool (CNAT 4.1.0.26, Batch analysismodule 1.0.03) for 50k arrays and the GEMCA software(genotyping microarray-based copy number variant (CNV)analysis) for the 250k arrays (Komura et al. 2006; Zhao etal. 2004). The CNAT batch analysis module derives copynumbers by comparing the SNP intensities of the samplearrays against the intensity distribution of a reference set ofmore than 100 individuals of different ethnicity. Copynumber profiles were generated in CNAT using a genomicsmoothing lengths of 0.5 and 0.05 Mb. Copy numberprofiles were then searched for regions with smoothed copynumbers smaller than 1.3 for putative deletions and largerthan 2.9 for putative gains and region with more than eightconsecutive SNPs scored (Pfeifer et al. 2007).
250k StyI arrays were analyzed using GEMCA softwarewith the reference set copy number variation (CNV)analysis option. CNV calling parameters were used asdescribed in Komura et al. (2006). Briefly, signal intensityratio thresholds from at least four SNPs on three restrictionfragments were 1.12 and 0.89 for insertions and deletions,respectively. Significance was met when a p value threshold<0.01 after 5,000 permutations was reached. Only CNVsthat were called in at least 10% of all comparisons werescored. Male and female samples were analyzed separatelyin a pairwise fashion against a reference set consisting of 30male and 20 female samples of different ethnicity (subset ofthe HapMap collection).
For the purpose of visualization (see Fig. 1a), 250k arraydata of selected patients were reanalyzed with the CNATtest analysis module 4.0.1.3 against the same referencesamples used with the GEMCA software. We used thedefault values for the hidden Markov model (HMM)parameters and a genomic smoothing value of 0.1 Mb.The transition decay was set to 10 Mb, and the arraynormalization option was set to median scaling.
Results
In a first set of experiments, we analyzed the samples of 30sporadic HIES patients with 50k SNP arrays for thepresence of overlapping gains or losses. In a subsequentanalysis, 23 of these samples were reanalyzed with 250karrays to improve the resolution of the analysis.
We detected eight different copy number alterations insix of our 30 sporadic patients with a size range from 70 to340 kb (three gains and five deletions) using the lowerresolution 50k arrays, and all eight were confirmed usingthe 250k system. Seven of these eight genetic alterationsoverlapped with one or more copy number polymorphismsthat have been found also in normal individuals [databaseof genomic variants (DGV), Genome Build 35, http://projects.tcag.ca/variation/] (Iafrate et al. 2004) and thusmost likely are not associated with disease. However,patient no. 30 showed a 340-kb gain of the chromosomalregion 20p12 (Physical Position 18,287,493–18,623,480)that matched no entry in the database. In addition to thelack of this CNV in the 270 HapMap individuals(International HapMap Consortium 2005), we did notdetect this gain in a group of 130 chronic lymphocyticleukemia patients of predominantly Caucasian origin(Pfeifer et al. 2007). The patient presented with the typicalphenotype of AD HIES suffering from recurrent pneumoniawith formation of pneumatoceles, several skin abscesses,and severe eczema. Reanalysis of this patient and hishealthy first degree relatives with the 250k SNP chip (seebelow) identified the described gain as a private raregenetic copy number polymorphism that segregates withinthe family according to Mendel (data not shown). Thus,there was no association of this gain with the diseasephenotype (Fig. 1a).
To rule out the possibility that HIES is caused by sub-megabase deletions that have been missed with the 50ksystem, we set out to repeat the analysis with 250k StyIarrays. Due to the limited availability of sample DNA, only23 of the 30 HIES patients were reanalyzed with 250k StyIarrays using improved algorithms for CNV detection(Komura et al. 2006). These algorithms have been recentlyestablished to comprehensively analyze CNVs in 270HapMap samples (Redon et al. 2006). In total, 265 CNVs(mean 11.5 per patient) with a size distribution from 0.63up to 2031 kb (mean 388 kb) were identified in our 23HIES patients by pairwise comparisons to a sex-matchedset of reference samples (Table 1). Of these, 186 had amatch to corresponding entries in DGV or were found inother non-HIES individuals. CNVs that were present in thesamples with a frequency higher than 50% were found onchromosomes 10, 14, 15, 17, and X (Table 1). All theseoverlapped with already known polymorphic regions.Eleven CNVs had matches to entries that were considerably
916 Immunogenetics (2007) 59:913–926
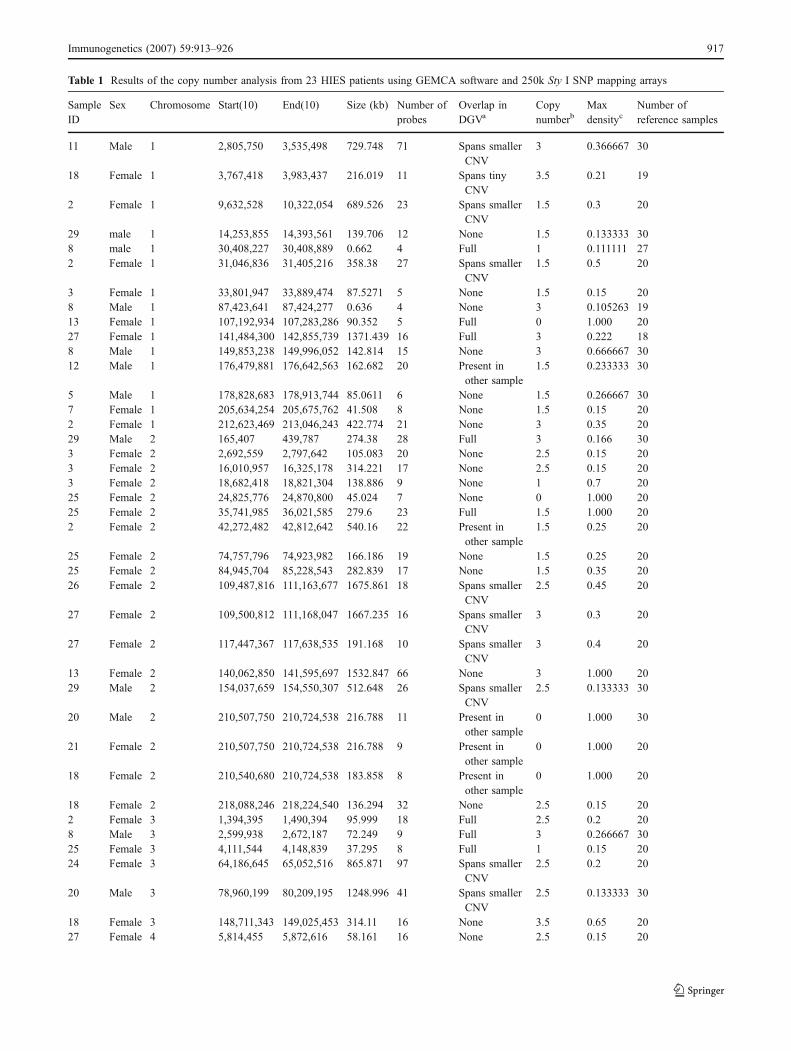
Table 1 Results of the copy number analysis from 23 HIES patients using GEMCA software and 250k Sty I SNP mapping arrays
SampleID
Sex Chromosome Start(10) End(10) Size (kb) Number ofprobes
Overlap inDGVa
Copynumberb
Maxdensityc
Number ofreference samples
11 Male 1 2,805,750 3,535,498 729.748 71 Spans smallerCNV
3 0.366667 30
18 Female 1 3,767,418 3,983,437 216.019 11 Spans tinyCNV
3.5 0.21 19
2 Female 1 9,632,528 10,322,054 689.526 23 Spans smallerCNV
1.5 0.3 20
29 male 1 14,253,855 14,393,561 139.706 12 None 1.5 0.133333 308 male 1 30,408,227 30,408,889 0.662 4 Full 1 0.111111 272 Female 1 31,046,836 31,405,216 358.38 27 Spans smaller
CNV1.5 0.5 20
3 Female 1 33,801,947 33,889,474 87.5271 5 None 1.5 0.15 208 Male 1 87,423,641 87,424,277 0.636 4 None 3 0.105263 1913 Female 1 107,192,934 107,283,286 90.352 5 Full 0 1.000 2027 Female 1 141,484,300 142,855,739 1371.439 16 Full 3 0.222 188 Male 1 149,853,238 149,996,052 142.814 15 None 3 0.666667 3012 Male 1 176,479,881 176,642,563 162.682 20 Present in
other sample1.5 0.233333 30
5 Male 1 178,828,683 178,913,744 85.0611 6 None 1.5 0.266667 307 Female 1 205,634,254 205,675,762 41.508 8 None 1.5 0.15 202 Female 1 212,623,469 213,046,243 422.774 21 None 3 0.35 2029 Male 2 165,407 439,787 274.38 28 Full 3 0.166 303 Female 2 2,692,559 2,797,642 105.083 20 None 2.5 0.15 203 Female 2 16,010,957 16,325,178 314.221 17 None 2.5 0.15 203 Female 2 18,682,418 18,821,304 138.886 9 None 1 0.7 2025 Female 2 24,825,776 24,870,800 45.024 7 None 0 1.000 2025 Female 2 35,741,985 36,021,585 279.6 23 Full 1.5 1.000 202 Female 2 42,272,482 42,812,642 540.16 22 Present in
other sample1.5 0.25 20
25 Female 2 74,757,796 74,923,982 166.186 19 None 1.5 0.25 2025 Female 2 84,945,704 85,228,543 282.839 17 None 1.5 0.35 2026 Female 2 109,487,816 111,163,677 1675.861 18 Spans smaller
CNV2.5 0.45 20
27 Female 2 109,500,812 111,168,047 1667.235 16 Spans smallerCNV
3 0.3 20
27 Female 2 117,447,367 117,638,535 191.168 10 Spans smallerCNV
3 0.4 20
13 Female 2 140,062,850 141,595,697 1532.847 66 None 3 1.000 2029 Male 2 154,037,659 154,550,307 512.648 26 Spans smaller
CNV2.5 0.133333 30
20 Male 2 210,507,750 210,724,538 216.788 11 Present inother sample
0 1.000 30
21 Female 2 210,507,750 210,724,538 216.788 9 Present inother sample
0 1.000 20
18 Female 2 210,540,680 210,724,538 183.858 8 Present inother sample
0 1.000 20
18 Female 2 218,088,246 218,224,540 136.294 32 None 2.5 0.15 202 Female 3 1,394,395 1,490,394 95.999 18 Full 2.5 0.2 208 Male 3 2,599,938 2,672,187 72.249 9 Full 3 0.266667 3025 Female 3 4,111,544 4,148,839 37.295 8 Full 1 0.15 2024 Female 3 64,186,645 65,052,516 865.871 97 Spans smaller
CNV2.5 0.2 20
20 Male 3 78,960,199 80,209,195 1248.996 41 Spans smallerCNV
2.5 0.133333 30
18 Female 3 148,711,343 149,025,453 314.11 16 None 3.5 0.65 2027 Female 4 5,814,455 5,872,616 58.161 16 None 2.5 0.15 20
Immunogenetics (2007) 59:913–926 917

Table 1 (continued)
SampleID
Sex Chromosome Start(10) End(10) Size (kb) Number ofprobes
Overlap inDGVa
Copynumberb
Maxdensityc
Number ofreference samples
22 Female 4 5,814,455 5,867,334 52.879 15 None 2.5 0.15 2025 Female 4 5,814,455 5,872,616 58.161 16 None 3 0.15 202 Female 4 9,780,939 9,868,377 87.438 44 Full 2.5 0.4 203 Female 4 136,638,092 137,360,314 722.222 25 None 2.5 0.15 209 Male 4 144,981,932 145,350,927 368.995 21 Full 1.5 0.241379 298 Male 4 156,264,761 156,280,635 15.874 5 None 1 0.166667 3024 Female 4 180,926,303 181,681,796 755.493 50 Spans smaller
CNV2.5 0.15 20
2 Female 4 182,774,844 183,128,673 353.829 41 Present inother sample
3 0.35 20
12 Male 4 182,865,323 183,128,376 263.053 33 Present inother sample
2.5 0.56 25
22 Female 4 182,865,323 183,177,854 312.531 37 Present inother sample
2.5 0.15 20
12 Male 5 672,333 875,123 202.79 11 Full 1.5 0.166667 188 Male 5 752,190 916,797 164.607 8 Full 1.5 0.111111 1826 Female 5 55,547,151 55,601,032 53.881 13 None 1 0.95 208 Male 5 177,806,609 177,897,050 90.441 14 None 3 0.533333 305 Male 6 166,146 329,546 163.4 10 Full 1.5 0.111111 1812 Male 6 214,735 332,659 117.924 10 Full 1.5 0.111111 183 Female 6 29,984,938 30,006,876 21.938 4 Full 0 1.000 142 Female 6 30,559,883 30,895,154 335.271 44 Spans smaller
CNV1.5 0.5 20
7 Female 6 31,222,314 31,284,581 62.267 13 Full 3 0.15 2026 Female 6 32,325,070 32,889,532 564.462 87 Present in
other sample1.5 0.15 20
22 Female 6 32,443,325 32,867,275 423.95 58 Present inother sample
1.5 0.15 20
29 Male 6 32,504,484 32,792,007 287.523 29 Present inother sample
1.5 0.133333 30
27 Female 6 84,483,165 84,684,198 201.033 12 None 3 0.15 2026 Female 6 92,001,319 92,378,064 376.745 18 Spans smaller
CNV2.5 0.15 20
18 Female 6 168,057,168 168,414,475 357.307 19 Full 3 0.4 2023 Female 7 35,382,544 35,875,899 493.355 24 Spans smaller
CNV1.5 0.3 20
8 Male 7 38,096,725 38,131,968 35.243 10 Full 1.5 0.933333 3012 Male 7 38,096,725 38,176,607 79.882 12 Full 1 0.7 3030 Male 7 38,096,725 38,176,607 79.882 11 Full 1 0.2 3025 Female 7 53,249,866 53,361,989 112.123 11 Spans smaller
CNV1 0.95 20
14 Male 7 83,318,167 84,089,522 771.355 25 None 3 0.166 309 Male 7 100,656,922 101,084,080 427.158 21 Spans smaller
CNV1.5 0.333333 30
30 Male 7 141,607,918 141,962,328 354.41 46 Full 1.5 0.551724 2912 Male 7 141,607,918 142,075,187 467.269 48 Full 1.5 0.241379 2918 Female 8 3,657,789 3,863,869 206.08 47 Full 3 0.15 208 Male 8 12,039,387 12,537,556 498.169 6 Full 3 0.347826 239 Male 8 18,136,585 18,287,748 151.163 19 Spans smaller
CNV1.5 0.2 30
9 Male 8 75,135,676 75,247,824 112.148 16 None 1 0.2 309 Male 8 96,342,431 96,547,939 205.508 26 Spans smaller
CNV1.5 0.433333 30
3 Female 8 143,020,060 143,188,118 168.058 18 None 2.5 0.2 20
918 Immunogenetics (2007) 59:913–926

Table 1 (continued)
SampleID
Sex Chromosome Start(10) End(10) Size (kb) Number ofprobes
Overlap inDGVa
Copynumberb
Maxdensityc
Number ofreference samples
9 Male 9 293,727 679,340 385.613 55 Spans smallerCNV
0 2.000 30
10 Male 9 1,534,755 1,673,781 139.026 31 None 3 0.166 303 Female 9 484,9872 581,8435 968.563 87 Spans smaller
CNV1.5 0.105263 19
22 Female 9 4,943,916 5,858,289 914.373 68 Spans smallerCNV
1.5 0.157895 19
26 Female 9 129,708,231 129,757,016 48.785 10 None 1.5 0.2 2026 Female 10 2,312,896 2,347,121 34.225 12 None 1 0.25 2026 Female 10 3,450,926 3,576,724 125.798 19 None 1.5 0.25 202 Female 10 11,742,195 12,455,154 712.959 60 None 1.5 0.45 207 Female 10 27,642,965 27,746,607 103.642 7 None 1 0.5 203 Female 10 42,799,941 42,914,459 114.518 17 Spans smaller
CNV2.5 0.15 20
26 Female 10 44,446,980 44,729,250 282.27 37 Spans smallerCNV
3 1.000 19
27 Female 10 45,367,462 47,212,082 1844.62 35 Full 3 1.000 1429 Male 10 45,367,462 47,212,082 1844.62 33 Full 3 1.000 177 Female 10 45,536,421 47,212,082 1675.661 29 Full 3 1.000 1430 Male 10 47,063,957 48,062,084 998.127 26 Full 3 0.588 173 Female 10 47,063,957 47,143,807 79.85 15 Full 1.5 1.000 147 Female 10 55,623,019 55,801,795 178.776 12 None 3 0.2 203 Female 10 59,385,719 59,510,689 124.97 19 Spans smaller
CNV2.5 0.105263 19
2 Female 10 69,516,802 70,685,976 1169.174 84 Spans smallerCNV
1.5 0.45 20
13 Female 10 72,380,953 72,389,048 8.095 6 Present inother sample
0 1.000 20
11 Male 10 72,384,286 72,389,048 4.762 6 Present inother sample
0 1.000 30
23 Female 10 75,631,142 76,238,780 607.638 18 None 1.5 0.55 209 Male 10 89,908,985 90,176,103 267.118 18 None 1.5 0.166667 309 Male 10 104,234,129 104,360,652 126.523 16 None 1.5 0.133333 3026 Female 10 111,933,510 112,062,492 128.982 11 None 1.5 0.105263 1914 Male 10 115,688,018 115,727,353 39.335 16 None 1.5 0.333333 3026 Female 10 123,421,836 123,484,634 62.798 13 Spans smaller
CNV1 1.000 20
2 Female 10 131,457,178 131,615,303 158.125 25 Spans smallerCNV
3 0.15 20
29 Male 10 134,598,099 135,262,316 664.217 36 Full 3 0.24 255 Male 10 135,240,018 135,323,432 83.414 14 Full 3 0.4 2512 Male 11 8,780,964 8,922,274 141.31 20 Full 1.5 0.2 3018 Female 11 12,250,939 12,461,900 210.961 25 None 2.5 0.263158 1910 Male 11 12,804,409 12,859,638 55.229 13 None 3 0.133 302 Female 11 19,373,059 19,407,469 34.41 10 None 3 0.15 2027 Female 11 48,535,899 49,371,138 835.239 20 Full 3.5 1.000 203 Female 11 61,752,884 61,775,118 22.234 13 None 1.5 0.15 2026 Female 11 78,401,192 78,462,343 61.151 17 None 3 0.2 202 Female 11 85,150,896 85,483,910 333.014 29 Spans smaller
CNV1.5 0.15 20
10 Male 11 91,431,323 91,687,315 255.992 47 Present inother sample
3 0.133 30
12 Male 11 91,510,546 91,648,752 138.206 25 Present inother sample
2.5 0.166667 30
Immunogenetics (2007) 59:913–926 919

Table 1 (continued)
SampleID
Sex Chromosome Start(10) End(10) Size (kb) Number ofprobes
Overlap inDGVa
Copynumberb
Maxdensityc
Number ofreference samples
9 Male 11 91,563,799 91,769,195 205.396 28 Present inother sample
3 0.2 30
9 Male 11 101,064,226 101,174,095 109.869 17 None 1 0.166667 3022 Female 11 120,642,125 120,839,820 197.695 27 None 1.5 0.15 2029 Male 11 133,714,118 134,090,011 375.893 59 Full 3 0.481481 2711 Male 11 133,821,432 134,106,222 284.79 46 Full 2.5 0.37037 2726 Female 11 133,861,143 134,157,118 295.975 52 Full 3 0.3 203 Female 11 133,917,124 134,168,536 251.412 46 Full 3 0.2 209 Male 12 1,147,724 1,620,858 473.134 37 Spans tiny
CNV1.5 0.5 30
11 Male 12 3,780,453 4,035,827 255.374 27 Spans tinyCNV
1.5 0.566667 30
2 Female 12 7,662,831 8,034,750 371.919 19 Full 1.5 0.15 2014 Male 12 17,942,983 19,107,310 1164.327 51 Spans smaller
CNV2.5 0.133333 30
18 Female 12 18,524,861 18,917,349 392.488 23 Spans smallerCNV
3 0.2 20
18 Female 12 33,480,710 34,651,598 1170.888 38 Full 2.5 0.470588 1714 Male 12 34,198,126 34,651,598 453.472 15 Full 3 0.269 2614 Male 12 36,177,141 36,252,574 75.433 4 Full 2.5 0.241 2918 Female 12 36,177,141 36,846,337 669.196 12 Full 3 0.45 207 Female 12 36,177,141 36,846,337 669.196 12 Full 3 0.35 205 Male 12 36,177,141 36,252,574 75.433 4 Full 3 0.206897 2914 Male 12 88,142,416 88,798,361 655.945 42 Present in
other sample1.5 0.133333 30
9 Male 12 90,240,906 90,619,246 378.34 22 None 1.5 0.2 302 Female 12 121,153,309 121,870,227 716.918 26 Spans tiny
CNV1.5 0.35 20
13 Female 12 123,690,926 123,725,895 34.969 4 None 0 1.000 2020 Male 13 20,765,759 21,246,173 480.414 42 Spans smaller
CNV1.5 0.266667 30
27 Female 13 36,748,678 36,843,045 94.367 14 None 3 0.15 2029 Male 13 37,125,748 37,280,809 155.061 16 None 3 0.5 309 Male 13 48,418,971 49,449,079 1030.108 41 Present in
other sample1.5 0.166667 30
10 Male 13 104,929,618 105,237,575 307.957 27 Present inother sample
3 0.133 30
23 Female 13 104,929,618 105,423,049 493.431 37 Present inother sample
2.5 0.2 20
1 Male 14 19,272,965 19,595,673 322.708 14 Full 3.5 0.777 93 Female 14 19,272,965 19,595,673 322.708 14 Full 1.5 0.272727 1112 Male 14 19,272,965 19,492,423 219.458 10 Full 1.5 0.111111 92 Female 14 19,272,965 19,492,423 219.458 10 Full 1.5 0.454545 1118 Female 14 20,863,076 21,462,988 599.912 44 Spans smaller
CNV1.5 0.3 20
12 Male 14 21,108,365 22,099,182 990.817 103 Full 1.5 1.000 3022 Female 14 21,118,254 22,048,615 930.361 94 Full 1.5 1.000 2030 Male 14 21,118,254 22,058,411 940.157 90 Full 1 1.000 303 Female 14 21,438,691 22,058,411 619.72 73 Full 1.5 1.000 201 Male 14 21,551,291 22,039,606 488.315 54 Full 1.5 1.000 307 Female 14 21,551,291 22,058,411 507.12 59 Full 1.5 1.000 208 Male 14 21,551,291 22,047,089 495.798 52 Full 1.5 1.000 302 Female 14 21,567,040 22,099,182 532.142 68 Full 1.5 0.45 205 Male 14 21,607,217 22,058,411 451.194 48 Full 1.5 1.000 30
920 Immunogenetics (2007) 59:913–926

Table 1 (continued)
SampleID
Sex Chromosome Start(10) End(10) Size (kb) Number ofprobes
Overlap inDGVa
Copynumberb
Maxdensityc
Number ofreference samples
2 Female 14 25,238,076 25,626,474 388.398 21 Spans smallerCNV
2.5 0.15 20
1 Male 14 69,679,669 69,776,988 97.319 20 None 1.5 0.133333 309 Male 14 72,826,658 73,465,699 639.041 33 Present in
other sample1.5 0.433333 30
10 Male 14 72,867,422 73,418,572 551.15 29 Present inother sample
1.5 0.133333 30
30 Male 14 73,006,350 73,418,572 412.222 30 Present inother sample
1.5 0.366667 30
22 Female 14 73,006,350 73,384,916 378.566 26 Present inother sample
1.5 0.105263 19
2 Female 14 73,024,250 73,511,098 486.848 40 Present inother sample
1.5 0.736842 19
2 Female 14 78,544,014 78,672,810 128.796 17 None 2.5 0.15 2026 Female 14 91,606,712 91,714,385 107.673 15 None 1.5 0.15 207 Female 14 91,606,712 91,740,938 134.226 23 None 1.5 0.15 202 Female 14 91,606,712 91,740,938 134.226 23 None 1.5 0.25 2027 Female 14 91,610,714 91,739,589 128.875 17 None 1.5 0.45 2027 Female 14 105,021,165 105,746,660 725.495 10 Full 4 0.166 128 Male 14 105,149,735 106,142,730 992.995 14 Full 3 0.642857 148 Male 15 18,451,755 19,403,149 951.394 15 Full 2.5 0.111111 927 Female 15 18,451,755 19,403,149 951.394 16 Full 2.5 0.2 55 Male 15 18,451,755 19,831,810 1380.055 19 Full 1 1.000 926 Female 15 18,682,601 20,077,554 1394.953 30 Full 1.5 0.8 518 Female 15 18,753,439 20,688,804 1935.365 41 Full 1.5 1.000 523 Female 15 18,753,439 20,042,468 1289.029 25 Full 1.5 0.4 521 Female 15 18,809,644 19464910 655.266 12 Full 1.5 0.2 53 Female 15 18,872,928 20,077,554 1204.626 26 Full 1.5 1.000 530 Male 15 19,464,910 20,077,554 612.644 18 Full 3.5 0.777 98 Male 15 19,856,526 20,343,286 486.76 13 Full 2.5 0.222222 93 Female 15 21,942,075 22,098,514 156.439 11 Full 1 0.2 2011 Male 15 24,989,155 25,039,127 49.972 4 Spans smaller
CNV0 1.000 30
9 Male 15 49,779,718 49,962,828 183.11 20 None 1.5 0.2 303 Female 15 65,060,001 65,083,692 23.691 9 Spans smaller
CNV1.5 0.15 20
9 Male 15 83,864,137 84,060,543 196.406 28 Present inother sample
1 0.266667 30
27 Female 15 85,587,147 85,670,812 83.665 9 None 1 1.000 2026 Female 16 3,392,194 3,629,679 237.485 11 None 1.5 0.4 209 Male 16 11,442,884 11,719,576 276.692 27 None 1.5 0.166667 303 Female 16 22,297,762 22,773,865 476.103 24 Full 1 0.533333 1527 Female 16 28,457,009 29,066,936 609.927 14 Full 1 0.9 2027 Female 16 34,246,988 34,614,572 367.584 18 Full 3 0.312 167 Female 16 34,246,988 34,614,572 367.584 18 Full 3 0.25 1626 Female 16 64,339,519 64,371,857 32.338 12 None 1 0.15 2023 Female 16 64,339,519 64,371,857 32.338 12 None 1.5 0.15 2018 Female 16 82,335,439 82,342,649 7.21 13 Spans smaller
CNV1 0.368421 19
29 Male 17 3,461,651 3,827,102 365.451 30 Full 1.5 0.241379 298 Male 17 21,242,033 21,657,532 415.499 15 Full 3 0.758621 2926 Female 17 27,963,258 28,214,729 251.471 14 Present in
other sample1.5 0.15 20
9 Male 17 31,416,126 32,076,780 660.654 27 Full 1.5 0.5 827 Female 17 31,454,449 31,895,171 440.722 12 Full 3.5 0.75 4
Immunogenetics (2007) 59:913–926 921

Table 1 (continued)
SampleID
Sex Chromosome Start(10) End(10) Size (kb) Number ofprobes
Overlap inDGVa
Copynumberb
Maxdensityc
Number ofreference samples
8 Male 17 31,454,563 31,488,153 33.59 9 Full 1.5 0.5 81 Male 17 31,463,252 31,488,153 24.901 8 Full 1.5 0.125 821 Female 17 40,504,036 41,090,087 586.051 37 Present in
other sample1.5 0.125 8
24 Female 17 40,564,152 41,112,752 548.6 31 Present inother sample
1 1.000 8
18 Female 17 40,825,939 41,109,882 283.943 21 Present inother sample
1 0.625 8
25 Female 17 41,006,823 41,022,689 15.866 9 Full 3 0.125 88 Male 17 41,007,016 41,049,321 42.305 8 Full 4 0.9 205 Male 17 41,007,016 41,049,321 42.305 9 Full 4 0.35 203 Female 17 41,426,926 41,569,489 142.563 26 Full 1.5 0.384615 1326 Female 17 41,476,292 41,618,727 142.435 26 Full 1.5 0.230769 1325 Female 17 41,500,209 41,711,411 211.202 35 Full 3 1.000 135 Male 17 41,522,318 41,711,411 189.093 34 Full 4 1.000 268 Male 17 41,522,318 41,711,411 189.093 34 Full 1.5 1.000 2629 Male 17 41,522,318 41,708,649 186.331 31 Full 4 0.615385 267 Female 17 41,522,318 41,644,356 122.038 26 Full 1.5 0.769231 1322 Female 17 41,522,318 41,630,337 108.019 27 Full 1.5 0.538462 1310 Male 17 41,522,422 42,223,353 700.931 36 Full 3 0.615 261 Male 17 41,522,422 42,151,961 629.539 33 Full 3.5 1.000 2623 Female 17 41,522,422 41,711,411 188.989 32 Full 3 1.000 1327 Female 17 41,560,151 42,166,078 605.927 34 Full 3.5 1.000 1313 Female 17 41,589,553 41,711,411 121.858 22 Full 3 0.23 133 Female 17 57,141,121 57,545,412 404.291 13 Spans tiny
CNV1.5 0.15 20
12 Male 18 9,636,198 9,737,630 101.432 12 Spans smallerCNV
1.5 0.133333 30
10 Male 18 29,023,519 29,459,187 435.668 18 Spans tinyCNV
3 0.6 30
27 Female 18 64,881,549 64,922,370 40.821 8 Spans smallerCNV
1 0.277778 18
2 Female 19 9,063,085 9,204,855 141.77 14 Spans tinyCNV
1.5 0.35 20
2 Female 19 11,088,326 12,964,638 1876.312 82 Spans tinyCNV
1.5 0.25 20
3 Female 19 11,625,040 12,157,284 532.244 31 Spans tinyCNV
1.5 0.2 20
26 Female 19 15,564,927 15,616,442 51.515 13 None 1.5 0.15 2011 Male 19 16,002,989 16,839,008 836.019 37 Spans tiny
CNV1.5 0.133333 30
30 Male 19 36,930,988 38,962,919 2031.931 178 Spans smallerCNV
1.5 1.000 30
2 Female 19 47,932,219 48,461,673 529.454 19 Full 3 0.272727 1125 Female 19 49,671,550 49,867,156 195.606 16 Spans smaller
CNV1.5 0.25 20
30 Male 20 18,061,486 18,383,181 321.695 31 Present inother sample
2.5 0.166667 30
30 Male 20 18,563,063 18,677,271 114.208 20 Present inother sample
3 0.8 30
9 Male 20 22,608,020 22,675,548 67.528 12 Spans smallerCNV
2.5 0.166667 30
24 Female 20 44,174,860 45,061,166 886.306 69 Spans smallerCNV
1.5 0.2 20
21 Female 20 46,968,668 47,464,220 495.552 40 None 1.5 0.15 20
922 Immunogenetics (2007) 59:913–926

smaller than the size of the predicted region in the HIESsamples, leaving 69 regions that were not present in DGV,presenting as either novel CNVs or false-positives.
The great majority of these CNVs with no match in thedatabase were so-called singletons (Redon et al. 2006) thatwere found only in one sample. A rather small CNV onchromosome 16 was present in two samples but does notspan any known genes and is thus unlikely to beresponsible for the HIES phenotype.
Additional CNVs on chromosome 4 and 14 were foundin three and four patients, respectively. The gain onchromosome 4 contains only one known gene (EVC) whichis associated with the Ellis van Creveld syndrome. Thedeletion on 14q32.12 however, spans three genes (ATXN3,NDUFB1, and CPSF2). So, we were interested if this
heterozygous deletion which was observed in patient nos.2, 7, 26, and 27 may cause the HIES phenotype in thesefour individuals. At that time, our research consortium onHIES had just found mutations in exons 11–21 in STAT3being responsible for HIES (Holland et al. 2007). Wetherefore sequenced exons 11–21 in these patients andfound STAT3 mutations in three of them (nos. 7, 26, and27). Hence, the heterozygous deletion on the chromosomeis not causing HIES in these four patients.
We screened the remaining singleton CNVs for overlapswith regions that have been associated with HIES likechromosome 4q around D4S428 region (Grimbacher et al.1999c) or the TYK2 locus on 19p13.2 but did not identifyoverlapping CNVs. In addition, regions that are associatedwith diseases that show a phenotypic resemblance to HIES
Table 1 (continued)
SampleID
Sex Chromosome Start(10) End(10) Size (kb) Number ofprobes
Overlap inDGVa
Copynumberb
Maxdensityc
Number ofreference samples
9 Male 20 47,552,837 47,880,560 327.723 30 None 1.5 0.2 307 Female 20 58,879,012 58,928,466 49.454 9 None 3.5 0.35 2026 Female 20 62,301,246 62,374,173 72.927 12 Full 3 0.15 209 Male 21 25,557,670 25,841,440 283.77 18 None 1.5 0.266667 3011 Male 21 32,533,765 33,141,602 607.837 34 Spans tiny
CNV1.5 0.133333 30
27 Female 22 15,252,977 15,549,842 296.865 13 Full 3 0.411765 173 Female 22 16,800,853 17,279,671 478.818 42 Spans smaller
CNV3 1.000 19
26 Female 22 23,983,115 24,244,331 261.216 26 Full 3 1.000 183 Female 22 35,044,924 35,447,115 402.191 43 Spans smaller
CNV1.5 0.45 20
11 Male X 2,673,310 2,687,601 14.291 6 Full 1.5 0.416667 1224 Female X 2,673,310 2,682,320 9.01 6 Full 1.5 0.636364 111 Male X 2,673,310 2,682,320 9.01 6 Full 1 0.75 1214 Male X 2,673,310 2,687,601 14.291 8 Full 1.5 0.5 122 Female X 2,682,320 2,687,601 5.281 4 Full 1.5 0.545455 1112 Male X 2,682,320 2,687,601 5.281 4 Full 1.5 0.166667 1229 Male X 2,682,320 2,687,601 5.281 4 Full 1 0.583333 1214 Male X 3,872,433 4,015,795 143.362 12 Spans smaller
CNV2 0.166 30
24 Female X 5,519,920 6,450,497 930.577 31 Spans smallerCNV
1.5 0.105263 19
22 Female X 11,348,425 11,904,509 556.084 26 Spans tinyCNV
1.5 0.25 20
2 Female X 51,210,792 51,663,987 453.195 8 None 4 0.2 2012 Male X 125,728,657 126,183,384 454.727 11 None 4 0.3 30
Columns “start(10)” and “end(10)” indicate the 10% density CNV borders and “Number of probes (10)” is the number of markers within the 10%density border. The SNPs at the border of the polymorphic region has retained 10% of the maximum density, which is defined as the largestdensity value for any SNP in that CNV region after comparison with the diploid reference samples. “Density” is defined as the fraction of timesthat the region is called as a CNV when compared with reference samples.a Overlap in DGV: spans smaller CNV (predicted CNV is larger than the region in DGV); spans tiny CNV (the CNV in DGV is less than a third insize then the predicted CNV); present in other sample (was found in normal individuals or CLL samples but so far not present in DGV)b Copy numbers in the GEMCA output were ordered in bins according to threshold values of the median ratios derived from hybridizations ofsamples with varying number of X chromosomes(1–5) to samples with 2 X chromosomes (see supplementary data to Komura et al. at www.genome.org for a table with copy numbers and the corresponding median ratio threshold values). Decimal numbers reflect less certain copynumbers.cMax density: a max density of 1 would indicate that in all pairwise comparisons against the reference set, the region was called a CNV.
Immunogenetics (2007) 59:913–926 923

were also aligned with the predicted CNVs from Table 1.Webb et al. (2007) performed a quantitative linkagegenome scan for atopy in 690 independent Caucasianfamilies, using serum IgE levels and percentage of positiveskin prick test (SPT) as clinical discriminators and foundLOD scores >2 for regions on chromosomes 1, 3, and 8qnear markers D1S1653 (position chromosome 1:154,745,744 bp), D3S2322 (position chromosome 3:134,168,906 bp), D3S1764 (position chromosome 3:140,670,986), and D8S2324, respectively. As indicated inTable 1, no CNV could be found near the markers onchromosomes 1 and 3, but we identified a deletion 750 kbtelomeric to marker D8S2324 in patient no. 9. This 112-kbdeletion starts around 32 kb on the telomeric side of theLY96 gene (physical position chromosome 8: 75,135,676–75,247,824 bp) and spans three ESTs. In the atopy linkagestudy by Webb et al., the 5q region (known to be associatedwith atopy) gave a LOD score of 1.96 (SPT) and 1.77 (IgE)at or near marker D5S1480 (position chromosome 5:144,123,841 bp). In our HIES cohort, however, no CNVcould be detected nearby marker D5S1480, as the closestCNV is more than 30 Mb telomeric to marker D5S1480.
Prolidase deficiency (PD, OMIM no. 170100) overlapsphenotypically with HIES in symptoms like elevated IgEand chronic infections and skin lesions. This autosomalrecessive disease is caused by homozygous mutations in thePEPD gene on 19q13.11. We found a large deletion of2,031 kb in patient no. 30 that is not present in his first-degree relatives (Fig. 1a,b). Sequencing of the patientsgenomic DNA, however, revealed a wild-type sequence,thus ruling out a compound heterozygote PEPD mutation.
In summary, with both 50k and 250k arrays, no recurrentmicrodeletions in a larger fraction of our samples could beidentified, which makes it unlikely that HIES is a micro-deletion syndrome. Nevertheless, sporadic AD HIESpatients could present with nonrecurrent gains or losses aspart of a mutational spectrum.
Discussion
Several clinically defined syndromes, such as the 22q11.2deletion syndrome (also known as DiGeorge/velo-cardio-facial syndrome) (Wurdak et al. 2006); the Williamssyndrome, caused by hemizygous microdeletion of about28 genes on chromosome 7q11.23 (Meyer-Lindenberg et al.2006) and the Smith–Magenis syndrome, are mostly causedby interstitial deletions that may not be detected by high-resolution karyotyping. Recently, Girirajan et al. (2006)described that the severity and the variability of the clinicalfeatures of patients affected by Smith–Magenis syndromedepend on the deleted region.
In the present study, we have chosen a 50k XbaIfollowed by a 250k StyI SNP mapping array approach todetect possible chromosomal deletions or gains associatedwith the pathogenesis of the HIES in 30 patients with anHIES phenotype. Using the 50k XbaI array, no largeaberrations could be detected using a genomic smoothinglength of 0.5 Mb in CNAT. With a setting of 0.05 Mb, eightdifferent copy number alterations below 1 Mb wereidentified in six patients using stringent criteria (seePatients and methods section). As seven of these alterationswere also found in healthy individuals, an impact of theseon the evolvement of HIES is highly unlikely.
The gain on chromosome 20p12, which we identified in1 of the 30 patients, was not found in more than 400 controlsamples. However, this gain turned out to be an incidentalprivate polymorphism with a perfect segregation in thepatient’s family (Fig. 1a).
The lack of large recurrent aberrations led us to switch tothe higher resolution 250k StyI array. With an improvedalgorithm for the detection of copy number variations, amean number of 11.5 CNVs per individual has been foundin our HIES cohort, which is in line with the finding ofRedon et al. (2006) who described a mean of 24 CNVs perindividual in the HapMap samples with 500k arrayresolution (both NspI and StyI arrays). The median inter-SNP-distance of the 250 k array is 5 kb. GEMCA identifiedknown CNVs with just four SNPs. Thus, in theory, a 20-kbdeletion should be identified by GEMCA. As shown inTable 1, GEMCA predicted CNVs as small as 600 bp withonly four SNPs, and some of them were already known tobe polymorphic. However, albeit their huge number, SNPsare not evenly spaced, and one cannot completely rule outthe possibility that smaller deletions have been missed.
Around 52% of the predicted CNVs were found tooverlap with known entries in DGV or CNVs in non-HIESsamples, and 21% spanned known CNVs to a varyingdegree, making them thus more likely to be extendedversions of the known polymorphic regions. The remaining69 CNVs with no match in DGV constitute a pool ofpotential CNVs that are either rare polymorphisms, false-positives or disease-associated regions. The huge number ofthese gains and losses makes it difficult to discern the truenature of the predicted region. We thus concentrated first onrecurrent CNVs. The gain of chromosome 4 in threepatients is unlikely to be associated with HIES as theunderlying gene is associated with Ellis van CreveldSyndrome (OMIM no. 225500) and Weyers acrofacialdysostosis (OMIM no. 193530).
In addition, we have screened singleton CNVs forpotential overlaps to regions that have been associated withHIES. We have identified a deletion 750-kb telomeric to themarker D8S2324 on chromosome 8 in one HIES patient.This marker had a LOD score of 2.25 for IgE in the study
924 Immunogenetics (2007) 59:913–926

of Webb et al. (2007) describing linkage of severalchromosomal regions to atopy and asthma in a largecollection of Caucasian families. Although this deletiondoes not span a known gene, it could be worthwhile tofurther analyze this CNV, as it is close to the LY96 genewhich cooperates with TLR4 in the innate immune responseto bacterial lipopolysaccharide (LPS), and with TLR2 in theresponse to cell wall components from Gram-positive andGram-negative bacteria.
The large deletion including the PEPD locus on19q13.11 could merely present an extended version of aCNV present in non-HIES samples, as it spans smallerentries in DGV. Given the overlap in the phenotypicspectrum of HIES and prolidase deficiency, this patientcould be compound heterozygote with the deletion being onone allele and a so far unknown mutation in PEPD on thesecond allele.
However, this was ruled out by direct sequencing of thePEPD gene where no pathogenic mutation could beidentified. Although the PEPD gene was a strong candidatein this region, the deletion removes several other geneswhich may be further analyzed regarding their potentialcontribution to the HIES phenotype.
In summary, we have screened a cohort of 30 sporadicpatients with a typical phenotype of AD HIES forsubmicroscopic insertions or deletions. Using 50k and250k SNP mapping arrays, we were able to rule out thepresence of overlapping deletions in these patients, makingit unlikely that a common microdeletion, such as seen in the22q11.2 deletion and other syndromes, accounts for themajority of cases with HIES. In addition, Minegishi et al,and Holland et al. described mutations in STAT3 in patientswith HIES, while this manuscript was under review. We arecurrently analyzing which of our patients carry mutations inSTAT3.
Nevertheless, this project has identified numerous novelCNVs. Some of them may be further analyzed to verify orfalsify their contribution to the HIES phenotype in selectedsporadic patients with an HIES-like phenotype.
Acknowledgments We thank the patients and their families and Dr. U.Salzer for his help, advice, and the critical reading of the manuscript.
Funding The work was supported by the Deutsche Forschungsge-meinschaft (DFG) grant GR 1617/3–3.
References
Bignell GR, Huang J, Greshock J, Watt S, Butler A, West S,Grigorova M, Jones KW, Wei W, Stratton MR, Futreal PA,Weber B, Shapero MH, Wooster R (2004) High-resolutionanalysis of DNA copy number using oligonucleotide micro-arrays. Genome Res 14:287–295
International HapMap Consortium (2005) A haplotype map of thehuman genome. Nature 437:1299–1320
Girirajan S, Vlangos CN, Szomju BB, Edelman E, Trevors CD,Dupuis L, Nezarati M, Bunyan DJ, Elsea SH (2006) Genotype–phenotype correlation in Smith-Magenis syndrome: evidence thatmultiple genes in 17p11.2 contribute to the clinical spectrum.Genet Med 8:417–427
Grimbacher B, Dutra AS, Holland SM, Fischer RE, Pao M, Gallin JI,Puck JM (1999a) Analphoid marker chromosome in a patientwith hyper-IgE syndrome, autism, and mild mental retardation.Genet Med 1:213–218
Grimbacher B Holland SM, Gallin JI, Greenberg F, Hill SC, MalechHL, Miller JA, O’Connell AC, Puck JM (1999b) Hyper-IgEsyndrome with recurrent infections–an autosomal dominantmultisystem disorder. N Engl J Med 340:692–702
Grimbacher B, Schaffer AA, Holland SM, Davis J, Gallin JI, MalechHL, Atkinson TP, Belohradsky BH, Buckley RH, Cossu F,Espanol T, Garty BZ, Matamoros N, Myers LA, Nelson RP, OchsHD, Renner ED, Wellinghausen N, Puck JM (1999c) Geneticlinkage of hyper-IgE syndrome to chromosome 4. Am J HumGenet 65:735–744
Grimbacher B, Holland SM, Puck JM (2005) Hyper-IgE syndromes.Immunol Rev 203:244–250
Holland SM, Deleo FR, Elloumi HZ, Hsu AP, Uzel G, Brodsky N,Freeman AF, Demidowich A, Davis J, Turner ML, Anderson VL,Darnell DN, Welch PA, Kuhns DB, Frucht DM, Malech HL,Gallin JI, Kobayashi SD, Whitney AR, Voyich JM, Musser JM,Woellner C, Schaffer AA, Puck JM, Grimbacher B (2007)STAT3 mutations in the hyper-IgE syndrome. N Engl J Med357:1608–1619
Huang J, Wei W, Zhang J, Liu G, Bignell GR, Stratton MR, FutrealPA, Wooster R, Jones KW, Shapero MH (2004) Whole genomeDNA copy number changes identified by high density oligonu-cleotide arrays. Hum Genomics 1:287–299
Iafrate AJ, Feuk L, Rivera MN, Listewnik ML, Donahoe PK, Qi Y,Scherer SW, Lee C (2004) Detection of large-scale variation inthe human genome. Nat Genet 36:949–951
Komura D, Shen F, Ishikawa S, Fitch KR, Chen W, Zhang J, Liu G,Ihara S, Nakamura H, Hurles ME, Lee C, Scherer SW, JonesKW, Shapero MH, Huang J, Aburatani H (2006) Genome-widedetection of human copy number variations using high-densityDNA oligonucleotide arrays. Genome Res 16:1575–1584
Meyer-Lindenberg A,Mervis CB, Berman KF (2006) Neural mechanismsin Williams syndrome: a unique window to genetic influences oncognition and behaviour. Nat Rev Neurosci 7:380–393
Minegishi Y, Saito M, Morio T, Watanabe K, Agematsu K, TsuchiyaS, Takada H, Hara T, Kawamura N, Ariga T, Kaneko H, KondoN, Tsuge I, Yachie A, Sakiyama Y, Iwata T, Bessho FOhishi T,Joh K, Imai K, Kogawa K, Shinohara M, Fujieda M, WakiguchiH, Pasic S, Abinun M, Ochs HD, Renner ED, Jansson A,Belohradsky BH, Metin A, Shimizu N, Mizutani S, Miyawaki T,Nonoyama S, Karasuyama H (2006) Human tyrosine kinase 2deficiency reveals its requisite roles in multiple cytokine signalsinvolved in innate and acquired immunity. Immunity 25:745–755
Minegishi Y, Saito M, Tsuchiya S, Tsuge I, Takada H, Hara T,Kawamura N, Ariga T, Pasic S, Stojkovic O, Metin A,Karasuyama H (2007) Dominant-negative mutations in theDNA-binding domain of STAT3 cause hyper-IgE syndrome.Nature 448:1058–1062
Pfeifer D, Pantic M, Skatulla I, Rawluk J, Kreutz C, Martens UM,Fisch P, Timmer J, Veelken H (2007) Genome-wide analysis ofDNA copy number changes and LOH in CLL using high-densitySNP arrays. Blood 109:1202–1210
Redon R, Ishikawa S, Fitch KR, Feuk L, Perry GH, Andrews TD,Fiegler H, Shapero MH, Carson AR, Chen W, Cho EK, DallaireS, Freeman JL, Gonzalez JR, Gratacos M, Huang J, KalaitzopoulosD, Komura D, MacDonald JR, Marshall CR, Mei R, MontgomeryL, Nishimura K, Okamura K, Shen F, Somerville MJ, Tchinda J,
Immunogenetics (2007) 59:913–926 925

Valsesia A, Woodwark C, Yang F, Zhang J, Zerjal T, Zhang J,Armengol L, Conrad DF, Estivill X, Tyler-Smith C, Carter NP,Aburatani H, Lee C, Jones KW, Scherer SW, Hurles ME (2006)Global variation in copy number in the human genome. Nature444:444–454
Renner ED, Puck JM, Holland SM, Schmitt M, Weiss M, Frosch M,Bergmann M, Davis J, Belohradsky BH, Grimbacher B (2004)Autosomal recessive hyperimmunoglobulin E syndrome: adistinct disease entity. J Pediatr 144:93–99
Webb BT, van den Oord E, Akkari A, Wilton S, Ly T, Duff R, BarnesKC, Carlsen K, Gerritsen J, Lenney W, Silverman M, Sly P,
Sundy J, Tsanakas J, von Berg A, Whyte M, Blumenthal M,Vestbo J, Middleton L, Helms PJ, Anderson WH, Pillai SG(2007) Quantitative linkage genome scan for atopy in a largecollection of Caucasian families. Hum Genet 121:83–92
Wurdak H Ittner LM, Sommer L (2006) DiGeorge syndrome andpharyngeal apparatus development. Bioessays 28:1078–1086
Zhao X, Li C, Paez JG, Chin K, Janne PA, Chen TH, Girard L, MinnaJ, Christiani D, Leo C, Gray JW, Sellers WR, Meyerson M(2004) An integrated view of copy number and allelic alterationsin the cancer genome using single nucleotide polymorphismarrays. Cancer Res 64:3060–3071
926 Immunogenetics (2007) 59:913–926