The host response of maize towards Exserohilum turcicum ...
152
The host response of maize towards Exserohilum turcicum and its toxin, monocerin by Richard Gavin Kotze Submitted in fulfilment of the requirements for the degree Philosophiae Doctor: Plant Science In the Faculty of Natural and Agricultural Sciences Department of Plant and Soil Sciences University of Pretoria Pretoria SUPERVISOR: DR. Q. KRITZINGER CO-SUPERVISOR: DR. B.G. CRAMPTON February 2020
-
Upload
khangminh22 -
Category
Documents
-
view
2 -
download
0
Transcript of The host response of maize towards Exserohilum turcicum ...
The host response of maize towards
Exserohilum turcicum and its toxin, monocerin
by
Richard Gavin Kotze
Submitted in fulfilment of the requirements for the degree
Philosophiae Doctor: Plant Science
In the Faculty of Natural and Agricultural Sciences
Department of Plant and Soil Sciences
University of Pretoria
Pretoria
SUPERVISOR: DR. Q. KRITZINGER
CO-SUPERVISOR: DR. B.G. CRAMPTON
February 2020
ii
Declaration
I, Richard Gavin Kotze declare that the thesis, which I hereby submit for the degree
Philosophiae Doctor: Plant Science at the University of Pretoria, is my own work and has not
previously been submitted by me for a degree at this or any other tertiary institution.
………………………………….
Richard Gavin Kotze
11th February 2020
iii
The host response of maize towards Exserohilum turcicum and its toxin, monocerin
by
Richard Gavin Kotze
Supervisor: Dr. Q. Kritzinger
Co-supervisor: Dr. B.G. Crampton
Department: Plant Science and Soil Sciences
Degree: PhD Plant Science
Summary
Northern leaf blight (NLB) is a devastating foliar disease of maize (Zea mays L.) throughout
the maize growing regions of the world. The causal agent of NLB is the hemibiotrophic fungal
pathogen, Exserohilum turcicum. Exserohilum turcicum produces a secondary metabolite,
monocerin, which is phytotoxic and could aid the fungus in causing NLB in maize. This study
was conceptualised to assess the infection strategy of E. turcicum in maize, as well as the host
response of maize towards E. turcicum and its toxin monocerin.
The infection strategy of E. turcicum was evaluated through the use of high resolution light
(LM), scanning (SEM) and transmission electron microscopy (TEM) to obtain a better
understanding of the hemibiotrophic lifestyle of the fungus. During the biotrophic phase of
fungal infection, the disease was characterised by chlorotic spots whereas cigar shaped lesions
formed during the necrotrophic phase. Infection structures as well as conidiophores were
observed for the first time through SEM. At 9 days post inoculation (9 dpi) the fungus was
observed in the epidermal cells, visible in the xylem at 11 dpi, at 14 dpi the xylem was almost
completely blocked, and at 18 dpi conidiophores formed through the stomata, and the fungus
completed its life cycle. The results of this study provide updated insight into the infection
strategy of the fungus in maize as well as supporting previous findings that E. turcicum is a
hemibiotrophic pathogen.
iv
Pathogenesis-related (PR) proteins are one of the many defence mechanisms plants use to
protect themselves against fungal infection. Reverse transcription-quantitative PCR was
applied to evaluate whether PR protein genes were upregulated in maize in response to E.
turcicum infection and the presence of the E. turcicum toxin, monocerin. Expression of selected
PR protein genes (PR-1, PR-2, PR-3, PR10) associated with fungal infection was induced in
response to the fungus but only during the necrotrophic phase of the fungal growth. Monocerin
did induce the gene expression of PR proteins but at a low level when compared to the fungus.
PR-10 (ribonuclease-like) was the only PR protein gene which was induced at a higher level
by monocerin as compared to the fungus.
The phytotoxic effects of monocerin on the maize leaf cell ultrastructure were studied using
LM and TEM. The cytoplasm as well as the vacuole and chloroplast were most affected by the
phytotoxic nature of monocerin. The chloroplast was the most sensitive to the toxin due to
disruption of the double-membrane, stroma and thylakoid membranes. As monocerin treatment
caused an over accumulation of starch granules in the chloroplast, the gene expression of
enzymes (gwd, pwd, amy3) involved in degradation of starch granules in the chloroplast was
assessed following fungal infection and monocerin treatment. Expression of the all the starch
degradation enzymes genes was inhibited during fungal infection but only amy3 was inhibited
by monocerin treatment.
Response of the maize host to E. turcicum infection and monocerin infiltration provided new
understanding in the host-pathogen interaction which could be exploited in developing new
control strategies against NLB in maize.

v
Acknowledgements
Dr Quenton Kritzinger, for his guidance, motivation, encouragement and input throughout this
study. Thank you for all the support during this study especially during the challenging times.
Dr Bridget Crampton for your insight and guidance with the molecular work and always being
there for me. Thank you for giving me the opportunity to work on maize, a crop that is close to
my heart.
Without the funding of The Maize Trust and University of Pretoria this project would not have
been possible. I gratefully acknowledge their contributions for this project.
Prof Dave Berger for always asking challenging questions as well as your wealth of knowledge.
Chris van der Merwe for your time and expertise on plant anatomy and microscopy and always
willing to help out even in your retirement; without you I would not have finished this PhD.
Carel Oosthuizen for helping me with the statistics, editing of the thesis and friendship. Nicky
Olivier for the technical support and numerous sport conversations. Brigette Langenhoven, for
the numerous phone calls explaining and helping me with the gene expression studies. Eudri
Venter for all your support as well as the preparations of numerous microscopy samples.
Velushka Swart and Miekie Human for their overall support during this study. Renate Zipfel
from the DNA Sequencing Facility, for walking the extra mile in helping me sequencing the
genes. Molly Malefo and Tsholofelo Rampa for your continued support.
The personal of the Laboratory of Microscopy and Microanalysis, University of Pretoria for
the assistance with the microscopy studies. Special thanks to Alan Hall, Erna van Wilpe and
Chantelle Venter.
The lab members of the Cereal Foliar Pathogen Research (CFPR) and Molecular Plant-
Pathogen Research (MPPI) groups for the invaluable advice they gave me and their support.
The staff of the H.G.W.J Schweickerdt Herbarium and Manie van der Schijff Botanical Garden
for their continual kind, friendly and enthusiastic assistance, especially that of Jason Sampson,
Magda Nel and Arnold Frisby who I share my love of plants with.

vi
To my colleagues at Syngenta, Jack, Adri, Petrus and Buyani, you have helped me out
immensely especially during the writing of this thesis with work related activities.
My family and friends for their support, encouragement and valuable advice during this study
My Sister, Vanessa Kotze and brother Jonathan Kotze for always being there for me.
My parents Ina and Gavin Kotze for always believing in me and encouraging me, in good and
in difficult times of my study.
God for the guidance and support as well as always showing the path for me even when I did
not know where to go.
vii
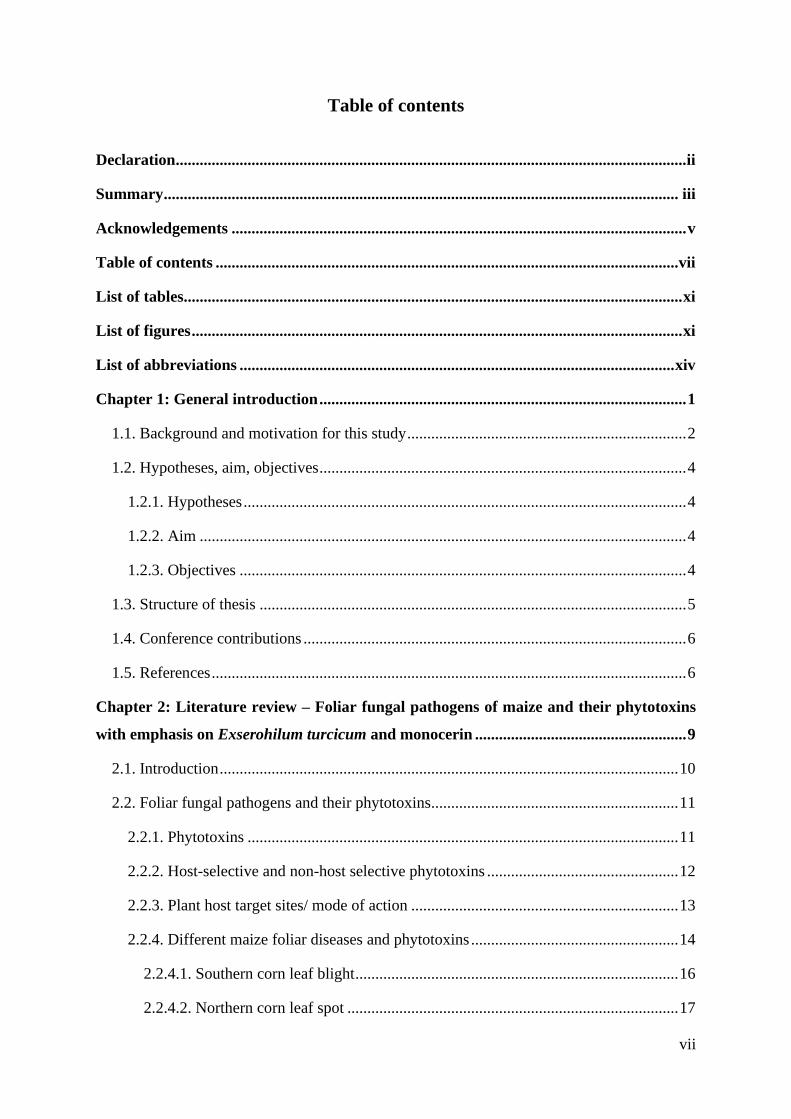
Table of contents
Declaration................................................................................................................................ ii
Summary ................................................................................................................................. iii
Acknowledgements .................................................................................................................. v
Table of contents .................................................................................................................... vii
List of tables............................................................................................................................. xi
List of figures ........................................................................................................................... xi
List of abbreviations ............................................................................................................. xiv
Chapter 1: General introduction ............................................................................................ 1
1.1. Background and motivation for this study ...................................................................... 2
1.2. Hypotheses, aim, objectives ............................................................................................ 4
1.2.1. Hypotheses ............................................................................................................... 4
1.2.2. Aim .......................................................................................................................... 4
1.2.3. Objectives ................................................................................................................ 4
1.3. Structure of thesis ........................................................................................................... 5
1.4. Conference contributions ................................................................................................ 6
1.5. References ....................................................................................................................... 6
Chapter 2: Literature review – Foliar fungal pathogens of maize and their phytotoxins
with emphasis on Exserohilum turcicum and monocerin ..................................................... 9
2.1. Introduction ................................................................................................................... 10
2.2. Foliar fungal pathogens and their phytotoxins.............................................................. 11
2.2.1. Phytotoxins ............................................................................................................ 11
2.2.2. Host-selective and non-host selective phytotoxins ................................................ 12
2.2.3. Plant host target sites/ mode of action ................................................................... 13
2.2.4. Different maize foliar diseases and phytotoxins .................................................... 14
2.2.4.1. Southern corn leaf blight ................................................................................. 16
2.2.4.2. Northern corn leaf spot ................................................................................... 17
viii
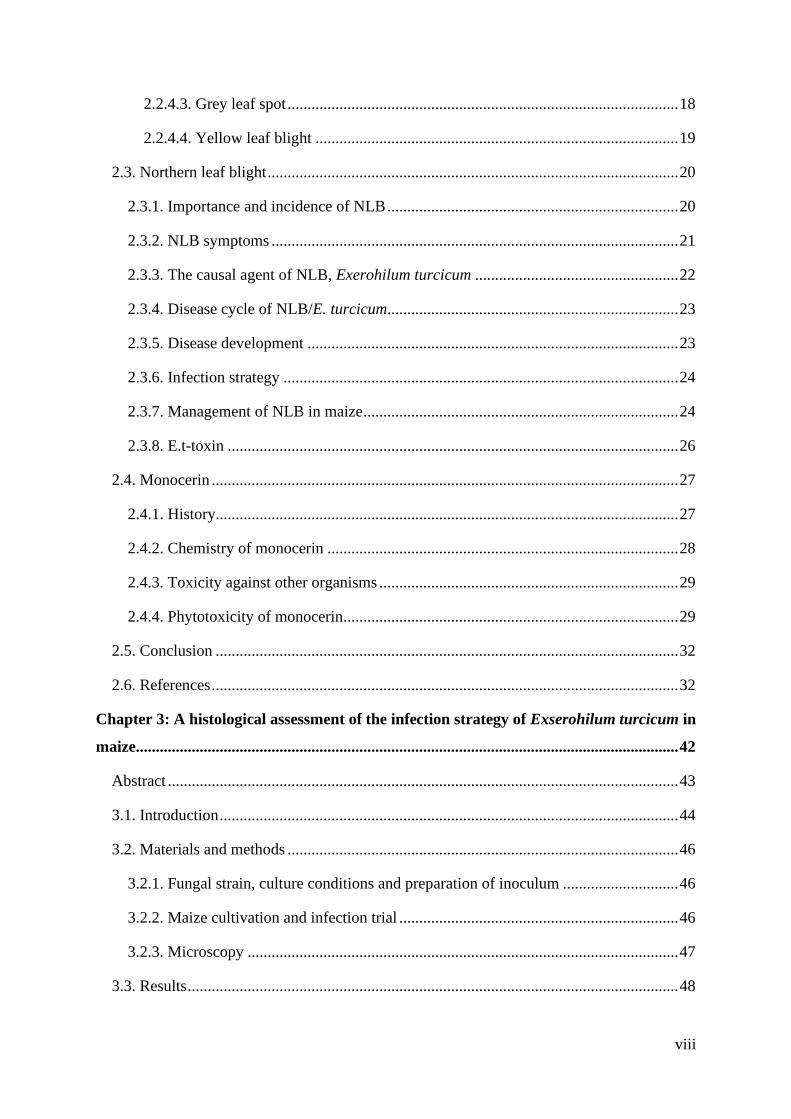
2.2.4.3. Grey leaf spot .................................................................................................. 18
2.2.4.4. Yellow leaf blight ........................................................................................... 19
2.3. Northern leaf blight ....................................................................................................... 20
2.3.1. Importance and incidence of NLB ......................................................................... 20
2.3.2. NLB symptoms ...................................................................................................... 21
2.3.3. The causal agent of NLB, Exerohilum turcicum ................................................... 22
2.3.4. Disease cycle of NLB/E. turcicum......................................................................... 23
2.3.5. Disease development ............................................................................................. 23
2.3.6. Infection strategy ................................................................................................... 24
2.3.7. Management of NLB in maize ............................................................................... 24
2.3.8. E.t-toxin ................................................................................................................. 26
2.4. Monocerin ..................................................................................................................... 27
2.4.1. History.................................................................................................................... 27
2.4.2. Chemistry of monocerin ........................................................................................ 28
2.4.3. Toxicity against other organisms ........................................................................... 29
2.4.4. Phytotoxicity of monocerin.................................................................................... 29
2.5. Conclusion .................................................................................................................... 32
2.6. References ..................................................................................................................... 32
Chapter 3: A histological assessment of the infection strategy of Exserohilum turcicum in
maize........................................................................................................................................ 42
Abstract ................................................................................................................................ 43
3.1. Introduction ................................................................................................................... 44
3.2. Materials and methods .................................................................................................. 46
3.2.1. Fungal strain, culture conditions and preparation of inoculum ............................. 46
3.2.2. Maize cultivation and infection trial ...................................................................... 46
3.2.3. Microscopy ............................................................................................................ 47
3.3. Results ........................................................................................................................... 48
ix
3.4. Discussion ..................................................................................................................... 55
3.5. Acknowledgements ....................................................................................................... 59
3.6. References ..................................................................................................................... 59
Chapter 4: Expression analysis of pathogenesis-related protein genes in maize in response
to Exserohilum turcicum infection and monocerin infiltration .......................................... 62
Abstract ................................................................................................................................ 63
4.1. Introduction ................................................................................................................... 64
4.2. Materials and methods .................................................................................................. 66
4.2.1. Materials ................................................................................................................ 66
4.2.2. Monocerin preparation ........................................................................................... 66
4.2.3. Plant material ......................................................................................................... 66
4.2.4. Fungal strain, culture condition and inoculum preparation ................................... 67
4.2.5. Maize inoculation and infiltration .......................................................................... 67
4.2.6. RNA isolation ........................................................................................................ 68
4.2.7. cDNA synthesis ..................................................................................................... 69
4.2.8. RT-qPCR primer design ........................................................................................ 69
4.2.9. Sequencing of cDNA amplicons ............................................................................ 72
4.2.10. Expression analysis of PR and reference genes ................................................... 72
4.2.11. Statistical analysis ................................................................................................ 73
4.3. Results ........................................................................................................................... 73
4.3.1. Maize trial (infection and infiltration) ................................................................... 73
4.3.2. RNA isolation and cDNA synthesis ...................................................................... 75
4.3.3. Choice of pathogenesis related genes for RT-qPCR .............................................. 76
4.3.4. Expression analysis of PR protein and reference genes......................................... 76
4.4. Discussion ..................................................................................................................... 80
4.5. Conclusion .................................................................................................................... 85
4.6. References ..................................................................................................................... 85
x
Chapter 5: Evidence of ultrastructural phytotoxicity associated with monocerin, on maize
leaves ....................................................................................................................................... 91
Abstract ................................................................................................................................ 92
5.1. Introduction ................................................................................................................... 93
5.2. Materials and methods .................................................................................................. 95
5.2.1. Materials ................................................................................................................ 95
5.2.2. Preparation of monocerin ....................................................................................... 95
5.2.3. Plant material ......................................................................................................... 95
5.2.4. Fungal strain, culture condition and inoculum preparation ................................... 95
5.2.5. Maize inoculation and infiltration .......................................................................... 95
5.2.6. Light and transmission electron microscopy preparations ..................................... 96
5.2.7. RNA isolation and cDNA synthesis ...................................................................... 96
5.2.8. RT-qPCR primer design ........................................................................................ 96
5.2.9. PCR optimisation, sequencing and expression analysis of genes involved in starch
degradation ....................................................................................................................... 98
5.2.10. Statistical analysis ................................................................................................ 98
5.3. Results ........................................................................................................................... 98
5.3.1. Monocerin infiltration of maize leaves .................................................................. 98
5.3.2. The effect of monocerin on the ultrastructure of maize leaf cells ......................... 99
5.3.3. Expression of genes involved in starch degradation ............................................ 107
5.4. Discussion ................................................................................................................... 111
5.5. Conclusion .................................................................................................................. 116
5.6. References ................................................................................................................... 116
Chapter 6: General discussion ............................................................................................ 120
6.1. References ................................................................................................................... 125
Chapter 7: Appendix ........................................................................................................... 128

xi
List of tables
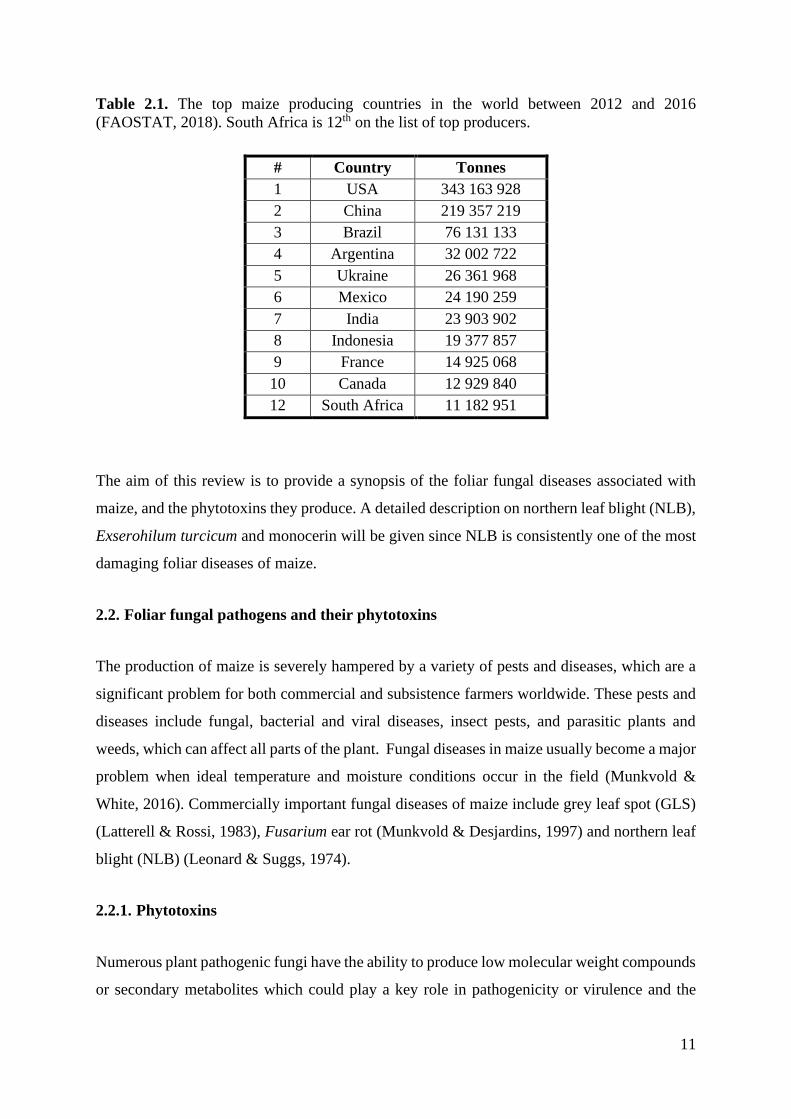
Table 2.1. The top maize producing countries in the world between 2012 and 2016
(FAOSTAT, 2018). .................................................................................................................. 11
Table 2.2. Foliar fungal pathogens of maize and their respective phytotoxins they produce. 15
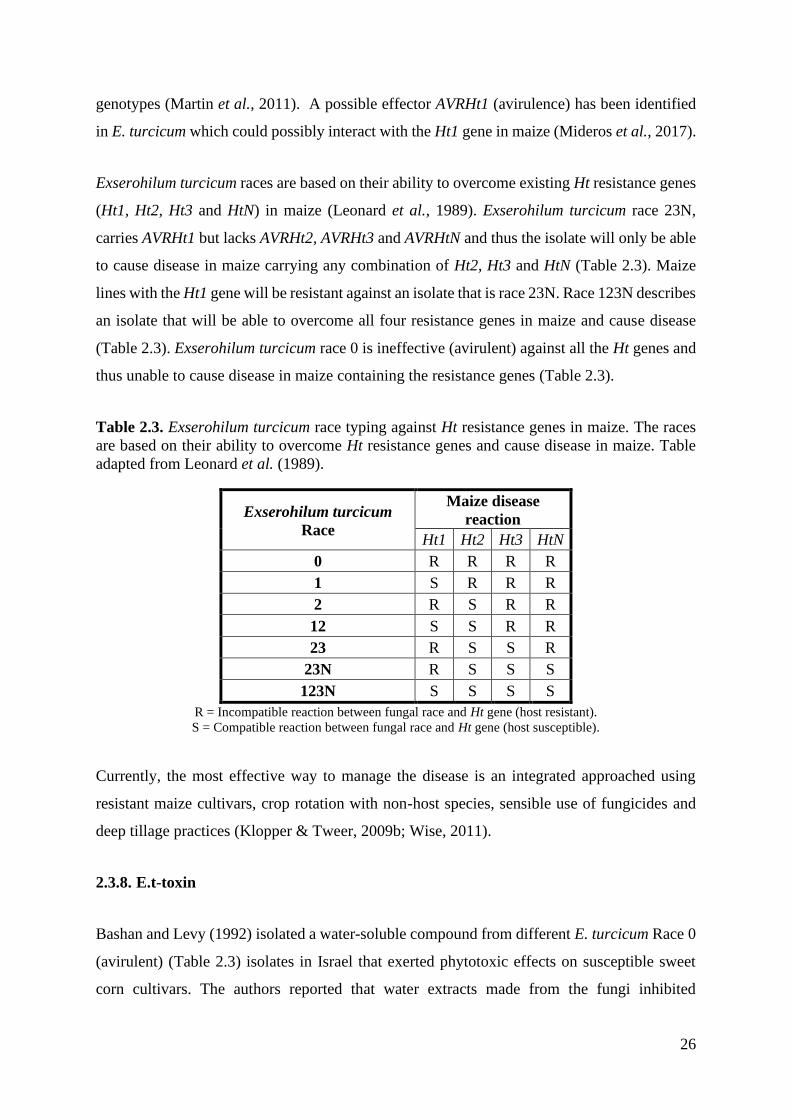
Table 2.3. Exserohilum turcicum race typing against Ht resistance genes in maize. .............. 26
Table 2.4. Fungal pathogens from which monocerin has been isolated. ................................ 28
Table 4.1. A summary of the primer sequences and descriptive information of the maize genes
analysed with RT-qPCR. ......................................................................................................... 71
Table 4.2. GeNorm references gene stability analysis of rpol, srl and gst3. .......................... 77
Table 5.1. A summary of the primer sequences and descriptive information of the maize genes
analysed with RT-qPCR. ......................................................................................................... 97
Table 7.1. The sequences obtained for the sequencing of each genes amplicon indiciating that
the primer set did amplify the correct gene. .......................................................................... 130
List of figures
Figure 2.1. Graphic overview of the cellular targets and modes of action of fungal phytotoxins
(Mobius & Hertweck, 2009). ................................................................................................... 14
Figure 2.2. Typical lesions of Southern corn leaf blight (https://www.pioneer.com). ........... 17
Figure 2.3. Typical lesions of northern corn leaf spot (www.fieldcrops.cals.cornell.edu). .... 18
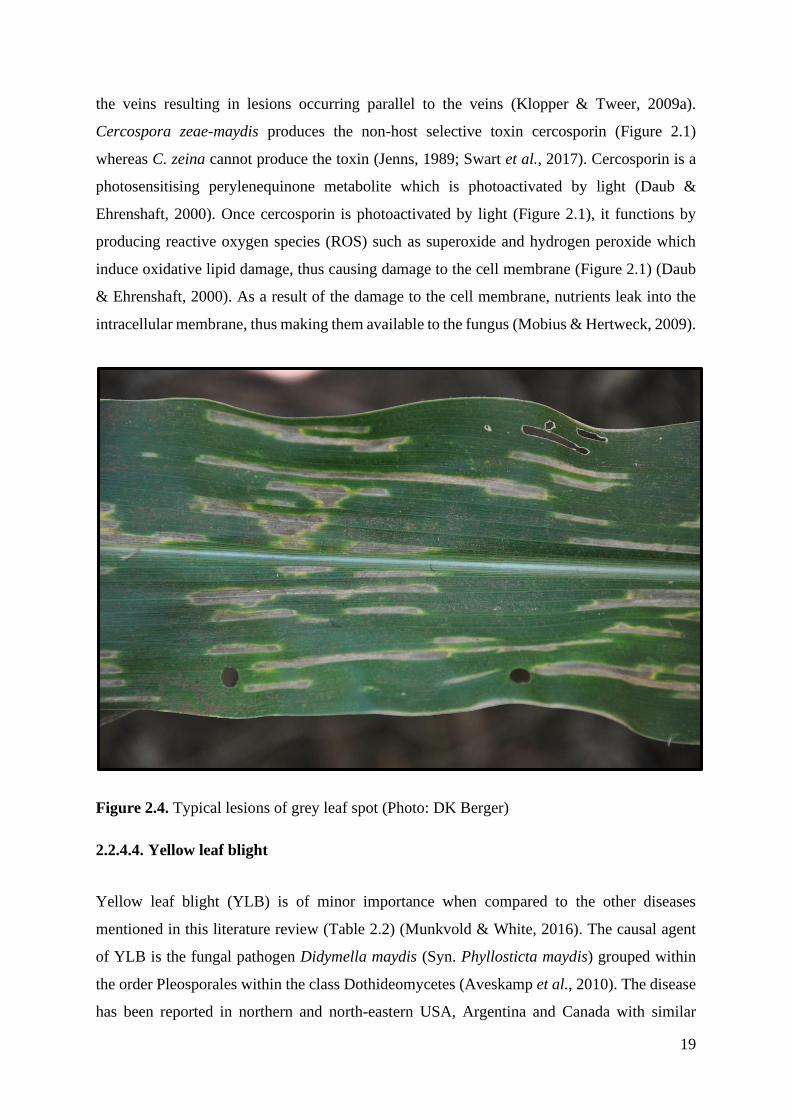
Figure 2.4. Typical lesions of grey leaf spot (Photo: DK Berger) .......................................... 19
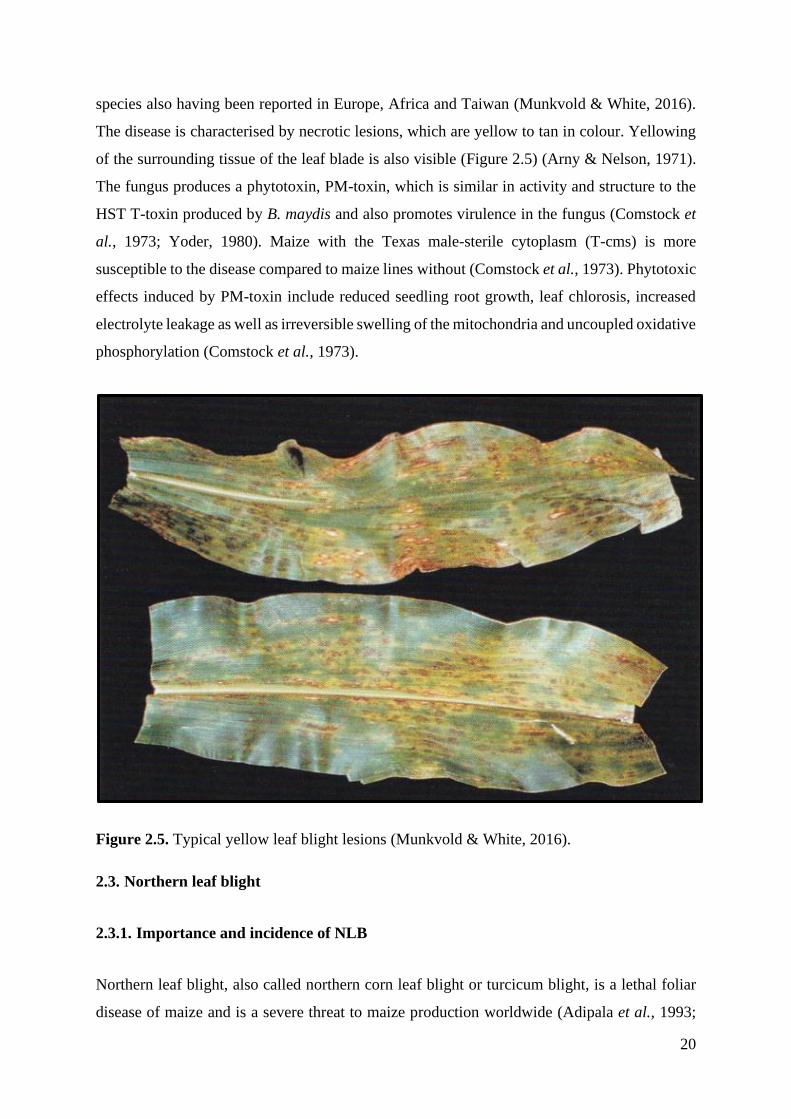
Figure 2.5. Typical yellow leaf blight lesions (Munkvold & White, 2016). .......................... 20
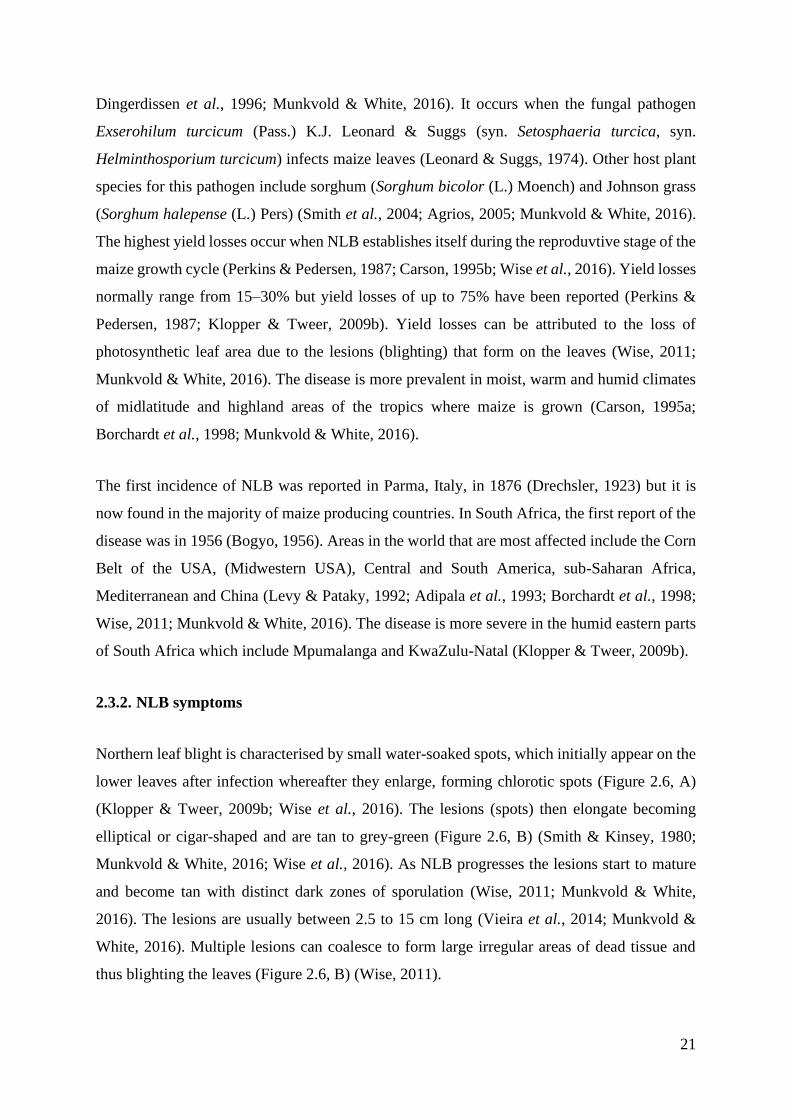
Figure 2.6. Typical characteristic symptoms of NLB. ............................................................ 22
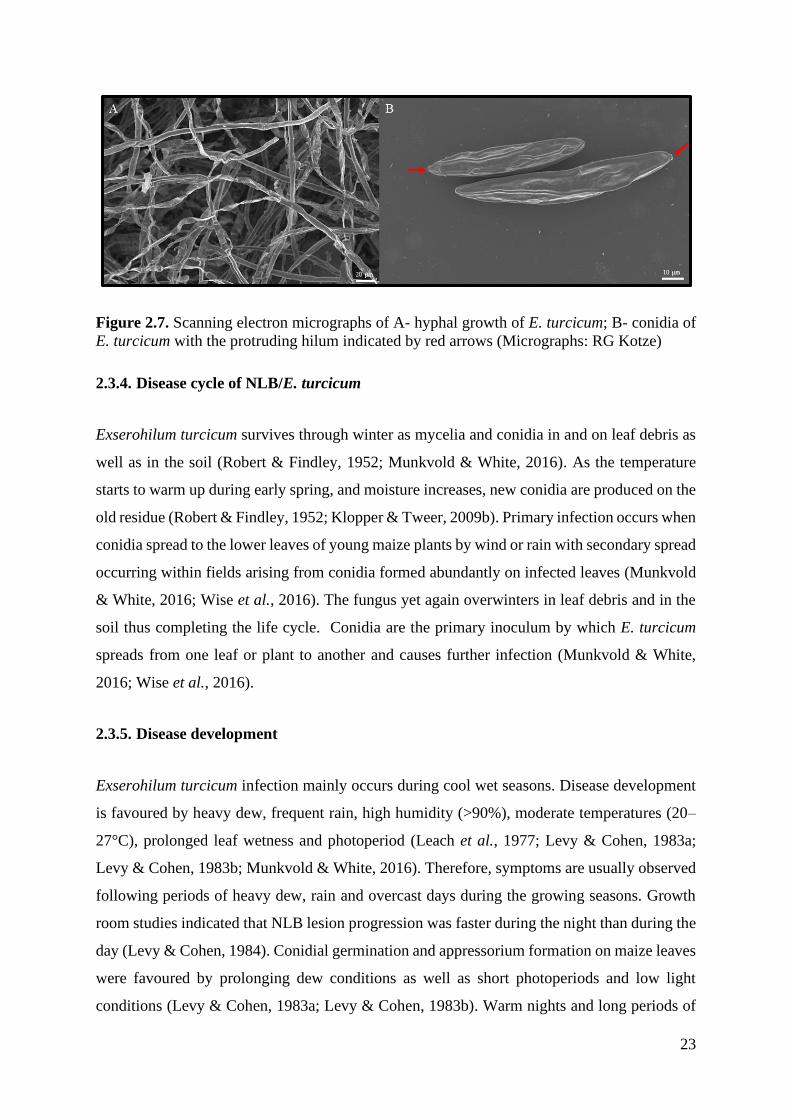
Figure 2.7. Scanning electron micrographs of A- hyphal growth of E. turcicum; B- conidia of
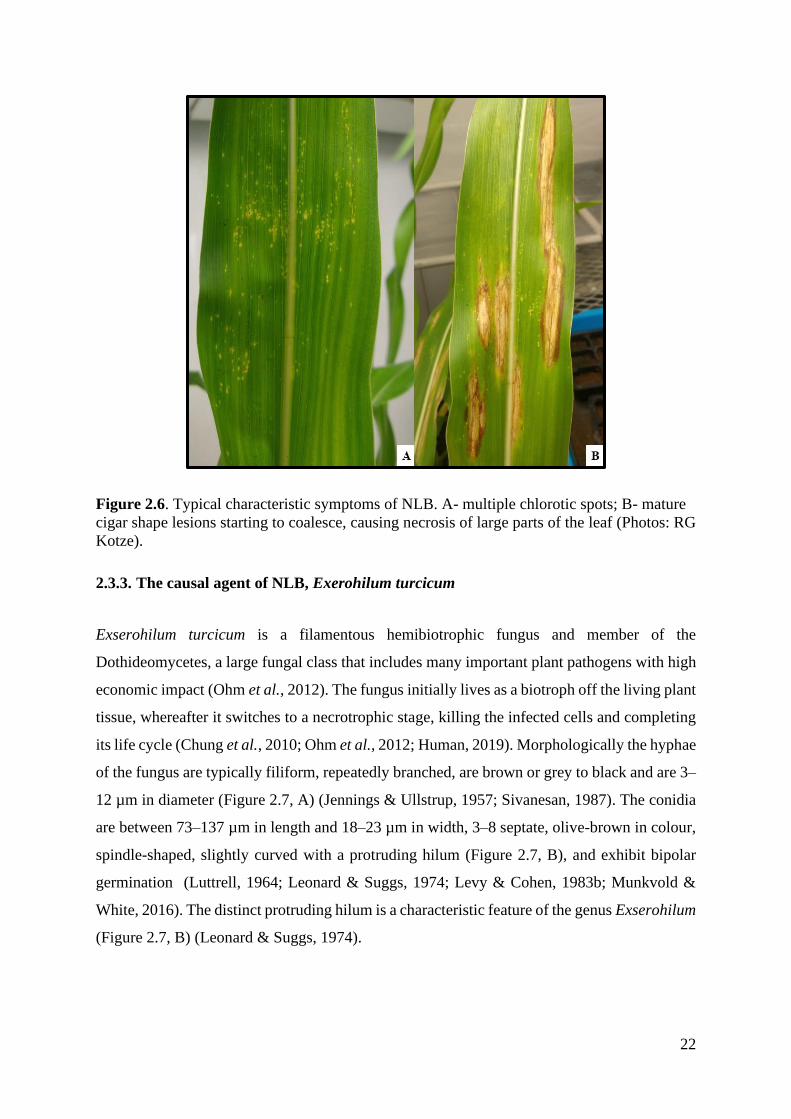
E. turcicum with the protruding hilum indicated by red arrows (Micrographs: RG Kotze) .... 23
Figure 2.8. The chemical structure of monocerin (Mori & Takaishi, 1989). .......................... 29
Figure 3.1. Visual progression of northern leaf blight caused by Exserohilum turcicum on B73
maize leaves. ............................................................................................................................ 51
Figure 3.2. Light microscopy of B73 maize leaves during Exserohilum turcicum infection. 52
Figure 3.3. Scanning electron microscopy of B73 maize leaves during infection by
Exserohilum turcicum. ............................................................................................................. 54
xii
Figure 3.4. Transmission electron micrograph of bundle sheath cell of a B73 maize leaf
infected by Exserohilum turcicum. .......................................................................................... 55
Figure 4.1. Diagrammatic representation of monocerin infiltration sites in a maize leaf. ...... 68
Figure 4.2. NLB disease symptoms developed on B73 maize leaves following inoculation with
the conidia of E. turcicum. ....................................................................................................... 74
Figure 4.3. Visual progression of lesions forming on maize leaves after infiltration with 1 mM
pure monocerin. ....................................................................................................................... 75
Figure 4.4. The RNA quality was assessed by sodium borate agarose gel electrophoresis of
total RNA isolated from maize leaves. .................................................................................... 76
Figure 4.5. Normalised gene expression profiles of PR-1 (a), PR-2 (b), PR-3 (c) and PR-10 (d)
during E. turcicum infection in maize leaves. .......................................................................... 78
Figure 4.6. Normalised gene expression profiles of PR-1 (a), PR-2 (b), PR-3 (c) and PR-10 (d)
during infiltration of maize leaves with monocerin. ................................................................ 80
Figure 5.1. Visual progression of lesions forming on maize leaves infiltrated with 1 and 2 mM
monocerin. ............................................................................................................................... 99
Figure 5.2. Transverse sections of a non-infiltrated (control) B73 maize leaves. ................ 100
Figure 5.3. Transverse sections of maize leaves infiltrated with monocerin 6 hpi. .............. 103
Figure 5.4. Transverse sections of maize leaves infiltrated with monocerin 12 hpi. ............ 103
Figure 5.5. Transverse sections of maize leaves infiltrated with monocerin 24 hpi. ............ 105
Figure 5.6. Transverse sections of maize leaves infiltrated with monocerin 48 hpi. ............ 106
Figure 5.7. Normalised gene expression profiles of the selected genes involved in starch
degradation, gwd (A), pwd (B) and amy3 (C) during E. turcicum infection of maize leaves.
................................................................................................................................................ 109
Figure 5.8. Normalised gene expression profiles of the selected genes involved in starch
degradation, gwd (A), pwd (B) and amy3 (C) during monocerin infiltration of maize leaves.
................................................................................................................................................ 110
Figure 7.1. Scanning electron micrograph of the conidia of Exserohilum turcicum with the
protruding hilum (H). ............................................................................................................. 129
Figure 7.2. Light micrographs of observations of B73 maize leaf paradermal sections after
infection by Exserohilum turcicum (9 days post-inoculation). .............................................. 129
Figure 7.3. Melt-curve analysis of target genes (PR-1, PR-2, PR-3, PR-10, gwd, pwd and amy3)
and references genes (rpol, srl and gst3). .............................................................................. 132
Figure 7.4. Standard curves for generated for each of the PR and reference genes submitted to
RT-qPCR analysis. ................................................................................................................. 134
xiii
Figure 7.5. Standard curves for generated for each of the starch enzymes genes and reference
genes submitted to RT-qPCR analysis. .................................................................................. 135
xiv
List of abbreviations
°C degree Celsius
µl microlitre
µm micrometre
µM micromolar
ANOVA analysis of variance
avr avirulence
BLAST Basic Local Alignment Search Tool
bp base pair
cDNA complementary DNA
cm centimetre
CWDE cell wall-degrading enzymes
DNA deoxyribonucleic acid
DNase deoxyribonuclease
DON deoxynivalenol
dpi days post-inoculation
ecp extracellular proteins
FAOSTAT Food and Agriculture Organization Corporate Statistical Database
FB1 fumonisin B1
gDNA genomic DNA
GLS grey leaf spot
h hour
HMDS hexamethyldisilazane
hpi hours post infiltration
HST host-selective toxin
xv
JA jasmonic acid
kDa kilodalton
kV kilovolt
LM light microscopy
LR London Resin
mM millimolar
M molar
mg milligram
ml millilitre
mm millimetre
NCLS Northern corn leaf spot
NE necrotrophic effector
ng nanogram
NHST non-host selective toxin
NLB Northern leaf blight
nm nanometre
NMR nuclear magnetic resonance
NRPS non-ribosomal peptide
PCR polymerase chain reaction
PR pathogenesis-related
RH relative humidity
RNA ribonucleic acid
rRNA ribosomal RNA
RT-qPCR reverse transcription quantitative PCR
SA salicylic acid
SAR systemic acquired response

xvi
SC solvent control
SCLB Southern corn leaf blight
Sec second
SEM scanning electron microscope
SNP single nucleotide polymorphisms
TEM transmission electron microscope
Tm melting temperature
V8 vegetable 8
WC wounded control
YLS yellow leaf spot

1
Chapter 1: General introduction
2
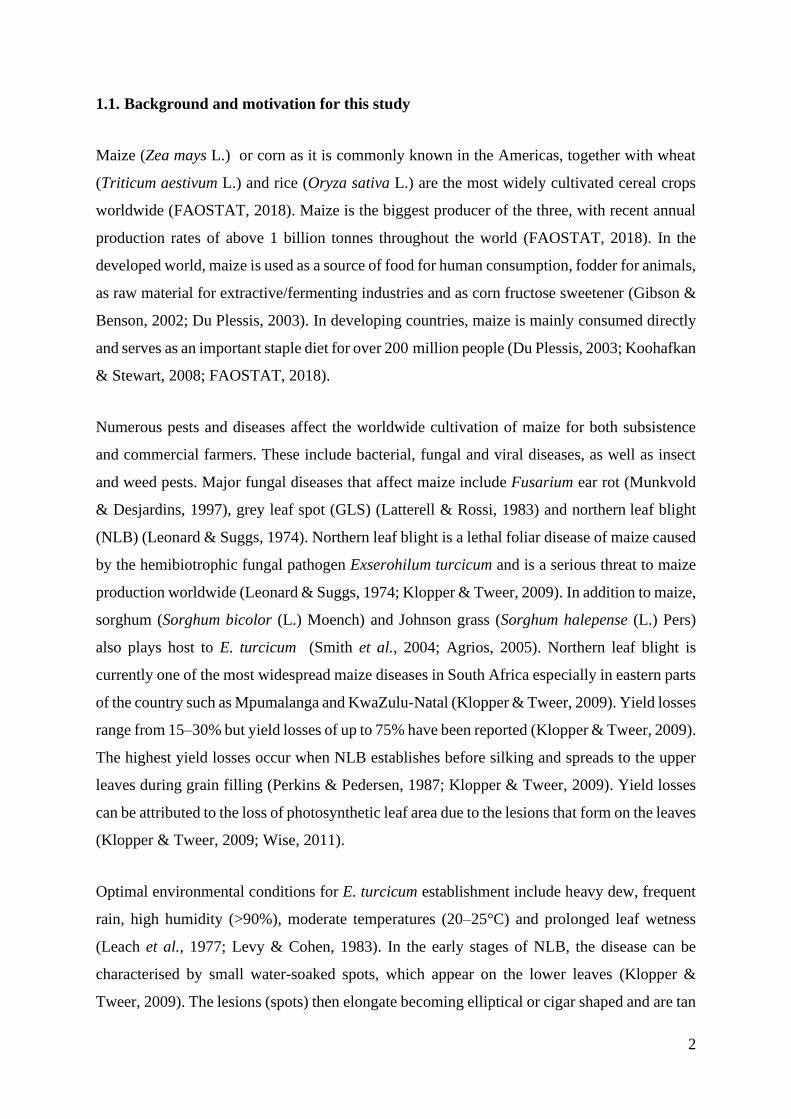
1.1. Background and motivation for this study
Maize (Zea mays L.) or corn as it is commonly known in the Americas, together with wheat
(Triticum aestivum L.) and rice (Oryza sativa L.) are the most widely cultivated cereal crops
worldwide (FAOSTAT, 2018). Maize is the biggest producer of the three, with recent annual
production rates of above 1 billion tonnes throughout the world (FAOSTAT, 2018). In the
developed world, maize is used as a source of food for human consumption, fodder for animals,
as raw material for extractive/fermenting industries and as corn fructose sweetener (Gibson &
Benson, 2002; Du Plessis, 2003). In developing countries, maize is mainly consumed directly
and serves as an important staple diet for over 200 million people (Du Plessis, 2003; Koohafkan
& Stewart, 2008; FAOSTAT, 2018).
Numerous pests and diseases affect the worldwide cultivation of maize for both subsistence
and commercial farmers. These include bacterial, fungal and viral diseases, as well as insect
and weed pests. Major fungal diseases that affect maize include Fusarium ear rot (Munkvold
& Desjardins, 1997), grey leaf spot (GLS) (Latterell & Rossi, 1983) and northern leaf blight
(NLB) (Leonard & Suggs, 1974). Northern leaf blight is a lethal foliar disease of maize caused
by the hemibiotrophic fungal pathogen Exserohilum turcicum and is a serious threat to maize
production worldwide (Leonard & Suggs, 1974; Klopper & Tweer, 2009). In addition to maize,
sorghum (Sorghum bicolor (L.) Moench) and Johnson grass (Sorghum halepense (L.) Pers)
also plays host to E. turcicum (Smith et al., 2004; Agrios, 2005). Northern leaf blight is
currently one of the most widespread maize diseases in South Africa especially in eastern parts
of the country such as Mpumalanga and KwaZulu-Natal (Klopper & Tweer, 2009). Yield losses
range from 15–30% but yield losses of up to 75% have been reported (Klopper & Tweer, 2009).
The highest yield losses occur when NLB establishes before silking and spreads to the upper
leaves during grain filling (Perkins & Pedersen, 1987; Klopper & Tweer, 2009). Yield losses
can be attributed to the loss of photosynthetic leaf area due to the lesions that form on the leaves
(Klopper & Tweer, 2009; Wise, 2011).
Optimal environmental conditions for E. turcicum establishment include heavy dew, frequent
rain, high humidity (>90%), moderate temperatures (20–25°C) and prolonged leaf wetness
(Leach et al., 1977; Levy & Cohen, 1983). In the early stages of NLB, the disease can be
characterised by small water-soaked spots, which appear on the lower leaves (Klopper &
Tweer, 2009). The lesions (spots) then elongate becoming elliptical or cigar shaped and are tan
3
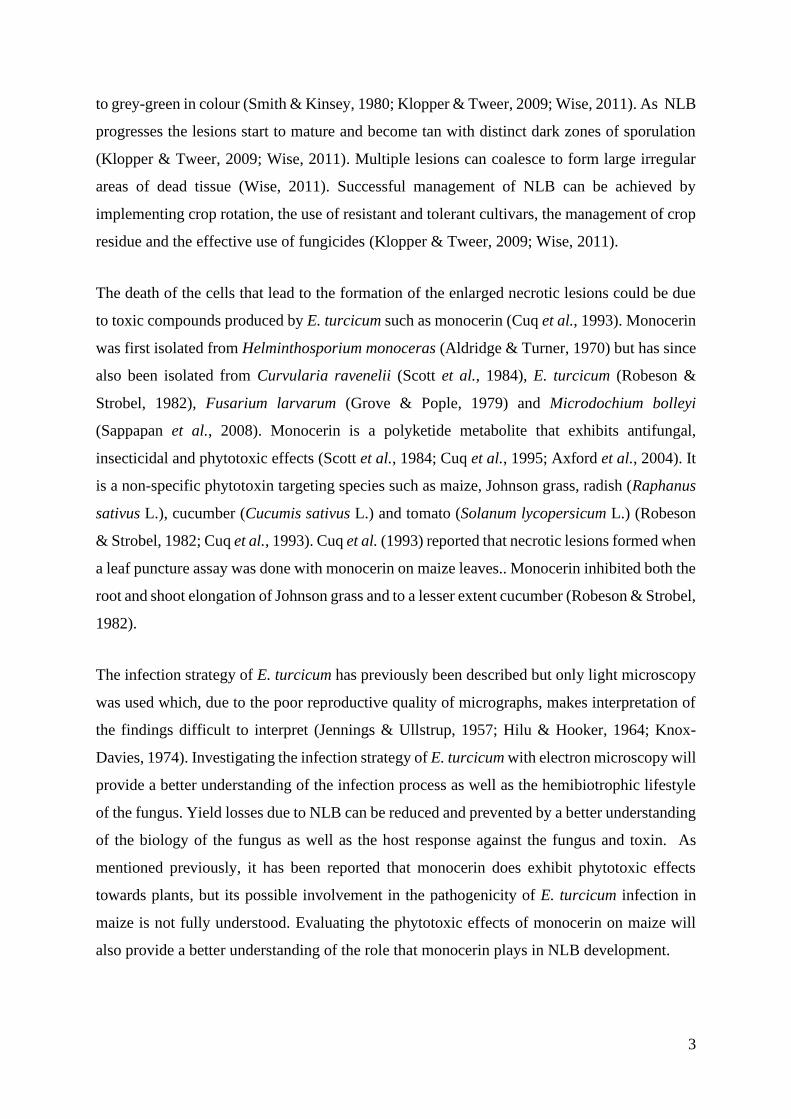
to grey-green in colour (Smith & Kinsey, 1980; Klopper & Tweer, 2009; Wise, 2011). As NLB
progresses the lesions start to mature and become tan with distinct dark zones of sporulation
(Klopper & Tweer, 2009; Wise, 2011). Multiple lesions can coalesce to form large irregular
areas of dead tissue (Wise, 2011). Successful management of NLB can be achieved by
implementing crop rotation, the use of resistant and tolerant cultivars, the management of crop
residue and the effective use of fungicides (Klopper & Tweer, 2009; Wise, 2011).
The death of the cells that lead to the formation of the enlarged necrotic lesions could be due
to toxic compounds produced by E. turcicum such as monocerin (Cuq et al., 1993). Monocerin
was first isolated from Helminthosporium monoceras (Aldridge & Turner, 1970) but has since
also been isolated from Curvularia ravenelii (Scott et al., 1984), E. turcicum (Robeson &
Strobel, 1982), Fusarium larvarum (Grove & Pople, 1979) and Microdochium bolleyi
(Sappapan et al., 2008). Monocerin is a polyketide metabolite that exhibits antifungal,
insecticidal and phytotoxic effects (Scott et al., 1984; Cuq et al., 1995; Axford et al., 2004). It
is a non-specific phytotoxin targeting species such as maize, Johnson grass, radish (Raphanus
sativus L.), cucumber (Cucumis sativus L.) and tomato (Solanum lycopersicum L.) (Robeson
& Strobel, 1982; Cuq et al., 1993). Cuq et al. (1993) reported that necrotic lesions formed when
a leaf puncture assay was done with monocerin on maize leaves.. Monocerin inhibited both the
root and shoot elongation of Johnson grass and to a lesser extent cucumber (Robeson & Strobel,
1982).
The infection strategy of E. turcicum has previously been described but only light microscopy
was used which, due to the poor reproductive quality of micrographs, makes interpretation of
the findings difficult to interpret (Jennings & Ullstrup, 1957; Hilu & Hooker, 1964; Knox-
Davies, 1974). Investigating the infection strategy of E. turcicum with electron microscopy will
provide a better understanding of the infection process as well as the hemibiotrophic lifestyle
of the fungus. Yield losses due to NLB can be reduced and prevented by a better understanding
of the biology of the fungus as well as the host response against the fungus and toxin. As
mentioned previously, it has been reported that monocerin does exhibit phytotoxic effects
towards plants, but its possible involvement in the pathogenicity of E. turcicum infection in
maize is not fully understood. Evaluating the phytotoxic effects of monocerin on maize will
also provide a better understanding of the role that monocerin plays in NLB development.
4
Plants have numerous defence mechanisms that they utilise against abiotic and biotic stresses
such as wounding, drought, and infection by viral, bacterial and fungal pathogens (Agrios,
2005). The production of pathogenesis-related (PR) proteins is one of these mechanisms that
is induced in a response to fungal infections in plants (van Loon et al., 2006). To date, 17
families of PR proteins have been characterised but not all of them are induced by fungal
infections in plants (van Loon et al., 2006). These proteins have various functions including
being antifungal in nature, protease inhibitors, hydrolases and ribonuclease-like (Scherer et al.,
2005; van Loon et al., 2006). Due to the increased resistance that fungal pathogens acquire
against resistant maize lines as well as fungicides, alternative control methods need to be
pursued. The induced expression of PR proteins could be a potential mechanism in controlling
E. turcicum infection in maize.
1.2. Hypotheses, aim, objectives
1.2.1. Hypotheses
1. Exserohilum turcicum is a hemibiotrophic fungus that switches from a biotrophic to a
necrotic lifestyle that leads to cell death.
2. Monocerin is a phytotoxic effector produced by E. turcicum and contributes to development
of NLB disease
3. Pathogenesis-related protein gene expression is induced by E. turcicum infection and
monocerin infiltration.
4. The expression of genes involved in starch degradation in the chloroplast is inhibited by E.
turcicum infection and monocerin infiltration.
1.2.2. Aim
The primary aim of this study was to understand the role of E. turcicum infection and
monocerin in the development of northern leaf blight in maize.
1.2.3. Objectives
The specific objectives of the study were to:
5
1. Determine the infection strategy of E. turcicum by using light microscopy (LM),
transmission electron microscopy (TEM) and scanning electron microscopy (SEM).
2. Determine if pathogenesis-related (PR) protein genes are induced when monocerin and E.
turcicum are applied to maize plants.
3. Determine the phototoxic effect of pure monocerin on the ultrastructure of maize leaf cells.
4. Determine whether starch gene expression in the chloroplast is inhibited by monocerin
infiltration and E. turcicum infection.
1.3. Structure of thesis
This thesis is divided into six chapters as presented below.
Chapter 1: This chapter provides a brief background to and justification for the study, and
states the aim, objectives and hypotheses.
Chapter 2: This chapter provides a concise review on foliar fungal pathogens and their
phytotoxins of maize with an emphasis on northern leaf blight, the causal agent
E. turcicum and the toxin it produces, monocerin.
Chapter 3: In this chapter the infection process of E. turcicum in maize leaves is
characterised using light microscopy, scanning and transmission electron
microscopy to provide an updated and detailed assessment on the infection
strategy of the fungus in maize. In addition, this information is used to confirm
whether the fungus follows a hemibiotrophic lifestyle.
Published as Kotze RG, van der Merwe CF, Crampton BG, Kritzinger Q, 2019.
A histological assessment of the infection strategy of Exserohilum turcicum in
maize. Plant Pathology 68, 504-12 (DOI: 10.1111/ppa.12961).
Chapter 4: This chapter examines whether E. turcicum infection and pure monocerin
infiltration induces a host response in maize leaves by inducing the expression
of pathogenesis related (PR) protein genes.
Chapter 5: The phytotoxic effects of pure monocerin on the ultrastructure of maize leaf
cells are investigated in this chapter. In addition, the effect of the toxin as well
6
as the fungus itself are examined to see whether the expression of genes coding
for enzymes involved in degradation of starch granules in the chloroplast is
inhibited.
Chapter 6: This chapter includes a general discussion, interpretation of the experimental
results achieved, shortcomings of the study and suggestions for future research.
1.4. Conference contributions
Parts of this study were presented at the following conferences/symposia:
55th Annual Congress of the Microscopy Society of Southern Africa (MSSA), Sefako
Makgatho Health Sciences University, 4–7 December 2017, Forever Resorts Warmbaths, Bela-
Bela. The infection Strategy of Exserohilum turcicum in Zea mays. Kotze, R.G., Crampton,
B.G., Kritzinger, Q. (Oral presentation).*
*Won the Wirsam Olympus Light Microscopy Prize for the best light microscopy oral
presentation
11th International Congress of Plant Pathology (ICPP), International Society for Plant
Pathologist (ISPP) and The American Phytopathological Society (APS), 29 July – 3 August
2018, Boston, USA. The infection process of Exserohilum turcicum: A microscopy
investigation. Kotze, R.G., Crampton, B.G., Kritzinger, Q. (Poster presentation).
51st Bi-annual Congress of South African Society for Plant Pathology (SASPP), University of
Stellenbosch, 20–24 January 2019, Club Mykonos, Langebaan. Host response of maize against
the foliar pathogen Exserohilum turcicum. Kotze, R.G., Kritzinger, Q., Crampton, B.G. (Oral
presentation).
1.5. References
Agrios GN, 2005. Plant Pathology. San Diego, CA, USA: Elsevier Academic Press.
Aldridge DC, Turner WB, 1970. Metabolites of Helminthosporium monoceras: Structures of
monocerin and related benzopyrans. Journal of the Chemical Society C: Organic 18, 2598-
600.
7
Axford LC, Simpson TJ, Willis CL, 2004. Synthesis and incorporation of the first polyketide
synthase free intermediate in monocerin biosynthesis. Angewandte Chemie International
Edition 43, 727-30.
Cuq F, Brown SC, Petitprez M, Alibert G, 1995. Effects of monocerin on cell-cycle progression
in maize root-meristems synchronized with aphidicolin. Plant Cell Reports 15, 138-42.
Cuq F, Petitprez M, Herrmann-Gorline S, Klaebe A, Rossignol M, 1993. Monocerin in
Exserohilum turcicum isolates from maize and a study of its phytotoxicity. Phytochemistry 34,
1265-70.
Du Plessis J, 2003. Maize production. Pretoria, South Africa: Department of Agriculture.
FAOSTAT, 2018. FAO statistical database. In. Rome, Italy: Food and Agricultural
Organization of the United Nations.
Gibson L, Benson G, 2002. Origin, history, and uses of corn (Zea mays). [http://agron-
www.agron.iastate.edu/Courses/agron212/readings/corn_history.htm]. Accessed 31 May
2016.
Grove JF, Pople M, 1979. Metabolic products of Fusarium larvarum fuckel. The fusarentins
and the absolute configuration of monocerin. Journal of the Chemical Society, Perkin
Transactions 1, 2048-51.
Hilu HM, Hooker AL, 1964. Host-pathogen relationship of Helminthosporium turcicum in
resistant and susceptible corn seedlings. Phytopathology 54, 570-5.
Jennings P, Ullstrup A, 1957. A histological study of 3 Helminthosporium leaf blights of corn.
Phytopathology 47, 707-14.
Klopper R, Tweer S, 2009. Northern corn leaf blight fact sheet.
[http://www.pannar.com/assets/disease_fact_sheets/Northern_Corn_Leaf_Blight.pdf].
Accessed 11 November 2019.
Knox-Davies P, 1974. Penetration of maize leaves by Helminthosporium turcicum.
Phytopathology 64, 1468-70.
Koohafkan P, Stewart BA, 2008. Water and cereals in drylands. The Food and Agriculture
Organization of the United Nations and Earthscan.
Latterell FM, Rossi AE, 1983. Gray leaf spot of corn: a disease on the move. Plant Disease 67,
842-7.
8
Leach CM, Fullerton RA, Young K, 1977. Northern leaf blight of maize in New Zealand:
relationship of Drechslera turcia airspora to factors onfluencing sporulation, conidium
development, and chlamydospore formation. Phytopathology 77, 629.
Leonard K, Suggs EG, 1974. Setosphaeria prolata, the ascigerous state of Exserohilum
prolatum. Mycologia, 281-97.
Levy Y, Cohen Y, 1983. Biotic and environmental factors affecting infection of sweet corn
with Exserohilum turcicum. Phytopathology 73, 722-5.
Munkvold GP, Desjardins AE, 1997. Fumonisins in maize: Can we reduce their occurrence?
Plant Disease 81, 556-65.
Perkins J, Pedersen W, 1987. Disease development and yield losses associated with Northern
leaf blight on corn. Plant Disease 71, 940-3.
Robeson DJ, Strobel GA, 1982. Monocerin, a phytotoxin from Exserohilum turcicum (=
Drechslera turcica). Agricultural and Biological Chemistry 46, 2681-3.
Sappapan R, Sommit D, Ngamrojanavanich N, et al., 2008. 11-Hydroxymonocerin from the
plant endophytic fungus Exserohilum rostratum. Journal of natural products 71, 1657-9.
Scherer NM, Thompson CE, Freitas LB, Bonatto SL, Salzano FM, 2005. Patterns of molecular
evolution in pathogenesis-related proteins. Genetics and Molecular Biology 28, 645-53.
Scott FE, Simpson TJ, Trimble LA, Vederas JC, 1984. Biosynthesis of monocerin.
Incorporation of 2H-, 13C-, and 18O-labelled acetates by Drechslera ravenelii. Journal of the
Chemical Society, Chemical Communications, 756.
Smith CW, Betran J, Runge ECA, 2004. Corn : Origin, history, technology, and production.
Hoboken, N.J. :: John Wiley.
Smith D, Kinsey J, 1980. Further physiologic specialization in Helminthosporium turcicum.
Plant Disease 64, 779-81.
van Loon LC, Rep M, Pieterse CM, 2006. Significance of inducible defense-related proteins in
infected plants. Annual Review of Phytopathology 44, 135-62.
Wise K, 2011. Diseases of Corn: Northern Corn Leaf Blight.
[https://www.extension.purdue.edu/extmedia/BP/BP-84-W.pdf]. 14 November 2019.
9
Chapter 2: Literature review – Foliar
fungal pathogens of maize and their
phytotoxins with emphasis on
Exserohilum turcicum and monocerin
10
2.1. Introduction
Maize (Zea mays L.) or corn is an edible annual grain belonging to the grass family, Poaceae.
This crop, together with wheat (Triticum aestivum L.) and rice (Oryza sativa L.) constitute the
three most-produced cereal crops throughout the world (FAOSTAT, 2018). Since 2013, annual
production levels have been in excess of one billion tonnes worldwide for maize (FAOSTAT,
2018). The world’s three leading producers of maize are the United States of America (USA),
China and Brazil with the Republic of South Africa (RSA) placed at 12th position (Table 2.1).
For the last ten years, South Africa has produced annually on average 12.5 million tonnes of
maize on 2.5 million ha land (Grain_SA, 2018). During the 2016/2017 season, South Africa
had a record maize harvest with 16.74 million tonnes maize produced from 2.6 million ha land,
which resulted in a yield of 6.02 t/ha (Grain_SA, 2018). The Free State, Mpumalanga and
North West provinces are South Africa’s main maize production centres, which in combination
produce 81.5% of the total maize in South Africa (Grain_SA, 2018).
Maize is a primary staple food in Africa and Latin America with sub-Saharan Africa consuming
more than 90% of the maize produced on the continent (Du Plessis, 2003; Awika, 2011). In
developed countries such as the United States, maize is mainly used as fodder for animals, as
fuel for ethanol production, as a high fructose corn sweetener and for second-cycle produce
which includes meat, eggs and dairy products (Du Plessis, 2003; Koohafkan & Stewart, 2008;
Awika, 2011). In developing countries, it is a significant source of food for humans as well as
fodder for animals (Du Plessis, 2003; Koohafkan & Stewart, 2008).
11
Table 2.1. The top maize producing countries in the world between 2012 and 2016
(FAOSTAT, 2018). South Africa is 12th on the list of top producers.
# Country Tonnes
1 USA 343 163 928
2 China 219 357 219
3 Brazil 76 131 133
4 Argentina 32 002 722
5 Ukraine 26 361 968
6 Mexico 24 190 259
7 India 23 903 902
8 Indonesia 19 377 857
9 France 14 925 068
10 Canada 12 929 840
12 South Africa 11 182 951
The aim of this review is to provide a synopsis of the foliar fungal diseases associated with
maize, and the phytotoxins they produce. A detailed description on northern leaf blight (NLB),
Exserohilum turcicum and monocerin will be given since NLB is consistently one of the most
damaging foliar diseases of maize.
2.2. Foliar fungal pathogens and their phytotoxins
The production of maize is severely hampered by a variety of pests and diseases, which are a
significant problem for both commercial and subsistence farmers worldwide. These pests and
diseases include fungal, bacterial and viral diseases, insect pests, and parasitic plants and
weeds, which can affect all parts of the plant. Fungal diseases in maize usually become a major
problem when ideal temperature and moisture conditions occur in the field (Munkvold &
White, 2016). Commercially important fungal diseases of maize include grey leaf spot (GLS)
(Latterell & Rossi, 1983), Fusarium ear rot (Munkvold & Desjardins, 1997) and northern leaf
blight (NLB) (Leonard & Suggs, 1974).
2.2.1. Phytotoxins
Numerous plant pathogenic fungi have the ability to produce low molecular weight compounds
or secondary metabolites which could play a key role in pathogenicity or virulence and the

12
primary infection process (fungal survival against the plant) (Yoder, 1980; Steyn, 1995;
Mobius & Hertweck, 2009; Collemare & Lebrun, 2011). Any secondary metabolites produced
by fungi that are toxic towards plants are known as phytotoxins (Bennett & Klich, 2003). Many
of these phytotoxins play a role in causing or exacerbating plant diseases (Bennett & Klich,
2003). Phytotoxins, in general, can either be classified as a pathogenicity factor (qualitative),
which is the ability to cause disease or as a virulence factor (quantitative), which refers to the
extent or severity of the disease caused (Yoder, 1980). Phytotoxins which are classified as
pathogenicity factor are required by the fungus to cause disease in plants. For example, with
Cercospora kikuchii produces cercosporin, which is required by the fungus to cause Cercospora
leaf blight in soya beans (Glycine max (L.) Merr.). Cercosporin deficient mutants of C. kikuchii
failed to produced disease in soya beans (Upchurch et al., 1991). Phytotoxins which are
classified as virulence factors are not needed by the fungus to cause disease in plants, but their
production results in an increase in disease severity. In contrast some phytotoxins are not
needed for pathogenicity, as for example dothistromin deficient mutants of Dothistroma
septosporum still have the ability to cause dothistroma needle blight of pines (Kabir et al.,
2015).
2.2.2. Host-selective and non-host selective phytotoxins
The phytotoxins that fungi produce can be classified as host-selective (HST) or non-host
selective (NHST) depending on the number of species they affect. Host-selective phytotoxins
are only biologically active towards the host plant species and sparingly or non-toxic towards
non-host plant species (Scheffer & Livingston, 1984; Tsuge et al., 2013). Host-selective toxins
include: victorin (released by Bipolaris victoriae, Victoria blight of oats (Avena sativa L.))
(Scheffer & Livingston, 1984; Stergiopoulos et al., 2013); HS-toxin (released by Bipolaris
sacchari, eyespot disease of sugarcane (Saccharum spp.)) (Larkin & Scowcroft, 1981); and,
PtrToxA and PtrToxB (Pyrenophora tritici-repentis, tan spot of wheat) (Ciuffetti et al., 2010).
Many of the necrotrophic fungal plant pathogens producing HST’s have been grouped together
in the order Pleosporales within the class Dothideomycetes (Friesen et al., 2008). The same
pair of alleles that controls resistance and susceptibility to fungi in plants also controls tolerance
and sensitivity to their toxins, respectively (Scheffer & Livingston, 1984). In contrast to HST’s,
NHST’s are produced by multiple species and biologically active towards numerous plant
species regardless of whether or not they play host to the fungal pathogen (Scheffer &
Livingston, 1984). Examples of NHST’s include fumonisins (Fusarium verticillioides,
13
Fusarium proliferatum, Alternaria alternata) , AAL-toxins (A. alternata), dothistromin (D.
septosporum, Dothistroma pini) and elsinochrome (Elsinoë spp.) (Stoessl et al., 1990; Abbas
& Boyette, 1992; Abbas et al., 1995; Collemare & Lebrun, 2011; Stergiopoulos et al., 2013).
2.2.3. Plant host target sites/ mode of action
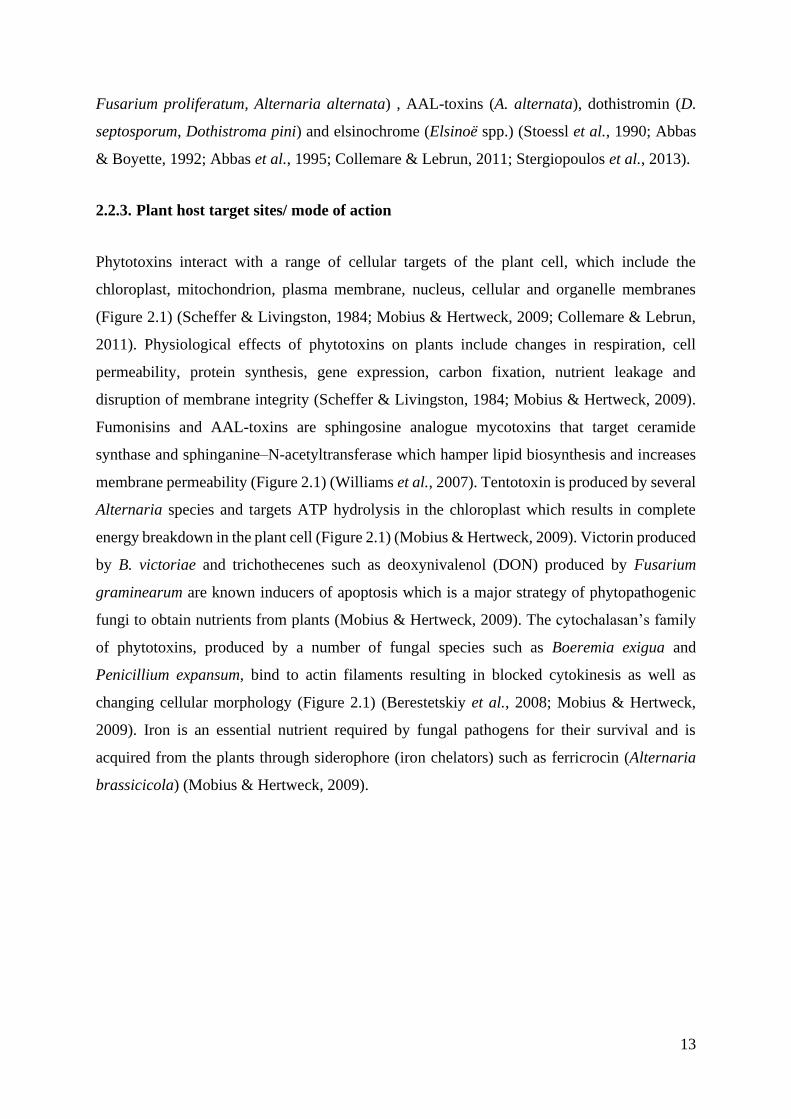
Phytotoxins interact with a range of cellular targets of the plant cell, which include the
chloroplast, mitochondrion, plasma membrane, nucleus, cellular and organelle membranes
(Figure 2.1) (Scheffer & Livingston, 1984; Mobius & Hertweck, 2009; Collemare & Lebrun,
2011). Physiological effects of phytotoxins on plants include changes in respiration, cell
permeability, protein synthesis, gene expression, carbon fixation, nutrient leakage and
disruption of membrane integrity (Scheffer & Livingston, 1984; Mobius & Hertweck, 2009).
Fumonisins and AAL-toxins are sphingosine analogue mycotoxins that target ceramide
synthase and sphinganine–N-acetyltransferase which hamper lipid biosynthesis and increases
membrane permeability (Figure 2.1) (Williams et al., 2007). Tentotoxin is produced by several
Alternaria species and targets ATP hydrolysis in the chloroplast which results in complete
energy breakdown in the plant cell (Figure 2.1) (Mobius & Hertweck, 2009). Victorin produced
by B. victoriae and trichothecenes such as deoxynivalenol (DON) produced by Fusarium
graminearum are known inducers of apoptosis which is a major strategy of phytopathogenic
fungi to obtain nutrients from plants (Mobius & Hertweck, 2009). The cytochalasan’s family
of phytotoxins, produced by a number of fungal species such as Boeremia exigua and
Penicillium expansum, bind to actin filaments resulting in blocked cytokinesis as well as
changing cellular morphology (Figure 2.1) (Berestetskiy et al., 2008; Mobius & Hertweck,
2009). Iron is an essential nutrient required by fungal pathogens for their survival and is
acquired from the plants through siderophore (iron chelators) such as ferricrocin (Alternaria
brassicicola) (Mobius & Hertweck, 2009).

14
Figure 2.1. Graphic overview of the cellular targets and modes of action of fungal phytotoxins
(Mobius & Hertweck, 2009).
2.2.4. Different maize foliar diseases and phytotoxins
Maize is susceptible to numerous foliar fungal pathogens that can cause diseases in the leaves,
which ultimately lead to reduced yield or even death of the plants. Many of the pathogens
follow a necrotrophic or hemibiotrophic lifestyle with some of these fungi often producing
phytotoxins, which aid them in causing disease and completing their lifecycle (Table 2.2). The
fungi listed in Table 2.2 and the diseases they cause have resulted in devastating epidemics and
significant annual yield losses in maize in the past.

15
Table 2.2. Foliar fungal pathogens of maize and their respective phytotoxins they produce.
Pathogen Other names Disease Phytotoxins Cellular
target
Chemical
class
Host
selectivity References
Bipolaris
maydis
Cochliobolus
heterostrophus,
Helminthosporium
maydis
Southern
corn leaf
blight
T-toxin T-urf13
protein Polyketide HST
(Scheffer & Livingston,
1984; Markham &
Hille, 2001; Wolpert et
al., 2002)
ophiobolin I
Sesterpenoid Non-HST
(Sugawara et al., 1987;
Strobel et al., 1988;
Kim et al., 1999; Au et
al., 2000)
ChToxA Protein HST (Lu et al., 2015)
Bipolaris
zeicola
Cochliobolus carbonum,
Helminthosporium
zeicola
Northern
corn leaf
spot
HC-toxin
Histone
deacetyl-
lyses
(HDACs)
Cyclic
tetrapeptide HST
(Scheffer & Livingston,
1984; Brosch et al.,
1995; Ransom &
Walton, 1997; Wolpert
et al., 2002; Walton,
2006; Munkvold &
White, 2016)
Cercospora
zeae-maydis,
Cercospora
zeina
Grey leaf
spot Cercosporin
Reactive
oxygen
species/ cell
membrane
Polyketide Non-HST
(Dunkle & Levy, 2000;
Crous et al., 2006;
Meisel et al., 2009)
Didymella
maydis Phyllosticta maydis
Yellow
leaf blight PM-toxin
T-urf13
protein Polyketide HST
(Comstock et al., 1973;
Yoder, 1980; Wolpert
et al., 2002)
Exserohilum
turcicum
Setosphaeria turcica,
Helminthosporium
turcicum
Northern
leaf blight
Monocerin
Polyketide Non-HST (Robeson & Strobel,
1982; Cuq et al., 1993)
E.t-toxin
Peptide (Bashan & Levy, 1992;
Bashan et al., 1995)
16
2.2.4.1. Southern corn leaf blight
Southern corn leaf blight (SCLB) is caused by the necrotrophic fungus Bipolaris maydis (syn.
Cochliobolus heterostrophus, Helminthosporium maydis) grouped in the order Pleosporales
within the class Dothideomycetes (Table 2.2) (Manamgoda et al., 2011; Condon et al., 2013;
Munkvold & White, 2016). The disease is found worldwide and is most severe in warm
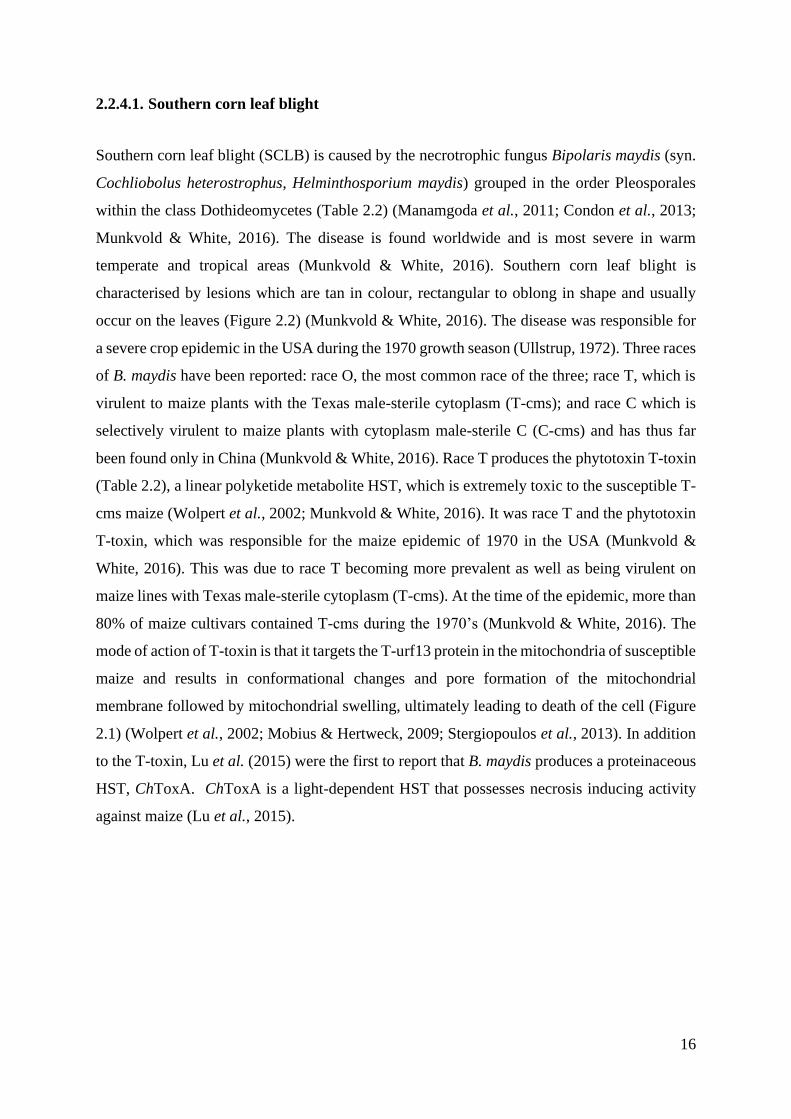
temperate and tropical areas (Munkvold & White, 2016). Southern corn leaf blight is
characterised by lesions which are tan in colour, rectangular to oblong in shape and usually
occur on the leaves (Figure 2.2) (Munkvold & White, 2016). The disease was responsible for
a severe crop epidemic in the USA during the 1970 growth season (Ullstrup, 1972). Three races
of B. maydis have been reported: race O, the most common race of the three; race T, which is
virulent to maize plants with the Texas male-sterile cytoplasm (T-cms); and race C which is
selectively virulent to maize plants with cytoplasm male-sterile C (C-cms) and has thus far
been found only in China (Munkvold & White, 2016). Race T produces the phytotoxin T-toxin
(Table 2.2), a linear polyketide metabolite HST, which is extremely toxic to the susceptible T-
cms maize (Wolpert et al., 2002; Munkvold & White, 2016). It was race T and the phytotoxin
T-toxin, which was responsible for the maize epidemic of 1970 in the USA (Munkvold &
White, 2016). This was due to race T becoming more prevalent as well as being virulent on
maize lines with Texas male-sterile cytoplasm (T-cms). At the time of the epidemic, more than
80% of maize cultivars contained T-cms during the 1970’s (Munkvold & White, 2016). The
mode of action of T-toxin is that it targets the T-urf13 protein in the mitochondria of susceptible
maize and results in conformational changes and pore formation of the mitochondrial
membrane followed by mitochondrial swelling, ultimately leading to death of the cell (Figure
2.1) (Wolpert et al., 2002; Mobius & Hertweck, 2009; Stergiopoulos et al., 2013). In addition
to the T-toxin, Lu et al. (2015) were the first to report that B. maydis produces a proteinaceous
HST, ChToxA. ChToxA is a light-dependent HST that possesses necrosis inducing activity
against maize (Lu et al., 2015).
17
Figure 2.2. Typical lesions of Southern corn leaf blight (https://www.pioneer.com).
2.2.4.2. Northern corn leaf spot
Northern corn leaf spot (NCLS) is caused by the fungus Bipolaris zeicola (syn. Cochliobolus
carbonum, Helminthosporium carbonum) (Manamgoda et al., 2011). Bipolaris zeicola follows
a necrotrophic lifestyle and is grouped within the order Pleosporales (Condon et al., 2013). The
disease is more prevalent on inbred lines as opposed to hybrids (Munkvold & White, 2016).
The disease occurs wherever maize is grown throughout the world (Munkvold & White, 2016).
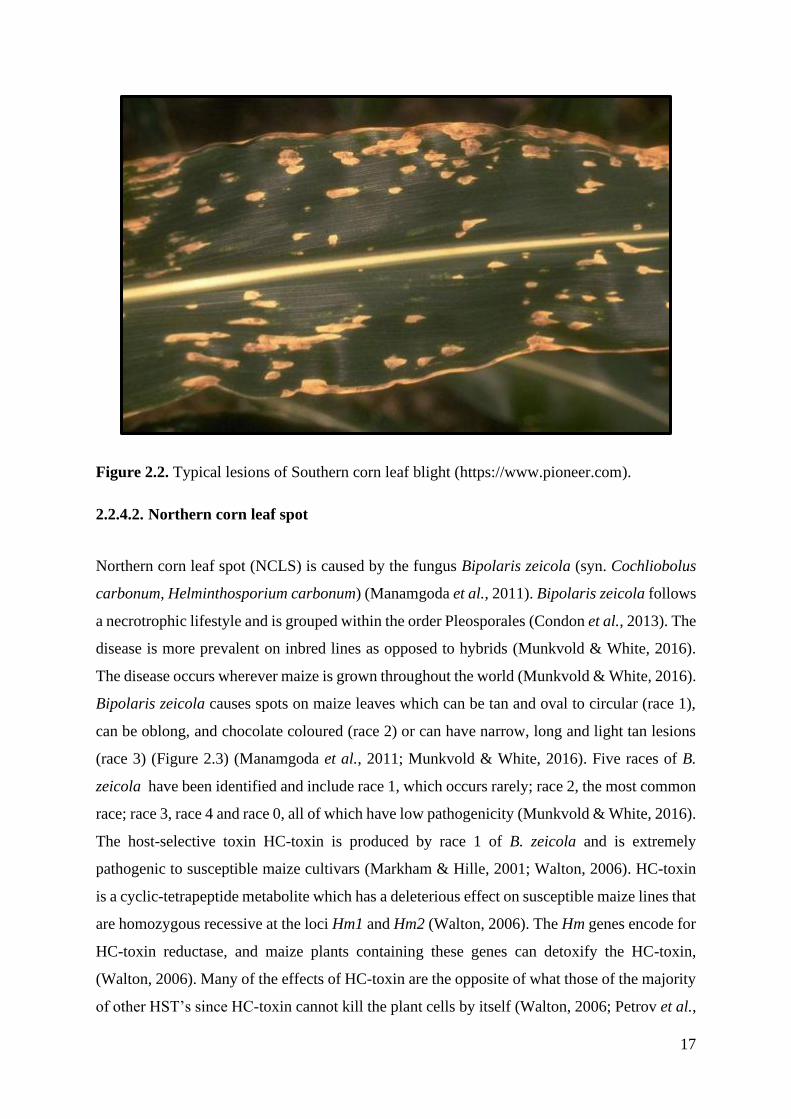
Bipolaris zeicola causes spots on maize leaves which can be tan and oval to circular (race 1),
can be oblong, and chocolate coloured (race 2) or can have narrow, long and light tan lesions
(race 3) (Figure 2.3) (Manamgoda et al., 2011; Munkvold & White, 2016). Five races of B.
zeicola have been identified and include race 1, which occurs rarely; race 2, the most common
race; race 3, race 4 and race 0, all of which have low pathogenicity (Munkvold & White, 2016).
The host-selective toxin HC-toxin is produced by race 1 of B. zeicola and is extremely
pathogenic to susceptible maize cultivars (Markham & Hille, 2001; Walton, 2006). HC-toxin
is a cyclic-tetrapeptide metabolite which has a deleterious effect on susceptible maize lines that
are homozygous recessive at the loci Hm1 and Hm2 (Walton, 2006). The Hm genes encode for
HC-toxin reductase, and maize plants containing these genes can detoxify the HC-toxin,
(Walton, 2006). Many of the effects of HC-toxin are the opposite of what those of the majority
of other HST’s since HC-toxin cannot kill the plant cells by itself (Walton, 2006; Petrov et al.,
18
2018). HC-toxin inhibits the enzyme histone deacetylases (HDAC’s) (Figure 2.1) which results
in hyperacetylation of histones and subsequent repression of gene expression in the plant
(Mobius & Hertweck, 2009). The inhibition of HDAC’s leads to hyperacetylated forms of
nucleosomal histones H3 and H4 (Brosch et al., 1995; Ransom & Walton, 1997). Histones are
involved in the control of fundamental cellular processes such as cell cycle progression and
gene expression (Brosch et al., 1995). Rasmussen and Scheffer (1988) reported that HC-toxin
could also inhibit chlorophyll synthesis.
Figure 2.3. Typical lesions of northern corn leaf spot (www.fieldcrops.cals.cornell.edu).
2.2.4.3. Grey leaf spot
Grey leaf spot (GLS) is a foliar fungal disease caused by either Cercospora zeae-maydis or by
Cercospora zeina with both of these species belonging to the class Dothideomycetes (Crous et
al., 2006). Cercospora zeina is the causal agent for GLS in South Africa (Meisel et al., 2009).
The disease occurs worldwide where maize is grown, especially in the temperate to warm,
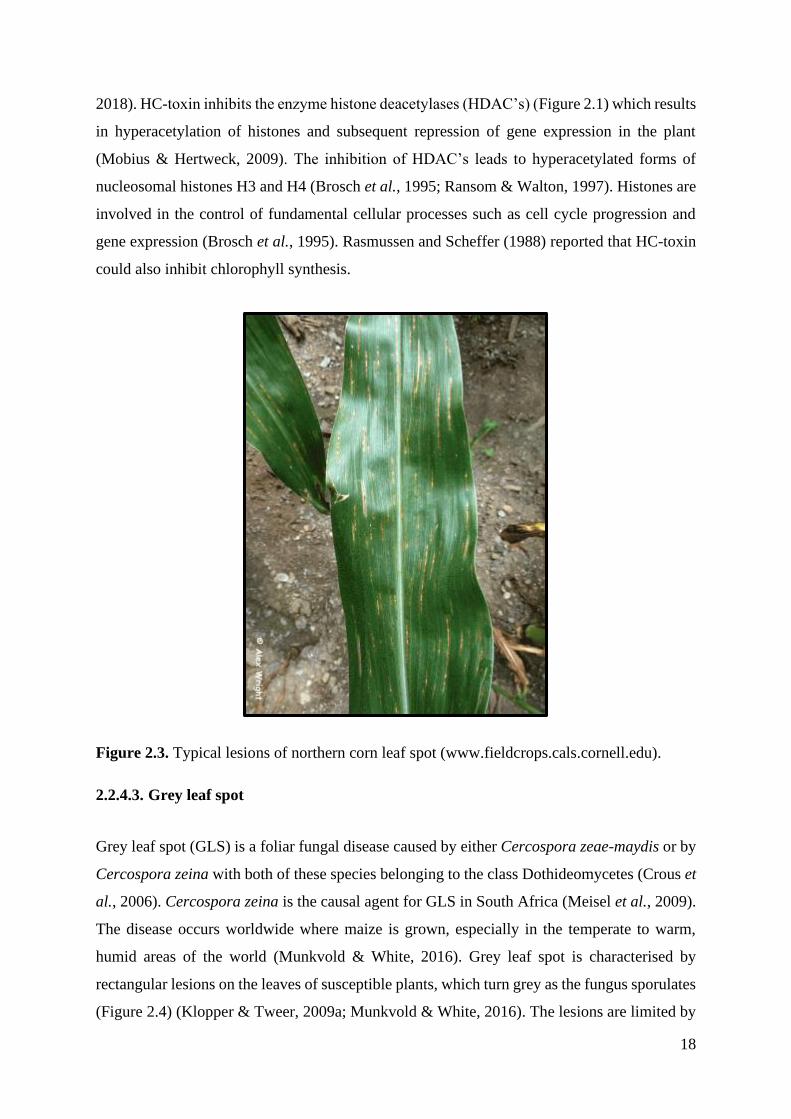
humid areas of the world (Munkvold & White, 2016). Grey leaf spot is characterised by
rectangular lesions on the leaves of susceptible plants, which turn grey as the fungus sporulates
(Figure 2.4) (Klopper & Tweer, 2009a; Munkvold & White, 2016). The lesions are limited by
19
the veins resulting in lesions occurring parallel to the veins (Klopper & Tweer, 2009a).
Cercospora zeae-maydis produces the non-host selective toxin cercosporin (Figure 2.1)
whereas C. zeina cannot produce the toxin (Jenns, 1989; Swart et al., 2017). Cercosporin is a
photosensitising perylenequinone metabolite which is photoactivated by light (Daub &
Ehrenshaft, 2000). Once cercosporin is photoactivated by light (Figure 2.1), it functions by
producing reactive oxygen species (ROS) such as superoxide and hydrogen peroxide which
induce oxidative lipid damage, thus causing damage to the cell membrane (Figure 2.1) (Daub
& Ehrenshaft, 2000). As a result of the damage to the cell membrane, nutrients leak into the
intracellular membrane, thus making them available to the fungus (Mobius & Hertweck, 2009).
Figure 2.4. Typical lesions of grey leaf spot (Photo: DK Berger)
2.2.4.4. Yellow leaf blight
Yellow leaf blight (YLB) is of minor importance when compared to the other diseases
mentioned in this literature review (Table 2.2) (Munkvold & White, 2016). The causal agent
of YLB is the fungal pathogen Didymella maydis (Syn. Phyllosticta maydis) grouped within
the order Pleosporales within the class Dothideomycetes (Aveskamp et al., 2010). The disease
has been reported in northern and north-eastern USA, Argentina and Canada with similar
20
species also having been reported in Europe, Africa and Taiwan (Munkvold & White, 2016).
The disease is characterised by necrotic lesions, which are yellow to tan in colour. Yellowing
of the surrounding tissue of the leaf blade is also visible (Figure 2.5) (Arny & Nelson, 1971).
The fungus produces a phytotoxin, PM-toxin, which is similar in activity and structure to the
HST T-toxin produced by B. maydis and also promotes virulence in the fungus (Comstock et
al., 1973; Yoder, 1980). Maize with the Texas male-sterile cytoplasm (T-cms) is more
susceptible to the disease compared to maize lines without (Comstock et al., 1973). Phytotoxic
effects induced by PM-toxin include reduced seedling root growth, leaf chlorosis, increased
electrolyte leakage as well as irreversible swelling of the mitochondria and uncoupled oxidative
phosphorylation (Comstock et al., 1973).
Figure 2.5. Typical yellow leaf blight lesions (Munkvold & White, 2016).
2.3. Northern leaf blight
2.3.1. Importance and incidence of NLB
Northern leaf blight, also called northern corn leaf blight or turcicum blight, is a lethal foliar
disease of maize and is a severe threat to maize production worldwide (Adipala et al., 1993;
21
Dingerdissen et al., 1996; Munkvold & White, 2016). It occurs when the fungal pathogen
Exserohilum turcicum (Pass.) K.J. Leonard & Suggs (syn. Setosphaeria turcica, syn.
Helminthosporium turcicum) infects maize leaves (Leonard & Suggs, 1974). Other host plant
species for this pathogen include sorghum (Sorghum bicolor (L.) Moench) and Johnson grass
(Sorghum halepense (L.) Pers) (Smith et al., 2004; Agrios, 2005; Munkvold & White, 2016).
The highest yield losses occur when NLB establishes itself during the reproduvtive stage of the
maize growth cycle (Perkins & Pedersen, 1987; Carson, 1995b; Wise et al., 2016). Yield losses
normally range from 15–30% but yield losses of up to 75% have been reported (Perkins &
Pedersen, 1987; Klopper & Tweer, 2009b). Yield losses can be attributed to the loss of
photosynthetic leaf area due to the lesions (blighting) that form on the leaves (Wise, 2011;
Munkvold & White, 2016). The disease is more prevalent in moist, warm and humid climates
of midlatitude and highland areas of the tropics where maize is grown (Carson, 1995a;
Borchardt et al., 1998; Munkvold & White, 2016).
The first incidence of NLB was reported in Parma, Italy, in 1876 (Drechsler, 1923) but it is
now found in the majority of maize producing countries. In South Africa, the first report of the
disease was in 1956 (Bogyo, 1956). Areas in the world that are most affected include the Corn
Belt of the USA, (Midwestern USA), Central and South America, sub-Saharan Africa,
Mediterranean and China (Levy & Pataky, 1992; Adipala et al., 1993; Borchardt et al., 1998;
Wise, 2011; Munkvold & White, 2016). The disease is more severe in the humid eastern parts
of South Africa which include Mpumalanga and KwaZulu-Natal (Klopper & Tweer, 2009b).
2.3.2. NLB symptoms
Northern leaf blight is characterised by small water-soaked spots, which initially appear on the
lower leaves after infection whereafter they enlarge, forming chlorotic spots (Figure 2.6, A)
(Klopper & Tweer, 2009b; Wise et al., 2016). The lesions (spots) then elongate becoming
elliptical or cigar-shaped and are tan to grey-green (Figure 2.6, B) (Smith & Kinsey, 1980;
Munkvold & White, 2016; Wise et al., 2016). As NLB progresses the lesions start to mature
and become tan with distinct dark zones of sporulation (Wise, 2011; Munkvold & White,
2016). The lesions are usually between 2.5 to 15 cm long (Vieira et al., 2014; Munkvold &
White, 2016). Multiple lesions can coalesce to form large irregular areas of dead tissue and
thus blighting the leaves (Figure 2.6, B) (Wise, 2011).
22
Figure 2.6. Typical characteristic symptoms of NLB. A- multiple chlorotic spots; B- mature
cigar shape lesions starting to coalesce, causing necrosis of large parts of the leaf (Photos: RG
Kotze).
2.3.3. The causal agent of NLB, Exerohilum turcicum
Exserohilum turcicum is a filamentous hemibiotrophic fungus and member of the
Dothideomycetes, a large fungal class that includes many important plant pathogens with high
economic impact (Ohm et al., 2012). The fungus initially lives as a biotroph off the living plant
tissue, whereafter it switches to a necrotrophic stage, killing the infected cells and completing
its life cycle (Chung et al., 2010; Ohm et al., 2012; Human, 2019). Morphologically the hyphae
of the fungus are typically filiform, repeatedly branched, are brown or grey to black and are 3–
12 µm in diameter (Figure 2.7, A) (Jennings & Ullstrup, 1957; Sivanesan, 1987). The conidia
are between 73–137 µm in length and 18–23 µm in width, 3–8 septate, olive-brown in colour,
spindle-shaped, slightly curved with a protruding hilum (Figure 2.7, B), and exhibit bipolar
germination (Luttrell, 1964; Leonard & Suggs, 1974; Levy & Cohen, 1983b; Munkvold &
White, 2016). The distinct protruding hilum is a characteristic feature of the genus Exserohilum
(Figure 2.7, B) (Leonard & Suggs, 1974).
23
Figure 2.7. Scanning electron micrographs of A- hyphal growth of E. turcicum; B- conidia of
E. turcicum with the protruding hilum indicated by red arrows (Micrographs: RG Kotze)
2.3.4. Disease cycle of NLB/E. turcicum
Exserohilum turcicum survives through winter as mycelia and conidia in and on leaf debris as
well as in the soil (Robert & Findley, 1952; Munkvold & White, 2016). As the temperature
starts to warm up during early spring, and moisture increases, new conidia are produced on the
old residue (Robert & Findley, 1952; Klopper & Tweer, 2009b). Primary infection occurs when
conidia spread to the lower leaves of young maize plants by wind or rain with secondary spread
occurring within fields arising from conidia formed abundantly on infected leaves (Munkvold
& White, 2016; Wise et al., 2016). The fungus yet again overwinters in leaf debris and in the
soil thus completing the life cycle. Conidia are the primary inoculum by which E. turcicum
spreads from one leaf or plant to another and causes further infection (Munkvold & White,
2016; Wise et al., 2016).
2.3.5. Disease development
Exserohilum turcicum infection mainly occurs during cool wet seasons. Disease development
is favoured by heavy dew, frequent rain, high humidity (>90%), moderate temperatures (20–
27°C), prolonged leaf wetness and photoperiod (Leach et al., 1977; Levy & Cohen, 1983a;
Levy & Cohen, 1983b; Munkvold & White, 2016). Therefore, symptoms are usually observed
following periods of heavy dew, rain and overcast days during the growing seasons. Growth
room studies indicated that NLB lesion progression was faster during the night than during the
day (Levy & Cohen, 1984). Conidial germination and appressorium formation on maize leaves
were favoured by prolonging dew conditions as well as short photoperiods and low light
conditions (Levy & Cohen, 1983a; Levy & Cohen, 1983b). Warm nights and long periods of
24
high relative humidity are essential for the fungus to sporulate and complete its life cycle
(Leach et al., 1977). Disease progression is usually retarded by hot and dry weather conditions
and thus the disease is more prevalent in the wetter areas of the world where maize is grown
(Wise, 2011; Munkvold & White, 2016).
2.3.6. Infection strategy
Exserohilum turcicum typically causes yield loss by infecting and forming necrotic lesions,
which leads to the loss of photosynthetic leaf area (Klopper & Tweer, 2009b). The infection
process of maize leaves by E. turcicum starts when conidia on the maize leaf surface germinate,
forming germination tubes whereafter it forms appressoria on the leaf epidermis cells (Knox-
Davies, 1974). From the appressorium a fine infection hypha forms, which penetrates the outer
epidermal cell wall, leading to thickening of the cell wall and invagination of the plasma
membrane (Knox-Davies, 1974). Penetration is usually through the epidermal cell wall and
rarely through the stomata (Jennings & Ullstrup, 1957). At the end of the infection hypha an
intracellular vesicle forms, which subsequently gives rise to stout colonisation hyphae which
extend into adjacent plant cells (Knox-Davies, 1974). As the disease progresses, intracellular
growth is limited until the hyphae invade the vascular bundles and subsequently penetrate the
xylem vessels and tracheids (Jennings & Ullstrup, 1957). After penetration of the vascular
bundle, growth in the spongy mesophyll cells ceases (Jennings & Ullstrup, 1957). Growth
throughout the vascular bundles is rapid as opposed to the initial dilatory growth of the hyphae
in the spongy mesophyll cells. Wilted symptoms and necrosis of the bundle sheath and
chlorenchyma cells follow extensive plugging of the xylem (Jennings & Ullstrup, 1957). In
susceptible maize lines, the fungi thrive in the xylem tissue whereafter they invade the healthy
bundle sheath and spongy mesophyll tissue (Hilu & Hooker, 1964). Rapid cell death follows
and results in typical wilt like lesions (Hilu & Hooker, 1964). The death of healthy cells that
causes the lesions could either be due to the presence of toxic fungal compounds (e.g.
monocerin, E.t-toxin) (Table 2.2) or cell wall degrading enzymes (CWDE) produced by the
fungus (Cuq et al., 1993; Kubicek et al., 2014).
2.3.7. Management of NLB in maize
The management of the disease can be achieved by the use of deep tillage and crop rotation
practices, biological control, fungicides and resistant cultivars. The use of deep ploughing or
25
tilling practises will reduce the amount of primary inoculum carried over to the next season
since plant residue is allowed to decompose (Wise et al., 2016). Crop rotation with a non-host
species of E. turcicum such as sunflower (Helianthus annuus L.) or soya beans will also reduce
the inoculum load (Klopper & Tweer, 2009b). In maize fields with a history of NLB and where
no or reduced tillage is practised, a two-year rotation with a non-host crop should be
implemented (Wise, 2011).
Foliar fungicides are widely used by commercial farmers throughout the world to control NLB
incidence in maize fields. The use of fungicides before 2002 was rare and only increased
dramatically in 2007 (Wise & Mueller, 2011). This was due to several coinciding factors such
as increased incidence of foliar pathogens such as NLB, the increased market price of maize,
new fungicides being released, increased marketing of fungicides and tillage practices (Wise
& Mueller, 2011). Strobilurins and triazoles are the two major classes of agricultural fungicides
currently been used to prevent NLB (Bartlett et al., 2002; Weems & Bradley, 2017). Brent and
Hollomon (1998) reported that these chemical classes also run the risk of developing pathogen
resistance and thus the fungicides cannot be used sustainably on their own over a long period.
Maize has two types of resistance against E. turcicum, namely polygenic and monogenic
resistance. Polygenic or quantitative resistance is more durable than monogenic or qualitative
resistance, is non-race-specific, more stable over time and is quantitatively expressed as a
reduction in lesion number, lesion size and sporulation (Balint-Kurti & Johal, 2009; Munkvold
& White, 2016). On the other hand, monogenic resistance is based on a single resistance gene
called an R-gene, and provides race specific, high-level resistance against E. turcicum (Balint-
Kurti & Johal, 2009). Maize plants with the appropriate R-gene can convey resistance towards
a fungal pathogen by recognising the effectors secreted by these pathogens whereas plants are
susceptible when they cannot recognise the effectors (Haasbroek, 2014). The four single
dominant genes in maize which confer qualitative resistance are called Ht1, Ht2, Ht3 and HtN
(Hooker, 1961; Hooker, 1963a; Hooker, 1963b; Gevers, 1975; Hooker, 1977; Hooker, 1978;
Hooker, 1981). The genes Ht1, Ht2 and Ht3 resistance phenotypes are characterised by
chlorotic lesions and minimal sporulation events whereas HtN delays lesion development
(Leonard et al., 1989; Bentolila et al., 1991; Simcox & Bennetzen, 1993). Martin et al. (2011)
identified a putative R-gene on chromosome two, bin 2.06 of maize that conveys resistant
against E. turcicum and could be the Ht1 gene. The gene encodes a coiled-coil, nucleotide
binding leucine rich repeat and was found to be uniquely expressed in resistant maize
26
genotypes (Martin et al., 2011). A possible effector AVRHt1 (avirulence) has been identified
in E. turcicum which could possibly interact with the Ht1 gene in maize (Mideros et al., 2017).
Exserohilum turcicum races are based on their ability to overcome existing Ht resistance genes
(Ht1, Ht2, Ht3 and HtN) in maize (Leonard et al., 1989). Exserohilum turcicum race 23N,
carries AVRHt1 but lacks AVRHt2, AVRHt3 and AVRHtN and thus the isolate will only be able
to cause disease in maize carrying any combination of Ht2, Ht3 and HtN (Table 2.3). Maize
lines with the Ht1 gene will be resistant against an isolate that is race 23N. Race 123N describes
an isolate that will be able to overcome all four resistance genes in maize and cause disease
(Table 2.3). Exserohilum turcicum race 0 is ineffective (avirulent) against all the Ht genes and
thus unable to cause disease in maize containing the resistance genes (Table 2.3).
Table 2.3. Exserohilum turcicum race typing against Ht resistance genes in maize. The races
are based on their ability to overcome Ht resistance genes and cause disease in maize. Table
adapted from Leonard et al. (1989).
Exserohilum turcicum
Race
Maize disease
reaction
Ht1 Ht2 Ht3 HtN
0 R R R R
1 S R R R
2 R S R R
12 S S R R
23 R S S R
23N R S S S
123N S S S S
R = Incompatible reaction between fungal race and Ht gene (host resistant).
S = Compatible reaction between fungal race and Ht gene (host susceptible).
Currently, the most effective way to manage the disease is an integrated approached using
resistant maize cultivars, crop rotation with non-host species, sensible use of fungicides and
deep tillage practices (Klopper & Tweer, 2009b; Wise, 2011).
2.3.8. E.t-toxin
Bashan and Levy (1992) isolated a water-soluble compound from different E. turcicum Race 0
(avirulent) (Table 2.3) isolates in Israel that exerted phytotoxic effects on susceptible sweet
corn cultivars. The authors reported that water extracts made from the fungi inhibited
27
chlorophyll production in susceptible sweet corn cultivars (without Ht genes) but not in
resistant cultivars (containing Ht genes). In a follow-up study, Bashan et al. (1995) isolated
and structurally determined a water-soluble peptide (E.t toxin) consisting of three amino acids
from extracts made from either fungal cultures or leaves infected with the fungus. Both
synthetic and natural peptides inhibited chlorophyll levels in a susceptible sweet corn cultivar.
The root growth of the susceptible sweet corn cultivar, Jubilee, was inhibited when treated with
the synthetic peptide solution (Bashan et al., 1995). Bashan et al. (1996) reported that non-
pathogenic E. turcicum isolates from Johnson grass successfully infected susceptible maize
lines (A619 and Jubilee) when the conidia were treated with the E.t toxin. Thus, this toxin could
play an important role in E. turcicum infection of maize. Not much research has been done on
E.t toxin since 1996 on E.t toxin and additional work should include whether the peptide is an
HST or a NHST, determine its phytotoxic effects towards maize leaf ultrastructure as well as
if it is toxic towards other organisms.
2.4. Monocerin
2.4.1. History
Monocerin is a lipophilic, dihydroisocoumarin and a polyketide metabolite that was first
isolated in 1970 from Exserohilum monoceras (syn. Helminthosporium monoceras) (Aldridge
& Turner, 1970; Axford et al., 2004). Robeson and Strobel (1982) were the first authors to
isolate monocerin from E. turcicum cultures and to report on its phytotoxicity towards plants.
Monocerin and its related compounds have not only been isolated from E. monoceras and E.
turcicum but have also been isolated from a variety of fungal pathogens (Table 2.4).
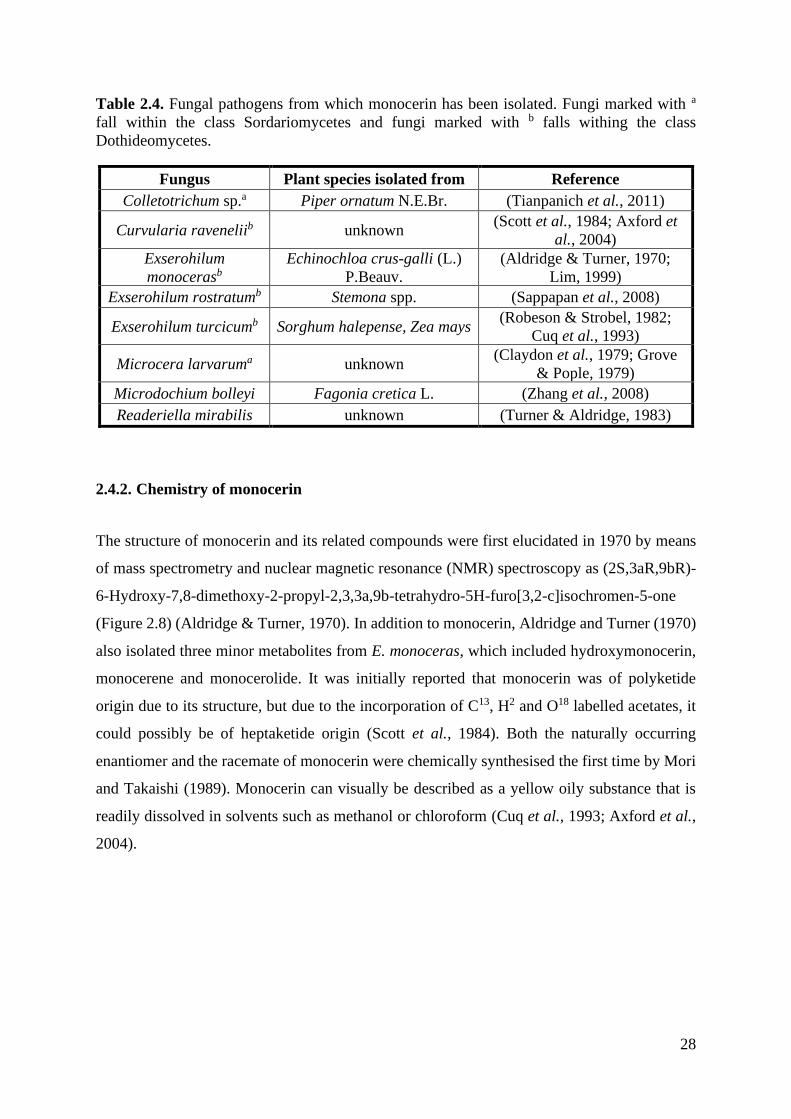
28
Table 2.4. Fungal pathogens from which monocerin has been isolated. Fungi marked with a
fall within the class Sordariomycetes and fungi marked with b falls withing the class
Dothideomycetes.
Fungus Plant species isolated from Reference
Colletotrichum sp.a Piper ornatum N.E.Br. (Tianpanich et al., 2011)
Curvularia raveneliib unknown (Scott et al., 1984; Axford et
al., 2004)
Exserohilum
monocerasb
Echinochloa crus-galli (L.)
P.Beauv.
(Aldridge & Turner, 1970;
Lim, 1999)
Exserohilum rostratumb Stemona spp. (Sappapan et al., 2008)
Exserohilum turcicumb Sorghum halepense, Zea mays (Robeson & Strobel, 1982;
Cuq et al., 1993)
Microcera larvaruma unknown (Claydon et al., 1979; Grove
& Pople, 1979)
Microdochium bolleyi Fagonia cretica L. (Zhang et al., 2008)
Readeriella mirabilis unknown (Turner & Aldridge, 1983)
2.4.2. Chemistry of monocerin
The structure of monocerin and its related compounds were first elucidated in 1970 by means
of mass spectrometry and nuclear magnetic resonance (NMR) spectroscopy as (2S,3aR,9bR)-
6-Hydroxy-7,8-dimethoxy-2-propyl-2,3,3a,9b-tetrahydro-5H-furo[3,2-c]isochromen-5-one
(Figure 2.8) (Aldridge & Turner, 1970). In addition to monocerin, Aldridge and Turner (1970)
also isolated three minor metabolites from E. monoceras, which included hydroxymonocerin,
monocerene and monocerolide. It was initially reported that monocerin was of polyketide
origin due to its structure, but due to the incorporation of C13, H2 and O18 labelled acetates, it
could possibly be of heptaketide origin (Scott et al., 1984). Both the naturally occurring
enantiomer and the racemate of monocerin were chemically synthesised the first time by Mori
and Takaishi (1989). Monocerin can visually be described as a yellow oily substance that is
readily dissolved in solvents such as methanol or chloroform (Cuq et al., 1993; Axford et al.,
2004).
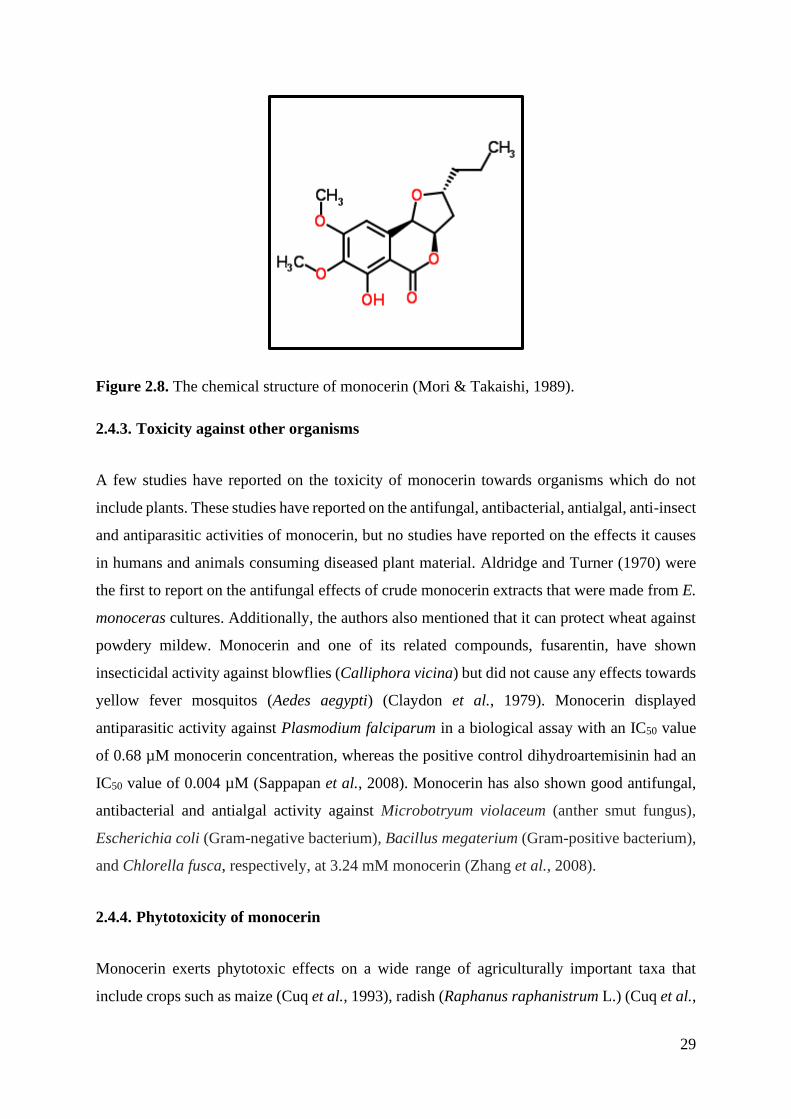
29
Figure 2.8. The chemical structure of monocerin (Mori & Takaishi, 1989).
2.4.3. Toxicity against other organisms
A few studies have reported on the toxicity of monocerin towards organisms which do not
include plants. These studies have reported on the antifungal, antibacterial, antialgal, anti-insect
and antiparasitic activities of monocerin, but no studies have reported on the effects it causes
in humans and animals consuming diseased plant material. Aldridge and Turner (1970) were
the first to report on the antifungal effects of crude monocerin extracts that were made from E.
monoceras cultures. Additionally, the authors also mentioned that it can protect wheat against
powdery mildew. Monocerin and one of its related compounds, fusarentin, have shown
insecticidal activity against blowflies (Calliphora vicina) but did not cause any effects towards
yellow fever mosquitos (Aedes aegypti) (Claydon et al., 1979). Monocerin displayed
antiparasitic activity against Plasmodium falciparum in a biological assay with an IC50 value
of 0.68 µM monocerin concentration, whereas the positive control dihydroartemisinin had an
IC50 value of 0.004 µM (Sappapan et al., 2008). Monocerin has also shown good antifungal,
antibacterial and antialgal activity against Microbotryum violaceum (anther smut fungus),
Escherichia coli (Gram-negative bacterium), Bacillus megaterium (Gram-positive bacterium),
and Chlorella fusca, respectively, at 3.24 mM monocerin (Zhang et al., 2008).
2.4.4. Phytotoxicity of monocerin
Monocerin exerts phytotoxic effects on a wide range of agriculturally important taxa that
include crops such as maize (Cuq et al., 1993), radish (Raphanus raphanistrum L.) (Cuq et al.,
30
1993), cucumber (Cucumis sativus L.) (Robeson & Strobel, 1982), tomato (Solanum
lycopersicum L.) (Robeson & Strobel, 1982; Lim, 1999), ryegrass (Lolium multiflorum Lam.)
(Lim, 1999) and to a lesser extent rice (Lim, 1999) and weeds such as Johnson grass (Robeson
& Strobel, 1982), creeping thistle (Cirsium arvense (L.) Scop.) (Robeson & Strobel, 1982),
barnyardgrass (Echinochloa crus-galli (L.) P.Beauv.) (Lim, 1999) and bulrush
(Schoenoplectiella juncoides (Roxb.) Lye) (Lim, 1999). The phytotoxic effects of monocerin
include necrosis, chlorosis, reduced root development and cell death (Robeson & Strobel, 1982;
Cuq et al., 1993). Monocerin is considered a non-host selective toxin as it is phytotoxic to more
than one plant species (Robeson & Strobel, 1982; Cuq et al., 1993).
Robeson and Strobel (1982) were the first authors to report on the phytotoxicity of monocerin
towards plants. The phytotoxic nature of monocerin was first observed when the authors
performed a leaf dip assay where they applied monocerin at a concentration of 0.097 mM (0.3
mg/ml) to a punctured creeping thistle leaf. A necrotic spot of 7 mm in diameter together with
necrotic spots along the main vein was observed 16 hours after incubation. After 40 hours of
incubation, more than 50% of the leaf area was necrotic and the leaf was also brittle. The same
was done for tomato leaves but at a concentration of 1 mM (0.33 mg/ml) monocerin (Robeson
& Strobel, 1982). This caused the leaves to wilt within 16 hours but the leaves were not
desiccated and no distinct areas of necrosis were apparent after 48 hours incubation. Robeson
and Strobel (1982) additionally sprayed various concentrations of monocerin 0.32–3.24 mM
(0.1-1.0 mg/ml) on cut leaves of Johnson grass. Chlorosis was observed after six days of
incubation, and necrosis after eight days at all of the above-mentioned concentrations.
Furthermore, the effect of monocerin on the root and shoot elongation of pre-germinated
Johnson grass and cucumber seeds was also tested. At 3.24 mM (1 mg/ml) monocerin, root and
shoot elongation was completely inhibited whereas at the lowest concentration of 0.1 mM
(0.033 mg/ml) monocerin, the root and shoot elongation was inhibited by 50%. Pre-germinated
seeds of cucumber were less sensitive to monocerin as compared to those of Johnson grass
seedlings. In cucumber seedlings treated with 1 mg/ml monocerin root, and shoot elongation
was inhibited by 33% when compared to the controls.
Cuq et al. (1993) purified and identified monocerin from crude chloroform extracts made from
E. turcicum cultures isolated from maize in France. The authors further examined the
phytotoxic effects of monocerin with the aid of various bioassays on the cells and protoplasts
of maize. Brown necrotic lesions were observed on punctured leaves treated with a crude
31
extract containing monocerin. The authors reported that chloroform extracts inhibited radish,
maize and tomato root elongation (Cuq et al., 1993). The authors used pure monocerin in a
detached leaf assay at different concentrations and temperatures. Monocerin was tested at a
concentration range of 0.2–3 mM at both 24°C and 27°C. After 24 hours at 24°C, whitish
necrosis developed along the veins whereas at 27°C the necrosis was brown and the area of the
lesion was bigger (Cuq et al., 1993). The minimum detection threshold was 0.4 mM with a
plateau effect at 1 mM for both temperatures. No necrosis was seen in leaves treated with the
40% methanol control. The same range of monocerin concentrations was tested on the growth
of pre-germinated radish seed. The maximal effect was reached at 2.5 mM but the ID50 value
for both leaf and root bioassays were determined at 1 mM monocerin. Monocerin also reduced
the viability of maize root cap cells as well as mesophyll protoplasts (Cuq et al., 1993).
Root elongation was inhibited by over 91% in ryegrass, barnyardgrass and bulrush when
treated with a monocerin solution of 0.32 mM (100 mg/L) made from E. monoceras (Lim,
1999). Root necrosis was also seen in the above-mentioned plants at a monocerin concentration
of 0.32 mM (Lim, 1999). Monocerin did not have any effect on the root growth of tomato and
lettuce even when 0.97 mM monocerin was applied to the plants (Lim, 1999). However, Cuq
et al. (1993) reported that the growth of tomato roots was inhibited by 75% when the roots
were treated with a crude extract made from E. turcicum when compared to the untreated
control. Robeson and Strobel (1982) observed wilting effects on tomato leaves treated with
1 mM monocerin. Lim (1999) mentioned that monocerin plays a part in the expression of
disease symptoms by E. monoceras but also in host selection (Lim, 1999). This is in contrast
to Robeson and Strobel (1982) and Cuq et al. (1993) who reported that monocerin is a non-
host selective toxin. Cuq et al. (1995) investigated the phytotoxic effects of monocerin on the
cell cycle progression in maize root meristems. The authors reported that monocerin could
interfere with the S and G2 stages of the cell division cycle where putative target molecules
could be expressed.
It is interesting to note that in the first three studies (Robeson & Strobel, 1982; Cuq et al., 1993;
Lim, 1999) root inhibition assays were performed to test the phytotoxicity of monocerin
whereas the last study investigated the effect of monocerin on the cell cycle progression of
maize root cells (Cuq et al., 1995). However, to date all the fungal pathogens from which
moncerin has been isolated from, are known to be foliar pathogens and not soil pathogens.
32
Since monocerin not only exerts a phytotoxic effect towards leaf tissue but also the root tissue,
it could potentially be used as a herbicide
2.5. Conclusion
The review provides a summary of the foliar pathogens of maize and the respective phytotoxins
they produce, which could aid them in causing disease. It is evident that the fungal pathogens
mentioned cannot cause disease without the host-selective phytotoxins they produce. It is
apparent that if a race of a fungal pathogen, which produces phytotoxins, becomes prevalent in
a season, as in the case of SCLB, it can lead to major maize yield losses, which in turn would
lead to economic losses and food shortages. Additionally, this review also provides a detailed
summary of NLB in maize as well as background on monocerin, with emphasis on its
phytotoxicity. The infection process of E. turcicum has been studied before but only light
microscopy was used, and the reproduction quality of the micrographs was poor in the past
(Jennings & Ullstrup, 1957; Hilu & Hooker, 1964). This often makes the interpretation of the
micrographs difficult especially examination of the infection and reproduction structures of the
fungus. Due to an increase in resistance of the E. turcicum towards fungicides and resistant
maize cultivars, alternative methods and strategies are needed to control NLB in maize.
Monocerin is phytotoxic towards numerous plant species and could aid E. turcicum in causing
disease in maize. Not much is known of the mode of action of the toxin as well as what part of
the cell ultrastructure it exerts its toxic effects.
2.6. References
Abbas HK, Boyette C, 1992. Phytotoxicity of fumonisin B1 on weed and crop species. Weed
Technology, 548-52.
Abbas HK, Duke SO, Paul RN, Riley RT, Tanaka T, 1995. AAL‐toxin, a potent natural
herbicide which disrupts sphingolipid metabolism of plants. Pesticide science 43, 181-7.
Adipala E, Lipps PE, Madden LV, 1993. Reaction of maize cultivars from Uganda to
Exserohilum turcicum. Phytopathology 83, 217-23.
Agrios GN, 2005. Plant Pathology. San Diego, CA, USA: Elsevier Academic Press.
33
Aldridge DC, Turner WB, 1970. Metabolites of Helminthosporium monoceras: Structures of
monocerin and related benzopyrans. Journal of the Chemical Society C: Organic 18, 2598-
600.
Arny D, Nelson R, 1971. Phyllosticta maydis species nova, the incitant of yellow leaf blight of
maize. Phytopathology 61, 1170-2.
Au TK, Chick WSH, Leung PC, 2000. The biology of ophiobolins. Life Sciences 67, 733-42.
Aveskamp MM, de Gruyter J, Woudenberg JH, Verkley GJ, Crous PW, 2010. Highlights of
the Didymellaceae: A polyphasic approach to characterise Phoma and related pleosporalean
genera. Studies in Mycology 65, 1-60.
Awika JM, 2011. Major Cereal Grains Production and Use around the World. In: Awika JM,
Piironen V, Bean S, eds. Advances in Cereal Science: Implications to Food Processing and
Health Promotion. Wasgington, DC: ACS Publications, 1-13. (ACS Symposium Series; vol.
1089.)
Axford LC, Simpson TJ, Willis CL, 2004. Synthesis and incorporation of the first polyketide
synthase free intermediate in monocerin biosynthesis. Angewandte Chemie International
Edition 43, 727-30.
Balint-Kurti PJ, Johal GS, 2009. Maize disease resistance. In. Handbook of Maize: Its Biology.
229-50.
Bartlett DW, Clough JM, Godwin JR, Hall AA, Hamer M, Parr-Dobrzanski B, 2002. The
strobilurin fungicides. Pest Management Science 58, 649-62.
Bashan B, Abadi R, Levy Y, 1996. Involvement of a phytotoxic peptide in the development of
the Northern leaf blight of corn. European Journal of Plant Pathology 102, 891-3.
Bashan B, Levy RS, Cojocaru M, Levy Y, 1995. Purification and structural determination of a
phytotoxic substance from Exserohilum turcicum. Physiological and Molecular Plant
Pathology 47, 225-35.
Bashan B, Levy Y, 1992. Differential response of sweet corn cultivars to phytotoxic water-
soluble compounds from culture filtrates of Exserohilum turcicum. Plant Disease 76, 451-4.
Bennett JW, Klich M, 2003. Mycotoxins. Clinical Microbiology Reviews 16, 497-516.
34
Bentolila S, Guitton C, Bouvet N, Sailland A, Nykaza S, Freyssinet G, 1991. Identification of
an RFLP marker tightly linked to the Ht1 gene in maize. Theoretical and Applied Genetics 82,
393-8.
Berestetskiy A, Dmitriev A, Mitina G, Lisker I, Andolfi A, Evidente A, 2008. Nonenolides and
cytochalasins with phytotoxic activity against Cirsium arvense and Sonchus arvensis: a
structure-activity relationships study. Phytochemistry 69, 953-60.
Bogyo TP, 1956. Maize varieties in Natal and East Griqualand. In. Farming in S.A.
Borchardt DS, Welz HG, Geiger HH, 1998. Genetic Structure of Setosphaeria turcica
populations in tropical and temperate cimates. Phytopathology 88, 322-9.
Brent KJ, Hollomon DW, 1998. Fungicide resistance: the assessment of risk. Global Crop
Protection Federation Brussels.
Brosch G, Ransom R, Lechner T, Walton JD, Loidl P, 1995. Inhibition of maize histone
deacetylases by HC toxin, the host-selective toxin of Cochliobolus carbonum. Plant Cell 7,
1941-50.
Carson M, 1995a. A new gene in maize conferring the "chlorotic halo" reaction to infection by
Exserohilum turcicum. Plant Disease 79, 717-20.
Carson ML, 1995b. Inheritance of latent period length in maize Infected with Exserohilum
turcicum. Plant Disease 79.
Chung CL, Longfellow JM, Walsh EK, et al., 2010. Resistance loci affecting distinct stages of
fungal pathogenesis: use of introgression lines for QTL mapping and characterization in the
maize - Setosphaeria turcica pathosystem. BMC Plant Biology 10, 103.
Ciuffetti LM, Manning VA, Pandelova I, Betts MF, Martinez JP, 2010. Host-selective toxins,
Ptr ToxA and Ptr ToxB, as necrotrophic effectors in the Pyrenophora tritici-repentis-wheat
interaction. New phytologist 187, 911-9.
Claydon N, Grove JF, Pople M, 1979. Insecticidal secondary metabolic products from the
entomogenous fungus Fusarium larvarum. Journal of Invertebrate Pathology 33, 364-7.
Collemare J, Lebrun MH, 2011. Fungal secondary metabolites: ancient toxins and novel
effectors in plant–microbe interactions. In: Martin F, Kamoun S, eds. In effectors in plant–
microbe interactions. Oxford, UK: Wiley-Blackwell, 377-400.
35
Comstock JC, Martinson CA, Gengenbach BG, 1973. Host specificity of a toxin from
Phyllosticta maydis for Texas cytoplasmically male-sterile maize. Phytopathology 63, 1357–
61.
Condon BJ, Leng Y, Wu D, et al., 2013. Comparative genome structure, secondary metabolite,
and effector coding capacity across Cochliobolus pathogens. PLOS Genetics 9, e1003233.
Crous PW, Groenewald JZ, Groenewald M, Caldwell P, Braun U, Harrington TC, 2006.
Species of Cercospora associated with grey leaf spot of maize. Studies in Mycology 55, 189-
97.
Cuq F, Brown SC, Petitprez M, Alibert G, 1995. Effects of monocerin on cell-cycle progression
in maize root-meristems synchronized with aphidicolin. Plant Cell Reports 15, 138-42.
Cuq F, Petitprez M, Herrmann-Gorline S, Klaebe A, Rossignol M, 1993. Monocerin in
Exserohilum turcicum isolates from maize and a study of its phytotoxicity. Phytochemistry 34,
1265-70.
Daub ME, Ehrenshaft M, 2000. The photoactivated Cercospora toxin cercosporin:
Contributions to plant disease and fundamental biology. Annual Review of Phytopathology 38,
461-90.
Dingerdissen AL, Geiger HH, Lee M, Schechert A, Welz HG, 1996. Interval mapping of genes
for quantitative resistance of maize to Setosphaeria turcica, cause of Northern leaf blight, in a
tropical environment. Molecular Breeding 2, 143-56.
Drechsler C, 1923. Some graminicolons species of Helminthosporium. Journal of Agricultural
Research 24, 641-739.
Du Plessis J, 2003. Maize production. Pretoria, South Africa: Department of Agriculture.
Dunkle LD, Levy M, 2000. Genetic relatedness of African and United States populations of
Cercospora zeae-maydis. Phytopathology 90, 486-90.
FAOSTAT, 2018. FAO statistical database. In. Rome, Italy: Food and Agricultural
Organization of the United Nations.
Friesen TL, Faris JD, Solomon PS, Oliver RP, 2008. Host-specific toxins: effectors of
necrotrophic pathogenicity. Cell Microbiology 10, 1421-8.
Gevers H, 1975. A new major gene for resistance to Helminthosporium turcicum leaf blight of
maize. Plant Disease Reporter 59, 296-9.
36
Grain_SA, 2018. In. Pretoria, South Africa: Grain SA.
Grove JF, Pople M, 1979. Metabolic products of Fusarium larvarum fuckel. The fusarentins
and the absolute configuration of monocerin. Journal of the Chemical Society, Perkin
Transactions 1, 2048-51.
Haasbroek MP, 2014. Characterization of Exserohilum turcicum isolates from South African
maize production areas. Pretoria, University of Pretoria, MSc dissertation.
Hilu HM, Hooker AL, 1964. Host-pathogen relationship of Helminthosporium turcicum in
resistant and susceptible corn seedlings. Phytopathology 54, 570-5.
Hooker AL, 1961. A new type of resistance in corn to Helminthosporium turcicum. Plant
Disease Reporter 45, 780-1.
Hooker AL, 1963a. Inheritance of chlorotic-lesion resistance to Helminthosporium turcicum in
seedling corn. Phytopathology 53, 660-2.
Hooker AL, 1963b. Monogenic resistance in Zea mays L. to Helminthosporium turcicum. Crop
science 3, 381-3.
Hooker AL, 1977. A second major gene locus in corn for chlorotic-lesion resistance to
Helminthosporium turicum. Crop science 17.
Hooker AL, 1978. Additional sources of monogenic resistance in corn to Helminthosporium
turcicum. Crop science 18.
Hooker AL, 1981. Resistance to Helminthosporium turcicum from Tripsacum floridanum
incorporated into corn. Maize Genetics Cooperation Newsletter 55, 87-8.
Human MP, 2019. Effector identification from the susceptible Exserohilum turcicum – Zea
mays interaction. Pretoria, University of Pretoria, PhD Thesis.
Jennings P, Ullstrup A, 1957. A histological study of 3 Helminthosporium leaf blights of corn.
Phytopathology 47, 707-14.
Jenns AE, 1989. Regulation of cercosporin accumulation in culture by medium and
temperature manipulation. Phytopathology 79.
Kabir MS, Ganley RJ, Bradshaw RE, 2015. Dothistromin toxin is a virulence factor in
dothistroma needle blight of pines. Plant Pathology 64, 225-34.
37
Kim H-J, Kim J-C, Kim B-S, Kim H-G, Cho K-Y, 1999. Antibiotic and phytotoxic activities
of ophiobolins from Helminthosporium species. The Plant Pathology Journal 15, 14-20.
Klopper R, Tweer S, 2009a. Grey leaf spot fact sheet.
[http://www.pannar.com/assets/disease_fact_sheets/Grey_Leaf_Spot.pdf]. Accessed 10 July
2018.
Klopper R, Tweer S, 2009b. Northern corn leaf blight fact sheet.
[http://www.pannar.com/assets/disease_fact_sheets/Northern_Corn_Leaf_Blight.pdf].
Accessed 11 November 2019.
Knox-Davies P, 1974. Penetration of maize leaves by Helminthosporium turcicum.
Phytopathology 64, 1468-70.
Koohafkan P, Stewart BA, 2008. Water and cereals in drylands. The Food and Agriculture
Organization of the United Nations and Earthscan.
Kubicek CP, Starr TL, Glass NL, 2014. Plant cell wall-degrading enzymes and their secretion
in plant-pathogenic fungi. Annual Review of Phytopathology 52, 427-51.
Larkin PJ, Scowcroft WR, 1981. Eyespot Disease of Sugarcane : Induction of host-specific
toxin and its interaction with leaf cells. Plant Physiology 67, 408-14.
Latterell FM, Rossi AE, 1983. Gray leaf spot of corn: a disease on the move. Plant Disease 67,
842-7.
Leach CM, Fullerton RA, Young K, 1977. Northern leaf blight of maize in New Zealand:
relationship of Drechslera turcia airspora to factors onfluencing sporulation, conidium
development, and chlamydospore formation. Phytopathology 77, 629.
Leonard KJ, Levy Y, Smith DR, 1989. Proposed nomenclature for pathogenic races of
Exserohilum turcicum on corn. Plant Disease 73, 776-7.
Leonard KJ, Suggs EG, 1974. Setosphaeria prolata, the ascigerous state of Exserohilum
prolatum. Mycologia 66, 281-97.
Levy Y, Cohen Y, 1983a. Biotic and environmental factors affecting infection of sweet corn
with Exserohilum turcicum. Phytopathology 73, 722-5.
Levy Y, Cohen Y, 1983b. Differential effect of light on spore germination of Exserohilum
turcicum on corn leaves and corn leaf impressions. Phytopathology 73, 249-52.

38
Levy Y, Cohen Y, 1984. A negative association between leaf sugar content and the
development of northern leaf blight lesions in sweet corn. Physiological Plant Pathology 24,
247-52.
Levy Y, Pataky JK, 1992. Epidemiology of Northern leaf blight on sweet corn. Phytoparasitica
20, 53-66.
Lim C-H, 1999. Monocerin and ziganein: phytotoxins from pathogenic fungus Exserohilum
turcicum Inu-1. Agricultural Chemistry and Biotechnology 42, 45-7.
Lu S, Gillian Turgeon B, Edwards MC, 2015. A ToxA-like protein from Cochliobolus
heterostrophus induces light-dependent leaf necrosis and acts as a virulence factor with host
selectivity on maize. Fungal Genetics and Biology 81, 12-24.
Luttrell E, 1964. Systematics of Helminthosporium and related genera. Mycologia 56, 119-32.
Manamgoda DS, Cai L, Bahkali AH, Chukeatirote E, Hyde KD, 2011. Cochliobolus: an
overview and current status of species. Fungal Diversity 51, 3-42.
Markham JE, Hille J, 2001. Host-selective toxins as agents of cell death in plant-fungus
interactions. Molecular Plant Pathology 2, 229-39.
Martin T, Biruma M, Fridborg I, Okori P, Dixelius C, 2011. A highly conserved NB-LRR
encoding gene cluster effective against Setosphaeria turcica in sorghum. BMC Plant Biology
11, 151.
Meisel B, Korsman J, Kloppers FJ, Berger DK, 2009. Cercospora zeina is the causal agent of
grey leaf spot disease of maize in southern Africa. European Journal of Plant Pathology 124,
577-83.
Mideros SX, Chung C-L, Wiesner-Hanks T, et al., 2017. Determinants of virulence and in vitro
development colocalize on a genetic map of Setosphaeria turcica. Phytopathology 108, 254-
63.
Mobius N, Hertweck C, 2009. Fungal phytotoxins as mediators of virulence. Current Opinion
in Plant Biology 12, 390-8.
Mori K, Takaishi H, 1989. Synthesis of monocerin, an antifungal, insecticidal and phytotoxic
heptaketide metabolite of Exserohilum monoceras. Tetrahedron 45, 1639-46.
Munkvold GP, Desjardins AE, 1997. Fumonisins in maize: Can we reduce their occurrence?
Plant Disease 81, 556-65.
39
Munkvold GP, White DG, 2016. Compendium of Corn Diseases. APS press St. Paul, MN.
Ohm RA, Feau N, Henrissat B, et al., 2012. Diverse lifestyles and strategies of plant
pathogenesis encoded in the genomes of eighteen Dothideomycetes fungi. PLOS Pathogens 8,
e1003037.
Perkins J, Pedersen W, 1987. Disease development and yield losses associated with Northern
leaf blight on corn. Plant Disease 71, 940-3.
Petrov V, Qureshi MK, Hille J, Gechev T, 2018. Occurrence, biochemistry and biological
effects of host-selective plant mycotoxins. Food and Chemical Toxicology 112, 251-64.
Ransom RF, Walton JD, 1997. Histone hyperacetylation in maize in response to treatment with
HC-toxin or infection by the filamentous fungus Cochliobolus carbonum. Plant Physiology
115, 1021-7.
Rasmussen JB, Scheffer RP, 1988. Effects of selective toxin from Helminthosporium
carbonum on chlorophyll synthesis in maize. Physiological and Molecular Plant Pathology
32, 283-91.
Robert AL, Findley WR, 1952. Diseased corn leaves as a source of infection in artificial and
natural epidemics of Helminthosporium turcicum. Plant Disease Reporter 36, 9-10.
Robeson DJ, Strobel GA, 1982. Monocerin, a phytotoxin from Exserohilum turcicum (=
Drechslera turcica). Agricultural and Biological Chemistry 46, 2681-3.
Sappapan R, Sommit D, Ngamrojanavanich N, et al., 2008. 11-Hydroxymonocerin from the
plant endophytic fungus Exserohilum rostratum. Journal of natural products 71, 1657-9.
Scheffer RP, Livingston RS, 1984. Host-selective toxins and their role in plant diseases.
Science 223, 17-21.
Scott FE, Simpson TJ, Trimble LA, Vederas JC, 1984. Biosynthesis of monocerin.
Incorporation of 2H-, 13C-, and 18O-labelled acetates by Drechslera ravenelii. Journal of the
Chemical Society, Chemical Communications, 756.
Simcox KD, Bennetzen JL, 1993. The use of molecular markers to study Setosphaeria turcica
resistance in maize. Phytopathology 83, 1326-30.
Sivanesan A, 1987. Graminicolous species of Bipolaris, Curvularia, Drechslera, Exserohilum
and their teleomorphs. Mycological Papers 158, 1-261.
40
Smith CW, Betran J, Runge ECA, 2004. Corn : Origin, history, technology, and production.
Hoboken, N.J. :: John Wiley.
Smith D, Kinsey J, 1980. Further physiologic specialization in Helminthosporium turcicum.
Plant Disease 64, 779-81.
Stergiopoulos I, Collemare J, Mehrabi R, De Wit PJ, 2013. Phytotoxic secondary metabolites
and peptides produced by plant pathogenic Dothideomycete fungi. FEMS Microbiology
Reviews 37, 67-93.
Steyn PS, 1995. Mycotoxins, general view, chemistry and structure. Toxicology Letters 82-83,
843-51.
Stoessl A, Abramowski Z, Lester HH, Rock GL, Towers GHN, 1990. Further toxic properties
of the fungal metabolite dothistromin. Mycopathologia 112, 179-86.
Strobel G, Kenfield D, Sugawara F, 1988. The incredible fungal genus —Drechslera — and
its phytotoxic ophiobolins. Phytoparasitica 16, 145-52.
Sugawara F, Strobel G, Strange RN, Siedow JN, Van Duyne GD, Clardy J, 1987. Phytotoxins
from the pathogenic fungi Drechslera maydis and Drechslera sorghicola. Proceedings of the
National Academy of Sciences 84, 3081-5.
Swart V, Crampton BG, Ridenour JB, et al., 2017. Complementation of CTB7 in the Maize
Pathogen Cercospora zeina Overcomes the Lack of In Vitro Cercosporin Production.
Molecular Plant-Microbe Interactions 30, 710-24.
Tianpanich K, Prachya S, Wiyakrutta S, Mahidol C, Ruchirawat S, Kittakoop P, 2011. Radical
scavenging and antioxidant activities of isocoumarins and a phthalide from the endophytic
fungus Colletotrichum sp. Journal of natural products 74, 79-81.
Tsuge T, Harimoto Y, Akimitsu K, et al., 2013. Host-selective toxins produced by the plant
pathogenic fungus Alternaria alternata. FEMS Microbiology Reviews 37, 44-66.
Turner W, Aldridge D, 1983. Fungal metabolites, vol II. Paris: Academic, 257-9.
Ullstrup AJ, 1972. The impacts of the Southern corn leaf blight epidemics of 1970-1971.
Annual Review of Phytopathology 10, 37-50.
Upchurch RG, Walker DC, Rollins JA, Ehrenshaft M, Daub ME, 1991. Mutants of Cercospora
kikuchii altered in cercosporin synthesis and pathogenicity. Applied and Environmental
Microbiology 57, 2940-5.
41
Vieira RA, Mesquini RM, Silva CN, Hata FT, Tessmann DJ, Scapim CA, 2014. A new
diagrammatic scale for the assessment of Northern corn leaf blight. Crop Protection 56, 55-7.
Walton JD, 2006. HC-toxin. Phytochemistry 67, 1406-13.
Weems JD, Bradley CA, 2017. Sensitivity of Exserohilum turcicum to demethylation inhibitor
fungicides. Crop Protection 99, 85-92.
Williams LD, Glenn AE, Zimeri AM, Bacon CW, Smith MA, Riley RT, 2007. Fumonisin
disruption of ceramide biosynthesis in maize roots and the effects on plant development and
Fusarium verticillioides-induced seedling disease. Journal of agricultural and food chemistry
55, 2937-46.
Wise K, 2011. Diseases of Corn: Northern Corn Leaf Blight.
[https://www.extension.purdue.edu/extmedia/BP/BP-84-W.pdf]. 14 November 2019.
Wise K, Mueller D, 2011. Are fungicides no longer just for fungi? An analysis of foliar
fungicide use in corn. APSnet Features, -.
Wise K, Mueller D, Sisson A, Smith D, Bradley C, Robertson A, 2016. A Farmer’s Guide to
Corn Diseases. St. Paul, Minnesota: APS Press.
Wolpert TJ, Dunkle LD, Ciuffetti LM, 2002. Host-selective toxins and avirulence
determinants: what's in a name? Annual Review of Phytopathology 40, 251-85.
Yoder OC, 1980. Toxins in pathogenesis. Annual Review of Phytopathology 18, 103-29.
Zhang W, Krohn K, Draeger S, Schulz B, 2008. Bioactive isocoumarins isolated from the
endophytic fungus Microdochium bolleyi. Journal of natural products 71, 1078-81.

This chapter has been published as: Kotze, R.G., van der Merwe, C.F., Crampton, B.G.,
Kritzinger, Q., 2018. A histological assessment of the infection strategy of Exserohilum
turcicum in maize. Plant Pathology (DOI: 10.1111/ppa.12961).
Chapter 3: A histological assessment
of the infection strategy of
Exserohilum turcicum in maize
43
Abstract
Northern leaf blight is a lethal foliar disease of maize caused by the fungus Exserohilum
turcicum. The aim of this study was to elucidate the infection strategy of the fungus in maize
leaves using modern microscopy techniques and to understand better the hemibiotrophic
lifestyle of E. turcicum. Leaf samples were collected from inoculated B73 maize plants at 1, 4,
9, 11, 14 and 18 days post-inoculation (dpi). Samples were prepared according to standard
microscopy procedures and analysed using light microscopy as well as scanning (SEM) and
transmission electron microscopy (TEM). Microscopic observations were preceded by
macroscopic observations for each time point. The fungus penetrated the leaf epidermal cells
at 1 dpi and the disease was characterized by chlorotic leaf flecks. At 4 dpi the chlorotic flecks
enlarged to form spots, and at 9 dpi hyphae were seen in the epidermal cells surrounding the
infection site. At 11 dpi lesions started to form on the leaves and SEM revealed the presence
of hyphae in the vascular bundles. At 14 dpi the xylem was almost completely blocked by
hyphal growth. Hyphae spread into the adjacent bundle sheath cells causing cellular damage,
characterized by plasmolysis, at 18 dpi and conidiophores formed through the stomata.
Morphologically, lesions started to enlarge and coalesce leading to wilting of leaves. This study
provides an updated, detailed view of the infection strategy of E. turcicum in maize and
supports previous findings that E. turcicum follows a hemibiotrophic lifestyle.
Keywords: electron microscopy, Exserohilum turcicum, fungal infection, hemibiotroph, light
microscopy, northern leaf blight
44
3.1. Introduction
Northern leaf blight (NLB) is a devastating foliar disease of maize (Zea mays L.) and is a
serious threat to its production worldwide. In addition to maize, the disease can affect other
crops including sorghum (Sorghum bicolor (L.) Moench) and grass species (White, 1999;
Agrios, 2005). Currently, NLB is one of the most widespread diseases of maize in South Africa,
especially in the wetter eastern parts of the country (Klopper & Tweer, 2009) and causes
significant yield losses in both quality and quantity of the grain. Typical yield losses range
from 15% to 30% but can be as high as 75% during optimal disease conditions (Klopper &
Tweer, 2009). The disease is the most severe if infection happens before silking and spreads to
the upper leaves during grain filling (Perkins & Pedersen, 1987; Carson, 1995; Klopper &
Tweer, 2009). Yield losses can be predominantly ascribed to the loss of photosynthetic leaf
area due to the blighting of the leaves (Klopper & Tweer, 2009; Wise, 2011). Disease
development is favoured by dew periods of at least 4 h, 90–100% relative humidity (RH),
prolonged leaf wetness, and moderate temperatures ranging from 17 to 27°C (Levy & Cohen,
1983a; Bentolila et al., 1991; White, 1999; Klopper & Tweer, 2009; Wise, 2011).
Initial symptoms of NLB can be characterized by minute chlorotic flecks, which appear on
leaves after infection (White, 1999; Klopper & Tweer, 2009). Mature symptoms of NLB are
characterized by grey-green coloured elliptical or cigar-shaped lesions that are 2.5–17.5 cm in
length (White, 1999; Wise, 2011). As the disease progresses, the lesions start to mature and
become tan coloured with distinct dark zones that are associated with fungal sporulation
(White, 1999; Klopper & Tweer, 2009; Wise, 2011). In the advanced stages of the disease,
multiple lesions can coalesce forming large irregular areas of dead tissue on the leaves (Wise,
2011). In severe infection, almost all of the leaves may be infected and can be entirely blighted,
resembling frost or drought injury (White, 1999).
The causal agent of NLB is Exserohilum turcicum (sexual stage Setosphaeria turcica, syn.
Helminthosporium turcicum), which is a filamentous hemibiotrophic fungus from the class
Dothideomycetes (Leonard & Suggs, 1974). The hyphae are brown or grey to black in colour
and are 3–12 µm in diameter (Jennings & Ullstrup, 1957; Sivanesan, 1987). Conidia are the
primary inoculum by which the disease spreads from one plant to another. They are 73–137
µm in length and 18–23 µm in width, 3–8 septate, olive-brown in colour, spindle shaped with

45
a protruding hilum and exhibit bipolar germination (Luttrell, 1964; Levy & Cohen, 1983b;
White, 1999).
The infection strategy of E. turcicum has been previously described by Jennings and Ullstrup
(1957), Hilu and Hooker (1964); Hilu and Hooker (1965) and Knox-Davies (1974). Chung et
al. (2010) and Ohm et al. (2012) described E. turcicum as a hemibiotrophic fungus, which
initially lives as a biotroph, feeding off living host tissue; subsequently it switches to a
necrotrophic lifestyle, killing the infected cells of the host. In the first histological study on
NLB, carried out by Jennings and Ullstrup (1957), the authors used light microscopy (LM) to
determine whether there were any histological differences between resistant and susceptible
inbred lines of maize for three different Helminthosporium leaf blights, including NLB. In
addition, they compared the host–parasite relationship of these three blights with maize.
Similarly, Hilu and Hooker (1964) performed a histopathological study on E. turcicum in
resistant and susceptible maize types. Their study was expanded to include observations of the
cellular host response to fungal invasion and cytological changes associated with necrosis.
Additionally, Hilu and Hooker (1965) studied the localized infection as well as the histology
of virulent and avirulent isolates of E. turcicum in susceptible maize seedlings. Knox-Davies
(1974) observed fine infection hyphae (penetration pegs) that developed from the appressoria
of E. turcicum during the penetration of the epidermal cells of maize leaves. Although the
above-mentioned studies gave insight into the histopathology following infection by E.
turcicum, only light microscopy was used. In addition, it is often difficult to interpret some
micrographs from these studies due to their poor reproduction quality.
Other microscopy techniques that can be used to examine host–pathogen interactions include
scanning electron microscopy (SEM), transmission electron microscopy (TEM) and confocal
microscopy. Transmission electron microscopy is useful in visualizing the ultrastructure of
cells whereas, with SEM, the topography of the leaf surface and subsequent infection sites can
be observed. Confocal microscopy is a valuable tool to study the initial infection phase of a
fungus when it is difficult to detect the fungal infection structures in the leaf.
The present study was originated to characterize the infection process of E. turcicum in maize
in order to correlate cytological processes with on-going molecular host–pathogen interaction
studies in the laboratory (M. Human, University of Pretoria, Pretoria, South Africa, personal
communication). Thus, the aims of this study were, first, to use light and electron microscopy
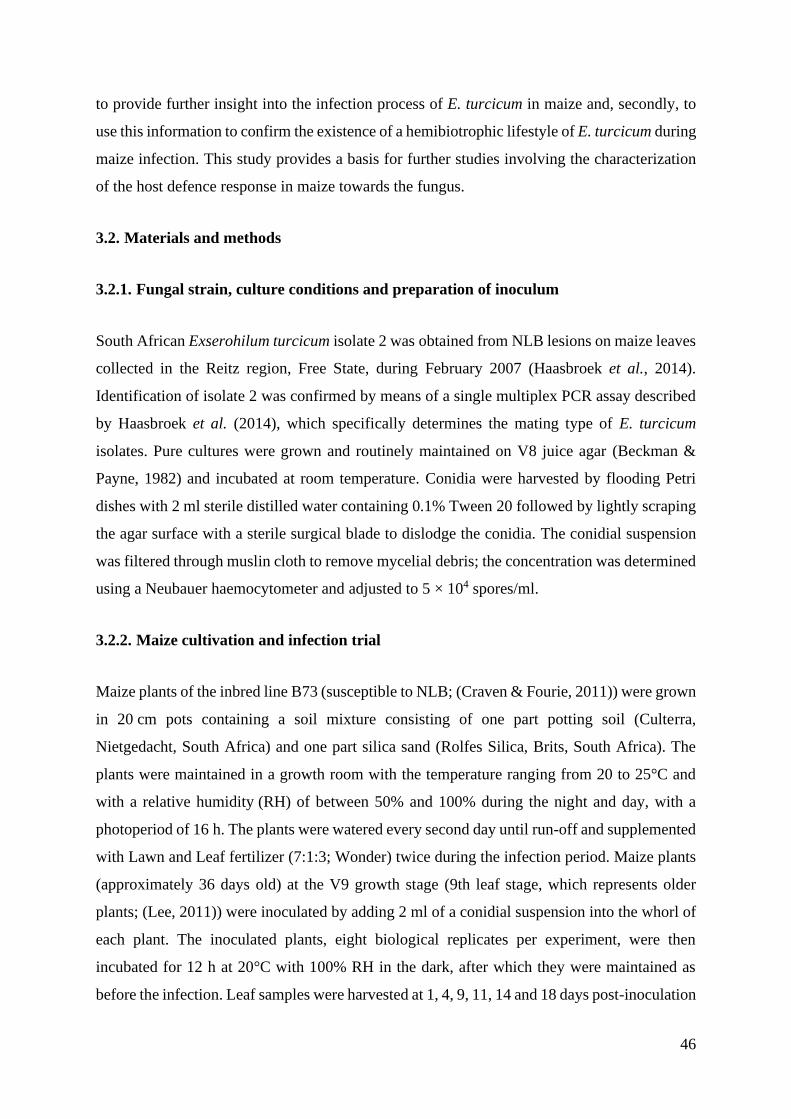
46
to provide further insight into the infection process of E. turcicum in maize and, secondly, to
use this information to confirm the existence of a hemibiotrophic lifestyle of E. turcicum during
maize infection. This study provides a basis for further studies involving the characterization
of the host defence response in maize towards the fungus.
3.2. Materials and methods
3.2.1. Fungal strain, culture conditions and preparation of inoculum
South African Exserohilum turcicum isolate 2 was obtained from NLB lesions on maize leaves
collected in the Reitz region, Free State, during February 2007 (Haasbroek et al., 2014).
Identification of isolate 2 was confirmed by means of a single multiplex PCR assay described
by Haasbroek et al. (2014), which specifically determines the mating type of E. turcicum
isolates. Pure cultures were grown and routinely maintained on V8 juice agar (Beckman &
Payne, 1982) and incubated at room temperature. Conidia were harvested by flooding Petri
dishes with 2 ml sterile distilled water containing 0.1% Tween 20 followed by lightly scraping
the agar surface with a sterile surgical blade to dislodge the conidia. The conidial suspension
was filtered through muslin cloth to remove mycelial debris; the concentration was determined
using a Neubauer haemocytometer and adjusted to 5 × 10⁴ spores/ml.
3.2.2. Maize cultivation and infection trial
Maize plants of the inbred line B73 (susceptible to NLB; (Craven & Fourie, 2011)) were grown
in 20 cm pots containing a soil mixture consisting of one part potting soil (Culterra,
Nietgedacht, South Africa) and one part silica sand (Rolfes Silica, Brits, South Africa). The
plants were maintained in a growth room with the temperature ranging from 20 to 25°C and
with a relative humidity (RH) of between 50% and 100% during the night and day, with a
photoperiod of 16 h. The plants were watered every second day until run-off and supplemented
with Lawn and Leaf fertilizer (7:1:3; Wonder) twice during the infection period. Maize plants
(approximately 36 days old) at the V9 growth stage (9th leaf stage, which represents older
plants; (Lee, 2011)) were inoculated by adding 2 ml of a conidial suspension into the whorl of
each plant. The inoculated plants, eight biological replicates per experiment, were then
incubated for 12 h at 20°C with 100% RH in the dark, after which they were maintained as
before the infection. Leaf samples were harvested at 1, 4, 9, 11, 14 and 18 days post-inoculation
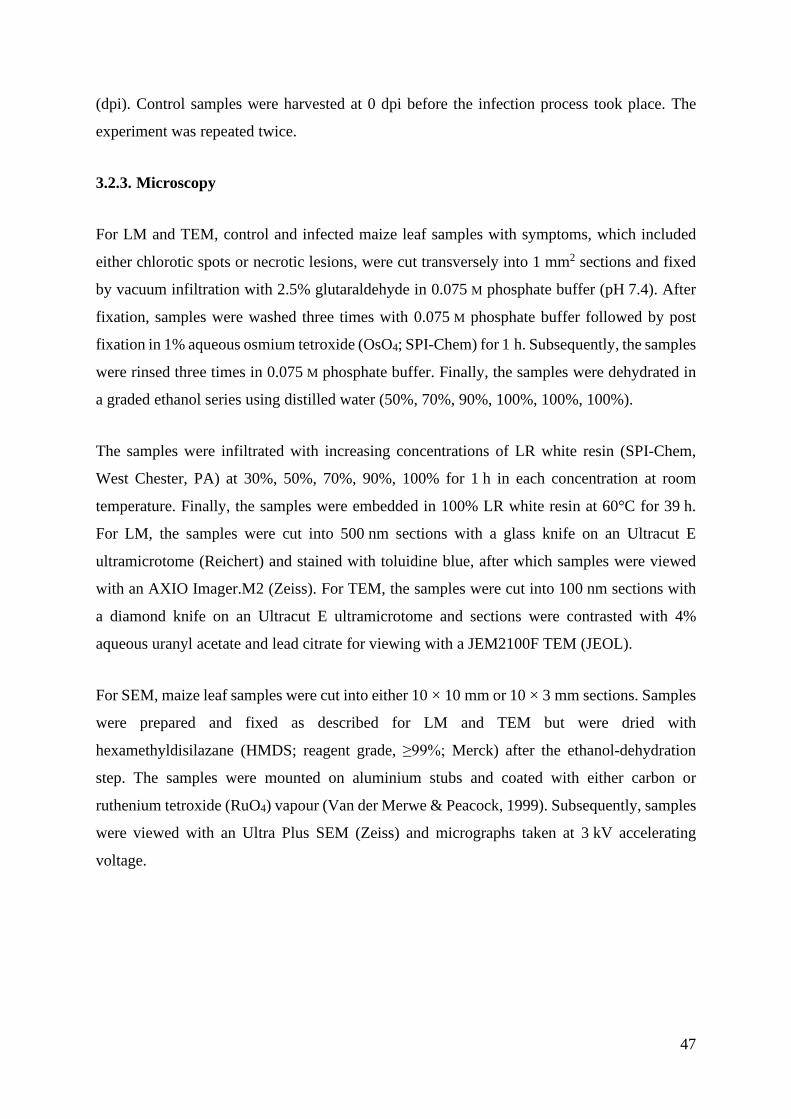
47
(dpi). Control samples were harvested at 0 dpi before the infection process took place. The
experiment was repeated twice.
3.2.3. Microscopy
For LM and TEM, control and infected maize leaf samples with symptoms, which included
either chlorotic spots or necrotic lesions, were cut transversely into 1 mm2 sections and fixed
by vacuum infiltration with 2.5% glutaraldehyde in 0.075 M phosphate buffer (pH 7.4). After
fixation, samples were washed three times with 0.075 M phosphate buffer followed by post
fixation in 1% aqueous osmium tetroxide (OsO4; SPI-Chem) for 1 h. Subsequently, the samples
were rinsed three times in 0.075 M phosphate buffer. Finally, the samples were dehydrated in
a graded ethanol series using distilled water (50%, 70%, 90%, 100%, 100%, 100%).
The samples were infiltrated with increasing concentrations of LR white resin (SPI-Chem,
West Chester, PA) at 30%, 50%, 70%, 90%, 100% for 1 h in each concentration at room
temperature. Finally, the samples were embedded in 100% LR white resin at 60°C for 39 h.
For LM, the samples were cut into 500 nm sections with a glass knife on an Ultracut E
ultramicrotome (Reichert) and stained with toluidine blue, after which samples were viewed
with an AXIO Imager.M2 (Zeiss). For TEM, the samples were cut into 100 nm sections with
a diamond knife on an Ultracut E ultramicrotome and sections were contrasted with 4%
aqueous uranyl acetate and lead citrate for viewing with a JEM2100F TEM (JEOL).
For SEM, maize leaf samples were cut into either 10 × 10 mm or 10 × 3 mm sections. Samples
were prepared and fixed as described for LM and TEM but were dried with
hexamethyldisilazane (HMDS; reagent grade, ≥99%; Merck) after the ethanol-dehydration
step. The samples were mounted on aluminium stubs and coated with either carbon or
ruthenium tetroxide (RuO4) vapour (Van der Merwe & Peacock, 1999). Subsequently, samples
were viewed with an Ultra Plus SEM (Zeiss) and micrographs taken at 3 kV accelerating
voltage.

48
3.3. Results
The effect of E. turcicum infection on maize leaf morphology, anatomy, cell ultrastructure and
integrity was examined during the progression of NLB disease in maize. The life cycle of
E. turcicum in planta was usually completed within 18 days after inoculation of maize leaves
in the growth room. A 100% infection rate was observed for all maize plants.
Throughout the study, the control noninfected maize plants exhibited no visible NLB infection
and the leaves were healthy and intact (Figure 3.1, a). Additionally, the light and scanning
electron micrographs of the control tissue showed intact cells with clearly defined chloroplasts
and nuclei in the spongy mesophyll and bundle sheath cells (Figure 3.2, a & Figure 3.3, a).
Intact vascular bundles were also observed.
Penetration of the maize leaf by E. turcicum typically elicited localized host responses, which
resulted in very small visible chlorotic flecks seen at 1 dpi (Figure 3.1, b). These flecks occurred
where the fungus had penetrated the leaf epidermis. Penetration of the leaf epidermal cells
occurred between 12 and 18 h post-inoculation. Scanning electron micrographs (Figure 3.3, b)
revealed that conidial germination and penetration of the leaf epidermis occurred within 1 dpi.
Germinated conidia produced germ tubes, which grew towards leaf epidermal cell walls and
subsequently formed appressoria (Figure 3.3, b). In this study conidia were on average 70–
105 µm in length (Appendix, Figure 7.1), germ tubes were 35–300 µm long and appressoria
were 12–22 µm in width. Penetration of the leaf epidermis was direct and occurred at the
juncture between epidermal cell walls; it was not observed to occur through the stomata or leaf
trichomes even when in close contact with both these structures (Figure 3.3, c).
Morphologically, at 4 dpi chlorotic flecks had enlarged to form chlorotic spots on infected
maize leaves (Figure 3.1, c) but microscopically the fungus was not observed in the leaf tissue.
Light micrographs of paradermal sections of infected maize leaves harvested at 9 dpi revealed
that the tissue in the necrotic spots had collapsed compared to the surrounding healthy tissue
(Figure 7.2, a); complete tissue degradation was evident and cells were necrotic (Figure 7.2, b).
A hypha of E. turcicum was observed in an epidermal cell in close proximity to one of these
spots (Figure 3.2, b). At a macroscopic level, the necrotic spots stayed the same size from 4 dpi
until 11 dpi.
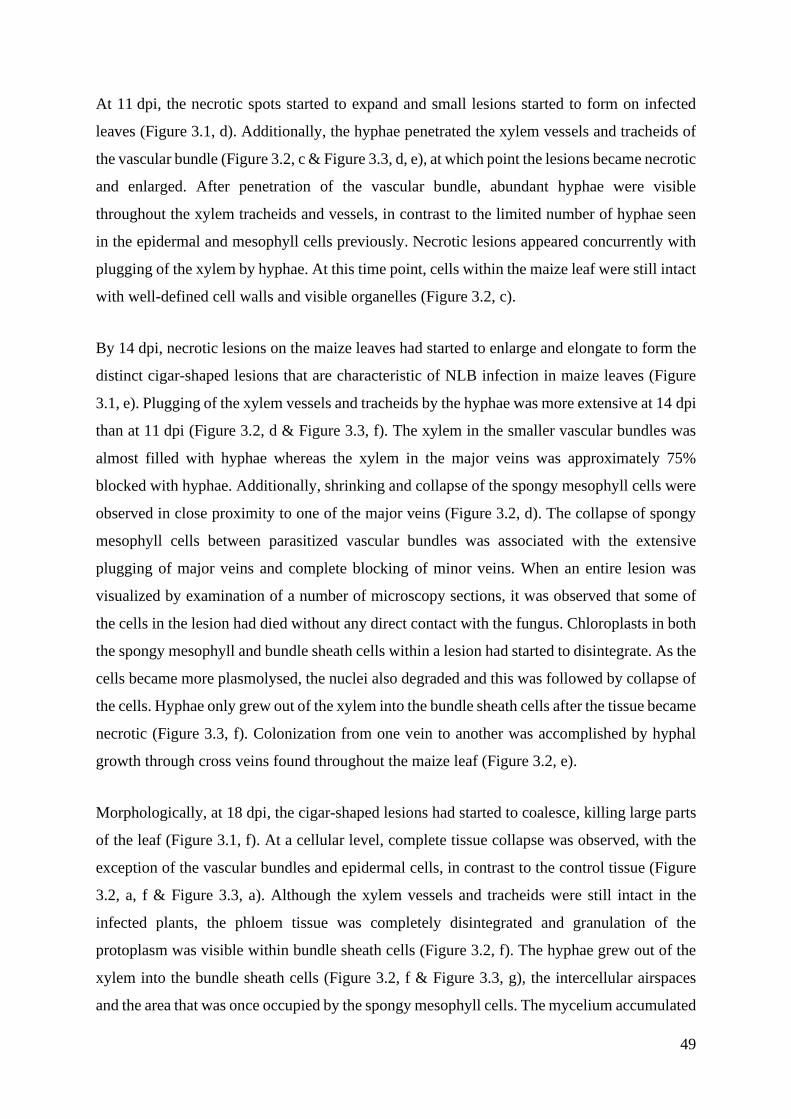
49
At 11 dpi, the necrotic spots started to expand and small lesions started to form on infected
leaves (Figure 3.1, d). Additionally, the hyphae penetrated the xylem vessels and tracheids of
the vascular bundle (Figure 3.2, c & Figure 3.3, d, e), at which point the lesions became necrotic
and enlarged. After penetration of the vascular bundle, abundant hyphae were visible
throughout the xylem tracheids and vessels, in contrast to the limited number of hyphae seen
in the epidermal and mesophyll cells previously. Necrotic lesions appeared concurrently with
plugging of the xylem by hyphae. At this time point, cells within the maize leaf were still intact
with well-defined cell walls and visible organelles (Figure 3.2, c).
By 14 dpi, necrotic lesions on the maize leaves had started to enlarge and elongate to form the
distinct cigar-shaped lesions that are characteristic of NLB infection in maize leaves (Figure
3.1, e). Plugging of the xylem vessels and tracheids by the hyphae was more extensive at 14 dpi
than at 11 dpi (Figure 3.2, d & Figure 3.3, f). The xylem in the smaller vascular bundles was
almost filled with hyphae whereas the xylem in the major veins was approximately 75%
blocked with hyphae. Additionally, shrinking and collapse of the spongy mesophyll cells were
observed in close proximity to one of the major veins (Figure 3.2, d). The collapse of spongy
mesophyll cells between parasitized vascular bundles was associated with the extensive
plugging of major veins and complete blocking of minor veins. When an entire lesion was
visualized by examination of a number of microscopy sections, it was observed that some of
the cells in the lesion had died without any direct contact with the fungus. Chloroplasts in both
the spongy mesophyll and bundle sheath cells within a lesion had started to disintegrate. As the
cells became more plasmolysed, the nuclei also degraded and this was followed by collapse of
the cells. Hyphae only grew out of the xylem into the bundle sheath cells after the tissue became
necrotic (Figure 3.3, f). Colonization from one vein to another was accomplished by hyphal
growth through cross veins found throughout the maize leaf (Figure 3.2, e).
Morphologically, at 18 dpi, the cigar-shaped lesions had started to coalesce, killing large parts
of the leaf (Figure 3.1, f). At a cellular level, complete tissue collapse was observed, with the
exception of the vascular bundles and epidermal cells, in contrast to the control tissue (Figure
3.2, a, f & Figure 3.3, a). Although the xylem vessels and tracheids were still intact in the
infected plants, the phloem tissue was completely disintegrated and granulation of the
protoplasm was visible within bundle sheath cells (Figure 3.2, f). The hyphae grew out of the
xylem into the bundle sheath cells (Figure 3.2, f & Figure 3.3, g), the intercellular airspaces
and the area that was once occupied by the spongy mesophyll cells. The mycelium accumulated
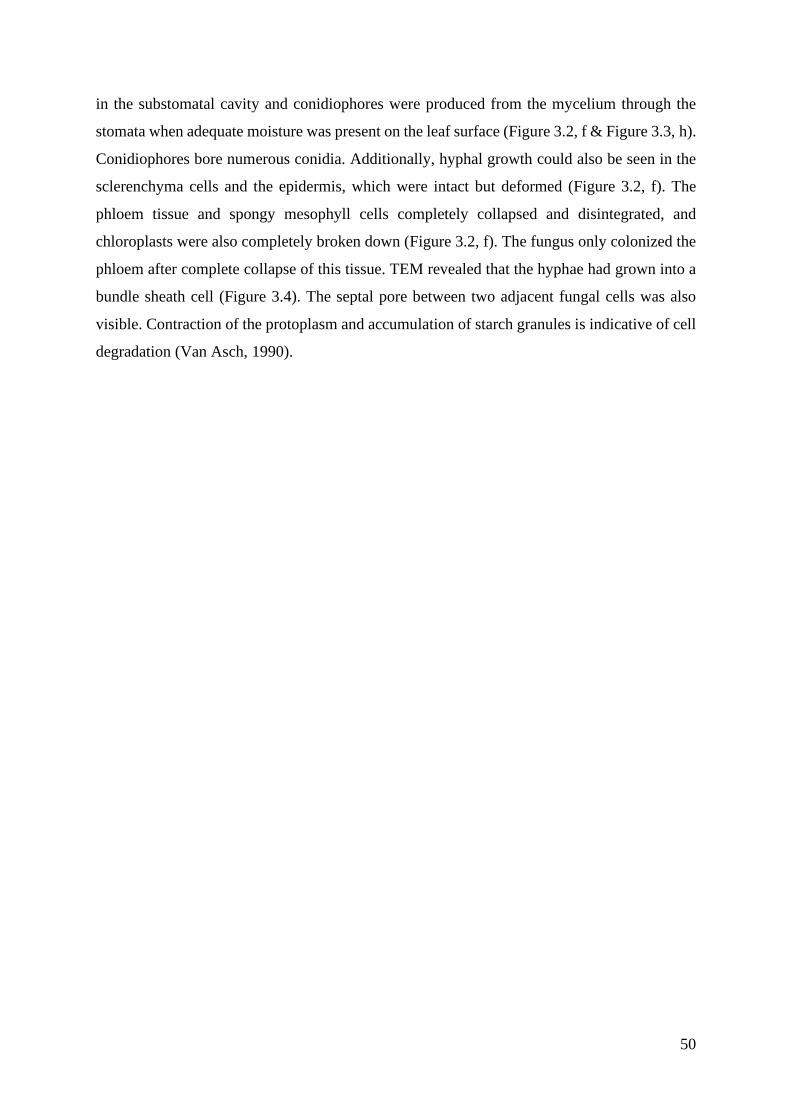
50
in the substomatal cavity and conidiophores were produced from the mycelium through the
stomata when adequate moisture was present on the leaf surface (Figure 3.2, f & Figure 3.3, h).
Conidiophores bore numerous conidia. Additionally, hyphal growth could also be seen in the
sclerenchyma cells and the epidermis, which were intact but deformed (Figure 3.2, f). The
phloem tissue and spongy mesophyll cells completely collapsed and disintegrated, and
chloroplasts were also completely broken down (Figure 3.2, f). The fungus only colonized the
phloem after complete collapse of this tissue. TEM revealed that the hyphae had grown into a
bundle sheath cell (Figure 3.4). The septal pore between two adjacent fungal cells was also
visible. Contraction of the protoplasm and accumulation of starch granules is indicative of cell
degradation (Van Asch, 1990).
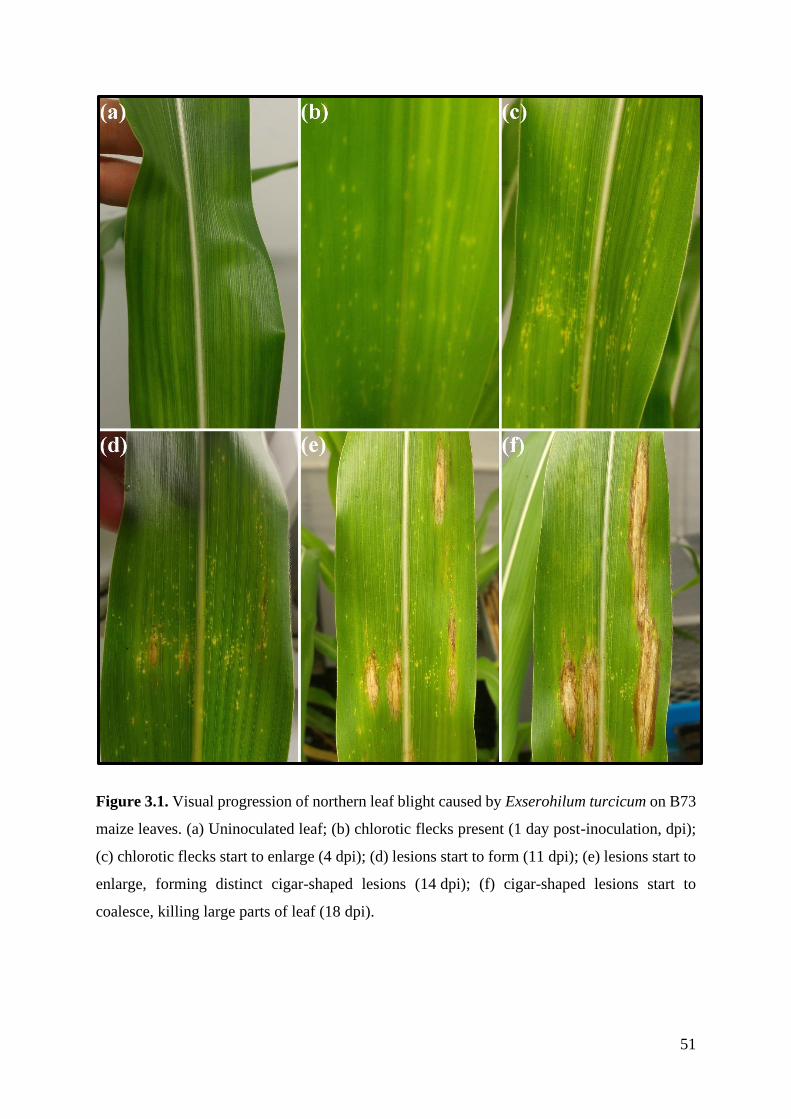
51
Figure 3.1. Visual progression of northern leaf blight caused by Exserohilum turcicum on B73
maize leaves. (a) Uninoculated leaf; (b) chlorotic flecks present (1 day post-inoculation, dpi);
(c) chlorotic flecks start to enlarge (4 dpi); (d) lesions start to form (11 dpi); (e) lesions start to
enlarge, forming distinct cigar-shaped lesions (14 dpi); (f) cigar-shaped lesions start to
coalesce, killing large parts of leaf (18 dpi).
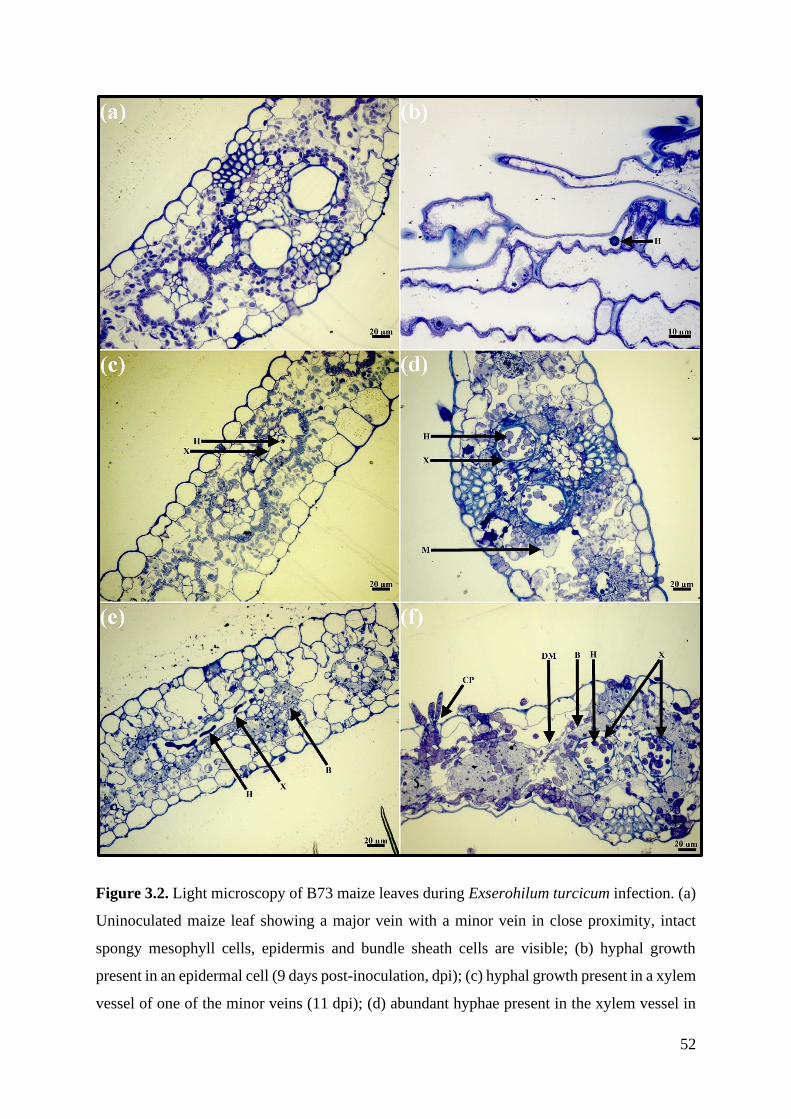
52
Figure 3.2. Light microscopy of B73 maize leaves during Exserohilum turcicum infection. (a)
Uninoculated maize leaf showing a major vein with a minor vein in close proximity, intact
spongy mesophyll cells, epidermis and bundle sheath cells are visible; (b) hyphal growth
present in an epidermal cell (9 days post-inoculation, dpi); (c) hyphal growth present in a xylem
vessel of one of the minor veins (11 dpi); (d) abundant hyphae present in the xylem vessel in
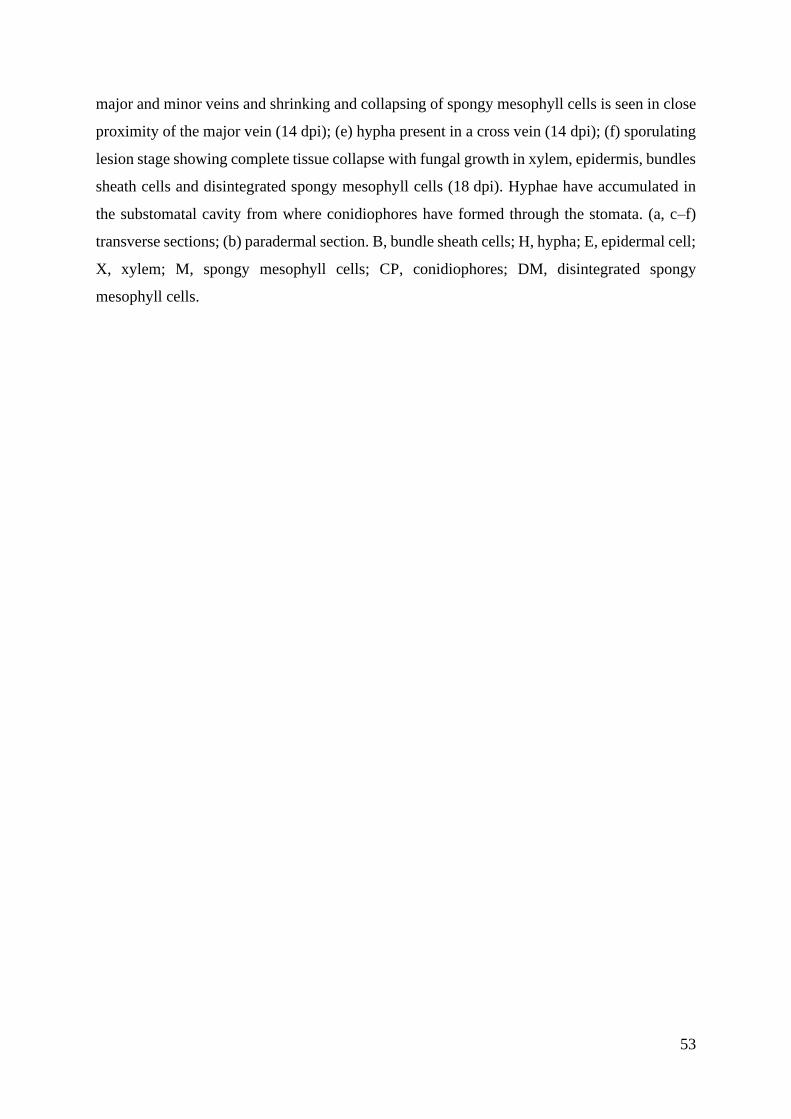
53
major and minor veins and shrinking and collapsing of spongy mesophyll cells is seen in close
proximity of the major vein (14 dpi); (e) hypha present in a cross vein (14 dpi); (f) sporulating
lesion stage showing complete tissue collapse with fungal growth in xylem, epidermis, bundles
sheath cells and disintegrated spongy mesophyll cells (18 dpi). Hyphae have accumulated in
the substomatal cavity from where conidiophores have formed through the stomata. (a, c–f)
transverse sections; (b) paradermal section. B, bundle sheath cells; H, hypha; E, epidermal cell;
X, xylem; M, spongy mesophyll cells; CP, conidiophores; DM, disintegrated spongy
mesophyll cells.

54
Figure 3.3. Scanning electron microscopy of B73 maize leaves during infection by
Exserohilum turcicum. (a) Uninoculated maize leaf, transverse section of a major vein with
intact cells; (b, c) a germinating conidium (C) with a germination tube (G) and appressorium
55
(A) in close proximity to a stomata (S) and a trichome (T) at 1 dpi; (d) hyphal growth (arrowed)
in the xylem (11 dpi); (e) a single hypha growing through a xylem vessel (X), the lignified
secondary cell wall is also present; (f) extensive plugging of the xylem with hyphae (arrowed;
14 dpi); (g) hyphal growth through two adjacent bundle sheath cells (B); (h) conidiophores
emerging through a stomata.
Figure 3.4. Transmission electron micrograph of bundle sheath cell of a B73 maize leaf
infected by Exserohilum turcicum. Hyphae (H) are present in the bundle sheath cell and the
septum is intact with a septal pore (SP). Contraction of the protoplasm and the accumulation
of starch granules (SG) indicate that the bundle sheath cell is degrading.
3.4. Discussion
In the present study, high-resolution SEM and TEM as well as LM microscopy were used to
study the infection strategy of E. turcicum in maize. Studying the host–pathogen relationship
between maize and E. turcicum contributes to knowledge of the pathogenicity of the fungus
and may also assist in developing improved ways to prevent the disease in maize. In general,
the histological observations made during this study are in agreement with those made by
Jennings and Ullstrup (1957), Hilu and Hooker (1964), Hilu and Hooker (1965) and Knox-
Davies (1974). However, this study employed technological advancements in microscopy
techniques that allowed the researchers to improve observations and advance scientific
understanding of the interaction between the host and pathogen. To the best of the researchers’
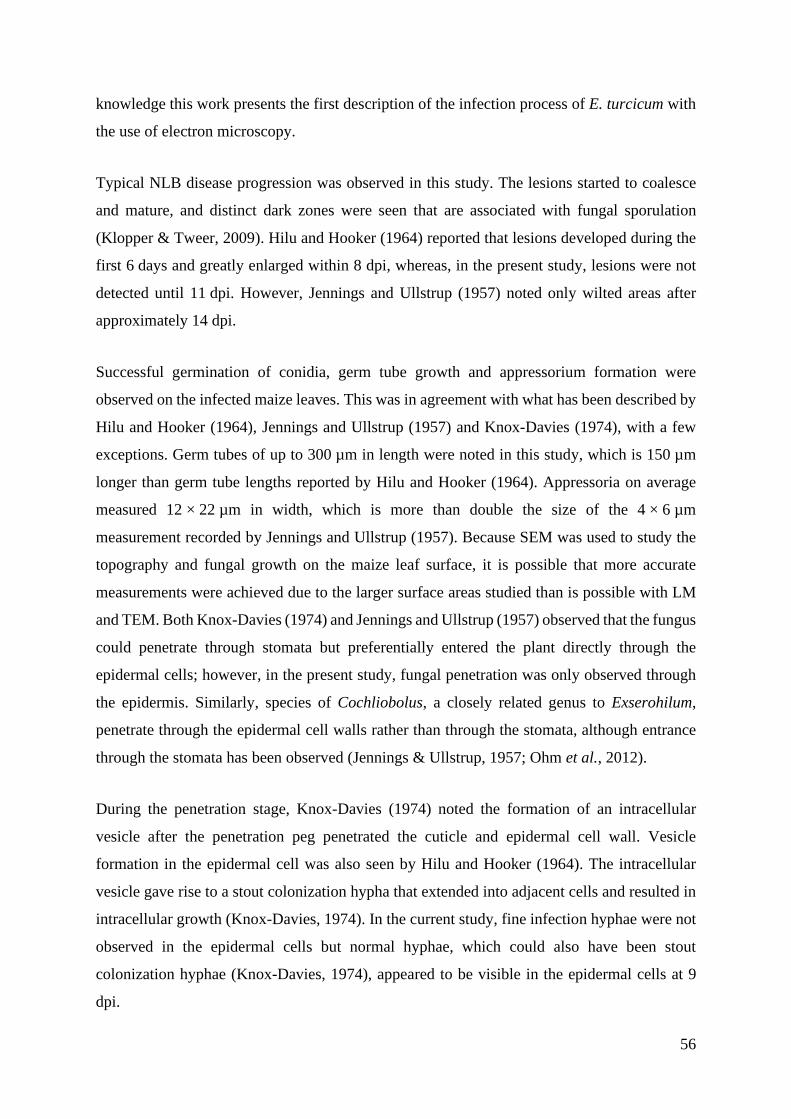
56
knowledge this work presents the first description of the infection process of E. turcicum with
the use of electron microscopy.
Typical NLB disease progression was observed in this study. The lesions started to coalesce
and mature, and distinct dark zones were seen that are associated with fungal sporulation
(Klopper & Tweer, 2009). Hilu and Hooker (1964) reported that lesions developed during the
first 6 days and greatly enlarged within 8 dpi, whereas, in the present study, lesions were not
detected until 11 dpi. However, Jennings and Ullstrup (1957) noted only wilted areas after
approximately 14 dpi.
Successful germination of conidia, germ tube growth and appressorium formation were
observed on the infected maize leaves. This was in agreement with what has been described by
Hilu and Hooker (1964), Jennings and Ullstrup (1957) and Knox-Davies (1974), with a few
exceptions. Germ tubes of up to 300 µm in length were noted in this study, which is 150 µm
longer than germ tube lengths reported by Hilu and Hooker (1964). Appressoria on average
measured 12 × 22 µm in width, which is more than double the size of the 4 × 6 µm
measurement recorded by Jennings and Ullstrup (1957). Because SEM was used to study the
topography and fungal growth on the maize leaf surface, it is possible that more accurate
measurements were achieved due to the larger surface areas studied than is possible with LM
and TEM. Both Knox-Davies (1974) and Jennings and Ullstrup (1957) observed that the fungus
could penetrate through stomata but preferentially entered the plant directly through the
epidermal cells; however, in the present study, fungal penetration was only observed through
the epidermis. Similarly, species of Cochliobolus, a closely related genus to Exserohilum,
penetrate through the epidermal cell walls rather than through the stomata, although entrance
through the stomata has been observed (Jennings & Ullstrup, 1957; Ohm et al., 2012).
During the penetration stage, Knox-Davies (1974) noted the formation of an intracellular
vesicle after the penetration peg penetrated the cuticle and epidermal cell wall. Vesicle
formation in the epidermal cell was also seen by Hilu and Hooker (1964). The intracellular
vesicle gave rise to a stout colonization hypha that extended into adjacent cells and resulted in
intracellular growth (Knox-Davies, 1974). In the current study, fine infection hyphae were not
observed in the epidermal cells but normal hyphae, which could also have been stout
colonization hyphae (Knox-Davies, 1974), appeared to be visible in the epidermal cells at 9
dpi.
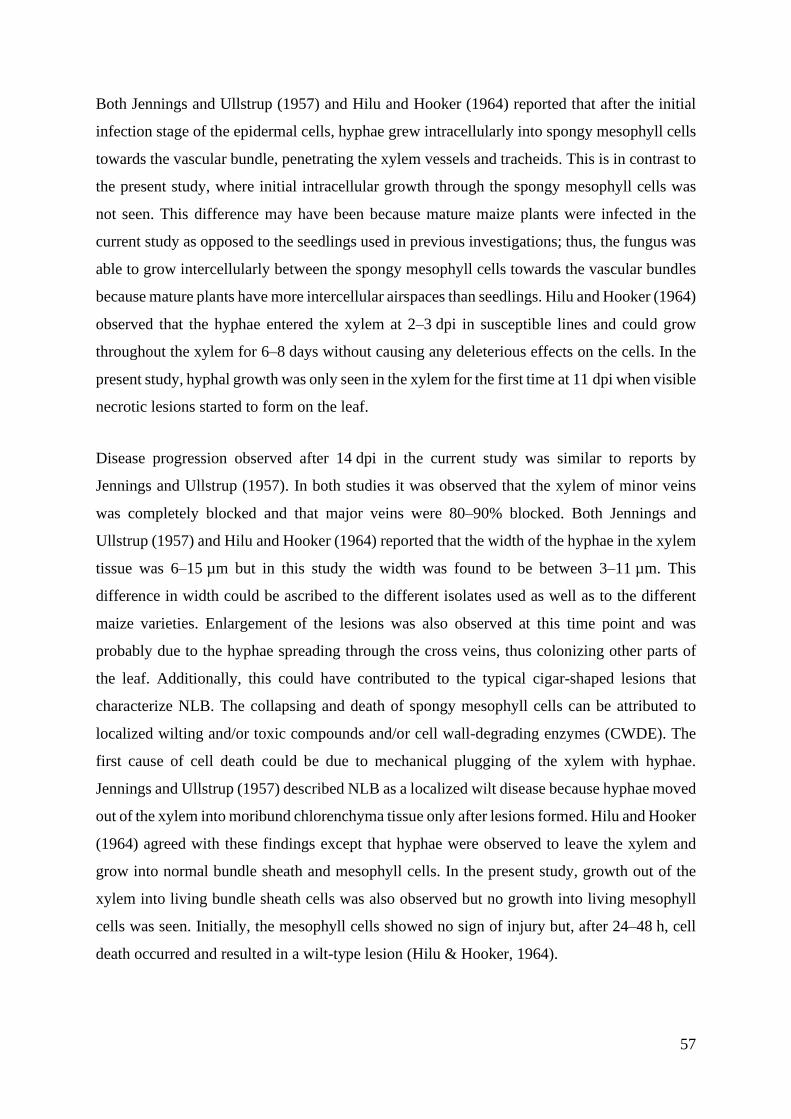
57
Both Jennings and Ullstrup (1957) and Hilu and Hooker (1964) reported that after the initial
infection stage of the epidermal cells, hyphae grew intracellularly into spongy mesophyll cells
towards the vascular bundle, penetrating the xylem vessels and tracheids. This is in contrast to
the present study, where initial intracellular growth through the spongy mesophyll cells was
not seen. This difference may have been because mature maize plants were infected in the
current study as opposed to the seedlings used in previous investigations; thus, the fungus was
able to grow intercellularly between the spongy mesophyll cells towards the vascular bundles
because mature plants have more intercellular airspaces than seedlings. Hilu and Hooker (1964)
observed that the hyphae entered the xylem at 2–3 dpi in susceptible lines and could grow
throughout the xylem for 6–8 days without causing any deleterious effects on the cells. In the
present study, hyphal growth was only seen in the xylem for the first time at 11 dpi when visible
necrotic lesions started to form on the leaf.
Disease progression observed after 14 dpi in the current study was similar to reports by
Jennings and Ullstrup (1957). In both studies it was observed that the xylem of minor veins
was completely blocked and that major veins were 80–90% blocked. Both Jennings and
Ullstrup (1957) and Hilu and Hooker (1964) reported that the width of the hyphae in the xylem
tissue was 6–15 µm but in this study the width was found to be between 3–11 µm. This
difference in width could be ascribed to the different isolates used as well as to the different
maize varieties. Enlargement of the lesions was also observed at this time point and was
probably due to the hyphae spreading through the cross veins, thus colonizing other parts of
the leaf. Additionally, this could have contributed to the typical cigar-shaped lesions that
characterize NLB. The collapsing and death of spongy mesophyll cells can be attributed to
localized wilting and/or toxic compounds and/or cell wall-degrading enzymes (CWDE). The
first cause of cell death could be due to mechanical plugging of the xylem with hyphae.
Jennings and Ullstrup (1957) described NLB as a localized wilt disease because hyphae moved
out of the xylem into moribund chlorenchyma tissue only after lesions formed. Hilu and Hooker
(1964) agreed with these findings except that hyphae were observed to leave the xylem and
grow into normal bundle sheath and mesophyll cells. In the present study, growth out of the
xylem into living bundle sheath cells was also observed but no growth into living mesophyll
cells was seen. Initially, the mesophyll cells showed no sign of injury but, after 24–48 h, cell
death occurred and resulted in a wilt-type lesion (Hilu & Hooker, 1964).
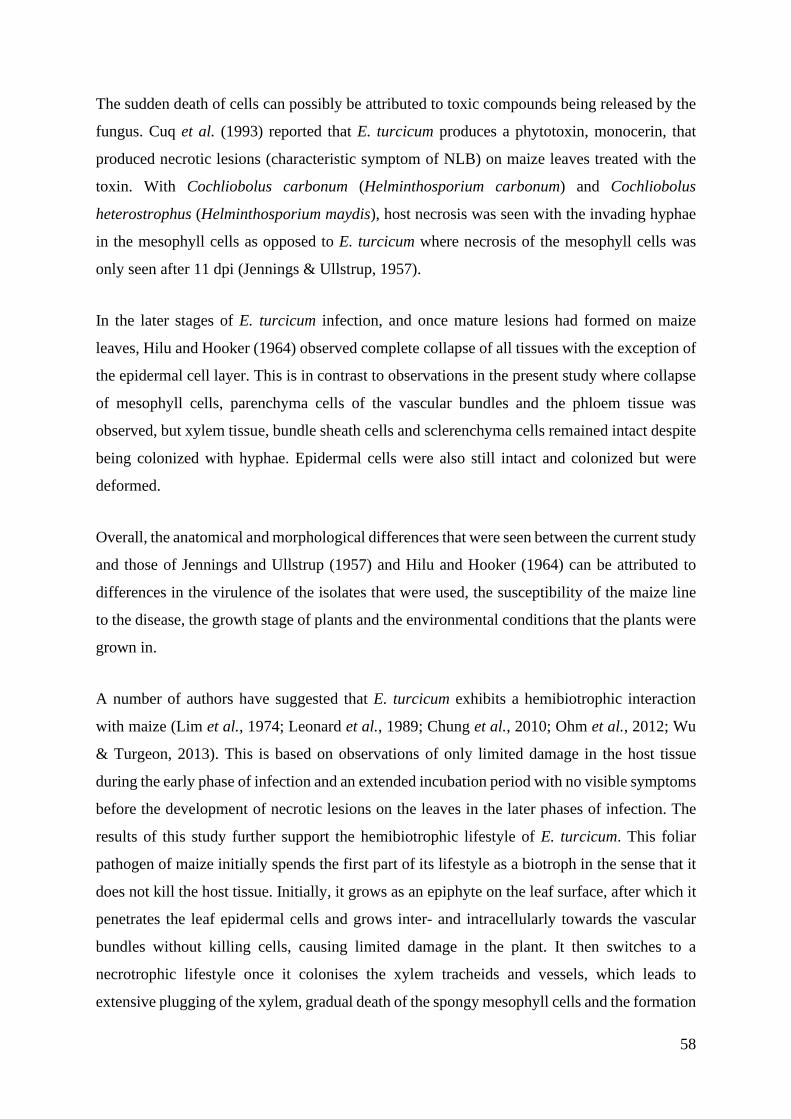
58
The sudden death of cells can possibly be attributed to toxic compounds being released by the
fungus. Cuq et al. (1993) reported that E. turcicum produces a phytotoxin, monocerin, that
produced necrotic lesions (characteristic symptom of NLB) on maize leaves treated with the
toxin. With Cochliobolus carbonum (Helminthosporium carbonum) and Cochliobolus
heterostrophus (Helminthosporium maydis), host necrosis was seen with the invading hyphae
in the mesophyll cells as opposed to E. turcicum where necrosis of the mesophyll cells was
only seen after 11 dpi (Jennings & Ullstrup, 1957).
In the later stages of E. turcicum infection, and once mature lesions had formed on maize
leaves, Hilu and Hooker (1964) observed complete collapse of all tissues with the exception of
the epidermal cell layer. This is in contrast to observations in the present study where collapse
of mesophyll cells, parenchyma cells of the vascular bundles and the phloem tissue was
observed, but xylem tissue, bundle sheath cells and sclerenchyma cells remained intact despite
being colonized with hyphae. Epidermal cells were also still intact and colonized but were
deformed.
Overall, the anatomical and morphological differences that were seen between the current study
and those of Jennings and Ullstrup (1957) and Hilu and Hooker (1964) can be attributed to
differences in the virulence of the isolates that were used, the susceptibility of the maize line
to the disease, the growth stage of plants and the environmental conditions that the plants were
grown in.
A number of authors have suggested that E. turcicum exhibits a hemibiotrophic interaction
with maize (Lim et al., 1974; Leonard et al., 1989; Chung et al., 2010; Ohm et al., 2012; Wu
& Turgeon, 2013). This is based on observations of only limited damage in the host tissue
during the early phase of infection and an extended incubation period with no visible symptoms
before the development of necrotic lesions on the leaves in the later phases of infection. The
results of this study further support the hemibiotrophic lifestyle of E. turcicum. This foliar
pathogen of maize initially spends the first part of its lifestyle as a biotroph in the sense that it
does not kill the host tissue. Initially, it grows as an epiphyte on the leaf surface, after which it
penetrates the leaf epidermal cells and grows inter- and intracellularly towards the vascular
bundles without killing cells, causing limited damage in the plant. It then switches to a
necrotrophic lifestyle once it colonises the xylem tracheids and vessels, which leads to
extensive plugging of the xylem, gradual death of the spongy mesophyll cells and the formation
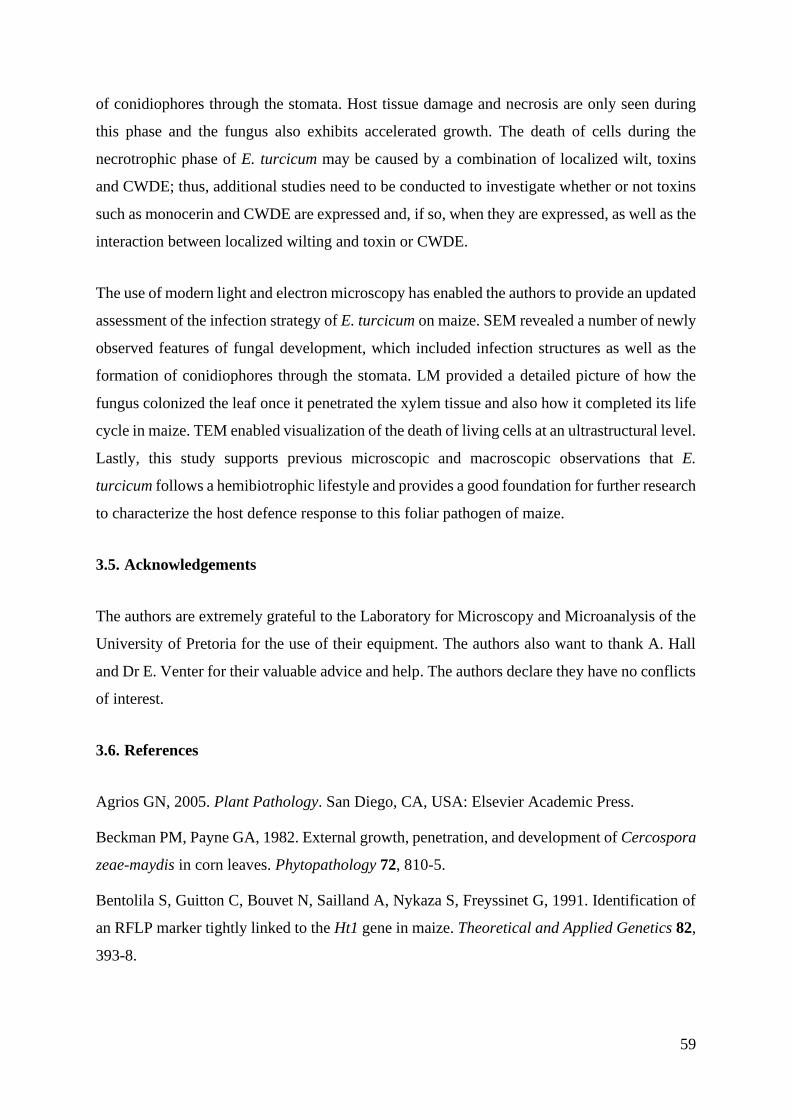
59
of conidiophores through the stomata. Host tissue damage and necrosis are only seen during
this phase and the fungus also exhibits accelerated growth. The death of cells during the
necrotrophic phase of E. turcicum may be caused by a combination of localized wilt, toxins
and CWDE; thus, additional studies need to be conducted to investigate whether or not toxins
such as monocerin and CWDE are expressed and, if so, when they are expressed, as well as the
interaction between localized wilting and toxin or CWDE.
The use of modern light and electron microscopy has enabled the authors to provide an updated
assessment of the infection strategy of E. turcicum on maize. SEM revealed a number of newly
observed features of fungal development, which included infection structures as well as the
formation of conidiophores through the stomata. LM provided a detailed picture of how the
fungus colonized the leaf once it penetrated the xylem tissue and also how it completed its life
cycle in maize. TEM enabled visualization of the death of living cells at an ultrastructural level.
Lastly, this study supports previous microscopic and macroscopic observations that E.
turcicum follows a hemibiotrophic lifestyle and provides a good foundation for further research
to characterize the host defence response to this foliar pathogen of maize.
3.5. Acknowledgements
The authors are extremely grateful to the Laboratory for Microscopy and Microanalysis of the
University of Pretoria for the use of their equipment. The authors also want to thank A. Hall
and Dr E. Venter for their valuable advice and help. The authors declare they have no conflicts
of interest.
3.6. References
Agrios GN, 2005. Plant Pathology. San Diego, CA, USA: Elsevier Academic Press.
Beckman PM, Payne GA, 1982. External growth, penetration, and development of Cercospora
zeae-maydis in corn leaves. Phytopathology 72, 810-5.
Bentolila S, Guitton C, Bouvet N, Sailland A, Nykaza S, Freyssinet G, 1991. Identification of
an RFLP marker tightly linked to the Ht1 gene in maize. Theoretical and Applied Genetics 82,
393-8.
60
Carson M, 1995. A new gene in maize conferring the "chlorotic halo" reaction to infection by
Exserohilum turcicum. Plant Disease 79, 717-20.
Chung CL, Longfellow JM, Walsh EK, et al., 2010. Resistance loci affecting distinct stages of
fungal pathogenesis: use of introgression lines for QTL mapping and characterization in the
maize - Setosphaeria turcica pathosystem. BMC Plant Biology 10, 103.
Craven M, Fourie AP, 2011. Field evaluation of maize inbred lines for resistance to
Exserohilum turcicum. South African Journal of Plant and Soil 28, 69-74.
Cuq F, Petitprez M, Herrmann-Gorline S, Klaebe A, Rossignol M, 1993. Monocerin in
Exserohilum turcicum isolates from maize and a study of its phytotoxicity. Phytochemistry 34,
1265-70.
Haasbroek MP, Craven M, Barnes I, Crampton BG, 2014. Microsatellite and mating type
primers for the maize and sorghum pathogen, Exserohilum turcicum. Australasian Plant
Pathology 43, 577-81.
Hilu HM, Hooker AL, 1964. Host-pathogen relationship of Helminthosporium turcicum in
resistant and susceptible corn seedlings. Phytopathology 54, 570-5.
Hilu HM, Hooker AL, 1965. Localized infection by Helminthosporium turcicum on corn
leaves. Phytopathology 55, 189-92.
Jennings P, Ullstrup A, 1957. A histological study of 3 Helminthosporium leaf blights of corn.
Phytopathology 47, 707-14.
Klopper R, Tweer S, 2009. Northern corn leaf blight fact sheet.
[http://www.pannar.com/assets/disease_fact_sheets/Northern_Corn_Leaf_Blight.pdf].
Accessed 11 November 2019.
Knox-Davies P, 1974. Penetration of maize leaves by Helminthosporium turcicum.
Phytopathology 64, 1468-70.
Lee C, 2011. Corn growth stages and growing degree days: A quick reference guide.
[http://www2.ca.uky.edu/agcomm/pubs/agr/agr202/agr202.pdf]. Accessed 18 June 2018.
Leonard KJ, Levy Y, Smith DR, 1989. Proposed nomenclature for pathogenic races of
Exserohilum turcicum on corn. Plant Disease 73, 776-7.
Leonard KJ, Suggs EG, 1974. Setosphaeria prolata, the ascigerous state of Exserohilum
prolatum. Mycologia 66, 281-97.
61
Levy Y, Cohen Y, 1983a. Biotic and environmental factors affecting infection of sweet corn
with Exserohilum turcicum. Phytopathology 73, 722-5.
Levy Y, Cohen Y, 1983b. Differential effect of light on spore germination of Exserohilum
turcicum on corn leaves and corn leaf impressions. Phytopathology 73, 249-52.
Lim SM, Kinsey JG, Hooker AL, 1974. Inheritance of virulence in Helminthosporium turcicum
to monogenic resistant corn. Phytopathology 64, 1150-1.
Luttrell E, 1964. Systematics of Helminthosporium and related genera. Mycologia 56, 119-32.
Ohm RA, Feau N, Henrissat B, et al., 2012. Diverse lifestyles and strategies of plant
pathogenesis encoded in the genomes of eighteen Dothideomycetes fungi. PLOS Pathogens 8,
e1003037.
Perkins J, Pedersen W, 1987. Disease development and yield losses associated with northern
leaf blight on corn. Plant Disease 71, 940-3.
Sivanesan A, 1987. Graminicolous species of Bipolaris, Curvularia, Drechslera, Exserohilum
and their teleomorphs. Mycological Papers 158, 1-261.
Van Asch MAJ, 1990. Studies on the resistance of wheat and maize to fungal patogenesis.
Pietermaritzburg, University of Natal, PhD thesis.
Van der Merwe C, Peacock J, 1999. Enhancing conductivity of biological material for SEM.
Microscopy Society of Southern Africa Proceedings 29, 44.
White DG, 1999. Compendium of corn diseases. APS press St. Paul, MN.
Wise K, 2011. Diseases of Corn: Northern Corn Leaf Blight.
[https://www.extension.purdue.edu/extmedia/BP/BP-84-W.pdf]. 14 November 2019.
Wu D, Turgeon BG, 2013. Setosphaeria rostrata: Insights from the sequenced genome of
Setosphaeria turcica. Fungal Genetics and Biology 61, 158-63.

62
Chapter 4: Expression analysis of
pathogenesis-related protein genes in
maize in response to Exserohilum
turcicum infection and monocerin
infiltration
63
Abstract
Pathogenesis-related (PR) proteins are one of the defence mechanisms plants use in response
to fungal infections such as Exserohilum turcicum, which is the causal agent of northern leaf
blight (NLB) in maize. Exserohilum turcicum produces monocerin, a phytotoxic secondary
metabolite, which could aid the fungus in causing disease. The aim of this study was to
elucidate whether expression of PR protein genes is induced upon infection with E. turcicum
infection as well in response to monocerin infiltration. Fungus infected maize leaf material was
harvested at 0, 4, 9, and 14 days post-inoculation (dpi) and monocerin infiltrated material at
0, 24 and 48 hours post-infiltration (hpi). Expression analysis of PR protein genes were
examined using maize leaf cDNA. PR-1 (antifungal), PR-2 (β-1,3-glucanase), PR-3 (chitinase)
gene expression were highly induced by the fungus whereas PR-10 (ribonuclease-like) was
only induced at a very low level. Expression of three PR protein genes was induced by
monocerin after 24 hpi except for PR-1, the expression of which was not significantly different
from its control. The expression of all four PR protein genes was lower after 48 hpi than at 24
hpi but was also induced by the solvent control (SC) and wounded control (WC) indicating that
these controls do have an effect on the expression of PR protein genes. The expression of the
PR protein genes was higher in the fungal infected tissue compared to the monocerin treated
tissue indicating that monocerin probably affects other defence genes or exerts its toxicity at
some other cellular level. The results of this study yield additional insights into the host
response of maize to E. turcicum and suggest that its toxin, monocerin, did elicit a defence
response in maize by inducing PR protein gene expression albeit at a lower level than the
fungus.
Keywords: Exserohilum turcicum, gene expression, maize, monocerin, northern leaf blight,
pathogenesis-related proteins, RT-qPCR

64
4.1. Introduction
Northern leaf blight (NLB) is an economically important foliar disease of maize throughout
the world. The disease has been associated with yield losses of between 15–30% but can be as
high as 75% in ideal conditions (Klopper & Tweer, 2009). The causal agent of NLB is the
hemibiotrophic fungus Exserohilum turcicum (sexual stage Setosphaeria turcica, syn.
Helminthosporium turcicum) (Leonard & Suggs, 1974). Exserohilum turcicum produces a
secondary metabolite, monocerin, a phytotoxic polyketide metabolite, which possibly aids the
fungus in causing disease in maize (Aldridge & Turner, 1970; Robeson & Strobel, 1982; Cuq
et al., 1993). Numerous methods to control the disease including deep ploughing, crop rotation,
resistant maize cultivars and applying fungicides, exist. Unfortunately, the fungus has the
ability to form new races that can overcome existing resistance in maize lines as well as to
become resistant to fungicides (Klopper & Tweer, 2009; Wise, 2011). There is thus a
continuous drive to develop new strategies in controlling this disease in maize. These include
developing new fungicides and breeding new maize lines involving the plant's natural defences
against pathogens such as the upregulation of pathogenesis-related (PR) proteins.
Pathogenesis-related proteins are one of many mechanisms that plants use to protect
themselves in response to various abiotic and biotic threats such as wounding, drought, cold
and pathogen invasion, which includes bacterial, viral and fungal attacks (Bowles, 1990;
Agrios, 2005). The production of PR proteins occurs in both healthy and infected cells as
opposed to phytoalexins, which are only produced in healthy cells surrounding localised
damaged and necrotic cells (van Loon et al., 2006; Ebrahim et al., 2011). The production of
PR proteins in healthy cells can prevent the affected plant from further infection (Ebrahim et
al., 2011). Pathogenesis-related proteins can either inhibit pathogens with their antimicrobial
properties or by regulating expression of genes involved in the host defence, or both (Majumdar
et al., 2017). Pathogenesis-related proteins have various functions including hydrolases,
protease inhibitors and transcription factors (Scherer et al., 2005). Overall, PR proteins are low
molecular weight molecules of between 6–43 kDa, stable at low pH, thermostable and resistant
to proteases, which enable them to survive the harsh environment they occur in such as the
vacuoles, cell wall or intracellular spaces (Niki et al., 1998; Ebrahim et al., 2011). The majority
of PR proteins are induced through signalling compounds such as salicylic acid (SA), jasmonic
acid (JA) and ethylene (van Loon & van Strien, 1999; Miyamoto et al., 2012; Manghwar et al.,
2018). Salicylic acid is involved in inducing the expression of PR-1, PR-2 and PR-5 genes
65
whereas JA has been reported to induce chitinases (PR-3, PR-4, PR-8 and PR-11) and PR-13
(Uknes et al., 1992; Morris et al., 1998; Sels et al., 2008; Miyamoto et al., 2012; Manghwar et
al., 2018).
To date, 17 PR protein families have been identified according to their function and properties,
and include an antifungal protein (PR-1), β–1,3–glucanase (PR-2), chitinases (PR-3, PR-4, PR-
8, PR-11), thaumatin-like proteins (PR-5), proteinases (PR-6, PR-7), peroxidase (PR-9), RNase
(PR-10), defensin (PR-12), thionin (PR-13), lipid-transfer protein (PR-14) oxalate-oxidases
(PR-15, PR-16), while the function of PR-17 is still unknown (van Loon & van Strien, 1999;
van Loon et al., 2006). Pathogenesis-related proteins which have been associated with fungal
infection and/or mycotoxin production include PR-1, PR-2, PR-3, PR-5 and PR-10 (Jondle et
al., 1989; Stone et al., 2000; Sekhon et al., 2006; Chen et al., 2010; Galeana-Sánchez et al.,
2017; Manghwar et al., 2018). The role of the PR-1 family is still poorly understood but it is
one of the PR proteins that is most abundantly produced during a fungal attack (Breen et al.,
2017). It is known that PR-1 has antifungal properties and recent reports have indicated that it
has sterol binding activity, harbours a defence signalling peptide and is targeted by plant
pathogens during infection (Breen et al., 2017). The PR-2 family consists of the β-1,3-
glucanases, which catalyse the hydrolytic cleavage of β-1,3-glucosidic linkages in β-1,3-
glucans (Xie et al., 2015). PR-3 is responsible for the hydrolytic breakdown of chitin. Both
chitin and β-1,3-glucanase are important structural components of fungal cell walls of many
pathogenic fungi (Li et al., 2001). PR10 has been reported to have ribonuclease activity and its
gene expression has been reported to be induced by fungal infection (Bantignies et al., 2000;
Chen et al., 2010).
Numerous phytotoxins produced by phytopathogenic fungi have been reported to induce PR
proteins directly or affect pathways such as SA or JA pathways, which in turn induce PR
proteins. Fumonisin B1, a programmed cell death eliciting mycotoxin, produced by various
Fusarium species such as Fusarium verticillioides, is capable of inducing the expression of
PR-1, PR-2 and PR-5 genes in Arabidopsis plants (Stone et al., 2000). Additionally, the activity
of β-1,3-glucanase (PR-2) in germinating maize embryos is also inhibited by fumonisin B1
(Galeana-Sánchez et al., 2017). Fusarium verticillioides and moniliformin, the phytotoxin it
produces, elicit a host response by inducing the expression of PR-4 (chitinases) in germinating
maize embryos (Bravo et al., 2003). The well-known mycotoxin family, the trichothecenes,
which include deoxynivalenol and T-2 toxin, induced the expression of PR-1 in Arabidopsis
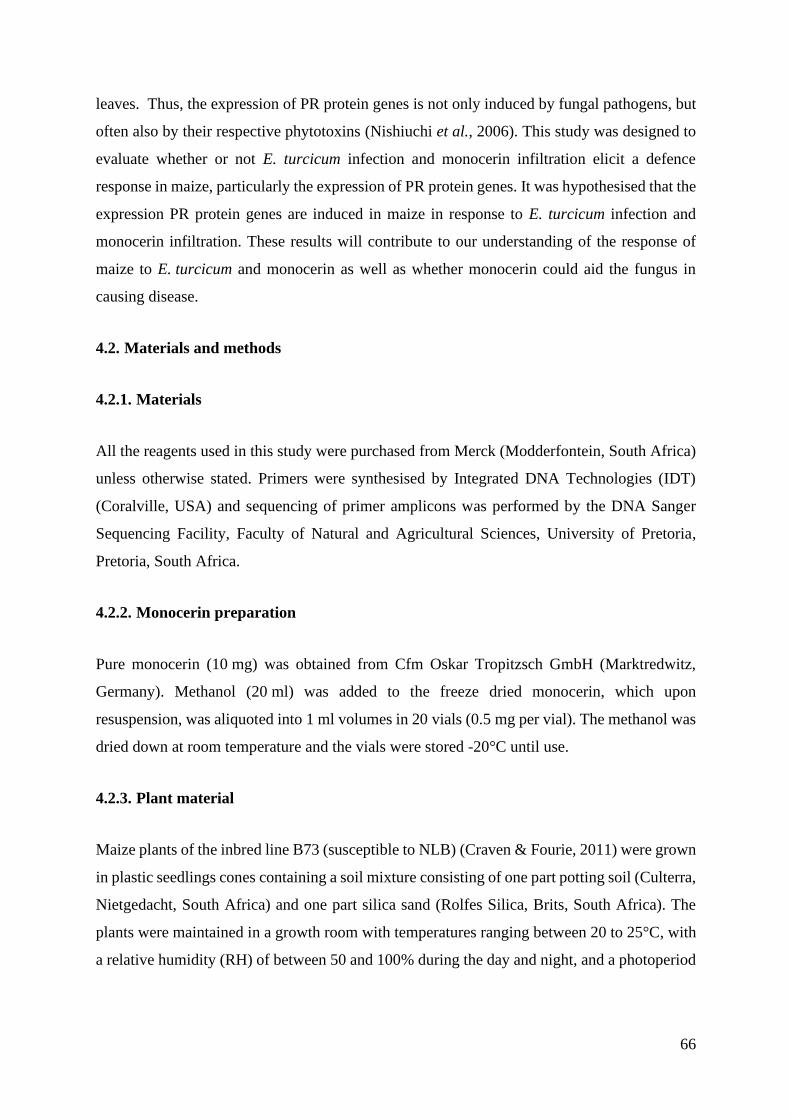
66
leaves. Thus, the expression of PR protein genes is not only induced by fungal pathogens, but
often also by their respective phytotoxins (Nishiuchi et al., 2006). This study was designed to
evaluate whether or not E. turcicum infection and monocerin infiltration elicit a defence
response in maize, particularly the expression of PR protein genes. It was hypothesised that the
expression PR protein genes are induced in maize in response to E. turcicum infection and
monocerin infiltration. These results will contribute to our understanding of the response of
maize to E. turcicum and monocerin as well as whether monocerin could aid the fungus in
causing disease.
4.2. Materials and methods
4.2.1. Materials
All the reagents used in this study were purchased from Merck (Modderfontein, South Africa)
unless otherwise stated. Primers were synthesised by Integrated DNA Technologies (IDT)
(Coralville, USA) and sequencing of primer amplicons was performed by the DNA Sanger
Sequencing Facility, Faculty of Natural and Agricultural Sciences, University of Pretoria,
Pretoria, South Africa.
4.2.2. Monocerin preparation
Pure monocerin (10 mg) was obtained from Cfm Oskar Tropitzsch GmbH (Marktredwitz,
Germany). Methanol (20 ml) was added to the freeze dried monocerin, which upon
resuspension, was aliquoted into 1 ml volumes in 20 vials (0.5 mg per vial). The methanol was
dried down at room temperature and the vials were stored -20°C until use.
4.2.3. Plant material
Maize plants of the inbred line B73 (susceptible to NLB) (Craven & Fourie, 2011) were grown
in plastic seedlings cones containing a soil mixture consisting of one part potting soil (Culterra,
Nietgedacht, South Africa) and one part silica sand (Rolfes Silica, Brits, South Africa). The
plants were maintained in a growth room with temperatures ranging between 20 to 25°C, with
a relative humidity (RH) of between 50 and 100% during the day and night, and a photoperiod
67
of 16 h. The plants were watered every second day until runoff and were fertilised twice (20
and 30 days after planting) with Nitrosol Organiksol (Fleuron, Johannesburg, South Africa).
4.2.4. Fungal strain, culture condition and inoculum preparation
Exserohilum turcicum isolate 2 (race 23N) was isolated from NLB lesion on maize leaves and
identified as isolate 2 by means of a single multiplex polymerase chain reaction (PCR) assay
described by Haasbroek et al. (2014), whereafter it was maintained and prepared for
inoculation of maize plants as described in Chapter 3, Section 3.2.1. The concentration of the
conidial suspension was adjusted to 1 × 10⁵ spores/ml prior to inoculation.
4.2.5. Maize inoculation and infiltration
Maize plants (approximately 29 days old) at the V6 growth stage were inoculated by adding 1
ml of a conidial suspension into the whorl of each plant. The inoculated plants were then
incubated for 12 h in a growth room at 20°C with 100% RH in the dark. Monocerin was
prepared for infiltration by adding pure monocerin to 40% methanol to yield a concentration
of 1 mM monocerin. Maize plants at the same growth stage as the inoculation study were
infiltrated with 50 µl of a 1 mM monocerin solution. A monocerin solution of 1 mM was used
since Cuq et al. (1993) reported that the phytotoxic effect of monocerin plateaued at 1 mM
monocerin in a maize leaf detached essay. This was performed by nicking the adaxial surface
of a fully expanded leaf with a needle and pressure infiltrating the monocerin solution using
1 ml syringe into the wounded surface (Swanson et al., 1988). The infiltration was done on
both sides of the midrib, with four infiltration sites per side and thus eight sites per leaf (Figure
4.1). The same procedure was followed for the solvent control (SC) in which the leaf was only
infiltrated with 40% methanol and for the wounded control (WC) where the leaves were only
nicked. After the inoculation and infiltration, plants were maintained under the same growth
conditions as before the treatments. A third control which consisted of uninoculated and non-
infiltrated maize leaves, was included.
68
Figure 4.1. Diagrammatic representation of monocerin infiltration sites in a maize leaf. For
each treatment or control, there were four infiltration sites on each side of the midrib (M) of
the leaf, making a total of eight infiltrated sites, per leaf.
Diseased leaves were harvested at 4, 9 and 14 days post-inoculation (dpi) whereas, for the
monocerin treatment, leaves were harvested at 24 and 48 hours post infiltration (hpi). The
control tissue was harvested 0 dpi/hpi and the wounded control and solvent control at 24 hai.
One diseased or healthy leaf per plant was harvested for the inoculated leaves or the untreated
control, respectively. For the monocerin infiltrated leaves, leaf segments were cut into strips
of 15 mm wide, which included the lesions (Figure 4.1). All the segments in a biological
replicate were pooled together. The same was done for the wounded and solvent controls. Each
treatment or control consisted of three biological replicates, with each biological replicate
comprised of three plants, which were pooled for downstream analysis. Harvested leaf material
was immediately flash-frozen in liquid nitrogen (N2) and stored at -80°C until used. In total 24
samples were obtained for downstream analysis.
4.2.6. RNA isolation
Total RNA was isolated from all the frozen samples using the InviTrap Spin Plant RNA Mini
Kit (Stratec, Berlin, Germany) according to the manufacturer’s protocol. Approximately,
100 mg of plant material was ground to a fine powder in liquid nitrogen with the aid of a mortar
and pestle and used for the RNA isolations. The RNA was eluted in 30 µl elution Buffer R
whereafter the concentration and quality were determined using a Nano Drop 2000
spectrophotometer (Thermo Fisher Scientific, Carlsbad, USA). The integrity of the RNA was
assessed by adding 2.5 µl 2X RNA loading dye (New England BioLabs, Ipswich, USA) to 5 µl

69
RNA, incubated at 65°C for 7 min whereafter the RNA was electrophorized on 2% sodium
borate (5.24 mM) agarose gel at 200 V for 30 min.
The RNA samples were treated with deoxyribonuclease (DNase) to remove unwanted genomic
DNA. DNase digestion was performed using Turbo DNase (Thermo Fisher Scientific)
according to the manufacturer’s instructions. A single reaction consisted of 4200 ng RNA,
0.3 µl 10X Turbo DNase buffer and 2 µl Turbo DNase enzyme to obtain a final volume of
35 µl. The samples were then incubated at 37°C for 30 min and the reactions were stopped by,
in each case, the addition of 6 µl DNase inactivation reagent, whereafter the samples were
incubated for an additional five minutes at 25°C. The samples were then centrifuged at
10 000 g for 90 sec and the supernatant was removed and stored at -80°C until used.
4.2.7. cDNA synthesis
Complementary DNA (cDNA) was synthesised from extracted total mRNA samples, free of
DNA, using the Maxima First Strand cDNA Synthesis kit (Thermo Fisher Scientific) following
the manufacturer’s instructions. A single reaction consisted of 4 µl 5X reaction mix, 2 µl
Maxima enzyme mix, 1270 ng RNA and nuclease-free water made up to obtain a final volume
of 20 µl. This was done for all 24 samples. The samples were then incubated for 10 min at
25°C and 30 min at 50°C. The reaction was terminated by incubating the samples at 85°C for
5 min. The samples were aliquoted and stored at -80°C until used.
4.2.8. RT-qPCR primer design
Gene-specific primers were selected to test the expression of five PR protein genes which
included PR-1 (Zm00001d018738), PR-2 (Zm00001d042143), PR-3 (Zm00001d043988), and
PR-10 (Zm00001d028816) and three references genes rpol (Zm00001d012857), srl
(Zm00001d006480) and gst3 (Zm00001d042216). When primer sequences were not found
from literature, gene-specific primers were designed using IDT’s PrimerQuest Tool
(https://eu.idtdna.com/Primerquest) and assessed with Net Primer (www.premierbiosoft.com)
for internal secondary structures. Primers were designed to adhere to MIQE guidelines (Bustin
et al., 2009; Taylor et al., 2010) for RT-qPCR expression studies. Where possible, primers
were designed to amplify either a part of a single exon or exon-exon boundary and to the 3’
end of the gene. After primers were designed, the Basic Local Alignment Search Tool
70
(BLAST) was applied to compare the primer sequences against the maize genome
(http://ensembl.gramene.org/Tools/Blast) to ensure that the primers were gene-specific and did
not target non-specific targets. Primer sequences and associated information are summarised
in Table 4.1.
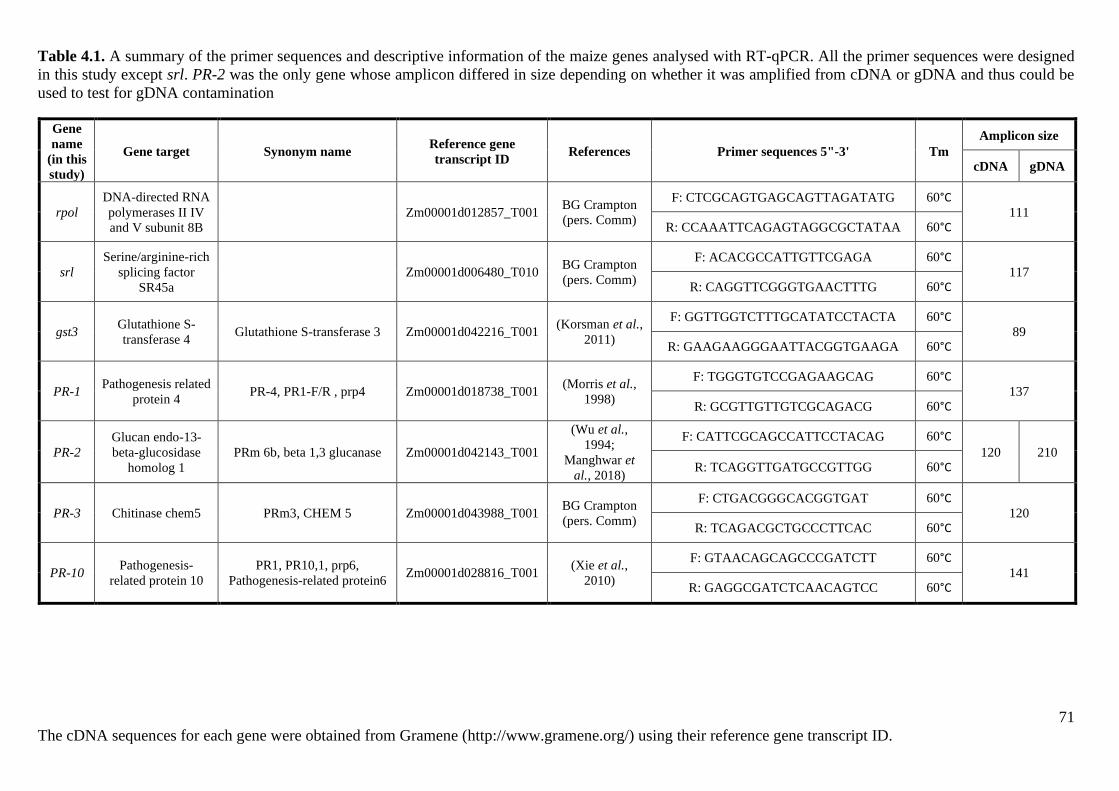
71
The cDNA sequences for each gene were obtained from Gramene (http://www.gramene.org/) using their reference gene transcript ID.
Table 4.1. A summary of the primer sequences and descriptive information of the maize genes analysed with RT-qPCR. All the primer sequences were designed
in this study except srl. PR-2 was the only gene whose amplicon differed in size depending on whether it was amplified from cDNA or gDNA and thus could be
used to test for gDNA contamination
Gene
name
(in this
study)
Gene target Synonym name Reference gene
transcript ID References Primer sequences 5"-3' Tm
Amplicon size
cDNA gDNA
rpol
DNA-directed RNA
polymerases II IV
and V subunit 8B
Zm00001d012857_T001 BG Crampton
(pers. Comm)
F: CTCGCAGTGAGCAGTTAGATATG 60°C
111 R: CCAAATTCAGAGTAGGCGCTATAA 60°C
srl
Serine/arginine-rich
splicing factor
SR45a
Zm00001d006480_T010 BG Crampton
(pers. Comm)
F: ACACGCCATTGTTCGAGA 60°C
117 R: CAGGTTCGGGTGAACTTTG 60°C
gst3 Glutathione S-
transferase 4 Glutathione S-transferase 3 Zm00001d042216_T001
(Korsman et al.,
2011)
F: GGTTGGTCTTTGCATATCCTACTA 60°C
89 R: GAAGAAGGGAATTACGGTGAAGA 60°C
PR-1 Pathogenesis related
protein 4 PR-4, PR1-F/R , prp4 Zm00001d018738_T001
(Morris et al.,
1998)
F: TGGGTGTCCGAGAAGCAG 60°C
137 R: GCGTTGTTGTCGCAGACG 60°C
PR-2
Glucan endo-13-
beta-glucosidase
homolog 1
PRm 6b, beta 1,3 glucanase Zm00001d042143_T001
(Wu et al.,
1994;
Manghwar et
al., 2018)
F: CATTCGCAGCCATTCCTACAG 60°C
120 210 R: TCAGGTTGATGCCGTTGG 60°C
PR-3 Chitinase chem5 PRm3, CHEM 5 Zm00001d043988_T001 BG Crampton
(pers. Comm)
F: CTGACGGGCACGGTGAT 60°C
120 R: TCAGACGCTGCCCTTCAC 60°C
PR-10 Pathogenesis-
related protein 10
PR1, PR10,1, prp6,
Pathogenesis-related protein6 Zm00001d028816_T001
(Xie et al.,
2010)
F: GTAACAGCAGCCCGATCTT 60°C
141 R: GAGGCGATCTCAACAGTCC 60°C
72
4.2.9. Sequencing of cDNA amplicons
Sequencing of each amplicon was done to determine that each primer set was gene-specific
and did not bind to non-specific targets. The amplicons to be sequenced were first amplified
from maize cDNA through conventional PCR reactions with a gene-specific primer set and
subsequently analysed on a 2% sodium borate agarose gel (Brody & Kern, 2004). If these
amplicons were specific (single band on the gel) and of the correct size, the PCR reactions were
cleaned up with ExoSAP-IT (Thermo Fisher Scientific) according to manufacturer’s
instructions and used in subsequent sequencing reactions. A single 12 µl sequencing reaction
consisted of 1.2 µl BigDye Terminator v3.1 ready reaction mix (Thermo Fisher Scientific),
1.8 µl BigDye Terminator v3.1 5X sequencing buffer (Thermo Fisher Scientific), 1.2 µl of
either forward or reverse primer (10 µM) and 7.8 µl clean-up product as template. Cycle
conditions consisted of an initial denaturing step of 1 min at 96°C, followed by 25 cycles, each
comprising of 96°C for 10 sec, 58°C for 10 sec and 60°C for 4 min. The sequence reactions
were cleaned using sodium acetate/ethanol precipitation of DNA. Forward and reverse
sequencing reactions for each amplicon were run on an ABI3500xl (Thermo Fisher Scientific)
sequencer. Sequenced amplicons were analysed and aligned using CLC Main Workbench 8.0
(Aarhus, Denmark) (Appendix, Table 7.1)
4.2.10. Expression analysis of PR and reference genes
Prior to RT-qPCR analysis of PR proteins, all reactions were optimised using conventional
PCR. Reverse transcription-qPCR analysis of the PR protein genes (PR-1, PR-2, PR-3, and PR-
10) and three reference genes rpol, srl and gst3 were performed using the Bio-Rad CFX
Connect Real-Time PCR Detection System (Hercules, California, USA). Expression of the
genes was measured in three biological repeats with each biological repeat performed in
triplicate at all data points as outlined in Section 4.2.5. Each 10 µl reaction comprised of 5 µl
RealQ Plus 2x Master Mix Green (Ampliqon, Odense, Denmark), 0.32 µl forward primer
(10 µM), 0.32 µl reverse primer (10 µM), 3.36 µl sterile distilled water and 1 µl cDNA (1:25
dilution) or water for the non-template controls. The cycling conditions consisted of an initial
denaturing step of 15 min at 95°C, followed by 40 cycles of amplification and quantification,
each comprising of 95°C for 10 sec, 60°C for 10 sec and 72°C for 10 sec with a single
fluorescence measurement at the end of each elongation step. A melting curve analysis was
performed at the end of each run to measure amplification specificity. A standard curve was
73
set up for each gene tested using seven dilution points (2x10⁻¹, 1x10⁻¹, 2x10⁻², 1x10⁻², 4x10⁻³,
2x10⁻³, 1x10⁻³) containing pooled cDNA of all the samples tested. Gene expression data of all
the genes were analysed using Bio-Rad CFX manager and qBASEPLUS with geNorm
(Biogazelle, Ghent, Brussels). The relative expression values of the PR protein genes was
normalised by means of dividing the relative input cDNA (extrapolated from the respective
standard curves) of the PR protein genes by the geomean input reference cDNA of the reference
genes rpol, srl and gst3 for each sample (Vandesompele et al., 2002; Hellemans et al., 2007).
4.2.11. Statistical analysis
Statistical analysis of all the relative expression data was performed using GraphPad Prism
version 4.03 (GraphPad Prism Software, San Diego, California, USA). A one-way analysis of
variance (ANOVA) was performed, followed by a Tukey’s multiple comparison test with the
level statistical significance measured at p < 0.05.
4.3. Results
4.3.1. Maize trial (infection and infiltration)
Infection of maize leaves with E. turcicum and subsequent disease progression was similar to
what was observed in Chapter 3, Section 3.3. The non-infected or control leaves exhibited no
visible NLB infection and were healthy overall (Figure 4.2, a). Chlorotic spots were visible at
4 dpi (Figure 4.2, b), turning necrotic at 9 dpi (Figure 4.2, c) whereafter the lesions started to
enlarge and elongate forming the distinct cigar shape lesions by which the disease is
characterised at 14 dpi (Figure 4.2, d).
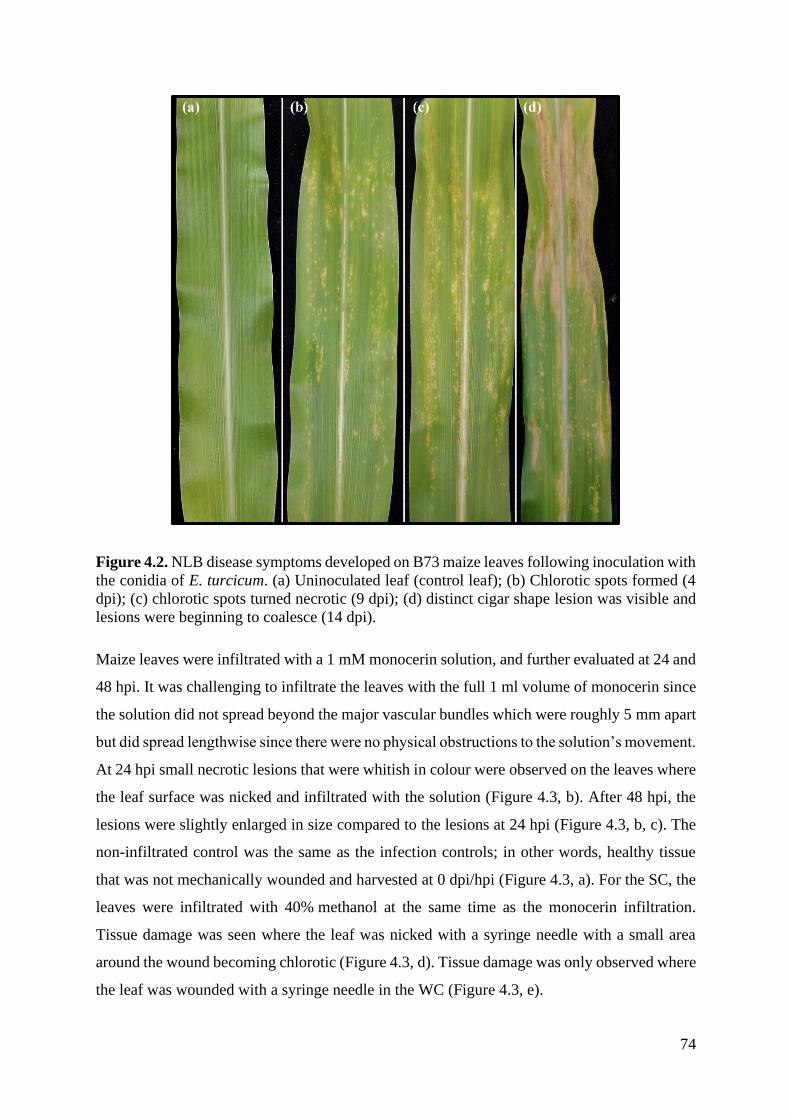
74
Figure 4.2. NLB disease symptoms developed on B73 maize leaves following inoculation with
the conidia of E. turcicum. (a) Uninoculated leaf (control leaf); (b) Chlorotic spots formed (4
dpi); (c) chlorotic spots turned necrotic (9 dpi); (d) distinct cigar shape lesion was visible and
lesions were beginning to coalesce (14 dpi).
Maize leaves were infiltrated with a 1 mM monocerin solution, and further evaluated at 24 and
48 hpi. It was challenging to infiltrate the leaves with the full 1 ml volume of monocerin since
the solution did not spread beyond the major vascular bundles which were roughly 5 mm apart
but did spread lengthwise since there were no physical obstructions to the solution’s movement.
At 24 hpi small necrotic lesions that were whitish in colour were observed on the leaves where
the leaf surface was nicked and infiltrated with the solution (Figure 4.3, b). After 48 hpi, the
lesions were slightly enlarged in size compared to the lesions at 24 hpi (Figure 4.3, b, c). The
non-infiltrated control was the same as the infection controls; in other words, healthy tissue
that was not mechanically wounded and harvested at 0 dpi/hpi (Figure 4.3, a). For the SC, the
leaves were infiltrated with 40% methanol at the same time as the monocerin infiltration.
Tissue damage was seen where the leaf was nicked with a syringe needle with a small area
around the wound becoming chlorotic (Figure 4.3, d). Tissue damage was only observed where
the leaf was wounded with a syringe needle in the WC (Figure 4.3, e).
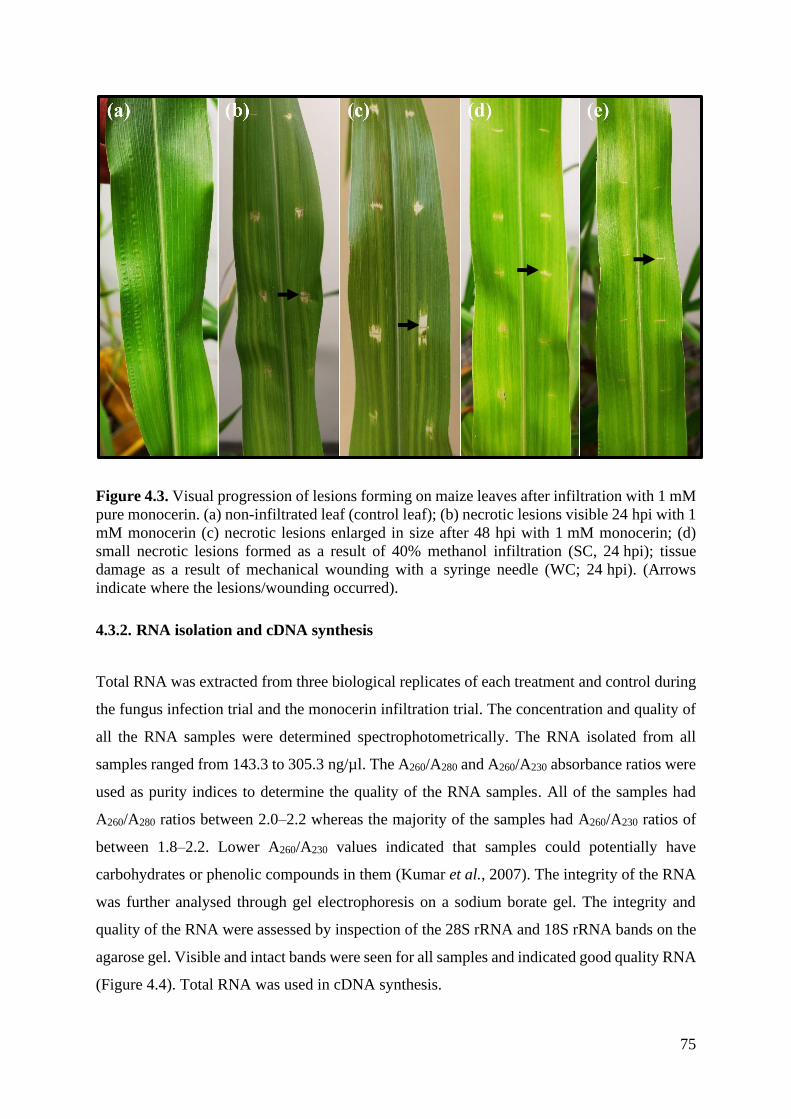
75
Figure 4.3. Visual progression of lesions forming on maize leaves after infiltration with 1 mM
pure monocerin. (a) non-infiltrated leaf (control leaf); (b) necrotic lesions visible 24 hpi with 1
mM monocerin (c) necrotic lesions enlarged in size after 48 hpi with 1 mM monocerin; (d)
small necrotic lesions formed as a result of 40% methanol infiltration (SC, 24 hpi); tissue
damage as a result of mechanical wounding with a syringe needle (WC; 24 hpi). (Arrows
indicate where the lesions/wounding occurred).
4.3.2. RNA isolation and cDNA synthesis
Total RNA was extracted from three biological replicates of each treatment and control during
the fungus infection trial and the monocerin infiltration trial. The concentration and quality of
all the RNA samples were determined spectrophotometrically. The RNA isolated from all
samples ranged from 143.3 to 305.3 ng/µl. The A260/A280 and A260/A230 absorbance ratios were
used as purity indices to determine the quality of the RNA samples. All of the samples had
A260/A280 ratios between 2.0–2.2 whereas the majority of the samples had A260/A230 ratios of
between 1.8–2.2. Lower A260/A230 values indicated that samples could potentially have
carbohydrates or phenolic compounds in them (Kumar et al., 2007). The integrity of the RNA
was further analysed through gel electrophoresis on a sodium borate gel. The integrity and
quality of the RNA were assessed by inspection of the 28S rRNA and 18S rRNA bands on the
agarose gel. Visible and intact bands were seen for all samples and indicated good quality RNA
(Figure 4.4). Total RNA was used in cDNA synthesis.
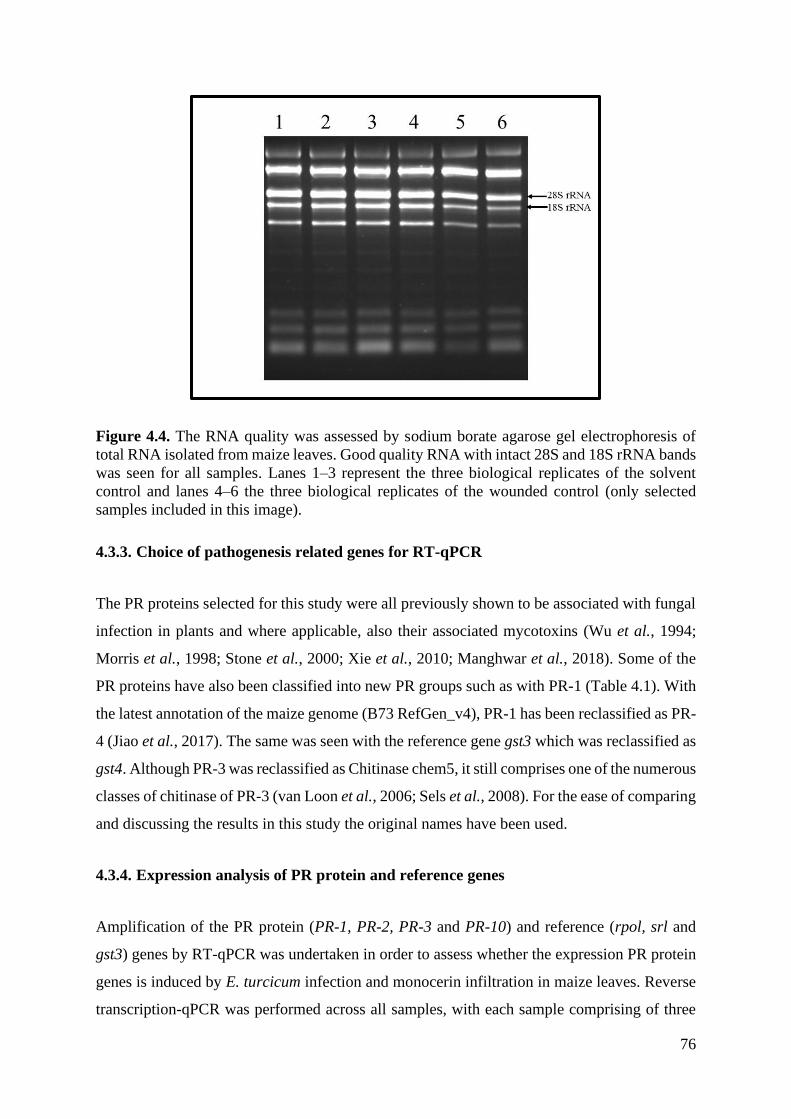
76
Figure 4.4. The RNA quality was assessed by sodium borate agarose gel electrophoresis of
total RNA isolated from maize leaves. Good quality RNA with intact 28S and 18S rRNA bands
was seen for all samples. Lanes 1–3 represent the three biological replicates of the solvent
control and lanes 4–6 the three biological replicates of the wounded control (only selected
samples included in this image).
4.3.3. Choice of pathogenesis related genes for RT-qPCR
The PR proteins selected for this study were all previously shown to be associated with fungal
infection in plants and where applicable, also their associated mycotoxins (Wu et al., 1994;
Morris et al., 1998; Stone et al., 2000; Xie et al., 2010; Manghwar et al., 2018). Some of the
PR proteins have also been classified into new PR groups such as with PR-1 (Table 4.1). With
the latest annotation of the maize genome (B73 RefGen_v4), PR-1 has been reclassified as PR-
4 (Jiao et al., 2017). The same was seen with the reference gene gst3 which was reclassified as
gst4. Although PR-3 was reclassified as Chitinase chem5, it still comprises one of the numerous
classes of chitinase of PR-3 (van Loon et al., 2006; Sels et al., 2008). For the ease of comparing
and discussing the results in this study the original names have been used.
4.3.4. Expression analysis of PR protein and reference genes
Amplification of the PR protein (PR-1, PR-2, PR-3 and PR-10) and reference (rpol, srl and
gst3) genes by RT-qPCR was undertaken in order to assess whether the expression PR protein
genes is induced by E. turcicum infection and monocerin infiltration in maize leaves. Reverse
transcription-qPCR was performed across all samples, with each sample comprising of three
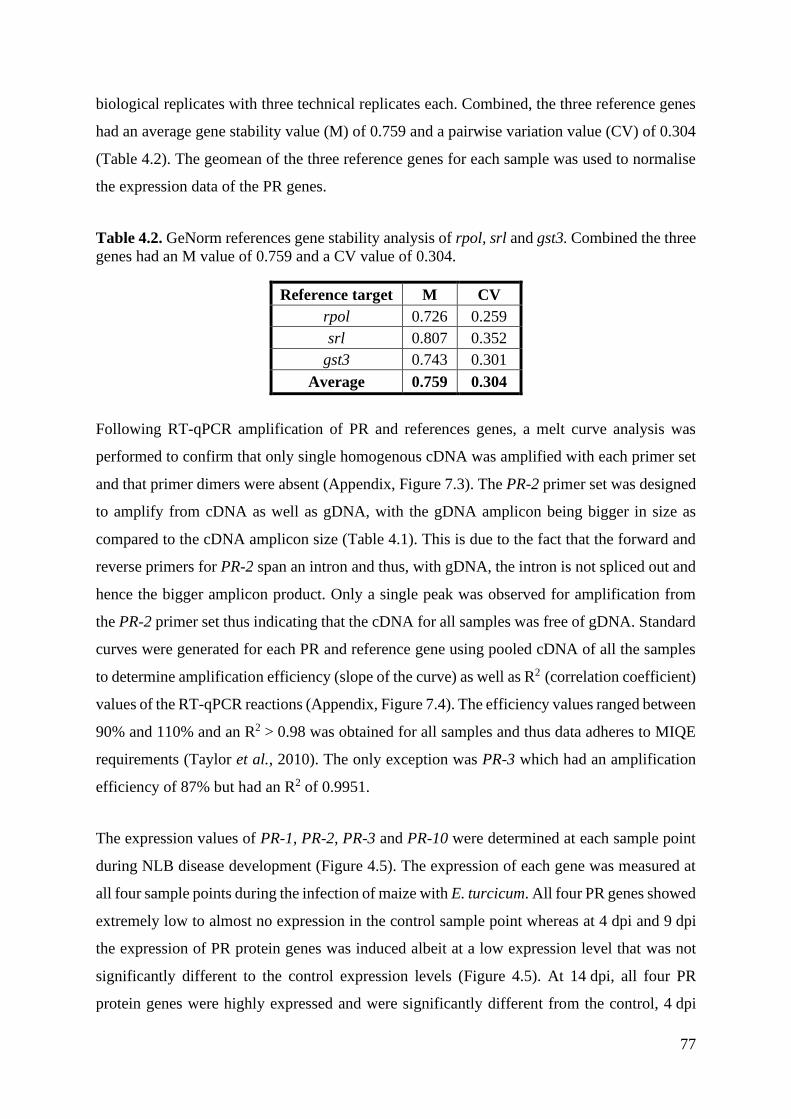
77
biological replicates with three technical replicates each. Combined, the three reference genes
had an average gene stability value (M) of 0.759 and a pairwise variation value (CV) of 0.304
(Table 4.2). The geomean of the three reference genes for each sample was used to normalise
the expression data of the PR genes.
Table 4.2. GeNorm references gene stability analysis of rpol, srl and gst3. Combined the three
genes had an M value of 0.759 and a CV value of 0.304.
Reference target M CV
rpol 0.726 0.259
srl 0.807 0.352
gst3 0.743 0.301
Average 0.759 0.304
Following RT-qPCR amplification of PR and references genes, a melt curve analysis was
performed to confirm that only single homogenous cDNA was amplified with each primer set
and that primer dimers were absent (Appendix, Figure 7.3). The PR-2 primer set was designed
to amplify from cDNA as well as gDNA, with the gDNA amplicon being bigger in size as
compared to the cDNA amplicon size (Table 4.1). This is due to the fact that the forward and
reverse primers for PR-2 span an intron and thus, with gDNA, the intron is not spliced out and
hence the bigger amplicon product. Only a single peak was observed for amplification from
the PR-2 primer set thus indicating that the cDNA for all samples was free of gDNA. Standard
curves were generated for each PR and reference gene using pooled cDNA of all the samples
to determine amplification efficiency (slope of the curve) as well as R2 (correlation coefficient)
values of the RT-qPCR reactions (Appendix, Figure 7.4). The efficiency values ranged between
90% and 110% and an R2 > 0.98 was obtained for all samples and thus data adheres to MIQE
requirements (Taylor et al., 2010). The only exception was PR-3 which had an amplification
efficiency of 87% but had an R2 of 0.9951.
The expression values of PR-1, PR-2, PR-3 and PR-10 were determined at each sample point
during NLB disease development (Figure 4.5). The expression of each gene was measured at
all four sample points during the infection of maize with E. turcicum. All four PR genes showed
extremely low to almost no expression in the control sample point whereas at 4 dpi and 9 dpi
the expression of PR protein genes was induced albeit at a low expression level that was not
significantly different to the control expression levels (Figure 4.5). At 14 dpi, all four PR
protein genes were highly expressed and were significantly different from the control, 4 dpi
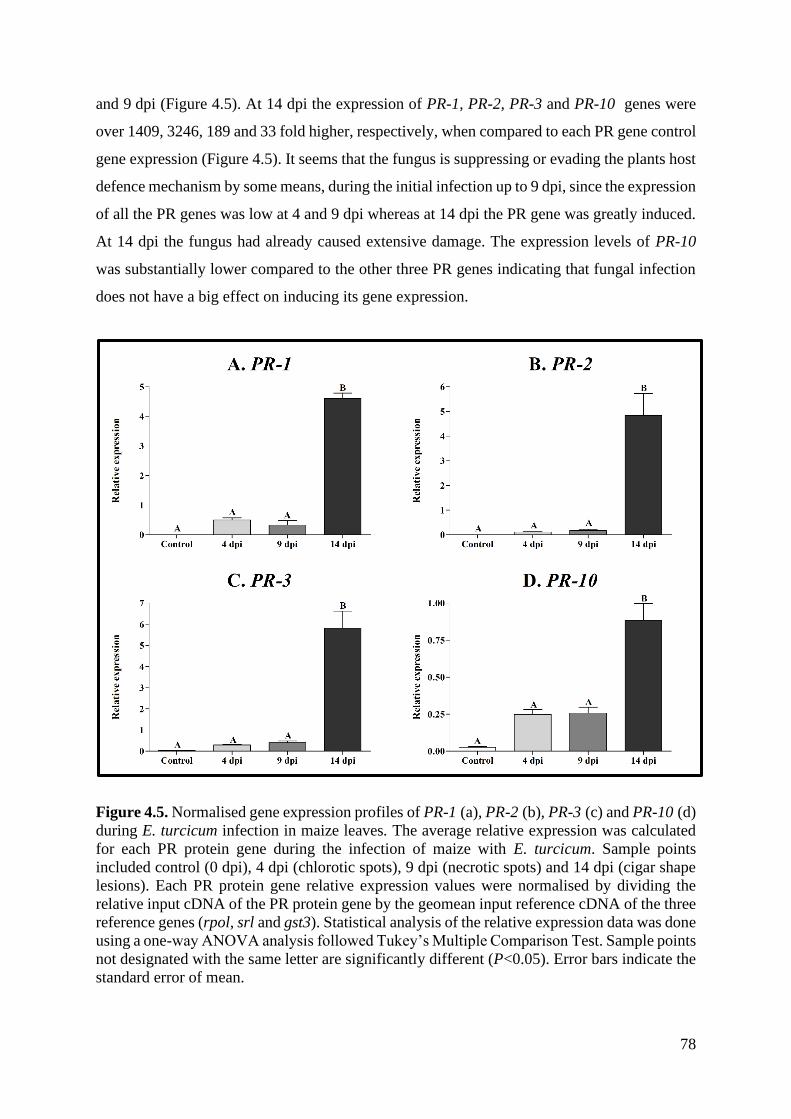
78
and 9 dpi (Figure 4.5). At 14 dpi the expression of PR-1, PR-2, PR-3 and PR-10 genes were
over 1409, 3246, 189 and 33 fold higher, respectively, when compared to each PR gene control
gene expression (Figure 4.5). It seems that the fungus is suppressing or evading the plants host
defence mechanism by some means, during the initial infection up to 9 dpi, since the expression
of all the PR genes was low at 4 and 9 dpi whereas at 14 dpi the PR gene was greatly induced.
At 14 dpi the fungus had already caused extensive damage. The expression levels of PR-10
was substantially lower compared to the other three PR genes indicating that fungal infection
does not have a big effect on inducing its gene expression.
Figure 4.5. Normalised gene expression profiles of PR-1 (a), PR-2 (b), PR-3 (c) and PR-10 (d)
during E. turcicum infection in maize leaves. The average relative expression was calculated
for each PR protein gene during the infection of maize with E. turcicum. Sample points
included control (0 dpi), 4 dpi (chlorotic spots), 9 dpi (necrotic spots) and 14 dpi (cigar shape
lesions). Each PR protein gene relative expression values were normalised by dividing the
relative input cDNA of the PR protein gene by the geomean input reference cDNA of the three
reference genes (rpol, srl and gst3). Statistical analysis of the relative expression data was done
using a one-way ANOVA analysis followed Tukey’s Multiple Comparison Test. Sample points
not designated with the same letter are significantly different (P<0.05). Error bars indicate the
standard error of mean.
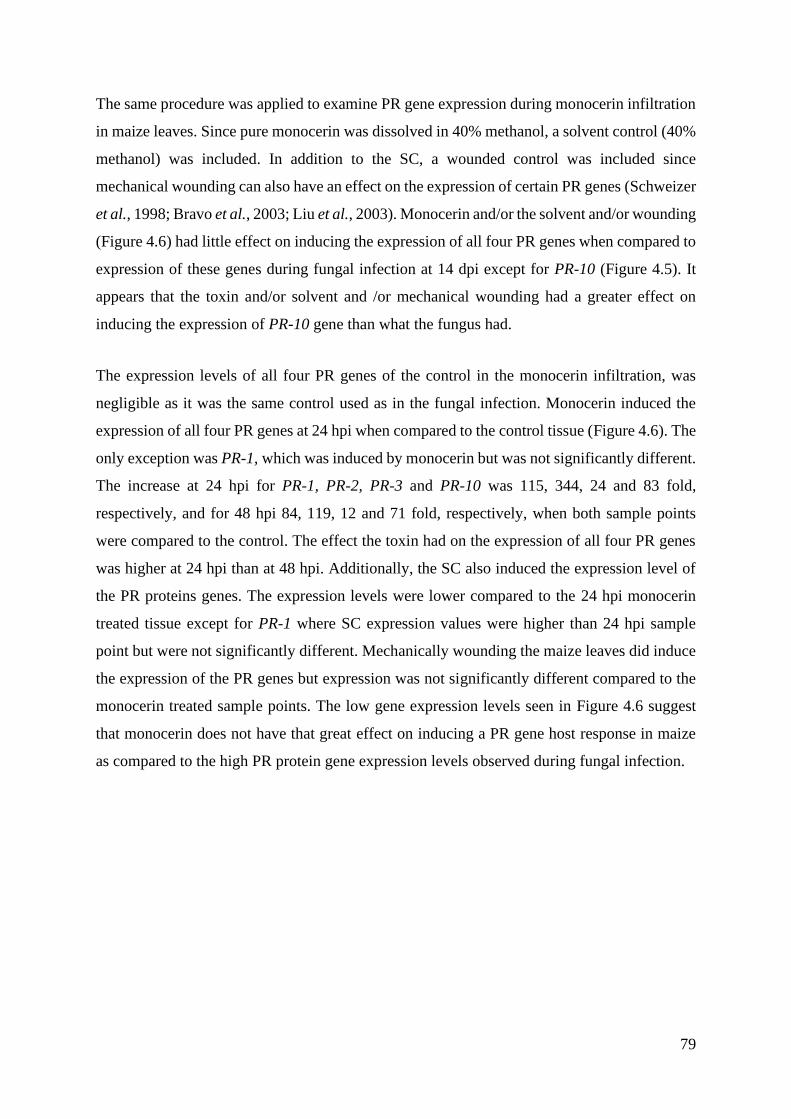
79
The same procedure was applied to examine PR gene expression during monocerin infiltration
in maize leaves. Since pure monocerin was dissolved in 40% methanol, a solvent control (40%
methanol) was included. In addition to the SC, a wounded control was included since
mechanical wounding can also have an effect on the expression of certain PR genes (Schweizer
et al., 1998; Bravo et al., 2003; Liu et al., 2003). Monocerin and/or the solvent and/or wounding
(Figure 4.6) had little effect on inducing the expression of all four PR genes when compared to
expression of these genes during fungal infection at 14 dpi except for PR-10 (Figure 4.5). It
appears that the toxin and/or solvent and /or mechanical wounding had a greater effect on
inducing the expression of PR-10 gene than what the fungus had.
The expression levels of all four PR genes of the control in the monocerin infiltration, was
negligible as it was the same control used as in the fungal infection. Monocerin induced the
expression of all four PR genes at 24 hpi when compared to the control tissue (Figure 4.6). The
only exception was PR-1, which was induced by monocerin but was not significantly different.
The increase at 24 hpi for PR-1, PR-2, PR-3 and PR-10 was 115, 344, 24 and 83 fold,
respectively, and for 48 hpi 84, 119, 12 and 71 fold, respectively, when both sample points
were compared to the control. The effect the toxin had on the expression of all four PR genes
was higher at 24 hpi than at 48 hpi. Additionally, the SC also induced the expression level of
the PR proteins genes. The expression levels were lower compared to the 24 hpi monocerin
treated tissue except for PR-1 where SC expression values were higher than 24 hpi sample
point but were not significantly different. Mechanically wounding the maize leaves did induce
the expression of the PR genes but expression was not significantly different compared to the
monocerin treated sample points. The low gene expression levels seen in Figure 4.6 suggest
that monocerin does not have that great effect on inducing a PR gene host response in maize
as compared to the high PR protein gene expression levels observed during fungal infection.
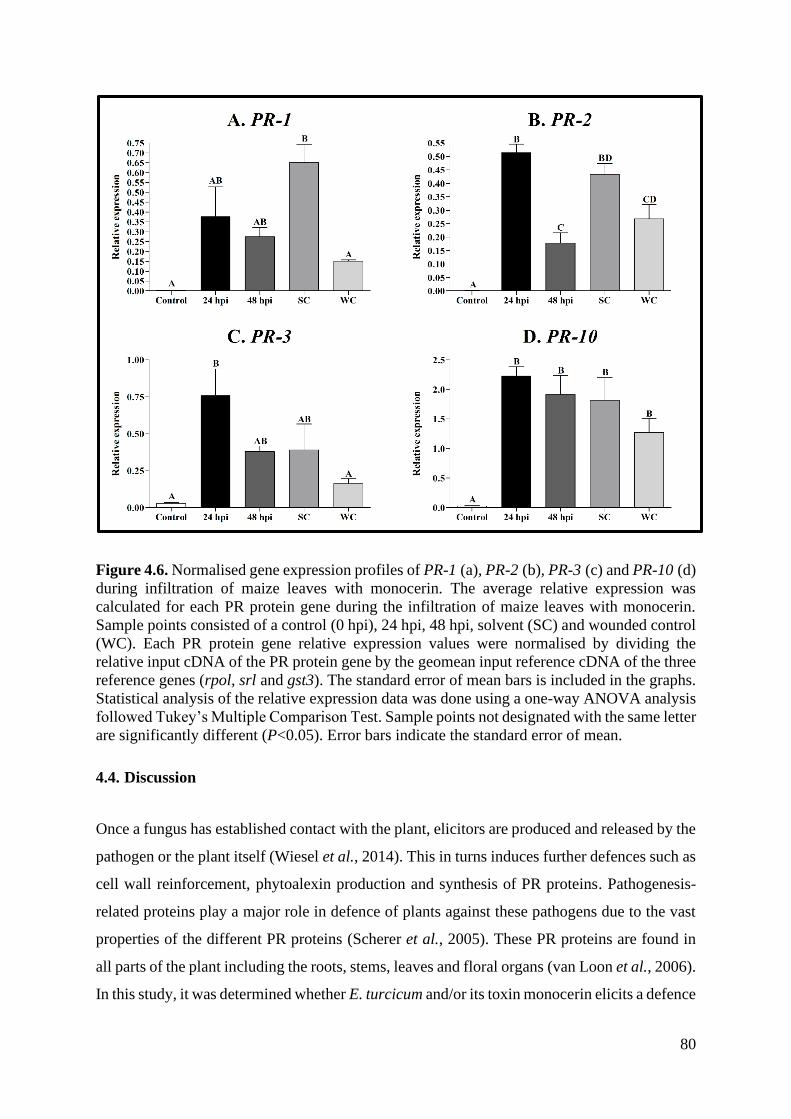
80
Figure 4.6. Normalised gene expression profiles of PR-1 (a), PR-2 (b), PR-3 (c) and PR-10 (d)
during infiltration of maize leaves with monocerin. The average relative expression was
calculated for each PR protein gene during the infiltration of maize leaves with monocerin.
Sample points consisted of a control (0 hpi), 24 hpi, 48 hpi, solvent (SC) and wounded control
(WC). Each PR protein gene relative expression values were normalised by dividing the
relative input cDNA of the PR protein gene by the geomean input reference cDNA of the three
reference genes (rpol, srl and gst3). The standard error of mean bars is included in the graphs.
Statistical analysis of the relative expression data was done using a one-way ANOVA analysis
followed Tukey’s Multiple Comparison Test. Sample points not designated with the same letter
are significantly different (P<0.05). Error bars indicate the standard error of mean.
4.4. Discussion
Once a fungus has established contact with the plant, elicitors are produced and released by the
pathogen or the plant itself (Wiesel et al., 2014). This in turns induces further defences such as
cell wall reinforcement, phytoalexin production and synthesis of PR proteins. Pathogenesis-
related proteins play a major role in defence of plants against these pathogens due to the vast
properties of the different PR proteins (Scherer et al., 2005). These PR proteins are found in
all parts of the plant including the roots, stems, leaves and floral organs (van Loon et al., 2006).
In this study, it was determined whether E. turcicum and/or its toxin monocerin elicits a defence
81
response in maize by inducing the expression of PR proteins, PR-1, PR-2, PR-3 and PR-10
genes. The PR proteins chosen in this study have previously been associated with fungal
pathogens and/or their associated mycotoxins that they produce (Morris et al., 1998; Xie et al.,
2010; Manghwar et al., 2018).
Typical NLB disease progression was observed in maize and correspond to what was observed
in previous experiments (Chapter 3, Section 3.3). Maize leaves that were infiltrated with pure
monocerin had small necrotic lesions at 24 hpi, which then slightly enlarged after 48 hpi. Cuq
et al. (1993) reported the same effect on maize leaves when crude monocerin extracts were
applied on leaves that had been punctured with a pin. The method of application of monocerin
to the leaves used in this study differs to that of Cuq et al. (1993). In this study monocerin was
infiltrated with a syringe and the leaves were attached whereas in the study by Cuq et al. (1993)
monocerin was applied as a droplet on the wound and the leaves were detached from the plant.
The toxin could have a bleaching effect (removal of chlorophyll) of some kind on the leaf or
could kill all the cells in the area surrounding infiltration. The tissue that was treated with
methanol (SC) had lesions but these were small and more chlorotic in nature compared to the
necrotic lesions caused by monocerin. The mechanical wounding of the leaf surface with a
syringe needle did not have any effect on lesion formation except for minimal cell necrosis
where the leaf was physically damaged.
From the results presented in this chapter it is clear that the expression of all four PR genes
were induced by the E. turcicum. All four PR genes were most induced at 14 dpi when the
fungus was in its necrotrophic phase and was in the process of completing its life cycle (Kotze
et al., 2019). A hemibiotroph (biotrophic phase) initially has to actively suppress the host
immune responses, allowing the invasive hyphae to spread throughout infected tissue as well
as protecting itself against the plant’s defence mechanisms (de Jonge et al., 2011; Koeck et al.,
2011). This is followed by the necrotrophic phase during which cell wall degrading enzymes,
reactive oxygen species or phytotoxins are released to induce host cell death allowing the
fungus to complete its life cycle (Horbach et al., 2011; Koeck et al., 2011). The plant’s immune
response is actively suppressed or altered by fungal effectors which are secreted into the plant
apoplast or cytosol during the biotrophic phase of hemibiotrophs (Koeck et al., 2011). Many
fungal effectors have been characterised which include the Avr (avirulence) and Ecp
(extracellular proteins) family of effectors which bind to chitin and thus prevent the plant host
defence recognition (Stergiopoulos & de Wit, 2009; Koeck et al., 2011). The overall low
82
expression of the PR genes at the earlier sample points observed in this study could possibly
be due to the fungal effectors that were suppressing the plants host defence. The increase in the
expression of PR genes at later sample points (14 dpi) can possonly be contributed to either or
both fungal and plant elicitors. Both fungal pathogens and their hosts (plants) have the ability
to secrete enzymes (e.g. chitinases, cellulases) that can attack and breakdown each other’s cells
walls and degrade them into their basic buildings blocks (Wiesel et al., 2014). These building
blocks in turn elicit a defence response in the plant. Fungal pathogens such as Fusarium spp.
produce trichothecenes family phytotoxins that can also elicit a defence response in its host
(Nishiuchi et al., 2006).
The function of PR-1 is still poorly understood but it is known to be antifungal in nature or
plays a role in host defence signalling and cell death (van Loon et al., 2006). The PR-1 family
is a dominant group of PR proteins, is induced by fungal pathogens and SA and is often used
as a marker in systemic acquired response (SAR) (van Loon et al., 2006). The expression of
PR-1 is a good indicator of a defence response in maize towards fungal pathogens such as
Bipolaris maydis¸ Puccinia sorghi, E. turcicum, Colletotrichum graminicola and Fusarium
verticillioides (Morris et al., 1998; Maschietto et al., 2016; Miranda et al., 2017). It is also one
of the most abundantly produced proteins in plants in response to fungal attacks (Breen et al.,
2016). Additionally it has been reported that PR-1 could also have a sterol binding activity but
the link between sterol binding activity and antimicrobial function remains unclear (Breen et
al., 2017). Another PR protein whose functions is relatively unknown is PR-10. It has been
reported that PR-10 has antifungal properties but is more known for its ribonuclease activity
(Bantignies et al., 2000; Chen et al., 2006). Xie et al. (2010) reported that the expression of
PR-10 gene was induced by Aspergillus flavus as well as the bacterial pathogen Erwinia
stewartia. Additionally, PR-10 was also induced by B. maydis (maize pathogen) and the
Colletotrichum sublineola (sorghum pathogen) (Lo et al., 1999). The expression of PR-10 gene
was induced by E. turcicum albeit at a low level compared to the other PR genes. PR-10 could
possibly also be used as indicator of a defence response in plants against fungal pathogens since
it is induced by numerous fungal species.
The functions of PR-2 and PR-3 have been well studied in plants in response to fungal
pathogens. The PR-2 family consists of β-1,3-glucanase which hydrolyses β-1,3-linked glucan
polymers whereas the PR-3 family consists of endochitinases that catalyses the cleavage β-1,4
bonds in chitin polymers making the fungus more sensitive to osmotic stress (Li et al., 2001;
83
Laluk & Mengiste, 2010; Ebrahim et al., 2011; Xie et al., 2015). Both β-1,3-glucan and chitin
together with mannoproteins are important structural components of fungal cells (Wiesel et al.,
2014). The structural components of fungal cell walls can elicit a host defence response in
plants but the fungus releases effectors such as Avr and Ecp (Stergiopoulos & de Wit, 2009).
Both Avr and Ecp can bind to these structural components which suppresses the host defence
response or protects the fungus physically due to less chitin and β-1,3-glucan being available
to elicit a response (Stergiopoulos & de Wit, 2009; de Jonge et al., 2011). As a result of this
the fungus evades the defence response of the host during the biotrophic phase until it has
colonised the host and switched over to is necrotrophic phase (de Jonge et al., 2011). The low
gene expression of PR proteins during the biotrophic phase could be contributed to fungal
effectors and healthy plant cells, which prevents the elucidation of the defence response of the
plant. Both PR protein genes’ expression was induced at high levels at 14 dpi when the fungus
was the most prevalent in the leaf tissue (Kotze et al., 2019). As with fungal cell walls, plant
cell walls are composed of cellulose, hemicellulose, pectic polysaccharides and lignin which
are broken down by fungal pathogens into β-glucans, xylose, and phenylpropanoid-containing
compounds (Wiesel et al., 2014). These break down products can act as plant based elicitors
by eliciting a defence response in plants (Wiesel et al., 2014). Fungal cell wall degrading
enzymes, phytotoxins and/or fragments formed from cell wall degradation could also elicit a
host defence response (Horbach et al., 2011).
In addition, to determine whether the fungus elicits a host response in maize with a focus on
PR protein gene expression, the phytotoxic effects of pure monocerin was also investigated.
Monocerin indeed induces expression of PR protein genes although at a lower level when
compared to the fungus. The only exception was with PR-10 which was induced at a higher
level when compared to fungal infection at the same sample point The SC also induced
expression of PR genes and thus a more appropriate solvent should be used in future studies.
Nishiuchi et al. (2006) reported on the elicitor like activity of trichothecenes in Arabidopsis
thaliana leaves. The authors indicated that PR-1 gene expression was induced by
trichothecenes between 24 hpi to 72 hpi and was the highest at 48 hpi when compared to the
control. In this study PR-1 gene expression was the highest at 24 hpi whereafter it started to
decline and thus the phytotoxic effects of monocerin on PR gene expression were induced
faster when compared to trichothecenes. Nishiuchi et al. (2006) unfortunately did not indicate
the level at which PR-1 was expressed. These authors used ethanol as a control ethanol which
did not have an effect the expression of PR-1. Stone et al. (2000) studied the effect of different
84
concentrations of fumonisin B1 (FB1) on Arabidopsis seedlings on PR proteins. The expression
of PR-1, PR-2 and PR-5 increased with increasing concentrations of FB1 with 1 mM FB1
having the greatest effect on the PR proteins. However, Stone et al. (2000) did not test the
effect of the solvent on the PR proteins. Both of these studies evaluated the effect of the fungal
pathogens (which produce these toxins) on the expression of PR protein genes. Both of these
mycotoxins (FB1 & trichothecenes) are comparable to the effects of monocerin seen in this
study as they produced similar PR protein gene expression results. Monocerin only induced
the expression of PR protein genes at a fraction of the levels that the fungus did. It could be
that monocerin is a necrotrophic effector (NE) which could target a specific protein and thus
aid the fungus in causing disease.
Hemibiotrophs initially produce effectors such as Avr4 and Ecp6 to evade the host defence
response by suppressing cell death in the host (Vleeshouwers & Oliver, 2014). At the later
stages of infection these genes are downregulated while other NE’s are upregulated
(Vleeshouwers & Oliver, 2014). It is assumed that NE’s usually induce cell death which results
in extra nutrients for the fungus but it is possible that cell death results in less anti-fungal
radicals or compounds that affect fungal growth as well as being a signal for sporulation
(Vleeshouwers & Oliver, 2014). Necrotrophic effectors can be of polyketide, non-ribosomal
peptide (NRPS) or protein origin. Vleeshouwers and Oliver (2014) state that the mode of action
of NE’s involves interaction and not always direct binding with a dominant host gene. T-toxin,
which is produced by B. maydis, targets the mitochondrial protein t-URF13, which results in
alterations to the membrane resulting in the death of the mitochondria (Vleeshouwers & Oliver,
2014). Didymella maydis produces PM-toxin which targets the same protein as T-toxin
(Stergiopoulos et al., 2013). The mode of action of HC-toxin produced by Cochliobolus
carbonum, is that it targets histone-deacetylases which results in the repression of gene
expression (Stergiopoulos et al., 2013). PtrToxA and PtrToxB produced by Pyrenophora
tritici-repentis reacts with ToxA binding protein 1 in the chloroplast which results in loss of
chlorophyll and the disorganization of thylakoids (Manning et al., 2009). It could be that
monocerin does not illicit a host defence response by inducing PR protein gene expression, but
rather acts as a NE that targets a specific protein such as ToxA binding protein 1 in the
chloroplast or the mitochondrial protein t-URF13.
85
4.5. Conclusion
The maize host defence response was induced by the E. turcicum through an increase in the
expression of PR protein genes but was expressed at a much lower level when the leaf tissue
was infiltrated with pure monocerin. These genes could then be used as expression markers in
breeding studies thus eliminating the use of transgenic plants. It could be that monocerin also
exerts its phytotoxic effect on cell organelles such as the mitochondria, chloroplast of plasma
membrane, for example. Additionally, monocerin could also be a NE that targets a specific
gene as T-toxin does with the mitochondrial protein, t-URF13. Aspects that should be
considered in the future studies would include using a different solvent which does not have a
toxic effect on maize cells and doing a transcriptomic study to determine what proteins
monocerin could possibly target.
4.6. References
Agrios GN, 2005. Plant Pathology. San Diego, CA, USA: Elsevier Academic Press.
Aldridge DC, Turner WB, 1970. Metabolites of Helminthosporium monoceras: Structures of
monocerin and related benzopyrans. Journal of the Chemical Society C: Organic 18, 2598-
600.
Bantignies B, Séguin J, Muzac I, Dédaldéchamp F, Gulick P, Ibrahim R, 2000. Direct evidence
for ribonucleolytic activity of a PR-10-like protein from white lupin roots. Plant Molecular
Biology 42, 871-81.
Bowles DJ, 1990. Defense-related proteins in higher plants. Annual Review of Biochemistry
59, 873-907.
Bravo JM, Campo S, Murillo I, Coca M, San Segundo B, 2003. Fungus- and wound-induced
accumulation of mRNA containing a class II chitinase of the pathogenesis-related protein 4
(PR-4) family of maize. Plant Molecular Biology 52, 745-59.
Breen S, Williams SJ, Outram M, Kobe B, Solomon PS, 2017. Emerging Insights into the
Functions of Pathogenesis-Related Protein 1. Trends in Plant Science 22, 871-9.
Breen S, Williams SJ, Winterberg B, Kobe B, Solomon PS, 2016. Wheat PR-1 proteins are
targeted by necrotrophic pathogen effector proteins. The Plant Journal 88, 13-25.
86
Brody JR, Kern SE, 2004. Sodium boric acid: a Tris-free, cooler conductive medium for DNA
electrophoresis. Biotechniques 36, 214-6.
Bustin SA, Benes V, Garson JA, et al., 2009. The MIQE guidelines: Minimum information for
publication of quantitative real-time PCR experiments. Clinical Chemistry 55, 611-22.
Chen ZY, Brown RL, Damann KE, Cleveland TE, 2010. PR10 expression in maize and its
effect on host resistance against Aspergillus flavus infection and aflatoxin production.
Molecular Plant Pathology 11, 69-81.
Chen ZY, Brown RL, Rajasekaran K, Damann KE, Cleveland TE, 2006. Identification of a
Maize Kernel Pathogenesis-Related Protein and Evidence for Its Involvement in Resistance to
Aspergillus flavus Infection and Aflatoxin Production. Phytopathology 96, 87-95.
Craven M, Fourie AP, 2011. Field evaluation of maize inbred lines for resistance to
Exserohilum turcicum. South African Journal of Plant and Soil 28, 69-74.
Cuq F, Petitprez M, Herrmann-Gorline S, Klaebe A, Rossignol M, 1993. Monocerin in
Exserohilum turcicum isolates from maize and a study of its phytotoxicity. Phytochemistry 34,
1265-70.
de Jonge R, Bolton MD, Thomma BP, 2011. How filamentous pathogens co-opt plants: the ins
and outs of fungal effectors. Current Opinion in Plant Biology 14, 400-6.
Ebrahim S, Usha K, Singh B, 2011. Pathogenesis related (PR) proteins in plant defense
mechanism. Science Against Microbial Pathogens 2, 1043-54.
Galeana-Sánchez E, Sánchez-Rangel D, de la Torre-Hernández ME, Nájera-Martínez M,
Ramos-Villegas P, Plasencia J, 2017. Fumonisin B1 produced in planta by Fusarium
verticillioides is associated with inhibition of maize β-1,3-glucanase activity and increased
aggressiveness. Physiological and Molecular Plant Pathology 100, 75-83.
Haasbroek MP, Craven M, Barnes I, Crampton BG, 2014. Microsatellite and mating type
primers for the maize and sorghum pathogen, Exserohilum turcicum. Australasian Plant
Pathology 43, 577-81.
Hellemans J, Mortier G, De Paepe A, Speleman F, Vandesompele J, 2007. qBase relative
quantification framework and software for management and automated analysis of real-time
quantitative PCR data. Genome Biology 8, R19.
87
Horbach R, Navarro-Quesada AR, Knogge W, Deising HB, 2011. When and how to kill a plant
cell: Infection strategies of plant pathogenic fungi. Journal of Plant Physiology 168, 51-62.
Jiao Y, Peluso P, Shi J, et al., 2017. Improved maize reference genome with single-molecule
technologies. Nature 546, 524.
Jondle DJ, Coors JG, Duke SH, 1989. Maize leaf β-1,3-glucanase activity in relation to
resistance to Exserohilum turcicum. Canadian Journal of Botany 67, 263-6.
Klopper R, Tweer S, 2009. Northern corn leaf blight fact sheet.
[http://www.pannar.com/assets/disease_fact_sheets/Northern_Corn_Leaf_Blight.pdf].
Accessed 11 November 2019.
Koeck M, Hardham AR, Dodds PN, 2011. The role of effectors of biotrophic and
hemibiotrophic fungi in infection. Cell Microbiology 13, 1849-57.
Korsman J, Meisel B, Kloppers FJ, Crampton BG, Berger DK, 2011. Quantitative phenotyping
of grey leaf spot disease in maize using real-time PCR. European Journal of Plant Pathology
133, 461-71.
Kotze RG, van der Merwe CF, Crampton BG, Kritzinger Q, 2019. A histological assessment
of the infection strategy of Exserohilum turcicum in maize. Plant Pathology 68, 504-12.
Kumar GN, Iyer S, Knowles NR, 2007. Extraction of RNA from fresh, frozen, and lyophilized
tuber and root tissues. Journal of agricultural and food chemistry 55, 1674-8.
Laluk K, Mengiste T, 2010. Necrotroph attacks on plants: wanton destruction or covert
extortion? The arabidopsis book 8, e0136-e.
Leonard KJ, Suggs EG, 1974. Setosphaeria prolata, the ascigerous state of Exserohilum
prolatum. Mycologia 66, 281-97.
Li WL, Faris JD, Muthukrishnan S, Liu DJ, Chen PD, Gill BS, 2001. Isolation and
characterization of novel cDNA clones of acidic chitinases and β-1,3-glucanases from wheat
spikes infected by Fusarium graminearum. Theoretical and Applied Genetics 102, 353-62.
Liu J-J, Ekramoddoullah AKM, Yu X, 2003. Differential expression of multiple PR10 proteins
in western white pine following wounding, fungal infection and cold-hardening. Physiologia
Plantarum 119, 544-53.
Lo SC, Hipskind JD, Nicholson RL, 1999. cDNA cloning of a sorghum pathogenesis-related
protein (PR-10) and differential expression of defense-related genes following inoculation with
88
Cochliobolus heterostrophus or Colletotrichum sublineolum. Molecular Plant-Microbe
Interactions 12, 479-89.
Majumdar R, Rajasekaran K, Sickler C, et al., 2017. The Pathogenesis-Related Maize Seed
(PRms) Gene Plays a Role in Resistance to Aspergillus flavus Infection and Aflatoxin
Contamination. Frontiers in Plant Science 8, 1758.
Manghwar H, Hussain A, Ullah A, et al., 2018. Expression analysis of defense related genes
in wheat and maize against Bipolaris sorokiniana. Physiological and Molecular Plant
Pathology 103, 36-46.
Manning VA, Chu AL, Steeves JE, Wolpert TJ, Ciuffetti LM, 2009. A host-selective toxin of
Pyrenophora tritici-repentis, Ptr ToxA, induces photosystem changes and reactive oxygen
species accumulation in sensitive wheat. Molecular Plant-Microbe Interactions 22, 665-76.
Maschietto V, Lanubile A, Leonardis SD, Marocco A, Paciolla C, 2016. Constitutive
expression of pathogenesis-related proteins and antioxydant enzyme activities triggers maize
resistance towards Fusarium verticillioides. Journal of Plant Physiology 200, 53-61.
Miranda VJ, Porto WF, Fernandes GDR, et al., 2017. Comparative transcriptomic analysis
indicates genes associated with local and systemic resistance to Colletotrichum graminicola in
maize. Scientific Reports 7, 2483.
Miyamoto K, Shimizu T, Lin F, et al., 2012. Identification of an E-box motif responsible for
the expression of jasmonic acid-induced chitinase gene OsChia4a in rice. Journal of Plant
Physiology 169, 621-7.
Morris SW, Vernooij B, Titatarn S, et al., 1998. Induced resistance responses in maize.
Molecular Plant-Microbe Interactions 11, 643-58.
Niki T, Mitsuhara I, Seo S, Ohtsubo N, Ohashi Y, 1998. Antagonistic effect of salicylic acid
and jasmonic acid on the expression of pathogenesis-related (PR) protein genes in wounded
mature tobacco leaves. Plant and Cell Physiology 39, 500-7.
Nishiuchi T, Masuda D, Nakashita H, et al., 2006. Fusarium phytotoxin trichothecenes have
an elicitor-like activity in Arabidopsis thaliana, but the activity differed significantly among
their molecular species. Molecular Plant-Microbe Interactions 19, 512-20.
Robeson DJ, Strobel GA, 1982. Monocerin, a phytotoxin from Exserohilum turcicum (=
Drechslera turcica). Agricultural and Biological Chemistry 46, 2681-3.
89
Scherer NM, Thompson CE, Freitas LB, Bonatto SL, Salzano FM, 2005. Patterns of molecular
evolution in pathogenesis-related proteins. Genetics and Molecular Biology 28, 645-53.
Schweizer P, Buchala A, Dudler R, Métraux JP, 1998. Induced systemic resistance in wounded
rice plants. The Plant Journal 14, 475-81.
Sekhon RS, Kuldau G, Mansfield M, Chopra S, 2006. Characterization of Fusarium-induced
expression of flavonoids and PR genes in maize. Physiological and Molecular Plant Pathology
69, 109-17.
Sels J, Mathys J, De Coninck BM, Cammue BP, De Bolle MF, 2008. Plant pathogenesis-related
(PR) proteins: a focus on PR peptides. Plant Physiology Biochemistry 46, 941-50.
Stergiopoulos I, Collemare J, Mehrabi R, De Wit PJ, 2013. Phytotoxic secondary metabolites
and peptides produced by plant pathogenic Dothideomycete fungi. FEMS Microbiology
Reviews 37, 67-93.
Stergiopoulos I, de Wit PJ, 2009. Fungal effector proteins. Annual Review of Phytopathology
47, 233-63.
Stone JM, Heard JE, Asai T, Ausubel FM, 2000. Simulation of fungal-mediated cell death by
fumonisin B1 and selection of fumonisin B1-resistant (fbr) Arabidopsis mutants. The Plant
Cell Online 12, 1811-22.
Swanson J, Kearney B, Dahlbeck D, Staskawicz B, 1988. Cloned avirulence gene of
Xanthomonas campestris pv. vesicatoria complements spontaneous race-change mutants.
Molecular Plant-Microbe Interactions 1, 5-9.
Taylor S, Wakem M, Dijkman G, Alsarraj M, Nguyen M, 2010. A practical approach to RT-
qPCR-Publishing data that conform to the MIQE guidelines. Methods 50, S1-5.
Uknes S, Mauch-Mani B, Moyer M, et al., 1992. Acquired resistance in Arabidopsis. Plant
Cell 4, 645-56.
van Loon LC, Rep M, Pieterse CM, 2006. Significance of inducible defense-related proteins in
infected plants. Annual Review of Phytopathology 44, 135-62.
van Loon LC, van Strien EA, 1999. The families of pathogenesis-related proteins, their
activities, and comparative analysis of PR-1 type proteins. Physiological and Molecular Plant
Pathology 55, 85-97.
90
Vandesompele J, De Preter K, Pattyn F, et al., 2002. Accurate normalization of real-time
quantitative RT-PCR data by geometric averaging of multiple internal control genes. Genome
Biology 3, RESEARCH0034.1-.11.
Vleeshouwers VG, Oliver RP, 2014. Effectors as tools in disease resistance breeding against
biotrophic, hemibiotrophic, and necrotrophic plant pathogens. Molecular Plant-Microbe
Interactions 27, 196-206.
Wiesel L, Newton AC, Elliott I, et al., 2014. Molecular effects of resistance elicitors from
biological origin and their potential for crop protection. Frontiers in Plant Science 5, 655.
Wise K, 2011. Diseases of Corn: Northern Corn Leaf Blight.
[https://www.extension.purdue.edu/extmedia/BP/BP-84-W.pdf]. 14 November 2019.
Wu S, Kriz AL, Widholm JM, 1994. Nucleotide sequence of a maize cDNA for a class II,
acidic beta-1,3-glucanase. Plant Physiology 106, 1709-10.
Xie YR, Chen ZY, Brown RL, Bhatnagar D, 2010. Expression and functional characterization
of two pathogenesis-related protein 10 genes from Zea mays. Journal of Plant Physiology 167,
121-30.
Xie YR, Raruang Y, Chen ZY, Brown RL, Cleveland TE, 2015. ZmGns, a maize class I beta-
1,3-glucanase, is induced by biotic stresses and possesses strong antimicrobial activity. Journal
of Integrative Plant Biology 57, 271-83.
91
Chapter 5: Evidence of
ultrastructural phytotoxicity
associated with monocerin, on maize
leaves
92
Abstract
Exserohilum turcicum, the causal agent of northern leaf blight (NLB) of maize, produces a
secondary metabolite, monocerin, which is known to be phytotoxic to a wide range of plants.
Monocerin could play an important role in disease development. The aims of the study were to
determine the phytotoxic effects of monocerin on the ultrastructure of maize leaf cells as well
as to investigate whether the expression of genes coding for enzymes involved in starch
degradation in the chloroplast are inhibited by the toxin and fungus. For microscopic studies,
leaf material infiltrated with 1 and 2 mM monocerin was harvested at 0, 6, 12, 24 and 48 hours
post-infiltration (hpi). Samples were prepared according to standard microscopy procedures
and analysed using light and transmission electron microscopy. The cytoplasm, vacuole and
chloroplast were most affected at both concentrations of monocerin. Chloroplasts appeared to
be most sensitive to the toxin which caused disruption of their double-membrane, stroma,
thylakoid membranes and an over accumulation of starch granules. In addition, RNA was
isolated from monocerin infiltrated and fungus infected leaves whereafter cDNA was
synthesised for gene expression studies. The expression of phosphoglucan water dikinase
(pwd) and ɑ-amylase 3 (amy3) (enzymes part of starch degradation) genes was inhibited by the
fungus, and amy3 by monocerin. The fungus and toxin could thus affect the translocation of
sugars out of the chloroplast. This study provided a detailed view on the toxic effect of
monocerin on the ultrastructure of maize leaf cells. Furthermore, the effect of the toxin and
fungus on the expression of genes involved on the degradation of starch granules in the
chloroplast was established.
Keywords: Exserohilum turcicum, monocerin, northern leaf blight, phytotoxins, starch
enzymes, ultrastructure, Zea mays.
93
5.1. Introduction
Many economically important disease-causing phytopathogenic fungi have the ability to
produce low molecular weight secondary metabolites or phytotoxins, which could contribute
to their survival. For example, metabolites such as pigments could provide protection or
pathogenicity whereas toxins could mediate virulence or play a role in infection (Bennett &
Klich, 2003; Mobius & Hertweck, 2009). Many phytotoxins that have been described either
play a role in the diseases caused by phytopathogenic fungi or are associated with a particular
fungus. These phytotoxins can either be host-selective, where they induce pathogenicity in one
species or non-host selective where they are phytotoxic towards numerous plant species
regardless of whether the species plays host to the fungus (Scheffer & Livingston, 1984;
Mobius & Hertweck, 2009). Host-selective phytotoxins includes victorin, HC-toxin, tentoxin,
T-toxin and PM-toxin (Scheffer & Livingston, 1984; Collemare & Lebrun, 2011;
Stergiopoulos et al., 2013). Non-host selective phytotoxins include the well-known mycotoxins
fumonisins, trichothecenes and AAL-toxin as well as cercosporin and elsinochrome (Cutler &
Jarvis, 1985; Abbas & Boyette, 1992; Abbas et al., 1995; Collemare & Lebrun, 2011; Kotze et
al., 2016). Phytotoxins target numerous cellular components of plants which include the plasma
membrane (fumonisins, AAL-toxin), mitochondria (victorin, T-toxin), chloroplast (tentoxin)
and ribosomes (trichothecenes) (Mobius & Hertweck, 2009; Collemare & Lebrun, 2011).
Disruption of these cellular components leads to chlorosis, necrosis, growth inhibition, wilting
and ultimately to the death of the plants (Abbas & Boyette, 1992; Abbas et al., 1995).
Monocerin is a lipophilic, dihydroisocoumarin and polyketide metabolite produced by
Exserohilum turcicum, which is the causal pathogen for northern leaf blight (NLB) of maize
(Aldridge & Turner, 1970; Robeson & Strobel, 1982). It has been reported that monocerin
could aid the fungus in causing disease in maize (Aldridge & Turner, 1970; Cuq et al., 1993).
Monocerin was first isolated by Aldridge and Turner (1970) from Exserohilum monoceras and
from E. turcicum by Robeson and Strobel (1982). Additionally, Robeson and Strobel (1982)
were the first to report on the phytotoxicity of monocerin towards cucumber (Cucumis
sativus L). and Johnson grass (Sorghum halepense Pers.). Monocerin is also phytotoxic
towards maize (Zea mays), radish (Raphanus raphanistrum L.), tomato (Solanum lycopersicum
L.), ryegrass (Lolium multiflorum Lam.) and weeds such as barnyard grass (Echinochloa crus-
galli (L.) P.Beauv.), bulrush (Schoenoplectiella juncoides (Roxb.) Lye) and creeping thistle
(Cirsium arvense (L.) Scop.) (Cuq et al., 1993; Lim, 1999). Monocerin is considered to be a
94
non-host specific phytotoxin since it is phytotoxic towards more than one plant species. Not
much is known about the mode of action or where the in the plant cell the toxin causes damage.
Monocerin could possibly have an effect on the cell division cycle by interfering with the S
and G2 stages, and could also disrupt the chloroplast (Gélie et al., 1987; Cuq et al., 1995).
The assimilation of atmospheric carbon dioxide during photosynthesis by leaves yields sucrose
and starch as the two end products of the light reaction of photosynthesis (Taiz & Zeiger, 2006).
Sucrose can be found in the cytosol and is continuously exported to other non-photosynthetic
parts of the plants whereas starch remains in the chloroplast (Taiz & Zeiger, 2006). At the onset
of darkness, carbon assimilation stops and the degradation of starch commences in the
chloroplast to maintain the export of sucrose (Taiz & Zeiger, 2006; Silver et al., 2014). Starch
granules consist mainly of branched polymers of glucose that are highly ordered, semi-
crystalline structures (Smith et al., 2005; Silver et al., 2014). The degradation of starch in the
chloroplast is initiated with the phosphorylation of the surface of a starch granule by glucan
water dikinase (gwd) and phosphoglucan, water dikinase (pwd) (Smith et al., 2005; Silver et
al., 2014). The phosphorylation of the semi-crystalline structure by gwd and pwd served to
solubilise the granule surface for enzymes such as ɑ-amylase (amy3), β-amylase (bam1 &
bam3) and isoamylase (isa3) to access the glucan chains (Zeeman et al., 2010). The products
of these hydrolyses reactions are then use in downstream reactions with the end product being
sucrose (Zeeman et al., 2010).
This study was undertaken to evaluate the phytotoxic effect of monocerin in maize leaves with
an emphasis on the cell ultrastructure and starch degradation in the chloroplast. Furthermore,
the study was conducted to determine whether monocerin could aid the fungus in causing
disease in maize. Additionally, due to the accumulation of starch granules observed in the
chloroplast it was determined whether E. turcicum and monocerin could inhibit the expression
of genes coding for enzymes involved in the degradation of starch in the chloroplast. The results
of this study will provide a better understanding at an ultrastructure level as to where the toxin
exerts its phytotoxic effects as well as to whether the fungus and toxin are involved in
manipulating genes involved in starch degradation in the chloroplast.
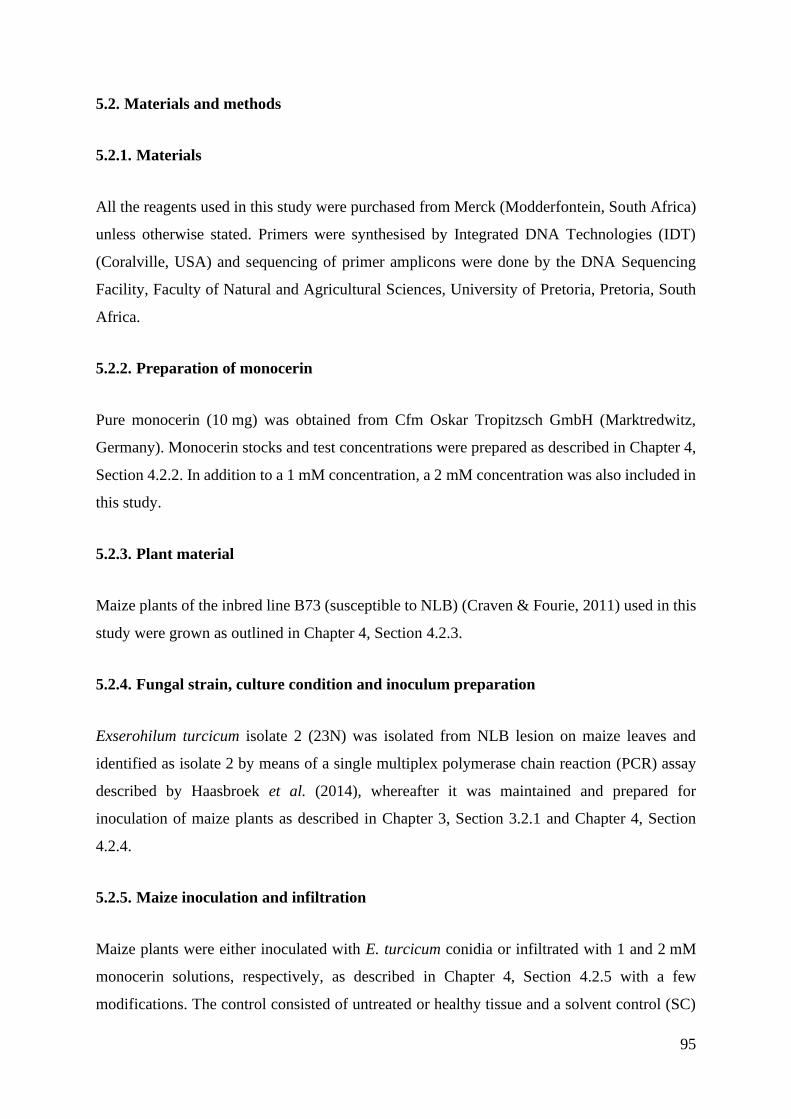
95
5.2. Materials and methods
5.2.1. Materials
All the reagents used in this study were purchased from Merck (Modderfontein, South Africa)
unless otherwise stated. Primers were synthesised by Integrated DNA Technologies (IDT)
(Coralville, USA) and sequencing of primer amplicons were done by the DNA Sequencing
Facility, Faculty of Natural and Agricultural Sciences, University of Pretoria, Pretoria, South
Africa.
5.2.2. Preparation of monocerin
Pure monocerin (10 mg) was obtained from Cfm Oskar Tropitzsch GmbH (Marktredwitz,
Germany). Monocerin stocks and test concentrations were prepared as described in Chapter 4,
Section 4.2.2. In addition to a 1 mM concentration, a 2 mM concentration was also included in
this study.
5.2.3. Plant material
Maize plants of the inbred line B73 (susceptible to NLB) (Craven & Fourie, 2011) used in this
study were grown as outlined in Chapter 4, Section 4.2.3.
5.2.4. Fungal strain, culture condition and inoculum preparation
Exserohilum turcicum isolate 2 (23N) was isolated from NLB lesion on maize leaves and
identified as isolate 2 by means of a single multiplex polymerase chain reaction (PCR) assay
described by Haasbroek et al. (2014), whereafter it was maintained and prepared for
inoculation of maize plants as described in Chapter 3, Section 3.2.1 and Chapter 4, Section
4.2.4.
5.2.5. Maize inoculation and infiltration
Maize plants were either inoculated with E. turcicum conidia or infiltrated with 1 and 2 mM
monocerin solutions, respectively, as described in Chapter 4, Section 4.2.5 with a few
modifications. The control consisted of untreated or healthy tissue and a solvent control (SC)
96
where tissue was infiltrated with 40% methanol. For the microscopy study, each condition
tested consisted of four biological replicates. Leaf samples were harvested at 6, 12, 24 and
48 hours after infiltration (hpi). Control samples were harvested before the infiltration (0 hpi)
and the SC samples were harvested at the same sample points as monocerin except for 48 hpi.
For RT-qPCR experiments the same biological replicates were used as described in Chapter 4,
Section 4.2.5.
5.2.6. Light and transmission electron microscopy preparations
For microscopy only the effect of the toxin on the ultrastructure of maize leaf cells was
investigated as the effect of the fungus had already been established in Chapter 3. Control and
monocerin infiltrated maize leaf tissue with necrotic lesions, was prepared for light microscopy
(LM) and transmission electron microscopy (TEM) as described in Chapter 3, Section 3.2.3.
The only modification was that samples prepared for TEM were cut 120 µm thick instead of
100 µm since 100 µm thick monocerin infiltrated samples collapsed when cut with an
ultramicrotome.
5.2.7. RNA isolation and cDNA synthesis
For the gene expression studies, the effects of both E. turcicum and monocerin were studied.
RNA was isolated and cDNA was synthesised as described in Chapter 4, Sections 4.2.6 and
4.2.7, respectively.
5.2.8. RT-qPCR primer design
Gene-specific primers were designed and synthesised as described in Chapter 4, Section 4.2.8
to determine the expression of three genes involved in breaking down starch granules in the
chloroplast. These genes included gwd (Zm00001d037059), pwd (Zm00001d023792) and
amy3 (Zm00001d043662). The same reference genes (rpol, srl and gst3) were used as in
Chapter 4. Primer sequences and associated information are summarised in Table 5.1.
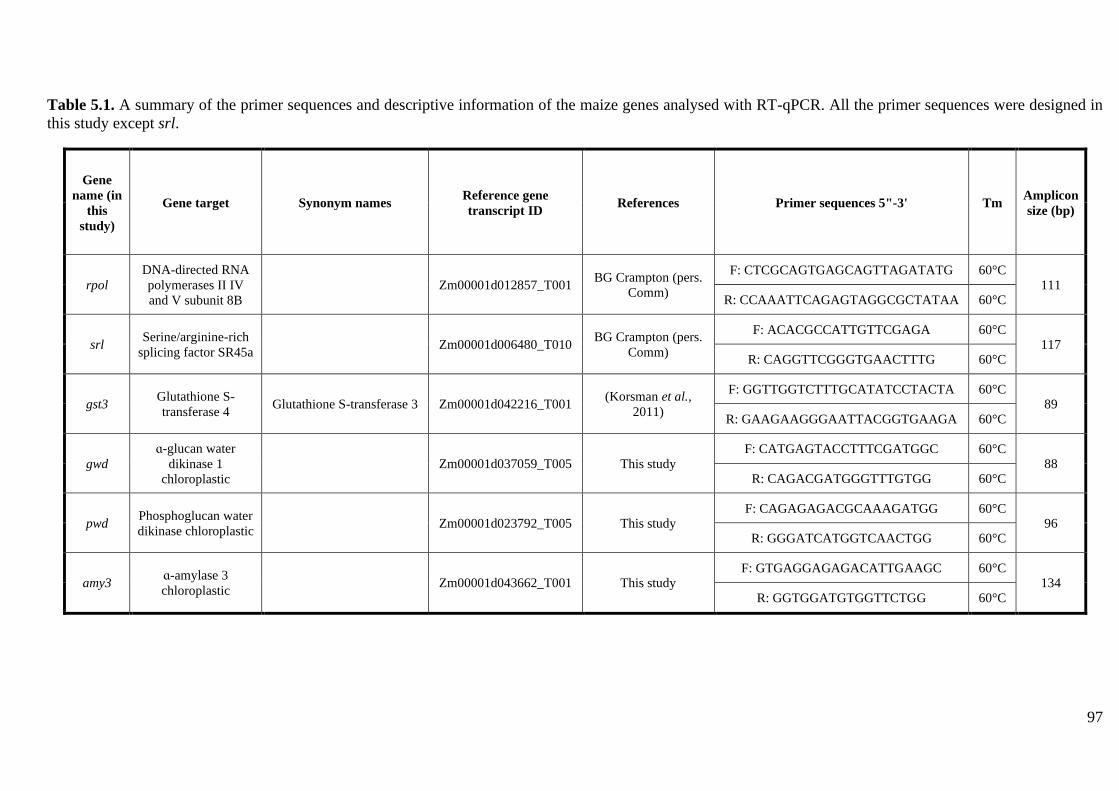
97
Table 5.1. A summary of the primer sequences and descriptive information of the maize genes analysed with RT-qPCR. All the primer sequences were designed in
this study except srl.
Gene
name (in
this
study)
Gene target Synonym names Reference gene
transcript ID References Primer sequences 5"-3' Tm
Amplicon
size (bp)
rpol
DNA-directed RNA
polymerases II IV
and V subunit 8B
Zm00001d012857_T001 BG Crampton (pers.
Comm)
F: CTCGCAGTGAGCAGTTAGATATG 60°C 111
R: CCAAATTCAGAGTAGGCGCTATAA 60°C
srl Serine/arginine-rich
splicing factor SR45a Zm00001d006480_T010
BG Crampton (pers.
Comm)
F: ACACGCCATTGTTCGAGA 60°C 117
R: CAGGTTCGGGTGAACTTTG 60°C
gst3 Glutathione S-
transferase 4 Glutathione S-transferase 3 Zm00001d042216_T001
(Korsman et al.,
2011)
F: GGTTGGTCTTTGCATATCCTACTA 60°C 89
R: GAAGAAGGGAATTACGGTGAAGA 60°C
gwd
ɑ-glucan water
dikinase 1
chloroplastic
Zm00001d037059_T005 This study F: CATGAGTACCTTTCGATGGC 60°C
88 R: CAGACGATGGGTTTGTGG 60°C
pwd Phosphoglucan water
dikinase chloroplastic Zm00001d023792_T005 This study
F: CAGAGAGACGCAAAGATGG 60°C 96
R: GGGATCATGGTCAACTGG 60°C
amy3 ɑ-amylase 3
chloroplastic Zm00001d043662_T001 This study
F: GTGAGGAGAGACATTGAAGC 60°C 134
R: GGTGGATGTGGTTCTGG 60°C

98
5.2.9. PCR optimisation, sequencing and expression analysis of genes involved in starch
degradation
The specificity of each gene primer set was tested and optimised as outlined in Chapter 4,
Section 4.2.9. PCR products were sequenced to confirm that primers did indeed amplify the
correct gene (Chapter 4, Section 4.2.10). Sequenced amplicons were analysed and are included
in the appendix (Table 7.1). Reverse transcription-qPCR (RT-qPCR) analysis of the genes
encoding enzymes involved in starch degradation (gwd, pwd and amy3) and three reference
genes (rpol, srl and gst3) were performed as described in Chapter 4, Section 4.2.10 whereafter
the expression of starch degradation genes was calculated relative to the reference genes for
each treatment and sample point tested. Gene expression data was analysed in Bio-Rad CFX
manager with the reference genes further analysed in qBASEPLUS with geNorm as explained in
Chapter 4, Section 4.3.4.
5.2.10. Statistical analysis
Statistical analysis of the relative expression data was performed using GraphPad Prism
version 4.03 (GraphPad Prism Software, San Diego, California, USA). A one-way analysis of
variance (ANOVA) was done, followed by a Tukey’s multiple comparison test with the level
statistical significance measured at p < 0.05.
5.3. Results
5.3.1. Monocerin infiltration of maize leaves
Maize leaves were infiltrated with either a 1 or a 2 mM monocerin solution whereafter they
were harvested at 6, 12, 24 and 48 hpi. Similar morphological observations were seen in
comparison to Chapter 4, Section 4.3.1. The lesions observed in Chapter 4 were small and
necrotic after 24 hpi with 1 mM monocerin and enlarged slightly at 48 hpi. The non-infiltrated
control (Figure 5.1, a) revealed healthy tissue without any visible lesions whereas with the SC
(Figure 5.1, b) damage could be seen, 24 hpi, where the leaf was nicked with a syringe needle
with a small area around the wound being necrotic. For both 1 and 2 mM monocerin at 6 and
12 hpi only water-soaked spots were visible and no lesions (images not shown). When leaves
were infiltrated with 1 mM monocerin, small necrotic lesions were visible 24 hpi (Figure 5.1, c)
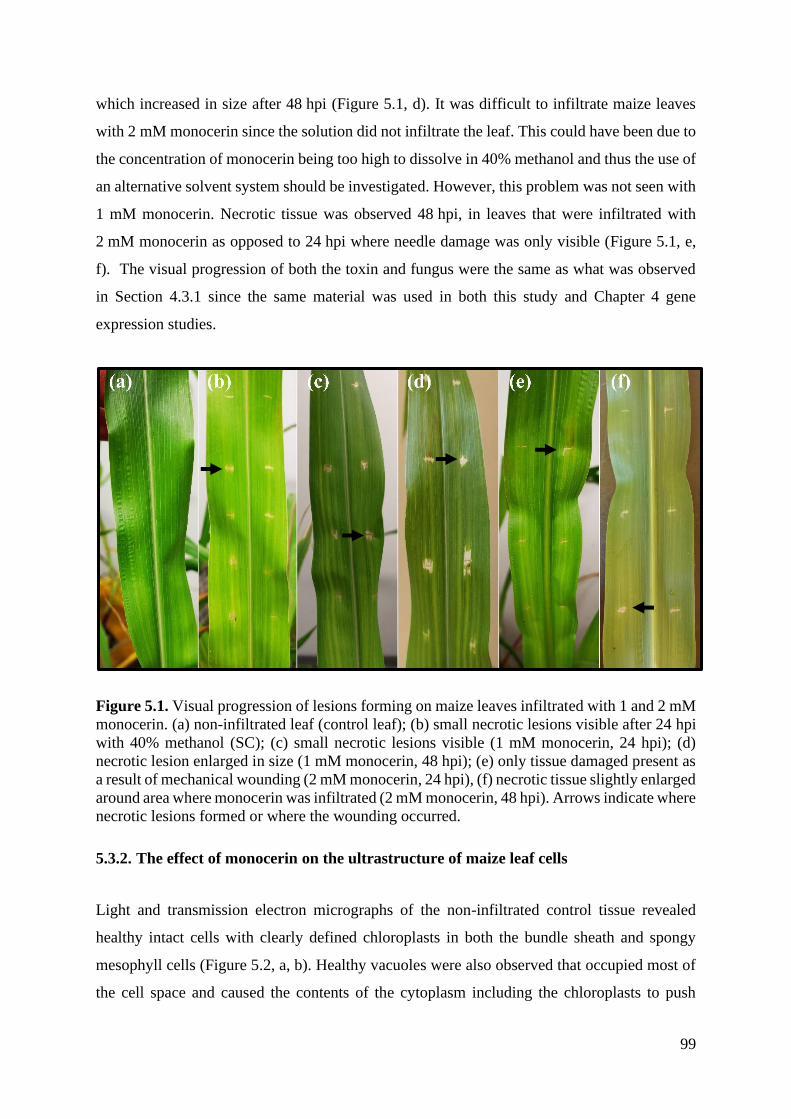
99
which increased in size after 48 hpi (Figure 5.1, d). It was difficult to infiltrate maize leaves
with 2 mM monocerin since the solution did not infiltrate the leaf. This could have been due to
the concentration of monocerin being too high to dissolve in 40% methanol and thus the use of
an alternative solvent system should be investigated. However, this problem was not seen with
1 mM monocerin. Necrotic tissue was observed 48 hpi, in leaves that were infiltrated with
2 mM monocerin as opposed to 24 hpi where needle damage was only visible (Figure 5.1, e,
f). The visual progression of both the toxin and fungus were the same as what was observed
in Section 4.3.1 since the same material was used in both this study and Chapter 4 gene
expression studies.
Figure 5.1. Visual progression of lesions forming on maize leaves infiltrated with 1 and 2 mM
monocerin. (a) non-infiltrated leaf (control leaf); (b) small necrotic lesions visible after 24 hpi
with 40% methanol (SC); (c) small necrotic lesions visible (1 mM monocerin, 24 hpi); (d)
necrotic lesion enlarged in size (1 mM monocerin, 48 hpi); (e) only tissue damaged present as
a result of mechanical wounding (2 mM monocerin, 24 hpi), (f) necrotic tissue slightly enlarged
around area where monocerin was infiltrated (2 mM monocerin, 48 hpi). Arrows indicate where
necrotic lesions formed or where the wounding occurred.
5.3.2. The effect of monocerin on the ultrastructure of maize leaf cells
Light and transmission electron micrographs of the non-infiltrated control tissue revealed
healthy intact cells with clearly defined chloroplasts in both the bundle sheath and spongy
mesophyll cells (Figure 5.2, a, b). Healthy vacuoles were also observed that occupied most of
the cell space and caused the contents of the cytoplasm including the chloroplasts to push
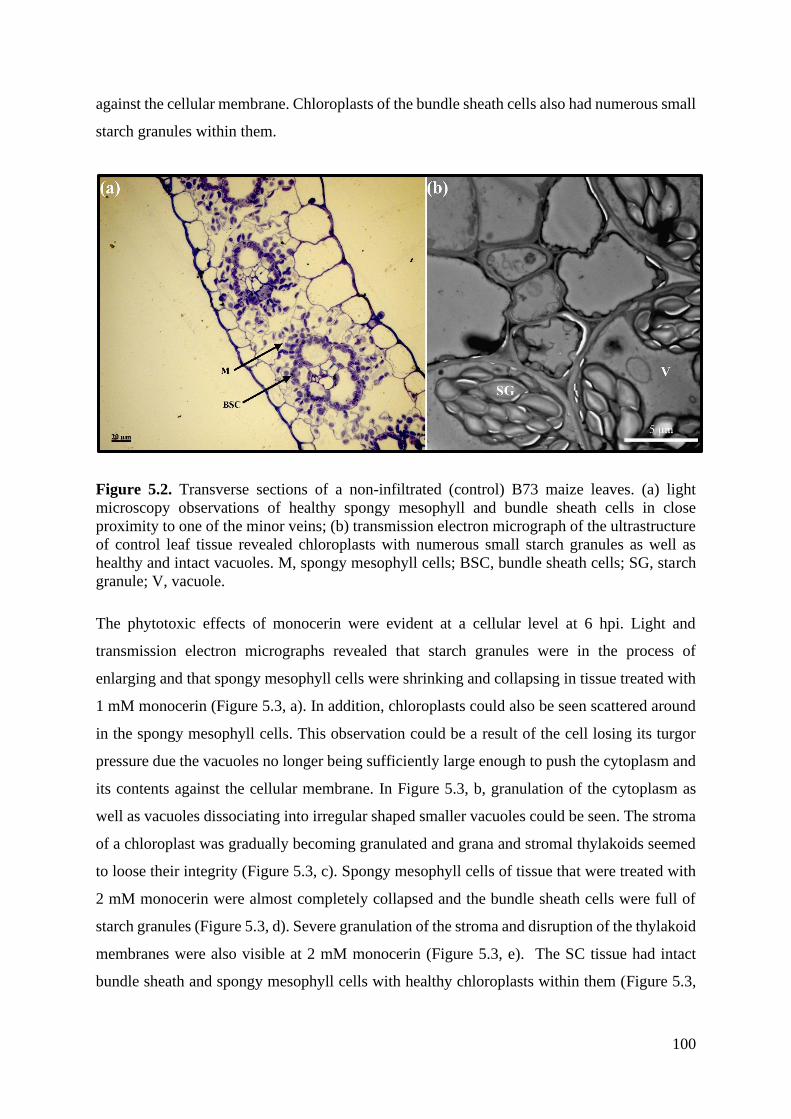
100
against the cellular membrane. Chloroplasts of the bundle sheath cells also had numerous small
starch granules within them.
Figure 5.2. Transverse sections of a non-infiltrated (control) B73 maize leaves. (a) light
microscopy observations of healthy spongy mesophyll and bundle sheath cells in close
proximity to one of the minor veins; (b) transmission electron micrograph of the ultrastructure
of control leaf tissue revealed chloroplasts with numerous small starch granules as well as
healthy and intact vacuoles. M, spongy mesophyll cells; BSC, bundle sheath cells; SG, starch
granule; V, vacuole.
The phytotoxic effects of monocerin were evident at a cellular level at 6 hpi. Light and
transmission electron micrographs revealed that starch granules were in the process of
enlarging and that spongy mesophyll cells were shrinking and collapsing in tissue treated with
1 mM monocerin (Figure 5.3, a). In addition, chloroplasts could also be seen scattered around
in the spongy mesophyll cells. This observation could be a result of the cell losing its turgor
pressure due the vacuoles no longer being sufficiently large enough to push the cytoplasm and
its contents against the cellular membrane. In Figure 5.3, b, granulation of the cytoplasm as
well as vacuoles dissociating into irregular shaped smaller vacuoles could be seen. The stroma
of a chloroplast was gradually becoming granulated and grana and stromal thylakoids seemed
to loose their integrity (Figure 5.3, c). Spongy mesophyll cells of tissue that were treated with
2 mM monocerin were almost completely collapsed and the bundle sheath cells were full of
starch granules (Figure 5.3, d). Severe granulation of the stroma and disruption of the thylakoid
membranes were also visible at 2 mM monocerin (Figure 5.3, e). The SC tissue had intact
bundle sheath and spongy mesophyll cells with healthy chloroplasts within them (Figure 5.3,
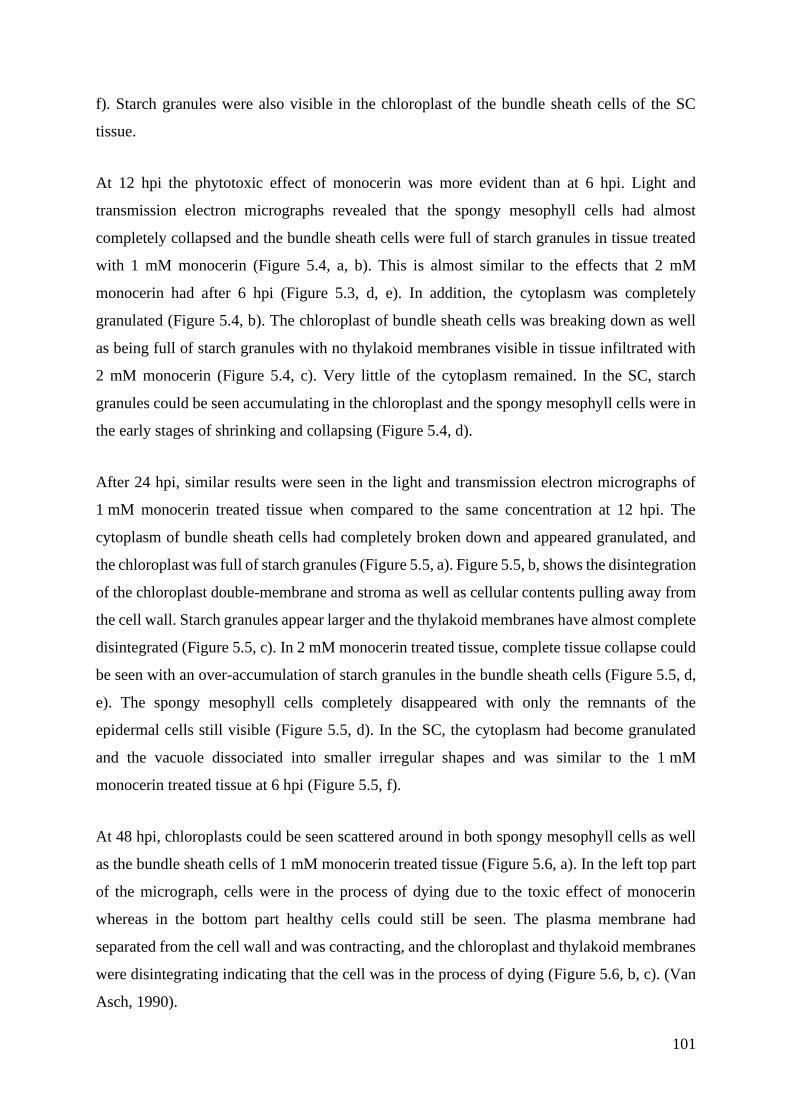
101
f). Starch granules were also visible in the chloroplast of the bundle sheath cells of the SC
tissue.
At 12 hpi the phytotoxic effect of monocerin was more evident than at 6 hpi. Light and
transmission electron micrographs revealed that the spongy mesophyll cells had almost
completely collapsed and the bundle sheath cells were full of starch granules in tissue treated
with 1 mM monocerin (Figure 5.4, a, b). This is almost similar to the effects that 2 mM
monocerin had after 6 hpi (Figure 5.3, d, e). In addition, the cytoplasm was completely
granulated (Figure 5.4, b). The chloroplast of bundle sheath cells was breaking down as well
as being full of starch granules with no thylakoid membranes visible in tissue infiltrated with
2 mM monocerin (Figure 5.4, c). Very little of the cytoplasm remained. In the SC, starch
granules could be seen accumulating in the chloroplast and the spongy mesophyll cells were in
the early stages of shrinking and collapsing (Figure 5.4, d).
After 24 hpi, similar results were seen in the light and transmission electron micrographs of
1 mM monocerin treated tissue when compared to the same concentration at 12 hpi. The
cytoplasm of bundle sheath cells had completely broken down and appeared granulated, and
the chloroplast was full of starch granules (Figure 5.5, a). Figure 5.5, b, shows the disintegration
of the chloroplast double-membrane and stroma as well as cellular contents pulling away from
the cell wall. Starch granules appear larger and the thylakoid membranes have almost complete
disintegrated (Figure 5.5, c). In 2 mM monocerin treated tissue, complete tissue collapse could
be seen with an over-accumulation of starch granules in the bundle sheath cells (Figure 5.5, d,
e). The spongy mesophyll cells completely disappeared with only the remnants of the
epidermal cells still visible (Figure 5.5, d). In the SC, the cytoplasm had become granulated
and the vacuole dissociated into smaller irregular shapes and was similar to the 1 mM
monocerin treated tissue at 6 hpi (Figure 5.5, f).
At 48 hpi, chloroplasts could be seen scattered around in both spongy mesophyll cells as well
as the bundle sheath cells of 1 mM monocerin treated tissue (Figure 5.6, a). In the left top part
of the micrograph, cells were in the process of dying due to the toxic effect of monocerin
whereas in the bottom part healthy cells could still be seen. The plasma membrane had
separated from the cell wall and was contracting, and the chloroplast and thylakoid membranes
were disintegrating indicating that the cell was in the process of dying (Figure 5.6, b, c). (Van
Asch, 1990).
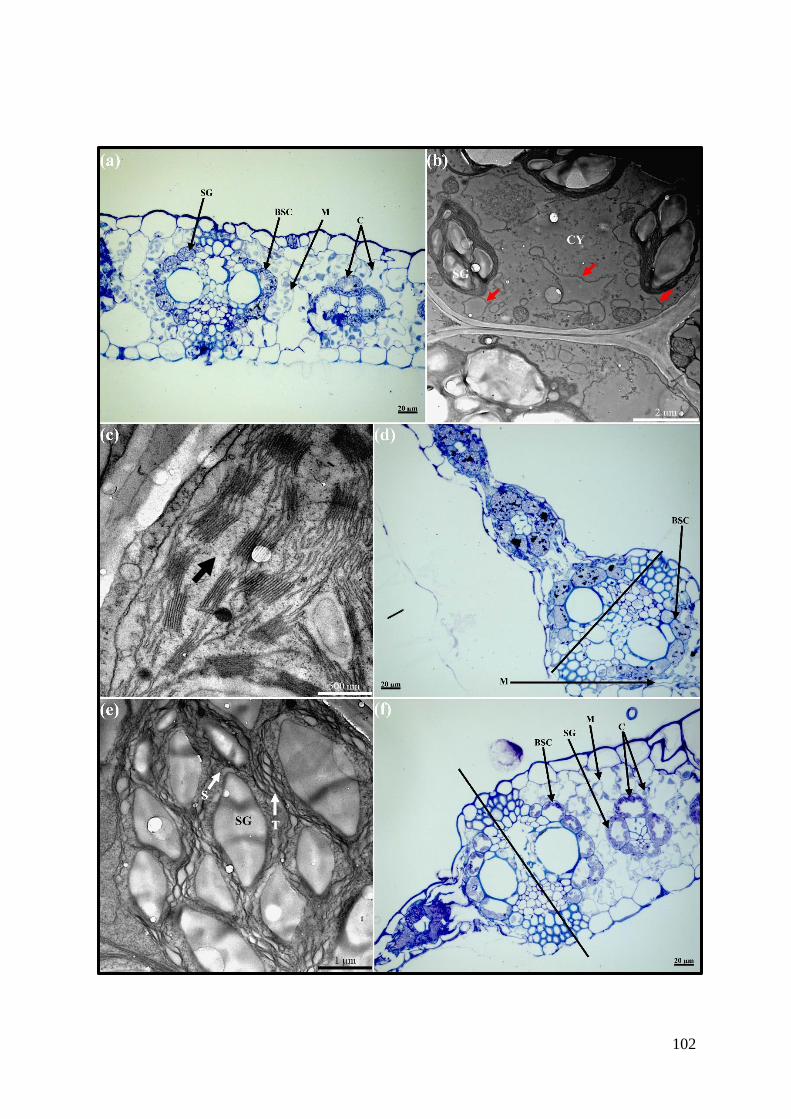
102
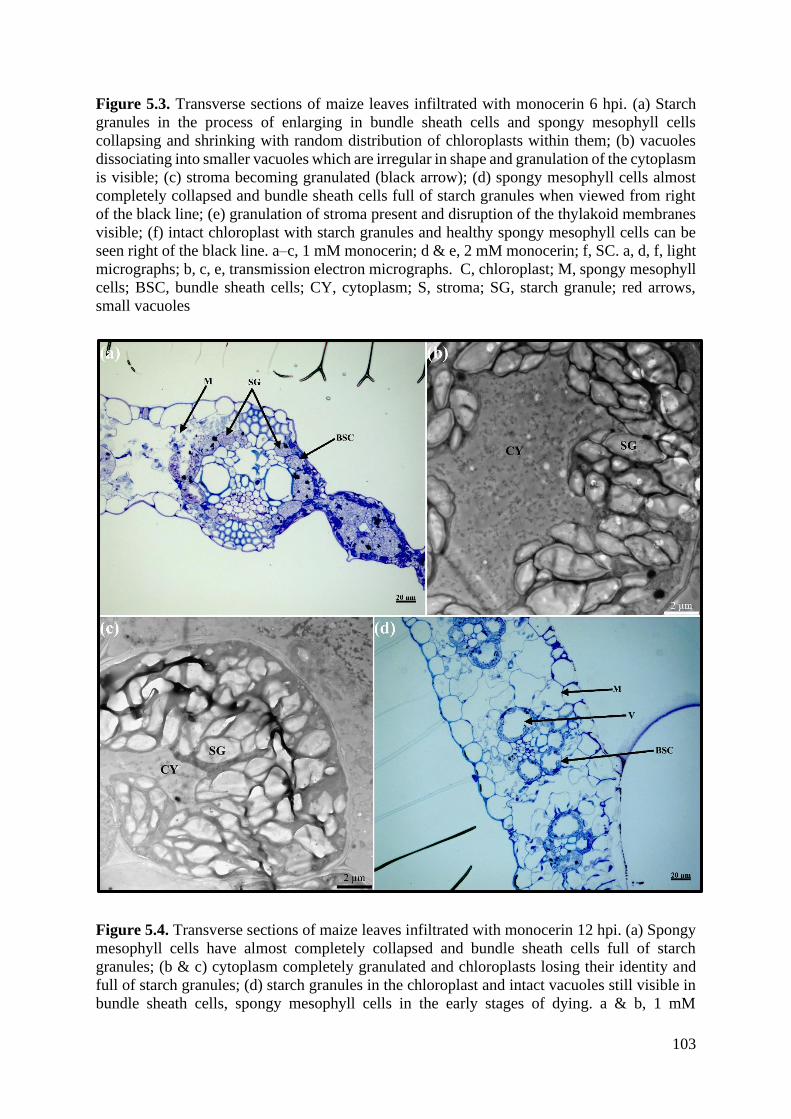
103
Figure 5.3. Transverse sections of maize leaves infiltrated with monocerin 6 hpi. (a) Starch
granules in the process of enlarging in bundle sheath cells and spongy mesophyll cells
collapsing and shrinking with random distribution of chloroplasts within them; (b) vacuoles
dissociating into smaller vacuoles which are irregular in shape and granulation of the cytoplasm
is visible; (c) stroma becoming granulated (black arrow); (d) spongy mesophyll cells almost
completely collapsed and bundle sheath cells full of starch granules when viewed from right
of the black line; (e) granulation of stroma present and disruption of the thylakoid membranes
visible; (f) intact chloroplast with starch granules and healthy spongy mesophyll cells can be
seen right of the black line. a–c, 1 mM monocerin; d & e, 2 mM monocerin; f, SC. a, d, f, light
micrographs; b, c, e, transmission electron micrographs. C, chloroplast; M, spongy mesophyll
cells; BSC, bundle sheath cells; CY, cytoplasm; S, stroma; SG, starch granule; red arrows,
small vacuoles
Figure 5.4. Transverse sections of maize leaves infiltrated with monocerin 12 hpi. (a) Spongy
mesophyll cells have almost completely collapsed and bundle sheath cells full of starch
granules; (b & c) cytoplasm completely granulated and chloroplasts losing their identity and
full of starch granules; (d) starch granules in the chloroplast and intact vacuoles still visible in
bundle sheath cells, spongy mesophyll cells in the early stages of dying. a & b, 1 mM
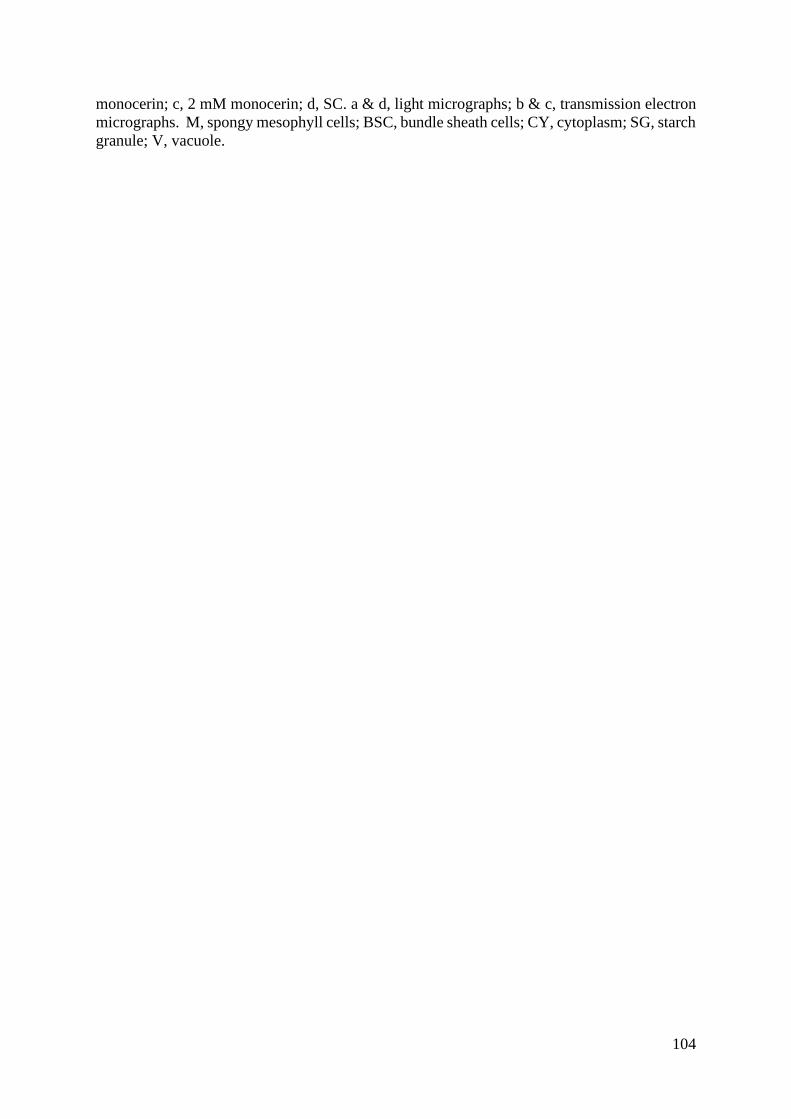
104
monocerin; c, 2 mM monocerin; d, SC. a & d, light micrographs; b & c, transmission electron
micrographs. M, spongy mesophyll cells; BSC, bundle sheath cells; CY, cytoplasm; SG, starch
granule; V, vacuole.
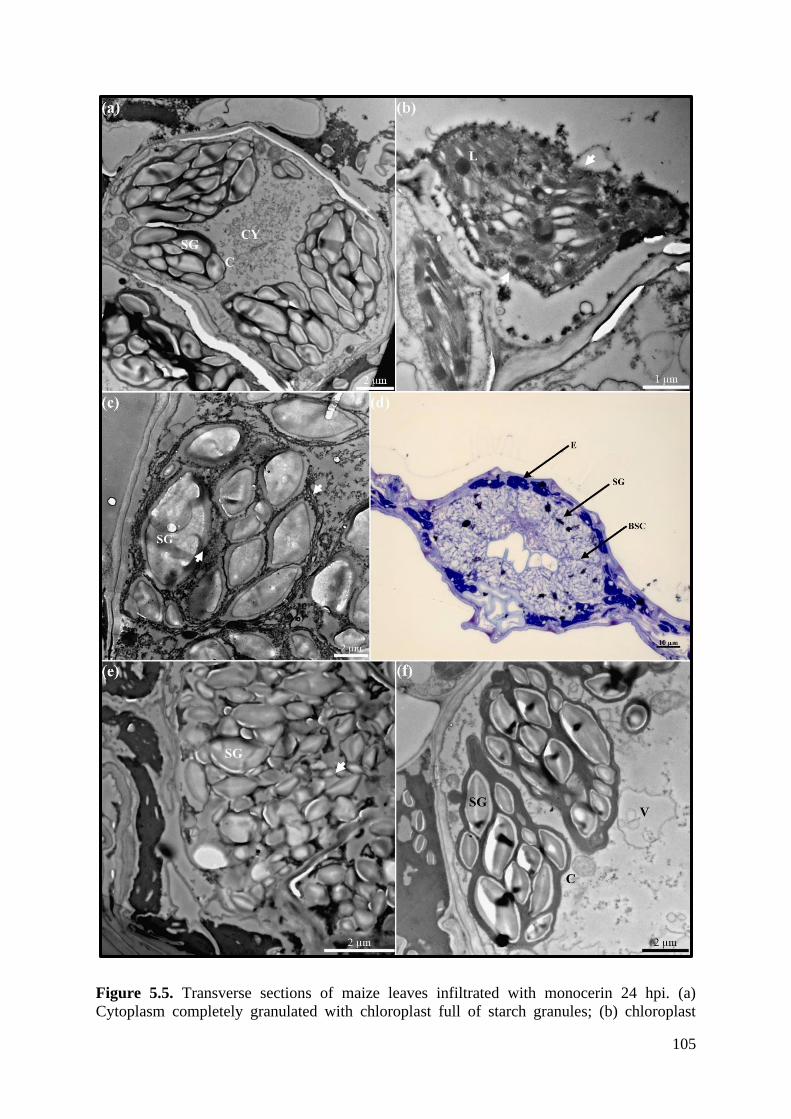
105
Figure 5.5. Transverse sections of maize leaves infiltrated with monocerin 24 hpi. (a)
Cytoplasm completely granulated with chloroplast full of starch granules; (b) chloroplast
106
double-membrane (white arrows) and the stroma disintegrating; (c) starch granules getting
bigger, and thylakoid membranes almost completely disintegrated (white arrows); (d) complete
tissue collapse, with an over-accumulation of starch granules in the bundle sheath cells; (e)
transmission electron micrograph of one of the bundle sheath cells in image d; (f) cytoplasm
becoming granulated as well as the vacuoles dissociating up into smaller vacuoles as well as in
the process of disintegrating. a–c, 1 mM monocerin; d & e, 2 mM monocerin; f, SC. d, light
micrographs; a–c, e & f, transmission electron micrographs. BSC, bundle sheath cells; C,
chloroplast; CY, cytoplasm; SG, starch granule; V, vacuole.
Figure 5.6. Transverse sections of maize leaves infiltrated with monocerin 48 hpi. (a) starch
granules increasing in size and quantity in chloroplasts with chloroplasts scattered around in
bundle sheath cell. Healthy bundle sheath and mesophyll cells also visible in the micrograph;
(b) plasma membrane separated from cell wall (white arrows) with starch granules increasing
in size; (c) chloroplast double-membrane and thylakoid membranes (red arrows) busy
disintegrating. a–c, 1 mM monocerin. a, light micrographs; b & c, transmission electron
107
micrographs. BSC, bundle sheath cells; C, chloroplast; M, spongy mesophyll cells; SG, starch
granule.
5.3.3. Expression of genes involved in starch degradation
Expression analysis of the three genes (gwd, pwd and amy3) using RT-qPCR was undertaken
to determine if E. turcicum and monocerin had an effect on the expression of these genes
involved in the breakdown of starch granules in the chloroplast. Reverse transcription-qPCR
was performed on E. turcicum infected and monocerin treated maize samples as well as
nontreated controls, and infiltration and wounding controls (Chapter 4, Section 4.2.5). Each
sample consisted of three biological replicates and each biological replicate consisted of three
technical replicates. The starch genes were normalised by dividing the expression of the starch
genes by the geomean input reference cDNA of the three reference genes (rpol, srl and gst3)
for the same sampling point. Following RT-qPCR amplification of the starch degradation and
reference genes, a melt-curve analysis was performed to confirm that a single homogenous
cDNA amplicon was amplified and that primer dimers were absent (Appendix, Figure 7.3).
Standard curves were constructed for each gene of interest as well as reference genes using
pooled cDNA of all the samples. The amplification efficiencies were calculated from the slope
of the standard curve as well as the R2 (correlation coefficient) values (Appendix, Figure 7.3
and 7.4). Amplification efficiencies of all the samples ranged between 90% to 110% and a R2
> 0.98 and adhere to MIQE guidelines (Taylor et al., 2010).
The expression values of all three starch enzyme genes were determined at each sample point
during NLB disease development (Figure 5.7). With all three starch enzymes, similar trends
were noted in that the gene expression was the highest in the control samples, then decreased
at 4 and 9 dpi and was the lowest at 14 dpi when the fungus was in its necrotrophic phase and
in the process of completing its life cycle (Figure 5.7). The expression of all three starch
degradation genes was significantly different between the control and fungal infected tissue (4,
9 and 14 dpi) except for gwd (Figure 5.7). The only significant difference seen in gwd was
between the control tissue and 14 dpi. Both sample points 4 and 9 dpi were lower than the
control but not significantly different (Figure 5.7, A). The gene expression of pwd at 4 and 9
dpi was the same between the two sample points but was lower and significantly different
compared to control samples which indicates that the fungus could have an effect on this gene
during the early stages of NLB disease progression (Figure 5.7, B). The same was seen with
amy3 except that the gene expression at 9 dpi was the same as 14 dpi (Figure 5.7, C). With all
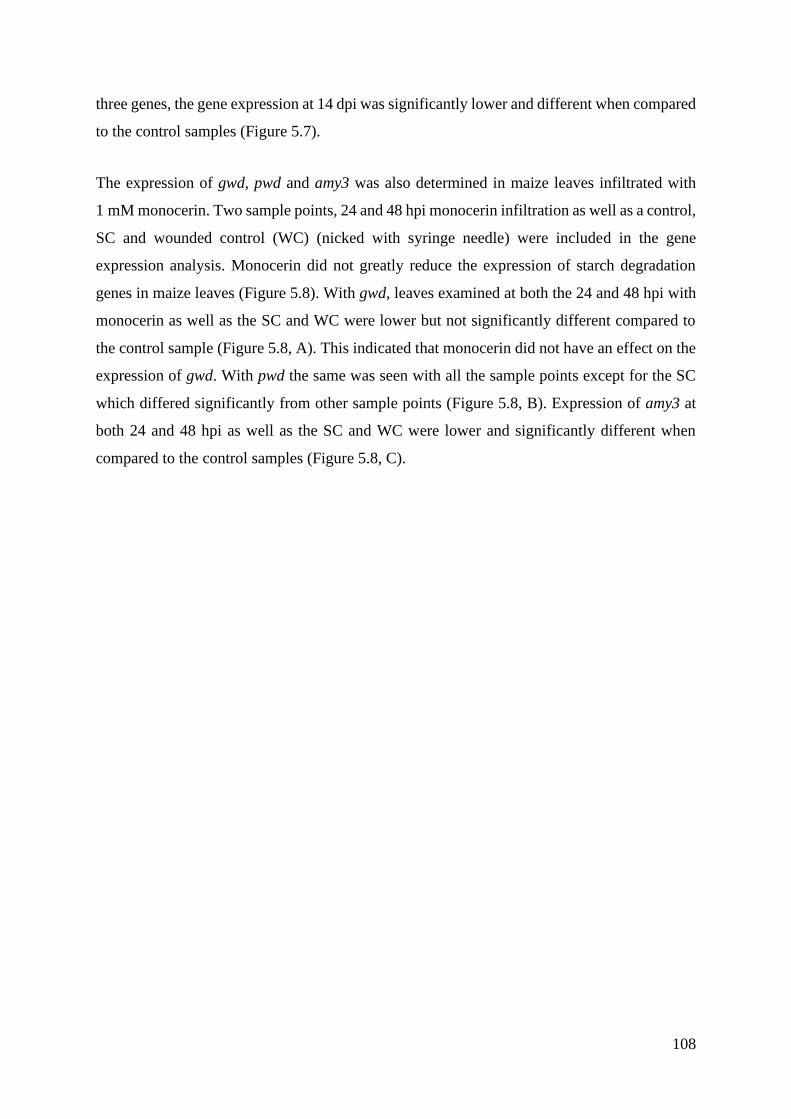
108
three genes, the gene expression at 14 dpi was significantly lower and different when compared
to the control samples (Figure 5.7).
The expression of gwd, pwd and amy3 was also determined in maize leaves infiltrated with
1 mM monocerin. Two sample points, 24 and 48 hpi monocerin infiltration as well as a control,
SC and wounded control (WC) (nicked with syringe needle) were included in the gene
expression analysis. Monocerin did not greatly reduce the expression of starch degradation
genes in maize leaves (Figure 5.8). With gwd, leaves examined at both the 24 and 48 hpi with
monocerin as well as the SC and WC were lower but not significantly different compared to
the control sample (Figure 5.8, A). This indicated that monocerin did not have an effect on the
expression of gwd. With pwd the same was seen with all the sample points except for the SC
which differed significantly from other sample points (Figure 5.8, B). Expression of amy3 at
both 24 and 48 hpi as well as the SC and WC were lower and significantly different when
compared to the control samples (Figure 5.8, C).
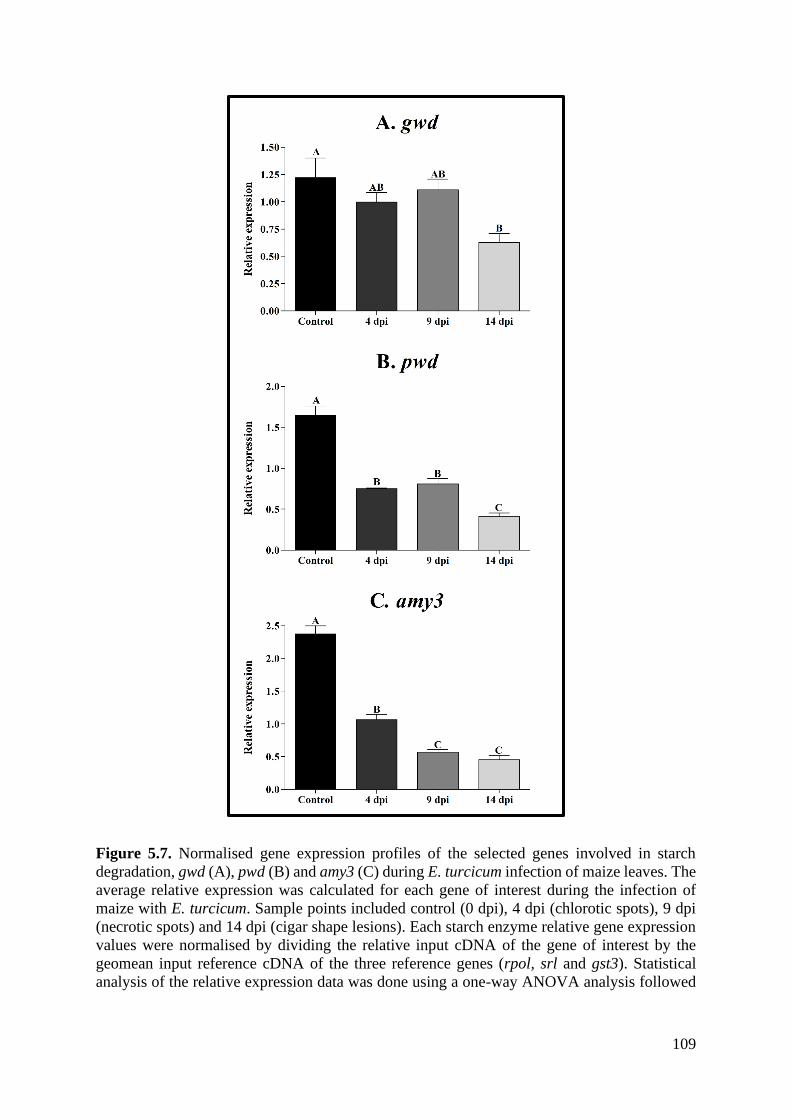
109
Figure 5.7. Normalised gene expression profiles of the selected genes involved in starch
degradation, gwd (A), pwd (B) and amy3 (C) during E. turcicum infection of maize leaves. The
average relative expression was calculated for each gene of interest during the infection of
maize with E. turcicum. Sample points included control (0 dpi), 4 dpi (chlorotic spots), 9 dpi
(necrotic spots) and 14 dpi (cigar shape lesions). Each starch enzyme relative gene expression
values were normalised by dividing the relative input cDNA of the gene of interest by the
geomean input reference cDNA of the three reference genes (rpol, srl and gst3). Statistical
analysis of the relative expression data was done using a one-way ANOVA analysis followed
110
Tukey’s Multiple Comparison Test. Sample points not designated with the same letter are
significantly different (P<0.05). Error bars indicate the standard error of mean.
Figure 5.8. Normalised gene expression profiles of the selected genes involved in starch
degradation, gwd (A), pwd (B) and amy3 (C) during monocerin infiltration of maize leaves.
The average relative expression was calculated for each gene of interest during the infiltration
of maize leaves with monocerin. Sample points consisted of a control (0 hpi), 24 hpi, 48 hpi,
solvent (SC) and wounded control (WC). Each starch enzymes relative gene expression values
were normalised by dividing the relative input cDNA of the gene of interest by the geomean
input reference cDNA of the three reference genes (rpol, srl and gst3). Statistical analysis of
111
the relative expression data was done using a one-way ANOVA analysis followed Tukey’s
Multiple Comparison Test. Sample points not designated with the same letter are significantly
different (P<0.05). Error bars indicate the standard error of mean.
5.4. Discussion
Studying the effect of monocerin on the cell ultrastructure has provided insight on where the
toxin exerts its negative effects. Additionally, the gene expression studies of starch degradation
enzymes have answered some questions with regards to the possible mode of action of the
toxin. Previous studies only reported on the morphological or growth effects of monocerin in
maize and other crops but not on the cell ultrastructure (Aldridge & Turner, 1970; Robeson &
Strobel, 1982; Cuq et al., 1993; Lim, 1999). Gélie et al. (1987) reported on the toxic effect of
the fungus on the maize leaf cell ultrastructure but not by the toxin. To the best of the
researcher’s knowledge this is the first report on the effect of monocerin on the cell
ultrastructure of maize as well as the effect of the fungus and the toxin on the gene expression
of enzymes involved in the degradation of starch.
Small whitish necrotic lesions were observed, where the leaf was infiltrated with monocerin
after 24 hpi, and the lesions were enlarged slightly after 48 hpi. This concurs with the findings
by Cuq et al. (1993), who also observed whitish necrotic lesions when the authors treated maize
leaves with different concentrations of monocerin. The same was noted by Robeson and Strobel
(1982) when creeping thistle was treated with 1 mM monocerin. Additionally, Robeson and
Strobel (1982) reported that the phytotoxic effect of monocerin on maize leaves plateaued at
concentration of 1 mM monocerin. Although necrosis did occur in the SC as a result of the
40% methanol application, it differed from the monocerin damaged tissue in several ways. The
necrotic tissue surrounding the location where the leaf was nicked was smaller when compared
to the monocerin treated tissue and the solvent took longer to induce an effect, morphologically
and on an ultrastructure level. This indicated 40% methanol could have a minor toxic effect on
the cells in the leaves. This was in contrast to what Cuq et al. (1993) reported as they did not
observe any damage in their SC which was also 40% methanol.
On an ultrastructural level, differences were seen between the control and monocerin treated
tissue especially at the later sample points. Control tissue revealed neat and intact cells with
clearly defined organelles. Numerous vacuoles as well as chloroplasts with starch granules
could be seen. The formation and accumulation of starch granules in the chloroplast together
112
with sucrose are two end product of carbon assimilation. At the onset of darkness, assimilation
of carbon stops, but the degradation of starch granules to maintain the exportation of sucrose
out of the chloroplast (Taiz & Zeiger, 2006).
At the earlier sample points, the cytoplasm, vacuole and chloroplast were the most affected by
monocerin. Large quantities of granular electron-dense intercellular material were seen in the
transmission electron micrographs indicating that the toxin had an effect on the cytoplasm. The
vacuoles also started to dissociate into smaller irregular shaped size, which was probably the
reason why the chloroplasts were scattered in the cell. In addition, the stroma of the chloroplasts
became granulated and the thylakoid membranes were disrupted indicating that the toxin had
an effect on the chloroplast. Granulation of the stroma was observed in bean (Phaseolus
vulgaris L.) leaves treated with systemic fungicide benomyl (Rufner et al., 1975). Abbas et al.
(1992) also indicated that the primary site of action of fumonisin B1 (FB1) in jimsonweed leaves
was either the plasma membrane or the tonoplast (membrane surrounding vacuole) followed
by disruption of the chloroplast and accumulation of intercellular debris. The swelling of the
chloroplast, disruption of the chloroplast double-membrane and subsequent disintegration of
the thylakoid membranes could be in response to the stroma of the chloroplast becoming
hypertonic due to a mixed combination of cytoplasmic and vacuole contents in the cell (Abbas
et al., 1992). Abbas et al. (1992) noted that loss of cell wall turgor could be due to the mixed
contents of the cytoplasm and vacuole. In this study, the disruption of the chloroplast could
have been a direct and/or indirect effect of the toxin since damage was seen early on to both
the chloroplast stroma, double membrane and thylakoid membranes as well as the cytoplasm.
Damage to the rest of the cellular organelles could have been secondary effect since the
cytoplasm was affected as well.
At the later sample points, the more severely affected cells that showed the most degenerative
damage were usually in close proximity to where the leaf was infiltrated with monocerin and
less damaged cells closer to the edge of the lesion. As time progressed the cytoplasm
disintegrated, the spongy mesophyll cells and epidermal cells had collapsed with only the
remnants left and the chloroplast double-membrane being in the process of disintegrating. It
was only at 48 hpi that the plasma membrane contracted from the cell wall. In spite of the
difficulty of infiltrating maize leaves with 2 mM monocerin and the lack of lesions forming,
damage to the ultrastructure of maize cells was, nevertheless still seen. Both concentrations of
monocerin had similar effects with the only exceptions being that phytotoxic effects of 2 mM
113
monocerin were seen earlier than 1 mM (e.g. the effects seen at 6 hpi for 2 mM were only seen
at 12 hpi for 1 mM monocerin)). As a result of the complete tissue collapse observed after 24
hpi with 2 mM monocerin, it was not further analysed at 48 hpi. Complete tissue collapse would
probably have been seen if 1 mM monocerin was analysed at a later time point such as 72 hpi.
Similar observations were seen on the ultrastructural level by Steinkamp et al. (1979) when the
authors treated beetroot (Beta vulgaris L.) leaves with cercosporin isolated from Cercospora
beticola. The observations seen included granulation of the cytoplasm, loss of integrity of cell
membranes especially the chloroplast double-membrane and tonoplast and necrotic cells that
had collapsed. In addition to these effects the authors also observed starch granules and
remnants of the chloroplast membranes in the necrotic cytoplasm (Steinkamp et al., 1979).
Steinkamp et al. (1979) also indicated that some of these effects were similar to the
ultrastructural changes caused by C. beticola.
The accumulation of starch granules increased as the time progressed in both monocerin
treatments. This could partially be due to sugars not being formed and translocated out of the
chloroplast as a result of cells dying, and thus resulting in the overaccumulation of starch
granules (Abbas et al., 1992). Alternatively, monocerin could have an effect on the starch genes
involved in breaking down starch granules (Smith et al., 2005; Taiz & Zeiger, 2006). In the
current study the chloroplasts were more resilient than the other organelles since they were still
recognisable even at the later sample points post treatment at both concentrations of monocerin.
Similar results were observed when jimsonweed leaves were treated with FB1 (Abbas et al.,
1992). This could be due to the fact that chloroplasts are more protected from oxidative
membrane damage compared to other organelles (Halliwell, 1978; Salin, 1988).
When a comparison is made between the phytotoxic effects of monocerin observed in this
chapter and the infection of E. turcicum in maize (Chapter 3), the only similarities noted
between the toxin and fungus treatments included the shrinking and collapsing of the spongy
mesophyll cells and accumulation of abundant starch granules in the bundle sheath cells, which
ultimately lead to complete tissue collapse. It thus could be that the toxin aids the fungus in
causing disease or helps the fungus in establishing itself during its biotrophic phase. . The toxic
effects of monocerin were very similar to the toxic effects that E. turcicum had on the cell
ultrastructure of maize leaves as reported by Gélie et al. (1987), who noted that the tonoplast
was the first cellular component altered in response to the toxic effect of the fungus towards
the leaf cells. This was followed by disorganisation and alteration of organelles which became
114
scattered throughout the cell. Additionally, they reported that the chloroplast was the most
sensitive to the toxic action of the fungus which resulted in disruption of double-membrane as
well as the grana (Gélie et al., 1987). Monocerin could partially be responsible in aiding the
fungus in establishing itself in maize leaves, but this needs to be supported by additional studies
especially involving additional ultrastructure and molecular studies with a monocerin deficient
mutant of E. turcicum.
The SC initially did not have any effect on cell ultrastructure (Figure 5.3). It is likely that 40%
methanol is toxic to maize tissue, but its effects are delayed when compared to monocerin. Due
to the toxic effect of 40% methanol another less toxic solvent should be used in further
investigations. The challenge with monocerin is that it more readily dissolves in a non-polar
solvent. Acetone has been used as a solvent in testing the effect of nonylphenol (endocrine
disruptor) on ryegrass, where its effect was no different to the control (Domene et al., 2009).
The use of acetone as a solvent, should be considered in future monocerin studies.
Following the microscopic evaluation of the phytotoxic effect of monocerin on maize leaf cells,
it was decided to investigate the effect of the toxin on the expression of genes involved in the
degradation of starch granules in the chloroplast. This was based on the accumulation of starch
granules observed in monocerin infiltrated tissue. Starch is an important storage carbohydrate
that is synthesised in the day during photosynthesis and then remobilised (in the form of sugars)
during the night when carbon derived from photosynthesis is unavailable (Silver et al., 2014).
Reverse transcription-qPCR (RT-qPCR) suggested that the expression of amy3 was reduced
by both E. turcicum and monocerin whereas pwd was only reduced by the fugus. The fungus
and toxin did not have an effect on the expression of gwd. Both gwd and pwd play in important
role in starch degradation because the semi-crystalline starch granules need to be
phosphorylated for downstream reactions (Smith et al., 2005; Silver et al., 2014). The precise
function of amy3 is still uncertain but it is believed that amy3 is involved in hydrolysing the
internal ɑ-1,4 linkages of linear or branch glucans to release a mixture of linear and branched
malto-oligosaccharide (Smith et al., 2005).
Fan et al. (2010) reported that starch levels increased in leaves of sweet orange (Citrus x
sinensis (L.) Osbeck) infected with the bacterial pathogen Candidatus liberibacter, which is
the causal agent for citrus Huanglongbing (HLB). The authors indicated that the gene
expression of the starch degradation enzymes transglucosidase (dpe2) and maltose exporter
115
(mex1) was inhibited in response to the pathogen whereas gwd was not (Fan et al., 2010). The
same was observed in the current study where gwd was not inhibited by both E. turcicum and
monocerin. Both dpe2 and mex1 are involved in starch degradation with dpe2 acting as a
transglucosidase by catalysing the release of one glucosyl moiety of maltose and the transfer
of another to a glucose acceptor, whereas mex1 transfers maltose across the chloroplast double-
membrane (Smith et al., 2005; Fan et al., 2010). Both maltose and glucose can be exported out
of the chloroplast into the cytoplasm at night which increases at the onset of starch degradation
but maltose is exported at a higher rate than glucose (Zeeman et al., 2007; Fan et al., 2010).
The activity of invertase, which is responsible for hydrolysis of sucrose into fructose and
glucose, was also induced in infected leaves (Fan et al., 2010). The decrease in expression
levels of dpe2 and mex1 resulted in decreased maltose levels and increased sucrose and glucose
levels. This resulted in an imbalance of carbohydrate partitioning and thus slowed starch
degradation down (Fan et al., 2010).
Similar observations were observed by Gamm et al. (2011) who studied the changes in
carbohydrate metabolism in grapevine (Vitis vinifera L.) leaves in response to the oomycte
Plasmopara viticola which causes downy mildew. Microarray analysis revealed the gene
expression of ɑ-amylase was induced at very high levels whereas β-amylase and pwd were not
induced (Gamm et al., 2011). The activity of ɑ-amylase was the highest at 7 dpi when lesions
were visible on the leaves. This is contrast with what was observed in this study where pwd
and amy3 expression was inhibited by E. turcicum. Additionally, Gamm et al. (2011) reported
that invertase activity was induced and that there was an increase in fructose and glucose levels
at the later stages of infection just before sporulation. The increase in sugars especially fructose
could thus serve as nutrients for the pathogen (Fan et al., 2010; Gamm et al., 2011).
It seems that the effect that fungal pathogens have on starch degradation in the chloroplast is
not at the initial starch degradation reactions catalysed by gwd and pwd but rather downstream.
It could thus be possible that E. turcicum prefers fructose as nutrient source as opposed to
maltose and glucose. Exserohilum turcicum could potentially induce the gene expression of
invertase and inhibit dpe2 and mex1 related enzymes in maize, which would result in an
increase in fructose. Furthermore, monocerin could possibly also have an effect on enzymes
such as dpe2 and mex1 which could result in an increase in fructose as well as an accumulation
of starch granules. The increase in fructose aids the fungus since fructose can potentially be a
source of carbon for the fungus.
116
5.5. Conclusion
In this chapter a microscopic study revealed that monocerin exerted a phytotoxic effect on the
chloroplast, in particular, but as well as on the cytoplasm and vacuole. Due to the accumulation
of starch granules noted in treated cells, expression analysis was performed on three genes
coding for enzymes involved in the degradation of these starch granules in the chloroplast of
maize leaves. This provided insight on how the fungus could potentially acquire nutrients as
well as how monocerin aids the fungus in the infection process. Aspects that should be
considered in future studies include conducting an ultrastructure study (with the aid of TEM)
of the fungus in the early stages of infection and comparing it to the monocerin to determine if
similar effects are seen since monocerin could be a necrotrophic effector. Additionally, the
effect of E. turcicum and monocerin on the expression of other starch degradation enzymes
genes should be investigated
5.6. References
Abbas HK, Boyette C, 1992. Phytotoxicity of fumonisin B1 on weed and crop species. Weed
Technology, 548-52.
Abbas HK, Duke SO, Paul RN, Riley RT, Tanaka T, 1995. AAL‐toxin, a potent natural
herbicide which disrupts sphingolipid metabolism of plants. Pesticide science 43, 181-7.
Abbas HK, Paul RN, Boyette CD, Duke SO, Vesonder RF, 1992. Physiological and
ultrastructural effects of fumonisin on jimsonweed leaves. Canadian Journal of Botany 70,
1824-33.
Aldridge DC, Turner WB, 1970. Metabolites of Helminthosporium monoceras: Structures of
monocerin and related benzopyrans. Journal of the Chemical Society C: Organic 18, 2598-
600.
Bennett JW, Klich M, 2003. Mycotoxins. Clinical Microbiology Reviews 16, 497-516.
Collemare J, Lebrun MH, 2011. Fungal secondary metabolites: ancient toxins and novel
effectors in plant–microbe interactions. In: Martin F, Kamoun S, eds. In effectors in plant–
microbe interactions. Oxford, UK: Wiley-Blackwell, 377-400.
Craven M, Fourie AP, 2011. Field evaluation of maize inbred lines for resistance to
Exserohilum turcicum. South African Journal of Plant and Soil 28, 69-74.
117
Cuq F, Brown SC, Petitprez M, Alibert G, 1995. Effects of monocerin on cell-cycle progression
in maize root-meristems synchronized with aphidicolin. Plant Cell Reports 15, 138-42.
Cuq F, Petitprez M, Herrmann-Gorline S, Klaebe A, Rossignol M, 1993. Monocerin in
Exserohilum turcicum isolates from maize and a study of its phytotoxicity. Phytochemistry 34,
1265-70.
Cutler HG, Jarvis BB, 1985. Preliminary observations on the effects of macrocyclic
trichothecenes on plant growth. Environmental and Experimental Botany 25, 115-28.
Domene X, Ramírez W, Solà L, Alcañiz JM, Andrés P, 2009. Soil pollution by nonylphenol
and nonylphenol ethoxylates and their effects to plants and invertebrates. Journal of Soils and
Sediments 9, 555.
Fan J, Chen C, Brlansky RH, Gmitter Jr FG, Li ZG, 2010. Changes in carbohydrate metabolism
in Citrus sinensis infected with ‘Candidatus Liberibacter asiaticus’. Plant Pathology 59, 1037-
43.
Gamm M, Heloir MC, Bligny R, et al., 2011. Changes in carbohydrate metabolism in
Plasmopara viticola-infected grapevine leaves. Molecular Plant-Microbe Interactions 24,
1061-73.
Gélie B, Petitprez M, Souvre A, Albertini L, 1987. Étude ultrastructurale des modifications
induites par Exserohilum turcicum chez le limbe de Zea mays– Effet du gène de résistance Ht-
1. Canadian Journal of Botany 65, 2061-6.
Haasbroek MP, Craven M, Barnes I, Crampton BG, 2014. Microsatellite and mating type
primers for the maize and sorghum pathogen, Exserohilum turcicum. Australasian Plant
Pathology 43, 577-81.
Halliwell B, 1978. Biochemical mechanisms accounting for the toxic action of oxygen on
living organisms: The key role of superoxide dismutase. Cell Biology International Reports 2,
113-28.
Korsman J, Meisel B, Kloppers FJ, Crampton BG, Berger DK, 2011. Quantitative phenotyping
of grey leaf spot disease in maize using real-time PCR. European Journal of Plant Pathology
133, 461-71.
Kotze RG, Crampton BG, Kritzinger Q, 2016. Effect of fumonisin B1 on the emergence, growth
and ceramide synthase gene expression of cowpea (Vigna unguiculata (L.) Walp). European
Journal of Plant Pathology 148, 295-306.
118
Lim C-H, 1999. Monocerin and ziganein: phytotoxins from pathogenic fungus Exserohilum
turcicum Inu-1. Agricultural Chemistry and Biotechnology 42, 45-7.
Mobius N, Hertweck C, 2009. Fungal phytotoxins as mediators of virulence. Current Opinion
in Plant Biology 12, 390-8.
Robeson DJ, Strobel GA, 1982. Monocerin, a phytotoxin from Exserohilum turcicum (=
Drechslera turcica). Agricultural and Biological Chemistry 46, 2681-3.
Rufner R, Witham F, Cole Jr H, 1975. Ultrastructure of chloroplasts of Phaseolus vulgaris
leaves treated with benomyl and ozone. Phytopathology 65, 345-9.
Salin ML, 1988. Toxic oxygen species and protective systems of the chloroplast. Physiologia
Plantarum 72, 681-9.
Scheffer RP, Livingston RS, 1984. Host-selective toxins and their role in plant diseases.
Science 223, 17-21.
Silver DM, Kotting O, Moorhead GB, 2014. Phosphoglucan phosphatase function sheds light
on starch degradation. Trends in Plant Science 19, 471-8.
Smith AM, Zeeman SC, Smith SM, 2005. Starch degradation. Annual Review of Plant Biology
56, 73-98.
Steinkamp MP, Martin SS, Hoefert LL, Ruppel EG, 1979. Ultrastructure of lesions produced
by Cercospora beticola in leaves of Beta vulgaris. Physiological Plant Pathology 15, 13-26.
Stergiopoulos I, Collemare J, Mehrabi R, De Wit PJ, 2013. Phytotoxic secondary metabolites
and peptides produced by plant pathogenic Dothideomycete fungi. FEMS Microbiology
Reviews 37, 67-93.
Taiz L, Zeiger E, 2006. Plant Physiology. Sunderland, MA, USA: Sinauer Associates.
Taylor S, Wakem M, Dijkman G, Alsarraj M, Nguyen M, 2010. A practical approach to RT-
qPCR-Publishing data that conform to the MIQE guidelines. Methods 50, S1-5.
Van Asch MAJ, 1990. Studies on the resistance of wheat and maize to fungal patogenesis.
Pietermaritzburg, University of Natal, PhD thesis.
Zeeman SC, Kossmann J, Smith AM, 2010. Starch: its metabolism, evolution, and
biotechnological modification in plants. Annual Review of Plant Biology 61, 209-34.
119
Zeeman SC, Smith SM, Smith AM, 2007. The diurnal metabolism of leaf starch. Biochemical
Journal 401, 13-28.

120
Chapter 6: General discussion
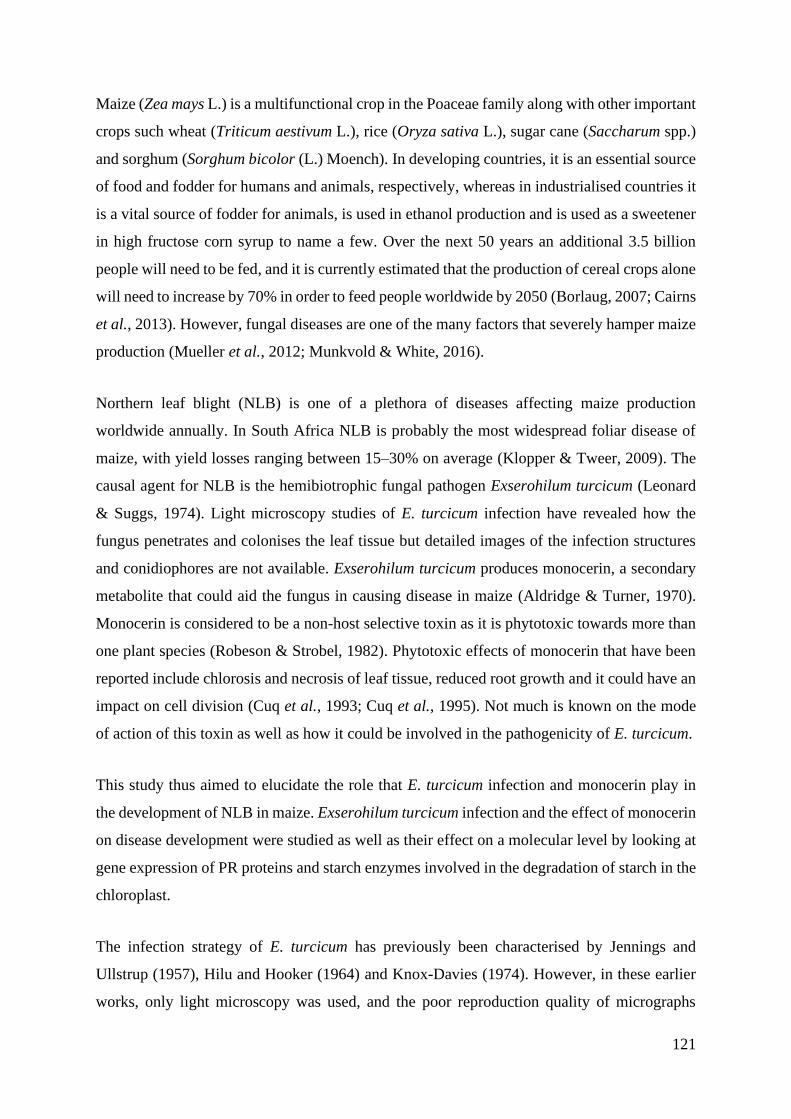
121
Maize (Zea mays L.) is a multifunctional crop in the Poaceae family along with other important
crops such wheat (Triticum aestivum L.), rice (Oryza sativa L.), sugar cane (Saccharum spp.)
and sorghum (Sorghum bicolor (L.) Moench). In developing countries, it is an essential source
of food and fodder for humans and animals, respectively, whereas in industrialised countries it
is a vital source of fodder for animals, is used in ethanol production and is used as a sweetener
in high fructose corn syrup to name a few. Over the next 50 years an additional 3.5 billion
people will need to be fed, and it is currently estimated that the production of cereal crops alone
will need to increase by 70% in order to feed people worldwide by 2050 (Borlaug, 2007; Cairns
et al., 2013). However, fungal diseases are one of the many factors that severely hamper maize
production (Mueller et al., 2012; Munkvold & White, 2016).
Northern leaf blight (NLB) is one of a plethora of diseases affecting maize production
worldwide annually. In South Africa NLB is probably the most widespread foliar disease of
maize, with yield losses ranging between 15–30% on average (Klopper & Tweer, 2009). The
causal agent for NLB is the hemibiotrophic fungal pathogen Exserohilum turcicum (Leonard
& Suggs, 1974). Light microscopy studies of E. turcicum infection have revealed how the
fungus penetrates and colonises the leaf tissue but detailed images of the infection structures
and conidiophores are not available. Exserohilum turcicum produces monocerin, a secondary
metabolite that could aid the fungus in causing disease in maize (Aldridge & Turner, 1970).
Monocerin is considered to be a non-host selective toxin as it is phytotoxic towards more than
one plant species (Robeson & Strobel, 1982). Phytotoxic effects of monocerin that have been
reported include chlorosis and necrosis of leaf tissue, reduced root growth and it could have an
impact on cell division (Cuq et al., 1993; Cuq et al., 1995). Not much is known on the mode
of action of this toxin as well as how it could be involved in the pathogenicity of E. turcicum.
This study thus aimed to elucidate the role that E. turcicum infection and monocerin play in
the development of NLB in maize. Exserohilum turcicum infection and the effect of monocerin
on disease development were studied as well as their effect on a molecular level by looking at
gene expression of PR proteins and starch enzymes involved in the degradation of starch in the
chloroplast.
The infection strategy of E. turcicum has previously been characterised by Jennings and
Ullstrup (1957), Hilu and Hooker (1964) and Knox-Davies (1974). However, in these earlier
works, only light microscopy was used, and the poor reproduction quality of micrographs
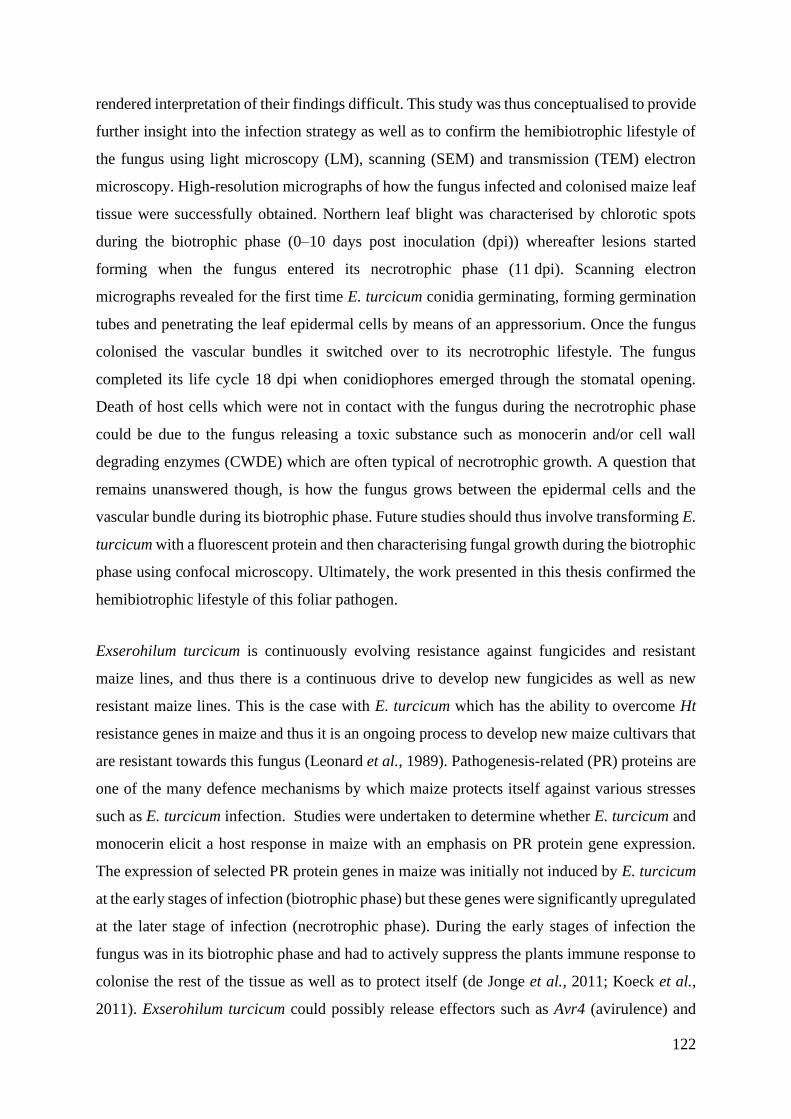
122
rendered interpretation of their findings difficult. This study was thus conceptualised to provide
further insight into the infection strategy as well as to confirm the hemibiotrophic lifestyle of
the fungus using light microscopy (LM), scanning (SEM) and transmission (TEM) electron
microscopy. High-resolution micrographs of how the fungus infected and colonised maize leaf
tissue were successfully obtained. Northern leaf blight was characterised by chlorotic spots
during the biotrophic phase (0–10 days post inoculation (dpi)) whereafter lesions started
forming when the fungus entered its necrotrophic phase (11 dpi). Scanning electron
micrographs revealed for the first time E. turcicum conidia germinating, forming germination
tubes and penetrating the leaf epidermal cells by means of an appressorium. Once the fungus
colonised the vascular bundles it switched over to its necrotrophic lifestyle. The fungus
completed its life cycle 18 dpi when conidiophores emerged through the stomatal opening.
Death of host cells which were not in contact with the fungus during the necrotrophic phase
could be due to the fungus releasing a toxic substance such as monocerin and/or cell wall
degrading enzymes (CWDE) which are often typical of necrotrophic growth. A question that
remains unanswered though, is how the fungus grows between the epidermal cells and the
vascular bundle during its biotrophic phase. Future studies should thus involve transforming E.
turcicum with a fluorescent protein and then characterising fungal growth during the biotrophic
phase using confocal microscopy. Ultimately, the work presented in this thesis confirmed the
hemibiotrophic lifestyle of this foliar pathogen.
Exserohilum turcicum is continuously evolving resistance against fungicides and resistant
maize lines, and thus there is a continuous drive to develop new fungicides as well as new
resistant maize lines. This is the case with E. turcicum which has the ability to overcome Ht
resistance genes in maize and thus it is an ongoing process to develop new maize cultivars that
are resistant towards this fungus (Leonard et al., 1989). Pathogenesis-related (PR) proteins are
one of the many defence mechanisms by which maize protects itself against various stresses
such as E. turcicum infection. Studies were undertaken to determine whether E. turcicum and
monocerin elicit a host response in maize with an emphasis on PR protein gene expression.
The expression of selected PR protein genes in maize was initially not induced by E. turcicum
at the early stages of infection (biotrophic phase) but these genes were significantly upregulated
at the later stage of infection (necrotrophic phase). During the early stages of infection the
fungus was in its biotrophic phase and had to actively suppress the plants immune response to
colonise the rest of the tissue as well as to protect itself (de Jonge et al., 2011; Koeck et al.,
2011). Exserohilum turcicum could possibly release effectors such as Avr4 (avirulence) and
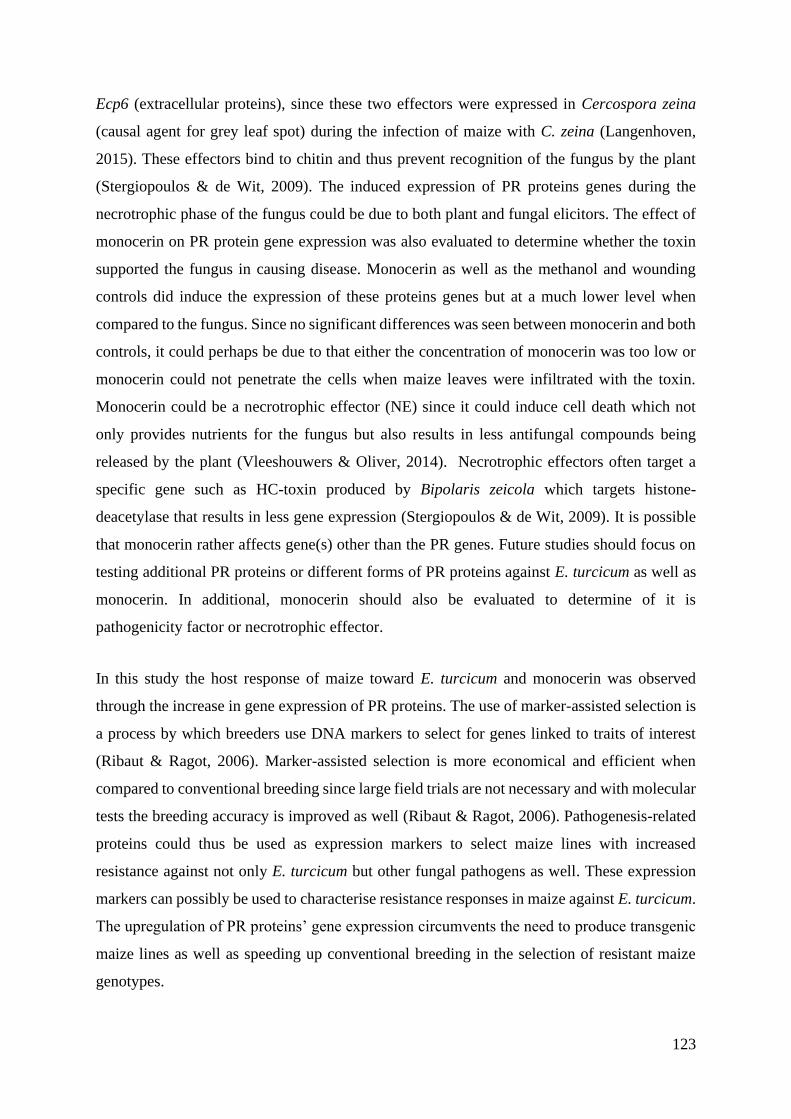
123
Ecp6 (extracellular proteins), since these two effectors were expressed in Cercospora zeina
(causal agent for grey leaf spot) during the infection of maize with C. zeina (Langenhoven,
2015). These effectors bind to chitin and thus prevent recognition of the fungus by the plant
(Stergiopoulos & de Wit, 2009). The induced expression of PR proteins genes during the
necrotrophic phase of the fungus could be due to both plant and fungal elicitors. The effect of
monocerin on PR protein gene expression was also evaluated to determine whether the toxin
supported the fungus in causing disease. Monocerin as well as the methanol and wounding
controls did induce the expression of these proteins genes but at a much lower level when
compared to the fungus. Since no significant differences was seen between monocerin and both
controls, it could perhaps be due to that either the concentration of monocerin was too low or
monocerin could not penetrate the cells when maize leaves were infiltrated with the toxin.
Monocerin could be a necrotrophic effector (NE) since it could induce cell death which not
only provides nutrients for the fungus but also results in less antifungal compounds being
released by the plant (Vleeshouwers & Oliver, 2014). Necrotrophic effectors often target a
specific gene such as HC-toxin produced by Bipolaris zeicola which targets histone-
deacetylase that results in less gene expression (Stergiopoulos & de Wit, 2009). It is possible
that monocerin rather affects gene(s) other than the PR genes. Future studies should focus on
testing additional PR proteins or different forms of PR proteins against E. turcicum as well as
monocerin. In additional, monocerin should also be evaluated to determine of it is
pathogenicity factor or necrotrophic effector.
In this study the host response of maize toward E. turcicum and monocerin was observed
through the increase in gene expression of PR proteins. The use of marker-assisted selection is
a process by which breeders use DNA markers to select for genes linked to traits of interest
(Ribaut & Ragot, 2006). Marker-assisted selection is more economical and efficient when
compared to conventional breeding since large field trials are not necessary and with molecular
tests the breeding accuracy is improved as well (Ribaut & Ragot, 2006). Pathogenesis-related
proteins could thus be used as expression markers to select maize lines with increased
resistance against not only E. turcicum but other fungal pathogens as well. These expression
markers can possibly be used to characterise resistance responses in maize against E. turcicum.
The upregulation of PR proteins’ gene expression circumvents the need to produce transgenic
maize lines as well as speeding up conventional breeding in the selection of resistant maize
genotypes.
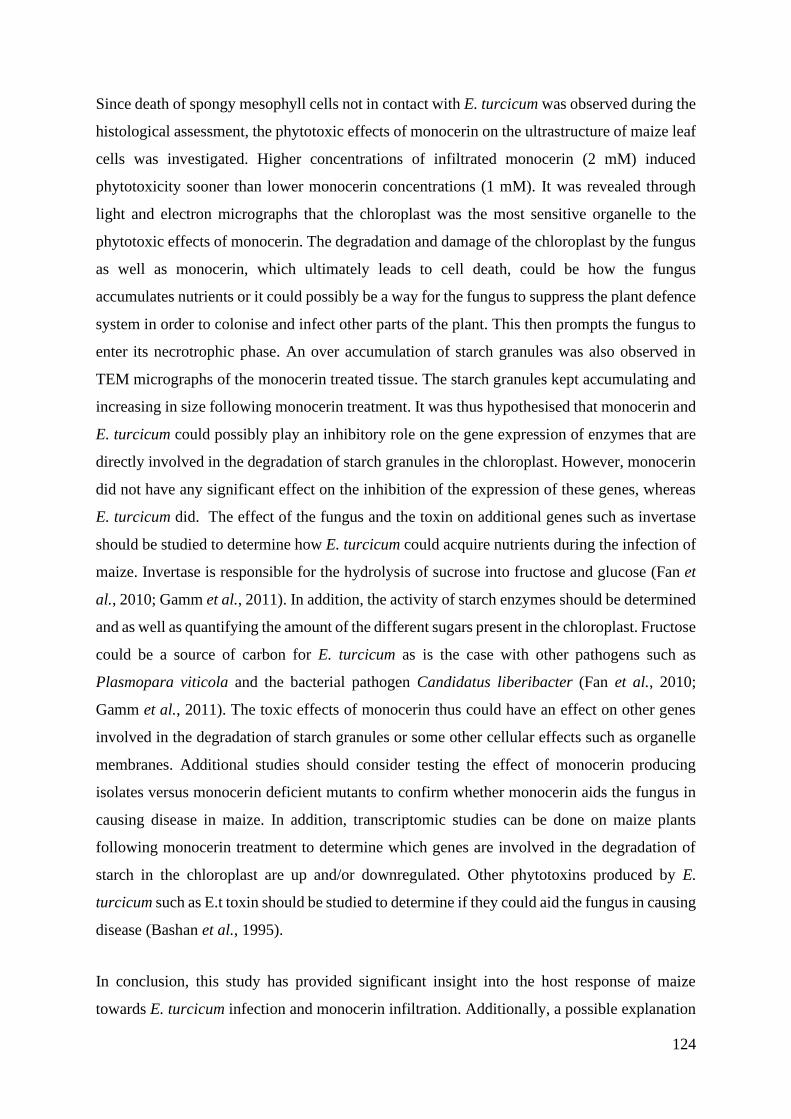
124
Since death of spongy mesophyll cells not in contact with E. turcicum was observed during the
histological assessment, the phytotoxic effects of monocerin on the ultrastructure of maize leaf
cells was investigated. Higher concentrations of infiltrated monocerin (2 mM) induced
phytotoxicity sooner than lower monocerin concentrations (1 mM). It was revealed through
light and electron micrographs that the chloroplast was the most sensitive organelle to the
phytotoxic effects of monocerin. The degradation and damage of the chloroplast by the fungus
as well as monocerin, which ultimately leads to cell death, could be how the fungus
accumulates nutrients or it could possibly be a way for the fungus to suppress the plant defence
system in order to colonise and infect other parts of the plant. This then prompts the fungus to
enter its necrotrophic phase. An over accumulation of starch granules was also observed in
TEM micrographs of the monocerin treated tissue. The starch granules kept accumulating and
increasing in size following monocerin treatment. It was thus hypothesised that monocerin and
E. turcicum could possibly play an inhibitory role on the gene expression of enzymes that are
directly involved in the degradation of starch granules in the chloroplast. However, monocerin
did not have any significant effect on the inhibition of the expression of these genes, whereas
E. turcicum did. The effect of the fungus and the toxin on additional genes such as invertase
should be studied to determine how E. turcicum could acquire nutrients during the infection of
maize. Invertase is responsible for the hydrolysis of sucrose into fructose and glucose (Fan et
al., 2010; Gamm et al., 2011). In addition, the activity of starch enzymes should be determined
and as well as quantifying the amount of the different sugars present in the chloroplast. Fructose
could be a source of carbon for E. turcicum as is the case with other pathogens such as
Plasmopara viticola and the bacterial pathogen Candidatus liberibacter (Fan et al., 2010;
Gamm et al., 2011). The toxic effects of monocerin thus could have an effect on other genes
involved in the degradation of starch granules or some other cellular effects such as organelle
membranes. Additional studies should consider testing the effect of monocerin producing
isolates versus monocerin deficient mutants to confirm whether monocerin aids the fungus in
causing disease in maize. In addition, transcriptomic studies can be done on maize plants
following monocerin treatment to determine which genes are involved in the degradation of
starch in the chloroplast are up and/or downregulated. Other phytotoxins produced by E.
turcicum such as E.t toxin should be studied to determine if they could aid the fungus in causing
disease (Bashan et al., 1995).
In conclusion, this study has provided significant insight into the host response of maize
towards E. turcicum infection and monocerin infiltration. Additionally, a possible explanation
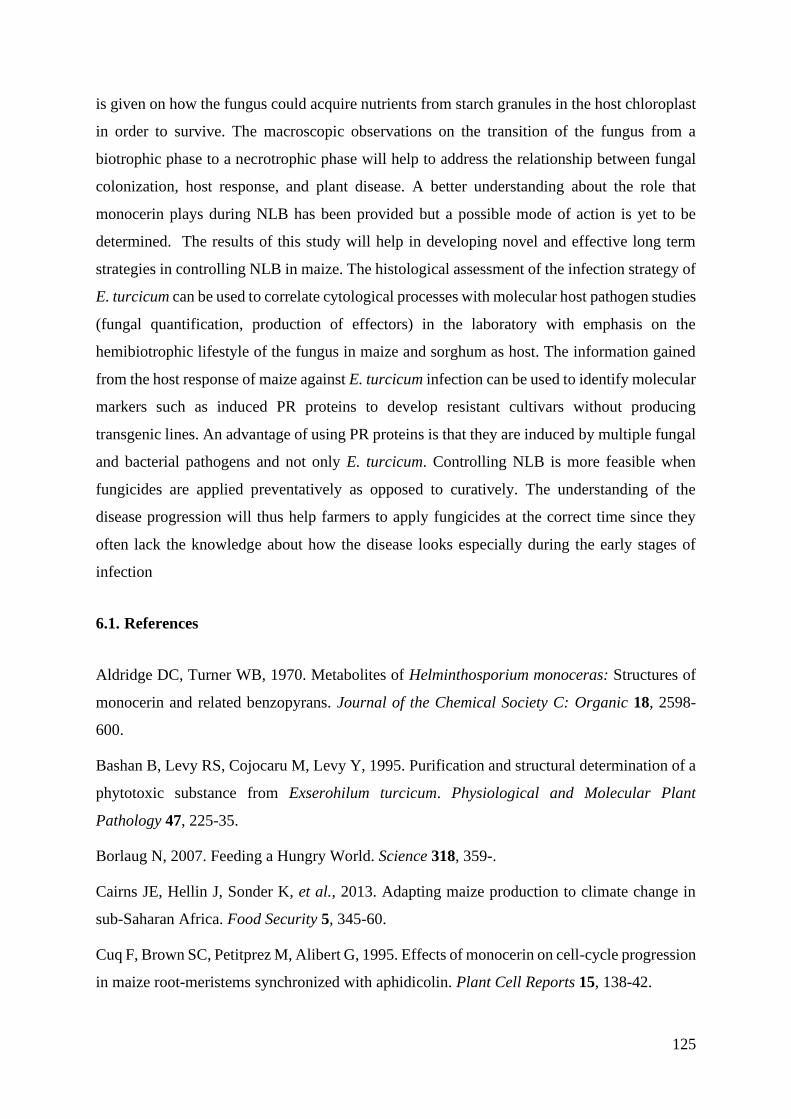
125
is given on how the fungus could acquire nutrients from starch granules in the host chloroplast
in order to survive. The macroscopic observations on the transition of the fungus from a
biotrophic phase to a necrotrophic phase will help to address the relationship between fungal
colonization, host response, and plant disease. A better understanding about the role that
monocerin plays during NLB has been provided but a possible mode of action is yet to be
determined. The results of this study will help in developing novel and effective long term
strategies in controlling NLB in maize. The histological assessment of the infection strategy of
E. turcicum can be used to correlate cytological processes with molecular host pathogen studies
(fungal quantification, production of effectors) in the laboratory with emphasis on the
hemibiotrophic lifestyle of the fungus in maize and sorghum as host. The information gained
from the host response of maize against E. turcicum infection can be used to identify molecular
markers such as induced PR proteins to develop resistant cultivars without producing
transgenic lines. An advantage of using PR proteins is that they are induced by multiple fungal
and bacterial pathogens and not only E. turcicum. Controlling NLB is more feasible when
fungicides are applied preventatively as opposed to curatively. The understanding of the
disease progression will thus help farmers to apply fungicides at the correct time since they
often lack the knowledge about how the disease looks especially during the early stages of
infection
6.1. References
Aldridge DC, Turner WB, 1970. Metabolites of Helminthosporium monoceras: Structures of
monocerin and related benzopyrans. Journal of the Chemical Society C: Organic 18, 2598-
600.
Bashan B, Levy RS, Cojocaru M, Levy Y, 1995. Purification and structural determination of a
phytotoxic substance from Exserohilum turcicum. Physiological and Molecular Plant
Pathology 47, 225-35.
Borlaug N, 2007. Feeding a Hungry World. Science 318, 359-.
Cairns JE, Hellin J, Sonder K, et al., 2013. Adapting maize production to climate change in
sub-Saharan Africa. Food Security 5, 345-60.
Cuq F, Brown SC, Petitprez M, Alibert G, 1995. Effects of monocerin on cell-cycle progression
in maize root-meristems synchronized with aphidicolin. Plant Cell Reports 15, 138-42.
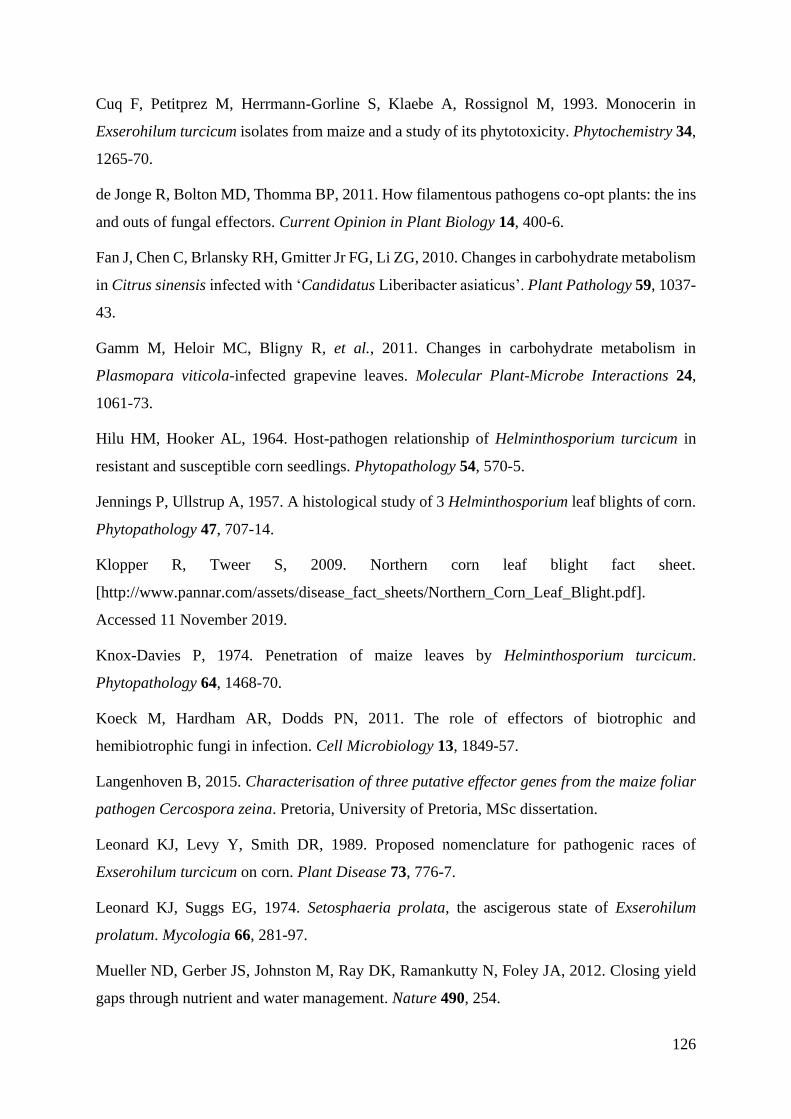
126
Cuq F, Petitprez M, Herrmann-Gorline S, Klaebe A, Rossignol M, 1993. Monocerin in
Exserohilum turcicum isolates from maize and a study of its phytotoxicity. Phytochemistry 34,
1265-70.
de Jonge R, Bolton MD, Thomma BP, 2011. How filamentous pathogens co-opt plants: the ins
and outs of fungal effectors. Current Opinion in Plant Biology 14, 400-6.
Fan J, Chen C, Brlansky RH, Gmitter Jr FG, Li ZG, 2010. Changes in carbohydrate metabolism
in Citrus sinensis infected with ‘Candidatus Liberibacter asiaticus’. Plant Pathology 59, 1037-
43.
Gamm M, Heloir MC, Bligny R, et al., 2011. Changes in carbohydrate metabolism in
Plasmopara viticola-infected grapevine leaves. Molecular Plant-Microbe Interactions 24,
1061-73.
Hilu HM, Hooker AL, 1964. Host-pathogen relationship of Helminthosporium turcicum in
resistant and susceptible corn seedlings. Phytopathology 54, 570-5.
Jennings P, Ullstrup A, 1957. A histological study of 3 Helminthosporium leaf blights of corn.
Phytopathology 47, 707-14.
Klopper R, Tweer S, 2009. Northern corn leaf blight fact sheet.
[http://www.pannar.com/assets/disease_fact_sheets/Northern_Corn_Leaf_Blight.pdf].
Accessed 11 November 2019.
Knox-Davies P, 1974. Penetration of maize leaves by Helminthosporium turcicum.
Phytopathology 64, 1468-70.
Koeck M, Hardham AR, Dodds PN, 2011. The role of effectors of biotrophic and
hemibiotrophic fungi in infection. Cell Microbiology 13, 1849-57.
Langenhoven B, 2015. Characterisation of three putative effector genes from the maize foliar
pathogen Cercospora zeina. Pretoria, University of Pretoria, MSc dissertation.
Leonard KJ, Levy Y, Smith DR, 1989. Proposed nomenclature for pathogenic races of
Exserohilum turcicum on corn. Plant Disease 73, 776-7.
Leonard KJ, Suggs EG, 1974. Setosphaeria prolata, the ascigerous state of Exserohilum
prolatum. Mycologia 66, 281-97.
Mueller ND, Gerber JS, Johnston M, Ray DK, Ramankutty N, Foley JA, 2012. Closing yield
gaps through nutrient and water management. Nature 490, 254.
127
Munkvold GP, White DG, 2016. Compendium of Corn Diseases. APS press St. Paul, MN.
Ribaut J-M, Ragot M, 2006. Marker-assisted selection to improve drought adaptation in maize:
the backcross approach, perspectives, limitations, and alternatives. Journal of Experimental
Botany 58, 351-60.
Robeson DJ, Strobel GA, 1982. Monocerin, a phytotoxin from Exserohilum turcicum (=
Drechslera turcica). Agricultural and Biological Chemistry 46, 2681-3.
Stergiopoulos I, de Wit PJ, 2009. Fungal effector proteins. Annual Review of Phytopathology
47, 233-63.
Vleeshouwers VG, Oliver RP, 2014. Effectors as tools in disease resistance breeding against
biotrophic, hemibiotrophic, and necrotrophic plant pathogens. Molecular Plant-Microbe
Interactions 27, 196-206.

128
Chapter 7: Appendix
129
Figure 7.1. Scanning electron micrograph of the conidia of Exserohilum turcicum with the
protruding hilum (H).
Figure 7.2. Light micrographs of observations of B73 maize leaf paradermal sections after
infection by Exserohilum turcicum (9 days post-inoculation). (a) Chlorotic spot visible with
surrounding healthy tissue; (b) further examinations of the same sample through additional
sections revealed necrotic tissue surrounded by the healthy tissue.
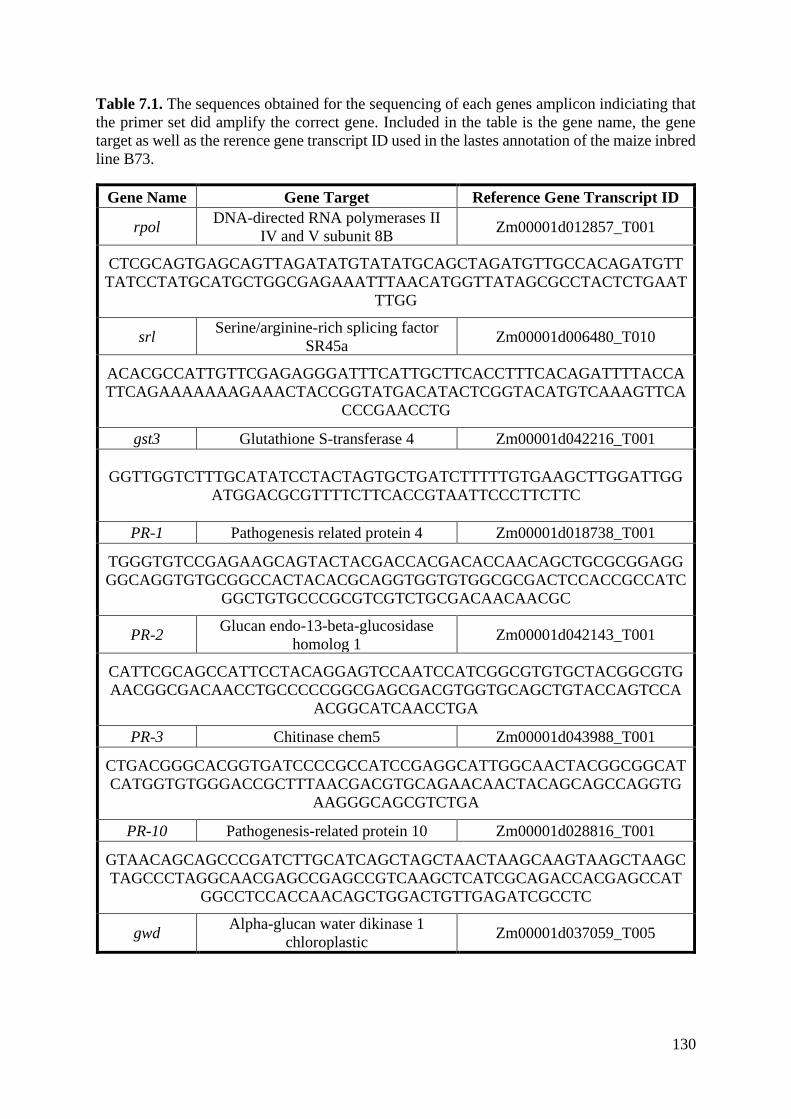
130
Table 7.1. The sequences obtained for the sequencing of each genes amplicon indiciating that
the primer set did amplify the correct gene. Included in the table is the gene name, the gene
target as well as the rerence gene transcript ID used in the lastes annotation of the maize inbred
line B73.
Gene Name Gene Target Reference Gene Transcript ID
rpol DNA-directed RNA polymerases II
IV and V subunit 8B Zm00001d012857_T001
CTCGCAGTGAGCAGTTAGATATGTATATGCAGCTAGATGTTGCCACAGATGTT
TATCCTATGCATGCTGGCGAGAAATTTAACATGGTTATAGCGCCTACTCTGAAT
TTGG
srl Serine/arginine-rich splicing factor
SR45a Zm00001d006480_T010
ACACGCCATTGTTCGAGAGGGATTTCATTGCTTCACCTTTCACAGATTTTACCA
TTCAGAAAAAAAGAAACTACCGGTATGACATACTCGGTACATGTCAAAGTTCA
CCCGAACCTG
gst3 Glutathione S-transferase 4 Zm00001d042216_T001
GGTTGGTCTTTGCATATCCTACTAGTGCTGATCTTTTTGTGAAGCTTGGATTGG
ATGGACGCGTTTTCTTCACCGTAATTCCCTTCTTC
PR-1 Pathogenesis related protein 4 Zm00001d018738_T001
TGGGTGTCCGAGAAGCAGTACTACGACCACGACACCAACAGCTGCGCGGAGG
GGCAGGTGTGCGGCCACTACACGCAGGTGGTGTGGCGCGACTCCACCGCCATC
GGCTGTGCCCGCGTCGTCTGCGACAACAACGC
PR-2 Glucan endo-13-beta-glucosidase
homolog 1 Zm00001d042143_T001
CATTCGCAGCCATTCCTACAGGAGTCCAATCCATCGGCGTGTGCTACGGCGTG
AACGGCGACAACCTGCCCCCGGCGAGCGACGTGGTGCAGCTGTACCAGTCCA
ACGGCATCAACCTGA
PR-3 Chitinase chem5 Zm00001d043988_T001
CTGACGGGCACGGTGATCCCCGCCATCCGAGGCATTGGCAACTACGGCGGCAT
CATGGTGTGGGACCGCTTTAACGACGTGCAGAACAACTACAGCAGCCAGGTG
AAGGGCAGCGTCTGA
PR-10 Pathogenesis-related protein 10 Zm00001d028816_T001
GTAACAGCAGCCCGATCTTGCATCAGCTAGCTAACTAAGCAAGTAAGCTAAGC
TAGCCCTAGGCAACGAGCCGAGCCGTCAAGCTCATCGCAGACCACGAGCCAT
GGCCTCCACCAACAGCTGGACTGTTGAGATCGCCTC
gwd Alpha-glucan water dikinase 1
chloroplastic Zm00001d037059_T005
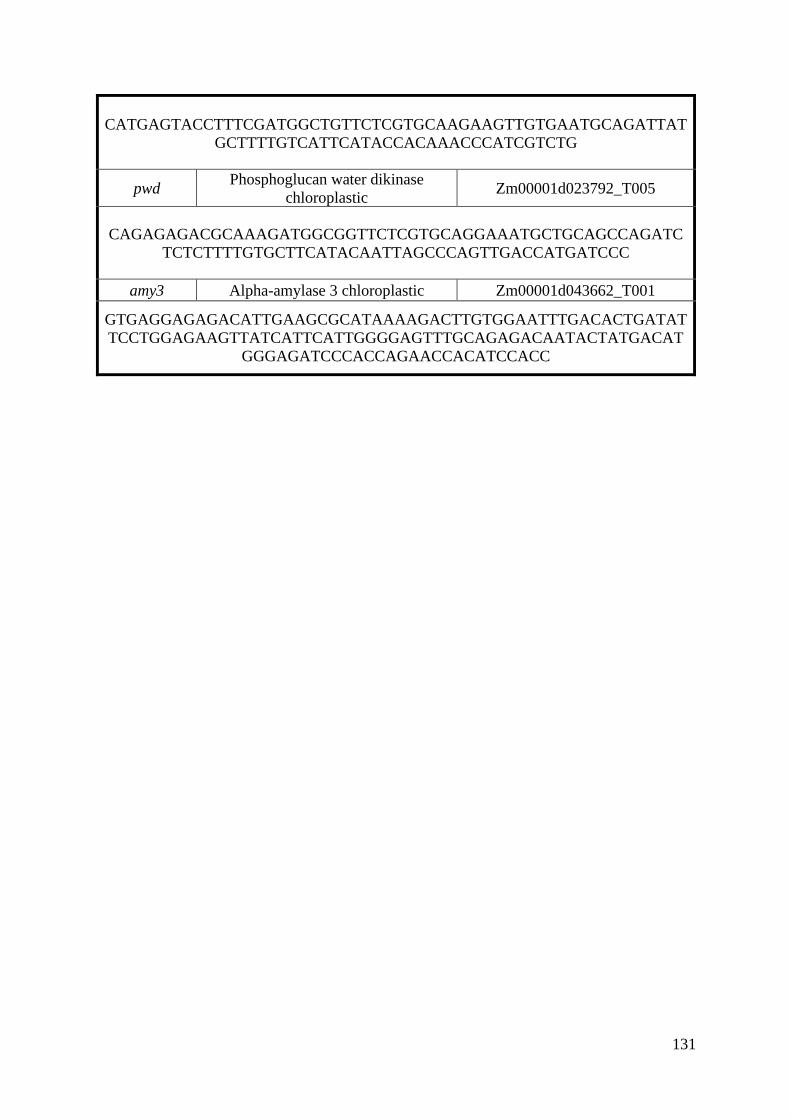
131
CATGAGTACCTTTCGATGGCTGTTCTCGTGCAAGAAGTTGTGAATGCAGATTAT
GCTTTTGTCATTCATACCACAAACCCATCGTCTG
pwd Phosphoglucan water dikinase
chloroplastic Zm00001d023792_T005
CAGAGAGACGCAAAGATGGCGGTTCTCGTGCAGGAAATGCTGCAGCCAGATC
TCTCTTTTGTGCTTCATACAATTAGCCCAGTTGACCATGATCCC
amy3 Alpha-amylase 3 chloroplastic Zm00001d043662_T001
GTGAGGAGAGACATTGAAGCGCATAAAAGACTTGTGGAATTTGACACTGATAT
TCCTGGAGAAGTTATCATTCATTGGGGAGTTTGCAGAGACAATACTATGACAT
GGGAGATCCCACCAGAACCACATCCACC

132
Figure 7.3. Melt-curve analysis of target genes (PR-1, PR-2, PR-3, PR-10, gwd, pwd and amy3)
and references genes (rpol, srl and gst3). The melting peaks were plotted as the negative rate
of change in relative fluorescent units (RFU) against the change in temperature. Melt-curve
133
analysis of all amplicons analysed revealed single peaks with the absence of primer dimers.
Non-template controls had no melt peaks indicating that no contamination was present. The
melting points for PR-1, PR-2, PR-3, PR-10, gwd, pwd, amy3, rpol, srl and gst3 were 88.5°C,
86.5°C, 85.5°C, 84.5°C, 78.5°C, 80.5°C, 79°C, 78.5°C, 78.5°C and 78°C, respectively.
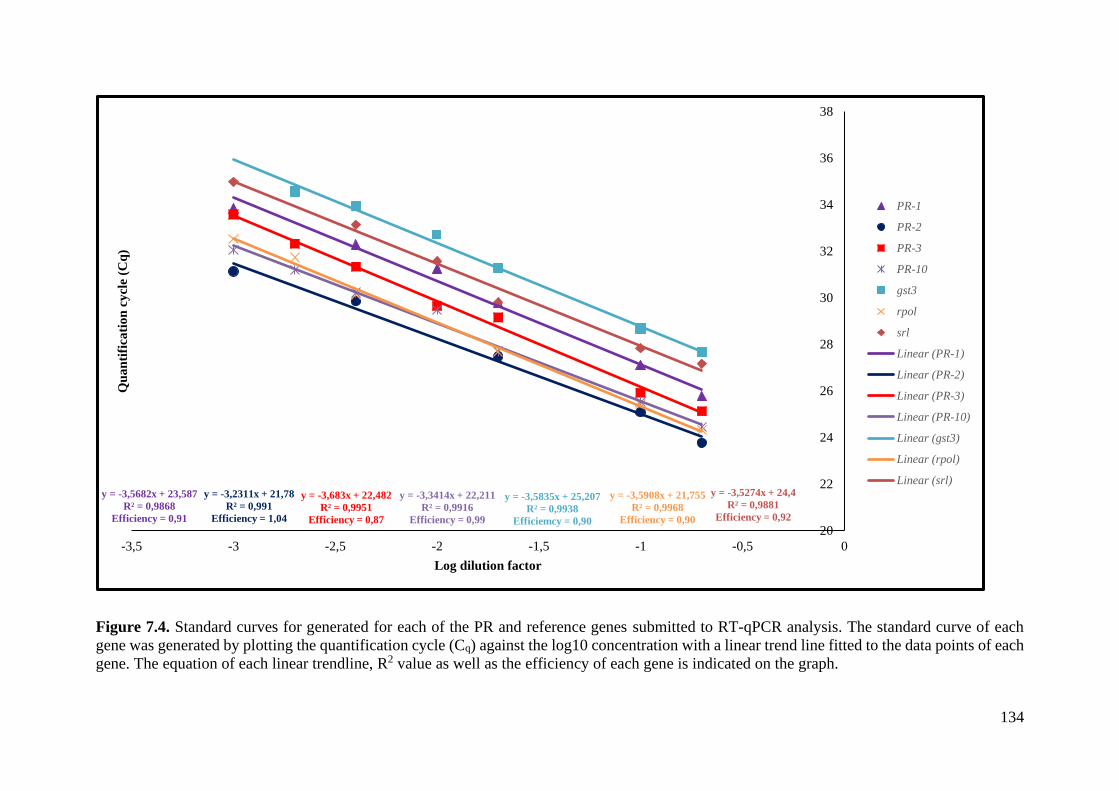
134
Figure 7.4. Standard curves for generated for each of the PR and reference genes submitted to RT-qPCR analysis. The standard curve of each
gene was generated by plotting the quantification cycle (Cq) against the log10 concentration with a linear trend line fitted to the data points of each
gene. The equation of each linear trendline, R2 value as well as the efficiency of each gene is indicated on the graph.
y = -3,5682x + 23,587
R² = 0,9868
Efficiency = 0,91
y = -3,2311x + 21,78
R² = 0,991
Efficiency = 1,04
y = -3,683x + 22,482
R² = 0,9951
Efficiency = 0,87
y = -3,3414x + 22,211
R² = 0,9916
Efficiency = 0,99
y = -3,5835x + 25,207
R² = 0,9938
Efficiemcy = 0,90
y = -3,5908x + 21,755
R² = 0,9968
Efficiency = 0,90
y = -3,5274x + 24,4
R² = 0,9881
Efficiency = 0,92
20
22
24
26
28
30
32
34
36
38
-3,5 -3 -2,5 -2 -1,5 -1 -0,5 0
Qu
an
tifi
cati
on
cy
cle
(Cq
)
Log dilution factor
PR-1
PR-2
PR-3
PR-10
gst3
rpol
srl
Linear (PR-1)
Linear (PR-2)
Linear (PR-3)
Linear (PR-10)
Linear (gst3)
Linear (rpol)
Linear (srl)
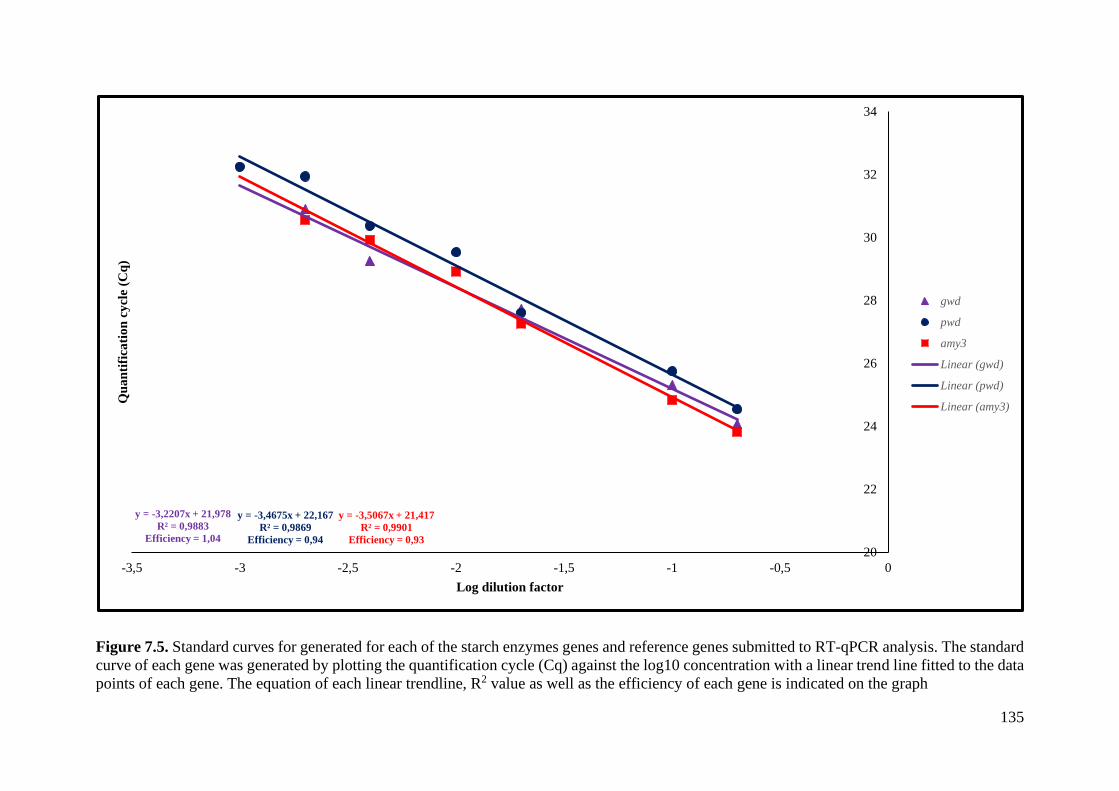
135
Figure 7.5. Standard curves for generated for each of the starch enzymes genes and reference genes submitted to RT-qPCR analysis. The standard
curve of each gene was generated by plotting the quantification cycle (Cq) against the log10 concentration with a linear trend line fitted to the data
points of each gene. The equation of each linear trendline, R2 value as well as the efficiency of each gene is indicated on the graph
y = -3,2207x + 21,978
R² = 0,9883
Efficiency = 1,04
y = -3,4675x + 22,167
R² = 0,9869
Efficiency = 0,94
y = -3,5067x + 21,417
R² = 0,9901
Efficiency = 0,93
20
22
24
26
28
30
32
34
-3,5 -3 -2,5 -2 -1,5 -1 -0,5 0
Qu
an
tifi
cati
on
cy
cle
(Cq
)
Log dilution factor
gwd
pwd
amy3
Linear (gwd)
Linear (pwd)
Linear (amy3)

136