Quantitative assessment of fecal contamination in multiple ...
Upload
independentCategory
view
0download
0
Environmental Pollution 148 (2007) 695e706www.elsevier.com/locate/envpol
The groundwater contribution to surface water contamination in a regionwith intensive agricultural land use (Noord-Brabant, The Netherlands)
J.C. Rozemeijer a,b,*, H.P. Broers b
a Department of Physical Geography, Utrecht University, P.O. Box 80115, NL-3508 TC Utrecht, The Netherlandsb Netherlands Organisation for Applied Scientific Research TNO, P.O. Box 80015, NL-3508 TA Utrecht, The Netherlands
Received 26 January 2007; accepted 31 January 2007
Water quality monitoring data show the importance of the groundwater contribution to surface water pollution.
Abstract
Traditionally, monitoring of soil, groundwater and surface water quality is coordinated by different authorities in the Netherlands. Nowadays,the European Water Framework Directive (EU, 2000) stimulates an integrated approach of the complete soil-groundwater-surface water system.Based on water quality data from several test catchments, we propose a conceptual model stating that stream water quality at different dischargesis the result of different mixing ratios of groundwater from different depths. This concept is used for a regional study of the groundwater con-tribution to surface water contamination in the Dutch province of Noord-Brabant, using the large amount of available data from the regionalmonitoring networks. The results show that groundwater is a dominant source of surface water contamination. The poor chemical conditionof upper and shallow groundwater leads to exceedance of the quality standards in receiving surface waters, especially during quick flow periods.� 2007 Elsevier Ltd. All rights reserved.
Keywords: Groundwater quality; Surface water quality; Base flow; Quick flow; Monitoring
1. Introduction
Pollution of groundwater and surface water by diffuse sour-ces is a serious problem in the EU and especially in the Neth-erlands, due to intensive livestock farming (Campling et al.,2005). Use of fertilizer and animal manure in agriculturalareas is the most important non-point source in most Dutch ru-ral catchments. Leaching of nutrients and heavy metals causegroundwater concentrations to exceed local quality targets, es-pecially in the sandy regions (Reijnders et al., 1998; Fraterset al., 1998; Broers, 2002; Broers and Van der Grift, 2004).Discharge of groundwater from agricultural land towards the
* Corresponding author at: Department of Physical Geography, Utrecht Uni-
versity, P.O. Box 80115, NL-3508 TC Utrecht, The Netherlands. Tel.: þ31
(0)30 256 4724; fax: þ31 (0)30 256 4755.
E-mail address: [email protected] (J.C. Rozemeijer).
0269-7491/$ - see front matter � 2007 Elsevier Ltd. All rights reserved.
doi:10.1016/j.envpol.2007.01.028
surface water system may cause exceedance of surface waterquality standards as well (Van der Molen et al., 1998; Oenemaand Roest, 1998; Oenema et al., 2005).
Ground- and surface water management and monitoring inthe Netherlands is coordinated by different authorities operat-ing in different geographical sub-regions, while national andEuropean governments are stimulating a more integrated ap-proach to managing the soil-groundwater-surface water sys-tem. The European Water Framework Directive (EU, 2000)for example states that pollution of groundwater bodies mustnot cause dependent surface water bodies to fail to meet theirgood status objectives.
In the agricultural province of Noord-Brabant in the Neth-erlands large amounts of water quality data are available.Groundwater and surface water quality data from the regionalmonitoring programs are compared to different thresholdvalues and reported in separate publications (e.g. Van derGrift et al., 2004; Waterschap De Dommel, 2004). These

696 J.C. Rozemeijer, H.P. Broers / Environmental Pollution 148 (2007) 695e706
publications indicate that both shallow groundwater and sur-face waters in Noord-Brabant often do not meet their qualitystandards. Comparing water quality studies reveals that thesame problematic solutes appear in both groundwater and sur-face water. The most problematic inorganic agrochemicals arenutrients (NO3-N, P-tot, SO4) and heavy metals (Zn, Cu, Ni).To date, no effort has been made to comparison and integra-tion of the surface and groundwater quality data from the re-gional monitoring networks.
Different modeling studies indicate that agriculture is animportant source of nutrients and heavy metals (Oenemaet al., 2005; Schoumans et al., 2002; Bonten and Brus,2006). These models indicate that nutrient and heavy metalconcentrations in groundwater discharged from agriculturalland exceed the relevant quality standards for surface waterin Noord-Brabant. Comparing the estimated groundwater con-tribution with estimated inputs from other sources producesa rough estimate of the relative contribution of groundwaterto surface water quality. A recent study estimates that ground-water contributes approximately 47% of total-N loads to sur-face waters in Noord-Brabant, 47% of total-P, 69% of Zn,16% of Cu and 74% of Ni (Van Vliet et al., 2006).
Direct relations between land use, groundwater quality andsurface water quality were observed in several field and catch-ment scale studies (e.g. Hyer et al., 2001; Jarvie et al., 2001;Ahearn et al., 2004; Gelbrecht et al., 2005). Measurementsshowed changes in surface water quality during storm events.Hyer et al. (2001) for example observed decreasing concentra-tions of silica and calcium during storm events in an agricul-tural catchment. Concentrations of nitrate, DOC, potassium,chloride and sulphate increased during storm events. These re-sults indicate that surface water quality during base flow con-ditions is mainly controlled by deeper groundwater chemistry(high concentrations of silica and calcium). The influence ofupper groundwater, soil water and overland flow increases dur-ing peak flow conditions. In an agricultural catchment, thisleads to higher concentrations of agricultural pollutants.
In spite of estimates from modeling studies identifyinggroundwater as an important source for surface water contam-ination and the direct relations between groundwater and sur-face water reported in the literature, extensive sets ofgroundwater and surface water quality data such as availablein Noord-Brabant, have never been compared. Consequently,no direct support exists for the assumed importance of ground-water composition for surface water quality on a regionalscale. If the groundwater contribution can be shown to bea dominant factor, surface water quality management, whichis traditionally focused on the surface water system itself,should aim at groundwater quality improvement as well.
The objective of the present study was to estimate thegroundwater contribution to surface water contamination us-ing monitoring data from the regional monitoring programsin Noord-Brabant. The study focused on problematic solutesin Dutch surface waters: nutrients (NO3-N, P-tot, SO4) andheavy metals (Zn, Cu, Ni).
Groundwater quality data from the regional monitoring pro-gram were used to characterize groundwater quality at different
depth levels. Data from surface water monitoring programs wereused to characterize surface water quality during base flow,intermediate flow and quick flow conditions. This approachallowed us to compare groundwater quality at different depthswith surface water quality during different flow conditions.
2. Description of the study area and the extensivesets of groundwater and surface waterquality data
2.1. Study area
Fig. 1a shows the location of Noord-Brabant within theNetherlands. The total area of Noord-Brabant is 5100 km2,of which 62% is in agricultural use. Noord-Brabant is one ofthe areas in Europe which is most affected by agricultural pol-lution, because of intensive livestock farming which producesa large surplus of manure (Campling et al., 2005; Broers andVan der Grift, 2004; Meinardi et al., 2005; Vermooten et al.,2006; Visser et al., 2007).
Noord-Brabant is a relatively flat area and groundwatertables are generally shallow, usually within 1e3 m below thesurface. The subsurface consists of fluvial Pleistocene uncon-solidated sand and gravel deposits from the Meuse river sys-tem, overlain by a 2e35 m thick cover of fluvio-periglacialand eolian deposits consisting of fine sands and loam. Thearea is drained by a series of brooks (Fig. 1b). The originaldrainage network was artificially extended during the 20thcentury, to allow for agricultural use of the poorly drainedareas. This resulted in a dense network of ditches, drainsand small watercourses.
2.2. Groundwater quality monitoring in the study area
Groundwater quality monitoring in Noord-Brabant is coor-dinated by the provincial government. Locations were selectedusing a concept of stratified random sampling from homoge-neous areas with similar land use, soil types and geohydrolog-ical positioning (Broers, 2002). Eleven homogeneous areaswere distinguished, each of them representing a specific com-bination of vulnerability and pollution loading. For example,the homogeneous area ‘agricultural land-sand-recharge’ wasconsidered vulnerable for leaching of agricultural pollutantsto groundwater. The amount of groundwater sampling wellsper homogeneous area was determined according to the totalextend of the homogeneous area and the a priori presumedrisk for groundwater contamination. Therefore, relativelymore wells were installed in the homogenous area ‘agriculturalland-sand-recharge’ compared to, for example, the homoge-neous area ‘nature-discharge’.
Groundwater quality is measured at different depths belowthe surface. The upper meter of groundwater is sampled intemporary hand-drilled holes. In this paper, this groundwateris referred to as ‘upper groundwater’. The deeper groundwateris sampled using specially designed multi-level observationswells with 2 m long screens at typical depths of about 10and 25 m below the surface (Van Duijvenbooden et al, 1985;

697J.C. Rozemeijer, H.P. Broers / Environmental Pollution 148 (2007) 695e706
a b
WB Brabantse Delta
WB De Dommel
WB Aa & Maas
c
Fig. 1. Location of Noord-Brabant within the Netherlands (a), the major brooks and other water courses and the management areas of the three Water Boards
Brabantse Delta, De Dommel and Aa & Maas (b) and the monitoring network locations for groundwater quality (upper, shallow and deep) and surface water qual-
ity (permanent and rotating) (c).
Broers, 2002). This groundwater will be referred to as ‘shal-low groundwater’ (5e15 m below surface) and ‘deep ground-water’ (15e30 m below surface), respectively.
The complete monitoring program consists of 103 locationsfor upper groundwater and 105 locations for both shallow anddeep groundwater (Fig. 1c). The monitoring locations are sam-pled once every year. The shallow and deep groundwater qual-ity data of 2003 were used for this study. For uppergroundwater, data from 4 sampling rounds (2000e2003)were averaged, to take into account the short-term temporalvariations due to meteorological influence. The accuracies ofthe different measurements are 2.1% for NO3-N, 8.0% for P-tot, 5.7% for SO4 and 7.0% for Zn, Cu, Ni.
2.3. Surface water quality monitoring in the study area
Surface water quality monitoring within Noord-Brabant iscoordinated by three Water Boards (Fig. 1b). Their monitoringstrategies are derived from a national framework for surfacewater quality monitoring (Commissie Integraal Waterbeheer(CIW), 2001). Consequently, the basic principles of the threemonitoring networks are the same, although there are slightdifferences in the implementation of the strategies betweenthe water boards.
Each monitoring program consists of permanent and rotat-ing sampling locations (Fig. 1c). The permanent locationswere sampled twelve times each year. In addition, everyyear a different group of rotating locations was sampled.
The rotating locations are also sampled every month butonly every third or fourth year. The surface water quality mon-itoring locations are mainly situated in the downstream partsof the larger streams. These downstream monitoring locationsare representative of the surface water quality of a largercatchment, integrating all upstream sources of pollution. In ad-dition, these locations do not run dry during dry summers andcan be sampled year-round. Few monitoring locations arepresent in the upper tributaries (headwaters) and the smallerdrains and ditches connected to them.
The three surface water monitoring networks together con-sist of 190 permanent and 330 rotating sampling locations(Fig. 1c). For this study the surface water quality data of1990e2003 were used. The samples were analyzed by two dif-ferent laboratories. Their current accuracies are 6.1% and1.9% for NO3-N, 5.7% and 11% for P-tot, 10% and 3.2%for SO4 and 7.0% and 6.0% for Zn, Cu, Ni.
3. Development of a conceptual model based on testcatchments
Comparison of groundwater and surface water quality datafrom the regional monitoring networks will benefit from a con-ceptual model dealing with the relations between the two com-partments. Water quality measurements from 4 test catchmentswith different geohydrological properties were used to gain in-sight into groundwater-surface water interactions. The test
698 J.C. Rozemeijer, H.P. Broers / Environmental Pollution 148 (2007) 695e706
catchments were selected where point sources are absent, inorder to avoid point sources to dominate surface watercontamination.
3.1. Groundwater quality data processing
Using the provincial groundwater monitoring network data,average NO3-N, PO4, SO4, Zn, Cu, Ni and HCO3 concentra-tions and pH were calculated for every homogeneous area.However, for comparison with surface water quality data, av-erage values for stream catchments were considered more ap-propriate. There are not enough groundwater qualitymonitoring wells for calculation of reliable locally averagedvalues for every single catchment. Therefore, only spatiallyweighted averages could be calculated per catchment. The cal-culation was based on the average concentrations in the homo-geneous areas and the spatial extent of these homogeneousareas within the catchment. Areas further than 100 m from sur-face water courses were excluded from the analysis becausethey are not likely to contribute to surface water dischargewithin the next decade.
This approach accounts for the most important landscapeproperties which influence groundwater quality: land use,soil type and geohydrological positioning. It should be notedthat the calculated averages for the catchments are not basedon groundwater quality data from the catchment itself. Be-cause earlier studies emphasized the dominant effects ofland use, soil type and geohydrological positioning relativeto other factors (Broers, 2002; Broers and Van der Grift,2004; Reijnders et al., 1998), this approach is consideredappropriate.
3.2. Surface water quality data processing
The surface water quality data were divided into groupsbased on the flow conditions at the time of sampling. In theselected test-catchments, both surface water quality and dis-charge were measured at the outflow point. Hydrograph
separation was used for the division into periods with baseflow and quick flow conditions. In this study a frequentlyused method for hydrograph separation developed by Hewlettand Hibbert (1963) was used. This method separates the baseflow and the quick flow component of the hydrograph by a sep-aration line with a constant slope. This line starts whenever theslope of the hydrograph exceeds a specified constant separa-tion slope. The separation line ends when it intersects the fall-ing limb of the hydrograph. For this study, a constantseparation slope of 50 m3 d�1 was used. With this relativelylow slope value, 100% base flow conditions only occur afterextended dry periods (Fig. 2).
The quick flow periods were subdivided into 6 groups,using the quick flow component percentage of the totaldischarge. This resulted in the following seven hydrographseparation classes (HS-classes): HS 1: 100% base flow, HS2: 0e20% quick flow, HS 3: 20e40% quick flow, HS 4:40e60% quick flow, HS 5: 60e80% quick flow, HS 6: 80e90% quick flow and HS 7: 90e100% quick flow. The surfacewater quality data from the test basins were divided into theseseven HS-classes.
3.3. Groundwater and surface water quality in a testcatchment
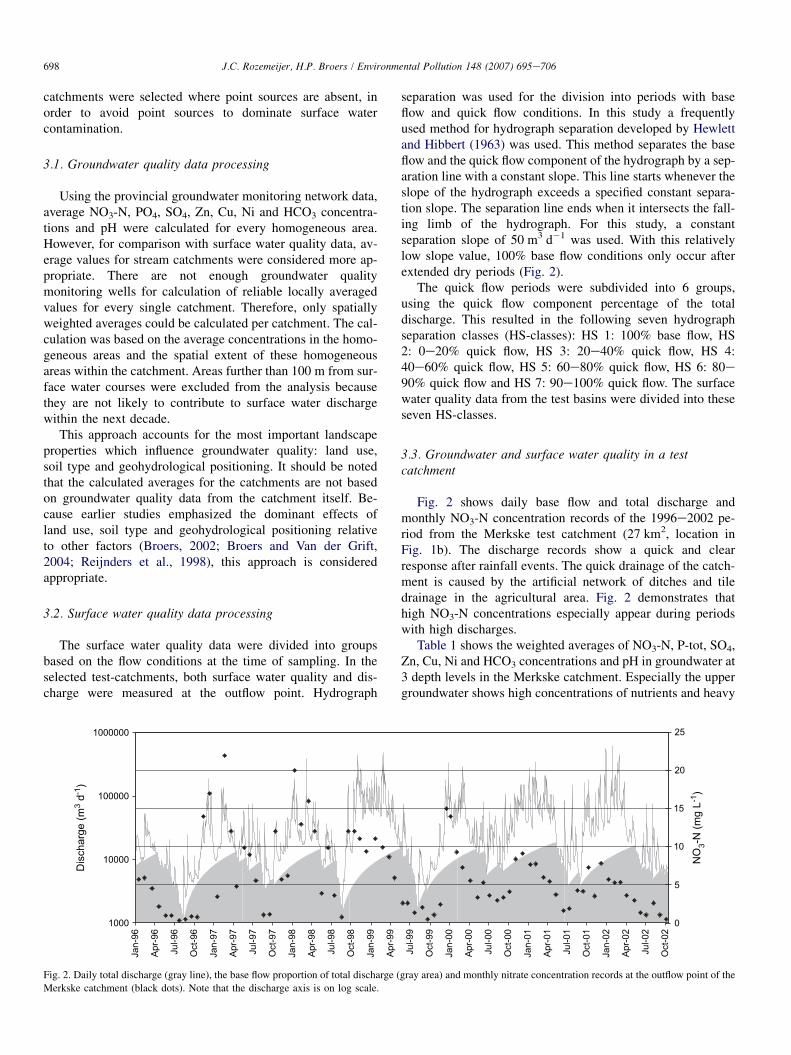
Fig. 2 shows daily base flow and total discharge andmonthly NO3-N concentration records of the 1996e2002 pe-riod from the Merkske test catchment (27 km2, location inFig. 1b). The discharge records show a quick and clearresponse after rainfall events. The quick drainage of the catch-ment is caused by the artificial network of ditches and tiledrainage in the agricultural area. Fig. 2 demonstrates thathigh NO3-N concentrations especially appear during periodswith high discharges.
Table 1 shows the weighted averages of NO3-N, P-tot, SO4,Zn, Cu, Ni and HCO3 concentrations and pH in groundwater at3 depth levels in the Merkske catchment. Especially the uppergroundwater shows high concentrations of nutrients and heavy
1000
10000
100000
1000000
Jan-
96
Apr-9
6
Jul-9
6
Oct
-96
Jan-
97
Apr-9
7
Jul-9
7
Oct
-97
Jan-
98
Apr-9
8
Jul-9
8
Oct
-98
Jan-
99
Apr-9
9
Jul-9
9
Oct
-99
Jan-
00
Apr-0
0
Jul-0
0
Oct
-00
Jan-
01
Apr-0
1
Jul-0
1
Oct
-01
Jan-
02
Apr-0
2
Jul-0
2
Oct
-02
0
5
10
15
20
25
Dis
char
ge (m
3 d-1
)
NO
3-N
(mg
L-1)
Fig. 2. Daily total discharge (gray line), the base flow proportion of total discharge (gray area) and monthly nitrate concentration records at the outflow point of the
Merkske catchment (black dots). Note that the discharge axis is on log scale.

699J.C. Rozemeijer, H.P. Broers / Environmental Pollution 148 (2007) 695e706
Table 1
Weighted average concentrations in upper, shallow and deep groundwater in the Merkske catchment, based on provincial averages in homogeneous areas and the
spatial extent of the homogeneous areas within the catchment
pH HCO3 (mg L�1) NO3-N (mg L�1) P-tot (mg L�1) SO4 (mg L) Zn (mg L�1) Cu (mg L�1) Ni (mg L�1)
Upper groundwater 4.99 57 22 1.2 74 182 15 38
Shallow groundwater 5.05 64 6.7 0.43 93 66 5.4 26
Deep groundwater 5.66 72 1.3 0.45 74 42 0.81 14
metals, indicating the dominant influence of surface sourceslike fertilizer, manure and atmospheric deposition. Clear dif-ferences exist between upper, shallow and deep groundwaterquality, with decreasing concentrations with depth for NO3-N,P-tot, Zn, Cu and Ni. This is explained by the general decreaseof agricultural influence on groundwater quality with depth.Upper groundwater is more contaminated than shallow anddeep groundwater because of its younger age and the retarda-tion and degradation of solutes due to chemical and physicalreactions in the subsoil (Broers and Van der Grift, 2004).
The pH and HCO3 concentrations show an overall increasewith depth. The upper groundwater is directly influenced byacid rainwater. The longer the groundwater passage throughthe subsoil, the more the acidity is buffered and pH andHCO3 concentrations increase. As the adsorption of heavymetals is weaker under acid conditions, the low pH also con-tributes to the higher Zn, Cu and Ni concentrations in uppergroundwater and shallow groundwater. NO3-N is very mobile,but reduction of NO3-N by oxidation of organic matter or py-rite causes decreasing concentrations with depth. Especiallypyrite is abundantly present in the Noord-Brabant subsurface(Broers, 2004). The mobilisation of sulphate by pyrite oxida-tion is the likely cause of the elevated sulphate concentrationsin shallow groundwater.
The Box-Whisker plots in Fig. 3 show the measured surfacewater concentrations in the Merkske brook, divided into sevenHydrograph Separation classes (HS-classes). The increasingHS-class numbers indicate a gradual change from very dryconditions (HS-class 1: 100% base flow) to very wet condi-tions (HS-class 7: 90e100% quick flow). Many solutes inFig. 3 show a clear relationship with HS-class, but with quitedifferent patterns. NO3-N, P-tot, SO4, Zn, Cu and Ni showa general increase in concentrations towards wetter conditions.On the contrary, pH and HCO3 concentrations show a clear de-crease from base flow to quick flow conditions. In more detail,there are some relevant differences between the patterns of thesolutes that show the general increase in concentrations. Thesedifferences especially become apparent when we compare theconcentrations with the Dutch MPC (maximum permissibleconcentration) standards for surface waters (horizontal linesin Fig. 3). For example, Cu and P-tot clearly exceed surfacewater MPC’s during HS-classes 6 and 7, Zn exceeds theMPC in classes 5, 6 and 7 and NO3-N from HS-class 4 andup. Nickel exceeds surface water MPC’s in all HS-classes,but concentrations are really elevated from HS-class 5 and up.
Overall, the results from the Merkske catchment data anal-ysis show a clear relation between surface water quality andflow conditions. Results from other test-catchments (notshown here) confirmed these general relationships.
3.4. Proposition of a conceptual model
We hypothesize that surface water under specific flow con-ditions is the result of a certain mixing ratio of groundwaterfrom different depth levels. During base flow conditions sur-face water quality is more influenced by deep groundwater.During quick flow conditions, the shallow and upper ground-water components become more important. When ground-water composition differs with depth, changes in flowconditions result in changes in surface water composition.
The concept is illustrated in Fig. 4 for a hypothetical crosssection of a catchment. The groundwater flow patterns towardsthe different surface water drainage levels depicted in Fig. 4agree with the flow concepts described by Ernst (1978) andDe Vries (1995). Similar concepts were also used for regionalsolute transport modeling studies (e.g. Groenendijk and Boers,1999). During base flow conditions (HS-classes 1 and 2)groundwater tables are low and only deep and shallow ground-water contribute to the stream discharge (Fig. 4). During HS-class 3 the groundwater level rises and upper groundwaterstarts to contribute. From HS-class 4 to 6 smaller ditchesand watercourses and field drains start to contribute. DuringHS-class 7 surface runoff might contribute to surface wateras well. Because agricultural influence on groundwater qualitygenerally decreases with depth, agricultural contaminants aremainly transported to surface waters during quick flow events.It should be noted that the exact separation between flow com-ponents contributing to surface water runoff within the differ-ent HS-classes in Fig. 4 is not known and depends on the localhydrological situation.
If we compare the surface water quality data (Fig. 3) withthe groundwater quality data (Table 1), it becomes obviousthat surface water composition during base flow conditions,with relatively high concentrations of HCO3, resembles deepgroundwater composition in base flow periods. Towards fasterflow conditions, surface water composition changes and in-creasingly resembles shallow and upper groundwater composi-tion. The different patterns in Fig. 3 can be explained by thedifferent chemical properties of the solutes.
For example, NO3-N shows a gradual increase with increas-ing HS-classes. We relate this to the decrease of NO3-N con-centrations with depth in groundwater. Similar to deepergroundwater, surface water during base flow conditions hardlycontains any NO3-N. The highest NO3-N concentrations insurface water occur during quick flow conditions (HS-class7). The concentrations during quick flow conditions are lowerthan the concentrations in upper groundwater. This supportsour hypothesis that surface water during quick flow conditionsis a mixture of deep, shallow and upper groundwater. The high

700 J.C. Rozemeijer, H.P. Broers / Environmental Pollution 148 (2007) 695e706
0%5%
10%15%20%25%
1 2 3 4 5 6 7
40
30
20
10
0
25
20
15
10
5
0
14
12
10
8
6
4
2
0
8.5
8.0
7.5
7.0
6.5
200
150
100
50
0
120
100
80
60
40
20
0
100
80
60
40
20
0
.8
.6
.4
.2
0.0
HS-class 1 2 3 4 5 6 7Number of measurements 16 11 12 26 20 20 14
Nitr
ate-
N (m
g L-1
)
Tota
l Pho
spha
te (m
g L-1
)
Sulp
hate
(mg
L-1)
1 2 3 4 5 6 712 7 16 12 18 11
HS-class 1 2 3 4 5 6 7Number of measurements 11 5 4 11 8 12 8
Zinc
(µg
L-1)
Cop
per (
µg L
-1)
Nic
kel (
µg L
-1)
1 2 3 4 5 6 711 5 4 11 8 12 8
1 2 3 4 5 6 711 5 4 11 8 12 8
1 2 3 4 5 6 75 1 1 6 2 6 3
1 2 3 4 5 6 712 7 6 16 12 18 11
HS-class 1 2 3 4 5 6 7Number of measurements
pH
Bica
rbon
ate
(mg
L-1)
12 7 6 16 12 18 11
median75-percentile
25-percentile
Range
MPC(Maximum permissible concentration,Dutch surface water quality standard)
HS-class
Prop
ortio
n of
tim
e
6
Fig. 3. Box plots of pH and concentrations of NO3-N, P-tot, SO4, Zn, Cu, Ni and HCO3 during different flow conditions (HS-class 1 (100% base flow)eHS-class 7
(>90% quick flow)) in the period from 1996e2002 at the outflow point of the Merkske catchment. The column graph in the lower right corner shows the pro-
portions of time that the different HS-classes occur.
NO3-N concentrations in discharged upper groundwater are di-luted by the ongoing contribution of deep and shallowgroundwater.
Results for Zn, Cu and P-tot are mutually comparable(Fig. 3). Their concentrations in surface water are elevatedin the highest HS-classes. This is explained by the apparent ac-cumulation of these solutes in the upper part of the soil. Zn, Cuand P-tot are only transported to surface waters when precip-itation water is directly drained after a short passage throughthe contaminated upper part of subsoil. This only occurs dur-ing very wet periods, when groundwater tables are high andtile drains, small ditches and possibly overland flow contributeto surface water runoff.
Relatively high Ni and SO4 concentrations in surface waterappear under both base flow and quick flow conditions, but are
highest in HS-class 5. Both Ni and SO4 show rather high concen-trations in upper, shallow and deep groundwater, resulting in el-evated concentrations already during base flow conditions, witha probable peak through drainage of shallow groundwater.
The pH-value shows a gradual increase with decreasingHS-classes. This resembles the increase in the contributionof deep groundwater which contains a higher pH. However,it is not possible to directly relate groundwater and surface wa-ter pH’s because degassing of CO2 and biological processesstrongly affect surface water pH (Appelo and Postma, 2005).
4. Regional analysis
The conceptual model proposed in the previous section wasused for a regional scale analysis of groundwater contribution

701J.C. Rozemeijer, H.P. Broers / Environmental Pollution 148 (2007) 695e706
Increasing concentrations
of agricultural pollutants
Active flow component
Groundwater table
Tile drainage
HS-class 1 HS-class 2 HS-class 3 HS-class 4
HS-class 7HS-class 6HS-class 5
Fig. 4. Visualisation of the proposed conceptual model for groundwater e surface water interaction; groundwater flow components contributing to surface water
discharge during different flow conditions from base flow conditions (HS-class 1) up to quick flow conditions (HS-class 7).
to surface water contamination in all so called RWSR-catchments in Noord-Brabant. RWSR catchments are the usualarea units used for reporting on surface water quality in theNetherlands. The 18 analyzed RWSR-catchments in Brabanthave surface areas ranging from 50 to 600 km2, with an aver-age of 200 km2.
The main goal of the regional analysis was to estimate theimpact of the groundwater contribution on regional surfacewater quality. Therefore, we tested whether our conceptualmodel would still hold when analysing data on a regionalscale. This would be an indication for the relative importancethe diffuse groundwater source with respect to other sources.Surface water quality in most analyzed catchments in the re-gional analysis is also affected by sources like effluents fromsewage treatment plants, industrial effluents and urban sources(e.g. sewer overflows, contaminated runoff). In addition, sur-face waters in the lower areas are influenced by the inlet ofMeuse water directly from the river or indirectly via canals.These processes were expected to result in weaker relationsbetween groundwater and surface water composition thanwere found in the selected test-catchments without point sour-ces and water inlet.
4.1. Data processing
Average concentrations in upper, shallow and deep ground-water for all catchments in Noord-Brabant were calculated us-ing the same approach as used for the test catchments (Section3.1). The surface water quality data from the regional monitor-ing networks were, analogous to the test catchment analysis,divided into different groups based on flow conditions. Aslightly different approach was followed for the regional
analysis, because discharge time series were not availablefor all surface water sampling locations. Instead, the divisionbetween base flow, intermediate flow and quick flow wasmade using daily precipitation data from 21 locations andevapotranspiration data from one of the main meteorologicalstations of the Royal Netherlands Meteorological Institute(KNMI) located in the centre of the study area.
To define discharge conditions, precipitation excess in theperiod just before the moments of sampling was taken into ac-count. Comparisons with the results of hydrograph separationin the test catchments showed that the cumulative precipitationdeficit (negative precipitation excess) for base flow conditionsand ten days moving averages of precipitation excess for quickflow conditions produced corresponding results. Base flowconditions were defined to occur after a dry period with a cu-mulative precipitation deficit of >20 mm, quick flow condi-tions after a ten days moving average precipitation excess of>3.5 mm and intermediate flow conditions after a periodwith a cumulative precipitation deficit of <1 mm anda 10 days moving average precipitation excess of <1 mm.
The surface water quality data of all monitoring locationswere divided into samples taken during different flow condi-tions. Average concentrations for these different flow conditionswere calculated per location. These average concentrations ofindividual locations were subsequently averaged per RWSR-catchment.
4.2. Regional scale results
The results of the regional scale analysis are presented bymaps showing groundwater quality at three depth levels andsurface water quality during base flow, intermediate flow and

702 J.C. Rozemeijer, H.P. Broers / Environmental Pollution 148 (2007) 695e706
quick flow conditions. Fig. 5 shows the results for total-N in-stead of NO3-N, because more measurements of total-N wereavailable for surface water. In groundwater, total-N concentra-tions are dominated by NO3-N, as concentrations of otherN-species are negligible.
To facilitate comparison between the groundwater and sur-face water quality maps, the legends for all maps in Fig. 5 arethe same. The legend relates the average measured N-tot con-centrations in groundwater and surface water to the Dutch
MPC (maximum permissible concentration) for surface water(2.2 mg N L�1).
The groundwater quality maps show that N-tot concentra-tions in groundwater decrease with depth. Average N-tot con-centrations in upper groundwater are at least five times higherthan the MPC in all catchments. Nitrogen concentrations inshallow groundwater also exceed the MPC frequently. Fromthese maps we conclude that both upper and shallow ground-water are a potential threat to surface water quality in this area.
Upper groundwater
Deep groundwater
Shallow groundwater
Surface waterQuick flow
Surface waterAverage flow
Surface waterBase flow
Not enough data
< MPC
< 1-2 x MPC
< 2-5 x MPC
>5 x MPCMPC (Maximum permissible concentration,Dutch surface water quality standard) = 2,2 mg L -1
Average N concentrations
Fig. 5. Average N-concentrations in upper, shallow and deep groundwater and in surface water during base flow, intermediate flow and quick flow conditions in the
RWSR catchments within Noord-Brabant.

703J.C. Rozemeijer, H.P. Broers / Environmental Pollution 148 (2007) 695e706
The surface water quality maps indeed show that averageN-tot concentrations in surface water exceed the MPC in allcatchments. The N-tot concentrations are highest during quickflow conditions and lowest during base flow conditions.
Comparing the groundwater and surface water maps sup-ports the conceptual model framed in this paper. This is strik-ing, because in most catchments point sources and water inletinfluence surface water composition as well. Nevertheless, theN-tot concentrations in surface water during base flow, inter-mediate flow and quick flow conditions can well be explainedby the mixing of upper, shallow and deep groundwater. Fig. 5shows that N-tot concentrations in surface water are within therange of N-tot concentrations in groundwater. Furthermore,the largest flux from upper and shallow groundwater and con-sequently the highest N-tot concentrations in surface waterwere expected during quick flow conditions. The results pre-sented in Fig. 5 meet this expectation as well.
A similar regional analysis was carried out for P-tot, SO4,Zn, Cu, Ni and pH. Fig. 6 shows the average concentrationsin upper, shallow and deep groundwater on the left side andthe average surface water concentrations during quick flow, in-termediate flow and base flow conditions on the right side. Thegray lines show the average concentrations per individualcatchment. The black lines show the median, 25 and 75 per-centile values of all catchments.
In spite of point sources and water inlet influencing surfacewater composition, the results in Fig. 6 reveal that concentra-tions in surface water of most examined solutes can still be ex-plained by the mixing of different proportions of upper,shallow and deep groundwater. Concentrations of most solutesexceed their MPC for surface water in both groundwater andsurface water. In groundwater, most solutes show decreasingconcentrations with depth. SO4 shows similar concentrationsfor the three depth levels with slightly higher concentrationsin shallow groundwater. The pH in groundwater increaseswith depth. In surface water, concentrations of N-tot, Zn andCu are highest during quick flow conditions and lowest duringbase flow conditions. The pH in surface water is highest duringbase flow conditions and lowest during quick flow conditions.Average P-tot, SO4 and Ni concentrations in surface water donot significantly change with changing flow conditions. Indi-vidual catchments show deviations, but most catchments agreewith these median patterns.
The results for N-tot, SO4, Zn, Cu and pH correspond to ourexpectations based on the proposed conceptual model. Theconcentrations in surface water are within the range of concen-trations in groundwater. Furthermore, N-tot, Zn and Cu con-centrations and pH in surface water show the expectedrelation with flow conditions, taking into account the differ-ences in upper, shallow and deep groundwater quality.
Because P-tot and Ni concentrations in groundwater de-crease with depth, their concentrations in surface water wereexpected to be highest during quick flow conditions and lowestduring base flow conditions. However, averaged P-tot and Niconcentrations do not significantly change with changingflow conditions in most catchments. These results do notmatch with the results from the test-catchments analysis,
where P-tot and Ni concentrations in surface water alsochanged with changing flow conditions. However, the selectedtest catchments were not influenced by point sources and wa-ter inlet. The regional scale results might indicate that pointsources and the water inlet from the Meuse have an importanteffect on regional P-tot and Ni concentrations in surface waterin Noord-Brabant.
5. Discussion
Using data from regional monitoring programs, this studyindicates that groundwater is a major contributor to surfacewater contamination in Noord-Brabant. The poor chemicalcondition of the shallow and upper groundwater in the studyarea can lead to exceedance of the quality standards inreceiving surface waters, even when they are not influencedby other sources.
The test catchment analysis showed the direct relations be-tween surface water quality and flow conditions. The test-catchments were selected where point sources are absent.Therefore, surface water quality during different flow condi-tions could be related to groundwater quality at different depthlevels. Different solutes have reached different depths ingroundwater due differences in input and retardation andtransformation processes. Agricultural contaminants that areretarded (e.g. P-tot, Zn and Cu) or transformed (e.g. NO3-N)and consequently only reached shallow depths, show largestgroundwater contributions to surface water composition dur-ing quick flow events. Contaminants that have reached deeper(Ni, SO4) also show a clear groundwater contribution duringbase flow conditions.
Based on these observations a conceptual model was pro-posed, stating that surface water quality during specific flowconditions is the result of a certain mixing ratio of groundwa-ter from different depth levels. This conceptual model is onlyvalid when groundwater is the major source of surface watercontamination. However, most catchments analysed in the re-gional analysis of Noord-Brabant are also influenced by othersources. Furthermore, the selected test catchments may not berepresentative for the hydrological and biochemical propertiesof all other catchments in Noord-Brabant. Nevertheless, theresults of the regional analysis also showed clear relations be-tween surface water quality during different flow conditionsand groundwater quality at different depth levels. This indi-cates that groundwater is an important contributor to surfacewater contamination.
Many other physical, chemical and biological processesalso affect surface water composition to a certain extent. Anexample of a process influencing P-tot and heavy metal con-centrations in surface water is the resuspension of contami-nated stream bed sediment (e.g. Zonta et al., 2005). Duringquick flow conditions, this may account for a part of the ele-vated concentrations. Nevertheless, P-tot and heavy metal con-centrations during average and base flow conditions, whensuspended matter contents are generally very low, still indicatethat groundwater is an important source.

704 J.C. Rozemeijer, H.P. Broers / Environmental Pollution 148 (2007) 695e706
0
Groundwater Surface water
P (m
g L
-1)
Groundwater
P (m
g L
-1)
Surface water
N (m
g L
-1)
N (m
g L
-1)
SO
4 (m
g L
-1)
0
20
40
60
80
100
120
140
160
SO
4 (m
g L
-1)
0
20
40
60
80
100
120
140
160
Zn
(µ
g L
-1)
Zn
(µ
g L
-1)
Ni (µ
g L
-1)
Ni (µ
g L
-1)
0
10
20
30
40
50
60
70
80
0
10
20
30
40
50
60
70
80
pH
pH
Upper Shallow Deep
flow flow
Quick Intermediate Base
flow
4.04.55.05.56.06.57.07.58.08.5
4.04.55.05.56.06.57.07.58.08.5
5
10
15
20
25
0
5
10
15
20
25
0.0
0.2
0.4
0.6
0.8
1.0
1.2
1.4
1.6
0.0
0.2
0.4
0.6
0.8
1.0
1.2
1.4
1.6
0
50
100
150
200
250
300
350
400
0
50
100
150
200
250
300
350
400
Cu
(µ
g L
-1)
0
5
10
15
20
25
Cu
(µ
g L
-1)
0
5
10
15
20
25
Catchment averaged concentrationsMedian of catchment averaged concentrationsp25 and p75 of catchment averaged concentrationsMaximum Permissible Concentration(MPC, Dutch surface water quality standard)
Upper Shallow Deep Quick
flow
Intermediate
flow
Base
flow
Upper Shallow Deep
flow flow
Quick Intermediate Base
flow
Upper Shallow Deep
flow flow
Quick Intermediate Base
flow
Upper Shallow Deep
flow flow
Quick Intermediate Base
flow
Upper Shallow Deep
flow flow
Quick Intermediate Base
flow
Upper Shallow Deep
flow flow
Quick Intermediate Base
flow
Fig. 6. Summary of the regional analysis results; average concentrations for upper, shallow and deep groundwater and surface water during base flow, intermediate
flow and quick flow conditions per RWSR-catchment (gray lines) and median, p25 and p75-concentrations of all catchments (black lines).
This study was carried out in relatively flat area with shal-low groundwater tables and a dense artificial drainage networkof ditches, drains and small watercourses. Other studies thatwere carried out in more hilly catchments with more naturaldrainage systems, for example in Germany (Gelbrecht et al.,2005) and Virginia, USA (Hyer et al., 2001) and in mountain-ous catchments for example in Scotland (Jarvie et al., 2001)and California, USA (Ahearn et al., 2004) also show changesin surface water quality during storm events. Therefore, our
approach to assess the relative impact of the diffuse groundwa-ter contribution to surface water pollution could also be ap-plied to these catchments and many other regions throughoutthe world with sufficient monitoring data.
An exact quantification of the groundwater contribution tosurface water pollution would require adaptations in the re-gional surface water and groundwater quality monitoring net-works from which the data were used in this study. In addition,a quantitative assessment of the groundwater contribution with

705J.C. Rozemeijer, H.P. Broers / Environmental Pollution 148 (2007) 695e706
respect to other sources would require quantification of allother important sources as well. This was beyond the scopeof this study. However, developing suited and cost-efficient re-gional monitoring network strategies is a major challenge forfuture research. In addition, further developments in hydrolog-ical modelling will be needed for better interpolation of waterquality data in both time and space and for improving impactpredictions of proposed mitigating measures. The major chal-lenge is to develop regional scale models that can still dealwith the impact of dynamic small-scale processes like over-land flow, shallow subsurface flow and drainage flow. Anothertopic for further research is the usability for regional monitor-ing of new measurement techniques that can deal with thelarge temporal variations in water quality, for example contin-uous measurements techniques like sensors and ion-selectiveelectrodes or passive samplers that produce long term averageconcentrations (e.g. De Jonge and Rothenberg, 2005).
6. Conclusions
Using measured groundwater and surface water quality datafrom regional monitoring networks, this paper showed thatgroundwater is a major contributor to surface water contami-nation in Noord-Brabant. The poor chemical condition of up-per and shallow groundwater leads to exceedance of thequality standards in receiving surface waters, especially duringquick flow periods. This means that improvement of ground-water quality is required to enable compliance with the surfacewater quality goals. Surface water quality management is tra-ditionally focused on the surface water system itself. The re-sults of this study imply that an integrated management andmonitoring of the whole groundwater and surface water sys-tem in catchments is needed.
In this study a conceptual model dealing with the relationsbetween groundwater and surface water was used for relatingthe regional groundwater quality monitoring data to the re-gional surface water quality monitoring data. Although currentregional water quality monitoring networks are not designedfor studying groundwater e surface water interactions, this ap-proach allowed us to determine the relative impact of the dif-fuse groundwater contribution to regional surface waterpollution. The approach can also be applied to any other re-gion with sufficient groundwater and surface water qualitymonitoring data.
Acknowledgements
This work was supported by the European Union FP6 Inte-grated Project AquaTerra (Project no. GOCE 505428) underthe thematic priority ‘‘sustainable development, global changeand ecosystems’’.
References
Ahearn, D.S., Sheibley, R.W., Dahlgren, R.A., Keller, K.E., 2004. Temporal
dynamics of stream water chemistry in the last free-flowing river draining
the western Sierra Nevada, California. Journal of Hydrology 295 (1e4),
47e63.
Appelo, C.A.J., Postma, D., 2005. Geochemistry, Groundwater and Pollution,
second ed. A.A. Balkema, Leiden.
Bonten, L.T.C., Brus, D.J., 2006. Belasting van het oppervlaktewater in het
landelijk gebied door uitspoeling van zware metalen. Alterra report
1340, Alterra, Wageningen (in Dutch).
Broers, H.P., 2002. Strategies for Regional Groundwater Quality Monitoring.
PhD thesis, Utrecht University, Utrecht.
Broers, H.P., 2004. Nitrate reduction and pyrite oxidation in the Netherlands.
In: Razowska-Jaworek, L., Sadurski, A. (Eds.), Nitrate in Groundwaters,
IAH Selected Papers on Hydrogeology. Balkema Publishers, Leiden, pp.
141e149.
Broers, H.P., Van der Grift, B., 2004. Regional monitoring of temporal changes
in groundwater quality. Journal of Hydrology 296 (1e4), 192e220.
Campling, P., Terres, J.M., Vande Walle, S., Van Orshoven, J., Crouzet, P.,
2005. Estimation of nitrogen balances from agriculture for EU-15: spatial-
isation of estimates to River basins using the CORINE Land Cover. Phys-
ics and Chemistry of the Earth 30, 25e34.
Commissie Integraal Waterbeheer (CIW), 2001. Leidraad Monitoring (in
Dutch). Institute for Inland Water Management and Waste Water Treat-
ment (RIZA), Lelystad, The Netherlands.
De Jonge, H., Rothenberg, G., 2005. New device and method for flux-propor-
tional sampling of mobile solutes in soil and groundwater. Journal of En-
vironmental Science Technology 39, 274e282.
De Vries, J.J., 1995. Seasonal expansion and contraction of stream networks in
shallow groundwater systems. Journal of Hydrology 170 (1e4), 15e26.
Ernst, L.F., 1978. Drainage of undulating sandy soils with high groundwater
tables. Journal of Hydrology 39 (1e2), 1e50.
EU, 2000. Directive 2000/60/EC of the European Parliament and of the Coun-
cil of 23 October 2000 Establishing a Framework for Community Action
in the Field of Water Policy. Official Journal, L327, European Parliament,
pp. 0001e0073.
Fraters, D., Boumans, L.J.M., Van Drecht, G., De Haan, T., De Hoop, W.D.,
1998. Nitrogen monitoring in groundwater in the sandy regions of the
Netherlands. Environmental Pollution 102 (Suppl. 1), 479e485.
Gelbrecht, J., Lengsfeld, H., Pothig, R., Opitz, D., 2005. Temporal and spatial
variation of phosphorus input, retention and loss in a small catchment of
NE Germany. Journal of Hydrology 304 (1e4), 151e165.
Groenendijk, P., Boers, P., 1999. Surface water pollution from diffuse agricul-
tural sources at a regional scale. IAHS-AISH Publication 257, 235e244.
Hewlett, J.D., Hibbert, A.R., 1963. Moisture and energy conditions within
a sloping soil mass during drainage. Journal of Geophysical Research
68, 1081e1087.
Hyer, K.E., Hornberger, G.M., Herman, J.S., 2001. Processes controlling the
episodic streamwater transport of atrazine and other agrichemicals in an
agricultural watershed. Journal of Hydrology 254 (1e4), 47e66.
Jarvie, H.P., Neal, C., Smart, R., Owen, R., Fraser, D., Forbes, I., Wade, A.,
2001. Use of continuous water quality records for hydrograph separation
and to assess short-term variability and extremes in acidity and dissolved
carbon dioxide for the River Dee, Scotland. Science of the Total Environ-
ment 265 (1e3), 85e98.
Meinardi, C.R., Van den Born, G.J., Boumans, L.J.M., Fraters, B., Lijzen,
J.P.A., Van der Linden, A.M.A., Otte, P.F.M., Reijnders, H.F., Schotten,
C.G.J., Versluijs, C.W., 2005. Basisdocument Karakterisering Grondwater
voor de Kaderrichtlijn Water. RIVM-report 50000306/2005, National Insti-
tute for Public Health and the Environment (RIVM), Bilthoven, The
Netherlands (in Dutch).
Oenema, O., Roest, C.W.J., 1998. Nitrogen and phosphorus losses from agri-
culture into surface waters; the effects of policies and measures in the
Netherlands. Water Science and Technology 37 (3), 19e30.
Oenema, O., Van Liere, L., Schoumans, O., 2005. Effects of lowering nitrogen
and phosphorus surpluses in agriculture on the quality of groundwater
and surface water in the Netherlands. Journal of Hydrology 304 (1e4),
289e301.
Reijnders, H.F.R., Van Drecht, G., Prins, H.F., Boumans, L.J.M., 1998. The
quality of the groundwater in the Netherlands. Journal of Hydrology 207
(3e4), 179e188.

706 J.C. Rozemeijer, H.P. Broers / Environmental Pollution 148 (2007) 695e706
Schoumans, O.F., Roelsma, J., Oosterom, H.P., Groenendijk, P., Wolf, J., Van
Zeijts, H., Van den Born, G.J., Van Tol, S., Beusen, A.H.W., Ten Berge
H.F.M., Van der Meer, H.G., Van Evert, F.K., 2002. Nutrientenemissie vanuit
landbouwgronden naar het grondwater en oppervlaktewater bij varianten
van verliesnormen. Modelberekeningen met STONE 2.0. Clusterrapport 4:
Deel 1. Alterra-report 552, Alterra, Wageningen, The Netherlands (in
Dutch).
Van der Grift, B., Rozemeijer, J.C., Van Vliet, M.E., Broers, H.P., 2004. De
kwaliteit van het grondwater in de provincie Noord Brabant, Rapportage
over de toestand van 2003 en trends in de periode 1992 t/m 2003, TNO
report NITG 04-206-B, TNO Built Environment and Geosciences, Utrecht,
The Netherlands (in Dutch).
Van der Molen, D.T., Breeuwsma, A., Boers, P.C.M., 1998. Agricultural nutri-
ent losses to surface water in the Netherlands: impact, strategies, and per-
spectives. Journal of Environmental Quality 27 (1), 4e11.
Van Duijvenbooden, W., Taat, J., Gast, L.F.L., 1985. The Netherlands Monitor-
ing Network for Groundwater Quality: Report on the Installation Phase.
840382001, National Institute of Public Health and the Environment,
Bilthoven, The Netherlands (in Dutch).
Van Vliet, M.E., Passier, H.F., Van der Grift, B., Brils, J., Joziasse, J., Schip-
per, P., Clement, P., Van Lanen, R., 2006. Herkomst stoffen in het Maas-
stroomgebied, TNO-report 2006-U-R0095/B, TNO Built Environment
and Geosciences, Utrecht, The Netherlands (in Dutch).
Vermooten, J.S.A., Maring, L., Van Vliet, M., Griffioen, J., 2006.
Landsdekkende, geologische karakterisering van de regionale grondwater-
samenstelling in de geotop van Nederland: Data rapport. TNO-report
2006-U-R0171/A, TNO Build Environment and Geosciences, Utrecht,
The Netherlands (in Dutch).
Visser, A., Van der Grift, B., Broers, H.P., Bierkensx, M.F.P., 2007. Demon-
strating trend reversal of groundwater quality in relation to time of re-
charge determined by 3H/3He. Environmental Pollution 148 (3), 797e807.
Waterschap De Dommel, 2004. Feiten en cijfers 2003, Waterkwantiteit
en waterkwaliteit. Report U-04e05914, Boxtel, The Netherlands (in
Dutch).
Zonta, R., Collavini, F., Zaggia, L., Zuliani, A., 2005. The effects of floods on
the transport of suspended sediments and contaminants: a case study from
the estuary of the Dese River (Venice Lagoon, Italy). Environmental Inter-
national 31, 948e958.
Copyright © 2022 FDOKUMEN