The glycosphingolipid globotriaosylceramide in the metastatic transformation of colon cancer
6
The glycosphingolipid globotriaosylceramide in the metastatic transformation of colon cancer Olga Kovbasnjuk* † , Rakhilya Mourtazina*, Boris Baibakov*, Thomas Wang*, Christian Elowsky*, Michael A. Choti ‡ , Anne Kane § , and Mark Donowitz* *Division of Gastroenterology, Department of Medicine, and ‡ Department of Surgery, The Johns Hopkins University School of Medicine, Baltimore, MD 21205; and § Center for Gastroenterology Research on Absorptive and Sectretory Processes, Tufts New England Medical Center, Boston, MA 02111 Edited by Sen-itiroh Hakomori, Pacific Northwest Research Institute and University of Washington, Seattle, WA, and approved November 9, 2005 (received for review July 28, 2005) The most devastating aspect of cancer is the emergence of metas- tases. Thus, identification of potentially metastatic cells among a tumor cell population and the underlying molecular changes that switch cells to a metastatic state are among the most important issues in cancer biology. Here we show that, although normal human colonic epithelial cells lack the glycosphingolipid globotri- aosylceramide (Gb3 ), this molecule is highly expressed in meta- static colon cancer. In addition, a subpopulation of cells that are greatly enriched in Gb3 and have an invasive phenotype was identified in human colon cancer cell lines. In epithelial cells in culture, Gb3 was necessary and sufficient for cell invasiveness. Transfection of Gb3 synthase, resulting in Gb 3 expression in non- cancerous polarized epithelial cells lacking endogenous Gb3 , in- duced cell invasiveness. Furthermore, Gb3 knockdown by small inhibitory RNA in colon cancer epithelial cells inhibited cell inva- siveness. Gb3 is the plasma membrane receptor for Shiga toxin 1. The noncatalytic B subunit of Shiga toxin 1 causes apoptosis of human colon cancer cells expressing Gb3 . Injections of the B subunit of Shiga toxin 1 into HT29 human colon cancer cells engrafted into the flanks of nude mice inhibited tumor growth. These data demonstrate the appearance of a subpopulation of Gb3 containing epithelial cells in the metastatic stage of human colon cancer and suggest their possible role in colon cancer invasiveness. metastases invasion filopodia C olorectal cancer is the second leading cause of cancer death in the U.S. (1, 2). The high mortality associated with colorectal cancer is related to its ability to spread beyond the large intestine and to invade distant organs. One route to improve understanding of the molecular mechanisms of metastasis is by the identification of genes that are differently expressed during cancer progression andor are responsible for acquisition of the metastatic phenotype. Although many molecular factors have been identified as contrib- uting to metastases and represent potential targets for treatment (3), much remains to be learned about the biology of the metastatic process. Aberrant glycosylation, which has been observed in essen- tially all types of human cancers during cancer progression into the metastatic stage, is an example of a metastases-related change that is based, in part, on altered gene expression (4). Aberrant glycosylation due to tumor transition into an invasive stage is also associated with changes in glycosphingolipid (GSL) composition. GSLs are abundant in the outer leaflet of plasma membranes of nearly all eukaryotic cells and have many diverse functions (5, 6). GSLs serve as receptors for viral and bacterial toxins, and microbial infections may be mediated by interactions of host GSLs with microbial membrane proteins. GSLs at the cell surface modulate transmembrane signal transduction by inf luenc- ing protein kinases associated with growth factor receptors and PKC. GSL–GSL interactions and formation of so-called glycosyn- apses appear to provide the basis for a specific cell recognition system independent of the fibronectinintegrin or surface lectin systems (7). Surprisingly large numbers of tumor-associated anti- gens have been identified as GSLs. Altered GSL structures and cell surface expression patterns are associated with invasive phenotypes of some experimental tumors (7). Thus, it is well established that G M3 inhibits cell motility and invasiveness in bladder tumors (8). Gangliosides Gt 1b , GD 1A ,G M3 , and G M1 inhibit cell proliferation and epidermal growth factor receptor tyrosine phosphorylation (9, 10), whereas depletion of Gt 1b and G M3 by sialidase overexpression facilitates epidermal growth factor receptor phosphorylation and cell migration (10). Oppositely, a different GSL, G b5 , strongly enhances motility of breast cancer cells (11). We have now identified a form of abnormal glycosylation that correlates with the development of human colon cancer metastasis. Globotriaosylceramide (Gb 3 ) is expressed in metastatic colon can- cer and is virtually absent from normal colonic epithelial cells. We found that Gb 3 -expressing colon cancer cells represent a potentially invasive subpopulation. Molecular manipulation to increase Gb 3 expression converts noninvasive epithelial cells into cells with an invasive phenotype, and the molecular alterations that lead to Gb 3 up-regulation appear to be sufficient for this transformation. To explore the role of Gb 3 in the growth of human colon cancer cell lines established from metastatic lesions, advantage was taken of the fact that Gb 3 serves as a receptor (12, 13) for the noncatalytic B subunit of Shiga toxin 1 (Stx1B). As in other cells (14), the selective binding and uptake of the Stx1B by Gb 3 -positive Caco-2 cells is shown to cause apoptosis. We also show that intratumoral injection of Stx1B inhibited colonic tumor growth in the nude mouse model. Materials and Methods Cell Culture and Human Tissue. Caco-2, T84, OK, and HT29 cells were from the American Type Culture Collection. Samples of archived frozen human tissue included normal distal and proximal colon (n 15), nonmalignant colonic adenomas (n 3), colon cancer without metastases (n 3), primary lesions of metastatic colon cancer (n 5), and colon cancer metastases in liver (n 2). This study was exempted under the Code of Federal Regulations Title 45 Section 46.101(b) by the Hopkins Institution Review Board. Fluorescence Microscopy. To evaluate the distribution of Gb 3 , cells grown on glass coverslips were incubated for 1 h with 0.5 gml Stx1B–Alexa Fluor 488 (Stx1B–488). All experiments, except im- munofluorescence, were performed on living cells mounted in a perfusion chamber (Warner Instruments, Hamden, CT) with Conflict of interest statement: No conflicts declared. This paper was submitted directly (Track II) to the PNAS office. Abbreviations: GSL, glycosphingolipid; Gb3, globotriaosylceramide; Stx1B, B subunit of Shiga toxin 1; siRNA, small inhibitory RNA; scRNA, scrambled RNA; HPTLC, high- performance thin-layer chromatography; LCM, laser capture microdissection; LacCer, lactoceramide. † To whom correspondence should be addressed at: The Johns Hopkins University School of Medicine, 720 Rutland Avenue, 925 Ross Research Building, Baltimore, MD 21205-2195. E-mail: [email protected]. © 2005 by The National Academy of Sciences of the USA www.pnas.orgcgidoi10.1073pnas.0506474102 PNAS December 27, 2005 vol. 102 no. 52 19087–19092 MEDICAL SCIENCES
-
Upload
un-lincoln -
Category
Documents
-
view
0 -
download
0
Transcript of The glycosphingolipid globotriaosylceramide in the metastatic transformation of colon cancer

The glycosphingolipid globotriaosylceramide in themetastatic transformation of colon cancerOlga Kovbasnjuk*†, Rakhilya Mourtazina*, Boris Baibakov*, Thomas Wang*, Christian Elowsky*, Michael A. Choti‡,Anne Kane§, and Mark Donowitz*
*Division of Gastroenterology, Department of Medicine, and ‡Department of Surgery, The Johns Hopkins University School of Medicine, Baltimore,MD 21205; and §Center for Gastroenterology Research on Absorptive and Sectretory Processes, Tufts New England Medical Center, Boston, MA 02111
Edited by Sen-itiroh Hakomori, Pacific Northwest Research Institute and University of Washington, Seattle, WA, and approved November 9, 2005(received for review July 28, 2005)
The most devastating aspect of cancer is the emergence of metas-tases. Thus, identification of potentially metastatic cells among atumor cell population and the underlying molecular changes thatswitch cells to a metastatic state are among the most importantissues in cancer biology. Here we show that, although normalhuman colonic epithelial cells lack the glycosphingolipid globotri-aosylceramide (Gb3), this molecule is highly expressed in meta-static colon cancer. In addition, a subpopulation of cells that aregreatly enriched in Gb3 and have an invasive phenotype wasidentified in human colon cancer cell lines. In epithelial cells inculture, Gb3 was necessary and sufficient for cell invasiveness.Transfection of Gb3 synthase, resulting in Gb3 expression in non-cancerous polarized epithelial cells lacking endogenous Gb3, in-duced cell invasiveness. Furthermore, Gb3 knockdown by smallinhibitory RNA in colon cancer epithelial cells inhibited cell inva-siveness. Gb3 is the plasma membrane receptor for Shiga toxin 1.The noncatalytic B subunit of Shiga toxin 1 causes apoptosis ofhuman colon cancer cells expressing Gb3. Injections of the B subunitof Shiga toxin 1 into HT29 human colon cancer cells engrafted intothe flanks of nude mice inhibited tumor growth. These datademonstrate the appearance of a subpopulation of Gb3 containingepithelial cells in the metastatic stage of human colon cancer andsuggest their possible role in colon cancer invasiveness.
metastases � invasion � filopodia
Colorectal cancer is the second leading cause of cancer death inthe U.S. (1, 2). The high mortality associated with colorectal
cancer is related to its ability to spread beyond the large intestineand to invade distant organs. One route to improve understandingof the molecular mechanisms of metastasis is by the identificationof genes that are differently expressed during cancer progressionand�or are responsible for acquisition of the metastatic phenotype.Although many molecular factors have been identified as contrib-uting to metastases and represent potential targets for treatment(3), much remains to be learned about the biology of the metastaticprocess. Aberrant glycosylation, which has been observed in essen-tially all types of human cancers during cancer progression into themetastatic stage, is an example of a metastases-related change thatis based, in part, on altered gene expression (4).
Aberrant glycosylation due to tumor transition into an invasivestage is also associated with changes in glycosphingolipid (GSL)composition. GSLs are abundant in the outer leaflet of plasmamembranes of nearly all eukaryotic cells and have many diversefunctions (5, 6). GSLs serve as receptors for viral and bacterialtoxins, and microbial infections may be mediated by interactions ofhost GSLs with microbial membrane proteins. GSLs at the cellsurface modulate transmembrane signal transduction by influenc-ing protein kinases associated with growth factor receptors andPKC. GSL–GSL interactions and formation of so-called glycosyn-apses appear to provide the basis for a specific cell recognitionsystem independent of the fibronectin�integrin or surface lectinsystems (7). Surprisingly large numbers of tumor-associated anti-gens have been identified as GSLs. Altered GSL structures and cell
surface expression patterns are associated with invasive phenotypesof some experimental tumors (7). Thus, it is well established thatGM3 inhibits cell motility and invasiveness in bladder tumors (8).Gangliosides Gt1b, GD1A, GM3, and GM1 inhibit cell proliferationand epidermal growth factor receptor tyrosine phosphorylation (9,10), whereas depletion of Gt1b and GM3 by sialidase overexpressionfacilitates epidermal growth factor receptor phosphorylation andcell migration (10). Oppositely, a different GSL, Gb5, stronglyenhances motility of breast cancer cells (11).
We have now identified a form of abnormal glycosylation thatcorrelates with the development of human colon cancer metastasis.Globotriaosylceramide (Gb3) is expressed in metastatic colon can-cer and is virtually absent from normal colonic epithelial cells. Wefound that Gb3-expressing colon cancer cells represent a potentiallyinvasive subpopulation. Molecular manipulation to increase Gb3expression converts noninvasive epithelial cells into cells with aninvasive phenotype, and the molecular alterations that lead to Gb3up-regulation appear to be sufficient for this transformation. Toexplore the role of Gb3 in the growth of human colon cancer celllines established from metastatic lesions, advantage was taken ofthe fact that Gb3 serves as a receptor (12, 13) for the noncatalyticB subunit of Shiga toxin 1 (Stx1B). As in other cells (14), theselective binding and uptake of the Stx1B by Gb3-positive Caco-2cells is shown to cause apoptosis. We also show that intratumoralinjection of Stx1B inhibited colonic tumor growth in the nudemouse model.
Materials and MethodsCell Culture and Human Tissue. Caco-2, T84, OK, and HT29 cellswere from the American Type Culture Collection. Samples ofarchived frozen human tissue included normal distal and proximalcolon (n � 15), nonmalignant colonic adenomas (n � 3), coloncancer without metastases (n � 3), primary lesions of metastaticcolon cancer (n � 5), and colon cancer metastases in liver (n � 2).This study was exempted under the Code of Federal RegulationsTitle 45 Section 46.101(b) by the Hopkins Institution ReviewBoard.
Fluorescence Microscopy. To evaluate the distribution of Gb3, cellsgrown on glass coverslips were incubated for 1 h with 0.5 �g�mlStx1B–Alexa Fluor 488 (Stx1B–488). All experiments, except im-munofluorescence, were performed on living cells mounted in aperfusion chamber (Warner Instruments, Hamden, CT) with
Conflict of interest statement: No conflicts declared.
This paper was submitted directly (Track II) to the PNAS office.
Abbreviations: GSL, glycosphingolipid; Gb3, globotriaosylceramide; Stx1B, B subunitof Shiga toxin 1; siRNA, small inhibitory RNA; scRNA, scrambled RNA; HPTLC, high-performance thin-layer chromatography; LCM, laser capture microdissection; LacCer,lactoceramide.
†To whom correspondence should be addressed at: The Johns Hopkins University School ofMedicine, 720 Rutland Avenue, 925 Ross Research Building, Baltimore, MD 21205-2195.E-mail: [email protected].
© 2005 by The National Academy of Sciences of the USA
www.pnas.org�cgi�doi�10.1073�pnas.0506474102 PNAS � December 27, 2005 � vol. 102 � no. 52 � 19087–19092
MED
ICA
LSC
IEN
CES

Hepes buffer, pH 7.4, at 37°C on the microscope stage, as described(Supporting Materials and Methods, which is published as supportinginformation on the PNAS web site) (15). The quantification of therelative amount of Gb3 in cells and tissue samples is described indetail in Supporting Materials and Methods.
Chemoinvasive Assay. Chemoinvasion was assayed in cell culturechambers by using 24-mm Transwell inserts with 8-�m pore mem-branes (Corning) as described in ref. 16. The membrane bottomswere precoated with 1 �g�ml laminin. Caco-2 cells or nontrans-formed renal proximal tubule OK cells were seeded on the topsurface of the filters. After incubation for 24, 48, or 72 h, cells onboth sides of the membrane were stained, and 0.5-�m confocaloptical sections were taken through the whole membrane thicknesswith a �100 objective lens. The distribution of cells on the top andbottom surfaces of the membrane and numbers of cells wereanalyzed with METAMORPH and VOLOCITY (Improvision, Lexing-ton, MA) image processing software. Five fields were examined ineach membrane.
Gb3 Synthase Knockdown. To affect the silencing of a specific gene,we used the pSUPER vector ligated with small inhibitory RNA(siRNA) oligonucleotides (17). By using the OLIGOENGINE siRNAdesign tool (OligoEngine, Inc., Seattle), five Gb3 synthase cDNAcoding regions suitable for RNA interference were chosen andDNA oligos were obtained. Caco-2 cells are difficult to transfect
with high efficiency by using lipophylic agents. To overcome thisproblem, an adenoviral vector was constructed in collaborationwith the Johns Hopkins Adenoviral Preparation, Purification, andTitering Core Facility, in which the pSUPER siRNA shuttle vectorwith cDNA–GFP (to monitor the efficiency of viral infection) wasligated. Exposure of �50% confluent Caco-2 cells to 1.3 � 1010
particles per ml of adenovirus led to 50% GFP-positive cells, andthis percentage did not increase significantly with higher doses ofthe virus. The Gb3 synthase cDNA oligo forward and reversesequences gatccccCTTCCTGTTCATGTGTGCTCGttcaa-gagaCGAGCACATGAACAGGAAGtttttggaaa and agcttttc-caaaaaCTTCCTGTTCATGTGCTCGtctcttgaaCGAGCACATG-AACAGGAAGggg were the most effective in terms of inhibitionof Gb3 synthesis, which was monitored by both specific Stx1Bbinding and CD77 mAb. The monolayers were inspected by fluo-rescence microscopy, and all GFP-positive cells were Gb3-free by48 h after infection.
For siRNA control experiments, pSUPER vector with scrambledRNA (scRNA) duplex (catalog no. D-1200-05, Dharmacon Re-search, Layfayette, CO) was engineered. Caco-2 cells were infectedwith 1 � 1010 to 2 � 1010 particles per ml scRNA adenovirus. After48 h, cells were used for high-performance thin-layer chromatog-raphy (HPTLC) to assess the changes in Gb3 content or for proteinexpression assay by Western blot.
Laser Capture Microdissection (LCM), GSLs Extraction, and HPTLC. Tocollect a cancer cell population enriched in epithelial cells, the tissue
Fig. 1. Gb3 is expressed in the primary lesions of human metastatic colon cancer and in liver metastases. (A) Normal colonic tissue immunostained against �-catenin(red) and Stx1B–488 (green) to mark Gb3. (B) Normal colonic tissue labeled with CD77 mAb against Gb3 (red) and cholera toxin B subunit to detect GSL GM1 (green).Note that cells in lamina propria but not epithelial cells are Gb3-positive (n � 54 fields of view). (C) Noncancer colonic adenoma immunolabeled against �-catenin (red)and Stx1B–488 (green) for Gb3 (n � 12 fields of view). Note that erythrocytes (yellow, do not have nuclei) but not epithelial cells are Gb3-positive. (D) Nonmetastaticcolon cancer tissue labeled against pankeratin to detect epithelial cells (red) and Gb3 by Stx1B–488 (green) (n � 12 fields). (E) Metastatic colon cancer tissueimmunostained against actin (green) and Gb3 marked by Stx1B–568 (red). (F) Hematoxylin�eosin staining corresponding to sample in E (n � 29 fields). (G) Colon cancermetastases into the liver (n � 17 fields) labeled with Stx1B–488 (green) and mAb against �-catenin (red). (H) Normal liver tissue (n � 10 fields) immunostained withStx1B–488 (green) and against �-catenin (red). Nuclei are stained with Hoechst dye (blue). (I and J) Tissue sample of hematoxylin-stained, nonmetastatic colon cancerbefore LCM (I) and after LCM when cancer epithelial cells were collected (J). (K) HPTLC shows the absence of Gb3 in epithelial cells collected by LCM from nonmetastaticcolon cancer (lane 1) as in D, and Gb3 presence in metastatic colon cancer (lane 2) as in E. Lane 3 shows a mixture of purified markers (10 �g�ml Gb3 and 5 �g�ml LacCer).(L) Relative amount of Gb3 (percentages) in epithelial cells in human tissue normalized to normal colon or liver. Bars: 1, normal colon; 2, noncancer adenomas; 3,nonmetastatic colon cancer; 4, primary lesion of metastatic colon cancer; 5, colon cancer metastases into liver; 6, normal liver. The relative amount of Gb3 in normalcolonic and liver tissue was calculated from analysis of 8-bit fluorescence images as an average of fluorescence intensity per field of view and presented as 100% � SE.TheamountofGb3 incancer tissuewascalculatedsimilarlyandexpressed inpercentages relative tocontrol. TherelativeamountofGb3 significantly (P�0.05) increasedin metastatic tissues compared with normal colon and liver, respectively.
19088 � www.pnas.org�cgi�doi�10.1073�pnas.0506474102 Kovbasnjuk et al.
samples were hematoxylin stained, vacuum dried, and subjected toLCM (P.A.L.M. Microlaser Technologies, Bernried, Germany) byfollowing manufacturer’s protocols. To detect Gb3 in cancer epi-thelial cells, the LCM collected cells from two cases of nonmeta-static and two cases of metastatic colon cancers or from Caco-2 cellsinfected either with small inhibitory Gb3 or scRNA were subjectedto HPTLC as described in detail (Supporting Materials and Meth-ods) (18–20).
Nude Mouse Xenograft Model. The growth of HT29 human coloniccancer cells injected into the flanks of nude mice was determinedwith or without intratumor injection of a fixed amount of Stx1Badministered every 2 days starting 7 days after tumor injection.Initially, effects of s.c. flank injections of various amounts of Stx1Bwere determined on nude mouse mortality and on liver, smallintestine, and kidney histology at the light microscopy level. Allexperiments were conducted according to a protocol approved bythe Johns Hopkins University School of Medicine Animal Care andUse Committee.
Statistics. Data are presented as mean � SEM. Significance wasdetermined by using Student’s t test, and P � 0.05 were consideredstatistically significant.
ResultsGb3 Is Expressed in Colon Cancer Metastases but Not in Normal ColonicTissue, Noncancer Adenomas, and Nonmetastatic Colon Cancer. Tobegin characterizing which types of colon cancer express Gb3,immunofluorescence staining was performed with CD77 Abagainst Gb3 or fluorescently labeled Stx1B, which binds specificallyto Gb3 (21). Gb3 was not expressed in normal colonic epithelial cells(Fig. 1 A and B), nonmalignant colonic adenomas (Fig. 1C), ornonmetastatic primary colon cancers (Fig. 1D). In contrast, as apositive control, another GSL GM1, the cholera toxin B subunitreceptor, was readily detectable on the apical surface of colonocytes(Fig. 1B). Gb3-positive cells were present in some cells in the laminapropria (Fig. 1 A and B) and in erythrocytes (Fig. 1C). In contrast,high levels of Gb3 were expressed in epithelial cells in primarylesions of metastatic colon cancers and in the colon cancer metas-tases to the liver (Fig. 1 E–G). There was no detectable level of Gb3in normal hepatocytes (Fig. 1H). To confirm the data gained byimmunofluorescence, cancer cells from primary lesions of non-metastatic colon cancer (Fig. 1 I and J) or from metastatic sampleswere collected by LCM. LCM was done to decrease contaminationby erythrocytes, endothelial cells, or inflammatory cells, which areknown to express Gb3 (22, 23) (Fig. 1). Collected cells weresubjected to HPTLC, which showed the presence of Gb3 in met-astatic colon cancer samples (Fig. 1K) but its virtual absence innonmetastatic samples. In contrast, lactoceramide (LacCer), aprecursor for many GSLs, including Gb3, was present in both typesof samples. The relative amount of Gb3 in tissue samples wasestimated from immunofluorescence images of tissue double-labeled with Stx1B or CD77 mAb to detect the Gb3 and pankeratinmAb and to ensure that exclusively epithelial cells were included inthe analysis. Quantification of Gb3 fluorescence intensity, whichcorresponds to the relative amount of Gb3 in the sample, showedthat Gb3 is up-regulated in primary lesions of metastatic coloncancer tissue �300% compared with the background autofluores-cence of normal colonic epithelial cells, tubular adenomas, andnonmetastatic cancers (Fig. 1L). Similarly, Gb3 fluorescence inten-sity in colon cancer metastases to the liver was elevated �300%compared with the normal liver (Fig. 1L). This significant Gb3elevation in metastatic colon cancer caused us to examine thepotential role of Gb3 in development of tumor invasiveness.
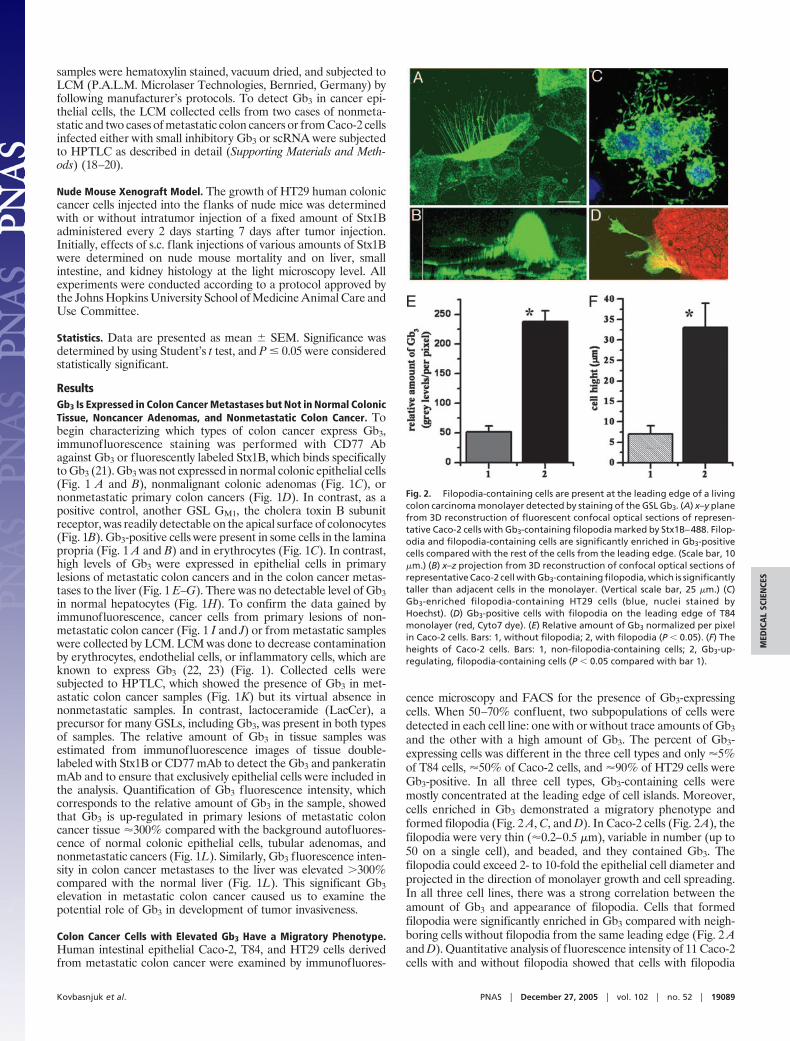
Colon Cancer Cells with Elevated Gb3 Have a Migratory Phenotype.Human intestinal epithelial Caco-2, T84, and HT29 cells derivedfrom metastatic colon cancer were examined by immunofluores-
cence microscopy and FACS for the presence of Gb3-expressingcells. When 50–70% confluent, two subpopulations of cells weredetected in each cell line: one with or without trace amounts of Gb3
and the other with a high amount of Gb3. The percent of Gb3-expressing cells was different in the three cell types and only �5%of T84 cells, �50% of Caco-2 cells, and �90% of HT29 cells wereGb3-positive. In all three cell types, Gb3-containing cells weremostly concentrated at the leading edge of cell islands. Moreover,cells enriched in Gb3 demonstrated a migratory phenotype andformed filopodia (Fig. 2 A, C, and D). In Caco-2 cells (Fig. 2A), thefilopodia were very thin (�0.2–0.5 �m), variable in number (up to50 on a single cell), and beaded, and they contained Gb3. Thefilopodia could exceed 2- to 10-fold the epithelial cell diameter andprojected in the direction of monolayer growth and cell spreading.In all three cell lines, there was a strong correlation between theamount of Gb3 and appearance of filopodia. Cells that formedfilopodia were significantly enriched in Gb3 compared with neigh-boring cells without filopodia from the same leading edge (Fig. 2 Aand D). Quantitative analysis of fluorescence intensity of 11 Caco-2cells with and without filopodia showed that cells with filopodia
Fig. 2. Filopodia-containing cells are present at the leading edge of a livingcolon carcinoma monolayer detected by staining of the GSL Gb3. (A) x–y planefrom 3D reconstruction of fluorescent confocal optical sections of represen-tative Caco-2 cells with Gb3-containing filopodia marked by Stx1B–488. Filop-odia and filopodia-containing cells are significantly enriched in Gb3-positivecells compared with the rest of the cells from the leading edge. (Scale bar, 10�m.) (B) x–z projection from 3D reconstruction of confocal optical sections ofrepresentative Caco-2 cell with Gb3-containing filopodia, which is significantlytaller than adjacent cells in the monolayer. (Vertical scale bar, 25 �m.) (C)Gb3-enriched filopodia-containing HT29 cells (blue, nuclei stained byHoechst). (D) Gb3-positive cells with filopodia on the leading edge of T84monolayer (red, Cyto7 dye). (E) Relative amount of Gb3 normalized per pixelin Caco-2 cells. Bars: 1, without filopodia; 2, with filopodia (P � 0.05). (F) Theheights of Caco-2 cells. Bars: 1, non-filopodia-containing cells; 2, Gb3-up-regulating, filopodia-containing cells (P � 0.05 compared with bar 1).
Kovbasnjuk et al. PNAS � December 27, 2005 � vol. 102 � no. 52 � 19089
MED
ICA
LSC
IEN
CES

express at least 3- to 5-fold more Gb3 per unit of surface area thancells without them (Fig. 2E). Average pixel intensity was 238 � 18gray levels in filopodia-containing cells vs. 52 � 10 gray levels incells without filopodia (P � 0.05). The filopodia-containing cellsalso have larger cell bodies (Fig. 2B). Measurement of the heightof 20 filopodia-containing cells showed (Fig. 2F) that they are�3-fold taller than non-filopodia-containing cells (33 � 6 �m vs.7 � 2 �m, P � 0.05).
Cells Containing Gb3 and Filopodia Are Invasive. The appearance ofcells with filopodia is consistent with their involvement in cellspreading, migration, or invasiveness. Because Gb3-enriched filop-odia-containing cells were detected in colonic cancer cell lines andbecause epithelial cells with higher amounts of Gb3 were anexclusive feature of metastatic colonic cancer, we hypothesized thatthese cells might represent an invasive pool. To test this hypothesis,we applied a standardized chemoinvasive assay (16) that correlateswith metastatic ability in vivo (24). In this assay, the movement of
Caco-2 cells across a filter treated from the bottom side withlaminin, a chemoattractant, was monitored. This assay demon-strated that only filopodia-containing Gb3-enriched cells migrate tothe bottom surface of the filter and do so by the initial movementof filopodia through the filter pores (Fig. 3 A–D).
Filopodia-containing cells that migrated through the filter cre-ated a confluent monolayer of cells. Attempts to clone Gb3-enriched Caco-2 cells resulted in formation of cell monolayer withonly �50% Gb3-containing cells, similar to that in wild-type Caco-2monolayers. Analysis of the expression of the Gb3 synthase mRNA,an enzyme responsible for Gb3 synthesis (22, 25), in the subpopu-lation of Gb3-negative vs. Gb3-up-regulating Caco-2 cells (Fig. 6 Aand B, which is published as supporting information on the PNASweb site) showed the presence of Gb3 synthase mRNA in both celltypes, with only a nonsignificant 1.4-fold elevation in Gb3-enrichedcells (Supporting Materials and Methods). This result indicates thatthe invasive subpopulation of cells does not occur because of thedifferential expression of the Gb3 synthase gene but, rather, becauseof the regulation of protein and�or lipid expression by uncharac-terized signal transduction mechanisms.
Gb3 Is Necessary for Colon Cancer Cell Invasiveness. One way tofurther explore the role of Gb3 in invasiveness is to inhibit Gb3synthesis in colon cancer cells and determine the impact on cellinvasiveness. There are no specific inhibitors of Gb3 synthesis (26).Thus, to address this question, we used siRNA (17) to knock downthe Gb3 synthase gene (siGb3). For these experiments, Caco-2 cellswere infected with adenovirus containing siGb3 to silence the Gb3synthase gene and thus prevent Gb3 synthesis (Fig. 3E). To ensure
Fig. 3. Gb3 is necessary for the development of the invasive cell phenotype:chemoinvasive assay. Confocal optical sections of Caco-2 and OK cells grownon Transwell filters from the top surface to bottom. Green indicates cells thatwere stained with Stx1B–488. (A) Confluent monolayer of Caco-2 cells on thetop of filter. (B) Section through the filter. (C and D) Gb3-enriched, filopodia-containing cells invading the bottom surface of filter (note the initial appear-ance of filopodia, arrows). (E) Caco-2 cells infected with Gb3 synthase siRNAplus GFP (green) do not have Gb3 and do not bind Stx1B–568 (red) 72 h afterinfection. Note cells are either red or green. (F) x–z section through the filtershows that these GFP-positive, Gb3-free cells do not invade the bottom surfaceof the filter because of siGb3. (G) HPTLC detected a decrease in the relativeamount of Gb3 in siGb3-infected Caco-2 cells (lane 1) vs. scRNA-infected cells(lane 2). Lane 3 shows the standard, which contains a mixture of 30 �g ofpurified LacCer and 30 �g of Gb3.
Fig. 4. Gb3 is sufficient for the development of the invasive cell phenotype:chemoinvasive assay. (A) Subconfluent OK cells labeled by Cyto7 dye (red) donot express Gb3, do not bind Stx1B–488, and do not form filopodia on theleading edge. (B) OK cells do not invade the bottom surface of the membranebut form only a monolayer on the top surface of the filter. (C) OK cellstransfected with Gb3 synthase bind Stx1B–488 and form Gb3-enriched filop-odia (green). (D) Only Gb3-expressing OK cells (green) invaded the bottomsurface of the filter. (E) RT-PCR detects the presence of 428 bp of Gb3 synthasemRNA in OK cells transfected with human Gb3 synthase cDNA; Lanes: 1,control, nontransfected OK cells do not express Gb3 synthase; 2, Gb3 synthasemRNA is present in transfected OK cells, which express Gb3; 3, a base pairstandard, with arrows indicating 400- and 500-bp markers.
19090 � www.pnas.org�cgi�doi�10.1073�pnas.0506474102 Kovbasnjuk et al.

the specificity of siGb3 knockdown, Caco-2 cells were also infectedwith scRNA-containing viral vector. The effect of siGb3 andscRNA on the relative amount of Gb3 was assessed 48 h later byusing HPTLC (Fig. 3G). The amount of Gb3 in siGb3 infected cellswas 57 � 18%, significantly (P � 0.05, n � 3) lower than that inscRNA infected cells (100 � 21%). In contrast, the amount of�-catenin, adenomatous polyposis coli protein, epithelial sodium-proton exchanger 2, and GAPDH (Fig. 7, which is published assupporting information on the PNAS web site) did not differ in thetwo types of infection.
For the chemoinvasive assay, confluent Caco-2 cells grown onTranswell membranes were infected with adenovirus containingsiGb3 and GFP. All cells that migrated through the pores in themembrane before the infection were scraped off 24 h after infec-tion. The numbers of Gb3-positive cells vs. the GFP-positive,Gb3-free cells that migrated through the filter were counted 72 and120 h after infection. Analysis of 15 fields of view in threemembranes showed that from 3 to 10 cells per field migratedthrough the filter 72 h after infection and all of them wereGb3-positive (Fig. 3F). In contrast, all GFP-positive, Gb3-free cellsremained on top of the membrane and did not migrate, even 120 hafter infection (Fig. 3F). We conclude that Gb3 expression isnecessary for Caco-2 cells to invade and that down-regulation ofGb3 by inhibition of Gb3 synthase through siGb3 prevents cellmigration.
Gb3 Is Sufficient for Epithelial Cell Invasiveness. To test whether Gb3expression is sufficient for epithelial cells to invade, we studied OKcells, which do not endogenously express Gb3, do not bind Stx1B(Fig. 4A), and are not invasive based on the fact they do not migratethrough the membrane pores (Fig. 4B). These cells were transientlytransfected with a Gb3 synthase cDNA (Supporting Materials andMethods) (22), shown to express Gb3 synthase (Fig. 4E), and thentested by chemoinvasive assay. Gb3-expressing OK cells formedGb3-positive filopodia on the leading edge of growing monolayers(Fig. 4C) similar to that in T84, Caco-2, and HT29 cells. Moreover,as shown by the chemoinvasive assay (Fig. 4D), OK cells nowpenetrated through the filter. Importantly, only Gb3-positive OKcells penetrated through the filter, whereas cells without Gb3 fromthe same monolayer (Fig. 4D) and control cells transfected onlywith empty vector did not migrate through the filter at all andbehaved similarly to the nontransfected cells (Fig. 4B).
B Subunit of Shiga Toxin Selectively Kills Gb3-Positive Colon CancerCells in Cell Culture Models and Mouse Xenographs. It has been shownthat the noncatalytic Stx1B triggers apoptosis of Gb3-expressingBurkitt’s lymphoma cells (14). To test whether Stx1B selectivelycauses apoptosis in Gb3-positive colonic cells, T84 cells wereexposed to Stx1B for up to 168 h. Mitochondria were monitored asa viability control by using tetramethylrodamine (7, 27). After 24 hof exposure to Stx1B, virtually all T84 cells that lacked Gb3 and,thus, did not internalize Stx1B had active mitochondria (Fig. 8A,which is published as supporting information on the PNAS website). However, cells that accumulated Stx1B had inactive mito-chondria. Incubation of T84 monolayers with Stx1B for longer timesled to elimination of Gb3-positive cells (Fig. 8B). In contrast, in thesame monolayer, cells that did not take up Stx1B had activemitochondria and survived. In addition, OK cells, which do notexpress Gb3, were resistant to Stx1B-mediated apoptosis (Fig. 8 Cand D). Stx1B-mediated apoptosis of Caco-2 cells was also con-firmed by the DNA-laddering assay (Fig. 8E) (28). We concludethat Stx1B selectively kills Gb3-expressing cells.
To test whether Stx1B affects growth of colonic tumors thatcontain Gb3, we used the nude mouse xenograph model (29). Thenontoxic dose of Stx1B was first determined in mice (two each)injected s.c. with Stx1B 10 �g�kg, 50 �g�kg, 100 �g�kg, and 200�g�kg. By day 20 after the Stx1B injection, none of the animals diedor appeared ill. These mice were euthanized by CO2 inhalation. Theliver, small intestine, and kidney were shown to be histologicallynormal (data not shown). Then nude mice (n � 10 animals) wereinjected s.c. in their flanks with 1 � 107 HT29 human colon cancercells. When tumors reached 0.3 cm in diameter (�7 days afterinjection), mice were divided into two groups: the control group(n � 5 mice), in which tumors were injected with PBS only, and atest group, in which tumors on one flank were injected every otherday with a nontoxic dose of Stx1B (50 �g�kg, n � 6 mice) andtumors on the other flank were injected with an equal volume ofPBS. Animals were monitored over 7 weeks, by which time sometumors reached �1.5 cm size, and the animals had to be euthanizedaccording to our animal protocol. As shown in Fig. 5A, Stx1Binjections significantly inhibited tumor growth in nude mice. Ex-amination of tumors for the presence of apoptotic cells using theTUNEL assay (28) showed that there were many apoptotic cells inStx1B-injected tissue (Fig. 5B), whereas only a few apoptotic cellsper tumor were detected in tumors injected with PBS (Fig. 5C).These data show that the B subunit of Stx1 alone causes apoptoticdeath of Gb3-positive human colon cancer cells.
DiscussionWe have identified a subpopulation of invasive colon cancer cellsbased on molecular and phenotypic characteristics. Analysis ofmetastatic human colon cancer tissue samples showed that signif-icant up-regulation of the GSL Gb3 was associated with develop-ment of metastasis. A similar subpopulation of cells with high levels
Fig. 5. An example of inhibition of HT29 colon cancer cell tumor growth innude mice by Stx1B. (A) HT29 tumor on one flank was injected with Stx1B,whereas the other flank was injected with PBS. Nontreated tumor (blacksquares) substantially outgrew Stx1B-treated tumor (red dots), which stoppedincreasing in size �7 days after the beginning of Stx1B injections. (B) TUNEL(green) staining of HT29 tumor injected with Stx1B shows that Stx1B causedapoptotic death of tumor cells; cell nuclei stained by propidium iodide are red.(C) HT29 tumor not treated with Stx1B does not have TUNEL-positive greencells. Orange is an overlay color caused by the yellow autofluorescence bytumor cells and their labeling by propidium iodide (red). The dark area ismouse tissue that surrounds the tumor.
Kovbasnjuk et al. PNAS � December 27, 2005 � vol. 102 � no. 52 � 19091
MED
ICA
LSC
IEN
CES

of Gb3 expression and a migratory phenotype was found in threecolon cancer cell lines established from metastatic human coloncancers. These cell lines may serve as a model for invasivenessdevelopment in a cancer cell population. It has been shown that theepithelial cells in human colon lack detectable Gb3 (23, 30). Thisfinding is in good agreement with our data that Gb3 is virtuallyabsent from normal colonic epithelial cells but is present in coloncancer in its metastatic stage.
Gb3 has been associated with other human cancers and wasidentified as the Burkitt’s lymphoma antigen (31). Elevated expres-sion of Gb3 was also detected in astrocytoma cell lines (32) and inseveral highly metastatic types of human tumors, including ovarianand breast cancers (33). Significant Gb3 accumulation was alsopreviously reported in testicular seminoma, which correlated withthe metastatic potential (34, 35). These data support our findingthat Gb3 expression is a marker for colonic epithelial tumor celltransformation from primary cancer into the metastatic stage andindicate that several types of invasive tumors may have commonmechanisms for metastasis.
Mechanistic studies of the role of Gb3 in metastases wereperformed on cell culture models. Our data demonstrate that Gb3overexpression is necessary and sufficient for the appearance ofcells with an invasive phenotype. In colon carcinoma epithelial cells,the presence of Gb3-containing filopodia correlates with cell inva-siveness. Filopodia are used to penetrate through the permeablesupport in a chemoinvasive assay. Importantly, elimination of Gb3from colon cancer cells by Gb3-synthase siRNA knockdown, whichwas verified by the Stx1B binding assay, completely inhibited cellmigration. This result shows that Gb3 is necessary for cell invasive-ness. Introduction of human Gb3-synthase into nontransformed,noninvasive OK cells that do not synthesize endogenous Gb3induced Gb3 and converted noninvasive epithelial cells into invasivecells. Thus, the presence of Gb3 was also sufficient to induce theinvasive phenotype in nontransformed cells.
Failure of Caco-2 cells to maintain the migratory phenotypewhen Gb3-enriched cells separated by FACS were cultured showsthat Gb3-enriched invasive cells do not represent separate clones.This result indicates that changes in signal transduction pathways,which lead to Gb3 expression due to some as yet unknown mech-anisms, rather than genetic alterations alone, are responsible forappearance of the invasive pool among the population of coloncancer cells.
Gb3 expression can be driven by several molecular mechanismsthat do not exclude but rather complement each other. Onepossibility is that the enzyme Gb3 synthase (�1,4-galactosyltrans-
ferase), which catalyzes the transfer of galactose to LacCer, andproduces Gb3, is significantly up-regulated during cancer progres-sion from the noninvasive stage into the invasive stage. Human Gb3synthase has recently been cloned (22, 25). Although expression ofGb3 synthase has not yet been reported in metastatic vs. normalcolonic epithelial tissue using gene arrays (Oncomine Cancer arraydatabase), the absence of a significant difference in the amount ofGb3 synthase mRNA between Caco-2 with up-regulated Gb3 andCaco-2 without a detectable amount of Gb3 make this mechanismvery unlikely to be responsible for the appearance of Gb3-positivecancer epithelial cells. Other mechanisms, such as differences in theamounts of Gb3 synthase enzyme or its activity, may be responsiblefor the transition of noninvasive colon cancer cells into invasiveand�or metastatic cells.
Gb3 is best known as the receptor for the B subunit of Shiga toxin1. Our data show that, similarly to that in Gb3-positive Burkitt’slymphoma cells (14), Stx1B selectively kills the subpopulation ofGb3-up-regulating colonic epithelial cells, which possess invasivepotential. Next, we tested whether the ability of Stx1B to causeapoptosis might be used against colon cancer tumors grown in nudemice. Treatment of HT29 cell tumors in nude mice with Stx1Bsubstantially inhibited tumor growth compared with nontreatedcontrol tumors, and, after �10 days, Stx1B treatment stabilized thetumor size, whereas nontreated tumors continued to increase insize. Thus, application of Stx1B or Stx1B linked to other morepotent antitumor agents might be an approach to target the specificGb3-expresing subpopulation of cells in human metastatic coloncancers.
In summary, the expression of the GSL Gb3 strongly correlateswith the metastatic potential of human colon cancer. Gb3-enrichedcolon cancer cells represent an invasive subpopulation, and Gb3expression is necessary and sufficient for this invasiveness in cellculture models. The overexpression of Gb3 makes it a possiblemarker for detection of a potentially invasive cell subpopulation incolon cancer.
We thank Drs. Raben and Schnaar for assistance with HPTLC exper-iments; Dr. Clausen (University of Copenhagen, Copenhagen) for Gb3synthase pcDNA3.1 vector; Drs. Caterina, Nealen, and Agami forproviding the pSUPER adenoviral construct with scRNA; andOksana Gutsal for LCM cell preparations. This work was supported byNational Institutes of Health Grants RO1DK58928, R24DK064388 (tothe Hopkins Basic Research Digestive Disease Development CoreCenter), and P30DK 34928 (to the Center for Gastroenterology Re-search on Absorptive and Sectretory Processes).
1. Gorlick, R. & Bertino, J. (1999) Semin. Oncol. 26, 606–611.2. Yokota, J. (2000) Carcinogenesis 121, 497–503.3. Srivastava, S., Verma, M. & Henson, D. E. (2001) Clin. Cancer Res. 7, 1118–1126.4. Ridley, A. (2000) Nature 406, 466–467.5. Hakomori, S. (1989) Adv. Cancer Res. 52, 257–331.6. Hakomori, S. (1996) Cancer Res. 56, 5309–5318.7. Hakomori, S. (2001) Adv. Exp. Med. Biol. 491, 369–402.8. Kawamura, S., Ohyama, C., Watanabe, R., Satoh, M., Saito, S., Hoshi, S., Gasa, S.
& Orikasa, S. (2001) Int. J. Cancer. 94, 343–347.9. Mirkin, B. L., Clark, S. H. & Zhang, C. (2002) Cell Prolif. 35, 105–115.
10. Li., R, Manella, J., Kong., Y. & Ladisch S. (2000) J. Biol. Chem. 275, 34213–3422311. Hakomori, S. (2002) Proc. Natl. Acad. Sci. USA 99, 10231–10233.12. Jacewicz, M., Clausen, H., Nudelman, E., Donohue-Rolfe, A. & Keusch, G. T. (1986)
J. Exp. Med. 163, 1391–1404.13. Lindberg, C. A., Brown, J. E., Stromberg, N., Westling-Ryd, M., Schultz, J. E. &
Karlson, K. (1987). J. Biol. Chem. 262, 1779–1785.14. Gordon, J., Challa, A., Levens, J. M., Gregory, C. D., Williams, J. M., Armitage, R. J.,
Cook, J. P., Roberts, L. M. & Lord, J. M. (2000) Cell Death Differ. 7, 785–794.15. Kovbasnjuk, O., Edidin, M. & Donowitz, M. (2001) J. Cell Sci. 114, 4025–4031.16. Saiki, I., Murata, J., Nakajima, M., Tokura, S. & Azuma, I. (1990) Cancer Res. 50,
3631–3637.17. Elbashir, S. M., Harborth, J., Lendeckel, W., Yalcin, A., Weber, K. & Tuschl, T.
(2001) Nature 411, 494–498.18. Hoey, D. E., Sharp, L., Currie, C., Lingwood, C. A., Gally, D. L. & Smith, D. G. (2003)
Cell. Microbiol. 5, 85–97.19. Schnaar, R. L. (1994) Methods Enzymol. 230, 348–370.20. Schnaar, R. L. & Needham, L. K. (1994) Methods Enzymol. 230, 371–389.
21. Ling, H., Boodhoo, A., Hazes, B., Cummings, M. D., Armstrong, G. D., Brunton, J.L & Read, R. J. (1998) Biochemistry 37, 1777–1788.
22. Steffensen, R., Carlier, K., Wiels, J., Levery, S. B., Stroud, M., Cedergren, B., NilssonSojka, B., Bennett, E. P, Jersild, C. & Clausen, H. (2000) J. Biol. Chem. 275,16723–16729.
23. Schuller, S., Frankel, G. & Phillip, A. D. (2004) Cell Microbiol. 6, 289–301.24. Muller, A., Home, B., Sot, H, Ge, N. F. Catron, D., Buchanan, M. E, McClanahan,
T., Murphy, E., Yuan, W., Wagner, S. N., et al. (2001) Nature 410, 50–56.25. Kojima, Y., Fukumoto, S., Furukawa, K., Okajima, T., Wiels, J., Yokoyama, K.,
Suzuki, Y., Urano, T., Ohta, M. & Furukawa, K. (2000) J. Biol. Chem. 275,15152–15156.
26. Lavie, Y., Cao, H., Volne, A., Lucci, A., Han, T. Y., Geffen, V., Giuliano, A. E. &Cabot, M. C. (1997) J. Biol. Chem. 272, 1682–1687.
27. Susin, S. A., Lorenzo, H. K., Zamzami, N., Marzo, I., Brenner, C., Larochette, N.,Prevost, M. C., Alzari, P. M. & Kroemer, G. (1999) J. Exp. Med. 189, 381–394.
28. Ashkenazi, A. & Dixit, V. M. (1998) Science 281, 1305–1308.29. Park, B. H., Vogelstein, B. & Kinzler, K. W. (2001) Proc. Natl. Acad. Sci. USA 98,
2598–2603.30. Holgersson, J., Jovell, P. A. & Breimer, M. E. (1991) J. Biochem. (Tokyo) 110, 120–131.31. LaCasse, E. C., Bray, M. R., Patterson, B., Lim, W. M., Perampalam, S., Radvanyi,
L. G., Keating, A., Stewart, A. K., Buckstein, R., Sandhu, J. S., et al. (1999) Blood 94,2901–2910.
32. Arab, S., Rutka, J. & Lingwood, C. (1999) Oncol. Res. 11, 33–39.33. Arab, S., Russel, E. & Chapman, W. B. (1997) Oncol. Res. 9, 553–563.34. Ohyama, C., Fukushi, Y., Satoh, M., Saitoh, S., Orikasa, S., Nudelman, E., Straud,
M. & Hakomori, S. (1990) Int. J. Cancer 45, 1040–1044.35. Ohyama, C., Orikasa, S., Kawamura, S., Satoh, M., Saito, S., Fukushi, Y., Levery, S. B.
& Hakomori, S. (1995) Cancer 76, 1043–1050.
19092 � www.pnas.org�cgi�doi�10.1073�pnas.0506474102 Kovbasnjuk et al.