The Global Health Cost of Ambient PM₂.₅ Air Pollution
51
The Global Health Cost of Ambient PM₂ . ₅ Air Pollution
-
Upload
khangminh22 -
Category
Documents
-
view
5 -
download
0
Transcript of The Global Health Cost of Ambient PM₂.₅ Air Pollution
The Global Health Cost of Ambient PM2.5
Air Pollution 1
The Global Health Cost of Ambient PM₂.₅ Air Pollution
The Global Health Cost of Ambient PM₂.₅ Air Pollution
© 2020 International Bank for Reconstruction and Development / The World Bank
1818 H Street NW Washington DC 20433 202-473-1000www.worldbank.org
This work is a product of the staff of The World Bank with external contributions. The findings,
interpretations, and conclusions expressed in this work do not necessarily reflect the views of The
World Bank, its Board of Executive Directors, or the governments they represent. The World Bank
does not guarantee the accuracy, completeness, or currency of the data included in this work and
does not assume responsibility for any errors, omissions, or discrepancies in the information, or
liability with respect to the use of or failure to use the information, methods, processes, or con-
clusions set forth. The boundaries, colors, denominations, and other information shown on any
map in this work do not imply any judgment on the part of The World Bank concerning the legal
status of any territory or the endorsement or acceptance of such boundaries.
Nothing herein shall constitute or be construed or considered to be a limitation upon or waiver
of the privileges and immunities of The World Bank, all of which are specifically reserved.
Rights and Permissions The material in this work is subject to copyright. Because The World Bank encourages dissemina-
tion of its knowledge, this work may be reproduced, in whole or in part, for noncommercial pur-
poses as long as full attribution to this work is given. Any queries on rights and licenses, including
subsidiary rights, should be addressed to World Bank Publications, The World Bank Group, 1818 H
Street NW, Washington, DC 20433, USA; fax: 202-522-2625; e-mail: [email protected].
Cover photo Tatiana Grozetskaya / Shutterstock
Sample credit for a non-WB image © Ami Vitale / Panos Pictures. Used with the permission
of Ami Vitale / Panos Pictures. Further permission required for reuse.
Sample credit for a WB image © Curt Carnemark / World Bank. Further permission required for reuse.
Report design Spaeth Hill
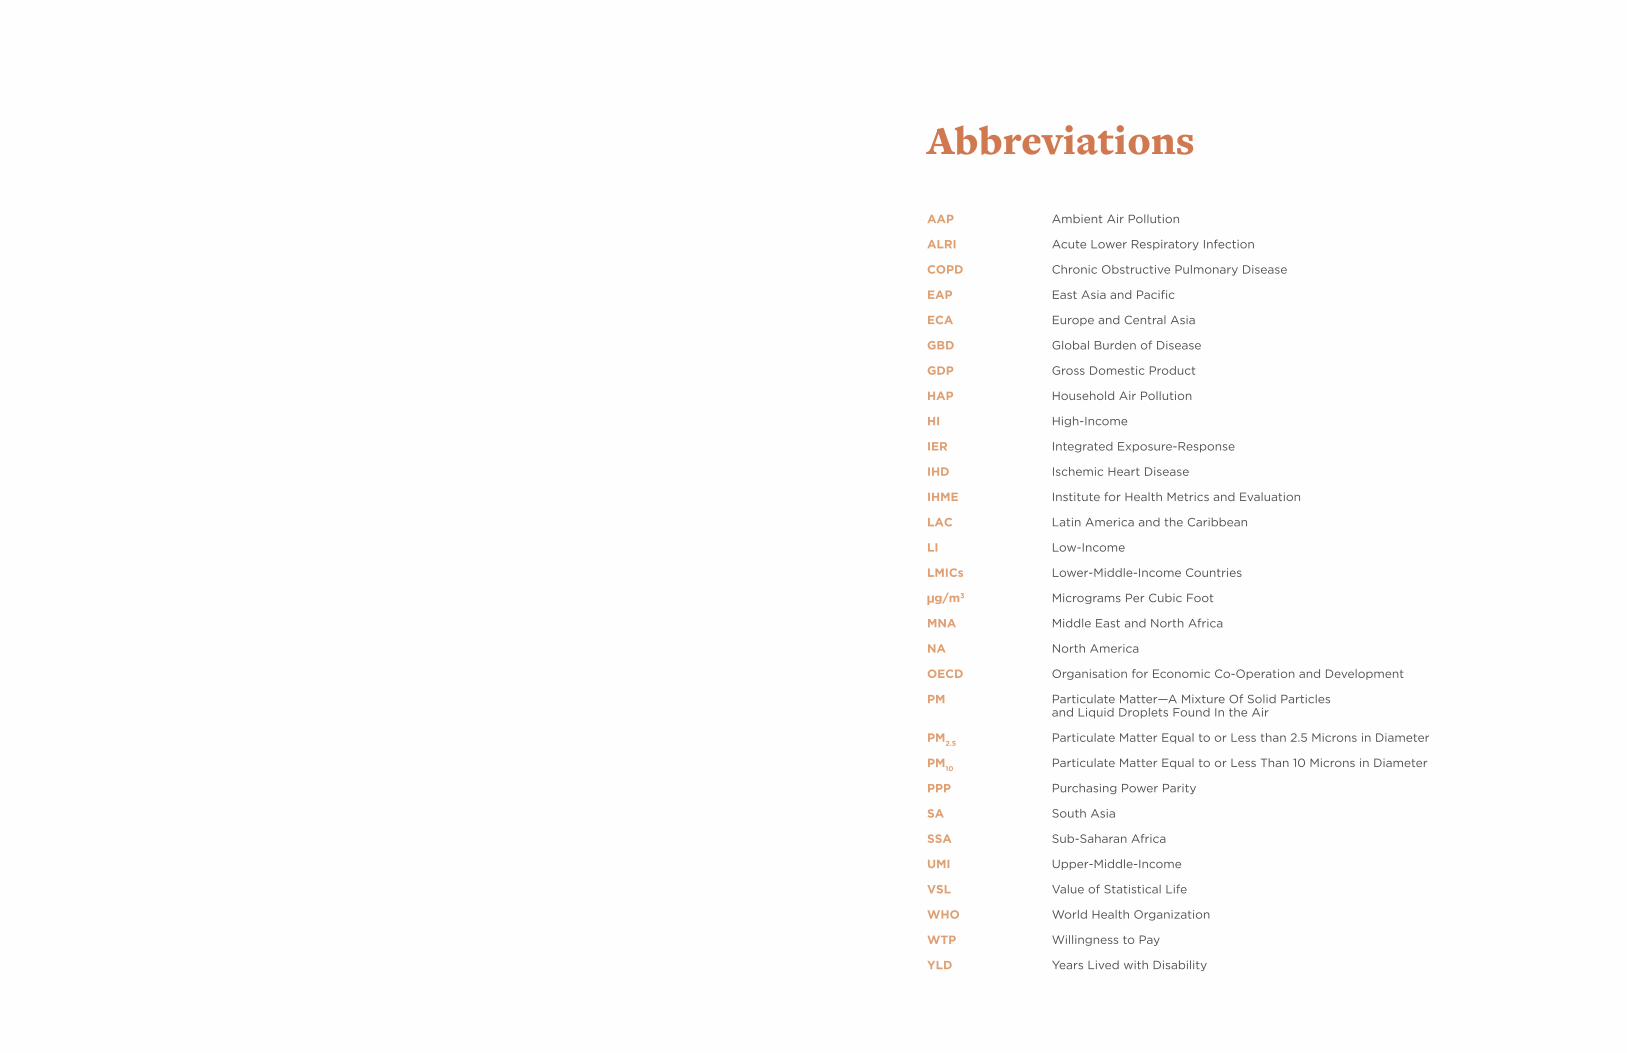
Abbreviations
AAP
ALRI
COPD
EAP
ECA
GBD
GDP
HAP
HI
IER
IHD
IHME
LAC
LI
LMICs
µg/m3
MNA
NA
OECD
PM
PM2.5
PM10
PPP
SA
SSA
UMI
VSL
WHO
WTP
YLD
Ambient Air Pollution
Acute Lower Respiratory Infection
Chronic Obstructive Pulmonary Disease
East Asia and Pacific
Europe and Central Asia
Global Burden of Disease
Gross Domestic Product
Household Air Pollution
High-Income
Integrated Exposure-Response
Ischemic Heart Disease
Institute for Health Metrics and Evaluation
Latin America and the Caribbean
Low-Income
Lower-Middle-Income Countries
Micrograms Per Cubic Foot
Middle East and North Africa
North America
Organisation for Economic Co-Operation and Development
Particulate Matter—A Mixture Of Solid Particles and Liquid Droplets Found In the Air
Particulate Matter Equal to or Less than 2.5 Microns in Diameter
Particulate Matter Equal to or Less Than 10 Microns in Diameter
Purchasing Power Parity
South Asia
Sub-Saharan Africa
Upper-Middle-Income
Value of Statistical Life
World Health Organization
Willingness to Pay
Years Lived with Disability
Table of Contents
ACKNOWLEDGMENTS 13
EXECUTIVE SUMMARY 15
INTRODUCTION AND OBJECTIVES 25
CONTEXT AND VALUE-ADDED OF THIS REPORT 29
EVOLUTION OF ESTIMATES OF POPULATION EXPOSURE TO AMBIENT PM
2.5 33
CURRENT AMBIENT PM2.5
POPULATION EXPOSURE 39
RISKS OF HEALTH DAMAGES FROM AMBIENT PM2.5
EXPOSURE 43
GLOBAL HEALTH DAMAGES OF AMBIENT PM2.5
EXPOSURE 47
GLOBAL COST OF AMBIENT PM2.5
EXPOSURE 57
CONCLUSIONS 61
APPENDIXES 65
REFERENCES 94
FIGURE 10 Global Number of Deaths from Ambient PM2.5 Air Pollution in 2016 48
FIGURE 11 Share of Global Deaths from Ambient PM2.5 Air Pollution in 2016 48
FIGURE 12
Global Deaths from Ambient PM2.5 Air Pollution as a Share of All Global Deaths in 2016 49
FIGURE 13 Global Number of Deaths from Ambient PM2.5 Exposure by Region in 2016 49
FIGURE 14 Global Number of Deaths from Ambient PM2.5 Exposure by Income Group in 2016 51
FIGURE 15 Number of Deaths from Ambient PM2.5 Exposure per 100,000 Population in 2016 by Region 51
FIGURE 16 Number of Deaths from Ambient PM2.5 Exposure per 100,000 Population in 2016 by Income Group 52
FIGURE 17 Deaths from Ambient PM2.5 Exposure as a Share of All Deaths in 2016 by Region 54
Figures & Tables
FIGURE 1 Annual Cost of Health Damage from Ambient PM2.5 Exposure, % Equivalent of GDP in 2016 by Region 18
FIGURE 2 Annual Cost of Health Damage from Ambient PM2.5 Exposure, % Equivalent of GDP in 2016 by Income Group 19
FIGURE 3 Ground-Level Monitoring Stations in Absolute Numbers by Country Income Level 34
FIGURE 4 Ground-Level Monitoring Stations in Absolute Numbers by Region 35
FIGURE 5 Million People per Ground-Level Monitoring Station by Country Income Level 35
FIGURE 6 Million People per Ground-Level Monitoring Station by Region 36
FIGURE 7 Regional Population-Weighted Ambient PM2.5 Exposure in 2016 39
FIGURE 8 Population-Weighted Ambient PM2.5 Exposure by Country Income Group in 2016 40
FIGURE 9 Relative Risks of Major Health Outcomes Associated with PM2.5 Exposure, GBD 2016 Study 44
FIGURE 18 Deaths from Ambient PM2.5 Exposure as a Share of All Deaths in 2016 by Income Group 54
FIGURE 19 Annual Cost of Health Damage from Ambient PM2.5 Exposure, % Equivalent of GDP in 2016 by Region 58
FIGURE 20 Annual Cost of Health Damage from Ambient PM2.5 Exposure, % Equivalent of GDP in 2016 by Income Group 58
Figures & Tables (cont.)
TABLE 1 Global Welfare Cost of Air Pollution, $, Trillions, per Year 26
TABLE 2 Number of Deaths from Ambient PM2.5 by Region and Country in 2016 50
TABLE 3 Number of Deaths from Ambient PM2.5 per 100,000 Population in 2016 by Country 53
TABLE 4 Number of Deaths from Ambient PM2.5 per 100,000 Population in 2016 by Country 55
TABLE 5 Annual Cost of Health Damages from Ambient PM2.5 by Country, % Equivalent of GDP in 2016 59
TABLE 6 Annual Health Damages and Costs of Ambient PM2.5, 2016 65
TABLE 7 Years of Life Lived with Disability (YLD) from Ambient PM2.5 in 2016 81
12World Bank Group The Global Health Cost of Ambient PM2.5
Air Pollution 13
Acknowledgments
This report was prepared by a team led by Yewande Awe with the core team com-
prising Bjorn Larsen, Shafick Hoossein, and Ernesto Sánchez-Triana. The background
document for this report was prepared by Bjorn Larsen.
The team would like to acknowledge, with thanks, the valuable advice and inputs of
the peer reviewers: Stephen Dorey, Fernando Loayza, Jostein Nygard, Helena Naber,
Katelijn Van den Berg, and Martin Heger. This report also benefitted from comments
provided by the following colleagues: Marcelo Bortman, Carter Brandon, Urvashi
Narain, Lek Kadeli, Tamer Rabie, Momoe Kanada, Maria Sarraf, and Hocine Chalal.
This report is a product of the Environment, Natural Resources and Blue Economy
Global Practice of the World Bank. This work was conducted under the supervision of
Juergen Voegele (Vice President, GGSVP); Karin Kemper (Global Director, SENDR);
Julia Bucknall (Global Director, SESD2); Benoit Bosquet (Regional Director, SEADR);
Benoit Blarel (Lead Environment Specialist, SENDR); Iain Shuker (Acting Practice
Manager, SENGL); and Christian Albert Peter (Practice Manager, SENGL).
The financial support provided by the Pollution Management and Environmental
Health multi-donor trust fund of the World Bank, for the preparation of this report,
is gratefully acknowledged.
14Executive Summary The Global Health Cost of Ambient PM2.5
Air Pollution 15
Executive Summary
Air pollution is a major cause of death and disease. Ambient air pollution refers to the
contamination of outdoor air; household air pollution refers to the contamination of
indoor air. Ambient (or outdoor) air pollution is the world’s leading environmental risk
to health and the cause of morbidity and mortality from diseases such as ischemic heart
disease (IHD), lung cancer, chronic obstructive pulmonary disease (COPD), stroke, and
pneumonia. The majority of deaths related to air pollution are caused by human exposure
to fine inhalable particles or fine particulate matter, also known as PM2.5
. “Particulate mat-
ter” is a mixture of solid particles and liquid droplets found in the air, and “fine particulate
matter (PM2.5
)” is particulate matter equal to or less than 2.5 microns in diameter.
Many people in developing countries live with ambient concentrations of PM2.5
that are
multiple times higher than the health-based guideline values for ambient air quality
established by the World Health Organization (WHO). About 90 percent of deaths
related to air pollution occur in lower-middle-income countries (LMICs) where outdoor air
pollution is driven by rapid urbanization, increased motorization and energy use, and the
burning of wastes and solid fuels.
An estimated 4.1 million people worldwide died prematurely in 2016 because of exposure to
ambient PM2.5
. About 90 percent of those deaths occurred in LMICs (GBD 2016 Risk Fac-
tors Collaborators 2017). The Global Burden of Disease (GBD) studies referred to in this
report will be cited as “GBD” followed by the year associated with that particular set of
GBD studies. Two-thirds of those deaths occurred in East Asia and Pacific and South Asia.
China and India accounted for 52 percent of global deaths from ambient PM2.5
. There
were 11 countries with 50,000 or more deaths from ambient PM2.5
and five countries with
more than 100,000 deaths.
Besides being a health problem, ambient air pollution contributes to less-livable condi-
tions in cities and hinders economic competitiveness. Poor people are more likely to live in
a polluted environment and suffer the adverse impacts of air pollution. In addition, people
who are sick as a result of exposure to air pollution are more likely to take days off work
and suffer reduced productivity, which in turn undermines their contributions to econom-
ic growth. Air pollution could also hinder cities’ ability to attract talented workers, thereby
reducing competitiveness. Furthermore, air pollution imposes a heavy economic burden
both on the economies of individual LMICs and on the global economy as a result of pre-
mature death, illness, lost earnings, and increased health care expenditures—all of which
constrain productivity and economic growth. Poor people who have the least means
to address the health damage of air pollution often disproportionately carry the
economic burden.
16Executive Summary The Global Health Cost of Ambient PM2.5
Air Pollution 17
Air pollution is also associated with many detrimental but less researched health im-
pacts and conditions (Sánchez-Triana et al. 2015), such as infant mortality (Heft-Neal et
al. 2018), low birth weight (Ezziane 2013), preterm delivery, diabetes (Bowe et al. 2018),
mental health (Shin et al. 2018), and neurological impairment (Xu et al. 2016; Zhang et al.
2018) including dementia in later life (Carey et al. 2018). As the evidence base for these
and other conditions becomes stronger, it is envisaged that exposure-response functions
can be developed to obtain global estimates of the health burden of air pollution.
Some air pollutants, notably short-lived climate pollutants such as black carbon, have
climate-warming properties (Shindell et al. 2012; World Bank 2020a). In addition, air pol-
lution (particularly linked to sulfur dioxide) adversely affects the environment, resulting in
acid rain and associated land and water pollution. Air pollution also has aesthetic impacts
such as reduced visibility. However, economic valuation of these impacts can be done
only at local and regional levels. Further research is needed to determine how to effec-
tively conduct an economic valuation of these impacts at the global level.
Air pollution’s various adverse impacts on multiple facets of the society and economy,
particularly of LMICs, squarely place air pollution as a core development challenge. This
makes reducing air pollution in developing countries central to achieving poverty reduc-
tion and equitable prosperity objectives in those countries.
Global health crises further highlight the need for continued action in addressing a global
and cross-cutting challenge such as air pollution. The current global COVID-19 pandemic,
caused by the novel coronavirus SARS-CoV-2, underscores the importance of reducing
air pollution through preventive and abatement measures. People who contract COVID-19
and have underlying medical problems such as heart disease, lung disease, and cancer
are at a higher risk of developing serious illnesses that could lead to death. It is note-
worthy that air pollution is a cause of the aforementioned diseases. Ongoing research
is finding relationships between air pollution and the incidence of illness and death due
to COVID-19. Such research suggests that PM2.5
air pollution plays an important role in
increased COVID-19 incidence and death rates. One such study reported that PM2.5
is a
highly significant predictor of the number of confirmed cases of COVID-19 and related
hospital admissions (Andrée 2020).
This report provides an estimate of the global, regional, and national costs of health
damage—that is, premature mortality and morbidity—from exposure to ambient PM2.5
air pollution in 2016. While recognizing the various costs of air pollution to society, this
report focuses on the cost of premature mortality and morbidity due to ambient air pol-
lution, the world’s leading environmental health risk. Estimating the health damage of
air pollution in monetary terms provides a suitable metric for policy makers and deci-
sion-makers in developing countries to prioritize the design and implementation of pol-
icies and interventions for controlling ambient air pollution amidst competing develop-
ment challenges and budgetary and other resource constraints. An earlier study by the
World Bank and the IHME (Institute for Health Metrics and Evaluation) (2016) estimated
the combined cost of premature mortality from ambient air pollution and household air
pollution in 2013.1
This report estimates the cost of health damages using the estimates of mortality and
morbidity from ambient PM2.5
published in the GBD 2016 study. The GBD assesses mor-
tality and disability from numerous diseases, injuries, and risk factors, including ambient
air pollution. Air pollution has long been recognized as a significant environmental health
risk. GBD estimates of the global, regional, and national health burden attributable to air
pollution, based on nationwide exposures to ambient PM2.5
, were published for the first
time in the GBD 2010 study then followed by the GBD 2013 and annual publications since
the GBD 2015.
MethodologyThis report uses the GBD 2016 estimates of premature mortality and morbidity attribut-
able to ambient PM2.5
air pollution to value the economic cost in dollar terms. The GBD
estimates the major health damages of population exposure to ambient PM2.5
from expo-
sure-response relationships that have been established by global research on air pollution
and health. These exposure-response relationships provide estimates of the number of
cases in a country of premature deaths and disease that result from the population’s ex-
posure to given ambient concentrations of PM2.5
. Population exposure levels are estimat-
ed based on a combination of ground-level monitoring of ambient PM2.5
, satellite imagery,
and chemical transport models.
The cost of the health damages from ambient PM2.5
is quantified separately for prema-
ture deaths and morbidity. The cost of premature deaths is estimated from the value of
statistical life (VSL). VSL is a measure of how much individuals are willing to pay for a
reduction in the risk or likelihood of premature death. VSL is influenced by income level
and other factors; it is unique for each country. The cost of morbidity is estimated based
on years lived with disability (YLD) as estimated by the GBD. YLD is a measure of disease
burden that reflects the duration and severity of diseases. YLD from exposure to ambient
PM2.5
is converted to days lived with disease, with the cost of a day of disease equated to
the average daily wage rate in each country.
This report recognizes that PM2.5
comes from both natural (for example, dust)
and anthropogenic (for example, vehicle exhaust and emissions from power generation)
origins to varying extents. The epidemiologic literature indicates that short- and long-
term exposures to dust have significant health impacts and provides a reasonable basis
to assume that the health risk per microgram of natural dust is generally similar to that of
other constituents of PM2.5
, with the exception of sulfates and elemental carbon (World
Bank 2020b). Epidemiologic evidence supports the inclusion of the effects of natural dust
on mortality and morbidity in the quantification of health impacts of ambient air pollution.
Furthermore, while global studies of the health impacts of PM2.5
have been based on
particle mass, the epidemiologic evidence shows that adverse health damages of PM2.5
vary according to PM2.5
source and composition. Specifically, trace constituents from
PM2.5
and PM2.5
mass from fossil-fuel combustion are among the greatest contributors to
PM2.5
toxicity (World Bank 2020c). The estimation of health impacts of natural dust, PM2.5
constituents, and PM2.5
mass from different sources, at a global level, will require strength-
1 Total air pollution damages in World Bank and IHME (2016) included ambient PM2.5
, household PM2.5
, and ambient ozone.
18Executive Summary The Global Health Cost of Ambient PM2.5
Air Pollution 19
ening the measurement of PM2.5
constituents and source markers and improving the
understanding of exposure-response relationships. In this report, the valuation of health
damage from PM2.5
is based on PM2.5
mass and is not disaggregated by PM2.5
source or
constituent (World Bank 2020b).
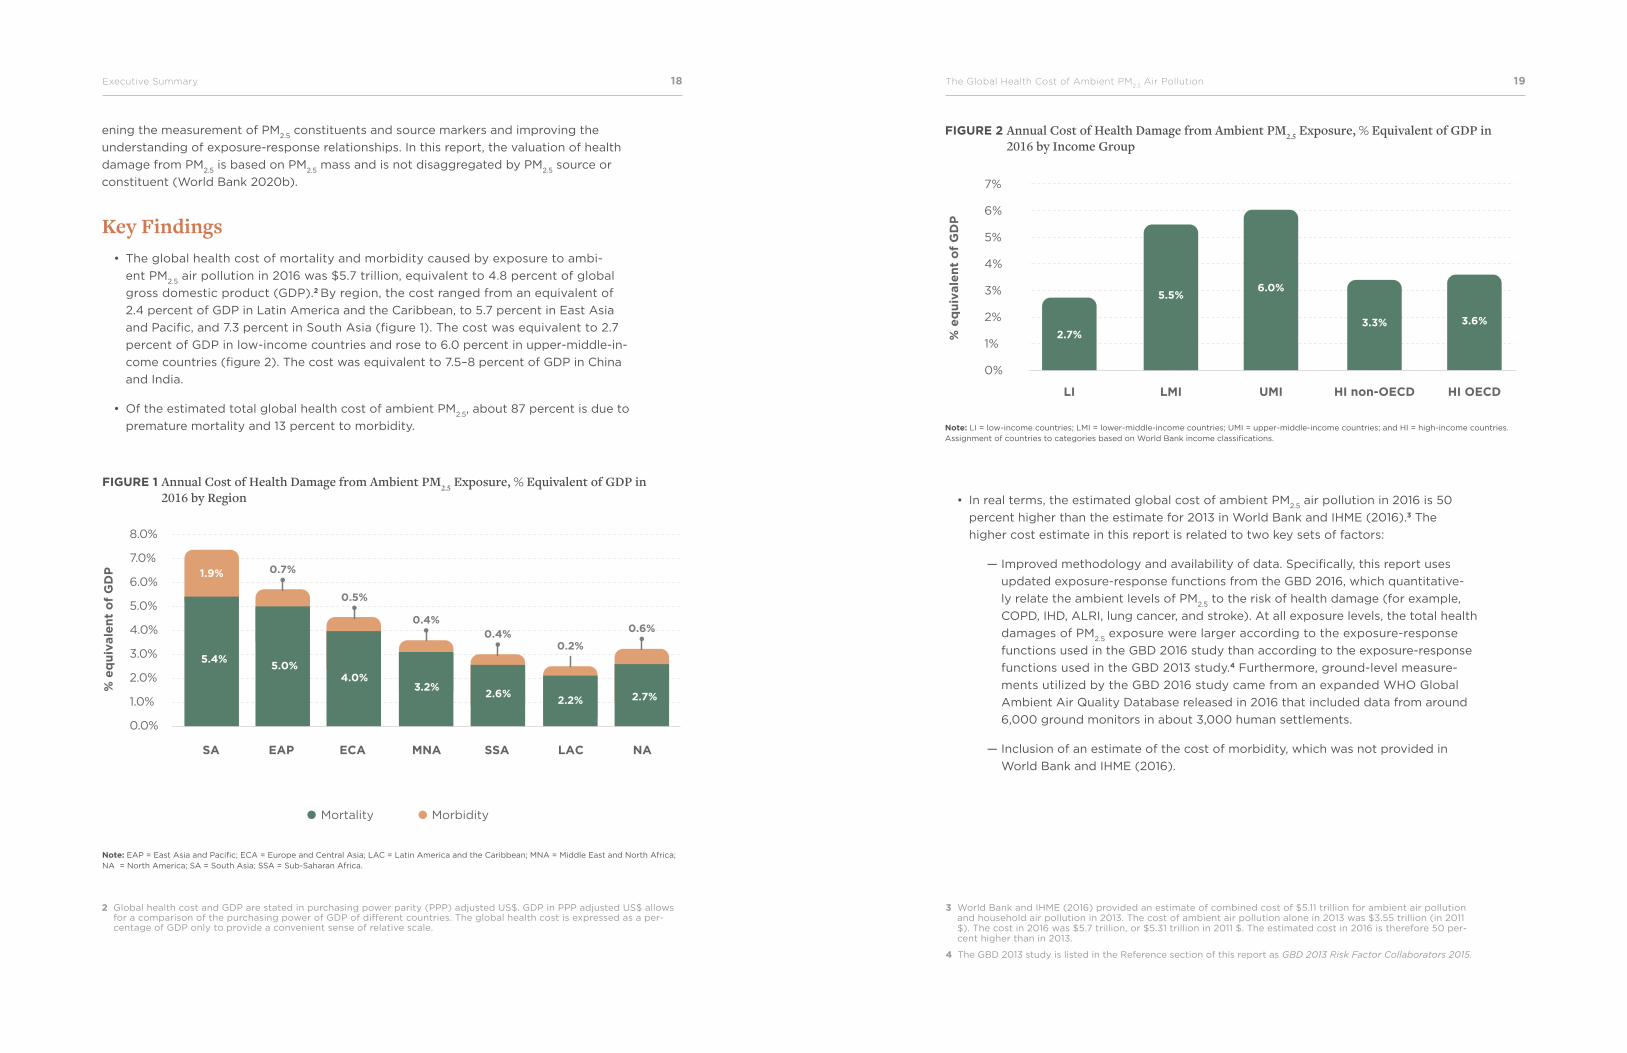
Key Findings• The global health cost of mortality and morbidity caused by exposure to ambi-
ent PM2.5
air pollution in 2016 was $5.7 trillion, equivalent to 4.8 percent of global
gross domestic product (GDP).2 By region, the cost ranged from an equivalent of
2.4 percent of GDP in Latin America and the Caribbean, to 5.7 percent in East Asia
and Pacific, and 7.3 percent in South Asia (figure 1). The cost was equivalent to 2.7
percent of GDP in low-income countries and rose to 6.0 percent in upper-middle-in-
come countries (figure 2). The cost was equivalent to 7.5–8 percent of GDP in China
and India.
• Of the estimated total global health cost of ambient PM2.5
, about 87 percent is due to
premature mortality and 13 percent to morbidity.
FIGURE 1 Annual Cost of Health Damage from Ambient PM2.5 Exposure, % Equivalent of GDP in 2016 by Region
FIGURE 2 Annual Cost of Health Damage from Ambient PM2.5 Exposure, % Equivalent of GDP in 2016 by Income Group
Note: EAP = East Asia and Pacific; ECA = Europe and Central Asia; LAC = Latin America and the Caribbean; MNA = Middle East and North Africa; NA = North America; SA = South Asia; SSA = Sub-Saharan Africa.
Note: LI = low-income countries; LMI = lower-middle-income countries; UMI = upper-middle-income countries; and HI = high-income countries. Assignment of countries to categories based on World Bank income classifications.
2 Global health cost and GDP are stated in purchasing power parity (PPP) adjusted US$. GDP in PPP adjusted US$ allows for a comparison of the purchasing power of GDP of different countries. The global health cost is expressed as a per-centage of GDP only to provide a convenient sense of relative scale.
8.0%
7.0%
6.0%
5.0%
4.0%
3.0%
2.0%
1.0%
0.0%
Mortality Morbidity
% e
qu
ivale
nt
of
GD
P
5.4%5.0%
0.7%
4.0%3.2%
2.6%2.2% 2.7%
1.9%
0.5%
0.4%0.4%
0.2%
0.6%
SA EAP ECA MNA SSA LAC NA
7%
6%
5%
4%
3%
2%
1%
0%
% e
qu
ivale
nt
of
GD
P
2.7%
5.5%6.0%
3.3% 3.6%
LI LMI UMI HI non-OECD HI OECD
• In real terms, the estimated global cost of ambient PM2.5
air pollution in 2016 is 50
percent higher than the estimate for 2013 in World Bank and IHME (2016).3 The
higher cost estimate in this report is related to two key sets of factors:
— Improved methodology and availability of data. Specifically, this report uses
updated exposure-response functions from the GBD 2016, which quantitative-
ly relate the ambient levels of PM2.5
to the risk of health damage (for example,
COPD, IHD, ALRI, lung cancer, and stroke). At all exposure levels, the total health
damages of PM2.5
exposure were larger according to the exposure-response
functions used in the GBD 2016 study than according to the exposure-response
functions used in the GBD 2013 study.4 Furthermore, ground-level measure-
ments utilized by the GBD 2016 study came from an expanded WHO Global
Ambient Air Quality Database released in 2016 that included data from around
6,000 ground monitors in about 3,000 human settlements.
— Inclusion of an estimate of the cost of morbidity, which was not provided in
World Bank and IHME (2016).
3 World Bank and IHME (2016) provided an estimate of combined cost of $5.11 trillion for ambient air pollution and household air pollution in 2013. The cost of ambient air pollution alone in 2013 was $3.55 trillion (in 2011 $). The cost in 2016 was $5.7 trillion, or $5.31 trillion in 2011 $. The estimated cost in 2016 is therefore 50 per-cent higher than in 2013.
4 The GBD 2013 study is listed in the Reference section of this report as GBD 2013 Risk Factor Collaborators 2015.
20Executive Summary The Global Health Cost of Ambient PM2.5
Air Pollution 21
• Ensure public access to information on air quality – To reinforce the impact of air
quality monitoring networks, air quality management efforts should include a ro-
bust system for public dissemination of air quality data in formats that are widely
understood and easily accessible to members of the public. Public dissemination of
air quality data allows members of the public to take adequate measures to reduce
their exposure to air pollution and thus provides an important social safety net for the
public, particularly vulnerable groups such as young children, the elderly, and people
with health conditions that can be exacerbated by poor air quality.
• Adopt regional approaches to address air pollution across boundaries – Air pol-
lution typically cuts across boundaries of individual cities or countries. As a result,
regional airshed approaches to addressing PM2.5
air pollution may be called for. Such
approaches require governments to collaborate at the national and international lev-
els across multiple administrative jurisdictions and geographical boundaries to ensure
effective air quality management.
• Prioritize key sources of PM2.5
air pollution, notably fossil-fuel combustion, such
as sulfur-emitting coal-fired power plants and diesel-fueled traffic – Air pollution
control efforts that prioritize fossil-fuel combustion sources are most likely to return
greater health benefits than broad efforts that do not consider the source and com-
position of PM2.5
. Sulfate, a chemical constituent of PM2.5
from coal burning, is one of
the greatest contributors to PM2.5
toxicity and has one of the strongest associations
with cardiovascular disease among the chemical constituents of PM2.5
from fossil-fuel
combustion. Reductions in PM2.5
emissions from fossil-fuel combustion, such as sul-
fur-emitting coal-fired power plants and diesel vehicles, can be expected to produce
the most significant health benefits per unit of PM2.5
reduced. Given that these sourc-
es are also key contributors to climate warming, air pollution efforts that target
these sources will also provide climate change mitigation benefits. Notably, reduc-
ing PM2.5
also means reducing black carbon, a component of PM2.5
and a short-lived
climate pollutant.
5 The numbers of monitors are based on the WHO Global Ambient Air Quality Database released in 2016. Since the prepa-ration of this report, the WHO has released its 2018 version of the WHO Global Ambient Air Quality Database, which was used by the GBD 2017 study. The 2018 version includes nearly 10,000 ground monitors in nearly 4,400 locations in 108 countries. This represents a substantial improvement in global coverage, although 76 percent of the increase in PM
2.5
monitors was in high-income countries. Regarding PM2.5
monitors, there were 64 million people per ground monitor in low-income countries and 29 million per ground monitor in Sub-Saharan Africa, in contrast to about 370,000 people per monitor in high-income countries. These results continue to underscore the need for establishing and strengthening ground-level monitoring networks in LMICs.
“Global health crises further highlight the need for continued action in addressing a global and cross-cutting challenge such as air pollution.”
• Observations about the reasons for variations between GBD mortality estimates for
different years were noted in Ostro et al. (2018), which examined estimates of air
pollution–related mortality provided in GBD 2010, GBD 2013, and GBD 2015. Method-
ological and technological improvements and demographic changes were found to
account for the observed variations in the mortality estimates. Ostro et al. (2018) also
noted the need to strengthen ground-level air quality monitoring and epidemiological
studies to improve estimates of PM2.5
exposure and air pollution-related mortality
in LMICs.
• Although the global availability of exposure data in GBD 2016 increased because
of increased ground-level monitoring data, there remains a great need to increase
ground-level air quality measurements in LMICs to reduce uncertainties to PM2.5
exposure estimates in countries that have limited or no ground-level measurements,
particularly of PM2.5
which is particulate matter equal to or less than 2.5 microns in di-
ameter. PM10
refers to particulate matter equal to or less than 10 microns in diameter.
It was found that there was only one PM2.5
or PM10
ground-level monitor per 54 million
people in low-income countries and one monitor per 16 million people in Sub-Saharan
Africa, in contrast to one monitor per 300,000 people in high-income countries.5
Recommendations for Policy ActionThe significant health and economic burdens of ambient PM
2.5 air pollution call for urgent
action from policy makers in LMICs to reduce air pollution and the resulting deaths. Some
key areas for action include the following:
• Improve ground-level air quality monitoring – Properly operated and maintained
ground-level monitoring networks for air quality provide data on the severity of air
pollution, a fundamental input for effective air quality management. Data for air qual-
ity monitoring networks are also useful for identifying the key sources that contribute
to ambient air pollution. Such air quality monitoring networks must be subject to
rigorous quality assurance and quality control regimes to ensure that the air quality
measurements generated are reliable for informing the design and implementation of
interventions to reduce air pollution and protect public health. Thus, high-quality, rou-
tine air quality monitoring first and foremost underpins effective air quality manage-
ment programs that would also include comprehensive emission inventories; applica-
tion of models to understand the transport and fate of air pollutants; assessment of
costs, health, and other benefits; and public outreach and stakeholder engagement. It
is pertinent to note that beyond initial investments in air quality monitoring networks,
governments need to ensure effective funding for sustained operation and mainte-
nance of air quality monitoring programs in the long term.
The Global Health Cost of Ambient PM2.5
Air Pollution 2322Executive Summary
• Engage a wide range of instruments that are suited to effectively and efficiently
reduce air pollution and ensure that they are enforced – To reduce air pollution,
governments need to apply the instruments and approaches that are most effective
for reducing air pollution. Command-and-control instruments such as the establish-
ment of ambient air quality standards, emissions standards for vehicles and stationary
sources, and vehicle inspection and maintenance programs are well established and
applied in many countries. Additional command-and-control instruments include reg-
ulations to improve fuel quality, such as by decreasing the sulfur content of fuels.
Economic instruments such as air pollution charges and repurposing of fossil-fuel
subsidies reduce air and climate pollutants to augment the government revenue that
can be allocated to education, health care, renewable energy, and interventions to
control air pollution. In addition, policies to promote the conversion of vehicles from
diesel to gas or to discourage the use of nitrogen-based fertilizers, which release
ammonia—a precursor of secondary PM2.5
formation—may also be used to reduce air
pollution. It is important to note that effective application of the various air-quality
management instruments requires that governments put in place adequate enforce-
ment mechanisms that also include incentives to reduce polluting behaviors.
The Global Health Cost of Ambient PM2.5
Air Pollution 2524World Bank Group
Introduction and Objectives
The detrimental effects of ambient air pollution, notably PM2.5
, on health are well known.
Ambient air pollution refers to the contamination of outdoor air; household air pollution
refers to the contamination of indoor air. Ambient (or outdoor) air pollution is the world’s
leading environmental risk to health and the cause of morbidity and mortality from
diseases such as IHD, lung cancer, COPD, stroke, and pneumonia. The majority of deaths
related to ambient and household air pollution are caused by human exposure to fine
inhalable particulate matter, also known as PM2.5
. In 2016, about 4.1 million people world-
wide died as a result of exposure to ambient air pollution.
Understanding the welfare costs associated with ambient air pollution has been
a topic of continued attention in several works. Several of these works have applied meth-
odologies and estimates of exposure to air pollution used in the Global Burden of Disease
Project. These works include Larsen (2014), OECD (2016), WHO (2016), World Bank and
IHME (2016), and a broader study by the Lancet Commission on pollution and health
(Landrigan et al. 2018). Four of these publications provide global estimates of the wel-
fare cost of air pollution, as does a recent World Bank update of the global, regional, and
national cost of PM2.5
ambient air pollution in 2015 (Larsen 2017). Multiple studies, includ-
ing ones cited in this paragraph, point to the enormous global welfare cost of ambient
air pollution in the trillions of dollars, equivalent in magnitude to 2.5–6 percent of global
GDP, depending on the valuation of health damages (table 1). Some estimates indicate an
upward trend in the global welfare cost of ambient air pollution. For example, the Organ-
isation for Economic Co-operation and Development (OECD) estimates that the cost of
health damages of ambient air pollution could increase to $20.5–$27.6 trillion
(9–12 percent of GDP) by 2060 (OECD 2016).6
It is important to note the following two cost-related findings of these studies: (i) The
global cost of ambient air pollution is substantially higher than the cost of household air
pollution associated with the burning of solid fuels. (ii) However, the cost of household air
pollution is still substantially higher than the cost of ambient air pollution in South Asia
and Sub-Saharan Africa and nearly as high as the cost of ambient air pollution in East
Asia and Pacific (World Bank and IHME 2016).
6 2010 Purchasing Power Parity (PPP) adjusted US$.
26Introduction and Objectives The Global Health Cost of Ambient PM2.5
Air Pollution 27
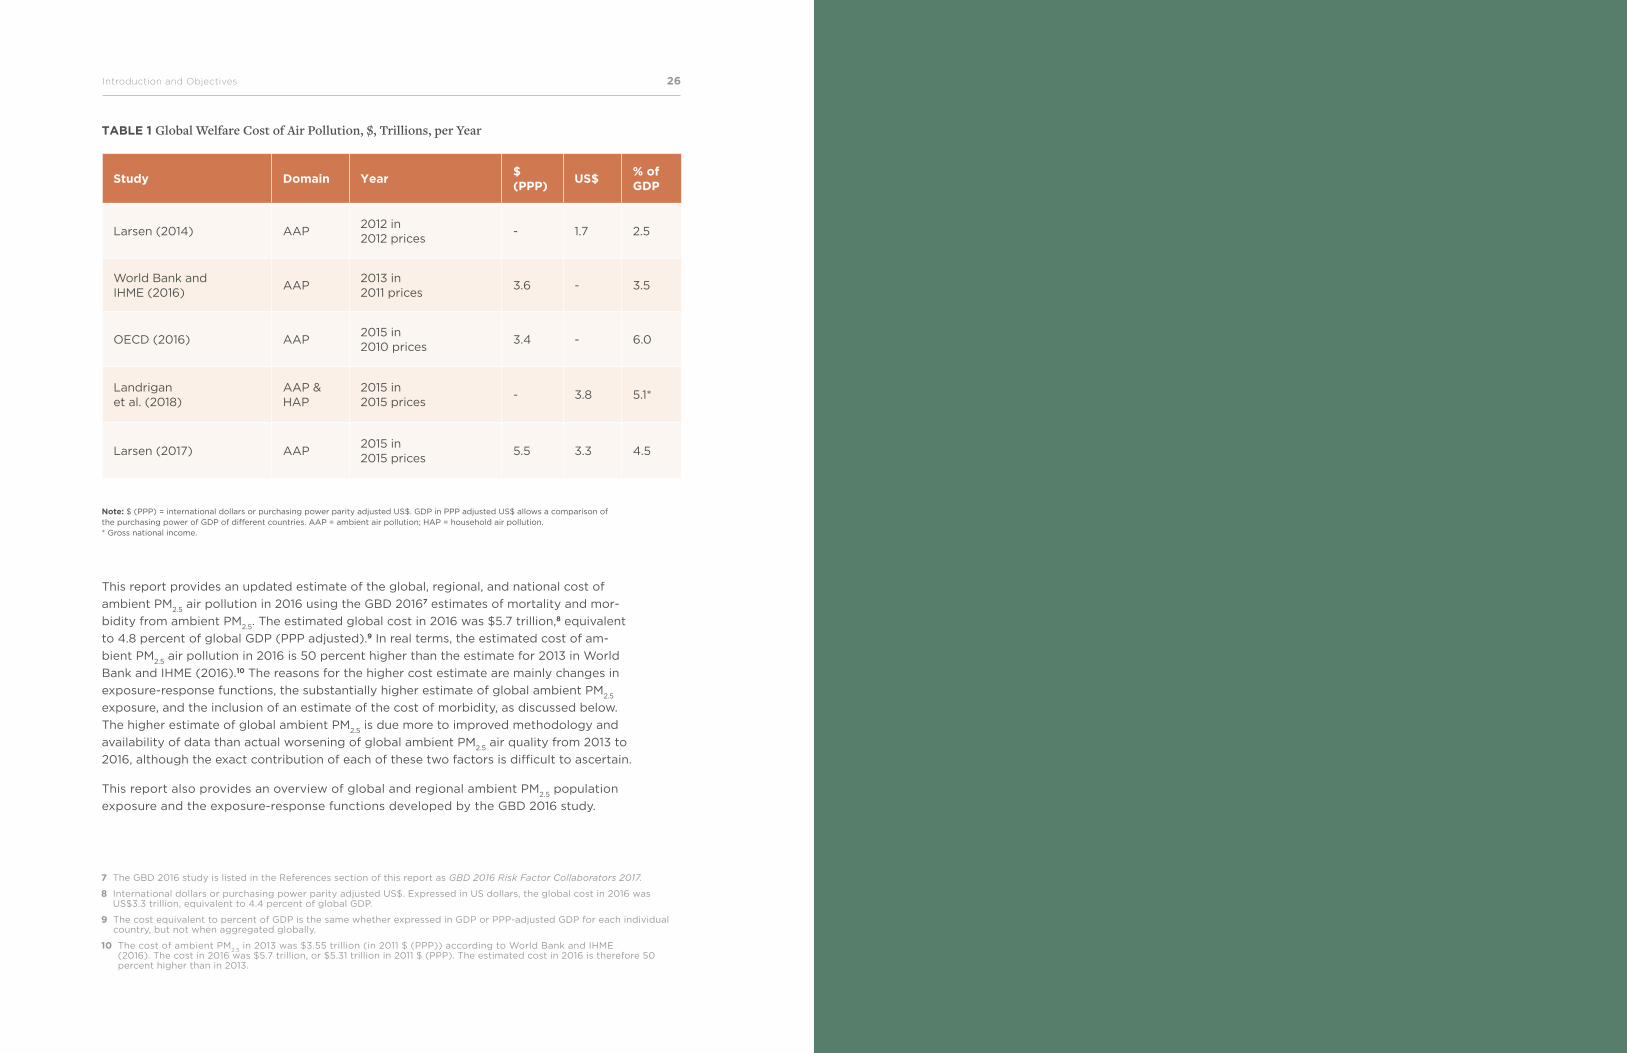
TABLE 1 Global Welfare Cost of Air Pollution, $, Trillions, per Year
Study Domain Year$ (PPP)
US$% of GDP
Larsen (2014) AAP2012 in 2012 prices
- 1.7 2.5
World Bank and IHME (2016)
AAP2013 in 2011 prices
3.6 - 3.5
OECD (2016) AAP2015 in 2010 prices
3.4 - 6.0
Landrigan et al. (2018)
AAP & HAP
2015 in 2015 prices
- 3.8 5.1*
Larsen (2017) AAP2015 in 2015 prices
5.5 3.3 4.5
Note: $ (PPP) = international dollars or purchasing power parity adjusted US$. GDP in PPP adjusted US$ allows a comparison of the purchasing power of GDP of different countries. AAP = ambient air pollution; HAP = household air pollution. * Gross national income.
This report provides an updated estimate of the global, regional, and national cost of
ambient PM2.5
air pollution in 2016 using the GBD 20167 estimates of mortality and mor-
bidity from ambient PM2.5
. The estimated global cost in 2016 was $5.7 trillion,8 equivalent
to 4.8 percent of global GDP (PPP adjusted).9 In real terms, the estimated cost of am-
bient PM2.5
air pollution in 2016 is 50 percent higher than the estimate for 2013 in World
Bank and IHME (2016).10 The reasons for the higher cost estimate are mainly changes in
exposure-response functions, the substantially higher estimate of global ambient PM2.5
exposure, and the inclusion of an estimate of the cost of morbidity, as discussed below.
The higher estimate of global ambient PM2.5
is due more to improved methodology and
availability of data than actual worsening of global ambient PM2.5
air quality from 2013 to
2016, although the exact contribution of each of these two factors is difficult to ascertain.
This report also provides an overview of global and regional ambient PM2.5
population
exposure and the exposure-response functions developed by the GBD 2016 study.
7 The GBD 2016 study is listed in the References section of this report as GBD 2016 Risk Factor Collaborators 2017.
8 International dollars or purchasing power parity adjusted US$. Expressed in US dollars, the global cost in 2016 was US$3.3 trillion, equivalent to 4.4 percent of global GDP.
9 The cost equivalent to percent of GDP is the same whether expressed in GDP or PPP-adjusted GDP for each individual country, but not when aggregated globally.
10 The cost of ambient PM2.5
in 2013 was $3.55 trillion (in 2011 $ (PPP)) according to World Bank and IHME (2016). The cost in 2016 was $5.7 trillion, or $5.31 trillion in 2011 $ (PPP). The estimated cost in 2016 is therefore 50 percent higher than in 2013.
The Global Health Cost of Ambient PM2.5
Air Pollution 2928World Bank Group
Context and Value- Added of this Report
This report provides an estimate of the global, regional, and national costs of health
damage—that is, of premature mortality and morbidity—from exposure to ambient
PM2.5
air pollution in 2016. While recognizing the various costs of air pollution to society,
this report focuses on the cost of premature mortality and morbidity due to ambient
air pollution, the world’s leading environmental health risk. Estimating the health dam-
age of air pollution in monetary terms provides a suitable metric for policy makers and
decision-makers in developing countries to prioritize the design and implementation of
policies and interventions for controlling ambient air pollution amidst competing devel-
opment challenges and budgetary and other resource constraints.
As a development institution, the cost of ambient air pollution underscores the need for
the World Bank’s sustained support of governments’ efforts to reduce ambient air pollution.
Furthermore, the cost estimate provides a useful metric for informing decision-making and
priority setting by governments in tackling the urgent problem of ambient air pollution.
The value-added of this report is as follows:
• The report is based on updated exposure-response functions as used by the GBD
2016 study. Exposure-response functions quantitatively relate the ambient levels
of PM2.5
to the risk of health damage (for example, COPD, IHD, ALRI, lung cancer,
and stroke). The exposure-response functions used in this report differ in import-
ant aspects from the functions from the GBD 2013 study11 used in World Bank and
IHME (2016). The GBD 2016 exposure-response functions reveal a much higher risk
of COPD and acute lower respiratory infection (ALRI) from PM2.5
exposure than the
functions used in the GBD 2013 study. The GBD 2016 exposure-response functions
are somewhat higher for IHD at higher exposure levels, somewhat lower for stroke,
and substantially lower for lung cancer. Lung cancer mortality is, however, a very
minor share of total mortality from ambient PM2.5
. Thus, in aggregate at all exposure
levels, the health damages of PM2.5
exposure are larger according to the exposure-re-
sponse functions used in the GBD 2016 study than according to the functions used in
the GBD 2013 study.
11 The GBD 2013 study is listed in the References section of this report as GBD 2013 Risk Factor Collaborators 2015.
30Context and Value-Added of this Report The Global Health Cost of Ambient PM2.5
Air Pollution 31
• This report is based on global ambient PM2.5
exposure estimates used in the GBD
2016. These exposure estimates are higher than the estimates used in the GBD 2013
and based on a database of ground-level measurements of air quality that are used
for calibrating satellite and chemical transport modeling estimates of PM2.5
. The data-
base of ground-level measurements used by the GBD 2016 is substantially larger than
the database used in the GBD 2013 study. Global population-weighted ambient PM2.5
exposure was 50 µg/m3 in 2016 according to the estimates used in the GBD 2016
study and 32 µg/m3 in 2013 according to the GBD 2013 study.
• As a result of the changes in exposure-response functions and ambient PM2.5
expo-
sure estimates from the GBD 2013 study to the GBD 2016 study, this report is based
on a global mortality estimate of 4.1 million deaths from ambient PM2.5
in 2016 com-
pared to 2.9 million deaths in 2013 used by World Bank and IHME (2016).
• This report also provides an order-of-magnitude estimate of the cost of
morbidity of ambient PM2.5
based on the morbidity disease burden reported by the
GBD 2016 study, which is found to vary substantially across countries and regions.
The remaining sections of this report provide a global and regional overview of PM2.5
ambient air quality monitoring, estimates of population exposure to PM2.5
, estimation of
health damages from this exposure, and global costs of these health damages.
32Evolution of Estimates of Population Exposure to Ambient PM2.5
The Global Health Cost of Ambient PM2.5
Air Pollution 33
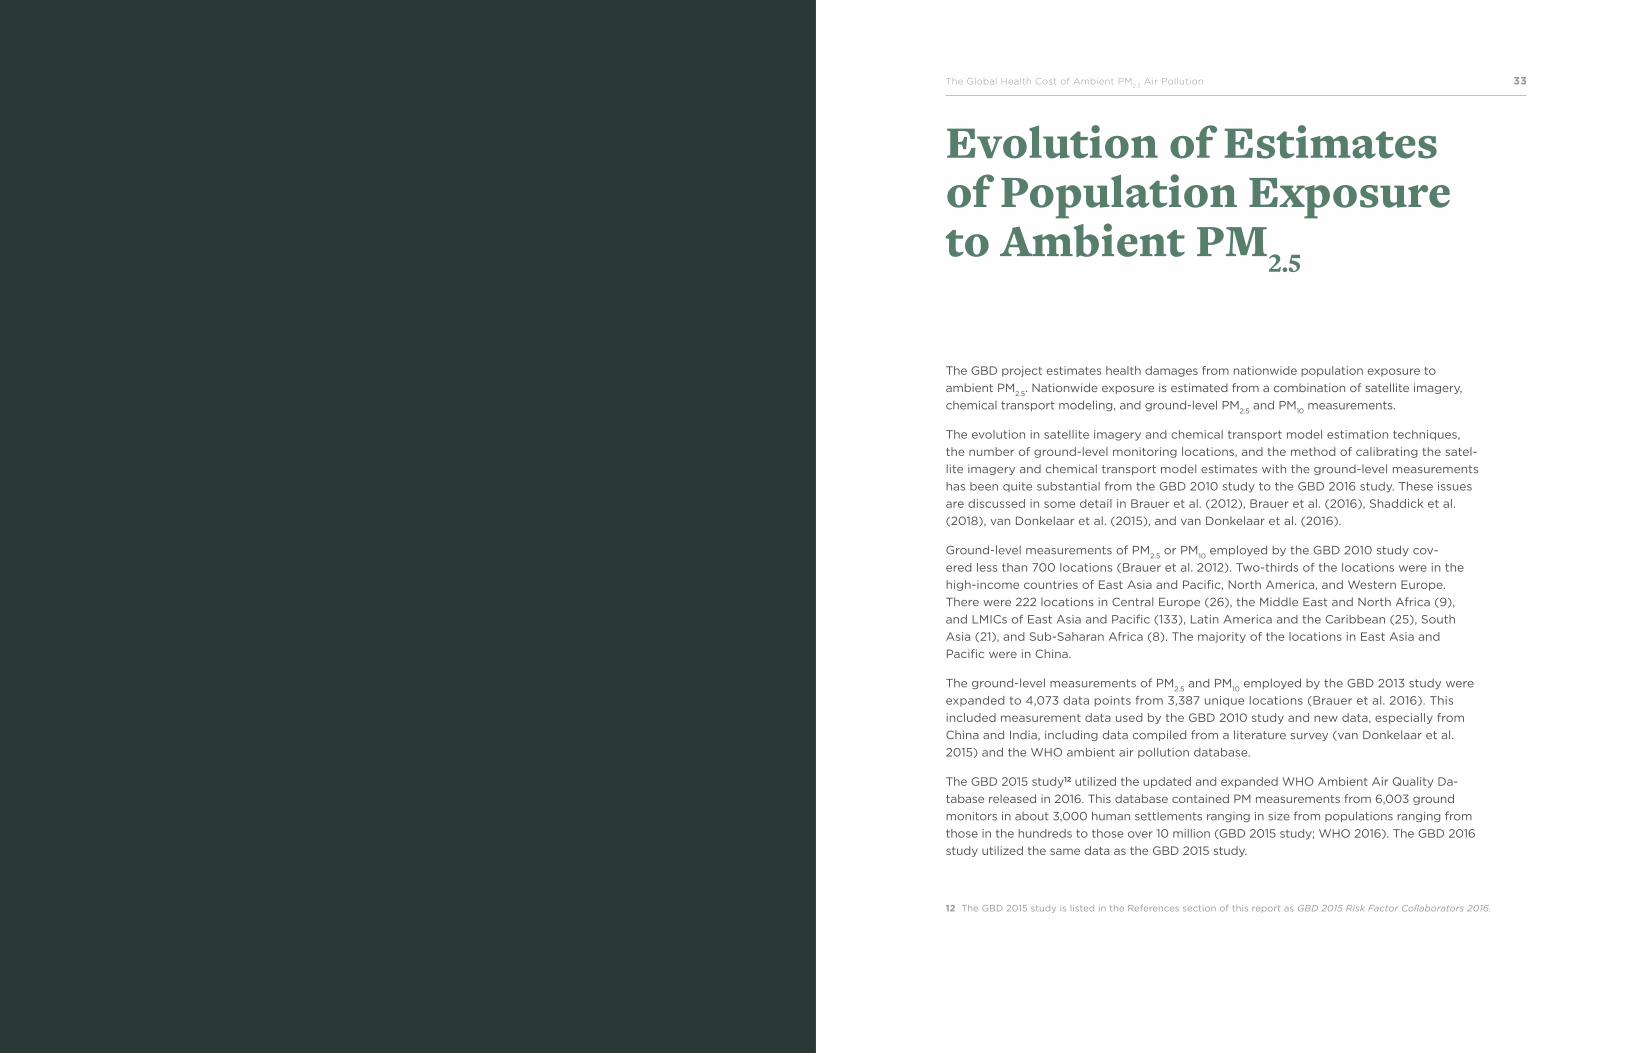
Evolution of Estimates of Population Exposure to Ambient PM2.5
The GBD project estimates health damages from nationwide population exposure to
ambient PM2.5
. Nationwide exposure is estimated from a combination of satellite imagery,
chemical transport modeling, and ground-level PM2.5
and PM10
measurements.
The evolution in satellite imagery and chemical transport model estimation techniques,
the number of ground-level monitoring locations, and the method of calibrating the satel-
lite imagery and chemical transport model estimates with the ground-level measurements
has been quite substantial from the GBD 2010 study to the GBD 2016 study. These issues
are discussed in some detail in Brauer et al. (2012), Brauer et al. (2016), Shaddick et al.
(2018), van Donkelaar et al. (2015), and van Donkelaar et al. (2016).
Ground-level measurements of PM2.5
or PM10
employed by the GBD 2010 study cov-
ered less than 700 locations (Brauer et al. 2012). Two-thirds of the locations were in the
high-income countries of East Asia and Pacific, North America, and Western Europe.
There were 222 locations in Central Europe (26), the Middle East and North Africa (9),
and LMICs of East Asia and Pacific (133), Latin America and the Caribbean (25), South
Asia (21), and Sub-Saharan Africa (8). The majority of the locations in East Asia and
Pacific were in China.
The ground-level measurements of PM2.5
and PM10
employed by the GBD 2013 study were
expanded to 4,073 data points from 3,387 unique locations (Brauer et al. 2016). This
included measurement data used by the GBD 2010 study and new data, especially from
China and India, including data compiled from a literature survey (van Donkelaar et al.
2015) and the WHO ambient air pollution database.
The GBD 2015 study12 utilized the updated and expanded WHO Ambient Air Quality Da-
tabase released in 2016. This database contained PM measurements from 6,003 ground
monitors in about 3,000 human settlements ranging in size from populations ranging from
those in the hundreds to those over 10 million (GBD 2015 study; WHO 2016). The GBD 2016
study utilized the same data as the GBD 2015 study.
12 The GBD 2015 study is listed in the References section of this report as GBD 2015 Risk Factor Collaborators 2016.
34Evolution of Estimates of Population Exposure to Ambient PM2.5
The Global Health Cost of Ambient PM2.5
Air Pollution 35
Analysis of the 2016 online version of the WHO database used by the GBD 2015 study
and the GBD 2016 study reveals the following:
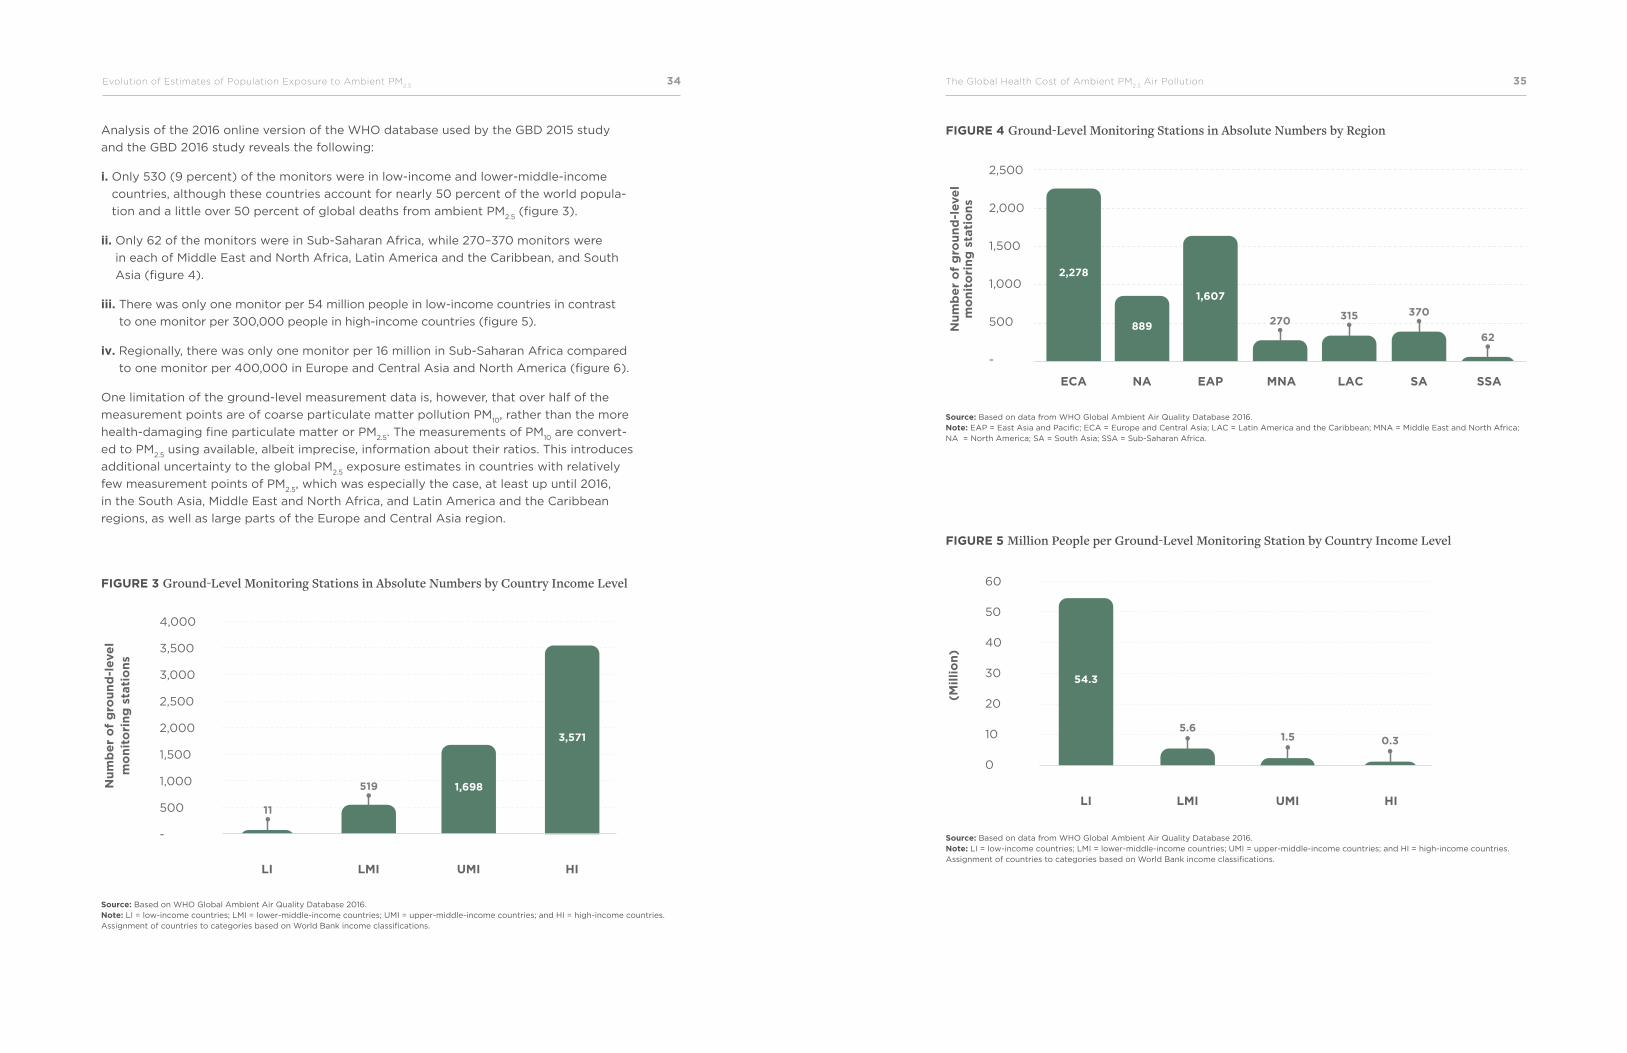
i. Only 530 (9 percent) of the monitors were in low-income and lower-middle-income
countries, although these countries account for nearly 50 percent of the world popula-
tion and a little over 50 percent of global deaths from ambient PM2.5
(figure 3).
ii. Only 62 of the monitors were in Sub-Saharan Africa, while 270–370 monitors were
in each of Middle East and North Africa, Latin America and the Caribbean, and South
Asia (figure 4).
iii. There was only one monitor per 54 million people in low-income countries in contrast
to one monitor per 300,000 people in high-income countries (figure 5).
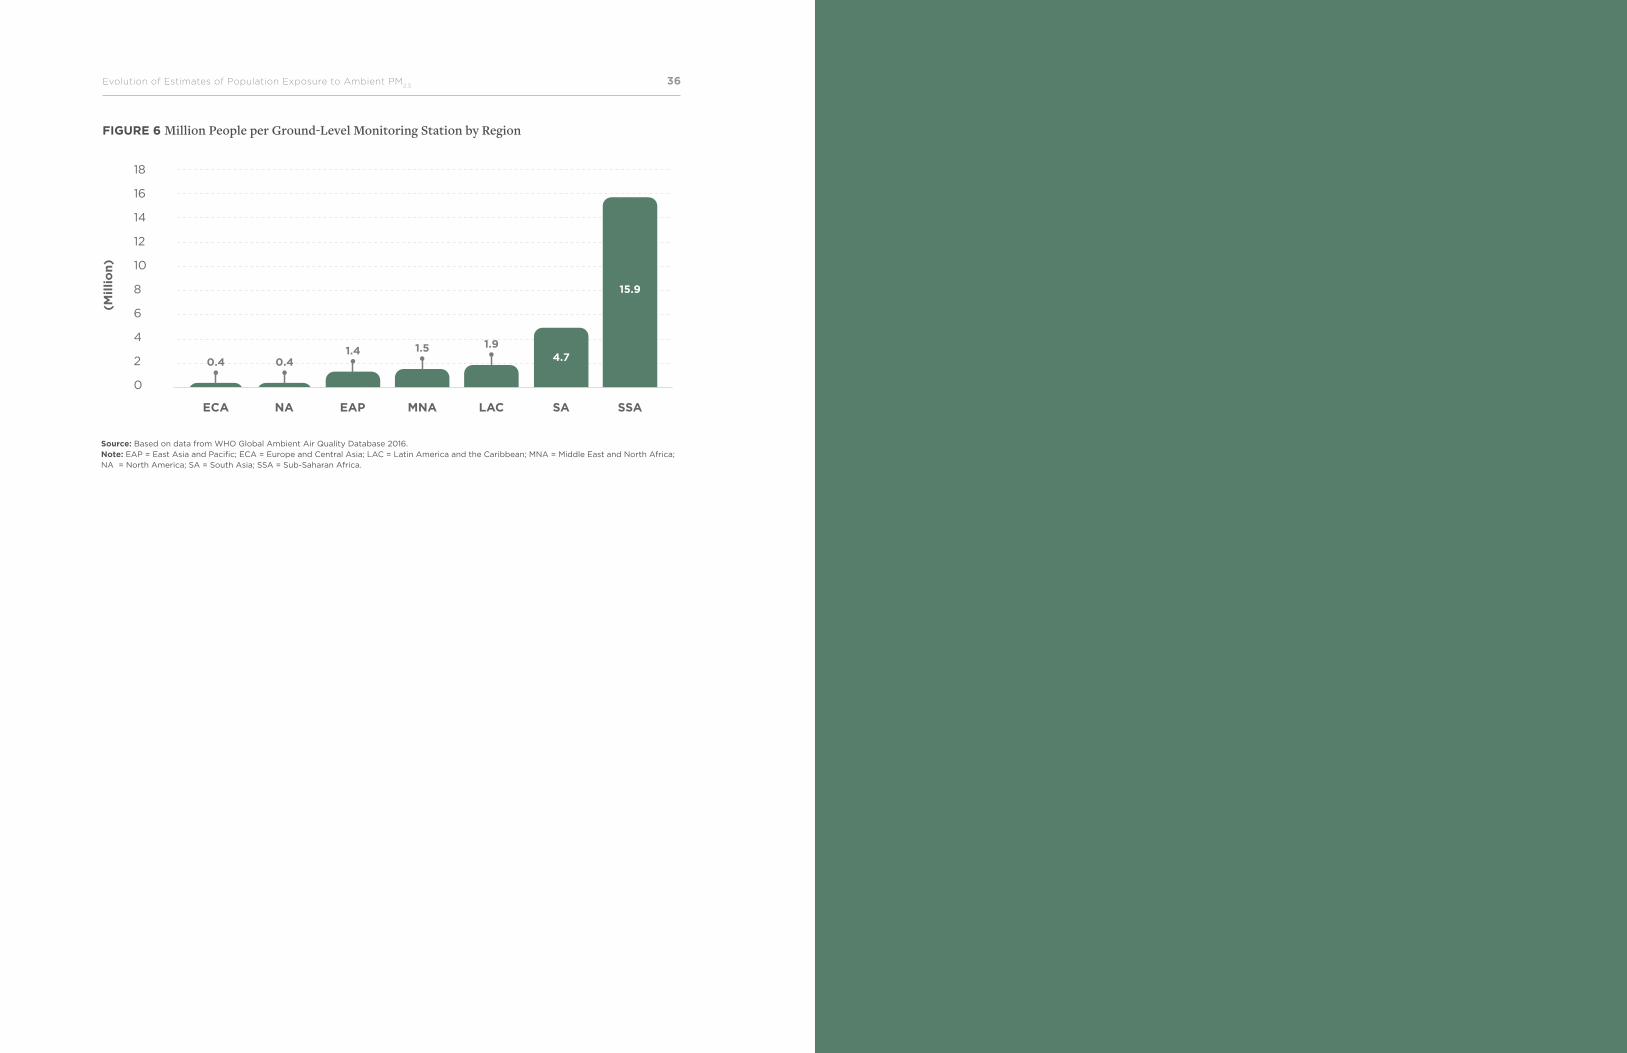
iv. Regionally, there was only one monitor per 16 million in Sub-Saharan Africa compared
to one monitor per 400,000 in Europe and Central Asia and North America (figure 6).
One limitation of the ground-level measurement data is, however, that over half of the
measurement points are of coarse particulate matter pollution PM10
, rather than the more
health-damaging fine particulate matter or PM2.5
. The measurements of PM10
are convert-
ed to PM2.5
using available, albeit imprecise, information about their ratios. This introduces
additional uncertainty to the global PM2.5
exposure estimates in countries with relatively
few measurement points of PM2.5
, which was especially the case, at least up until 2016,
in the South Asia, Middle East and North Africa, and Latin America and the Caribbean
regions, as well as large parts of the Europe and Central Asia region.
FIGURE 3 Ground-Level Monitoring Stations in Absolute Numbers by Country Income Level
FIGURE 4 Ground-Level Monitoring Stations in Absolute Numbers by Region
FIGURE 5 Million People per Ground-Level Monitoring Station by Country Income Level
Source: Based on WHO Global Ambient Air Quality Database 2016. Note: LI = low-income countries; LMI = lower-middle-income countries; UMI = upper-middle-income countries; and HI = high-income countries. Assignment of countries to categories based on World Bank income classifications.
Source: Based on data from WHO Global Ambient Air Quality Database 2016. Note: EAP = East Asia and Pacific; ECA = Europe and Central Asia; LAC = Latin America and the Caribbean; MNA = Middle East and North Africa; NA = North America; SA = South Asia; SSA = Sub-Saharan Africa.
Source: Based on data from WHO Global Ambient Air Quality Database 2016. Note: LI = low-income countries; LMI = lower-middle-income countries; UMI = upper-middle-income countries; and HI = high-income countries. Assignment of countries to categories based on World Bank income classifications.
4,000
3,500
3,000
2,500
2,000
1,500
1,000
500
-
Nu
mb
er
of
gro
un
d-l
eve
lm
on
ito
rin
g s
tati
on
s
LI LMI UMI HI
11
519 1,698
3,571
2,500
2,000
1,500
1,000
500
-
ECA NA EAP MNA LAC SA SSA
62
370315270889
2,278
1,607
Nu
mb
er
of
gro
un
d-l
eve
lm
on
ito
rin
g s
tati
on
s
60
50
40
30
20
10
0
(Mil
lio
n)
LI LMI UMI HI
5.61.5 0.3
54.3
The Global Health Cost of Ambient PM2.5
Air Pollution 3736Evolution of Estimates of Population Exposure to Ambient PM2.5
FIGURE 6 Million People per Ground-Level Monitoring Station by Region
Source: Based on data from WHO Global Ambient Air Quality Database 2016. Note: EAP = East Asia and Pacific; ECA = Europe and Central Asia; LAC = Latin America and the Caribbean; MNA = Middle East and North Africa; NA = North America; SA = South Asia; SSA = Sub-Saharan Africa.
18
16
14
12
10
8
6
4
2
0
ECA NA EAP MNA LAC SA SSA
0.41.4 1.5 1.9
0.4
15.9
4.7
(Mil
lio
n)
The Global Health Cost of Ambient PM2.5
Air Pollution 3938World Bank Group
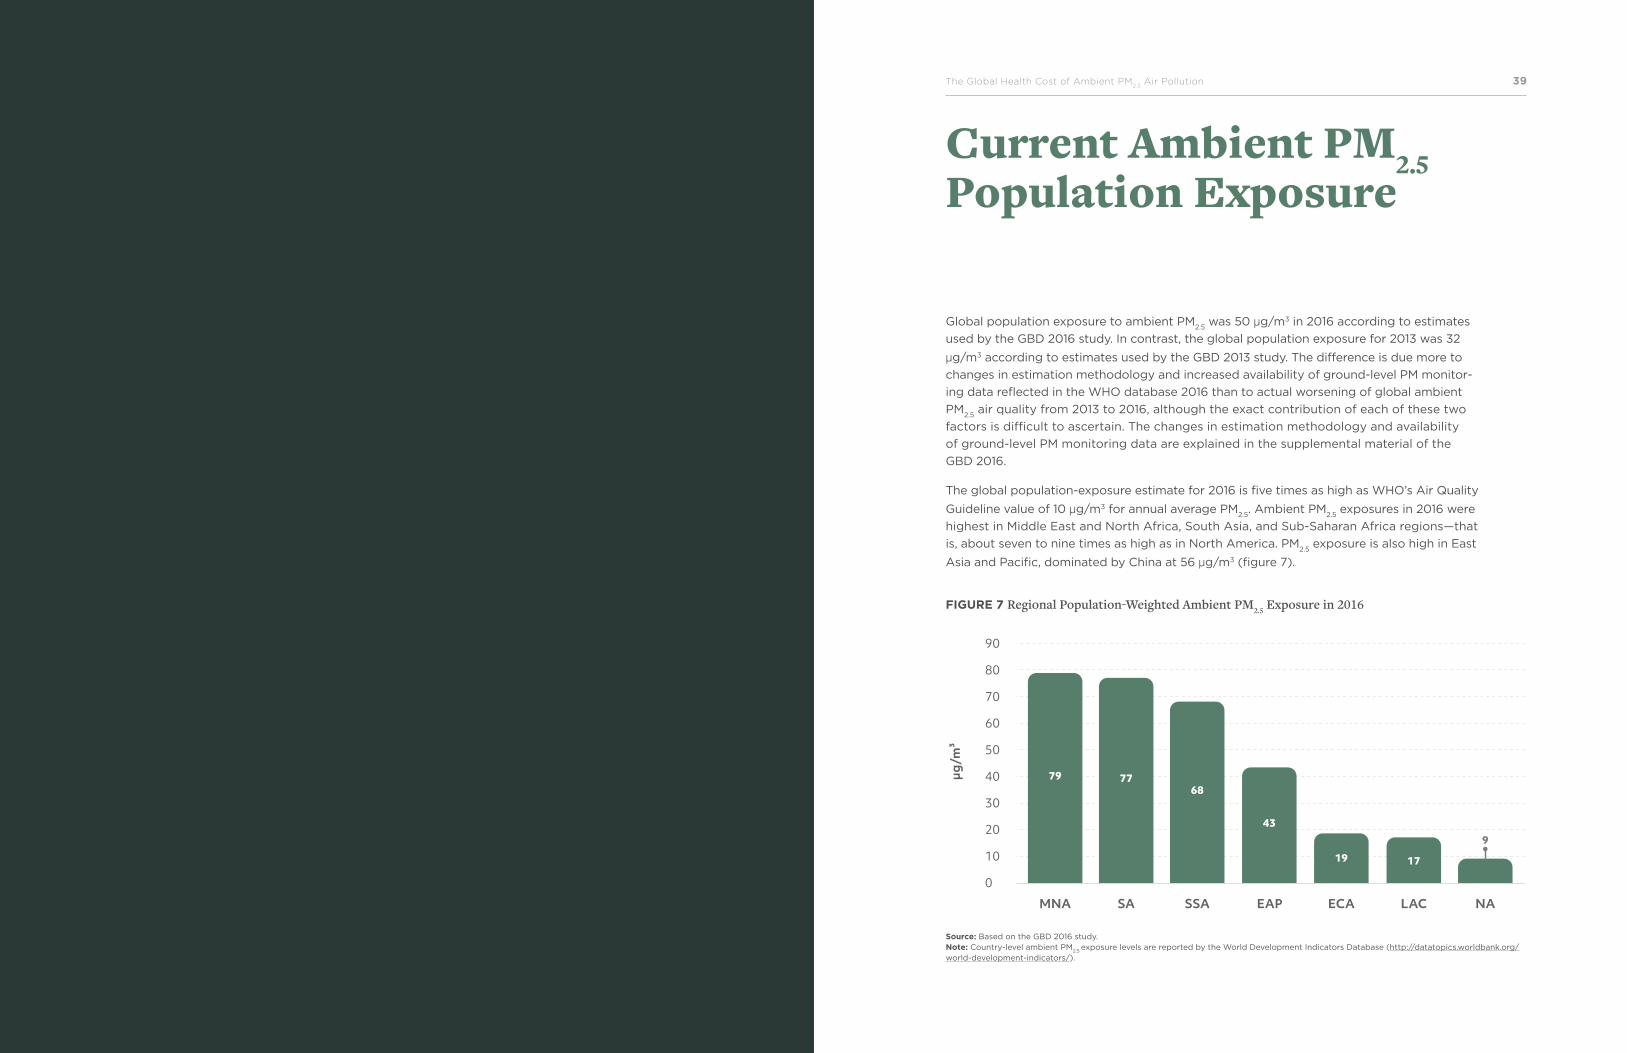
Current Ambient PM2.5 Population Exposure
Global population exposure to ambient PM2.5
was 50 µg/m3 in 2016 according to estimates
used by the GBD 2016 study. In contrast, the global population exposure for 2013 was 32
µg/m3 according to estimates used by the GBD 2013 study. The difference is due more to
changes in estimation methodology and increased availability of ground-level PM monitor-
ing data reflected in the WHO database 2016 than to actual worsening of global ambient
PM2.5
air quality from 2013 to 2016, although the exact contribution of each of these two
factors is difficult to ascertain. The changes in estimation methodology and availability
of ground-level PM monitoring data are explained in the supplemental material of the
GBD 2016.
The global population-exposure estimate for 2016 is five times as high as WHO’s Air Quality
Guideline value of 10 µg/m3 for annual average PM2.5
. Ambient PM2.5
exposures in 2016 were
highest in Middle East and North Africa, South Asia, and Sub-Saharan Africa regions—that
is, about seven to nine times as high as in North America. PM2.5
exposure is also high in East
Asia and Pacific, dominated by China at 56 µg/m3 (figure 7).
FIGURE 7 Regional Population-Weighted Ambient PM2.5 Exposure in 2016
Source: Based on the GBD 2016 study. Note: Country-level ambient PM
2.5 exposure levels are reported by the World Development Indicators Database (http://datatopics.worldbank.org/
world-development-indicators/).
90
80
70
60
50
40
30
20
10
0
MNA SA SSA EAP ECA LAC NA
9
777968
43
19 17
µg/m
³
The Global Health Cost of Ambient PM2.5
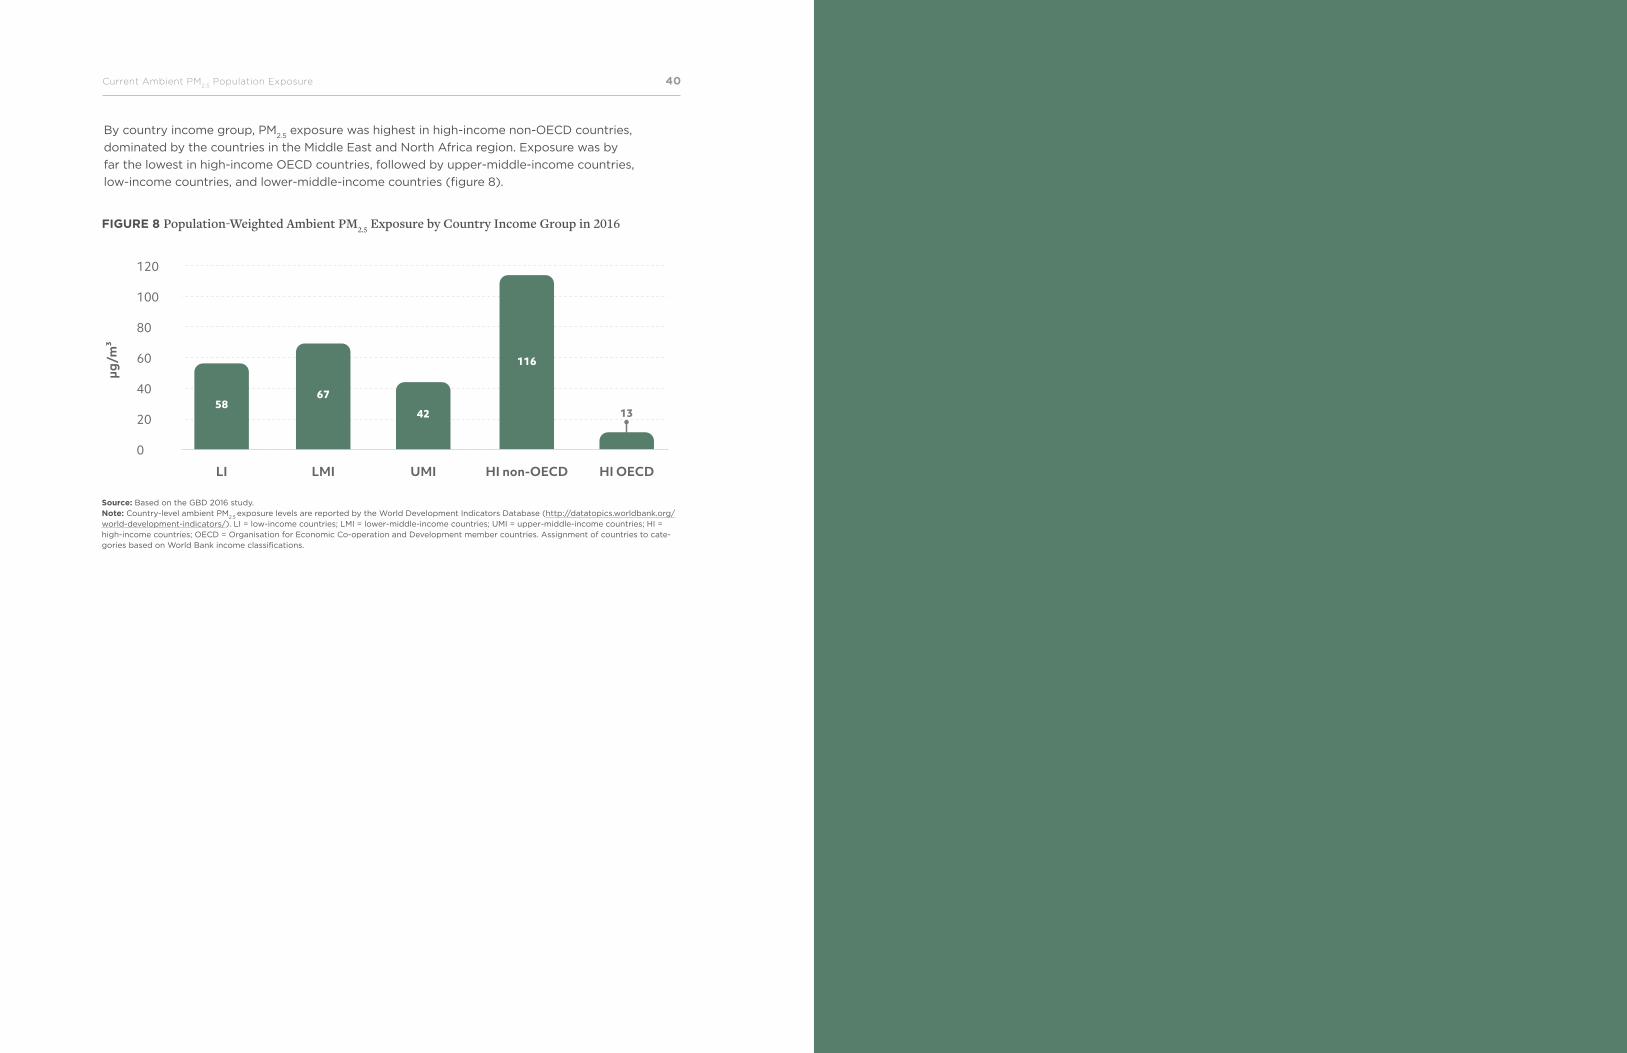
Air Pollution 4140Current Ambient PM2.5
Population Exposure
By country income group, PM2.5
exposure was highest in high-income non-OECD countries,
dominated by the countries in the Middle East and North Africa region. Exposure was by
far the lowest in high-income OECD countries, followed by upper-middle-income countries,
low-income countries, and lower-middle-income countries (figure 8).
120
100
80
60
40
20
0
µg/m
³
58
LI LMI UMI HI non-OECD HI OECD
67
42
116
13
FIGURE 8 Population-Weighted Ambient PM2.5 Exposure by Country Income Group in 2016
Source: Based on the GBD 2016 study. Note: Country-level ambient PM
2.5 exposure levels are reported by the World Development Indicators Database (http://datatopics.worldbank.org/
world-development-indicators/). LI = low-income countries; LMI = lower-middle-income countries; UMI = upper-middle-income countries; HI = high-income countries; OECD = Organisation for Economic Co-operation and Development member countries. Assignment of countries to cate-gories based on World Bank income classifications.
The Global Health Cost of Ambient PM2.5
Air Pollution 4342World Bank Group
Risks of Health Damages from Ambient PM2.5 Exposure
Exposure-response functions or concentration-response functions are a key input for
quantifying the health burden of ambient air pollution. One such function is the integrat-
ed exposure-response (IER) function, so called because it integrates exposures to PM2.5
from different sources. The GBD project estimates the health damages of PM2.5
exposure
from IER functions for five major health outcomes. The GBD project first developed IER
functions for the GBD 2010 study (see appendix B). These IER functions provide the rela-
tive risks of health damages of PM2.5
at exposures ranging from less than 10 µg/m3
to several hundred µg/m3.
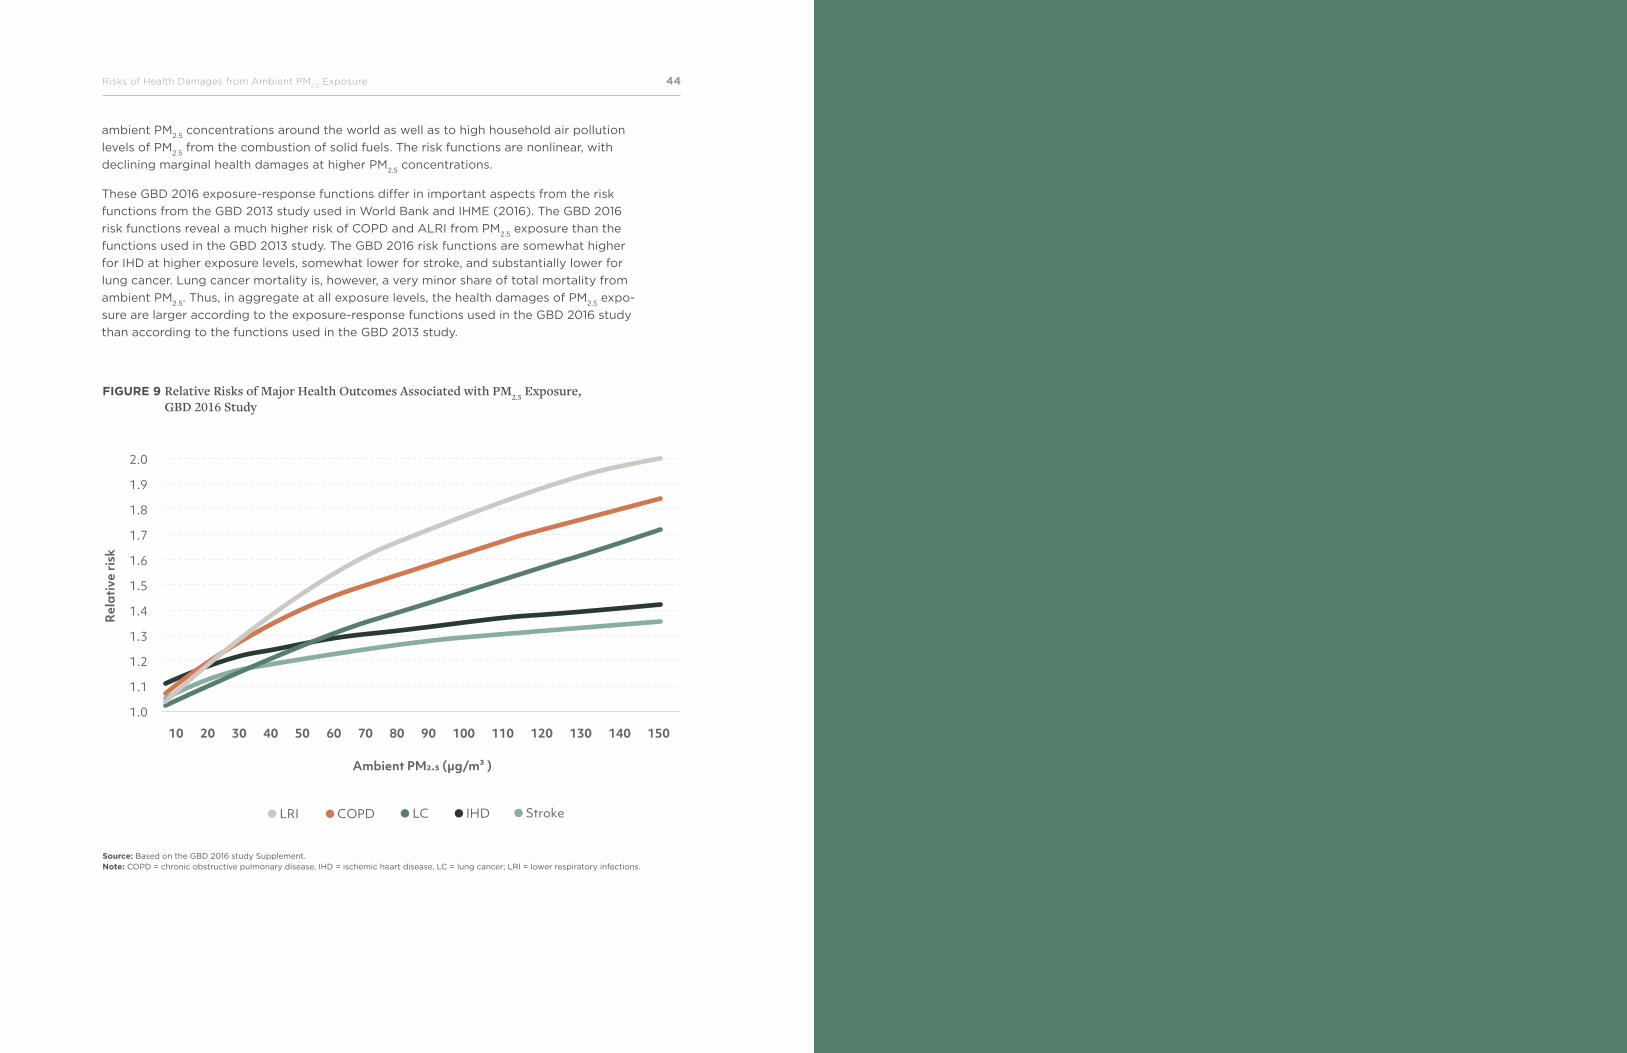
The relative risks from the IER function used by the GBD 2016 study are published in the
GBD 2016 study Supplement. They are reproduced in figure 9 for PM2.5
concentrations up
to 150 µg/m3. Relative risks of IHD and cerebrovascular disease (stroke) are the smallest
for PM2.5
concentrations larger than 30 to 50 µg/m3 and relative risks of ALRI and COPD
are the largest at PM2.5
concentrations over 20 µg/m3.13
The relative risks are derived from studies of long-term exposure to ambient air PM2.5
,
secondhand tobacco smoke, household use of solid cooking fuels, and active tobacco use
(Burnett et al. 2014). This provides risk functions that can be applied to a wide range of
13 Relative risks for IHD and stroke are population age-weighted and vary across countries in relation to the age structure of IHD and stroke mortality.
“Exposure-response functions or concentration-response functions are a key input for quantifying the health burden of ambient air pollution.”
The Global Health Cost of Ambient PM2.5
Air Pollution 4544Risks of Health Damages from Ambient PM2.5
Exposure
2.0
1.9
1.8
1.7
1.6
1.5
1.4
1.3
1.2
1.1
1.0
Rel
ativ
e ri
sk
Ambient PM2.5 (µg/m³ )
10 20 30 40 50 60 70 80 90 100 110 120 130 140 150
LRI COPD LC IHD Stroke
FIGURE 9 Relative Risks of Major Health Outcomes Associated with PM2.5 Exposure, GBD 2016 Study
Source: Based on the GBD 2016 study Supplement. Note: COPD = chronic obstructive pulmonary disease, IHD = ischemic heart disease, LC = lung cancer; LRI = lower respiratory infections.
ambient PM2.5
concentrations around the world as well as to high household air pollution
levels of PM2.5
from the combustion of solid fuels. The risk functions are nonlinear, with
declining marginal health damages at higher PM2.5
concentrations.
These GBD 2016 exposure-response functions differ in important aspects from the risk
functions from the GBD 2013 study used in World Bank and IHME (2016). The GBD 2016
risk functions reveal a much higher risk of COPD and ALRI from PM2.5
exposure than the
functions used in the GBD 2013 study. The GBD 2016 risk functions are somewhat higher
for IHD at higher exposure levels, somewhat lower for stroke, and substantially lower for
lung cancer. Lung cancer mortality is, however, a very minor share of total mortality from
ambient PM2.5
. Thus, in aggregate at all exposure levels, the health damages of PM2.5
expo-
sure are larger according to the exposure-response functions used in the GBD 2016 study
than according to the functions used in the GBD 2013 study.
The Global Health Cost of Ambient PM2.5
Air Pollution 4746World Bank Group
Global Health Damages of Ambient PM2.5 Exposure
As many as 4.1 million people died from ambient PM2.5
air pollution in 2016 according to
the GBD 2016 study. This makes ambient PM2.5
the seventh-largest health risk factor of
global deaths among dozens of risk factors assessed by the GBD 2016 study.
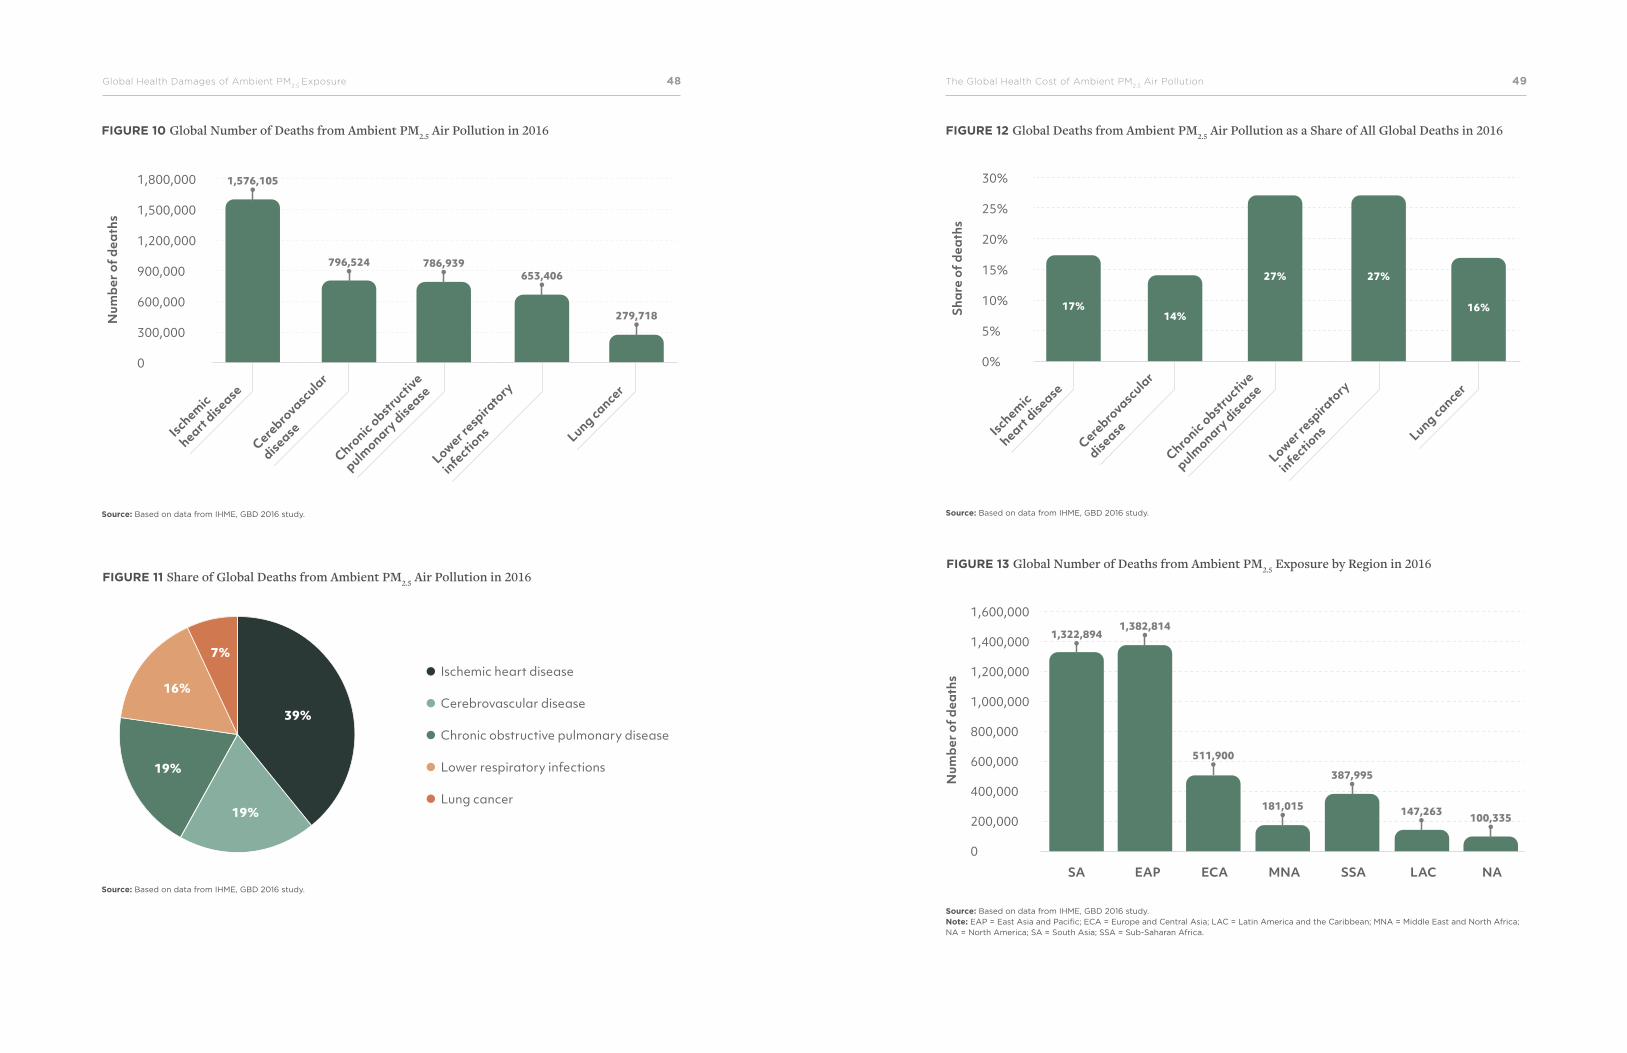
Globally, IHD accounts for 39 percent of deaths from ambient PM2.5
, stroke for 19 percent,
COPD for 19 percent, LRI for 16 percent, and lung cancer for 7 percent according to the
GBD 2016 study (see figure 10 for global number of deaths associated with ambient PM2.5
and figure 11 for percent share of associated diseases).
For perspective, global deaths from ambient PM2.5
air pollution constituted as much as 7.5
percent of all global deaths in 2016. For the five health outcomes of PM2.5
exposure, ambi-
ent PM2.5
caused 14–17 percent of global deaths from IHD, stroke, and lung cancer and 27
percent of global deaths from COPD and LRI (figure 12).
By region, two-thirds of global deaths from ambient PM2.5
exposure in 2016 occurred in
South Asia and East Asia and Pacific (figure 13). India accounted for 78 percent of these
deaths in South Asia and China for 77 percent in East Asia and Pacific. Deaths from ambi-
ent PM2.5
in these two countries constituted 52 percent of global deaths from ambient PM2.5
.
48Global Health Damages of Ambient PM2.5
Exposure The Global Health Cost of Ambient PM2.5
Air Pollution 49
1,800,000
1,500,000
1,200,000
900,000
600,000
300,000
0
Num
ber o
f dea
ths
Ischemic
heart disease
Cerebro
vascular
disease
Chronic obstru
ctive
pulmonary
disease
Lower respira
tory
infectio
ns Lung cancer
116
1,576,105
796,524 786,939653,406
116279,718
FIGURE 10 Global Number of Deaths from Ambient PM2.5 Air Pollution in 2016 FIGURE 12 Global Deaths from Ambient PM2.5 Air Pollution as a Share of All Global Deaths in 2016
FIGURE 13 Global Number of Deaths from Ambient PM2.5 Exposure by Region in 2016
Source: Based on data from IHME, GBD 2016 study. Source: Based on data from IHME, GBD 2016 study.
Source: Based on data from IHME, GBD 2016 study.
39%
19%
7%
16%
19%
Ischemic heart disease
Cerebrovascular disease
Chronic obstructive pulmonary disease
Lower respiratory infections
Lung cancer
FIGURE 11 Share of Global Deaths from Ambient PM2.5 Air Pollution in 2016
30%
25%
20%
15%
10%
5%
0%
Shar
e of
dea
ths
Ischemic
heart disease
Cerebro
vascular
disease
Chronic obstru
ctive
pulmonary
disease
Lower respira
tory
infectio
ns Lung cancer
17%14%
27% 27%
16%
1,600,000
1,400,000
1,200,000
1,000,000
800,000
600,000
400,000
200,000
0
SA EAP ECA MNA SSA LAC NA
100,335
1,322,8941,382,814
511,900
181,015
387,995
147,263
Num
ber o
f dea
ths
Source: Based on data from IHME, GBD 2016 study. Note: EAP = East Asia and Pacific; ECA = Europe and Central Asia; LAC = Latin America and the Caribbean; MNA = Middle East and North Africa; NA = North America; SA = South Asia; SSA = Sub-Saharan Africa.
50Global Health Damages of Ambient PM2.5
Exposure The Global Health Cost of Ambient PM2.5
Air Pollution 51
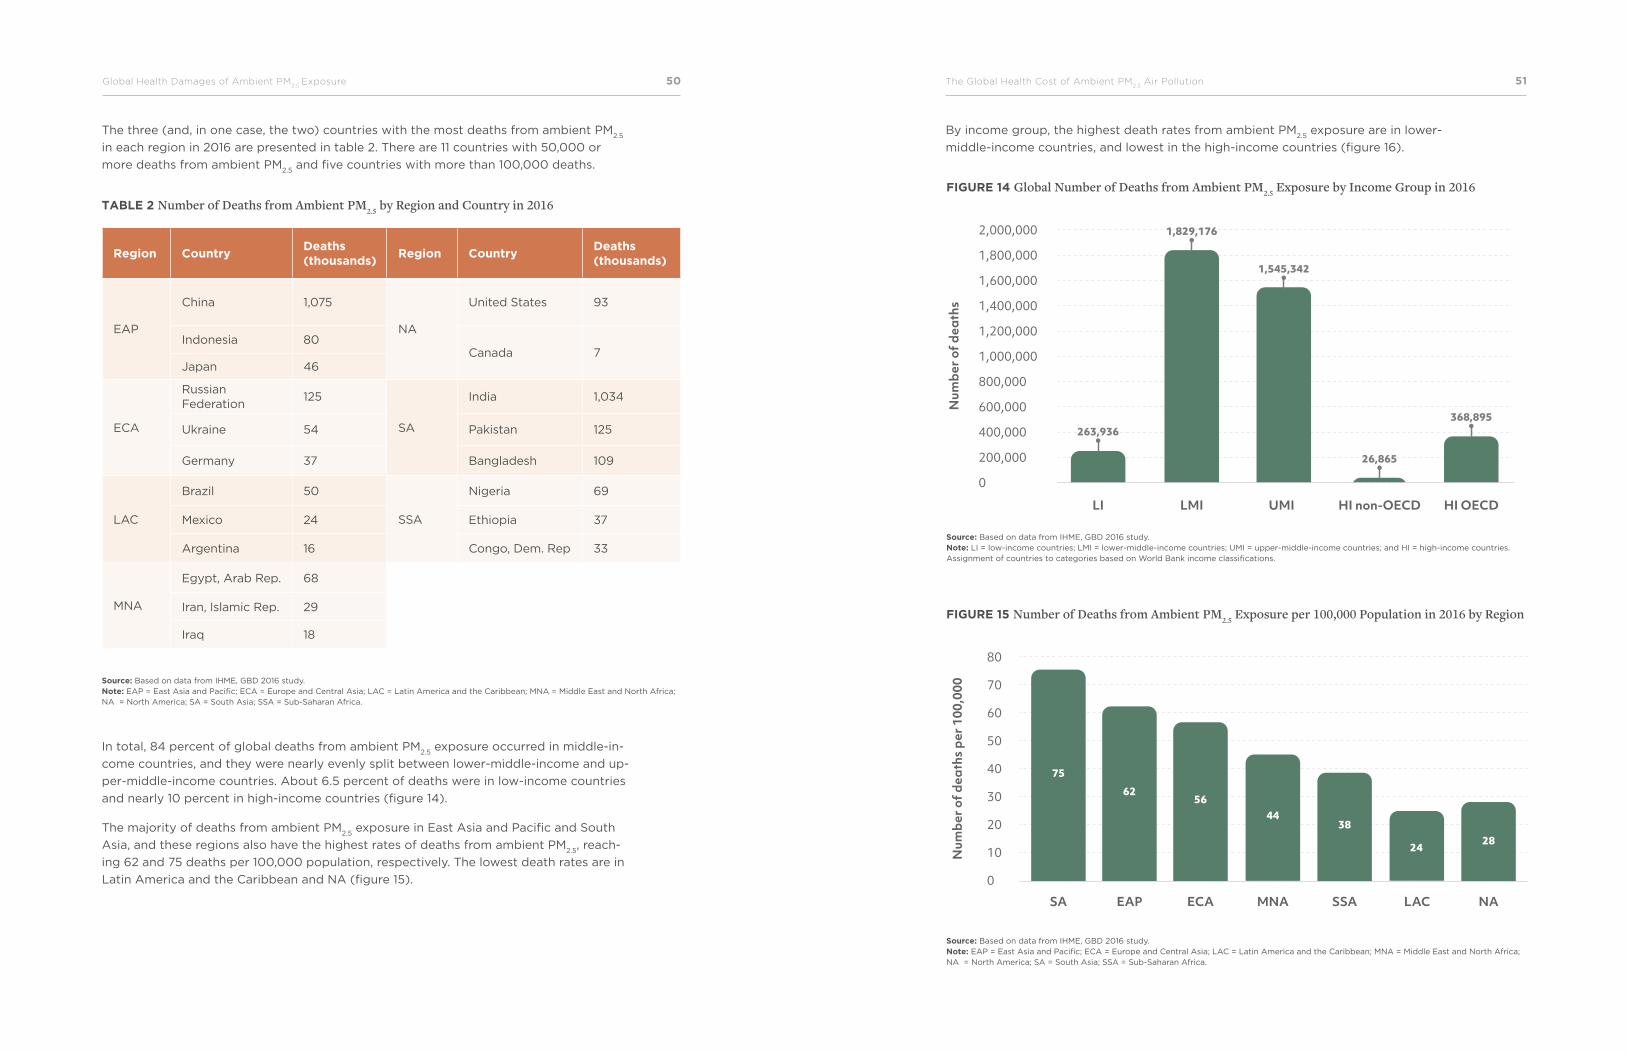
The three (and, in one case, the two) countries with the most deaths from ambient PM2.5
in each region in 2016 are presented in table 2. There are 11 countries with 50,000 or
more deaths from ambient PM2.5
and five countries with more than 100,000 deaths.
TABLE 2 Number of Deaths from Ambient PM2.5 by Region and Country in 2016
Region CountryDeaths (thousands)
Region CountryDeaths (thousands)
EAP
China 1,075
NA
United States 93
Indonesia 80Canada 7
Japan 46
ECA
Russian Federation
125
SA
India 1,034
Ukraine 54 Pakistan 125
Germany 37 Bangladesh 109
LAC
Brazil 50
SSA
Nigeria 69
Mexico 24 Ethiopia 37
Argentina 16 Congo, Dem. Rep 33
MNA
Egypt, Arab Rep. 68
Iran, Islamic Rep. 29
Iraq 18
Source: Based on data from IHME, GBD 2016 study. Note: EAP = East Asia and Pacific; ECA = Europe and Central Asia; LAC = Latin America and the Caribbean; MNA = Middle East and North Africa; NA = North America; SA = South Asia; SSA = Sub-Saharan Africa.
In total, 84 percent of global deaths from ambient PM2.5
exposure occurred in middle-in-
come countries, and they were nearly evenly split between lower-middle-income and up-
per-middle-income countries. About 6.5 percent of deaths were in low-income countries
and nearly 10 percent in high-income countries (figure 14).
The majority of deaths from ambient PM2.5
exposure in East Asia and Pacific and South
Asia, and these regions also have the highest rates of deaths from ambient PM2.5
, reach-
ing 62 and 75 deaths per 100,000 population, respectively. The lowest death rates are in
Latin America and the Caribbean and NA (figure 15).
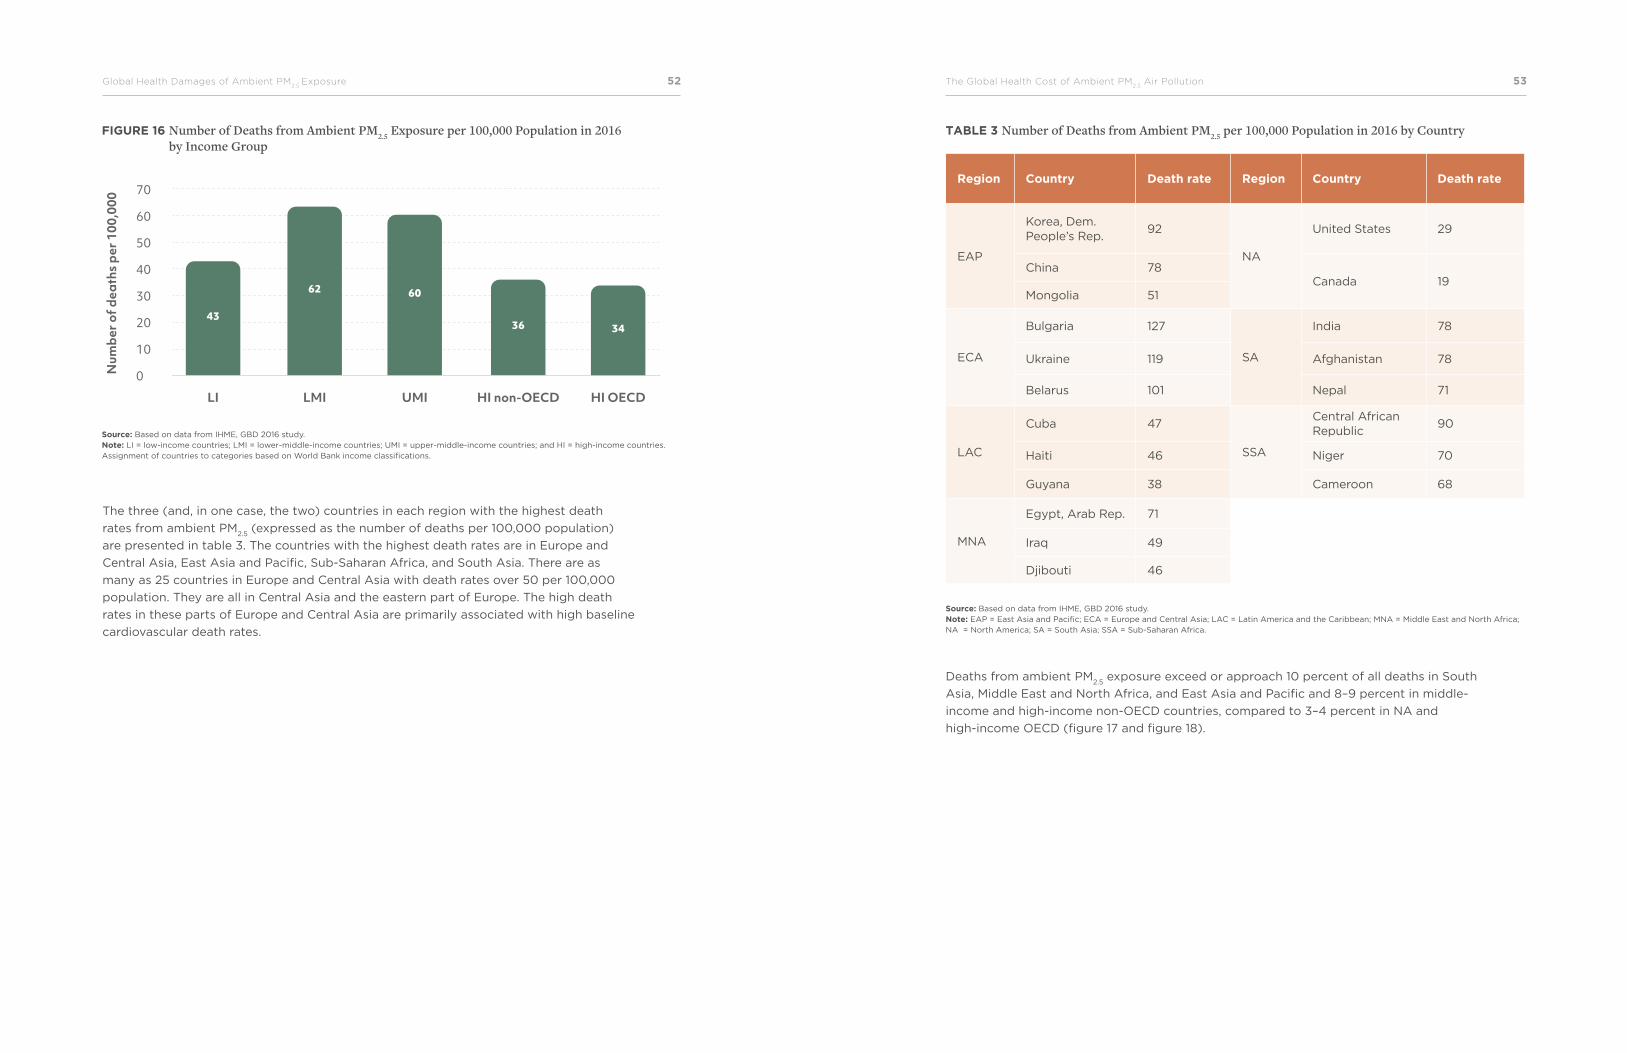
By income group, the highest death rates from ambient PM2.5
exposure are in lower-
middle-income countries, and lowest in the high-income countries (figure 16).
LI LMI UMI HI non-OECD HI OECD
2,000,000
1,800,000
1,600,000
1,400,000
1,200,000
1,000,000
800,000
600,000
400,000
200,000
0
Num
ber o
f dea
ths
263,936
1,829,176
1,545,342
26,865
368,895
FIGURE 14 Global Number of Deaths from Ambient PM2.5 Exposure by Income Group in 2016
FIGURE 15 Number of Deaths from Ambient PM2.5 Exposure per 100,000 Population in 2016 by Region
Source: Based on data from IHME, GBD 2016 study. Note: LI = low-income countries; LMI = lower-middle-income countries; UMI = upper-middle-income countries; and HI = high-income countries. Assignment of countries to categories based on World Bank income classifications.
Source: Based on data from IHME, GBD 2016 study. Note: EAP = East Asia and Pacific; ECA = Europe and Central Asia; LAC = Latin America and the Caribbean; MNA = Middle East and North Africa; NA = North America; SA = South Asia; SSA = Sub-Saharan Africa.
80
70
60
50
40
30
20
10
0
SA EAP ECA MNA SSA LAC NA
75
62
4438
2428
56
Num
ber o
f dea
ths
per 1
00,0
00
52Global Health Damages of Ambient PM2.5
Exposure The Global Health Cost of Ambient PM2.5
Air Pollution 53
FIGURE 16 Number of Deaths from Ambient PM2.5 Exposure per 100,000 Population in 2016 by Income Group
Source: Based on data from IHME, GBD 2016 study. Note: LI = low-income countries; LMI = lower-middle-income countries; UMI = upper-middle-income countries; and HI = high-income countries. Assignment of countries to categories based on World Bank income classifications.
70
60
50
40
30
20
10
0Num
ber o
f dea
ths
per 1
00,0
00
43
62 60
36 34
LI LMI UMI HI non-OECD HI OECD
The three (and, in one case, the two) countries in each region with the highest death
rates from ambient PM2.5
(expressed as the number of deaths per 100,000 population)
are presented in table 3. The countries with the highest death rates are in Europe and
Central Asia, East Asia and Pacific, Sub-Saharan Africa, and South Asia. There are as
many as 25 countries in Europe and Central Asia with death rates over 50 per 100,000
population. They are all in Central Asia and the eastern part of Europe. The high death
rates in these parts of Europe and Central Asia are primarily associated with high baseline
cardiovascular death rates.
TABLE 3 Number of Deaths from Ambient PM2.5 per 100,000 Population in 2016 by Country
Region Country Death rate Region Country Death rate
EAP
Korea, Dem. People’s Rep.
92
NA
United States 29
China 78Canada 19
Mongolia 51
ECA
Bulgaria 127
SA
India 78
Ukraine 119 Afghanistan 78
Belarus 101 Nepal 71
LAC
Cuba 47
SSA
Central African Republic
90
Haiti 46 Niger 70
Guyana 38 Cameroon 68
MNA
Egypt, Arab Rep. 71
Iraq 49
Djibouti 46
Source: Based on data from IHME, GBD 2016 study. Note: EAP = East Asia and Pacific; ECA = Europe and Central Asia; LAC = Latin America and the Caribbean; MNA = Middle East and North Africa; NA = North America; SA = South Asia; SSA = Sub-Saharan Africa.
Deaths from ambient PM2.5
exposure exceed or approach 10 percent of all deaths in South
Asia, Middle East and North Africa, and East Asia and Pacific and 8–9 percent in middle-
income and high-income non-OECD countries, compared to 3–4 percent in NA and
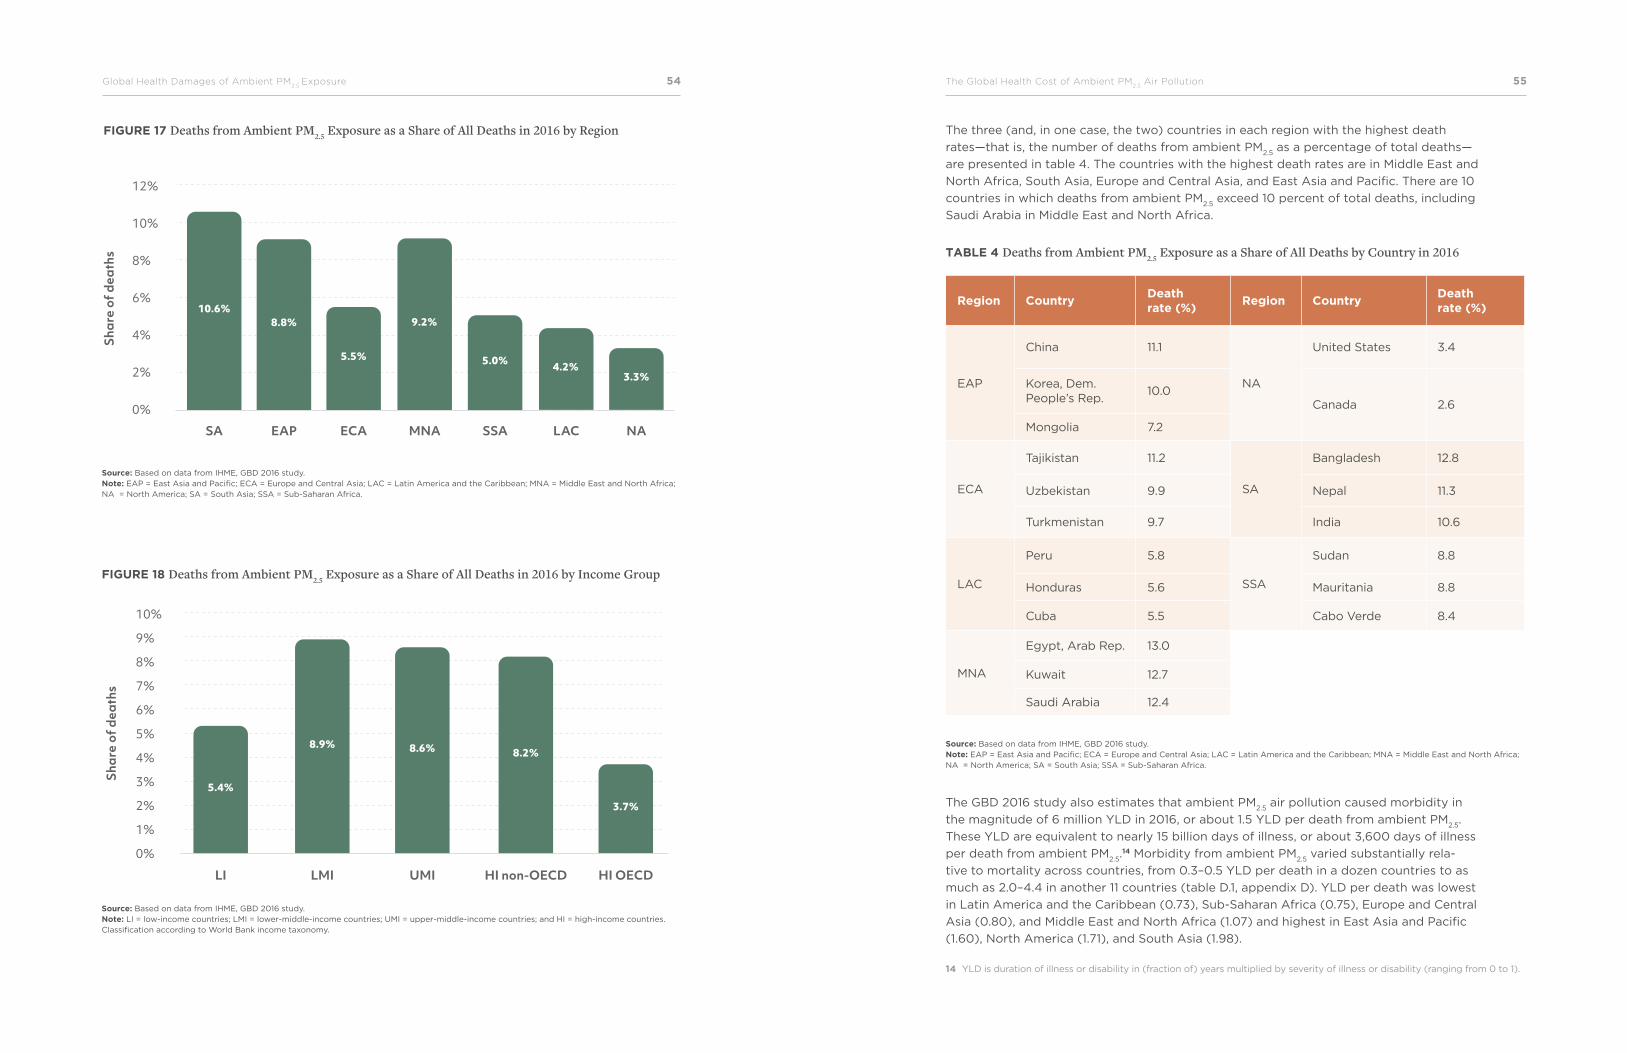
high-income OECD (figure 17 and figure 18).
54Global Health Damages of Ambient PM2.5
Exposure The Global Health Cost of Ambient PM2.5
Air Pollution 55
12%
10%
8%
6%
4%
2%
0%
SA EAP ECA MNA SSA LAC NA
8.8%10.6%
5.5%
9.2%
5.0% 4.2%3.3%
Shar
e of
dea
ths
FIGURE 17 Deaths from Ambient PM2.5 Exposure as a Share of All Deaths in 2016 by Region
FIGURE 18 Deaths from Ambient PM2.5 Exposure as a Share of All Deaths in 2016 by Income Group
Source: Based on data from IHME, GBD 2016 study. Note: EAP = East Asia and Pacific; ECA = Europe and Central Asia; LAC = Latin America and the Caribbean; MNA = Middle East and North Africa; NA = North America; SA = South Asia; SSA = Sub-Saharan Africa.
Source: Based on data from IHME, GBD 2016 study. Note: LI = low-income countries; LMI = lower-middle-income countries; UMI = upper-middle-income countries; and HI = high-income countries. Classification according to World Bank income taxonomy.
10%
9%
8%
7%
6%
5%
4%
3%
2%
1%
0%
Shar
e of
dea
ths
5.4%
8.9% 8.6% 8.2%
3.7%
LI LMI UMI HI non-OECD HI OECD
The three (and, in one case, the two) countries in each region with the highest death
rates—that is, the number of deaths from ambient PM2.5
as a percentage of total deaths—
are presented in table 4. The countries with the highest death rates are in Middle East and
North Africa, South Asia, Europe and Central Asia, and East Asia and Pacific. There are 10
countries in which deaths from ambient PM2.5
exceed 10 percent of total deaths, including
Saudi Arabia in Middle East and North Africa.
The GBD 2016 study also estimates that ambient PM2.5
air pollution caused morbidity in
the magnitude of 6 million YLD in 2016, or about 1.5 YLD per death from ambient PM2.5
.
These YLD are equivalent to nearly 15 billion days of illness, or about 3,600 days of illness
per death from ambient PM2.5
.14 Morbidity from ambient PM2.5
varied substantially rela-
tive to mortality across countries, from 0.3–0.5 YLD per death in a dozen countries to as
much as 2.0–4.4 in another 11 countries (table D.1, appendix D). YLD per death was lowest
in Latin America and the Caribbean (0.73), Sub-Saharan Africa (0.75), Europe and Central
Asia (0.80), and Middle East and North Africa (1.07) and highest in East Asia and Pacific
(1.60), North America (1.71), and South Asia (1.98).
TABLE 4 Deaths from Ambient PM2.5 Exposure as a Share of All Deaths by Country in 2016
Region CountryDeath rate (%)
Region CountryDeath rate (%)
EAP
China 11.1
NA
United States 3.4
Korea, Dem. People’s Rep.
10.0Canada 2.6
Mongolia 7.2
ECA
Tajikistan 11.2
SA
Bangladesh 12.8
Uzbekistan 9.9 Nepal 11.3
Turkmenistan 9.7 India 10.6
LAC
Peru 5.8
SSA
Sudan 8.8
Honduras 5.6 Mauritania 8.8
Cuba 5.5 Cabo Verde 8.4
MNA
Egypt, Arab Rep. 13.0
Kuwait 12.7
Saudi Arabia 12.4
Source: Based on data from IHME, GBD 2016 study. Note: EAP = East Asia and Pacific; ECA = Europe and Central Asia; LAC = Latin America and the Caribbean; MNA = Middle East and North Africa; NA = North America; SA = South Asia; SSA = Sub-Saharan Africa.
14 YLD is duration of illness or disability in (fraction of) years multiplied by severity of illness or disability (ranging from 0 to 1).
The Global Health Cost of Ambient PM2.5
Air Pollution 5756World Bank Group
Global Cost of Ambient PM2.5 Exposure
The health damages of ambient PM2.5
exposure can be monetized to provide an estimate
of the welfare cost of PM2.5
. The valuation of mortality in this report follows the welfare
approach or VSL in World Bank and IHME (2016) (see appendix C). Valuation of morbidi-
ty, measured as the cost of days of illness, is valued at wage rates (see appendix D).
The global cost of health damages from ambient PM2.5
exposure was $5.7 trillion in 2016,
equivalent to 4.8 percent of global GDP (PPP adjusted).15 This estimate is 50 percent
higher in real terms than the estimate for 2013 in World Bank and IHME (2016). The rea-
sons for the higher cost estimate are mainly changes in exposure-response functions, the
substantially higher estimate of global ambient PM2.5
exposure, and the inclusion of an
estimate of the cost of morbidity. The higher estimate of global ambient PM2.5
exposure is
more due to improved methodology and availability of ground-level PM monitoring data
than actual worsening of global ambient PM2.5
air quality from 2013 to 2016, although the
exact contribution of each of these two factors is difficult to ascertain.
About 87 percent of the total global cost of health damages in 2016 is from premature
mortality and 13 percent from morbidity. Cost of morbidity as a share of the total cost
of health damages by country varies from as low as 3 percent to as high as 38 percent
across countries (see table D.1 in appendix D). Regionally, the morbidity cost-share ranges
from 7 percent in Latin America and the Caribbean to 18 percent in NA and 26 percent in
South Asia. The share is 10–15 percent in the regions of Europe and Central Asia, Middle
East and North Africa, East Asia and Pacific, and Sub-Saharan Africa.
The overall global cost of morbidity, relative to the cost of mortality, is very similar to the
estimate by the OECD in its report on the global economic consequences of outdoor air
pollution (OECD 2016) (see appendix D).
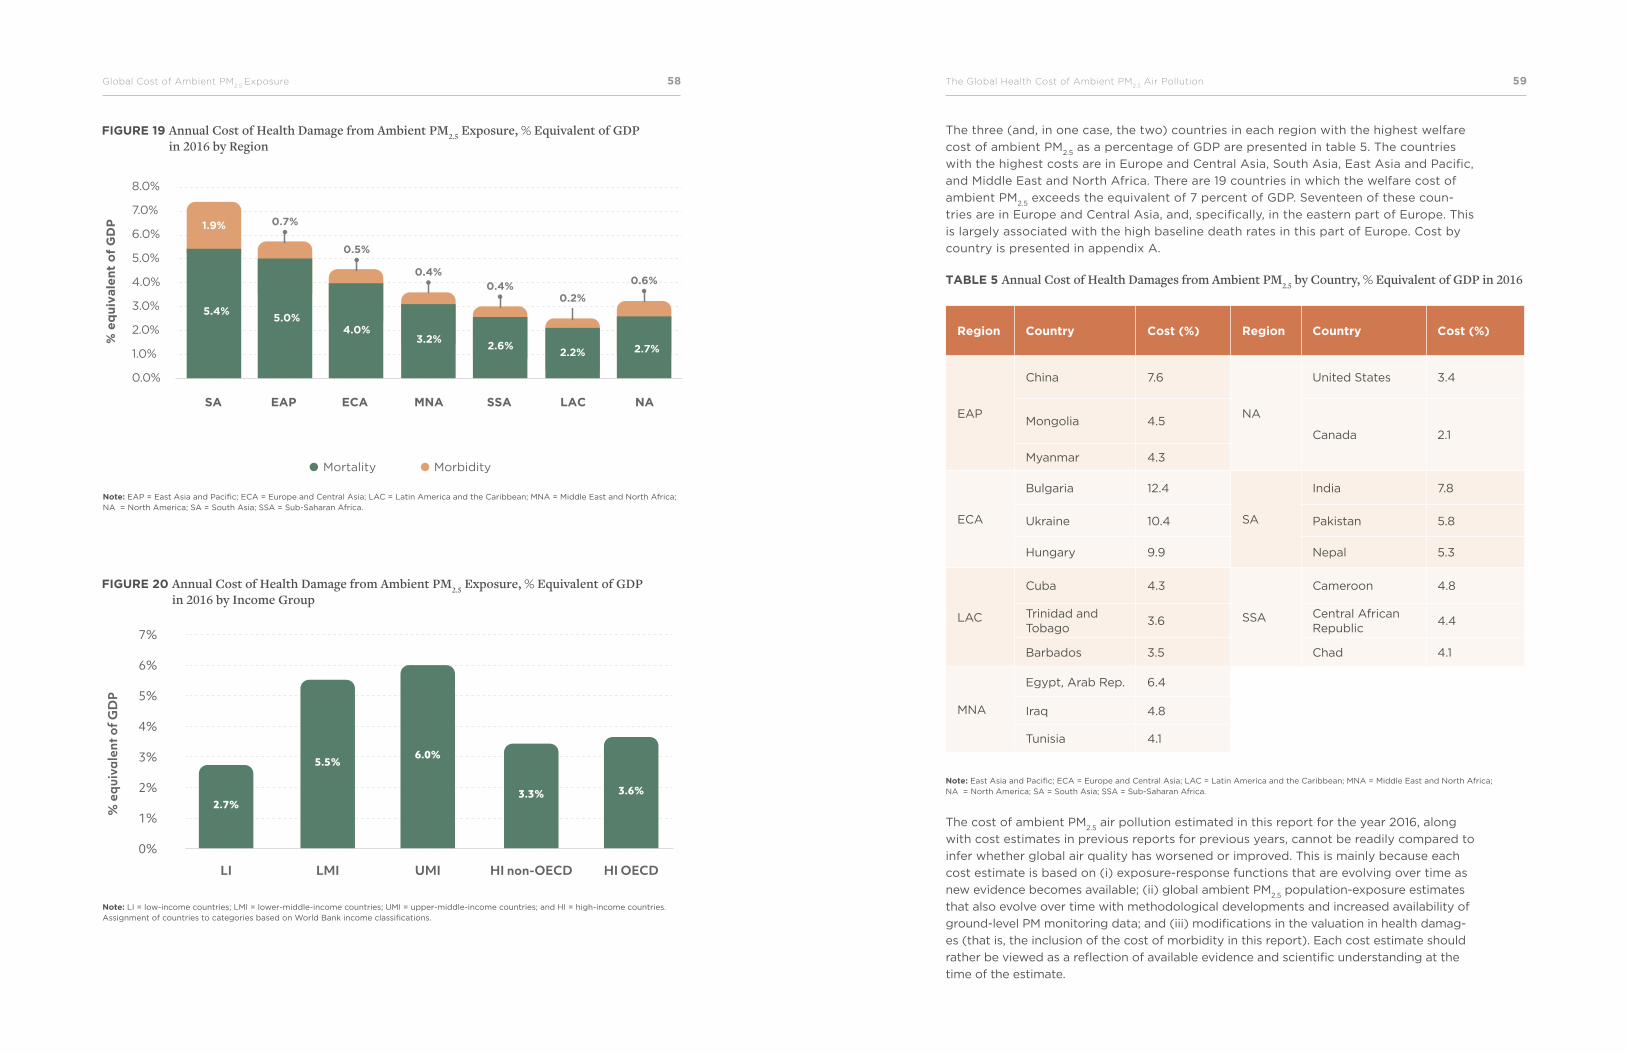
The total cost of health damages—that is, mortality and morbidity—from ambient PM2.5
was the highest in South Asia, at the equivalent of 7.3 percent of GDP, and in upper-
middle-income countries, at the equivalent of 6 percent of GDP. The cost was the lowest
in Latin America and the Caribbean and Sub-Saharan Africa and low-income countries
(figure 19 and figure 20).
15 Expressed in US dollars, this equates to US$3.3 trillion in 2016, equivalent to 4.4 percent of global GDP.
58Global Cost of Ambient PM2.5
Exposure The Global Health Cost of Ambient PM2.5
Air Pollution 59
FIGURE 19 Annual Cost of Health Damage from Ambient PM2.5 Exposure, % Equivalent of GDP in 2016 by Region
FIGURE 20 Annual Cost of Health Damage from Ambient PM2.5 Exposure, % Equivalent of GDP in 2016 by Income Group
Note: EAP = East Asia and Pacific; ECA = Europe and Central Asia; LAC = Latin America and the Caribbean; MNA = Middle East and North Africa; NA = North America; SA = South Asia; SSA = Sub-Saharan Africa.
Note: LI = low-income countries; LMI = lower-middle-income countries; UMI = upper-middle-income countries; and HI = high-income countries. Assignment of countries to categories based on World Bank income classifications.
8.0%
7.0%
6.0%
5.0%
4.0%
3.0%
2.0%
1.0%
0.0%
Mortality Morbidity
% e
qu
ivale
nt
of
GD
P
5.4%5.0%
0.7%
4.0%3.2%
2.6%2.2% 2.7%
1.9%
0.5%
0.4%0.4%
0.2%
0.6%
SA EAP ECA MNA SSA LAC NA
7%
6%
5%
4%
3%
2%
1%
0%
% e
quiv
alen
t of G
DP
2.7%
5.5%6.0%
3.3% 3.6%
LI LMI UMI HI non-OECD HI OECD
The three (and, in one case, the two) countries in each region with the highest welfare
cost of ambient PM2.5
as a percentage of GDP are presented in table 5. The countries
with the highest costs are in Europe and Central Asia, South Asia, East Asia and Pacific,
and Middle East and North Africa. There are 19 countries in which the welfare cost of
ambient PM2.5
exceeds the equivalent of 7 percent of GDP. Seventeen of these coun-
tries are in Europe and Central Asia, and, specifically, in the eastern part of Europe. This
is largely associated with the high baseline death rates in this part of Europe. Cost by
country is presented in appendix A.
TABLE 5 Annual Cost of Health Damages from Ambient PM2.5 by Country, % Equivalent of GDP in 2016
Region Country Cost (%) Region Country Cost (%)
EAP
China 7.6
NA
United States 3.4
Mongolia 4.5Canada 2.1
Myanmar 4.3
ECA
Bulgaria 12.4
SA
India 7.8
Ukraine 10.4 Pakistan 5.8
Hungary 9.9 Nepal 5.3
LAC
Cuba 4.3
SSA
Cameroon 4.8
Trinidad and Tobago
3.6Central African Republic
4.4
Barbados 3.5 Chad 4.1
MNA
Egypt, Arab Rep. 6.4
Iraq 4.8
Tunisia 4.1
Note: East Asia and Pacific; ECA = Europe and Central Asia; LAC = Latin America and the Caribbean; MNA = Middle East and North Africa; NA = North America; SA = South Asia; SSA = Sub-Saharan Africa.
The cost of ambient PM2.5
air pollution estimated in this report for the year 2016, along
with cost estimates in previous reports for previous years, cannot be readily compared to
infer whether global air quality has worsened or improved. This is mainly because each
cost estimate is based on (i) exposure-response functions that are evolving over time as
new evidence becomes available; (ii) global ambient PM2.5
population-exposure estimates
that also evolve over time with methodological developments and increased availability of
ground-level PM monitoring data; and (iii) modifications in the valuation in health damag-
es (that is, the inclusion of the cost of morbidity in this report). Each cost estimate should
rather be viewed as a reflection of available evidence and scientific understanding at the
time of the estimate.
The Global Health Cost of Ambient PM2.5
Air Pollution 6160World Bank Group
Conclusions
• This report provides an estimate of the global cost of ambient PM2.5
air pollution in
2016 based on the GBD 2016 study. It thus represents an update of the estimated
cost in 2013 reported in World Bank and IHME (2016) that was based on the GBD
2013 study.
• This report distinguishes itself from the 2013 estimate in important aspects. It is
based on
— Revised exposure-response functions from the GBD 2016 study that differ from
the functions from the GBD 2013 study for several health outcomes;
— Revised global ambient PM2.5
population-exposure estimates from the GBD 2016
study that are based on calibration from a substantially larger PM ground-level
measurement database than the data used for the GBD 2013 study;
— Annual deaths of 4.1 million from ambient PM2.5
according to the GBD 2016
study, in contrast to 2.9 million according to the GBD 2013 study—a change
which is mainly associated with higher health risks of PM2.5
and higher estimates
of global population exposure to ambient PM2.5
in the GBD 2016 study than in
the GBD 2013 study, rather than with worsening of air quality; and
— Inclusion of an estimate of the cost of morbidity based on estimates of YLD
from ambient PM2.5
reported by the GBD 2016 study.
• Health damages and cost of ambient PM2.5
are staggering, especially in developing
countries, globally reaching 4.1 million deaths and 15 billion days of illness in 2016, with
a welfare cost of $5.7 trillion equivalent to 4.8 percent of global GDP (PPP adjusted).
• This estimated cost for 2016 is 50 percent higher in real terms than the estimate for
2013 in World Bank and IHME (2016). The reasons for the higher cost estimate are
mainly changes in exposure-response functions, a substantially higher estimate of
global ambient PM2.5
exposure due to improved methodology and ground-level PM
monitoring data availability, and inclusion of an estimate of the cost of morbidity. The
higher estimate of global ambient PM2.5
exposure is more due to improved methodol-
ogy and availability of ground-level PM monitoring data than an actual worsening of
global ambient PM2.5
air quality from 2013 to 2016, although the exact contribution of
each of these two factors is difficult to ascertain.
The Global Health Cost of Ambient PM2.5
Air Pollution 6362Conclusions
• About 87 percent of the total global cost of health damages in 2016 is from prema-
ture mortality and 13 percent from morbidity. The cost of morbidity as a share of
total cost varies from as low as 3 percent to as high as 27 percent across countries.
• Two-thirds of the health damages occur in the South Asia and East Asia and
Pacific regions.
• Costs reach as high as 7.5–8 percent of GDP in China and India, the two countries in
which over half of global deaths from ambient PM2.5
occur.
• Although the methodology and ground-level measurements data available for the
global ambient PM2.5
population-exposure estimates from the GBD 2016 study rep-
resent important improvements over the estimates from the GBD 2013 study, based
on calibration from a larger PM ground-level measurement database, the database
nevertheless contains PM measurements from only half of the countries in the world
and is almost entirely lacking large parts of Sub-Saharan Africa.
• PM measurements are particularly scarce in low-income countries and Sub-Saharan
Africa, with one monitor per 54 and 15 million people, respectively, in contrast to one
monitor per 0.3 million people in high-income countries.
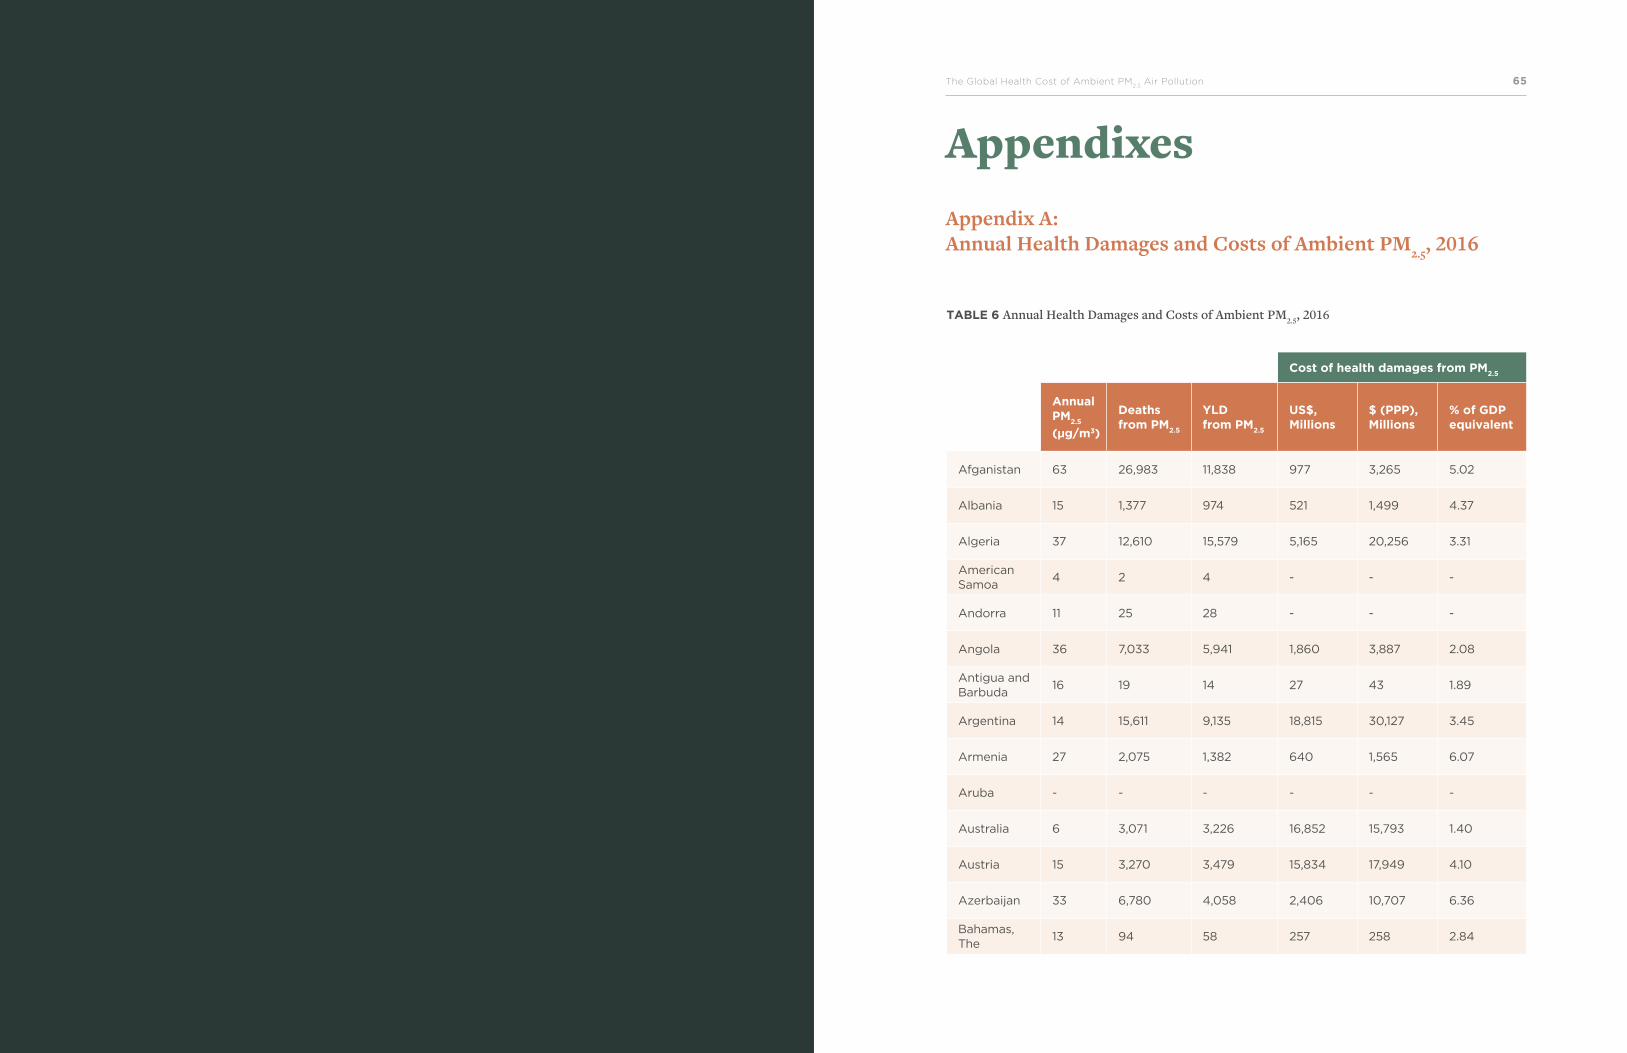
The Global Health Cost of Ambient PM2.5
Air Pollution 6564World Bank Group
AppendixesAppendix A: Annual Health Damages and Costs of Ambient PM2.5, 2016
TABLE 6 Annual Health Damages and Costs of Ambient PM2.5, 2016
Cost of health damages from PM2.5
StudyAnnual PM
2.5
(µg/m3)
Deaths from PM
2.5
YLD from PM
2.5
US$, Millions
$ (PPP), Millions
% of GDP equivalent
Afganistan 63 26,983 11,838 977 3,265 5.02
Albania 15 1,377 974 521 1,499 4.37
Algeria 37 12,610 15,579 5,165 20,256 3.31
American Samoa
4 2 4 - - -
Andorra 11 25 28 - - -
Angola 36 7,033 5,941 1,860 3,887 2.08
Antigua and Barbuda
16 19 14 27 43 1.89
Argentina 14 15,611 9,135 18,815 30,127 3.45
Armenia 27 2,075 1,382 640 1,565 6.07
Aruba - - - - - -
Australia 6 3,071 3,226 16,852 15,793 1.40
Austria 15 3,270 3,479 15,834 17,949 4.10
Azerbaijan 33 6,780 4,058 2,406 10,707 6.36
Bahamas, The
13 94 58 257 258 2.84
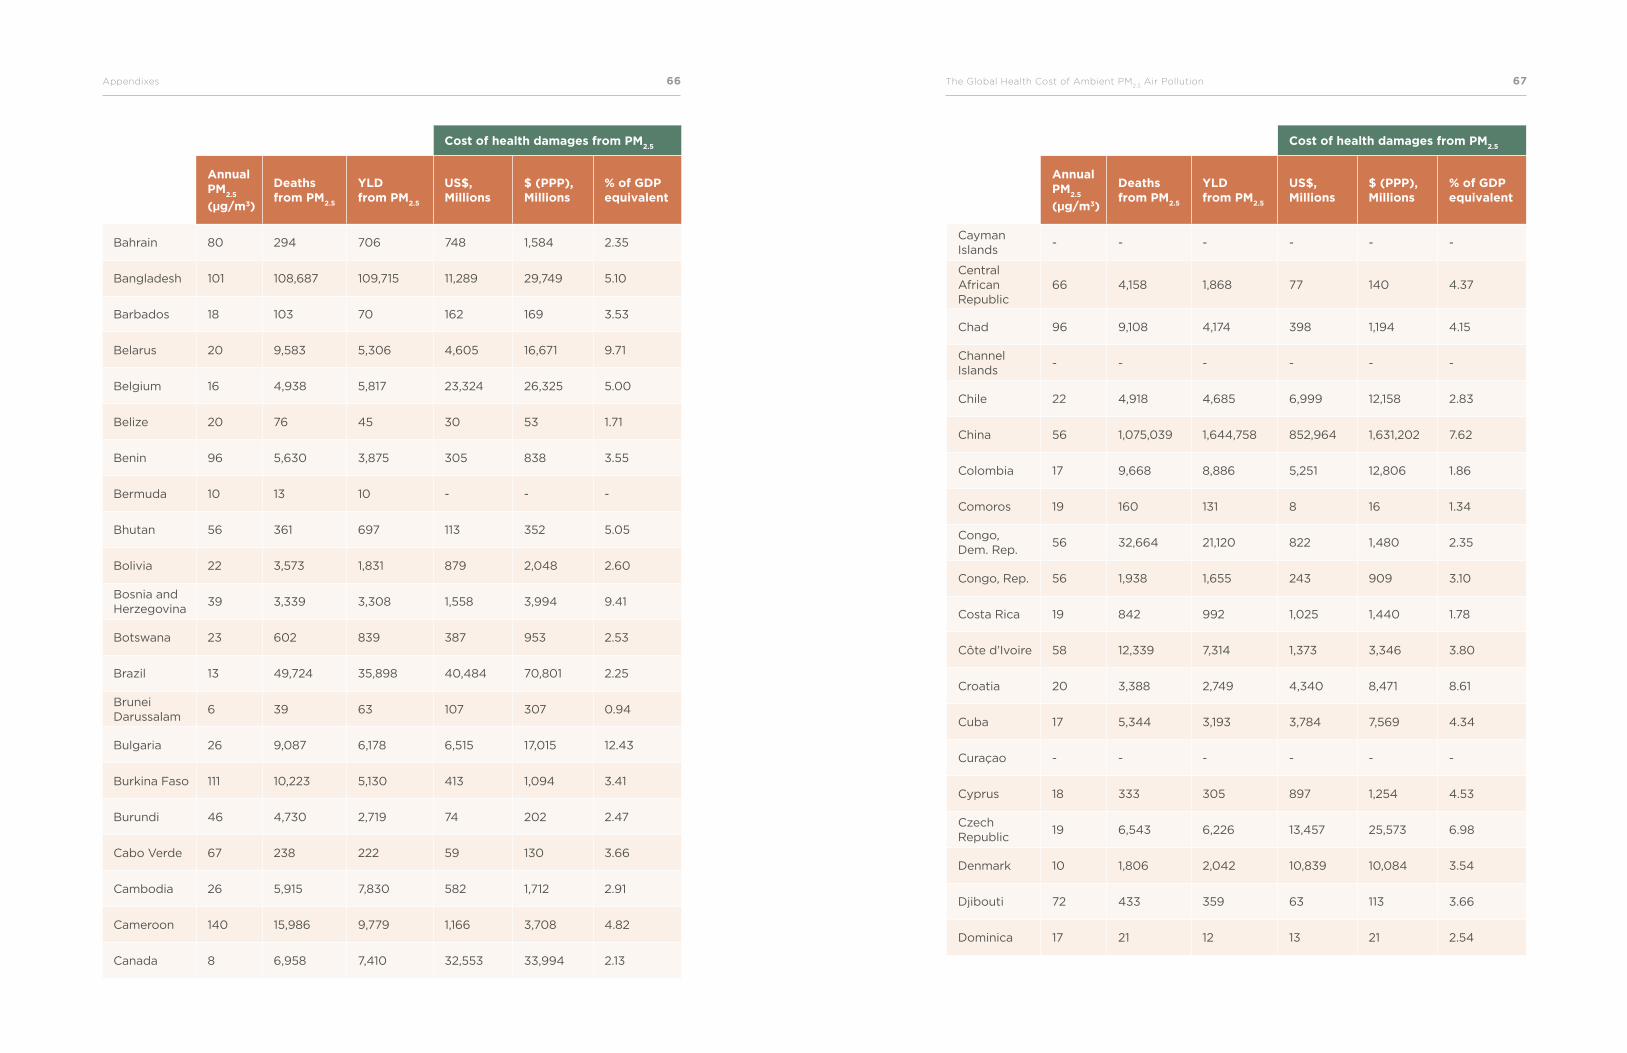
66Appendixes The Global Health Cost of Ambient PM2.5
Air Pollution 67
Cost of health damages from PM2.5
StudyAnnual PM
2.5
(µg/m3)
Deaths from PM
2.5
YLD from PM
2.5
US$, Millions
$ (PPP), Millions
% of GDP equivalent
Bahrain 80 294 706 748 1,584 2.35
Bangladesh 101 108,687 109,715 11,289 29,749 5.10
Barbados 18 103 70 162 169 3.53
Belarus 20 9,583 5,306 4,605 16,671 9.71
Belgium 16 4,938 5,817 23,324 26,325 5.00
Belize 20 76 45 30 53 1.71
Benin 96 5,630 3,875 305 838 3.55
Bermuda 10 13 10 - - -
Bhutan 56 361 697 113 352 5.05
Bolivia 22 3,573 1,831 879 2,048 2.60
Bosnia and Herzegovina
39 3,339 3,308 1,558 3,994 9.41
Botswana 23 602 839 387 953 2.53
Brazil 13 49,724 35,898 40,484 70,801 2.25
Brunei Darussalam
6 39 63 107 307 0.94
Bulgaria 26 9,087 6,178 6,515 17,015 12.43
Burkina Faso 111 10,223 5,130 413 1,094 3.41
Burundi 46 4,730 2,719 74 202 2.47
Cabo Verde 67 238 222 59 130 3.66
Cambodia 26 5,915 7,830 582 1,712 2.91
Cameroon 140 15,986 9,779 1,166 3,708 4.82
Canada 8 6,958 7,410 32,553 33,994 2.13
Cost of health damages from PM2.5
StudyAnnual PM
2.5
(µg/m3)
Deaths from PM
2.5
YLD from PM
2.5
US$, Millions
$ (PPP), Millions
% of GDP equivalent
Cayman Islands
- - - - - -
Central African Republic
66 4,158 1,868 77 140 4.37
Chad 96 9,108 4,174 398 1,194 4.15
Channel Islands
- - - - - -
Chile 22 4,918 4,685 6,999 12,158 2.83
China 56 1,075,039 1,644,758 852,964 1,631,202 7.62
Colombia 17 9,668 8,886 5,251 12,806 1.86
Comoros 19 160 131 8 16 1.34
Congo, Dem. Rep.
56 32,664 21,120 822 1,480 2.35
Congo, Rep. 56 1,938 1,655 243 909 3.10
Costa Rica 19 842 992 1,025 1,440 1.78
Côte d’Ivoire 58 12,339 7,314 1,373 3,346 3.80
Croatia 20 3,388 2,749 4,340 8,471 8.61
Cuba 17 5,344 3,193 3,784 7,569 4.34
Curaçao - - - - - -
Cyprus 18 333 305 897 1,254 4.53
Czech Republic
19 6,543 6,226 13,457 25,573 6.98
Denmark 10 1,806 2,042 10,839 10,084 3.54
Djibouti 72 433 359 63 113 3.66
Dominica 17 21 12 13 21 2.54

68Appendixes The Global Health Cost of Ambient PM2.5
Air Pollution 69
Cost of health damages from PM2.5
StudyAnnual PM
2.5
(µg/m3)
Deaths from PM
2.5
YLD from PM
2.5
US$, Millions
$ (PPP), Millions
% of GDP equivalent
Dominican Republic
24 2,964 1,798 1,825 4,128 2.55
Ecuador 13 2,240 1,720 1,144 2,163 1.17
Egypt, Arab Rep.
126 67,555 62,069 21,604 68,429 6.42
El Salvador 33 1,969 1,365 706 1,441 2.64
Equatorial Guinea
71 240 389 217 666 2.14
Eritrea 51 1,832 1,264 - - -
Estonia 6 388 271 728 1,216 3.14
Eswatini 24 425 402 111 335 2.99
Ethiopia 50 37,342 27,642 1,683 4,131 2.33
Faroe Islands - - - - - -
Fiji 8 191 183 90 167 1.94
Finland 6 1,099 1,286 5,425 5,420 2.29
France 12 16,444 12,083 67,383 75,814 2.73
French Polynesia
- - - - - -
Gabon 47 684 690 482 1,215 3.39
Gambia, The 95 754 579 23 83 2.41
Georgia 21 3,533 1,997 1,142 2,963 7.97
Germany 13 36,938 40,479 170,910 198,597 4.93
Ghana 54 11,803 8,768 1,344 3,814 3.15
Gibraltar - - - - - -
Cost of health damages from PM2.5
StudyAnnual PM
2.5
(µg/m3)
Deaths from PM
2.5
YLD from PM
2.5
US$, Millions
$ (PPP), Millions
% of GDP equivalent
Greece 11 5,818 6,977 11,661 17,251 5.99
Greenland 4 3 5 - - -
Grenada 18 39 18 33 49 3.27
Guam 9 58 71 - - -
Guatemala 29 4,105 2,420 1,400 2,683 2.04
Guinea 46 6,585 3,422 196 506 3.11
Guinea- Bissau
59 1,153 619 44 112 3.90
Guyana 20 295 116 106 186 3.07
Haiti 24 4,941 1,613 220 530 2.74
Honduras 29 2,516 1,544 454 911 2.11
Hong Kong SAR, China
- - - - - -
Hungary 25 8,999 7,971 12,355 26,028 9.94
Iceland 7 58 78 393 337 1.96
India 76 1,034,420 2,274,778 177,298 681,683 7.83
Indonesia 17 79,739 141,136 28,062 91,270 3.01
Iran, Islamic Rep.
49 28,716 34,603 13,890 47,760 3.53
Iraq 73 18,191 14,795 8,245 31,040 4.81
Ireland 9 1,060 1,258 6,827 7,633 2.32
Isle of Man - - - - - -
Israel 19 1,815 2,399 8,032 8,163 2.52
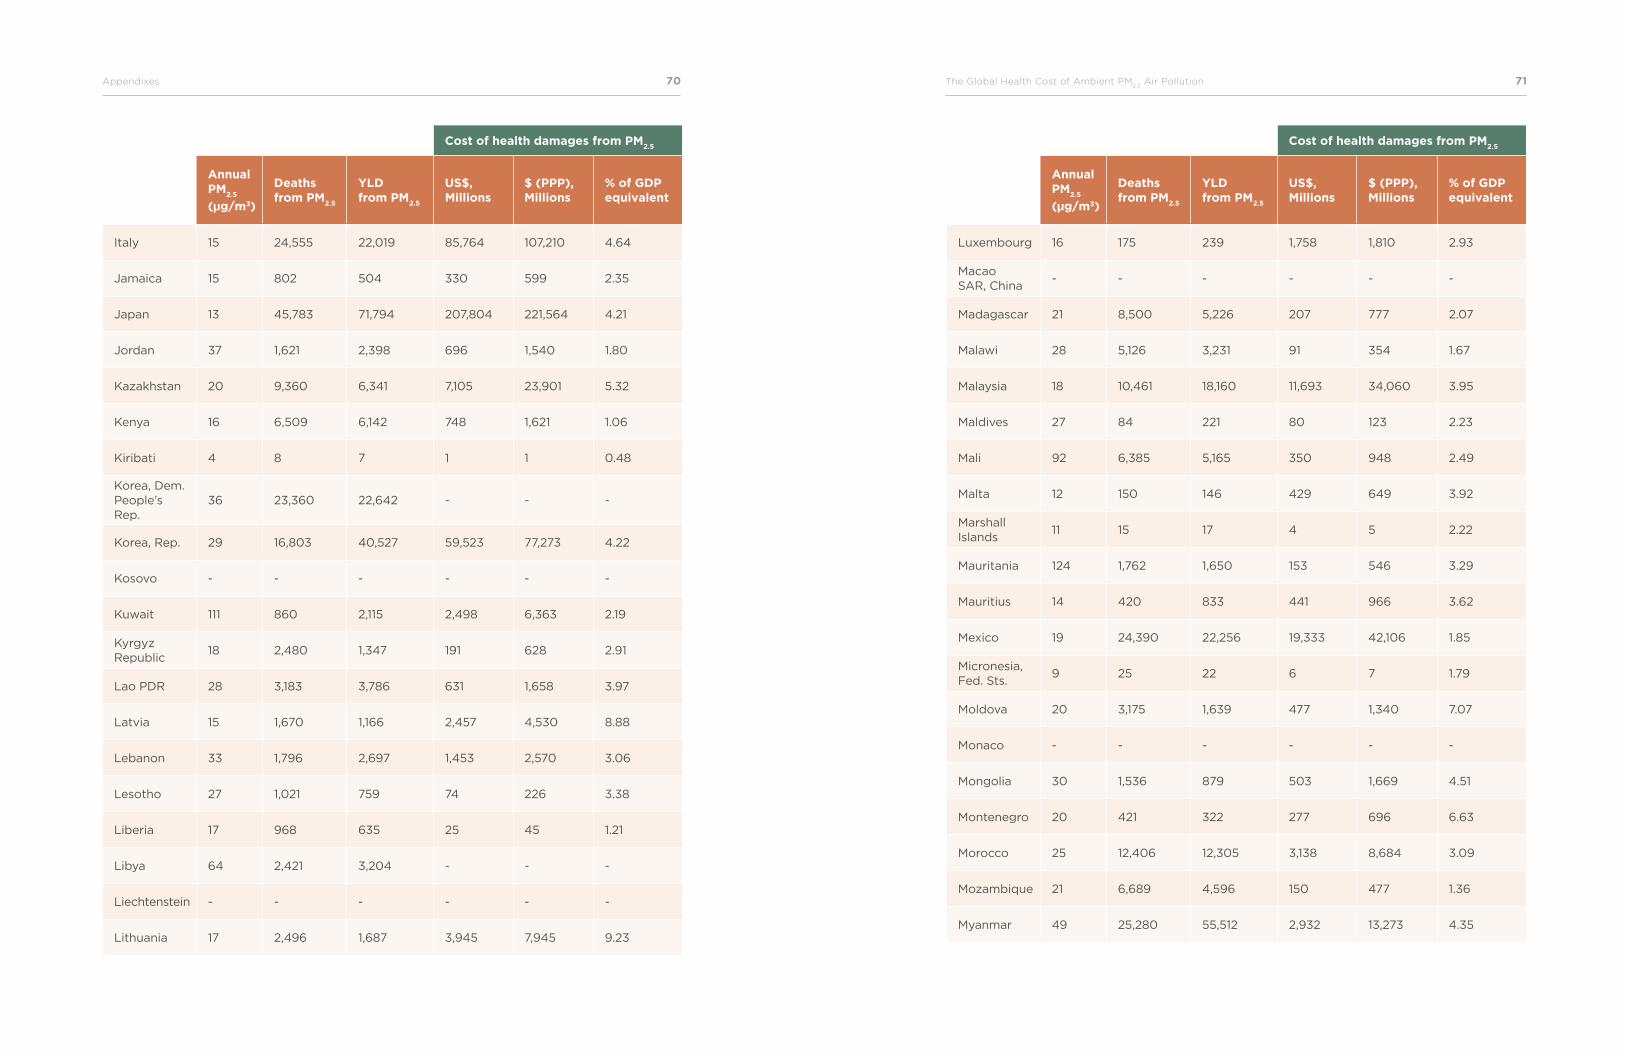
70Appendixes The Global Health Cost of Ambient PM2.5
Air Pollution 71
Cost of health damages from PM2.5
StudyAnnual PM
2.5
(µg/m3)
Deaths from PM
2.5
YLD from PM
2.5
US$, Millions
$ (PPP), Millions
% of GDP equivalent
Italy 15 24,555 22,019 85,764 107,210 4.64
Jamaica 15 802 504 330 599 2.35
Japan 13 45,783 71,794 207,804 221,564 4.21
Jordan 37 1,621 2,398 696 1,540 1.80
Kazakhstan 20 9,360 6,341 7,105 23,901 5.32
Kenya 16 6,509 6,142 748 1,621 1.06
Kiribati 4 8 7 1 1 0.48
Korea, Dem. People’s Rep.
36 23,360 22,642 - - -
Korea, Rep. 29 16,803 40,527 59,523 77,273 4.22
Kosovo - - - - - -
Kuwait 111 860 2,115 2,498 6,363 2.19
Kyrgyz Republic
18 2,480 1,347 191 628 2.91
Lao PDR 28 3,183 3,786 631 1,658 3.97
Latvia 15 1,670 1,166 2,457 4,530 8.88
Lebanon 33 1,796 2,697 1,453 2,570 3.06
Lesotho 27 1,021 759 74 226 3.38
Liberia 17 968 635 25 45 1.21
Libya 64 2,421 3,204 - - -
Liechtenstein - - - - - -
Lithuania 17 2,496 1,687 3,945 7,945 9.23
Cost of health damages from PM2.5
StudyAnnual PM
2.5
(µg/m3)
Deaths from PM
2.5
YLD from PM
2.5
US$, Millions
$ (PPP), Millions
% of GDP equivalent
Luxembourg 16 175 239 1,758 1,810 2.93
Macao SAR, China
- - - - - -
Madagascar 21 8,500 5,226 207 777 2.07
Malawi 28 5,126 3,231 91 354 1.67
Malaysia 18 10,461 18,160 11,693 34,060 3.95
Maldives 27 84 221 80 123 2.23
Mali 92 6,385 5,165 350 948 2.49
Malta 12 150 146 429 649 3.92
Marshall Islands
11 15 17 4 5 2.22
Mauritania 124 1,762 1,650 153 546 3.29
Mauritius 14 420 833 441 966 3.62
Mexico 19 24,390 22,256 19,333 42,106 1.85
Micronesia, Fed. Sts.
9 25 22 6 7 1.79
Moldova 20 3,175 1,639 477 1,340 7.07
Monaco - - - - - -
Mongolia 30 1,536 879 503 1,669 4.51
Montenegro 20 421 322 277 696 6.63
Morocco 25 12,406 12,305 3,138 8,684 3.09
Mozambique 21 6,689 4,596 150 477 1.36
Myanmar 49 25,280 55,512 2,932 13,273 4.35
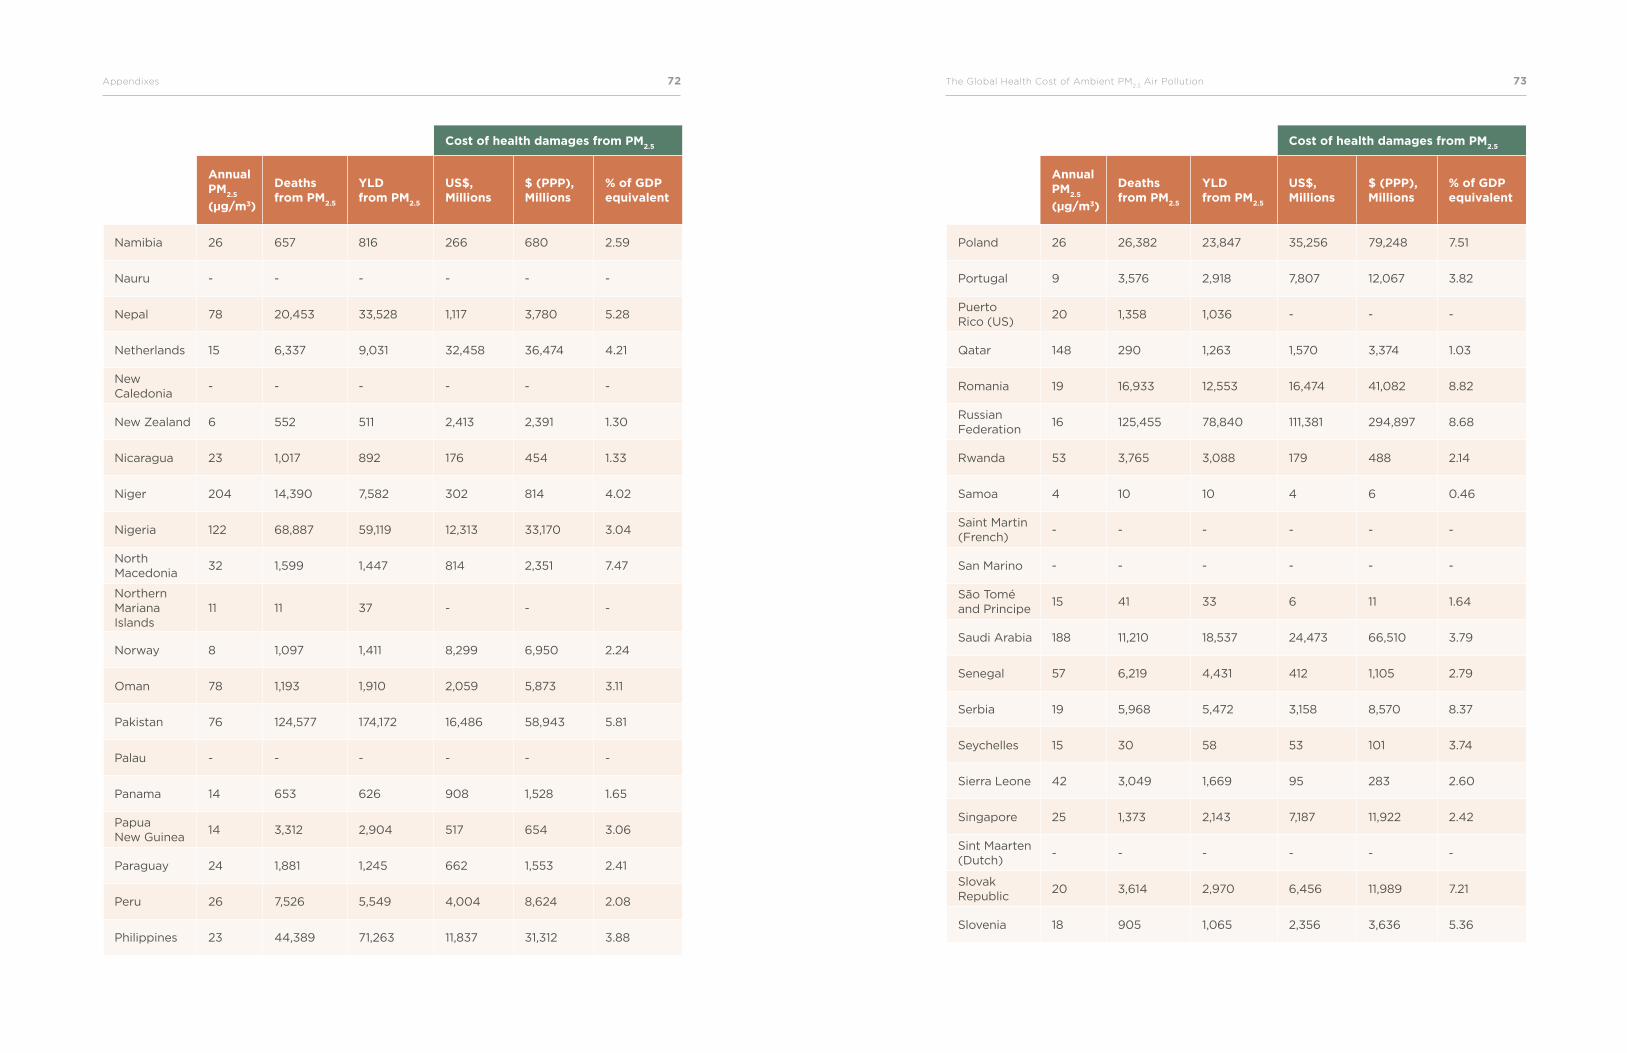
72Appendixes The Global Health Cost of Ambient PM2.5
Air Pollution 73
Cost of health damages from PM2.5
StudyAnnual PM
2.5
(µg/m3)
Deaths from PM
2.5
YLD from PM
2.5
US$, Millions
$ (PPP), Millions
% of GDP equivalent
Namibia 26 657 816 266 680 2.59
Nauru - - - - - -
Nepal 78 20,453 33,528 1,117 3,780 5.28
Netherlands 15 6,337 9,031 32,458 36,474 4.21
New Caledonia
- - - - - -
New Zealand 6 552 511 2,413 2,391 1.30
Nicaragua 23 1,017 892 176 454 1.33
Niger 204 14,390 7,582 302 814 4.02
Nigeria 122 68,887 59,119 12,313 33,170 3.04
North Macedonia
32 1,599 1,447 814 2,351 7.47
Northern Mariana Islands
11 11 37 - - -
Norway 8 1,097 1,411 8,299 6,950 2.24
Oman 78 1,193 1,910 2,059 5,873 3.11
Pakistan 76 124,577 174,172 16,486 58,943 5.81
Palau - - - - - -
Panama 14 653 626 908 1,528 1.65
Papua New Guinea
14 3,312 2,904 517 654 3.06
Paraguay 24 1,881 1,245 662 1,553 2.41
Peru 26 7,526 5,549 4,004 8,624 2.08
Philippines 23 44,389 71,263 11,837 31,312 3.88
Cost of health damages from PM2.5
StudyAnnual PM
2.5
(µg/m3)
Deaths from PM
2.5
YLD from PM
2.5
US$, Millions
$ (PPP), Millions
% of GDP equivalent
Poland 26 26,382 23,847 35,256 79,248 7.51
Portugal 9 3,576 2,918 7,807 12,067 3.82
Puerto Rico (US)
20 1,358 1,036 - - -
Qatar 148 290 1,263 1,570 3,374 1.03
Romania 19 16,933 12,553 16,474 41,082 8.82
Russian Federation
16 125,455 78,840 111,381 294,897 8.68
Rwanda 53 3,765 3,088 179 488 2.14
Samoa 4 10 10 4 6 0.46
Saint Martin (French)
- - - - - -
San Marino - - - - - -
São Tomé and Principe
15 41 33 6 11 1.64
Saudi Arabia 188 11,210 18,537 24,473 66,510 3.79
Senegal 57 6,219 4,431 412 1,105 2.79
Serbia 19 5,968 5,472 3,158 8,570 8.37
Seychelles 15 30 58 53 101 3.74
Sierra Leone 42 3,049 1,669 95 283 2.60
Singapore 25 1,373 2,143 7,187 11,922 2.42
Sint Maarten (Dutch)
- - - - - -
Slovak Republic
20 3,614 2,970 6,456 11,989 7.21
Slovenia 18 905 1,065 2,356 3,636 5.36

74Appendixes The Global Health Cost of Ambient PM2.5
Air Pollution 75
Cost of health damages from PM2.5
StudyAnnual PM
2.5
(µg/m3)
Deaths from PM
2.5
YLD from PM
2.5
US$, Millions
$ (PPP), Millions
% of GDP equivalent
Solomon Islands
9 144 115 20 22 1.66
Somalia 24 4,024 1,749 - - -
South Africa 36 21,061 32,619 11,669 29,264 3.96
South Sudan 49 6,926 3,620 348 882 3.85
Spain 10 12,289 9,448 37,072 50,740 3.01
Sri Lanka 26 7,330 16,965 3,470 11,144 4.27
St. Kitts and Nevis
- - - - - -
St. Lucia 17 44 34 30 45 2.21
St. Vincent and the Grenadines
17 38 18 23 38 2.98
Sudan 78 19,046 14,805 3,784 7,411 3.96
Suriname 22 191 109 114 248 3.14
Sweden 5 1,384 1,796 8,061 7,682 1.58
Switzerland 11 2,041 3,177 17,900 14,282 2.71
Syrian Arab Republic
44 6,789 5,486 - - -
Tajikistan 61 4,651 2,679 245 919 3.53
Tanzania 22 14,314 9,080 850 2,693 1.79
Thailand 23 25,432 65,373 15,832 45,334 3.89
Timor-Leste 17 256 433 28 56 1.97
Togo 84 3,603 2,437 138 357 3.15
Tonga 4 5 6 2 3 0.42
Cost of health damages from PM2.5
StudyAnnual PM
2.5
(µg/m3)
Deaths from PM
2.5
YLD from PM
2.5
US$, Millions
$ (PPP), Millions
% of GDP equivalent
Trinidad and Tobago
17 473 299 761 1,580 3.63
Tunisia 36 4,932 5,483 1,736 5,460 4.13
Turkey 37 27,103 45,783 32,340 72,681 3.77
Turkmenistan 38 3,185 1,417 1,903 5,029 5.26
Turks and Caicos Islands
- - - - - -
Tuvalu - - - - - -
Uganda 74 14,566 10,568 584 1,754 2.29
Ukraine 19 53,665 26,015 9,715 36,765 10.42
United Arab Emirates
105 3,093 6,732 11,794 22,702 3.38
United Kingdom
12 24,231 22,706 108,127 115,470 4.13
United States
9 93,376 164,451 622,383 622,383 3.35
Uruguay 12 1,188 887 1,799 2,555 3.43
Uzbekistan 47 20,297 9,605 3,365 10,385 5.01
Vanuatu 9 83 63 17 18 2.19
Venezuela, RB 26 8,559 7,319 - - -
Vietnam 26 40,170 78,104 7,835 23,030 3.87
Virgin Islands (British)
- - - - - -
Virgin Islands (US)
18 61 31 - - -
West Bank and Gaza
19 1,289 876 286 286 2.14
Yemen, Rep. 73 12,562 9,531 911 2,308 3.34
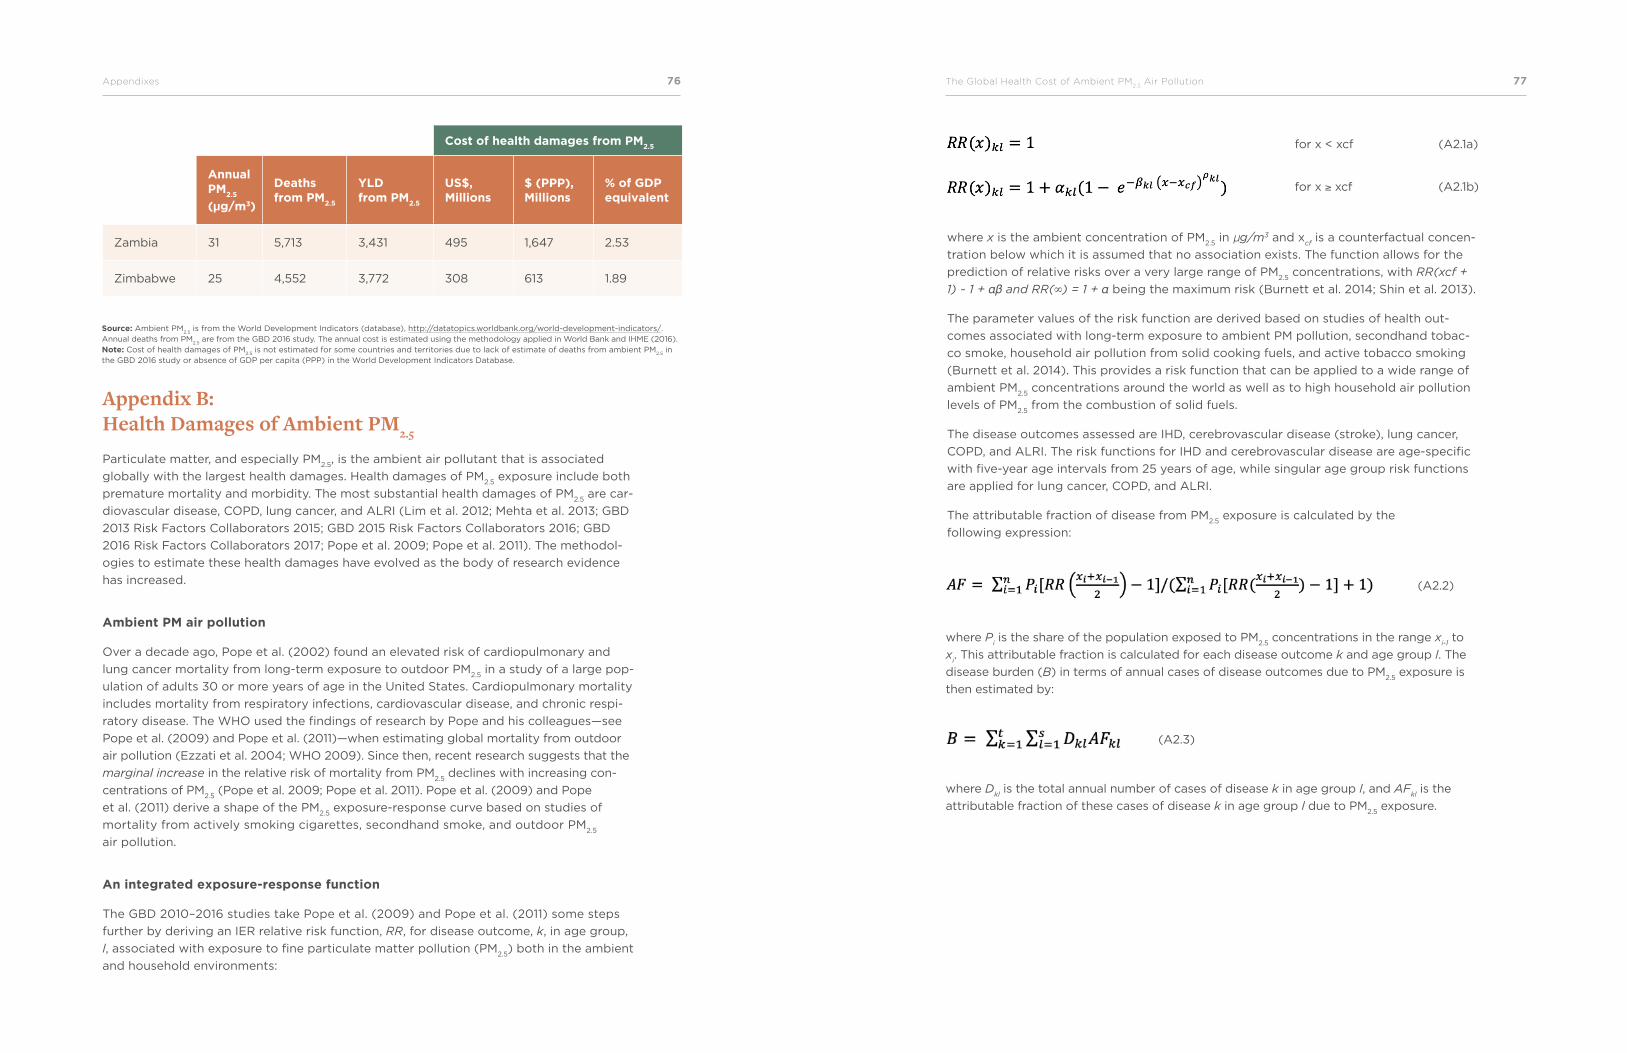
76Appendixes The Global Health Cost of Ambient PM2.5
Air Pollution 77
Cost of health damages from PM2.5
StudyAnnual PM
2.5
(µg/m3)
Deaths from PM
2.5
YLD from PM
2.5
US$, Millions
$ (PPP), Millions
% of GDP equivalent
Zambia 31 5,713 3,431 495 1,647 2.53
Zimbabwe 25 4,552 3,772 308 613 1.89
Source: Ambient PM2.5
is from the World Development Indicators (database), http://datatopics.worldbank.org/world-development-indicators/. Annual deaths from PM
2.5 are from the GBD 2016 study. The annual cost is estimated using the methodology applied in World Bank and IHME (2016).
Note: Cost of health damages of PM2.5
is not estimated for some countries and territories due to lack of estimate of deaths from ambient PM2.5
in the GBD 2016 study or absence of GDP per capita (PPP) in the World Development Indicators Database.
Appendix B: Health Damages of Ambient PM2.5
Particulate matter, and especially PM2.5
, is the ambient air pollutant that is associated
globally with the largest health damages. Health damages of PM2.5
exposure include both
premature mortality and morbidity. The most substantial health damages of PM2.5
are car-
diovascular disease, COPD, lung cancer, and ALRI (Lim et al. 2012; Mehta et al. 2013; GBD
2013 Risk Factors Collaborators 2015; GBD 2015 Risk Factors Collaborators 2016; GBD
2016 Risk Factors Collaborators 2017; Pope et al. 2009; Pope et al. 2011). The methodol-
ogies to estimate these health damages have evolved as the body of research evidence
has increased.
Ambient PM air pollution
Over a decade ago, Pope et al. (2002) found an elevated risk of cardiopulmonary and
lung cancer mortality from long-term exposure to outdoor PM2.5
in a study of a large pop-
ulation of adults 30 or more years of age in the United States. Cardiopulmonary mortality
includes mortality from respiratory infections, cardiovascular disease, and chronic respi-
ratory disease. The WHO used the findings of research by Pope and his colleagues—see
Pope et al. (2009) and Pope et al. (2011)—when estimating global mortality from outdoor
air pollution (Ezzati et al. 2004; WHO 2009). Since then, recent research suggests that the
marginal increase in the relative risk of mortality from PM2.5
declines with increasing con-
centrations of PM2.5
(Pope et al. 2009; Pope et al. 2011). Pope et al. (2009) and Pope
et al. (2011) derive a shape of the PM2.5
exposure-response curve based on studies of
mortality from actively smoking cigarettes, secondhand smoke, and outdoor PM2.5
air pollution.
An integrated exposure-response function
The GBD 2010–2016 studies take Pope et al. (2009) and Pope et al. (2011) some steps
further by deriving an IER relative risk function, RR, for disease outcome, k, in age group,
l, associated with exposure to fine particulate matter pollution (PM2.5
) both in the ambient
and household environments:
for x < xcf (A2.1a)
for x ≥ xcf (A2.1b)
where x is the ambient concentration of PM2.5
in µg/m3 and xcf is a counterfactual concen-
tration below which it is assumed that no association exists. The function allows for the
prediction of relative risks over a very large range of PM2.5
concentrations, with RR(xcf +
1) ~ 1 + αβ and RR(∞) = 1 + α being the maximum risk (Burnett et al. 2014; Shin et al. 2013).
The parameter values of the risk function are derived based on studies of health out-
comes associated with long-term exposure to ambient PM pollution, secondhand tobac-
co smoke, household air pollution from solid cooking fuels, and active tobacco smoking
(Burnett et al. 2014). This provides a risk function that can be applied to a wide range of
ambient PM2.5
concentrations around the world as well as to high household air pollution
levels of PM2.5
from the combustion of solid fuels.
The disease outcomes assessed are IHD, cerebrovascular disease (stroke), lung cancer,
COPD, and ALRI. The risk functions for IHD and cerebrovascular disease are age-specific
with five-year age intervals from 25 years of age, while singular age group risk functions
are applied for lung cancer, COPD, and ALRI.
The attributable fraction of disease from PM2.5
exposure is calculated by the
following expression:
(A2.2)
(A2.3)
where Pi is the share of the population exposed to PM
2.5 concentrations in the range x
i-1 to
xi. This attributable fraction is calculated for each disease outcome k and age group l. The
disease burden (B) in terms of annual cases of disease outcomes due to PM2.5
exposure is
then estimated by:
where Dkl is the total annual number of cases of disease k in age group l, and AF
kl is the
attributable fraction of these cases of disease k in age group l due to PM2.5
exposure.
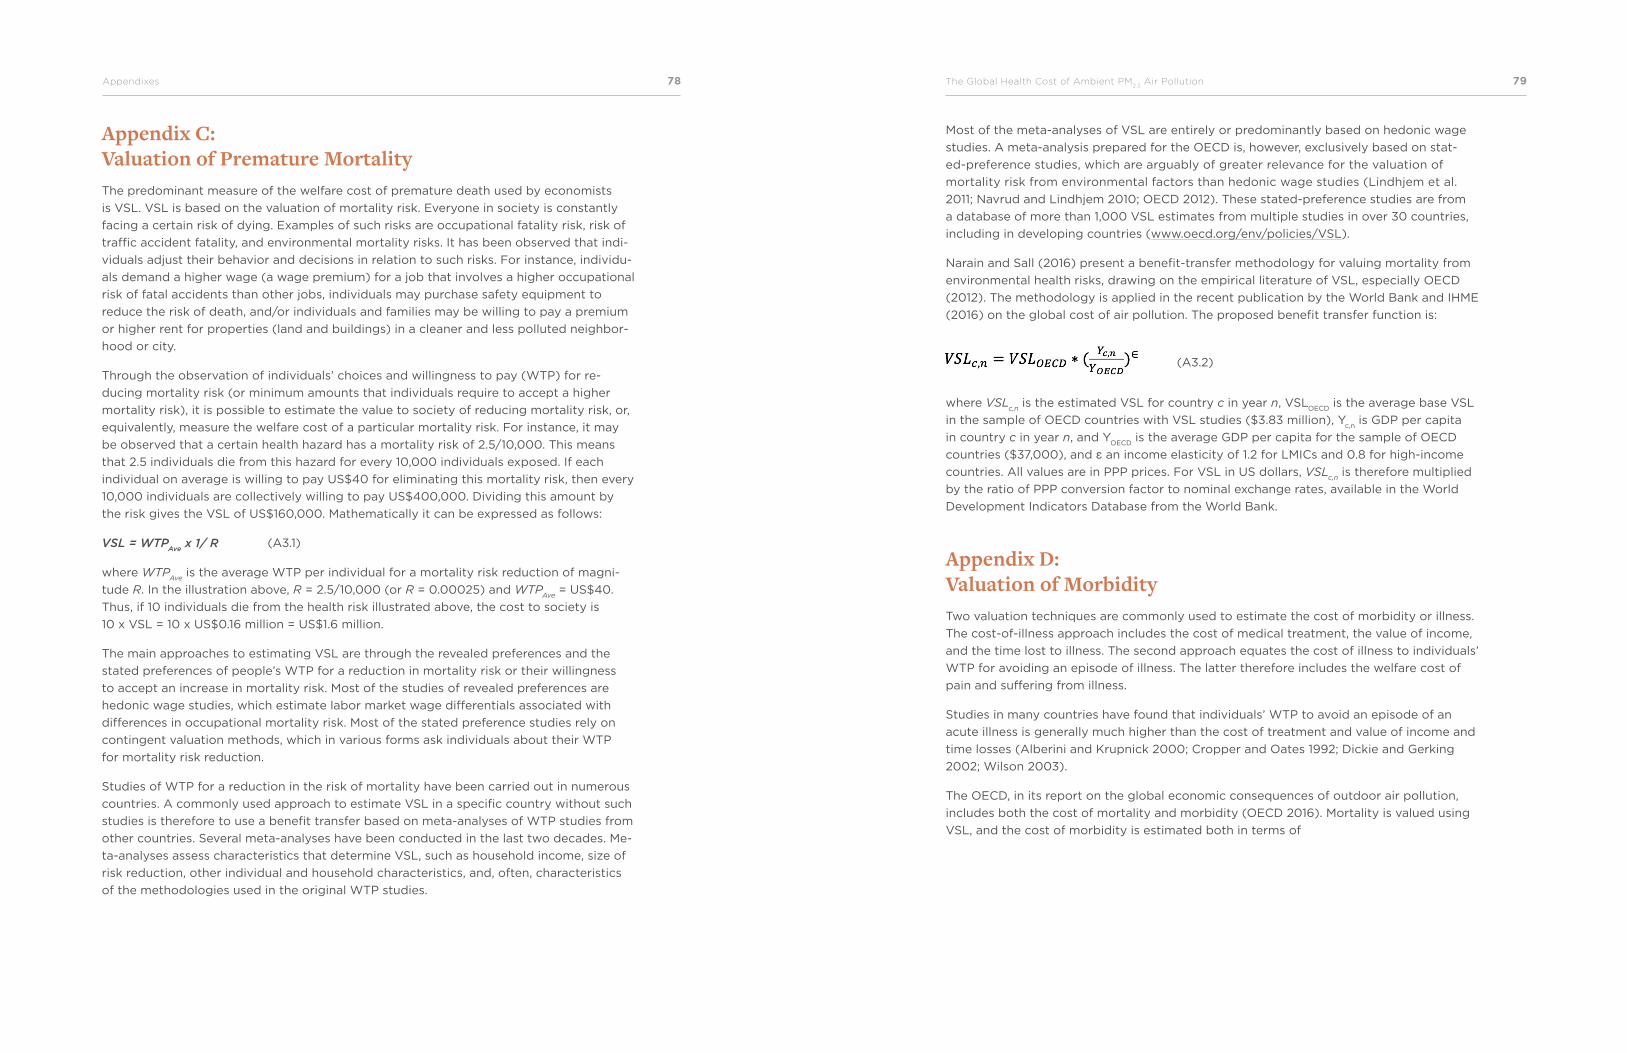
78Appendixes The Global Health Cost of Ambient PM2.5
Air Pollution 79
Appendix C: Valuation of Premature MortalityThe predominant measure of the welfare cost of premature death used by economists
is VSL. VSL is based on the valuation of mortality risk. Everyone in society is constantly
facing a certain risk of dying. Examples of such risks are occupational fatality risk, risk of
traffic accident fatality, and environmental mortality risks. It has been observed that indi-
viduals adjust their behavior and decisions in relation to such risks. For instance, individu-
als demand a higher wage (a wage premium) for a job that involves a higher occupational
risk of fatal accidents than other jobs, individuals may purchase safety equipment to
reduce the risk of death, and/or individuals and families may be willing to pay a premium
or higher rent for properties (land and buildings) in a cleaner and less polluted neighbor-
hood or city.
Through the observation of individuals’ choices and willingness to pay (WTP) for re-
ducing mortality risk (or minimum amounts that individuals require to accept a higher
mortality risk), it is possible to estimate the value to society of reducing mortality risk, or,
equivalently, measure the welfare cost of a particular mortality risk. For instance, it may
be observed that a certain health hazard has a mortality risk of 2.5/10,000. This means
that 2.5 individuals die from this hazard for every 10,000 individuals exposed. If each
individual on average is willing to pay US$40 for eliminating this mortality risk, then every
10,000 individuals are collectively willing to pay US$400,000. Dividing this amount by
the risk gives the VSL of US$160,000. Mathematically it can be expressed as follows:
VSL = WTPAve
x 1/ R
where WTPAve
is the average WTP per individual for a mortality risk reduction of magni-
tude R. In the illustration above, R = 2.5/10,000 (or R = 0.00025) and WTPAve
= US$40.
Thus, if 10 individuals die from the health risk illustrated above, the cost to society is
10 x VSL = 10 x US$0.16 million = US$1.6 million.
The main approaches to estimating VSL are through the revealed preferences and the
stated preferences of people’s WTP for a reduction in mortality risk or their willingness
to accept an increase in mortality risk. Most of the studies of revealed preferences are
hedonic wage studies, which estimate labor market wage differentials associated with
differences in occupational mortality risk. Most of the stated preference studies rely on
contingent valuation methods, which in various forms ask individuals about their WTP
for mortality risk reduction.
Studies of WTP for a reduction in the risk of mortality have been carried out in numerous
countries. A commonly used approach to estimate VSL in a specific country without such
studies is therefore to use a benefit transfer based on meta-analyses of WTP studies from
other countries. Several meta-analyses have been conducted in the last two decades. Me-
ta-analyses assess characteristics that determine VSL, such as household income, size of
risk reduction, other individual and household characteristics, and, often, characteristics
of the methodologies used in the original WTP studies.
(A3.1)
Most of the meta-analyses of VSL are entirely or predominantly based on hedonic wage
studies. A meta-analysis prepared for the OECD is, however, exclusively based on stat-
ed-preference studies, which are arguably of greater relevance for the valuation of
mortality risk from environmental factors than hedonic wage studies (Lindhjem et al.
2011; Navrud and Lindhjem 2010; OECD 2012). These stated-preference studies are from
a database of more than 1,000 VSL estimates from multiple studies in over 30 countries,
including in developing countries (www.oecd.org/env/policies/VSL).
Narain and Sall (2016) present a benefit-transfer methodology for valuing mortality from
environmental health risks, drawing on the empirical literature of VSL, especially OECD
(2012). The methodology is applied in the recent publication by the World Bank and IHME
(2016) on the global cost of air pollution. The proposed benefit transfer function is:
where VSLc,n
is the estimated VSL for country c in year n, VSLOECD
is the average base VSL
in the sample of OECD countries with VSL studies ($3.83 million), Yc,n
is GDP per capita
in country c in year n, and YOECD
is the average GDP per capita for the sample of OECD
countries ($37,000), and ɛ an income elasticity of 1.2 for LMICs and 0.8 for high-income
countries. All values are in PPP prices. For VSL in US dollars, VSLc,n
is therefore multiplied
by the ratio of PPP conversion factor to nominal exchange rates, available in the World
Development Indicators Database from the World Bank.
Appendix D: Valuation of MorbidityTwo valuation techniques are commonly used to estimate the cost of morbidity or illness.
The cost-of-illness approach includes the cost of medical treatment, the value of income,
and the time lost to illness. The second approach equates the cost of illness to individuals’
WTP for avoiding an episode of illness. The latter therefore includes the welfare cost of
pain and suffering from illness.
Studies in many countries have found that individuals’ WTP to avoid an episode of an
acute illness is generally much higher than the cost of treatment and value of income and
time losses (Alberini and Krupnick 2000; Cropper and Oates 1992; Dickie and Gerking
2002; Wilson 2003).
The OECD, in its report on the global economic consequences of outdoor air pollution,
includes both the cost of mortality and morbidity (OECD 2016). Mortality is valued using
VSL, and the cost of morbidity is estimated both in terms of
(A3.2)
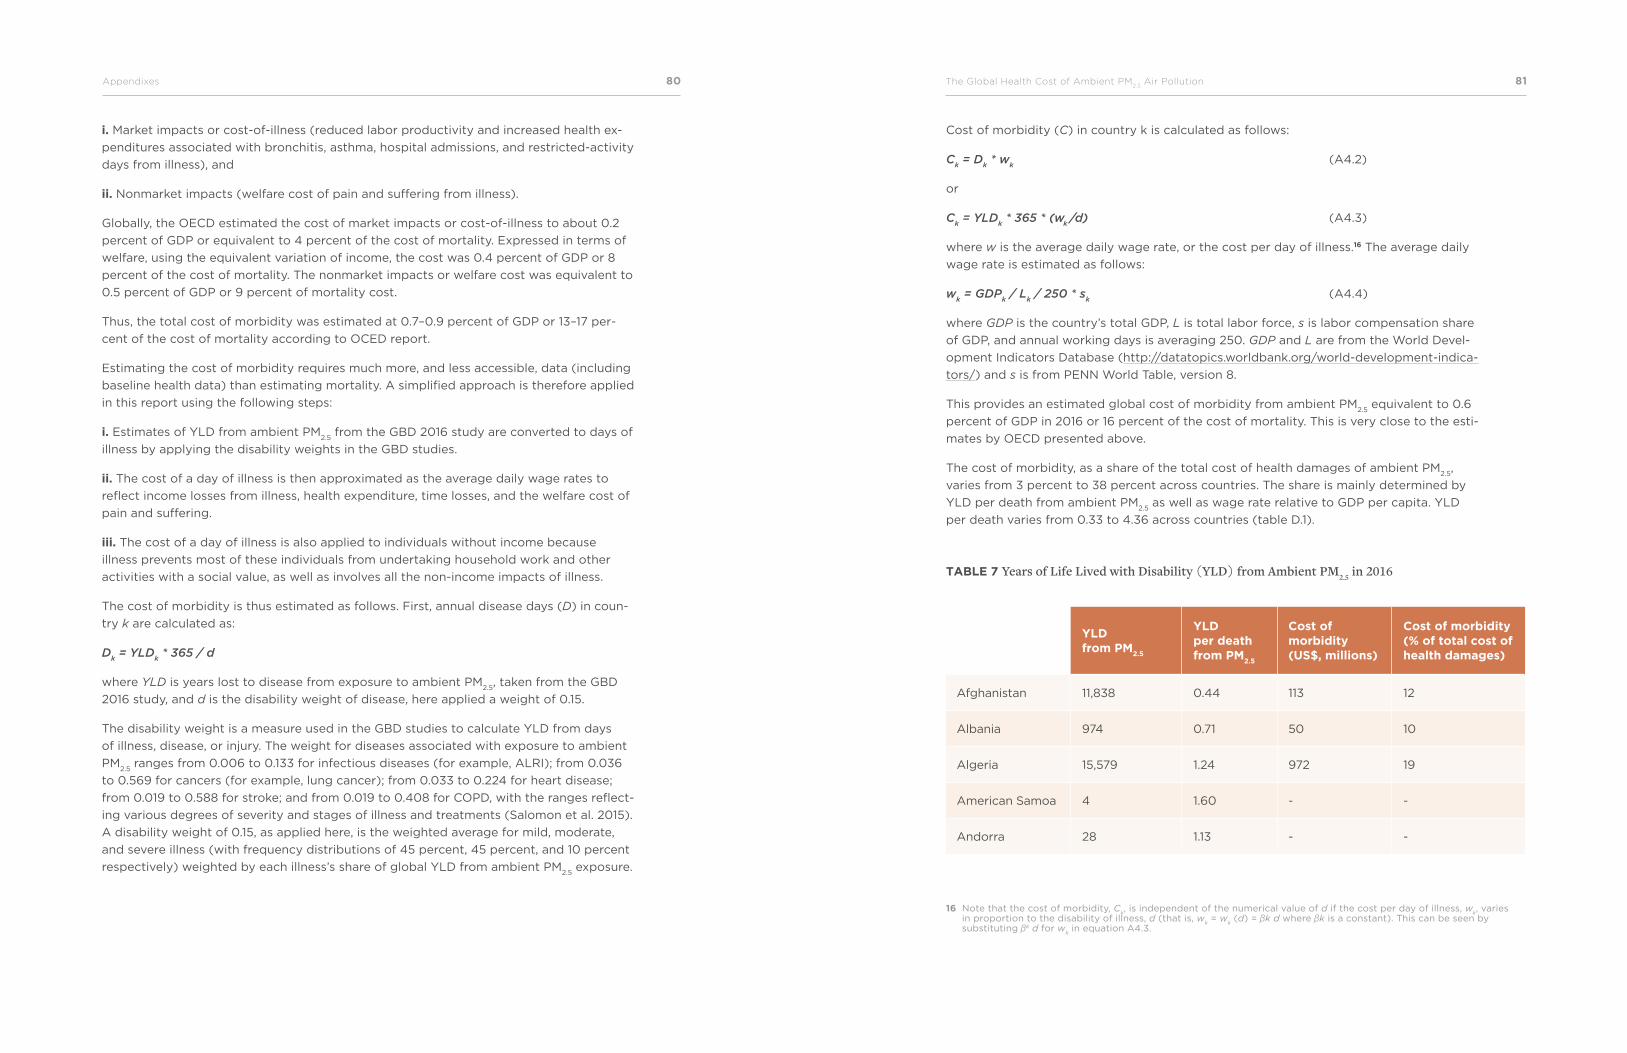
80Appendixes The Global Health Cost of Ambient PM2.5
Air Pollution 81
i. Market impacts or cost-of-illness (reduced labor productivity and increased health ex-
penditures associated with bronchitis, asthma, hospital admissions, and restricted-activity
days from illness), and
ii. Nonmarket impacts (welfare cost of pain and suffering from illness).
Globally, the OECD estimated the cost of market impacts or cost-of-illness to about 0.2
percent of GDP or equivalent to 4 percent of the cost of mortality. Expressed in terms of
welfare, using the equivalent variation of income, the cost was 0.4 percent of GDP or 8
percent of the cost of mortality. The nonmarket impacts or welfare cost was equivalent to
0.5 percent of GDP or 9 percent of mortality cost.
Thus, the total cost of morbidity was estimated at 0.7–0.9 percent of GDP or 13–17 per-
cent of the cost of mortality according to OCED report.
Estimating the cost of morbidity requires much more, and less accessible, data (including
baseline health data) than estimating mortality. A simplified approach is therefore applied
in this report using the following steps:
i. Estimates of YLD from ambient PM2.5
from the GBD 2016 study are converted to days of
illness by applying the disability weights in the GBD studies.
ii. The cost of a day of illness is then approximated as the average daily wage rates to
reflect income losses from illness, health expenditure, time losses, and the welfare cost of
pain and suffering.
iii. The cost of a day of illness is also applied to individuals without income because
illness prevents most of these individuals from undertaking household work and other
activities with a social value, as well as involves all the non-income impacts of illness.
The cost of morbidity is thus estimated as follows. First, annual disease days (D) in coun-
try k are calculated as:
Dk = YLD
k * 365 / d
where YLD is years lost to disease from exposure to ambient PM2.5
, taken from the GBD
2016 study, and d is the disability weight of disease, here applied a weight of 0.15.
The disability weight is a measure used in the GBD studies to calculate YLD from days
of illness, disease, or injury. The weight for diseases associated with exposure to ambient
PM2.5
ranges from 0.006 to 0.133 for infectious diseases (for example, ALRI); from 0.036
to 0.569 for cancers (for example, lung cancer); from 0.033 to 0.224 for heart disease;
from 0.019 to 0.588 for stroke; and from 0.019 to 0.408 for COPD, with the ranges reflect-
ing various degrees of severity and stages of illness and treatments (Salomon et al. 2015).
A disability weight of 0.15, as applied here, is the weighted average for mild, moderate,
and severe illness (with frequency distributions of 45 percent, 45 percent, and 10 percent
respectively) weighted by each illness’s share of global YLD from ambient PM2.5
exposure.
Cost of morbidity (C) in country k is calculated as follows:
Ck = D
k * w
k (A4.2)
or
Ck = YLD
k * 365 * (w
k/d) (A4.3)
where w is the average daily wage rate, or the cost per day of illness.16 The average daily
wage rate is estimated as follows:
wk = GDP
k / L
k / 250 * s
k (A4.4)
where GDP is the country’s total GDP, L is total labor force, s is labor compensation share
of GDP, and annual working days is averaging 250. GDP and L are from the World Devel-
opment Indicators Database (http://datatopics.worldbank.org/world-development-indica-
tors/) and s is from PENN World Table, version 8.
This provides an estimated global cost of morbidity from ambient PM2.5
equivalent to 0.6
percent of GDP in 2016 or 16 percent of the cost of mortality. This is very close to the esti-
mates by OECD presented above.
The cost of morbidity, as a share of the total cost of health damages of ambient PM2.5
,
varies from 3 percent to 38 percent across countries. The share is mainly determined by
YLD per death from ambient PM2.5
as well as wage rate relative to GDP per capita. YLD
per death varies from 0.33 to 4.36 across countries (table D.1).
16 Note that the cost of morbidity, Ck, is independent of the numerical value of d if the cost per day of illness, w
k, varies
in proportion to the disability of illness, d (that is, wk = w
k (d) = βk d where βk is a constant). This can be seen by
substituting βk d for wk in equation A4.3.
TABLE 7 Years of Life Lived with Disability (YLD) from Ambient PM2.5 in 2016
StudyYLD from PM
2.5
YLD per death from PM
2.5
Cost of morbidity (US$, millions)
Cost of morbidity (% of total cost of health damages)
Afghanistan 11,838 0.44 113 12
Albania 974 0.71 50 10
Algeria 15,579 1.24 972 19
American Samoa 4 1.60 - -
Andorra 28 1.13 - -
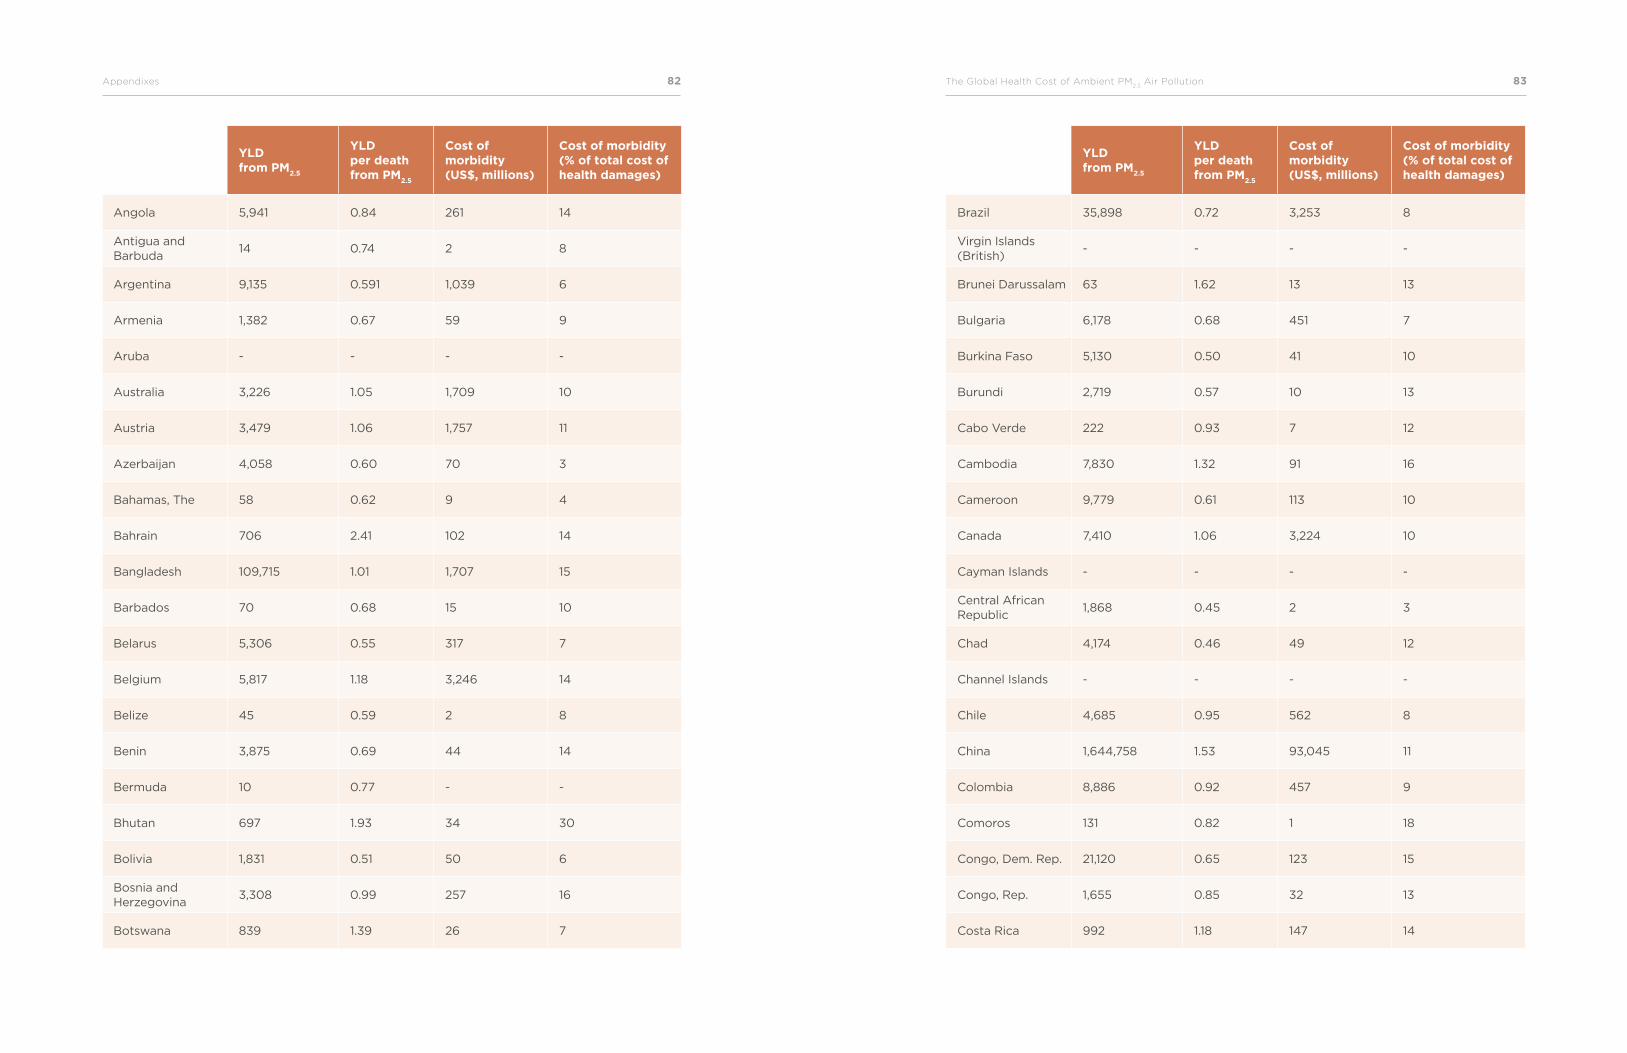
82Appendixes The Global Health Cost of Ambient PM2.5
Air Pollution 83
StudyYLD from PM
2.5
YLD per death from PM
2.5
Cost of morbidity (US$, millions)
Cost of morbidity (% of total cost of health damages)
Angola 5,941 0.84 261 14
Antigua and Barbuda
14 0.74 2 8
Argentina 9,135 0.591 1,039 6
Armenia 1,382 0.67 59 9
Aruba - - - -
Australia 3,226 1.05 1,709 10
Austria 3,479 1.06 1,757 11
Azerbaijan 4,058 0.60 70 3
Bahamas, The 58 0.62 9 4
Bahrain 706 2.41 102 14
Bangladesh 109,715 1.01 1,707 15
Barbados 70 0.68 15 10
Belarus 5,306 0.55 317 7
Belgium 5,817 1.18 3,246 14
Belize 45 0.59 2 8
Benin 3,875 0.69 44 14
Bermuda 10 0.77 - -
Bhutan 697 1.93 34 30
Bolivia 1,831 0.51 50 6
Bosnia and Herzegovina
3,308 0.99 257 16
Botswana 839 1.39 26 7
StudyYLD from PM
2.5
YLD per death from PM
2.5
Cost of morbidity (US$, millions)
Cost of morbidity (% of total cost of health damages)
Brazil 35,898 0.72 3,253 8
Virgin Islands (British)
- - - -
Brunei Darussalam 63 1.62 13 13
Bulgaria 6,178 0.68 451 7
Burkina Faso 5,130 0.50 41 10
Burundi 2,719 0.57 10 13
Cabo Verde 222 0.93 7 12
Cambodia 7,830 1.32 91 16
Cameroon 9,779 0.61 113 10
Canada 7,410 1.06 3,224 10
Cayman Islands - - - -
Central African Republic
1,868 0.45 2 3
Chad 4,174 0.46 49 12
Channel Islands - - - -
Chile 4,685 0.95 562 8
China 1,644,758 1.53 93,045 11
Colombia 8,886 0.92 457 9
Comoros 131 0.82 1 18
Congo, Dem. Rep. 21,120 0.65 123 15
Congo, Rep. 1,655 0.85 32 13
Costa Rica 992 1.18 147 14
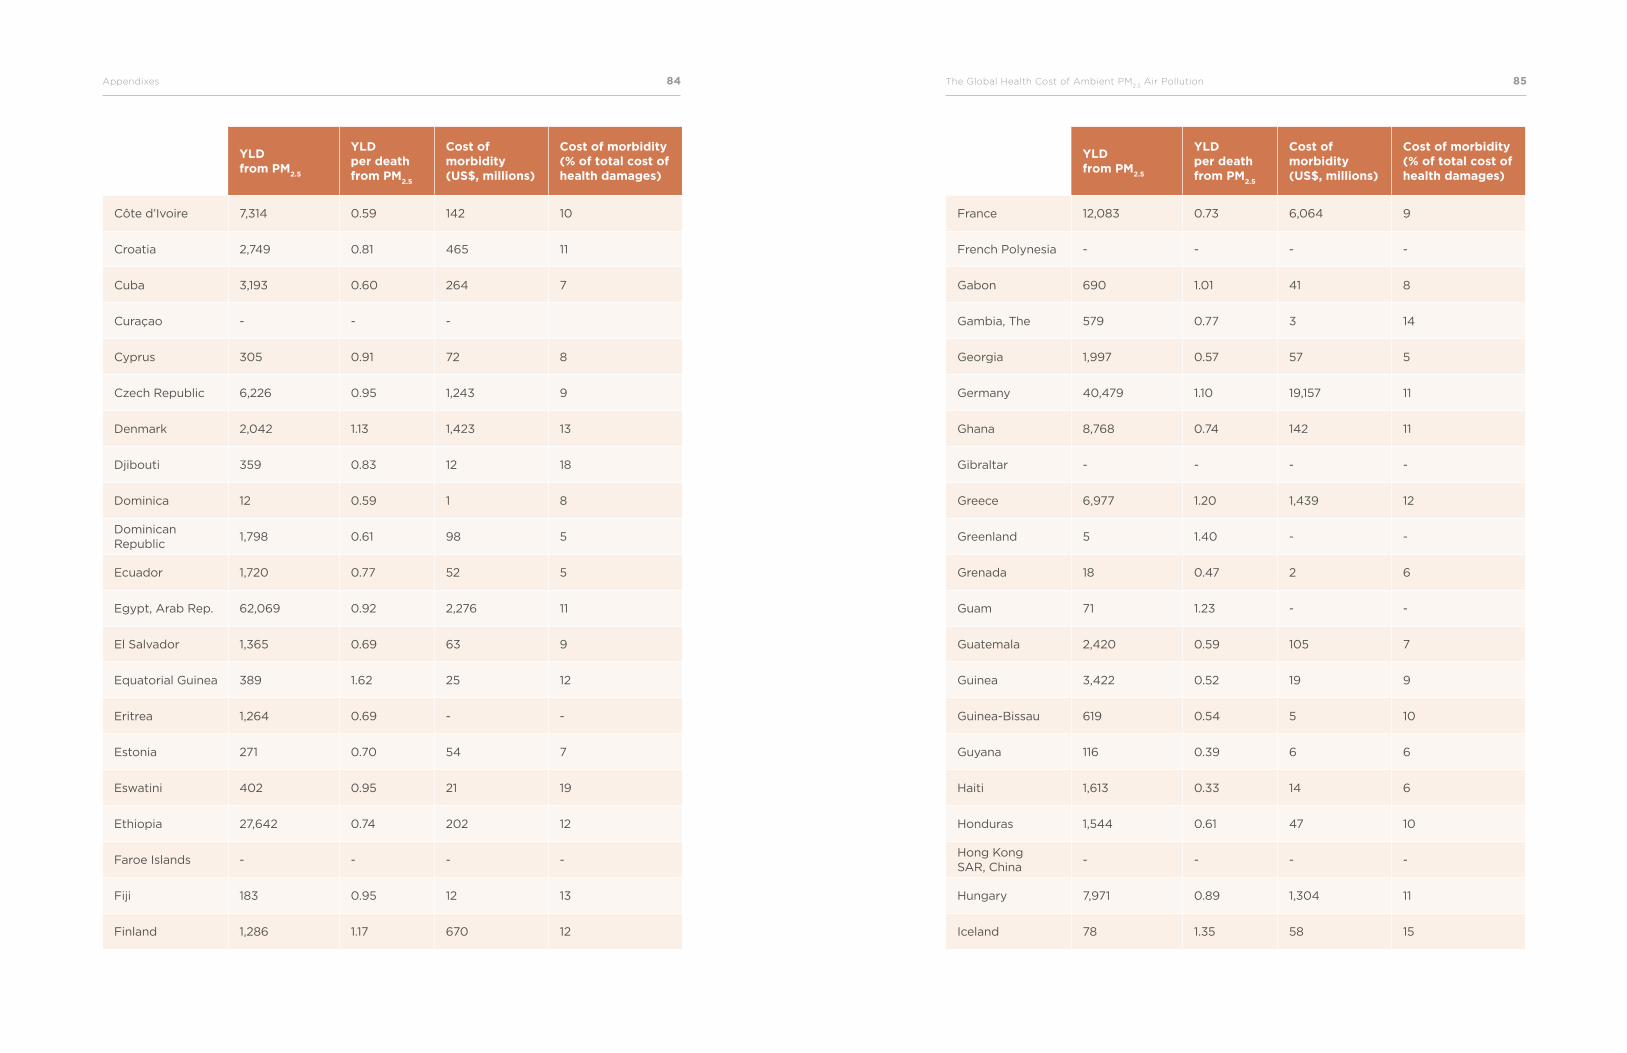
84Appendixes The Global Health Cost of Ambient PM2.5
Air Pollution 85
StudyYLD from PM
2.5
YLD per death from PM
2.5
Cost of morbidity (US$, millions)
Cost of morbidity (% of total cost of health damages)
Côte d’Ivoire 7,314 0.59 142 10
Croatia 2,749 0.81 465 11
Cuba 3,193 0.60 264 7
Curaçao - - -
Cyprus 305 0.91 72 8
Czech Republic 6,226 0.95 1,243 9
Denmark 2,042 1.13 1,423 13
Djibouti 359 0.83 12 18
Dominica 12 0.59 1 8
Dominican Republic
1,798 0.61 98 5
Ecuador 1,720 0.77 52 5
Egypt, Arab Rep. 62,069 0.92 2,276 11
El Salvador 1,365 0.69 63 9
Equatorial Guinea 389 1.62 25 12
Eritrea 1,264 0.69 - -
Estonia 271 0.70 54 7
Eswatini 402 0.95 21 19
Ethiopia 27,642 0.74 202 12
Faroe Islands - - - -
Fiji 183 0.95 12 13
Finland 1,286 1.17 670 12
StudyYLD from PM
2.5
YLD per death from PM
2.5
Cost of morbidity (US$, millions)
Cost of morbidity (% of total cost of health damages)
France 12,083 0.73 6,064 9
French Polynesia - - - -
Gabon 690 1.01 41 8
Gambia, The 579 0.77 3 14
Georgia 1,997 0.57 57 5
Germany 40,479 1.10 19,157 11
Ghana 8,768 0.74 142 11
Gibraltar - - - -
Greece 6,977 1.20 1,439 12
Greenland 5 1.40 - -
Grenada 18 0.47 2 6
Guam 71 1.23 - -
Guatemala 2,420 0.59 105 7
Guinea 3,422 0.52 19 9
Guinea-Bissau 619 0.54 5 10
Guyana 116 0.39 6 6
Haiti 1,613 0.33 14 6
Honduras 1,544 0.61 47 10
Hong Kong SAR, China
- - - -
Hungary 7,971 0.89 1,304 11
Iceland 78 1.35 58 15
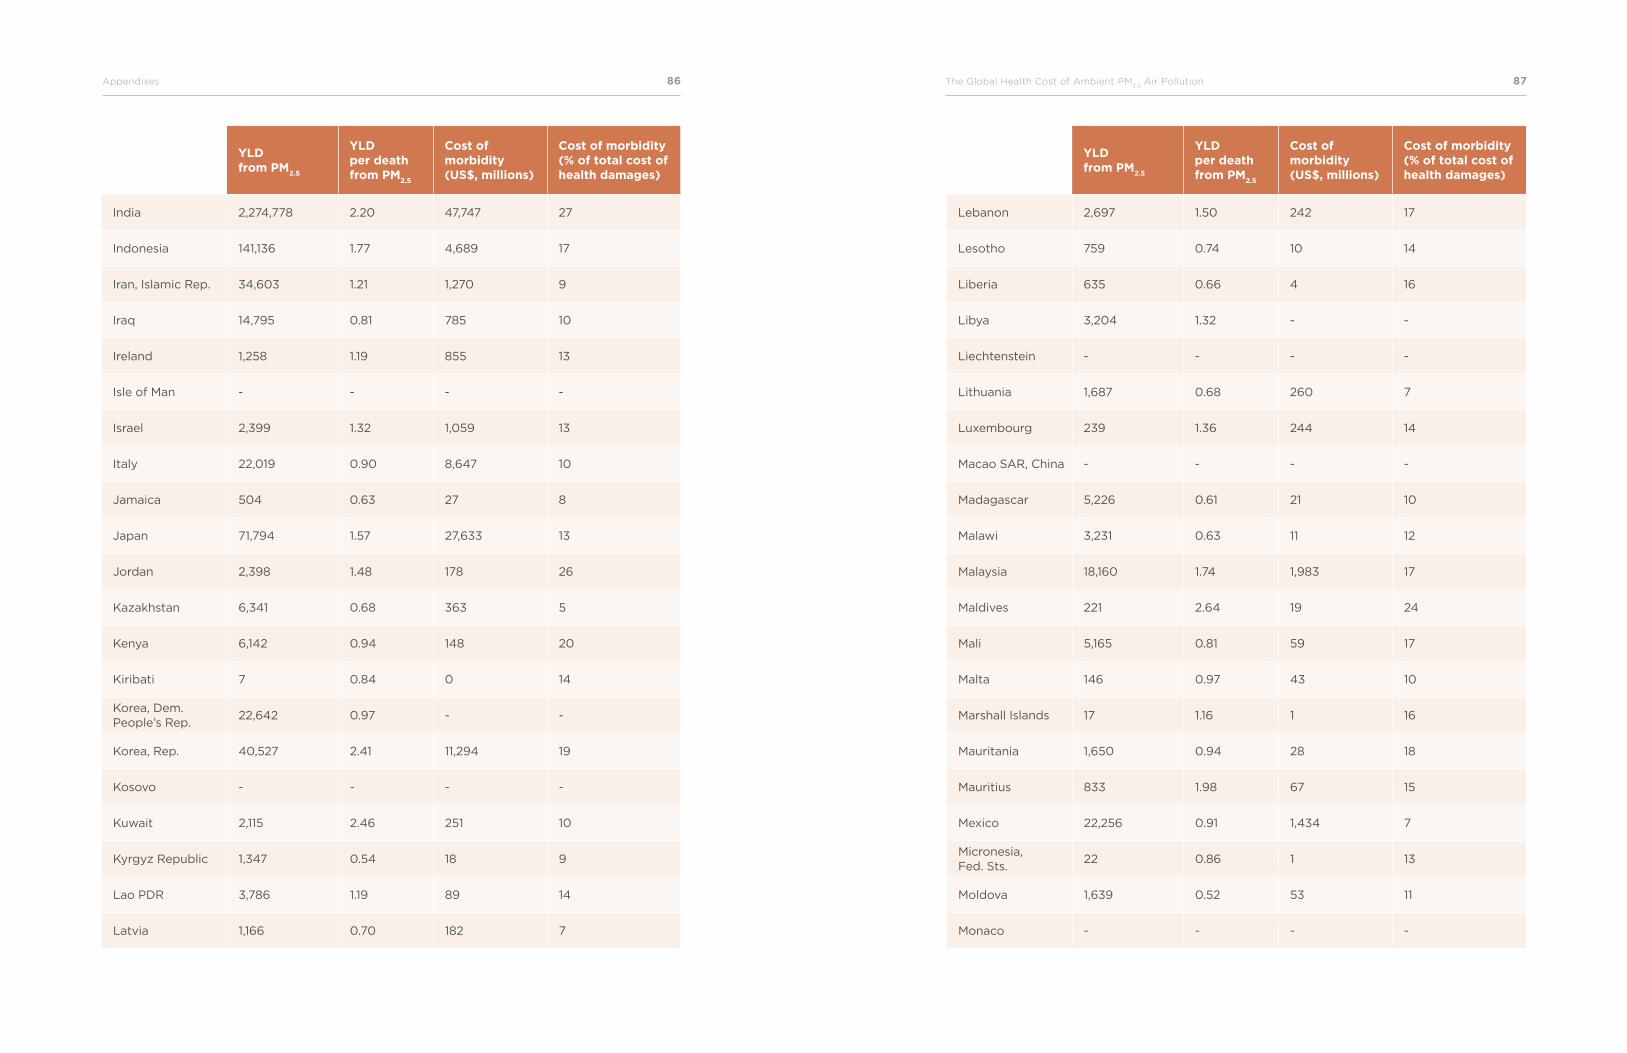
86Appendixes The Global Health Cost of Ambient PM2.5
Air Pollution 87
StudyYLD from PM
2.5
YLD per death from PM
2.5
Cost of morbidity (US$, millions)
Cost of morbidity (% of total cost of health damages)
India 2,274,778 2.20 47,747 27
Indonesia 141,136 1.77 4,689 17
Iran, Islamic Rep. 34,603 1.21 1,270 9
Iraq 14,795 0.81 785 10
Ireland 1,258 1.19 855 13
Isle of Man - - - -
Israel 2,399 1.32 1,059 13
Italy 22,019 0.90 8,647 10
Jamaica 504 0.63 27 8
Japan 71,794 1.57 27,633 13
Jordan 2,398 1.48 178 26
Kazakhstan 6,341 0.68 363 5
Kenya 6,142 0.94 148 20
Kiribati 7 0.84 0 14
Korea, Dem. People’s Rep.
22,642 0.97 - -
Korea, Rep. 40,527 2.41 11,294 19
Kosovo - - - -
Kuwait 2,115 2.46 251 10
Kyrgyz Republic 1,347 0.54 18 9
Lao PDR 3,786 1.19 89 14
Latvia 1,166 0.70 182 7
StudyYLD from PM
2.5
YLD per death from PM
2.5
Cost of morbidity (US$, millions)
Cost of morbidity (% of total cost of health damages)
Lebanon 2,697 1.50 242 17
Lesotho 759 0.74 10 14
Liberia 635 0.66 4 16
Libya 3,204 1.32 - -
Liechtenstein - - - -
Lithuania 1,687 0.68 260 7
Luxembourg 239 1.36 244 14
Macao SAR, China - - - -
Madagascar 5,226 0.61 21 10
Malawi 3,231 0.63 11 12
Malaysia 18,160 1.74 1,983 17
Maldives 221 2.64 19 24
Mali 5,165 0.81 59 17
Malta 146 0.97 43 10
Marshall Islands 17 1.16 1 16
Mauritania 1,650 0.94 28 18
Mauritius 833 1.98 67 15
Mexico 22,256 0.91 1,434 7
Micronesia, Fed. Sts.
22 0.86 1 13
Moldova 1,639 0.52 53 11
Monaco - - - -
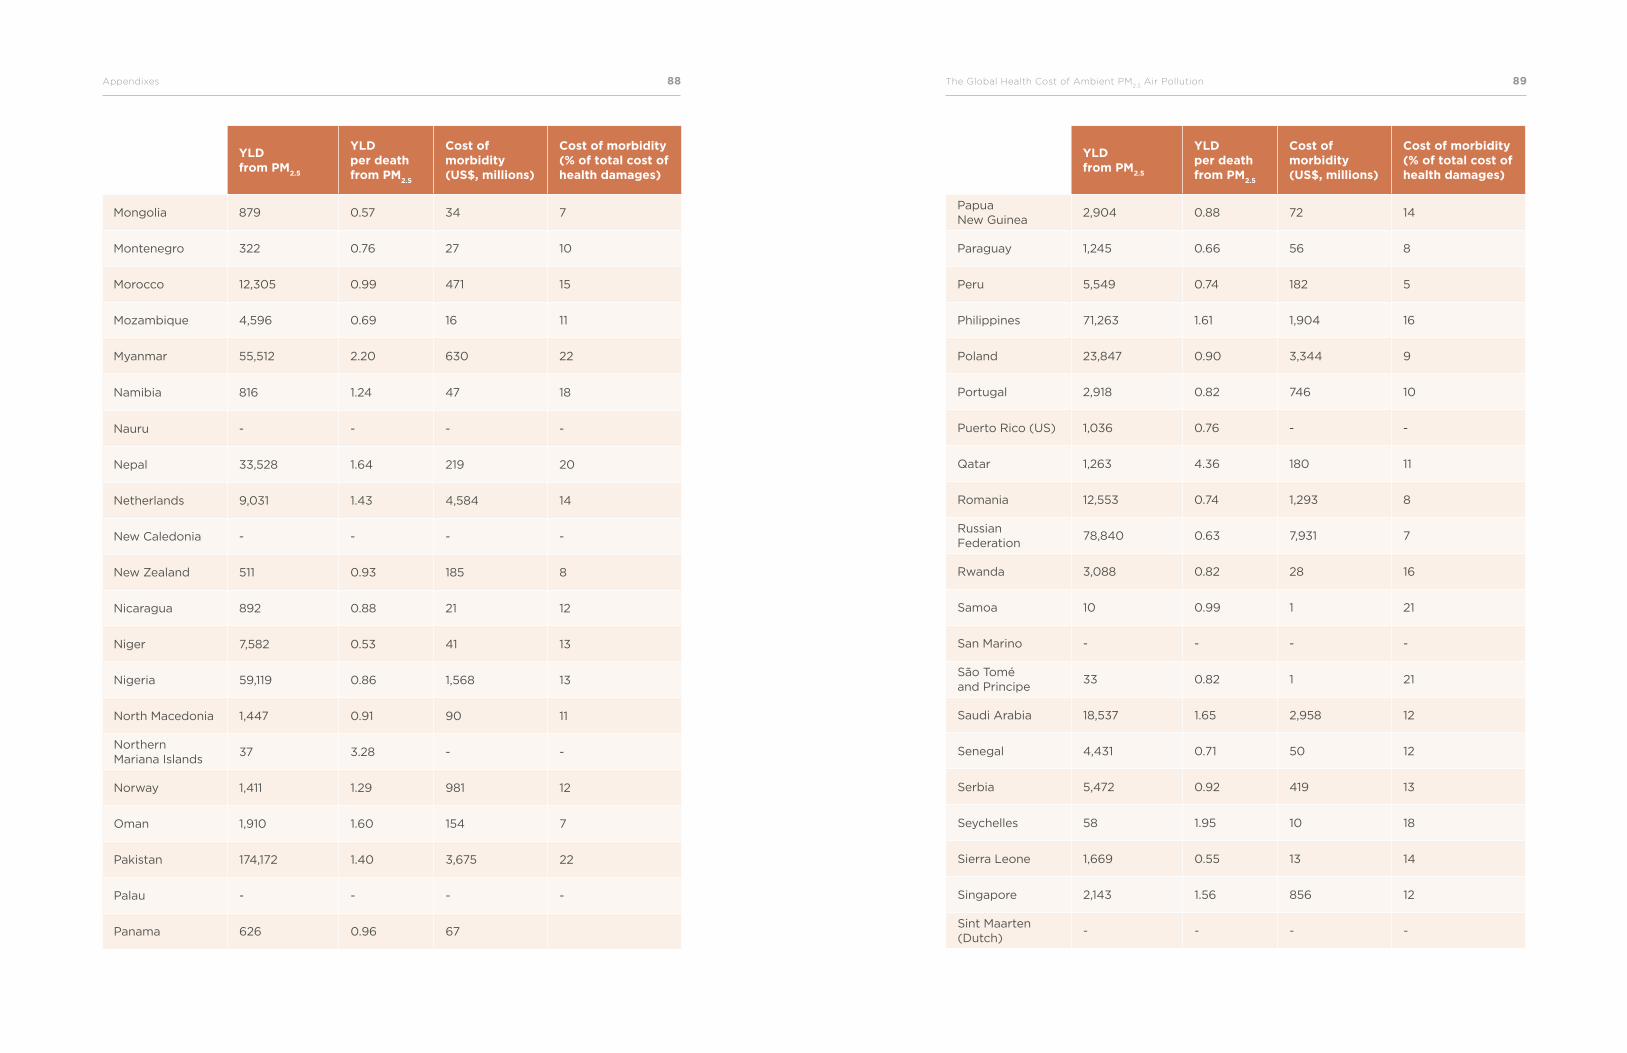
88Appendixes The Global Health Cost of Ambient PM2.5
Air Pollution 89
StudyYLD from PM
2.5
YLD per death from PM
2.5
Cost of morbidity (US$, millions)
Cost of morbidity (% of total cost of health damages)
Mongolia 879 0.57 34 7
Montenegro 322 0.76 27 10
Morocco 12,305 0.99 471 15
Mozambique 4,596 0.69 16 11
Myanmar 55,512 2.20 630 22
Namibia 816 1.24 47 18
Nauru - - - -
Nepal 33,528 1.64 219 20
Netherlands 9,031 1.43 4,584 14
New Caledonia - - - -
New Zealand 511 0.93 185 8
Nicaragua 892 0.88 21 12
Niger 7,582 0.53 41 13
Nigeria 59,119 0.86 1,568 13
North Macedonia 1,447 0.91 90 11
Northern Mariana Islands
37 3.28 - -
Norway 1,411 1.29 981 12
Oman 1,910 1.60 154 7
Pakistan 174,172 1.40 3,675 22
Palau - - - -
Panama 626 0.96 67
StudyYLD from PM
2.5
YLD per death from PM
2.5
Cost of morbidity (US$, millions)
Cost of morbidity (% of total cost of health damages)
Papua New Guinea
2,904 0.88 72 14
Paraguay 1,245 0.66 56 8
Peru 5,549 0.74 182 5
Philippines 71,263 1.61 1,904 16
Poland 23,847 0.90 3,344 9
Portugal 2,918 0.82 746 10
Puerto Rico (US) 1,036 0.76 - -
Qatar 1,263 4.36 180 11
Romania 12,553 0.74 1,293 8
Russian Federation
78,840 0.63 7,931 7
Rwanda 3,088 0.82 28 16
Samoa 10 0.99 1 21
San Marino - - - -
São Tomé and Principe
33 0.82 1 21
Saudi Arabia 18,537 1.65 2,958 12
Senegal 4,431 0.71 50 12
Serbia 5,472 0.92 419 13
Seychelles 58 1.95 10 18
Sierra Leone 1,669 0.55 13 14
Singapore 2,143 1.56 856 12
Sint Maarten (Dutch)
- - - -
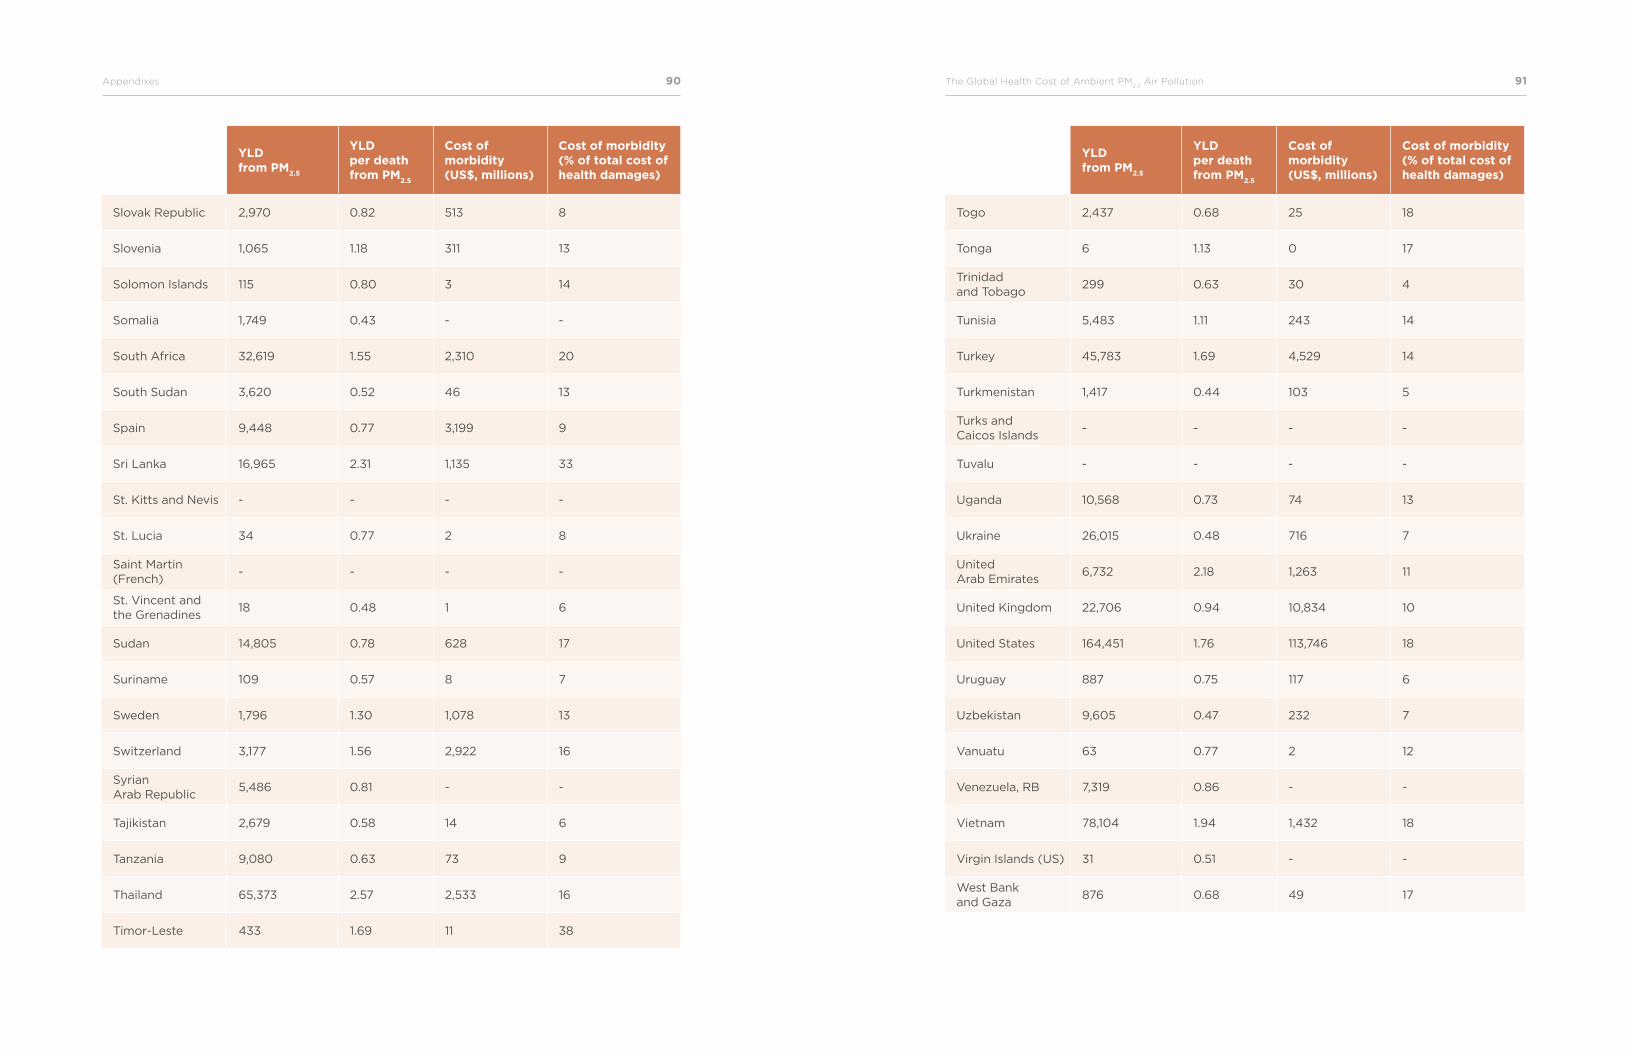
90Appendixes The Global Health Cost of Ambient PM2.5
Air Pollution 91
StudyYLD from PM
2.5
YLD per death from PM
2.5
Cost of morbidity (US$, millions)
Cost of morbidity (% of total cost of health damages)
Slovak Republic 2,970 0.82 513 8
Slovenia 1,065 1.18 311 13
Solomon Islands 115 0.80 3 14
Somalia 1,749 0.43 - -
South Africa 32,619 1.55 2,310 20
South Sudan 3,620 0.52 46 13
Spain 9,448 0.77 3,199 9
Sri Lanka 16,965 2.31 1,135 33
St. Kitts and Nevis - - - -
St. Lucia 34 0.77 2 8
Saint Martin (French)
- - - -
St. Vincent and the Grenadines
18 0.48 1 6
Sudan 14,805 0.78 628 17
Suriname 109 0.57 8 7
Sweden 1,796 1.30 1,078 13
Switzerland 3,177 1.56 2,922 16
Syrian Arab Republic
5,486 0.81 - -
Tajikistan 2,679 0.58 14 6
Tanzania 9,080 0.63 73 9
Thailand 65,373 2.57 2,533 16
Timor-Leste 433 1.69 11 38
StudyYLD from PM
2.5
YLD per death from PM
2.5
Cost of morbidity (US$, millions)
Cost of morbidity (% of total cost of health damages)
Togo 2,437 0.68 25 18
Tonga 6 1.13 0 17
Trinidad and Tobago
299 0.63 30 4
Tunisia 5,483 1.11 243 14
Turkey 45,783 1.69 4,529 14
Turkmenistan 1,417 0.44 103 5
Turks and Caicos Islands
- - - -
Tuvalu - - - -
Uganda 10,568 0.73 74 13
Ukraine 26,015 0.48 716 7
United Arab Emirates
6,732 2.18 1,263 11
United Kingdom 22,706 0.94 10,834 10
United States 164,451 1.76 113,746 18
Uruguay 887 0.75 117 6
Uzbekistan 9,605 0.47 232 7
Vanuatu 63 0.77 2 12
Venezuela, RB 7,319 0.86 - -
Vietnam 78,104 1.94 1,432 18
Virgin Islands (US) 31 0.51 - -
West Bank and Gaza
876 0.68 49 17
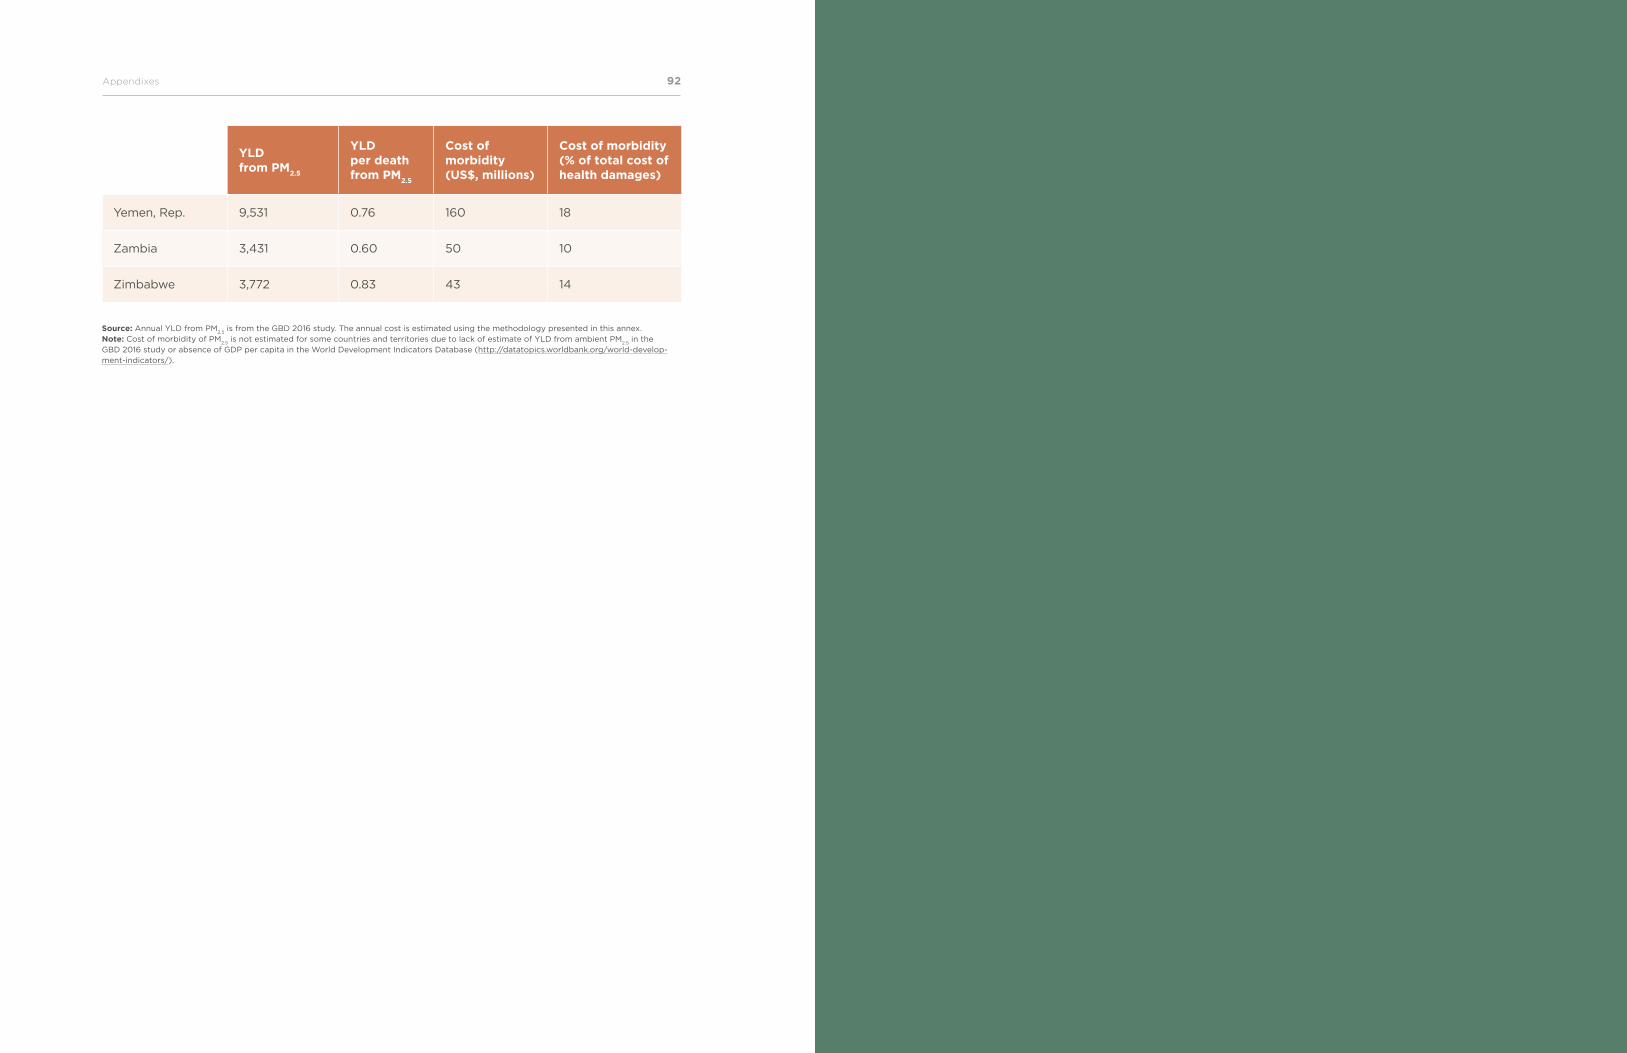
The Global Health Cost of Ambient PM2.5
Air Pollution 9392Appendixes
StudyYLD from PM
2.5
YLD per death from PM
2.5
Cost of morbidity (US$, millions)
Cost of morbidity (% of total cost of health damages)
Yemen, Rep. 9,531 0.76 160 18
Zambia 3,431 0.60 50 10
Zimbabwe 3,772 0.83 43 14
Source: Annual YLD from PM2.5
is from the GBD 2016 study. The annual cost is estimated using the methodology presented in this annex. Note: Cost of morbidity of PM
2.5 is not estimated for some countries and territories due to lack of estimate of YLD from ambient PM
2.5 in the
GBD 2016 study or absence of GDP per capita in the World Development Indicators Database (http://datatopics.worldbank.org/world-develop-ment-indicators/).
94World Bank Group The Global Health Cost of Ambient PM2.5
Air Pollution 95
References
Alberini, A., and A. Krupnick. 2000. “Cost-of-Illness and Willingness-to-Pay Estimates of the Benefits of Improved Air Quality: Evidence from Taiwan.” Land Economics 76: 37–53.
Andrée, P. J. 2020. “Incidence of COVID-19 and Connections with Air Pollution Expo-sure: Evidence from the Netherlands.” Policy Research Working Paper 9221. World Bank, Washington, DC.
Bowe, B., Y. Xie, T. Li, Y. Yan, H. Xian, and Z. Al-Aly. 2018. “The 2016 Global and Na-tional Burden of Diabetes Mellitus Attributable to PM2.5 Air Pollution.” Lancet Planetary
Health 2 (7): e301-e312.
Brauer, M., M. Amann, R. T. Burnett, A. Cohen, F. Dentener, M. Ezzati, S. B. Henderson,
M. Krzyzanowski, R. V. Martin, R. Van Dingenen, A. van Donkelaar, and G. D. Thurston. 2012. “Exposure Assessment for Estimation of the Global Burden of Disease Attributable to Outdoor Air Pollution.” Environ Sci Technol 46 (2): 652–60.
Brauer, M., G. Freedman, J. Frostad, A. van Donkelaar, R. V. Martin, F. Dentener, R. van
Dingenen, K. Estep, H. Amini, J. S. Apte, K. Balakrishnan, L. Barregard, D. Broday, V.
Feigin, S. Ghosh, P. K. Hopke, L.D. Knibbs, Y. Kokubo, Y. Liu, S. Ma, L. Morawska, J. L.
Sangrador, G. Shaddick, H. R. Anderson, T. Vos, M. H. Forouzanfar, R. T. Burnett, and A.
Cohen. 2016. “Ambient Air Pollution Exposure Estimation for the Global Burden of Disease 2013.” Environ Sci Technol 50 (1): 79–88.
Burnett, Richard T., C. Arden Pope III, Majid Ezzati, Casey Olives, Stephen S. Lim, Sumi
Mehta, Hwashin H. Shin, Gitanjali Singh, Bryan Hubbell, Michael Brauer, H. Ross An-
derson, Kirk R. Smith, John R. Balmes, Nigel G. Bruce, Haidong Kan, Francine Laden,
Annette Prüss-Ustün, Michelle C. Turner, Susan M. Gapstur, W. Ryan Diver, and Aaron
Cohen. 2014. “An Integrated Risk Function for Estimating the Global Burden of Disease Attributable to Ambient Fine Particulate Matter Exposure.” Environmental Health
Perspectives: 122 (4): 397–403.
Carey, I. M., H. R. Anderson, R. W. Atkinson RW, S. D. Beevers, D. G. Cook, D. P. Stra-
chan, D. Dajnak, J. Gulliver, and F. J. Kelly. 2018. “Are Noise and Air Pollution Related to the Incidence of Dementia? A Cohort Study in London, England.” BMJ Open 8: e022404.
Cropper, M., and W. Oates. 1992. “Environmental Economics: A Survey.” Journal of
Economic Literature 30: 675–740.
Dickie, M., and S. Gerking. 2002. “Willingness to Pay for Reduced Morbidity.” Paper presented at the Workshop “Economic Valuation of Health for Environmental Policy: Assessing Alternative Approaches,” Orlando, Florida, March 18–19, 2002.
Ezzati, M., A. D. Lopez, A. A. Rodgers, and C. J. Murray. 2004. Comparative Quanti-
fication of Health Risks: Global and Regional Burden of Disease Attributable to Selected
Major Risk Factors. Geneva: WHO.
Ezziane, Z. 2013. “The Impact of Air Pollution on Low Birth Weight and Infant Mortality.” Review of Environmental Health 28(2-3): 107–15.
GBD 2010 Risk Factors Collaborators. 2012. “GBD 2010: A Multi-Investigator Collabora-tion for Global Comparative Descriptive Epidemiology.” Lancet 380 (9859): 2055–58.
GBD 2013 Risk Factors Collaborators. 2015. “Global, Regional, and National Compara-tive Risk Assessment of 79 Behavioural, Environmental and Occupational, and Metabolic Risks or Clusters of Risks in 188 Countries, 1990–2013: A Systematic Analysis for the Global Burden of Disease Study 2013.” Lancet 386: 2287–323.
GBD 2015 Risk Factors Collaborators. 2016. “Global, Regional, and National Compara-tive Risk Assessment of 79 Behavioural, Environmental and Occupational, and Metabolic Risks or Clusters of Risks, 1990–2015: A Systematic Analysis for the Global Burden of Disease Study 2015.” Lancet 388: 1659–724.
GBD 2016 Risk Factors Collaborators. 2017. “Global, Regional, and National Compara-tive Risk Assessment of 84 Behavioural, Environmental and Occupational, and Metabolic Risks or Clusters of Risks, 1990–2016: A Systematic Analysis for the Global Burden of Disease Study 2016.” Lancet 390: 1345–422.
Heft-Neal, S., J. Burney, E. Bendavid, and M. Burk. 2018. “Robust Relationship Between Air Quality and Infant Mortality in Africa.” Nature 559(7713): 254–8.
Landrigan, P. J., R. Fuller, N. J. R. Acosta, O. Adeyi, R. Arnold, N. N. Basu, A. B. Baldé,
R. Bertollini, S. Bose-O’Reilly, J. I. Boufford, P. N. Breysse, T. Chiles, C. Mahidol, A. M.
Coll-Seck, M. L. Cropper, J. Fobil, V. Fuster, M. Greenstone, A. Haines, D. Hanrahan, D.
Hunter, M. Khare, A. Krupnick, B. Lanphear, B. Lohani, K. Martin, K. V. Mathiasen, M.
A. McTeer, C. J. L. Murray, J. D. Ndahimananjara, F. Perera, J. Potočnik, A. S. Preker, J.
Ramesh, J. Rockström, C. Salinas, L. D. Samson, K. Sandilya, P. D. Sly, K. R. Smith, A.
Steiner, R. B. Stewart, W. A. Suk, O. C .P. van Schayck, G. N. Yadama, K. Yumkella,
and M. Zhong. 2018. “The Lancet Commission on Pollution and Health.” Lancet 391 (10119): 462–512.
Larsen, B. 2014. “Benefits and Costs of the Air Pollution Targets for the Post-2015 Devel-opment Agenda.” Air Pollution Assessment Paper, Post-2015 Consensus Project, Copen-hagen Consensus Center, Copenhagen. https://www.copenhagenconsensus.com/sites/default/files/air_pollution_assessment_-_larsen.pdf.
96World Bank Group The Global Health Cost of Ambient PM2.5
Air Pollution 97
Larsen, B. 2017. “Global Ambient Air Pollution: New Perspectives on Exposure, Health Effects and Costs – Global, Regional and National Estimates for 2015.” Report prepared for the World Bank, Washington, DC.
Lim, S. S., T. Vos, A. D. Flaxman, et al. 2012. “A Comparative Risk Assessment of Burden of Disease and Injury Attributable to 67 Risk Factors and Risk Factor Clusters in 21 Re-gions, 1990–2010: A Systematic Analysis for the Global Burden of Disease Study 2010.” Lancet 380: 2224–60.
Lindhjem, H., S. Narvud, N. A. Braathen, and V. Biausque. 2011. “Valuing Mortality Risk Reductions from Environmental, Transport, and Health Policies: A Global Meta-Analysis of Stated Preference Studies.” Risk Analysis 31 (9): 1381–407.
Mehta, S., H. Shin, R. Burnett, T. North, and A. Cohen. 2013. “Ambient Particulate Air Pollution and Acute Lower Respiratory Infections: A Systematic Review and Implications for Estimating the Global Burden of Disease.” Air Qual Atmos Health 6: 69–83.
Narain, U., and C. Sall. 2016. Methodology for Valuing the Health Impacts of Air Pollu-
tion: Discussion of Challenges and Proposed Solutions. Washington, DC: World Bank.
Navrud, S., and H. Lindhjem. 2010. Meta-Analysis of Stated Preference VSL Studies: Fur-
ther Model Sensitivity and Benefit Transfer Issues. (ENV/EPOC/WPNEP(2010)10/FINAL). Environment Directorate. Paris: OECD.
OECD (Organisation for Economic Co-operation and Development). 2012. Mortality
Risk Valuation in Environment, Health, and Transport Policies. Paris: OECD.
OECD (Organisation for Economic Co-operation and Development). 2016. The Economic Consequences of Outdoor Air Pollution. Paris: OECD.
Ostro, B., J. V. Spadaro, S. Gumy, P. Mudu, Y. Awe, F. Forastiere, and A. Peters. 2018. “Assessing the Recent Estimates of the Global Burden of Disease for Ambient Air Pollu-tion: Methodological Changes and Implications for Low- and Middle-Income Countries.” Environmental Research 166: 713–25.
Pope, C. A. III, R. T. Burnett, D. Krewski, M. Jerrett, Y. Shi, E. E. Calle, and M. J. Thun.
2009. “Cardiovascular Mortality and Exposure to Airborne Fine Particulate Matter and Cigarette Smoke: Shape of the Exposure-Response Relationship.” Circulation 120: 941–48.
Pope, C. A. III, R. T. Burnett, M. J. Thun, E. E. Calle, D. Krewski, K. Ito, and G. Thurston.
2002. “Lung Cancer, Cardiopulmonary Mortality, and Long-Term Exposure to Fine Par-ticulate Air Pollution.” Journal of the American Medical Association 287: 1132–41.
Pope, C. A. III, R. T. Burnett, M. Turner, A. Cohen, D. Krewski, M. Jerrett, S. M. Gapstur,
and M. J. Thun. 2011. “Lung Cancer and Cardiovascular Disease Mortality Associated with Ambient Air Pollution and Cigarette Smoke: Shape of the Exposure-Response Relationships.“ Environmental Health Perspectives 119 (11): 1616–21.
Salomon, J. A., J. A. Haagsma, A. Davis, C. M. de Noordhout, S. Polinder, A. H. Have-
laar, A. Cassini, B. Devleesschauwer, M. Kretzschmar, N. Speybroeck, C. J. Murray, and T. Vos. 2015. “Disability Weights for the Global Burden of Disease 2013 Study.” Lancet
Global Health 3: e712–23.
Sánchez-Triana, E., S. Enriquez, B. Larsen, P. Webster, and J. Afzal. 2015. Sustainability
and Poverty Alleviation: Confronting Environmental Threats in Sindh, Pakistan. Directions in Development. Washington, DC: World Bank.
Shaddick, G., M. L. Thomas, A. Green, M. Brauer, A. van Donkelaar, R. Burnett, H. Chang,
A. Cohen, R. Van Dingenen, C. Dora, S. Gumy, Y. Liu, R. Martin, L. A. Waller, J. West, J.
V. Zidek, and A. Prüss-Ustün. 2018. “Data Integration Model for Air Quality: A Hierarchi-cal Approach to the Global Estimation of Exposures to Ambient Air Pollution.” Journal
of the Royal Statistical Society. Series C, Applied Statistics 2018 67: 231–53.
Shin, H., A. Cohen, C.A. Pope III, M. Ezzati, S. S. Lim, B. Hubbel, and R. T. Burnett. 2013. “Critical Issues in Combining Disparate Sources of Information to Estimate the Global Burden of Disease Attributable to Ambient Fine Particulate Matter Exposure.” Working Paper prepared for Harvard Center for Risk Analysis “Methods for Research Synthesis: A Cross-Disciplinary Workshop,” October 3, 2013.
Shin J., J. Y. Park, and J. Choi. 2018. “Long-Term Exposure to Ambient Air Pollutants and Mental Health Status. A Nationwide Population-Based Cross-Sectional Study.” PLOS One 13 (4): e0195607.
Shindell, D., J. C. I. Kuylenstierna, E. Vignati, R. van Dingenen, M. Amann, Z. Klimont,
S. C. Anenberg, N. Muller, G. Janssens-Maenhout, F. Raes, J. Schwartz, G. Faluvegi, L.
Pozzoli, K. Kupiainen, L. Höglund-Isaksson, L. Emberson, D. Streets, V. Ramanathan, K.
Hicks, N. T. K. Oanh, G. Milly, M. Williams, V. Demkine, and D. Fowler. 2012. “Simulta-neously Mitigating Near-Term Climate Change and Improving Human Health and Food Security.” Science 335: 183–89.
Van Donkelaar, A., R. Martin, M. Brauer, and B. Boys. 2015. “Use of Satellite Observa-tions for Long-Term Exposure Assessment of Global Concentrations of Fine Particulate Matter.” Environmental Health Perspectives 123: 135–43.
Van Donkelaar, A., R. V. Martin, M. Brauer, N. C. Hsu, R. A. Kahn, R. C. Levy, A. Lyapus-
tin, A. M. Sayer, and D. M. Winker. 2016. “Global Estimates of Fine Particulate Matter Using a Combined Geophysical-Statistical Method with Information from Satellites, Models, and Monitors.” Environmental Science and Technology 50: 3762–72.
WHO (World Health Organization). 2009. Estimated Deaths and DALYs Attributable to
Selected Environmental Risk Factors, by WHO Member States, 2004. http://www.who.int/quantifying_ehimpacts/national/countryprofile/intro/en/index.htm.
WHO (World Health Organization). 2016. Ambient Air Pollution: A Global Assessment
of Exposure and Burden of Disease. Geneva: WHO.
98World Bank Group The Global Health Cost of Ambient PM2.5
Air Pollution 99
Wilson, C. 2003. “Empirical Evidence Showing the Relationships Between Three Approaches for Pollution Control.” Environmental and Resource Economics 24: 97–101.
World Bank and IHME (Institute for Health Metrics and Evaluation). 2016. The Cost of Air
Pollution: Strengthening the Economic Case for Action. Washington, DC: World Bank.
World Bank. 2020a. Air Pollution and Climate. How Many Stones to Hit Both Targets?
Washington, DC: World Bank.
World Bank. 2020b. Implications of Exposure to Dust on the Burden of Disease from Air
Pollution. Washington, DC: World Bank.
World Bank. 2020c. Are All Air Pollution Particles Equal? – How Constituents and Sourc-
es of Fine Air Pollution Particles (PM2.5
) Affect Health. Washington, DC: World Bank.
Xu, X., S. U. Ha, and R. Basnet. 2016. “A Review of Epidemiological Research on Adverse Neurological Effects of Exposure to Ambient Air Pollution.” Frontiers in Public Health, 4: 157.
Zhang, X., X. Chen, and X. Zhang. 2018. “The Impact of Exposure to Air Pollution on Cognitive Performance.” Proceedings of the National Academy of Sciences 115 (37): 9193–97.

100Appendixes
WWW.WORLDBANK.ORG