The expression of recombinant genes in Escherichia coli can be strongly stimulated at the transcript...
15
The expression of recombinant genes in Escherichia coli can be strongly stimulated at the transcript production level by mutating the DNA-region corresponding to the 5-untranslated part of mRNA Laila Berg, 1 Rahmi Lale, 1 Ingrid Bakke, 1 Nigel Burroughs 2 and Svein Valla 1 * 1 Department of Biotechnology, Norwegian University of Science and Technology, N-7491 Trondheim, Norway. 2 Mathematics Institute and Warwick Systems Biology Centre, University of Warwick, Coventry. CV4 7AL, UK. Summary Secondary structures and the short Shine–Dalgarno sequence in the 5-untranslated region of bacterial mRNAs (UTR) are known to affect gene expression at the level of translation. Here we report the use of random combinatorial DNA sequence libraries to study UTR function, applying the strong, s 32 /s 38 - dependent, and positively regulated Pm promoter as a model. All mutations in the libraries are located at least 8 bp downstream of the transcriptional start site. The libraries were screened using the ampicillin- resistance gene (bla) as reporter, allowing easy iden- tification of UTR mutants that display high levels of expression (up to 20-fold increase relative to the wild- type at the protein level). Studies of the two UTR mutants identified by a modified screening procedure showed that their expression is stimulated to a similar extent at both the transcript and protein product levels. For one such mutant a model analysis of the transcription kinetics showed significant evidence of a difference in the transcription rate (about 18-fold higher than the wild type), while there was no evi- dence of a difference in transcript stability. The two UTR sequences also stimulated expression from a constitutive s 70 -dependent promoter (P1/Panti-tet), dem- onstrating that the UTR at the DNA or RNA level has a hitherto unrecognized role in transcription. Introduction The 5′-untranslated region of bacterial mRNAs (UTR) is known to be of critical importance for mRNA translation, and efficient translation is very important for obtaining high levels of recombinant gene expression in both many basic research projects and in industrial protein produc- tion. The feature in the UTR that is believed to be most important is the purine rich Shine–Dalgarno (SD) sequence, which by X-ray crystallographic studies of the mRNA bound to the ribosome has been confirmed to interact with the 3′ end of the 16S rRNA (anti-SD) in the 30S ribosomal subunit (Shine and Dalgarno, 1974; Steitz and Jakes, 1975; McCarthy and Brimacombe, 1994; Makrides, 1996; Yusupova et al., 2001; Laursen et al., 2005). In addition, the ribosomal protein S1 (Roberts and Raboniwitz, 1989; Farwell et al., 1992; Sub- ramanian, 1992; Tzareva et al., 1994), essential for in vivo translation in Escherichia coli (Sørensen et al., 1998), has been shown to bind to the 11 nucleotides directly upstream of the SD sequence (Sengupta et al., 2001). Secondary structures can prevent initiation of transla- tion from both correct and spurious initiation sites in the mRNA (de Smit and van Duin, 1990), usually when the SD sequence and/or the spacer between the SD sequence and translational start codon is inaccessible to the ribosomes (Spanjaard et al., 1989; de Smit and van Duin, 1994a,b). Secondary structures in the UTR can also prevent endonucleases from binding and initiating degradation of the mRNA (Grunberg-Manago, 1999; Rauhut and Klug, 1999; Deana and Belasco, 2005). Mutations near the transcriptional start site has been shown to influence start site selection, and thereby the expressional level (Walker and Osuna, 2002; Lewis and Adhya, 2004). In vitro experiments have demonstrated that RNA polymerase may produce many short (2 to ~12 nucleotides in length) abortive transcripts during initiation because of unsuccessful promoter escape, and mutations near the transcriptional start site has shown to influence the abortive to productive transcription initiation ratio (Hsu, 2002). Abortive transcripts may be an in vitro arte- fact (Kubori and Shimamoto, 1996), but the RNA poly- merase has to undergo promoter escape in vivo to proceed from the initiation to the elongation phase. During this transformation the RNA exit channel needs to be freed, and based on X-ray crystallographic structures and Received 10 March 2008; accepted 5 October 2008. *For correspon- dence. E-mail: [email protected]; Tel. (+47) 73598694; Fax (+47) 73591283. Microbial Biotechnology (2009) 2(3), 379–389 doi:10.1111/j.1751-7915.2009.00107.x © 2009 The Authors Journal compilation © 2009 Society for Applied Microbiology and Blackwell Publishing Ltd
-
Upload
independent -
Category
Documents
-
view
0 -
download
0
Transcript of The expression of recombinant genes in Escherichia coli can be strongly stimulated at the transcript...
The expression of recombinant genes in Escherichiacoli can be strongly stimulated at the transcriptproduction level by mutating the DNA-regioncorresponding to the 5�-untranslated part of mRNA
Laila Berg,1 Rahmi Lale,1 Ingrid Bakke,1
Nigel Burroughs2 and Svein Valla1*1Department of Biotechnology, Norwegian University ofScience and Technology, N-7491 Trondheim, Norway.2Mathematics Institute and Warwick Systems BiologyCentre, University of Warwick, Coventry. CV4 7AL, UK.
Summary
Secondary structures and the short Shine–Dalgarnosequence in the 5�-untranslated region of bacterialmRNAs (UTR) are known to affect gene expression atthe level of translation. Here we report the use ofrandom combinatorial DNA sequence libraries tostudy UTR function, applying the strong, s32/s38-dependent, and positively regulated Pm promoter asa model. All mutations in the libraries are located atleast 8 bp downstream of the transcriptional start site.The libraries were screened using the ampicillin-resistance gene (bla) as reporter, allowing easy iden-tification of UTR mutants that display high levels ofexpression (up to 20-fold increase relative to the wild-type at the protein level). Studies of the two UTRmutants identified by a modified screening procedureshowed that their expression is stimulated to a similarextent at both the transcript and protein productlevels. For one such mutant a model analysis of thetranscription kinetics showed significant evidence ofa difference in the transcription rate (about 18-foldhigher than the wild type), while there was no evi-dence of a difference in transcript stability. The twoUTR sequences also stimulated expression from aconstitutive s70-dependent promoter (P1/Panti-tet), dem-onstrating that the UTR at the DNA or RNA level has ahitherto unrecognized role in transcription.
Introduction
The 5′-untranslated region of bacterial mRNAs (UTR) isknown to be of critical importance for mRNA translation,
and efficient translation is very important for obtaininghigh levels of recombinant gene expression in both manybasic research projects and in industrial protein produc-tion. The feature in the UTR that is believed to bemost important is the purine rich Shine–Dalgarno (SD)sequence, which by X-ray crystallographic studies of themRNA bound to the ribosome has been confirmed tointeract with the 3′ end of the 16S rRNA (anti-SD) inthe 30S ribosomal subunit (Shine and Dalgarno, 1974;Steitz and Jakes, 1975; McCarthy and Brimacombe,1994; Makrides, 1996; Yusupova et al., 2001; Laursenet al., 2005). In addition, the ribosomal protein S1(Roberts and Raboniwitz, 1989; Farwell et al., 1992; Sub-ramanian, 1992; Tzareva et al., 1994), essential for in vivotranslation in Escherichia coli (Sørensen et al., 1998), hasbeen shown to bind to the 11 nucleotides directlyupstream of the SD sequence (Sengupta et al., 2001).
Secondary structures can prevent initiation of transla-tion from both correct and spurious initiation sites inthe mRNA (de Smit and van Duin, 1990), usually whenthe SD sequence and/or the spacer between the SDsequence and translational start codon is inaccessible tothe ribosomes (Spanjaard et al., 1989; de Smit andvan Duin, 1994a,b). Secondary structures in the UTRcan also prevent endonucleases from binding andinitiating degradation of the mRNA (Grunberg-Manago,1999; Rauhut and Klug, 1999; Deana and Belasco,2005).
Mutations near the transcriptional start site has beenshown to influence start site selection, and thereby theexpressional level (Walker and Osuna, 2002; Lewis andAdhya, 2004). In vitro experiments have demonstratedthat RNA polymerase may produce many short (2 to ~12nucleotides in length) abortive transcripts during initiationbecause of unsuccessful promoter escape, and mutationsnear the transcriptional start site has shown to influencethe abortive to productive transcription initiation ratio(Hsu, 2002). Abortive transcripts may be an in vitro arte-fact (Kubori and Shimamoto, 1996), but the RNA poly-merase has to undergo promoter escape in vivo toproceed from the initiation to the elongation phase. Duringthis transformation the RNA exit channel needs to befreed, and based on X-ray crystallographic structures and
Received 10 March 2008; accepted 5 October 2008. *For correspon-dence. E-mail: [email protected]; Tel. (+47) 73598694;Fax (+47) 73591283.
Microbial Biotechnology (2009) 2(3), 379–389 doi:10.1111/j.1751-7915.2009.00107.x
© 2009 The AuthorsJournal compilation © 2009 Society for Applied Microbiology and Blackwell Publishing Ltd
biophysical data this involves displacement of the s3.2 loop(transcript maximally 12 nucleotides) and release of thecontact between s4 and the RNA polymerase b-flap (tran-script maximally 15 nucleotides) (Murakami and Darst,2003; Paget and Helmann, 2003).
Based on the information presented above there aremany ways by which the UTR may be envisioned to affectexpression, and this indicated to us that by creatinglarge combinatorial mutant libraries of UTR nucleotidesequences, its range of potential influence on geneexpression might be analysed more efficiently than bysite-directed mutagenesis and error-prone PCR, oftenused in such studies (Komarova et al., 2002; 2005; Huanget al., 2006; Park et al., 2007). Here we have specificallychosen to study its potential to stimulate the level ofexpression, because this is obviously very important inbiotechnology.
The inducible and s32/s38-dependent Pm promoter(Marqués et al., 1999) and its cognate UTR together withits positive regulator gene xylS have previously been inte-grated into minimal replicon broad-host-range expressionvectors based on the RK2 plasmid (Blatny et al.,1997a,b). To facilitate the screening for high levelexpressing mutants the penicillin resistance gene (bla)was used as a reporter. The advantage of this system isthat it allows very strong selection for enhanced expres-sion levels by simply plating cells from the library on agarmedium supplied with a gradient of increasing levels ofampicillin (Winther-Larsen et al., 2000). The studies led toidentification of UTR DNA sequences that strongly stimu-late expression at the protein level (up to 20-fold), butmore surprisingly, also by enhancing the rate of transcriptformation and accumulation. We believe that these resultsare of great significance, partly because they have impor-tant consequences for the basic understanding of geneexpression, and partly because the wild-type Pm/xylSsystem was previously shown to be useful for productionof recombinant proteins at industrial levels (Sletta et al.,2004; 2007).
Results
Expression from the Pm promoter can be stronglystimulated by mutating the DNA region corresponding toits cognate UTR
Initially, a mutated Pm UTR library (LI) was constructed inthe corresponding part of the Pm/xylS expression cas-sette (bla used as reporter gene) by using randomlymutated synthetic oligonucleotides. The mutations wereintroduced throughout almost the entire UTR sequenceand mutants displaying a 10-fold increase in ampicillin-resistance levels compared with the wild type, couldeasily be isolated from this library. DNA sequence analy-sis showed that they carried three to six mutations in the
UTR DNA sequence, none of which affected the putativeSD sequence. Four examples of such mutants are indi-cated in the legend to Fig. 1. Most of the identifiedsequences had mutations near the transcriptional startsite, but as this was not always the case we wanted tospecifically investigate how sequences in the internalparts of the UTR affect gene expression. We thereforeprepared a new mutated Pm UTR library (LII) in plasmidpIB11 (Fig. 1), based on an oligonucleotide mixture inwhich only bases more than 7 bp downstream of thetranscriptional start site were subjected to randomsequence changes. Surprisingly, clones with equally highampicillin-resistance levels as in LI could be identifiedalso from this new library. Twelve such mutants wereselected for further studies, first by sequencing their UTRDNA sequences (LII-1 to -12), followed by new synthesisof the corresponding oligonucleotides (both strands).These were then exchanged with the corresponding partfrom the wild-type pIB11, reconfirmed by DNA sequenc-ing, and phenotype analysed with respect to ampicillinresistance of the hosts, confirming identity with the origi-nal mutants isolated. This means that the phenotypes ofthe mutants are caused solely by the UTR mutations.
Cells containing pIB11 with the wild-type UTR DNAsequence tolerated about 0.01 (uninduced) and 1 mg ml–1
(induced) of ampicillin, while the corresponding numbersfor hosts carrying pIB11 with the UTR DNA sequencesLII-1 to -12 were 0.15–0.25 and 9.5–11 mg ml–1 respec-tively. The identified mutated sequences carried two tofive changes relative to the wild type, but some positionsremained unchanged, including the GGAGT in or close tothe putative SD sequence (Fig. 1). Certain nucleotidepositions were substituted in many of the identifiedsequences, such as the A to C transversion at position+10 (9 out of 12) relative to the transcriptional start site.Interestingly, a majority of the mutations were A to C andT to C substitutions, whereas no G’s had been introduced.
Gene expression can be stimulated both at thetranscript and protein product levels by mutating theDNA region corresponding to the UTR
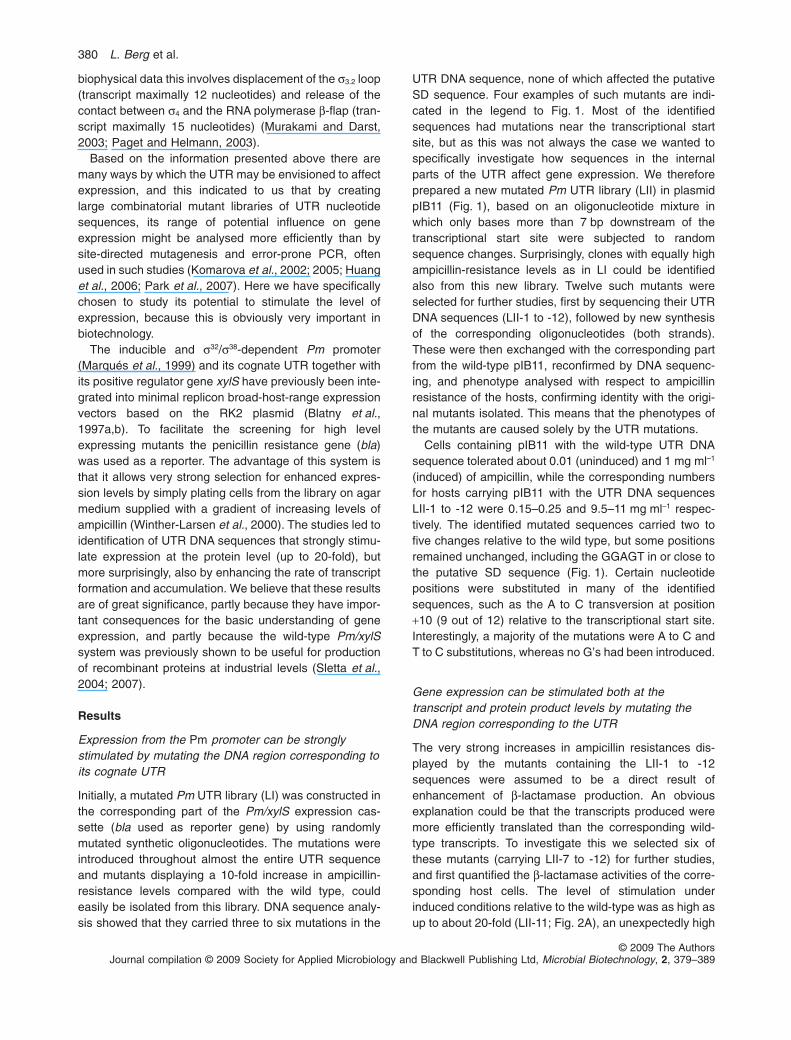
The very strong increases in ampicillin resistances dis-played by the mutants containing the LII-1 to -12sequences were assumed to be a direct result ofenhancement of b-lactamase production. An obviousexplanation could be that the transcripts produced weremore efficiently translated than the corresponding wild-type transcripts. To investigate this we selected six ofthese mutants (carrying LII-7 to -12) for further studies,and first quantified the b-lactamase activities of the corre-sponding host cells. The level of stimulation underinduced conditions relative to the wild-type was as high asup to about 20-fold (LII-11; Fig. 2A), an unexpectedly high
380 L. Berg et al.
© 2009 The AuthorsJournal compilation © 2009 Society for Applied Microbiology and Blackwell Publishing Ltd, Microbial Biotechnology, 2, 379–389

number taken into consideration that the wild-type systemhas been shown to be capable of industrial level produc-tion of recombinant proteins (see Introduction).
Interestingly, corresponding measurements of tran-script amounts by quantitative real-time PCR (qRT-PCR)showed that these levels were also very significantly
stimulated (a factor of about 7 for LII-11; Fig. 2A),although not to the same extent as at the proteinproduct level. Possible explanations for these observa-tions might be that the UTR mutations were causing thetranscripts to be less susceptible to RNA degradation,that more efficient translation leads to protection against
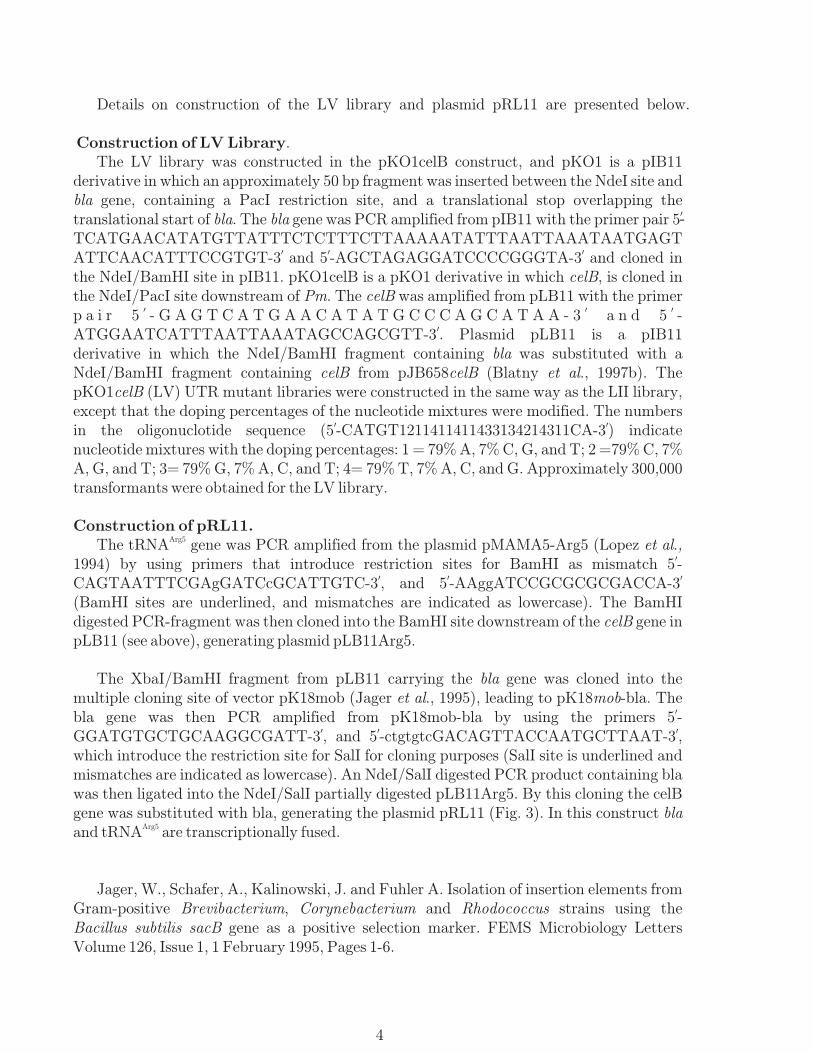
Fig. 1. Map of plasmid pIB11 and mutations giving rise to stimulated expression of bla. Restriction sites shown are unique. Pm, positivelyregulated promoter; xylS, gene encoding Pm activator; Apr (bla), ampicillin-resistance gene encoding b-lactamase; Kmr, kanamycin-resistancegene; trfA, gene encoding the essential replication protein; oriV, origin of vegetative replication; oriT, origin of transfer; t, bidirectionaltranscriptional terminator; rrnBT1T2, bidirectional transcriptional terminator. Details for the DNA sequences corresponding to the Pm5′-untranslated transcript region (UTR) are displayed above the plasmid map. SD is the putative Shine–Dalgarno sequence. Nucleotides inlowercase were randomly mutagenized. Deletion mutations are indicated by short horizontal lines. Transcriptional and translational start sitesare indicated with an arrow. The following base substitutions were identified in four selected examples from the screening of the LI library(nucleotide numbers are indicated in the 5′ to 3′ direction). Sequence 1: A2C, C3A, A14T. Sequence 2: C3A, A10C, T12C, A14C. Sequence 3:A2T, C3A, G6C, T12C, A14T. Sequence 4: A2T, A8G, C9T, T12C, A14T, T15A. Note that A10C is also found in nine of the 12 LII sequencesand T12C is found in four. The LI library was constructed in plasmid pLB1, which differs from pIB11 in the UTR region in that A4 has beenchanged to T, and T5 to A.
Enhanced transcription by 5� UTR mutations 381
© 2009 The AuthorsJournal compilation © 2009 Society for Applied Microbiology and Blackwell Publishing Ltd, Microbial Biotechnology, 2, 379–389
decay, or that more transcripts were formed by RNApolymerase.
UTR DNA sequences which strongly stimulate the rateof transcript formation independent of the promotercould be identified
The screenings reported here were parts of a bigger effortinvolving different reporter genes and screening proto-cols, and results from these studies indicated that thestrong stimulation of the amounts of transcripts presentwas difficult to explain as being the result of enhancedstability alone (data not shown). Furthermore, a change inthe transcriptional start site was found not to be essential,as primer extension analysis demonstrated that the startsite for Pm combined with LII-11 is identical to that of Pmcombined with the wild-type UTR (data not shown). Wetherefore decided to directly address the possibility thatmore transcripts might have been formed. In the screen-ings reported here selection is directly in favour of stimu-lated protein product formation. Mutations that putativelystimulate transcript formation might not necessarily beoptimal for translation, and thus less optimal for maximalprotein product formation. In screening protocols withalternative reporter genes (data not shown) we identifiedUTR DNA sequences leading to an increase in proteinproduction which correlated with the increase in transcriptamounts. Two such UTR DNA sequences (LV-1 and LV-2)are shown in Fig. 1. After insertion of these twosequences in the pIB11 context, it was found that the LV-1and LV-2 mutations caused an about equal and strongstimulation (about 13- and 17-fold respectively) of the blagene expression at both the transcript and protein product
levels (Fig. 2B). This observation might mean that theprocess of transcript formation has become stimulated bythe mutations, leaving the efficiency of translation pertranscript more or less unaffected. Alternatively, the muta-tions have resulted in the production of a more stabletranscript, so that the observed accumulation is the resultof reduced decay rates.
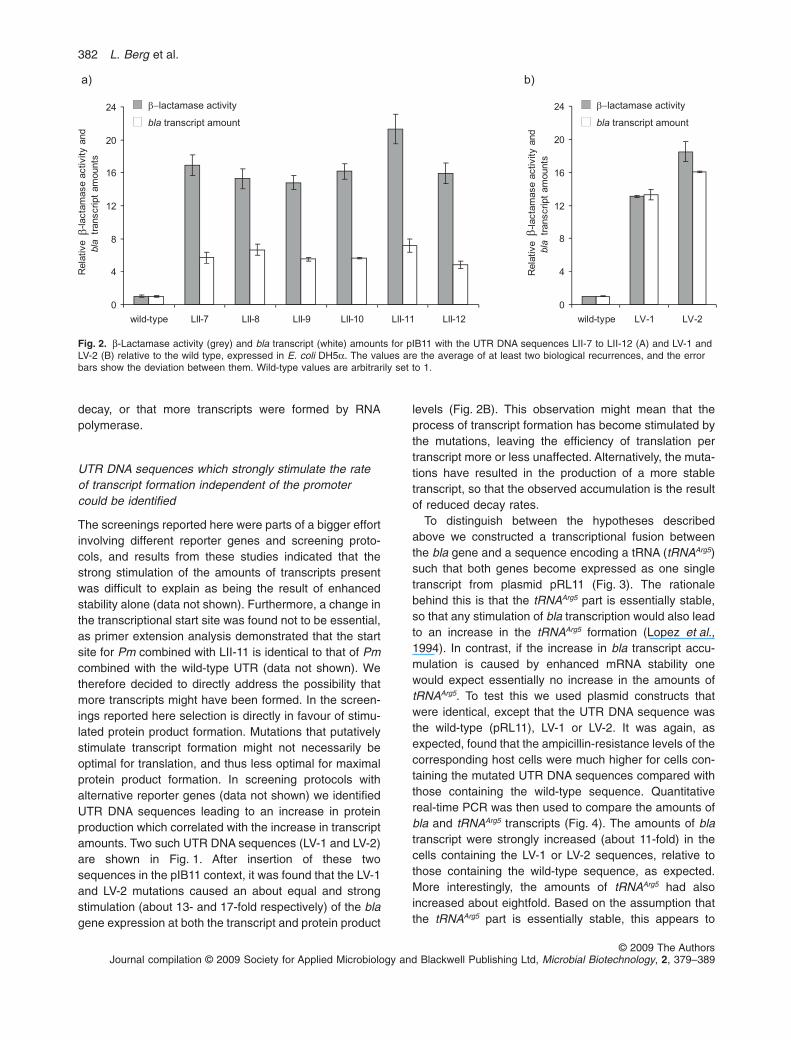
To distinguish between the hypotheses describedabove we constructed a transcriptional fusion betweenthe bla gene and a sequence encoding a tRNA (tRNAArg5)such that both genes become expressed as one singletranscript from plasmid pRL11 (Fig. 3). The rationalebehind this is that the tRNAArg5 part is essentially stable,so that any stimulation of bla transcription would also leadto an increase in the tRNAArg5 formation (Lopez et al.,1994). In contrast, if the increase in bla transcript accu-mulation is caused by enhanced mRNA stability onewould expect essentially no increase in the amounts oftRNAArg5. To test this we used plasmid constructs thatwere identical, except that the UTR DNA sequence wasthe wild-type (pRL11), LV-1 or LV-2. It was again, asexpected, found that the ampicillin-resistance levels of thecorresponding host cells were much higher for cells con-taining the mutated UTR DNA sequences compared withthose containing the wild-type sequence. Quantitativereal-time PCR was then used to compare the amounts ofbla and tRNAArg5 transcripts (Fig. 4). The amounts of blatranscript were strongly increased (about 11-fold) in thecells containing the LV-1 or LV-2 sequences, relative tothose containing the wild-type sequence, as expected.More interestingly, the amounts of tRNAArg5 had alsoincreased about eightfold. Based on the assumption thatthe tRNAArg5 part is essentially stable, this appears to
Fig. 2. b-Lactamase activity (grey) and bla transcript (white) amounts for pIB11 with the UTR DNA sequences LII-7 to LII-12 (A) and LV-1 andLV-2 (B) relative to the wild type, expressed in E. coli DH5a. The values are the average of at least two biological recurrences, and the errorbars show the deviation between them. Wild-type values are arbitrarily set to 1.
382 L. Berg et al.
© 2009 The AuthorsJournal compilation © 2009 Society for Applied Microbiology and Blackwell Publishing Ltd, Microbial Biotechnology, 2, 379–389
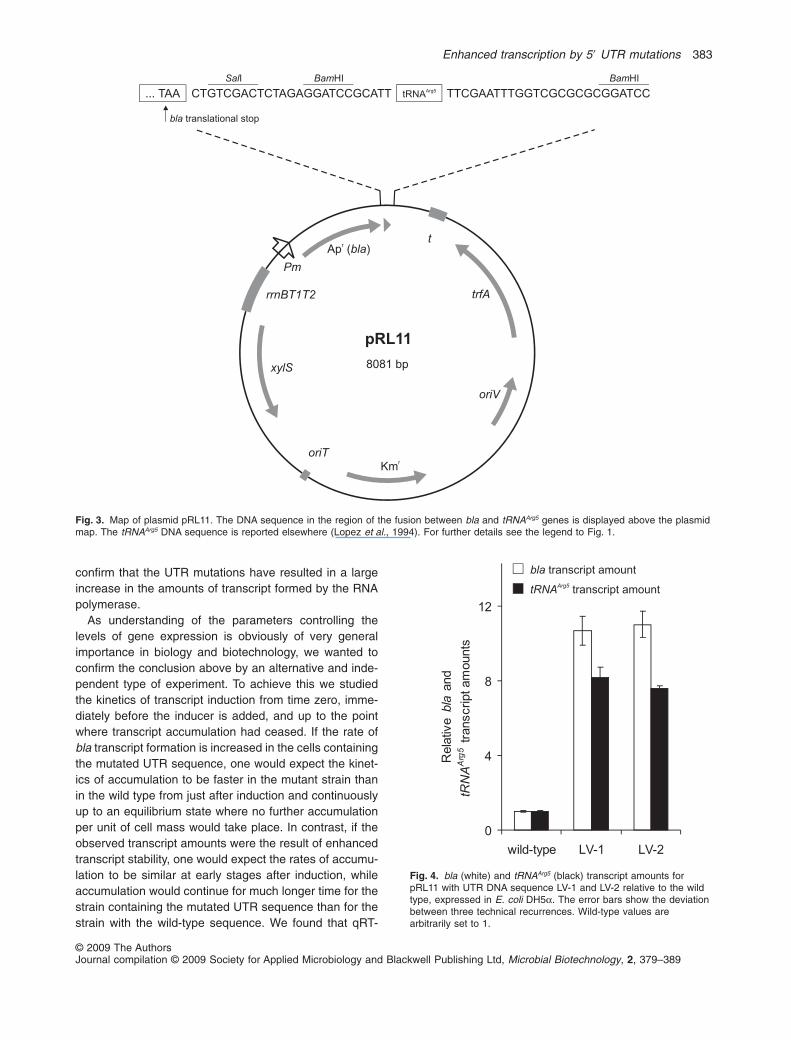
confirm that the UTR mutations have resulted in a largeincrease in the amounts of transcript formed by the RNApolymerase.
As understanding of the parameters controlling thelevels of gene expression is obviously of very generalimportance in biology and biotechnology, we wanted toconfirm the conclusion above by an alternative and inde-pendent type of experiment. To achieve this we studiedthe kinetics of transcript induction from time zero, imme-diately before the inducer is added, and up to the pointwhere transcript accumulation had ceased. If the rate ofbla transcript formation is increased in the cells containingthe mutated UTR sequence, one would expect the kinet-ics of accumulation to be faster in the mutant strain thanin the wild type from just after induction and continuouslyup to an equilibrium state where no further accumulationper unit of cell mass would take place. In contrast, if theobserved transcript amounts were the result of enhancedtranscript stability, one would expect the rates of accumu-lation to be similar at early stages after induction, whileaccumulation would continue for much longer time for thestrain containing the mutated UTR sequence than for thestrain with the wild-type sequence. We found that qRT-
Fig. 3. Map of plasmid pRL11. The DNA sequence in the region of the fusion between bla and tRNAArg5 genes is displayed above the plasmidmap. The tRNAArg5 DNA sequence is reported elsewhere (Lopez et al., 1994). For further details see the legend to Fig. 1.
Fig. 4. bla (white) and tRNAArg5 (black) transcript amounts forpRL11 with UTR DNA sequence LV-1 and LV-2 relative to the wildtype, expressed in E. coli DH5a. The error bars show the deviationbetween three technical recurrences. Wild-type values arearbitrarily set to 1.
Enhanced transcription by 5� UTR mutations 383
© 2009 The AuthorsJournal compilation © 2009 Society for Applied Microbiology and Blackwell Publishing Ltd, Microbial Biotechnology, 2, 379–389
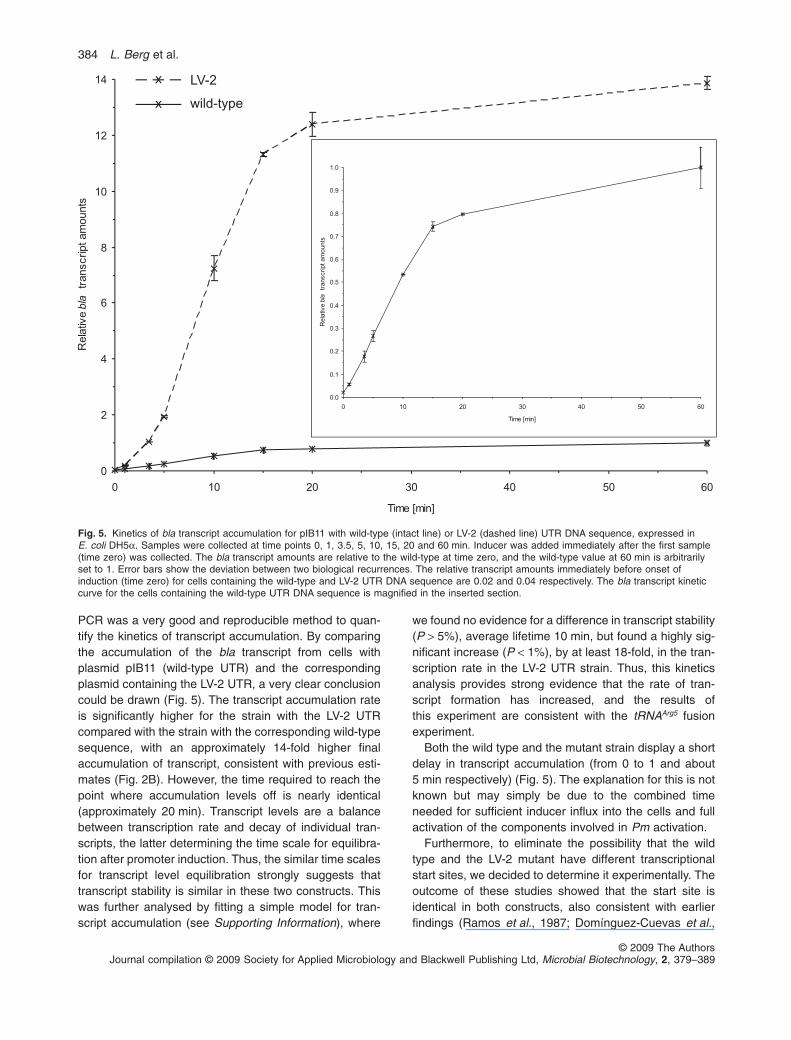
PCR was a very good and reproducible method to quan-tify the kinetics of transcript accumulation. By comparingthe accumulation of the bla transcript from cells withplasmid pIB11 (wild-type UTR) and the correspondingplasmid containing the LV-2 UTR, a very clear conclusioncould be drawn (Fig. 5). The transcript accumulation rateis significantly higher for the strain with the LV-2 UTRcompared with the strain with the corresponding wild-typesequence, with an approximately 14-fold higher finalaccumulation of transcript, consistent with previous esti-mates (Fig. 2B). However, the time required to reach thepoint where accumulation levels off is nearly identical(approximately 20 min). Transcript levels are a balancebetween transcription rate and decay of individual tran-scripts, the latter determining the time scale for equilibra-tion after promoter induction. Thus, the similar time scalesfor transcript level equilibration strongly suggests thattranscript stability is similar in these two constructs. Thiswas further analysed by fitting a simple model for tran-script accumulation (see Supporting Information), where
we found no evidence for a difference in transcript stability(P > 5%), average lifetime 10 min, but found a highly sig-nificant increase (P < 1%), by at least 18-fold, in the tran-scription rate in the LV-2 UTR strain. Thus, this kineticsanalysis provides strong evidence that the rate of tran-script formation has increased, and the results ofthis experiment are consistent with the tRNAArg5 fusionexperiment.
Both the wild type and the mutant strain display a shortdelay in transcript accumulation (from 0 to 1 and about5 min respectively) (Fig. 5). The explanation for this is notknown but may simply be due to the combined timeneeded for sufficient inducer influx into the cells and fullactivation of the components involved in Pm activation.
Furthermore, to eliminate the possibility that the wildtype and the LV-2 mutant have different transcriptionalstart sites, we decided to determine it experimentally. Theoutcome of these studies showed that the start site isidentical in both constructs, also consistent with earlierfindings (Ramos et al., 1987; Domínguez-Cuevas et al.,
Fig. 5. Kinetics of bla transcript accumulation for pIB11 with wild-type (intact line) or LV-2 (dashed line) UTR DNA sequence, expressed inE. coli DH5a. Samples were collected at time points 0, 1, 3.5, 5, 10, 15, 20 and 60 min. Inducer was added immediately after the first sample(time zero) was collected. The bla transcript amounts are relative to the wild-type at time zero, and the wild-type value at 60 min is arbitrarilyset to 1. Error bars show the deviation between two biological recurrences. The relative transcript amounts immediately before onset ofinduction (time zero) for cells containing the wild-type and LV-2 UTR DNA sequence are 0.02 and 0.04 respectively. The bla transcript kineticcurve for the cells containing the wild-type UTR DNA sequence is magnified in the inserted section.
384 L. Berg et al.
© 2009 The AuthorsJournal compilation © 2009 Society for Applied Microbiology and Blackwell Publishing Ltd, Microbial Biotechnology, 2, 379–389
2005) as indicated in Fig. 1. The possibility that RNApolymerase selects a new start site in the LV-2 mutant canthus be excluded.
Finally, to test if the transcription stimulation displayedby the two LV DNA sequences is independent ofthe promoter, we replaced the Pm promoter (s32/s38-dependent) in plasmid pIB11 with the constitutive s70 pro-moter P1 (generating plasmid pLB9). The UTR sequencein pLB9 was then substituted with those of LV-1 and LV-2.Phenotypic characterization of the resulting mutant cellsshowed that the ampicillin-resistance levels were about10-fold higher than that of the corresponding wild-type(pLB9). This strongly indicates that the LV-1 and LV-2sequences can stimulate transcription from very differenttypes of promoters.
Based on the results reported here we conclude thatthe UTR itself and/or the DNA region corresponding to itare of critical importance for the process of transcription.This conclusion appears to have important consequencesfor the basic understanding of gene expression in general,and also for recombinant protein production in researchand industry.
Discussion
The data presented in this paper illustrate the complexityof understanding the role the UTRs and their correspond-ing DNA sequences play in determining gene expressionat the transcript and protein levels. Taking into consider-ation the very extensive research that has been ongoingin this field for several decades it may seem surprisingthat the effects reported here have not been discoveredearlier. We believe that this can partly be explained bythe more recent methodological improvements allowingmore precise transcript level quantifications, and efficientrandom mutant library constructions combined with a verystrong positive screening system (level of host resistanceto ampicillin).
The UTR DNA sequences identified in the LII library arecharacterized by a strong stimulation at both the transcrip-tional and translational levels (Fig. 2A), while thosederived from the LV library stimulate mainly by enhancingthe rate of transcription (Figs 2B, 4 and 5). We believe thatthis difference can be explained by analysing how thescreening system works. The LII DNA sequences wereidentified based on the highest possible level of proteinproduct (b-lactamase). This is not necessarily achieved bymaximizing transcription, because the mutations might atthe same time also affect translation or transcript stability,potentially negatively. Thus, maximum protein output maybe achieved through a compromise between transcrip-tional and translational stimulation, possibly also includingtranscript stability. This compromise might be reached bya dominating transcriptional stimulation (as seen for LV-1
and LV-2), a dominating translational stimulation, or amixture of both (LII mutants).
Even though the design of the screening system canto a great extent explain why the particular phenotypeswere selected the underlying molecular mechanisms arefar less clear. It is well known that translation is affectedby the UTR, and the main focus in the literature hasbeen on the importance of the SD sequence and of sec-ondary structures which may or may not involve partsof the coding sequence. Concerning the translationaleffects observed with the mutants from the LII library itwas interesting to note that the mutations did not affectthe putative SD sequence, and in addition we wereunable to detect any correlations with putative secondarystructures eliminated or established by the mutatedUTRs. Furthermore, the assumed preference for A andT/U in UTR to diminish secondary structures (Laursenet al., 2005) does not agree with the high number ofnucleotide substitutions in which C had been introduced.Based on these results we therefore believe that the roleof the entire UTR sequence context in the control ofgene expression levels through translational effects ismore complex than previously anticipated, possibly dueto subtle interactions with parts of the components in theribosome. This hypothesis may potentially be studied inmore detail by in vitro binding and translational studiesinvolving the entire ribosome or parts of it, like the S1protein (see Introduction).
The strong stimulation of transcript levels derived fromall the mutated UTR DNA sequences reported here, butmost clearly the sequences originating from the LV librarywere surprising, and illustrate that the transcriptionalprocess can be strongly stimulated by changing basesquite far downstream of the transcriptional start site in theDNA region corresponding to the UTR. The mechanismsunderlying this is not clear, but it seems tempting tospeculate that the effects could be caused by a morerapid transition from closed to open transcription initiationcomplex and/or a faster promoter escape by RNA poly-merase. The DNA sequence from –11 to +20 occupies theactive-channel in both the first kinetically significant inter-mediate in RNA polymerase open complex formation andin the RNA polymerase open complex itself, based onreal-time hydroxyl radical (•OH) and potassium perman-ganate (KMnO4) footprints (Davis et al., 2007). During thesubsequent promoter escape, the RNA polymerase has toundergo major structural changes, including the displace-ment of the s3.2 loop to free the RNA exit channel when thetranscript is maximally ~12 nucleotides in length (seeIntroduction). In both of these processes there are con-tacts between the RNA polymerase and the DNA regioncorresponding to the UTR. In addition, during the pro-moter escape the UTR itself might influence the clearingof the RNA exit channel.
Enhanced transcription by 5� UTR mutations 385
© 2009 The AuthorsJournal compilation © 2009 Society for Applied Microbiology and Blackwell Publishing Ltd, Microbial Biotechnology, 2, 379–389
Based on the results reported here we conclude that theUTR and/or the DNA region corresponding to it have asignificantly more complex role in affecting gene expres-sion than previously realized, through a hitherto unrecog-nized effect on transcript formation. In addition, the entireUTR sequence, and not only the SD sequence, seemsto play an important role in the translational process.The underlying mechanisms behind these effects areunknown, but it appears likely that the answers will have tobe found by gaining deeper insights into the process ofpromoter escape in vivo, and in the complex interactionsthat take place between the UTR and the ribosome duringtranslation.
Experimental procedures
Bacterial strains, plasmids and growth media
Escherichia coli DH5a (Bethesda Research Laboratories)was used as host, except for in the construction and screen-ing of the mutated Pm UTR library, where E. coli Gold(Stratagene) was used.
pJT19bla (Winther-Larsen et al., 2000) represents theorigin for the plasmid constructs used in this work, and is aRK2-based expression vector containing the Pm/xylSexpression cassette with the ampicillin-resistance gene, bla,as the reporter gene for Pm. Plasmid pIB11, used for con-struction of the mutated Pm UTR library, is a pJT19bladerivative with a XbaI/MunI fragment containing therrnBT1T2 (transcriptional terminator) (Santos et al., 2001)cloned into the same sites of pJT19bla, an AflIII restrictionsite introduced upstream of the Pm promoter, and aBspLU11I restriction site inserted downstream of the Pmtranscriptional start site (Fig. 1). pRL11 (Fig. 3) is a pIB11derivative, and its construction required a large number ofsteps that are described in Supporting Information. Thedifferences between pRL11 and pIB11 consist in an alteredDNA sequence directly upstream of the unique BamHIrestriction site in pIB11, including the insertion of a SalI site,and the deletion of approximately 150 bp directly down-stream of the translational stop codon of the bla gene inpIB11. The tRNAArg5 gene is cloned into the BamHI andthus transcriptionally fuses bla and tRNAArg5 (Fig. 3). ThetRNAArg5 gene was PCR amplified from plasmid pMAMA5-Arg5 (Lopez et al., 1994) by using the primer set5′-CAGTAATTTCGAGGATCCGCATTGTC-3′ and 5′-AAGGATCCGCGCGCGACCA-3′. Plasmid pLB9 is a pIB11 deriva-tive with a BglII/BspLU11I fragment containing the P1 (alsoknown as Panti-tet) promoter (Brosius et al., 1982) cloned intothe same sites of pIB11. The P1 promoter was PCR ampli-fied from plasmid pPK34 (Karunakaran et al., 1998) byusing the primer set 5′-AGCCTATGCCTAGATCTTCCAGGGTGACG-3′ and 5′-TATCATCGATAACATGTAATGCGGTAGT-3′.
Cells were grown in L broth (10 g l–1 tryptone, 5 g l–1 yeastextract, and 5 g l–1 NaCl) or on L agar (L broth with 15 g l–1
Agar) at 37°C, except for in expression studies, where 30°Cwas used. Kanamycin (50 mg ml–1) was used as a marker forestablishment of the mutated Pm UTR libraries and the
Pm/xylS inducer, m-toluate, was always used at a concen-tration of 2 mM.
Standard DNA manipulations
Transformations of E. coli were performed with a modifiedRbCl protocol (http://www.promega.com) in cloning ex-periments. WizardPlus SV minipreps DNA purification kit(Promega) or Qiagen plasmid midi kit (Qiagen) were used forplasmid DNA purifications. Enzymatic manipulations wereperformed as described by the manufacturers. PCR reactionswere performed using the Expand high fidelity PCR system kit(Boehringer Mannheim) for cloning purposes, the polymeraseDynazymeII (Finnzymes) for generation of templates for DNAsequencing, and Quickchange II site-directed mutagenesis kit(Stratagene) for site-directed mutagenesis. PCR templateswere treated with the enzyme mixture ExoSapIt (USB) prior toDNA sequencing. Sequencing reactions were performed withthe ABI PRISM BigDye sequencing kit (Applied Biosystems),and analysed using an Applied Biosystems 3130 XL DNAsequencing machine (Applied Biosystems).
Construction of the mutated Pm UTR libraries
Ampicillin-resistance levels of host cells containing aplasmid-encoded b-lactamase gene (bla) is approximatelyproportional to the copy number of the plasmid (Uhlin andNordström, 1977), reflecting enhanced expression due toincreased gene dosage. Thus, ampicillin resistance can beused to estimate changes in the Pm UTR activity. ThepJT19bla derivative pIB11 was used for constructing themutated Pm UTR library, with the bla gene as a reporter ofPm activity. A kanamycin-resistance gene allows for plasmidselection, avoiding that Pm expression levels (ampicillinresistance) affect the composition of the UTR libraries.Construction of the LII library was performed according tothe procedure previously described (Winther-Larsen et al.,2000), with the exception that the oligonucleotides weredesigned to constitute a double-stranded DNA fragment con-taining the Pm UTR and with BspLU11I- and NdeI-compatibleends when annealed, for subsequent easy cloning into thepIB11 vector. One of the oligonucleotides corresponded tothe wild-type Pm UTR sequence (5′-TATGTTCATGACTCCATTATTATTGTA-3′), and the oligonucleotide correspondingto the complementary strand was randomly mutagenizedby the use of a mixed oligonucleotide solution (5′-CATGT1211411411433134214311CA-3′, where the numbersin sequence indicate the doping percentages of the nucle-otides: 1 = 70% A, 10% C, G and T; 2 = 70% C, 10% A, G andT; 3 = 70% G, 10% A, C and T; 4 = 70% T, 10% A, C and G).Approximately 25 000 transformants were obtained, mixedand used as a library (library LII). The LV library was con-structed in a similar way by using the same oligonucleotidemixture, but the plasmid construct used in the original screen-ing had a different history (see Supporting Information).
Screening for mutated UTR sequences leading tostimulation of expression from the Pm promoter
Screening for mutated Pm UTR sequences resulting inincreased ampicillin-resistance levels was performed
386 L. Berg et al.
© 2009 The AuthorsJournal compilation © 2009 Society for Applied Microbiology and Blackwell Publishing Ltd, Microbial Biotechnology, 2, 379–389
according to the procedure previously described (Winther-Larsen et al., 2000). The sequences of the Pm UTRs weredetermined for the selected high level expression candidatesusing the sequencing primer 5′-CTATCAAACCGGACACGTTTATCGTGGTTATGC-3′. PCR products generatedwith the primers 5′-CTTTCACCAGCGTTTCTGGGTG-3′ and5′-GATGTAGAAAGGCGCCAAGTC-3′ were used as tem-plates for the sequencing reactions. All mutants reportedunder Results were reproduced by cloning annealed newlysynthesized oligonucleotides with the mutations identified inthe original isolates. The reproduced mutants were also con-firmed by DNA sequencing, as described above.
b-Lactamase assay
Growth of strains and b-lactamase assay were performedaccording to the procedures previously described (Winther-Larsen et al., 2000). All enzyme activity analyses wererepeated at least twice, and measurements were carried outwith minimum three technical recurrences.
RNA isolation, cDNA synthesis, and transcriptquantification by qRT-PCR
Strains were grown as previously described (Winther-Larsenet al., 2000). Cell cultures were stabilized with RNAprotect(Qiagen) prior to freezing and RNA was isolated from thefrozen cell pellets using the RNAqeous kit (Ambion) asdescribed by the manufacturers. The RNA preparations weretreated with DNase (DNA-free, Ambion) and cDNA was pro-duced from 3 mg total RNA as template using the First-StrandcDNA synthesis kit (Amersham Biosciences) with randompd(N)6 primers as described by the suppliers. Two-step qRT-PCR with the power SYBR green PCR master mix (AppliedBiosystems) in a 7500 Real Time PCR System instrument(Applied Biosystems) was used for quantification of bla andtRNAArg5 transcripts. PCR cycles were 95°C for 10 min, fol-lowed by 40 cycles of amplification (95°C for 15 s; 60°C for1 min) except for the bla and tRNAArg5 fusion experiment werethe PCR cycles were 95°C for 10 min, followed by 40 cyclesof amplification (95°C for 15 s; 47°C for 1 min). Results wereanalysed using 7500 system software v1.3, and data werenormalized by the 2^DDCT method (Livak and Schmittgen,2001). Primers were designed using the primer express soft-ware (Applied Biosystems). Primer pairs used for transcriptquantification were 5′-ACGTTTTCCAATGATGAGCACTT-3′and 5′-TGCCCGGCGTCAACAC-3′ for bla, and 5′-GTCCTCTTAGTTAAATGG-3′ and 5′-AGGAATCGAACCTGC-3′ fortRNAArg5. A fragment from the kanamycin-resistance gene(primer pair 5′-TACCTTTGCCATGTTTCAGAAACA-3′ and5′-AATCAGGTGCGACAATCTATCGA-3′) or the 16S rRNAgene (primer pair 5′-ATTGACGTTACCCGCAGAAGAA-3′and 5′-GCTTGCACCCTCCGTATTACC-3′) was used as anormalizer. The normalizer genes gave nearly identicalresults.
Transcriptional start site determination
The transcriptional start site was determined for the pIB11construct containing the wild-type or LV-2 DNA sequence by
generating 5′-RACE-Ready cDNA from 100 mg ml–1 oftotal RNA (isolated as described above) by SMART RACEcDNA amplification kit (Clontech). Takara Bio’s PrimeScript(Clonetech) was used as reverse transcriptase. cDNA waspurified by QIAquick PCR purification kit (Qiagen), and usedas a template in the subsequent PCR step. 5′-RACE PCRreaction was carried out with SMART universal primer mix,the bla gene specific primer 5′-CTTTCACCAGCGTTTCTGGGTG-3′, and Expand high fidelity PCR system kit (Boe-hringer Mannheim). Single PCR product was excised fromgel, purified by QIAquick gel extraction kit (Qiagen) and TAcloned by using the PCR cloning kit (Qiagen). Selectedclones from the resulting constructs were subjected tosequencing (Eurofins MWG Operon) by using the M13 uni(-21) 5′-TGTAAAACGACGGCCAGT-3′ as sequencingprimer.
Acknowledgements
We would like to thank professor Agamemnon J. Carpousisfor suggesting the tRNA fusion experiment, and ProfessorMark Dreyfus for kindly providing us with important strains,and MWG Biotech AG for help with the design of primers forqRT-PCR quantification of tRNA. This work was supported bythe Norwegian Research Council, Grant Number 140533.
References
Blatny, J.M., Brautaset, T., Winther-Larsen, H.C., Haugan, K.,and Valla, S. (1997a) Construction and use of a versatileset of broad-host-range cloning and expression vectorsbased on the rk2 replicon. Appl Environ Microbiol 63: 370–379.
Blatny, J.M., Brautaset, T., Winther-Larsen, H.C., Karunaka-ran, P., and Valla, S. (1997b) Improved broad-host-rangeRK2 vectors useful for high and low regulated gene expres-sion levels in gram-negative bacteria. Plasmid 38: 35–51.
Brosius, J., Cate, R.L., and Perlmutter, A.P. (1982) Preciselocation of two promoters for the b-lactamase gene ofpBR322. J Biol Chem 257: 9205–9210.
Davis, C.A., Bingman, C.A., Landick, R., Record, M.T., Jr,and Saecker, R.M. (2007) Real-time footprinting of DNA inthe first kinetically significant intermediate in open complexformation by Escherichia coli RNA polymerase. Proc NatlAcad Sci USA 104: 7833–7838.
Deana, A., and Belasco, J.G. (2005) Lost in translation: theinfluence of ribosomes on bacterial mRNA decay. GenesDev 19: 2526–2533.
Domínguez-Cuevas, P., Marín, P., Ramos, J.L., andMarqués, S. (2005) RNA polymerase holoenzymes canshare a single transcription start site for the Pm promoter:Critical nucleotides in the -7 to -18 region are needed toselect between RNA polymerase with s38 or s32. J BiolChem 280: 41315–41323.
Farwell, M.A., Roberts, M.W., and Rabinowitz, J.C. (1992)The effect of ribosomal protein S1 from Escherichia coliand Micrococcus luteus on protein synthesis in vitro byE. coli and Bacillus subtilis. Mol Microbiol 6: 3375–3383.
Grunberg-Manago, M. (1999) Messenger RNA stability andits role in control of gene expression in bacteria andphages. Annu Rev Genet 33: 193–227.
Enhanced transcription by 5� UTR mutations 387
© 2009 The AuthorsJournal compilation © 2009 Society for Applied Microbiology and Blackwell Publishing Ltd, Microbial Biotechnology, 2, 379–389
Hsu, L.M. (2002) Promoter clearance and escape in prokary-otes. Biochim Biophys Acta 1577: 191–207.
Huang, X., Zhang, X., Zhou, Y., Zhang, Z., and Cass, A.E.G.(2006) Directed evolution of the 5′-untranslated region ofthe phoA gene in Escherichia coli simultaneously yieldsa stronger promoter and a stronger Shine-Dalgarnosequence. Biotechnol J 1: 1275–1282.
Karunakaran, P., Blatny, J.M., Ertesvåg, H., and Valla, S.(1998) Species-dependent phenotypes of replication-temperature-sensitive trfA mutants of plasmid RK2: acodon-neutral base substitution stimulates temperaturesensitivity by leading to reduced levels of trfA expression.J Bacteriol 180: 3793–3798.
Komarova, A.V., Tchufistova, L.S., Supina, E.V., and Boni,I.V. (2002) Protein S1 counteracts the inhibitory effect ofthe extended Shine-Dalgarno sequence on translation.RNA 8: 1137–1147.
Komarova, A.V., Tchufistova, L.S., Dreyfus, M., and Boni, I.V.(2005) AU-rich sequences within 5′ untranslated leadersenhance translation and stabilize mRNA in Escherichiacoli. J Bacteriol 187: 1344–1349.
Kubori, T., and Shimamoto, N. (1996) A branched pathway inthe early stage of transcription by Escherichia coli RNApolymerase. J Mol Biol 256: 449–457.
Laursen, B.S., Sørensen, H.P., Mortensen, K.K., andSperling-Petersen, H.U. (2005) Initiation of protein synthe-sis in bacteria. Microbiol Mol Biol Rev 69: 101–123.
Lewis, D.E.A., and Adhya, S. (2004) Axiom of determiningtranscription start points by RNA polymerase in Escheri-chia coli. Mol Microbiol 54: 692–701.
Livak, K.J., and Schmittgen, T.D. (2001) Analysis of relativegene expression data using real-time quantitative PCR andthe 2(-delta delta C(T)) method. Methods 25: 402–408.
Lopez, P.J., Iost, I., and Dreyfus, M. (1994) The use of a tRNAas a transcriptional reporter: the T7 late promoter isextremely efficient in Escherichia coli but its transcripts arepoorly expressed. Nucleic Acids Res 22: 1186–1193.
McCarthy, J.E.G., and Brimacombe, R. (1994) Procaryotictranslation: the interactive pathway leading to initiation.Trends Genet 10: 402–407.
Makrides, S.C. (1996) Strategies for achieving high-levelexpression of genes in Escherichia coli. Microbiol Rev 60:512–538.
Marqués, S., Manzanera, M., González-Pérez, M.M., Gal-legos, M.T., and Ramos, J.L. (1999) The XylS-dependentPm promoter is transcribed with s32 or s38 depending onthe growth phase. Mol Microbiol 31: 1105–1113.
Murakami, K.S., and Darst, S.A. (2003) Bacterial RNA poly-merases: the whole story. Curr Opin Struct Biol 13: 31–39.
Paget, M.S.B., and Helmann, J.D. (2003) The s70 family ofsigma factors. Genome Biol 4: 203–208.
Park, Y.S., Seo, S.W., Hwang, S., Chu, H.S., Ahn, J., Kim, T.,et al. (2007) Design of 5′-untranslated region variants fortunable expression in Escherichia coli. Biochem BiophysRes Commun 356: 136–141.
Ramos, J.L., Mermod, N., and Timmis, K.N. (1987) Regula-tory circuits controlling transcription of TOL plasmid operonencoding meta-cleavage pathway for degradation of alky-lbenzoates by Pseudomonas. Mol Microbiol 1: 293–300.
Rauhut, R., and Klug, G. (1999) mRNA degradation in bac-teria. FEMS Microbiol Rev 23: 353–370.
Roberts, M.W., and Raboniwitz, J.C. (1989) The effects ofEscherichia coli ribosomal protein S1 on the translationalspecificity of bacterial ribosomes. J Biol Chem 264: 2228–2235.
Santos, P.M., Di Bartolo, I., Blatny, J.M., Zennaro, E., andValla, S. (2001) New broad-host-range promoter probevectors based on the plasmid RK2 replicon. FEMS Micro-biol Lett 195: 91–96.
Sengupta, J., Agrawal, R.K., and Frank, J. (2001) Visualiza-tion of protein S1 within the 30S ribosomal subunit and itsinteraction with messenger RNA. Proc Natl Acad Sci USA98: 11991–11996.
Shine, J., and Dalgarno, L. (1974) The 3′-terminal sequenceof E. coli 16S ribosomal RNA: complementary to nonsensetriplets and ribosome binding sites. Proc Natl Acad Sci USA71: 1342–1346.
Sletta, H., Nedal, A., Aune, T.E.V., Hellebust, H., Hakvåg, S.,Aune, R., et al. (2004) Broad-host-range plasmid pJB658can be used for industrial-level production of a secretedhost-toxic single-chain antibody fragment in Escherichiacoli. Appl Environ Microbiol 70: 7033–7039.
Sletta, H., Tøndervik, A., Hakvåg, S., Aune, T.E.V., Nedal, A.,Aune, R., et al. (2007) The presence of N-terminal secre-tion signal sequences leads to strong stimulation of thetotal expression levels of three tested medically importantproteins during high-cell-density cultivations of Escherichiacoli. Appl Environ Microbiol 73: 906–912.
de Smit, M., and van Duin, J. (1990) Control of prokaryotictranslational initiation by mRNA secondary structure. ProgNucleic Acids Res Mol Biol 38: 1–35.
de Smit, M., and van Duin, J. (1994a) Translational initiationon structured messengers (Another role for the Shine-Dalgarno interaction). J Mol Biol 235: 173–184.
de Smit, M., and van Duin, J. (1994b) Control of translation bymRNA secondary structure in Escherichia coli (A quantita-tive analysis of literature data). J Mol Biol 244: 144–150.
Spanjaard, R.A., van Dijk, M.C.M., Turion, A.J., and van Duin,J. (1989) Expression of the rat interferon-a1 gene inEscherichia coli controlled by the secondary structure ofthe translation-initiation region. Gene 80: 345–351.
Steitz, J.A., and Jakes, K. (1975) How ribosomes selectinitiator regions in mRNA: base pair formation between the3′ terminus of 16S RNA and the mRNA during initiation ofprotein synthesis in E. coli. Proc Natl Acad Sci USA 72:4734–4738.
Subramanian, A.R. (1992) Structure and functions of riboso-mal protein S1. Prog Nucleic Acids Res Mol Biol 28: 101–142.
Sørensen, M.A., Fricke, J., and Pedersen, S. (1998) Riboso-mal protein S1 is required for translation of most, if not all,natural mRNAs in Escherichia coli in vivo. J Mol Biol 280:561–569.
Tzareva, N.V., Makhno, V.I., and Boni, I.V. (1994) Ribosome-messenger recognition in the absence of the Shine-Dalgarno interactions. FEBS Lett 337: 189–194.
Uhlin, B., and Nordström, K. (1977) R plasmid gene dosageeffects in Escherichia coli K-12: copy mutants of the Rplasmid R1drd-19. Plasmid 1: 1–7.
Walker, K.A., and Osuna, R. (2002) Factors affecting startsite selection at the Escherichia coli fis promoter. J Bacte-riol 184: 4783–4791.
388 L. Berg et al.
© 2009 The AuthorsJournal compilation © 2009 Society for Applied Microbiology and Blackwell Publishing Ltd, Microbial Biotechnology, 2, 379–389
Winther-Larsen, H.C., Blatny, J.B., Valand, B., Brautaset, T.,and Valla, S. (2000) Pm promoter expression mutants andtheir use in broad-host-range RK2 plasmid vectors. MetabEng 2: 92–103.
Yusupova, G.Z., Yusupov, M.M., Cate, J.H., and Noller, H.F.(2001) The path of messenger RNA through the ribosome.Cell 106: 233–241.
Supporting information
Additional Supporting Information may be found in the onlineversion of this article:
Fig. S1. Simulation of mRNA concentration after induction att = 0.Fig. S2. Time series with transcript levels rescaled between0.1.Fig. S3. Fits of the recovery to time points 3.5 min and above.Fig. S4. Simulation of mRNA concentration after induction att = 0 with a model for a finite time for the inducer activity.Table S1. Model fit and parmeter estimates.
Please note: Wiley-Blackwell are not responsible for thecontent or functionality of any supporting materials suppliedby the authors. Any queries (other than missing material)should be directed to the corresponding author for the article.
Enhanced transcription by 5� UTR mutations 389
© 2009 The AuthorsJournal compilation © 2009 Society for Applied Microbiology and Blackwell Publishing Ltd, Microbial Biotechnology, 2, 379–389
Supplementary information: The expression of recombinant genesin Escherichia coli can be strongly stimulated at the transcript production levelby mutating the DNA-region corresponding to the 5′-untranslated part ofmRNA Berg et al.
Details of the mathematical model and model parameter estimates to support theanalysis of the transcript kinetics is presented below.Mathematical Model.
Messenger RNA is assumed produced at a background rate µ0 prior to induction, andrate µs > µ0 after induction, and assumed subject to decay at rate δs. Subscript s refers tothe different UTR bla constructs: s= wildtype, LV-2 under hypothesis I (transcription rateis increased), or LV-2 under hypothesis II (mRNA stability rate is increased). Thus underhypothesis I µLV 2 > µwt, δLV 2 = δwt, and under hypothesis II, µLV 2 = µwt, δLV 2 < δwt.
The (average) concentration of mRNA in the cell satisfies the differential equation
dX
dt= µs(t)− δsX
for construct s. Here we are ignoring stochastic fluctuations in transcription and decaywhich is appropriate since a population average is measured. Under the instantaneousinduction model described above, this differential equation can be solved
X(t) =µ0
δs, t < 0, X(t) =
µs + (µ0 − µs) e−δst
δs, t > 0.
Prior to induction the mRNA is at steady state µ0/δs, and after induction it relaxes tothe new steady state µs/δs with characteristic time 1/δs. Simulations are shown in FigureS1. We consider two hypotheses,
• Hypothesis I. The LV-2 construct differs only in the transcription rates.
• Hypothesis II. The LV-2 construct differs only in the decay rates of transcripts.
A B C
−10 0 10 20 30 40 50 600.2
0.3
0.4
0.5
0.6
0.7
0.8
0.9
1
Time, mins
Tra
nscr
ipt l
evel
, arb
itrar
y un
its
−10 0 10 20 30 40 50 600
0.5
1
1.5
2
2.5
3
3.5
4
Time, mins
Tra
nscr
ipt l
evel
, arb
itrar
y un
its
−10 0 10 20 30 40 50 600
0.1
0.2
0.3
0.4
0.5
0.6
0.7
0.8
0.9
1
Time, mins
Tra
nscr
ipt l
evel
, arb
itrar
y un
its
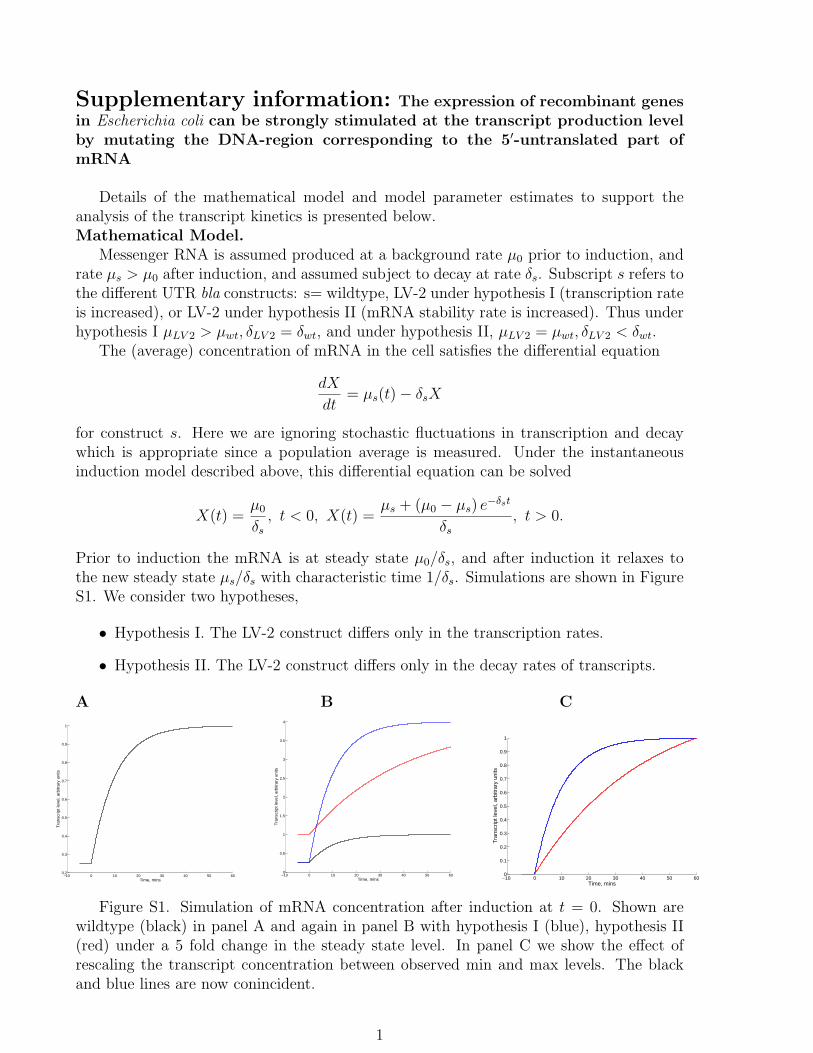
Figure S1. Simulation of mRNA concentration after induction at t = 0. Shown arewildtype (black) in panel A and again in panel B with hypothesis I (blue), hypothesis II(red) under a 5 fold change in the steady state level. In panel C we show the effect ofrescaling the transcript concentration between observed min and max levels. The blackand blue lines are now conincident.
1
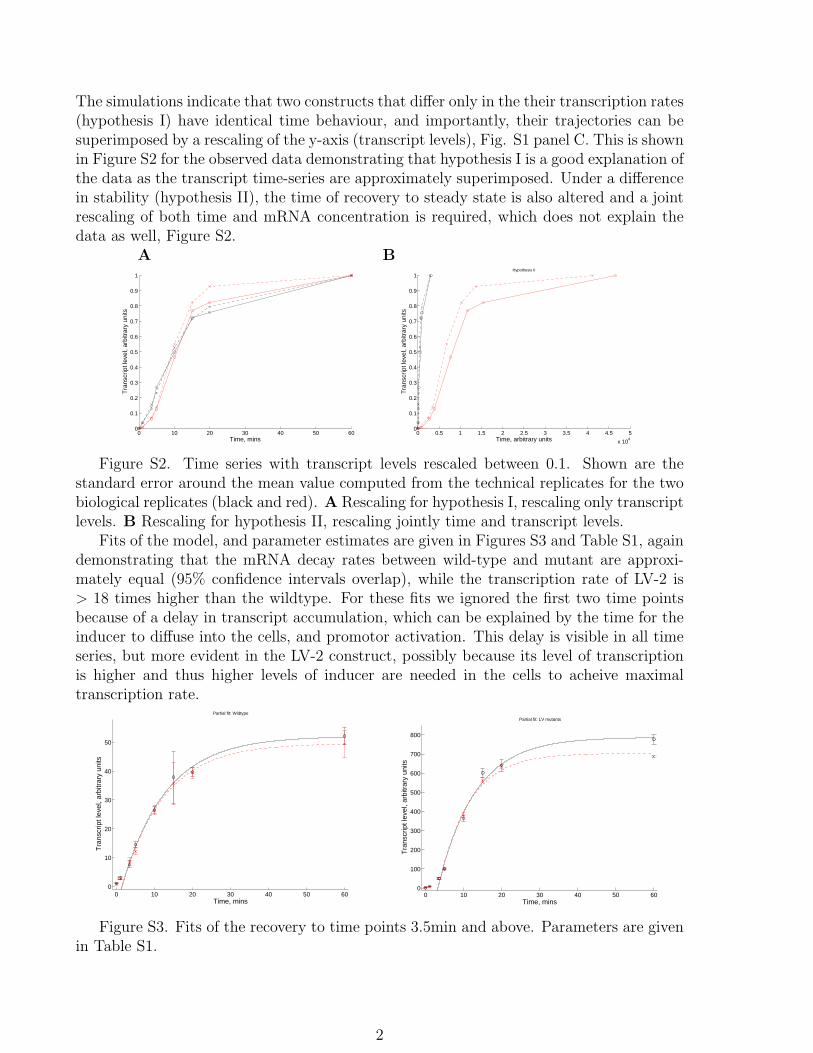
The simulations indicate that two constructs that differ only in the their transcription rates(hypothesis I) have identical time behaviour, and importantly, their trajectories can besuperimposed by a rescaling of the y-axis (transcript levels), Fig. S1 panel C. This is shownin Figure S2 for the observed data demonstrating that hypothesis I is a good explanation ofthe data as the transcript time-series are approximately superimposed. Under a differencein stability (hypothesis II), the time of recovery to steady state is also altered and a jointrescaling of both time and mRNA concentration is required, which does not explain thedata as well, Figure S2.
A B
0 10 20 30 40 50 600
0.1
0.2
0.3
0.4
0.5
0.6
0.7
0.8
0.9
1
Time, mins
Tra
nscr
ipt l
evel
, arb
itrar
y un
its
0 0.5 1 1.5 2 2.5 3 3.5 4 4.5 5
x 104
0
0.1
0.2
0.3
0.4
0.5
0.6
0.7
0.8
0.9
1
Time, arbitrary units
Tra
nscr
ipt l
evel
, arb
itrar
y un
its
Hypothesis II
Figure S2. Time series with transcript levels rescaled between 0.1. Shown are thestandard error around the mean value computed from the technical replicates for the twobiological replicates (black and red). A Rescaling for hypothesis I, rescaling only transcriptlevels. B Rescaling for hypothesis II, rescaling jointly time and transcript levels.
Fits of the model, and parameter estimates are given in Figures S3 and Table S1, againdemonstrating that the mRNA decay rates between wild-type and mutant are approxi-mately equal (95% confidence intervals overlap), while the transcription rate of LV-2 is> 18 times higher than the wildtype. For these fits we ignored the first two time pointsbecause of a delay in transcript accumulation, which can be explained by the time for theinducer to diffuse into the cells, and promotor activation. This delay is visible in all timeseries, but more evident in the LV-2 construct, possibly because its level of transcriptionis higher and thus higher levels of inducer are needed in the cells to acheive maximaltranscription rate.
0 10 20 30 40 50 600
10
20
30
40
50
Time, mins
Tra
nscr
ipt l
evel
, arb
itrar
y un
its
Partial fit: Widtype
0 10 20 30 40 50 600
100
200
300
400
500
600
700
800
Time, mins
Tra
nscr
ipt l
evel
, arb
itrar
y un
its
Partial fit: LV mutants
Figure S3. Fits of the recovery to time points 3.5min and above. Parameters are givenin Table S1.
2
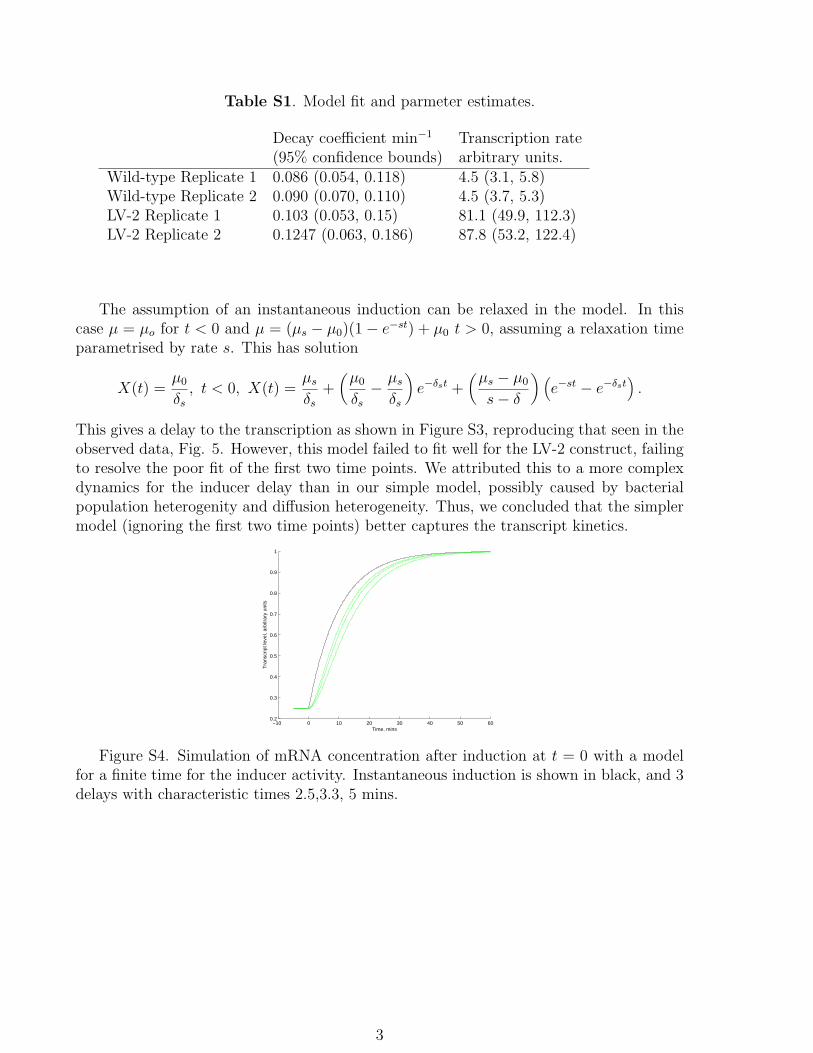
Table S1. Model fit and parmeter estimates.
Decay coefficient min−1 Transcription rate(95% confidence bounds) arbitrary units.
Wild-type Replicate 1 0.086 (0.054, 0.118) 4.5 (3.1, 5.8)Wild-type Replicate 2 0.090 (0.070, 0.110) 4.5 (3.7, 5.3)LV-2 Replicate 1 0.103 (0.053, 0.15) 81.1 (49.9, 112.3)LV-2 Replicate 2 0.1247 (0.063, 0.186) 87.8 (53.2, 122.4)
The assumption of an instantaneous induction can be relaxed in the model. In thiscase µ = µo for t < 0 and µ = (µs − µ0)(1− e−st) + µ0 t > 0, assuming a relaxation timeparametrised by rate s. This has solution
X(t) =µ0
δs, t < 0, X(t) =
µsδs
+(µ0
δs− µsδs
)e−δst +
(µs − µ0
s− δ
) (e−st − e−δst
).
This gives a delay to the transcription as shown in Figure S3, reproducing that seen in theobserved data, Fig. 5. However, this model failed to fit well for the LV-2 construct, failingto resolve the poor fit of the first two time points. We attributed this to a more complexdynamics for the inducer delay than in our simple model, possibly caused by bacterialpopulation heterogenity and diffusion heterogeneity. Thus, we concluded that the simplermodel (ignoring the first two time points) better captures the transcript kinetics.
−10 0 10 20 30 40 50 600.2
0.3
0.4
0.5
0.6
0.7
0.8
0.9
1
Time, mins
Tra
nscr
ipt l
evel
, arb
itrar
y un
its
Figure S4. Simulation of mRNA concentration after induction at t = 0 with a modelfor a finite time for the inducer activity. Instantaneous induction is shown in black, and 3delays with characteristic times 2.5,3.3, 5 mins.
3