Galaxy number counts - V. Ultradeep counts: the Herschel and Hubble Deep Fields
arX
iv:a
stro
-ph/
0008
065v
1 3
Aug
200
0
Mon. Not. R. Astron. Soc. 000, 000–000 (0000) Printed 21 January 2014 (MN LATEX style file v1.4)
The European Large Area ISO Survey III:
90µm extragalactic source counts
Andreas Efstathiou1, Seb Oliver1,2, Michael Rowan-Robinson1,
C. Surace1, T. Sumner1, P. Heraudeau3, M.J.D. Linden-Vørnle4,
D. Rigopoulou5, S. Serjeant1, R.G. Mann1, C.J. Cesarsky6, L. Danese7,
A. Franceschini8, R. Genzel5, A. Lawrence9, D. Lemke3,
R.G. McMahon10, G. Miley11, J-L. Puget12, B. Rocca-Volmerange13,1 Astrophysics Group, Blackett Laboratory, Imperial College of Science Technology & Medicine, Prince Consort Rd., Lon-don.SW7 2BZ2 Astronomy Centre, University of Sussex, Falmer, Brighton BN1 9QJ3 Max-Planck-Institut fur Astronomie, Konigstuhl 17, D-69117, Heidelburg, Germany4Danish Space Research Institute, Juliane Maries Vej 30, DK–2100 Copenhagen Ø, Denmark5 Max-Planck-Institut fur extraterrestrische Physik, Postfach 1603, 85740 Garching, Germany6 CEA / SACLAY, 91191 Gif sur Yvette cedex, France7 SISSA, International School for Advanced Studies, Via Beirut 2-4, 34014 Trieste, Italy8 Dipartimento di Astronomia, Universita’ di Padova, Vicolo Osservatorio 5, I-35122 Padova, Italy9 Institute for Astronomy, University of Edinburgh, Royal Observatory, Blackford Hill, Edinburgh EH9 3HJ10 Institute of Astronomy, The Observatories, Madingley Road, Cambridge, CB3 0HA11 Leiden Observatory, P.O. Box 9513, NL-2300 RA Leiden, The Netherlands12 Institut d’Astrophysique Spatiale, Batiment 121, Universite Paris XI, 91405 Orsay cedex, France13 Institut d’Astrophysique de Paris, 98bis Boulevard Arago, F 75014 Paris, France
Submitted 18th October 1999; accepted 1st August 2000
ABSTRACT
We present results and source counts at 90µm extracted from thePreliminary Analysis of the European Large Area ISO Survey (ELAIS).The survey covered about 11.6deg2 of the sky in four main areas andwas carried out with the PHOT instrument onboard the Infrared SpaceObservatory (ISO). The survey is at least an order of magnitude deeperthan the IRAS 100µm survey and is expected to provide constraints on theformation and evolution of galaxies. The majority of the detected sourcesare associated with galaxies on optical images. In some cases the opticalassociations are interacting pairs or small groups of galaxies suggestingthe sample may include a significant fraction of luminous infrared galaxies.The source counts extracted from a reliable subset of the detected sourcesare in agreement with strongly evolving models of the starburst galaxypopulation.
Key words: surveys - galaxies: evolution - galaxies: formation - galax-ies:Seyfert - galaxies:starburst - infrared:galaxies
1 INTRODUCTION
As is well known, a large fraction of the bolometricluminosity of galaxies is emitted at far-infrared wave-
lengths as a result of reprocessing of starlight by dust.The spectra of galaxies observed by IRAS typicallypeak in the 60-100µm range. Observations of galaxies
c© 0000 RAS
2 Andreas Efstathiou, Seb Oliver, Michael Rowan-Robinson, et al
in the far-infrared are therefore essential for deter-mining the star formation rate and dust masses ofgalaxies. Interest in dust-enshrouded galaxies has re-cently been renewed by the discovery of a far-infrared(140-850µm) background, thought to be due to dis-crete sources (Puget et al. 1996, Fixsen et al. 1998,Hauser et al. 1998, Lagache et al. 1999), and detec-tions of high redshift galaxies with SCUBA (Smailet al. 1997, Hughes et al. 1998, Barger et al. 1998,Eales et al. 1999), which are thought to be primevalanalogues of the starburst galaxies observed locally.Deep surveys in the far-infrared therefore promise tobe very useful for understanding galaxy formation andevolution, as they can recover information missed byoptical/UV studies (e.g. Steidel et al. 1996, Madauet al. 1996). Studies of infrared galaxies detected byIRAS suggest that violent episodes of star-formationare usually associated with very high dust opticaldepths (Condon et al. 1991, Rowan-Robinson & Efs-tathiou 1993, Franceschini et al. 1994) which usuallyexceed unity even at 60µm. Models of dusty tori inAGN (Pier & Krolik 1992, Granato & Danese 1994,Efstathiou & Rowan-Robinson 1995) also suggest thatthe optical depths of type 2 objects are at least ashigh. Observations of galaxies with ISO seem to havedetected colder dust than observed by IRAS (Krugelet al. 1998, Bogun et al. 1996).
The European Large Area ISO Survey (ELAIS;for a thorough description of the survey and its goalssee Oliver et al. 2000, PAPER I), that surveyed about12 square degrees of the sky at 15- and 90-µm (andsmaller areas at 6.7µm and 175µm) in mainly four(low cirrus) areas spread over the northern and south-ern sky, and other ISO surveys (Kawara et al. 1998,Puget et al. 1999, Dole et al. 1999) represent thefirst opportunity since IRAS to study the propertiesand evolution of the far-infrared galaxy populationsat intermediate redshift. An extensive follow-up pro-gramme from the radio to the X-rays, already underway, ensures that the ELAIS detected galaxies will bethe subject of thorough study for the next few years.
In this paper we describe the pipeline developedfor the production of the ELAIS Preliminary Analysis(EPA) 90µm catalogue and present source counts. Anaccompanying paper by Serjeant et al. (2000; PAPERII) presents the 6.7 and 15µm pipeline and counts.Oliver et al. (in preparation) present an analysis ofthe multiply-covered ELAIS areas.
The paper is organized as follows: In section 2we describe the data reduction and source extractionmethods used. In section 3 we discuss tests for as-sessing the reliability and completeness of the surveyincluding comparisons with a parallel pipeline to bedescribed in a separate paper (Surace et al. in prepa-ration). In section 4 we present the source counts. Insection 5 we discuss briefly our results and outline ourconclusions.
2 OBSERVATIONS AND REDUCTION
As described in detail in Paper I, the data consistsof a number of pointed observations (in raster mode)which use the 3x3 array of the ISOPHOT instrument(Lemke et al. 1996) onboard ISO (Kessler et al. 1996).The area covered by each raster was typically abouta quarter of a square degree. The integration time ateach raster position varied but it was typically 20s.The initial observing mode did not allow for any re-dundancy. Analysis of some of the early rasters in-dicated that the efficiency and reliability of the sur-vey could be significantly improved with some redun-dancy, so for the latter half or so of the survey weswitched to an ‘overlapping mode’ so that each part ofthe sky observed thereafter was covered at least twice.Some areas of the survey were observed on more thanone occasions thus providing further redundancy anddepth.
The survey was carried out in four main areas(three in the northern and one in the southern hemi-sphere) and some smaller areas of special scientificinterest (PAPER I).
The pipeline we developed for the PreliminaryAnalysis consists of two basic stages. In the first stagewe process the raw data using the standard Phot In-teractive Analysis (PIA) software (Gabriel et al. 1997)until we derive a signal per 2s integration ramp. Thisinvolves discarding of some readouts at the beginningof the ramp, and treatment of cosmic rays. The datastream includes data recorded while the telescope isslewing between pointings (this typically takes 2 or 3seconds per pointing).
The second stage of our analysis, performed withpurpose-built IDL routines, involves the extraction ofpoint sources from the timeline of each of the 9 pix-els of the PHOT array. Given the poor understandingof the instrument flat field at the time it was consid-ered premature to try to extract sources from maps.Our source extraction method is therefore very dif-ferent from that employed in deep 175µm surveyswhere multiple redundancy and detector stability al-low more traditional and reliable techniques to be em-ployed (Kawara et al. 1998, Puget et al. 1999, Doleet al. 1999). For each pixel we ran an iterative me-dian filter that removed outliers (arising from cosmicrays) and determined the fractional deviation fromthe background, ρ, for each ramp. Pointings for whichthe weighted-average of ρ over the pointing, ρ, ex-ceeded a certain threshold (3σρ) were flagged as po-tential point sources.
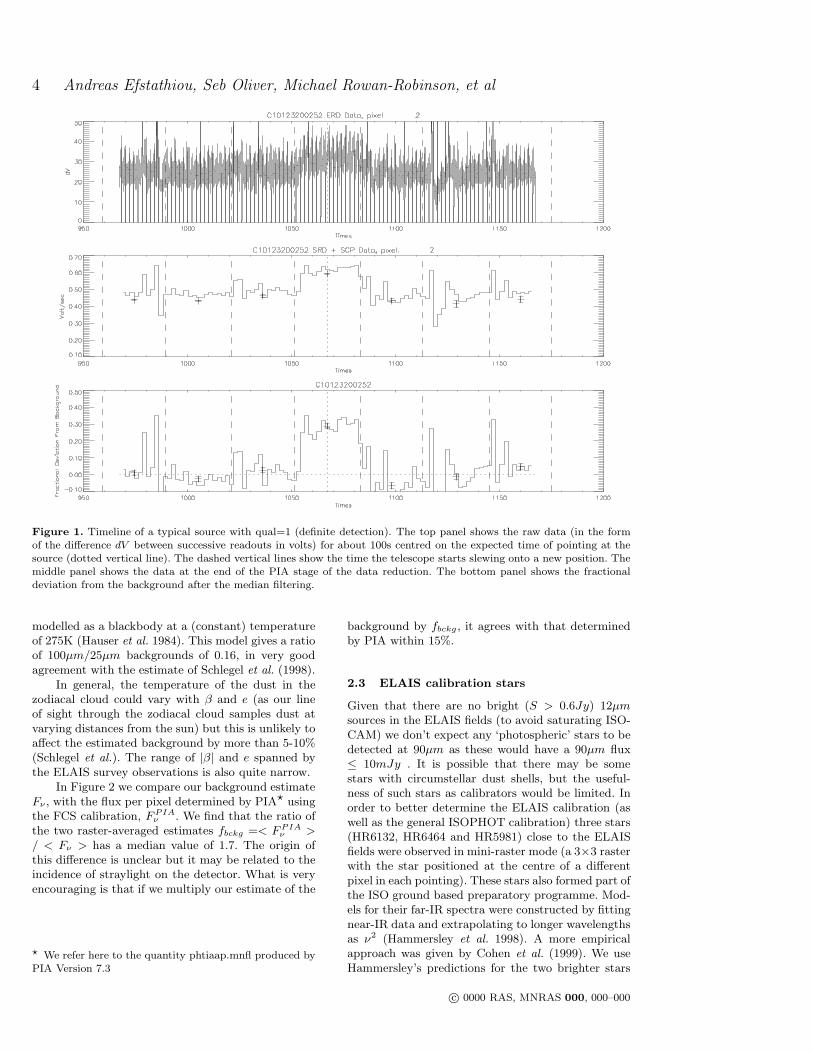
The pipeline produced source lists on a raster-by-raster basis and typically yielded ∼ 0.08 detectionsper pointing per pixel. Unfortunately, visual scanningof the time profiles of the potential sources revealedthat only a small fraction of them are likely to bereal sources. There are a number of effects that cangive rise to spurious sources and some of these areillustrated in Figure 1.
c© 0000 RAS, MNRAS 000, 000–000
ELAIS III:90µm source counts 3
Figure 1 shows the data stream of one pixel forabout 6 pointings centred on a very clear detection ofa source (at t ≈ 1050 − 1085s) at different stages ofthe processing. Note the delay in the signal responseto the change in illumination (about 2-3s) which ispartly due to the movement of the telescope into po-sition and partly due to the hysterisis of the detector.The latter is also responsible for the gradual fading ofthe signal at the end of the pointing. The occurence ofthese effects at the beginning and end of the pointingleaves little doubt as to the reality of the detection.
The source profiles are usually more complicatedthan the one shown in Figure 1, due to the occurenceof cosmic ray events. Examples of such events can beseen on the same stream of data. Note for examplethe dips in the signal after the spikes at t ≈ 985sand 1115s, and the fading profile after a spike att ≈ 1125s. In addition, the C100 detectors sometimesdisplay a drift behaviour which can give the appear-ance of a source if the peak of the cycle coincides withthe centre of a pointing.
While a procedure for automatic filtering of falsedetections was developed it was found to be unreli-able. The time profiles of all potential sources weretherefore visually scanned by at least two observersin order to construct the final source list. Five differ-ent classifications were used ranging from 1 (definitedetection; see Figure 1) to 5 (severely affected by cos-mic rays).
2.1 Flux Calibration
The standard method of flux calibration of the PHOTinstrument is to make use of the internal Fine Calibra-tion Source (FCS; Schulz et al. 1998). The FCS hasbeen calibrated using planets and asteroids at brightfluxes and stars at faint fluxes. The FCS is observedimmediately before and after each raster in order tomonitor the change in the responsivity of the detectorover the course of the raster. Despite the best effortsof the instrument team, the calibration obtained inthis way was considered until recently to be of onlyqualitative value. It is now thought to be uncertain byabout 20-30% depending on the type of observation.This motivated us to pursue an alternative methodfor the flux calibration for the EPA which makes useof celestial standards such as the 100µm backgroundmeasured by COBE/IRAS and IRAS sources. The ap-plication of a method based on celestial standards ona large and homogeneous dataset such as ELAIS canalso provide an independent check on the FCS methodand provide insight into the characteristics of the in-strument.
The basic steps followed in our method can besummarized as follows:
(i) determine the flux per pixel Fν,det (in Jy) ofeach detection by multiplying ρ by the predicted back-ground flux incident on the pixel Fν ≡ IνΩ, where Iν
is the predicted background intensity and Ω is thesolid angle (0.44468 × 10⁻⁷sr; Klaas et al 1994) sub-tended by a C100 (43.5′′ × 43.5′′) pixel.
(ii) find an empirical conversion factor fp→t forconverting Fν,det to a total flux for a point sourcecentred on the pixel Fν,src. This factor is determinedby comparing the corrected fluxes with those of cal-ibration stars and IRAS sources and includes correc-tions for the psf, straylight etc. We will find that fp→t
is the ratio of two factors fbckg and fpsf . The factorfbckg corrects our background estimate for the effec-tive solid angle, straylight etc. and fpsf corrects forthe fact that only a fraction of the flux from a pointsource will be recorded by a single-pixel detection.
The great advantage of the method is its trans-parency. Its validity ultimately depends on the ac-curacy with which the background can be estimated(given that it is dominated by the zodiacal emissionwhich varies with the time of observation) and on theaccuracy of the fluxes of the sources used as calibra-tors.
In the rest of this section we describe how weestimate the background, fbckg and fpsf , and test ourcalibration with stars and IRAS sources. Readers whoare not interested in the details of these estimates andtests can find a summary of our results in section 2.5.
2.2 Background estimate
Initially, we used the COBE background (obtainedfrom the IRSKY service at IPAC) which gave usvery poor spatial resolution. Our approach was subse-quently refined to consider the separate contributionsfrom the local (zodiacal) background, which dependson the time of observation, and Galactic & extragalac-tic components.
The background is estimated by combining thecontributions of Galactic emission from the 100µmmaps of Schlegel et al. (1998) and a model for thezodiacal light.
The zodiacal light emission depends on the eclip-tic latitude β and the solar elongation e (e.g. CAMmanual). It is worth noting that due to observing con-straints for the satellite the solar elongation of mostISO observations was in the range 60-120o. With theexception of two small areas (X3 and X6) |β| for theELAIS areas lies between 40 and 75o.
The zodiacal model used is based on the modeldescribed in the CAM manual (page 77) which givesthe zodiacal background at 10.9µm as a function of βand (more crudely) e. The predicted 10.9µm back-ground from this model is about 30% higher thanthat measured by ISOCAM towards the ecliptic plane(e = 104o and β = −2.4o; Reach et al. 1996) withthe quoted uncertainty of ISOCAM calibration at thetime being 15%.
To extrapolate to far-infrared wavelengths we as-sume that the spectrum of the zodiacal light can be
c© 0000 RAS, MNRAS 000, 000–000
4 Andreas Efstathiou, Seb Oliver, Michael Rowan-Robinson, et al
Figure 1. Timeline of a typical source with qual=1 (definite detection). The top panel shows the raw data (in the formof the difference dV between successive readouts in volts) for about 100s centred on the expected time of pointing at thesource (dotted vertical line). The dashed vertical lines show the time the telescope starts slewing onto a new position. Themiddle panel shows the data at the end of the PIA stage of the data reduction. The bottom panel shows the fractionaldeviation from the background after the median filtering.
modelled as a blackbody at a (constant) temperatureof 275K (Hauser et al. 1984). This model gives a ratioof 100µm/25µm backgrounds of 0.16, in very goodagreement with the estimate of Schlegel et al. (1998).
In general, the temperature of the dust in thezodiacal cloud could vary with β and e (as our lineof sight through the zodiacal cloud samples dust atvarying distances from the sun) but this is unlikely toaffect the estimated background by more than 5-10%(Schlegel et al.). The range of |β| and e spanned bythe ELAIS survey observations is also quite narrow.
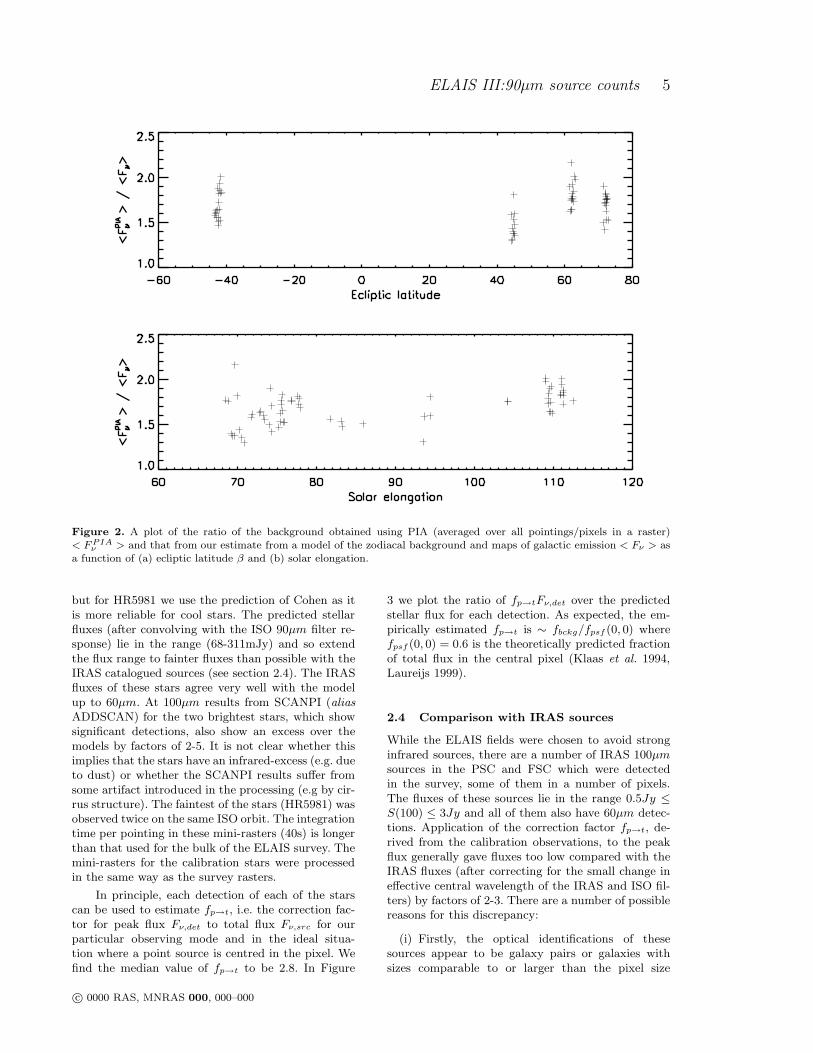
In Figure 2 we compare our background estimateFν , with the flux per pixel determined by PIA⋆ usingthe FCS calibration, F PIA
ν . We find that the ratio ofthe two raster-averaged estimates fbckg =< F PIA
ν >/ < Fν > has a median value of 1.7. The origin ofthis difference is unclear but it may be related to theincidence of straylight on the detector. What is veryencouraging is that if we multiply our estimate of the
⋆ We refer here to the quantity phtiaap.mnfl produced byPIA Version 7.3
background by fbckg , it agrees with that determinedby PIA within 15%.
2.3 ELAIS calibration stars
Given that there are no bright (S > 0.6Jy) 12µmsources in the ELAIS fields (to avoid saturating ISO-CAM) we don’t expect any ‘photospheric’ stars to bedetected at 90µm as these would have a 90µm flux≤ 10mJy . It is possible that there may be somestars with circumstellar dust shells, but the useful-ness of such stars as calibrators would be limited. Inorder to better determine the ELAIS calibration (aswell as the general ISOPHOT calibration) three stars(HR6132, HR6464 and HR5981) close to the ELAISfields were observed in mini-raster mode (a 3×3 rasterwith the star positioned at the centre of a differentpixel in each pointing). These stars also formed part ofthe ISO ground based preparatory programme. Mod-els for their far-IR spectra were constructed by fittingnear-IR data and extrapolating to longer wavelengthsas ν2 (Hammersley et al. 1998). A more empiricalapproach was given by Cohen et al. (1999). We useHammersley’s predictions for the two brighter stars
c© 0000 RAS, MNRAS 000, 000–000
ELAIS III:90µm source counts 5
Figure 2. A plot of the ratio of the background obtained using PIA (averaged over all pointings/pixels in a raster)< F PIA
ν > and that from our estimate from a model of the zodiacal background and maps of galactic emission < Fν > asa function of (a) ecliptic latitude β and (b) solar elongation.
but for HR5981 we use the prediction of Cohen as itis more reliable for cool stars. The predicted stellarfluxes (after convolving with the ISO 90µm filter re-sponse) lie in the range (68-311mJy) and so extendthe flux range to fainter fluxes than possible with theIRAS catalogued sources (see section 2.4). The IRASfluxes of these stars agree very well with the modelup to 60µm. At 100µm results from SCANPI (aliasADDSCAN) for the two brightest stars, which showsignificant detections, also show an excess over themodels by factors of 2-5. It is not clear whether thisimplies that the stars have an infrared-excess (e.g. dueto dust) or whether the SCANPI results suffer fromsome artifact introduced in the processing (e.g by cir-rus structure). The faintest of the stars (HR5981) wasobserved twice on the same ISO orbit. The integrationtime per pointing in these mini-rasters (40s) is longerthan that used for the bulk of the ELAIS survey. Themini-rasters for the calibration stars were processedin the same way as the survey rasters.
In principle, each detection of each of the starscan be used to estimate fp→t, i.e. the correction fac-tor for peak flux Fν,det to total flux Fν,src for ourparticular observing mode and in the ideal situa-tion where a point source is centred in the pixel. Wefind the median value of fp→t to be 2.8. In Figure
3 we plot the ratio of fp→tFν,det over the predictedstellar flux for each detection. As expected, the em-pirically estimated fp→t is ∼ fbckg/fpsf (0, 0) wherefpsf (0, 0) = 0.6 is the theoretically predicted fractionof total flux in the central pixel (Klaas et al. 1994,Laureijs 1999).
2.4 Comparison with IRAS sources
While the ELAIS fields were chosen to avoid stronginfrared sources, there are a number of IRAS 100µmsources in the PSC and FSC which were detectedin the survey, some of them in a number of pixels.The fluxes of these sources lie in the range 0.5Jy ≤S(100) ≤ 3Jy and all of them also have 60µm detec-tions. Application of the correction factor fp→t, de-rived from the calibration observations, to the peakflux generally gave fluxes too low compared with theIRAS fluxes (after correcting for the small change ineffective central wavelength of the IRAS and ISO fil-ters) by factors of 2-3. There are a number of possiblereasons for this discrepancy:
(i) Firstly, the optical identifications of thesesources appear to be galaxy pairs or galaxies withsizes comparable to or larger than the pixel size
c© 0000 RAS, MNRAS 000, 000–000

6 Andreas Efstathiou, Seb Oliver, Michael Rowan-Robinson, et al
Figure 3. Comparison of ELAIS fluxes with IRAS fluxes (squares) and theoretically predicted fluxes for the calibrationstars (stars). The 90µm fluxes of the IRAS sources are estimated by linearly interpolating between the 60 and 100µm
fluxes. The ratio of 90 to 100µm flux is typically 0.8. For the three calibration stars, we plot all the detections (exceptthose in the first and last pointings which make the background estimation rather difficult). The scatter in the ratio givesa measure of the reproducibility of the results. The predicted fluxes of the stars are obtained by convolving the models ofHammersley et al. (1998), for HR6132, HR6464, and Cohen et al. (1999), for the fainter star HR5981, with the ISO filterresponse function.
(43.5”). The ISO telescope psf (for the 105µm filter)has been approximately fitted with a gaussian withFWHM of 50′′ ± 5′′ (Heraudeau et al. 1997, MPIAinternal report). Clearly for such extended sources itis not appropriate to scale the peak flux by fp→t.
(ii) As it was demonstrated by Hacking & Houck(1987) in the Deep IRAS survey in the North EclipticPole, the 100µm fluxes of the survey proper becomeunreliable as the flux limit of the survey is approached(∼ 0.5Jy at 100µm). The fluxes tend to be overesti-mated by factors of up to 2 as they are boosted by
positive noise fluctuations which are superimposed onthe true source flux.
(iii) It is very unlikely that the source (even if itwere pointlike) would be centred in the pixel havingthe peak flux. In these situations fp→t should be con-sidered as a lower limit to the scale factor.
(iv) Due to the relatively short integration time perpointing it is possible that for bright sources the signaldoes not reach its stabilized value, so the flux will beunderestimated.
c© 0000 RAS, MNRAS 000, 000–000
ELAIS III:90µm source counts 7
In order to determine whether a source is ex-tended we need to know what fraction of the flux froma point source would fall in an adjacent, or diagonallyplaced, pixel. These fractions were estimated by Lau-reijs (1999) for a point source centred in a pixel. Hisresults show that fpsf (0, 46)/fpsf (0, 0) = 0.06 andfpsf (46, 46)/fpsf (0, 0) = 0.02 where fpsf (x, y) is thefraction of the flux in the pixel centred at x, y arc-seconds from the point source. This assumes all thepixels have the same roll angle. Note that althougheach C100 pixel is 43.5” square, the separation of pixelcenters is 46” (Klaas et al. 1994).
According to this analysis we can assume thatadjacent detections with flux greater than ∼ 15% ofthe peak flux correspond to extended sources or mem-bers of group of sources. There are, of course, situ-ations where this criterion will fail, that is when apoint source lies at the corner or edge of a pixel. Wehave simulated this situation and found that we areunlikely to overestimate the flux by more than 30%.Laureijs also calculated the fraction of the psf in thewhole array and found it to be ∼ 0.8 for the C90 fil-ter, which also sets a limit of ∼ 30% to the degreeby which we would overestimate the flux of a pointsource in this case.
2.5 Summary of calibration method
In summary, our strategy for flux calibration is as fol-lows: for sources with more than 1 reliable detections,
the total flux is calculated byfbckg
fpsf (0,0)
∑
iF i
ν,det,
where F iν,det are the fluxes of non-overlapping detec-
tions above 15% of the peak. The factor fbckg is esti-mated to be 1.7. The factor fpsf (0, 0) is assumed to be0.6 (Klaas et al 1994). For single detections we calcu-late the flux as fbckgFν,det/ < fpsf > where < fpsf >is estimated from simulations of a point source witha FWHM of 50′′ at different positions in the pixel tobe ∼ 0.4.
In Figure 3 we compare the predicted 90µmfluxes of the IRAS sources with the fluxes calibratedin this way. In conclusion, our approach to the fluxcalibration gives fluxes that agree with those of IRASsources and bright stars (which bracket the flux rangecovered by ELAIS) within 30-40%.
3 RELIABILITY AND COMPLETENESS
3.1 Comparison with an independent
pipeline
We have pursued a programme of detailed compar-isons of the IC detection lists with those compiled bya pipeline developed in parallel (but somewhat later,to take advantage of a better understanding of theinstrument) by the group at the Max-Planck-Institutfur Astronomie (MPIA) in Heidelberg. Results fromthat pipeline will be described in detail by Surace et
al. (in preparation). The detections obtained by theMPIA pipeline were also eyeballed with the same clas-sification scheme applied to the IC detections.
The sample of sources on which the preliminary90µm counts are based is a reliable subset of the EPAlist which was constructed as follows:
(i) A list of detections extracted by either pipelineand which received the top two eyeballing classifica-tions (1 or 2) by at least 2 observers was first con-structed.
(ii) The combined list was then trimmed to includeonly detections which received one of the top two clas-sifications by at least 3 observers (275 detections).
(iii) The detections were then merged with a nearneighbour algorithm (search radius of 1’) to producea source list consisting of 163 sources. Only one ofthe sources with S > 100mJy was detected by theMPIA pipeline only; otherwise, the lists from the twopipelines are in complete agreement above this limit.
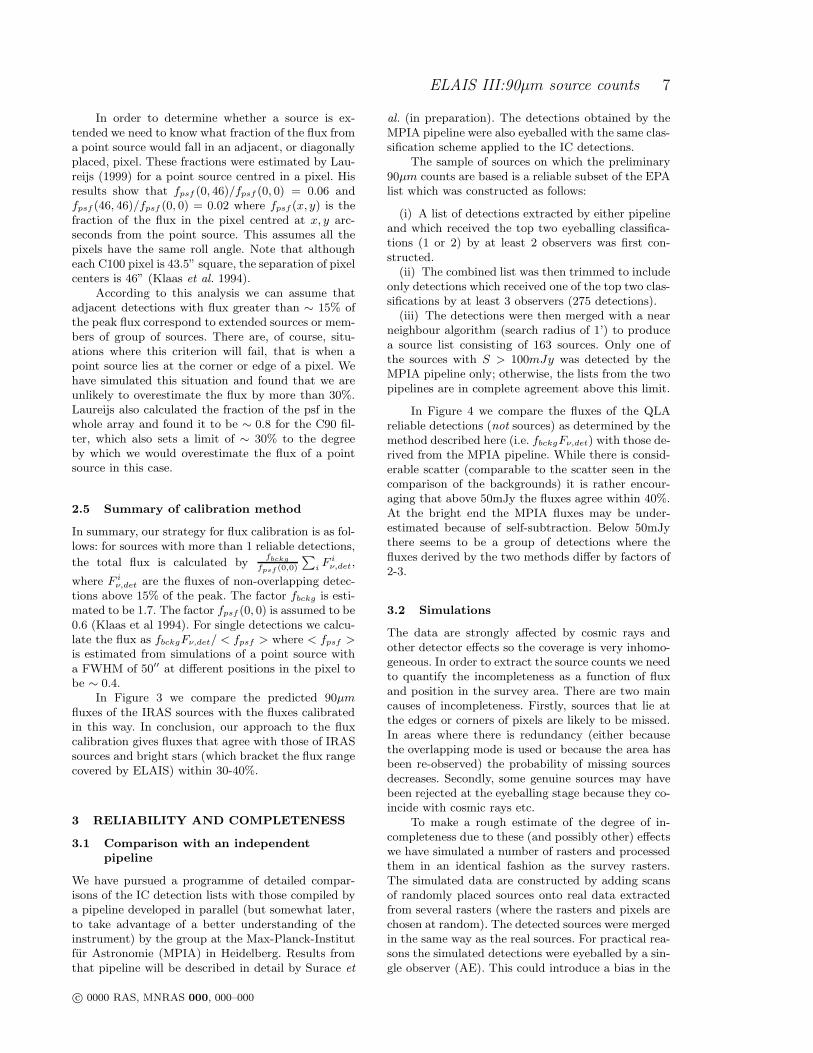
In Figure 4 we compare the fluxes of the QLAreliable detections (not sources) as determined by themethod described here (i.e. fbckgFν,det) with those de-rived from the MPIA pipeline. While there is consid-erable scatter (comparable to the scatter seen in thecomparison of the backgrounds) it is rather encour-aging that above 50mJy the fluxes agree within 40%.At the bright end the MPIA fluxes may be under-estimated because of self-subtraction. Below 50mJythere seems to be a group of detections where thefluxes derived by the two methods differ by factors of2-3.
3.2 Simulations
The data are strongly affected by cosmic rays andother detector effects so the coverage is very inhomo-geneous. In order to extract the source counts we needto quantify the incompleteness as a function of fluxand position in the survey area. There are two maincauses of incompleteness. Firstly, sources that lie atthe edges or corners of pixels are likely to be missed.In areas where there is redundancy (either becausethe overlapping mode is used or because the area hasbeen re-observed) the probability of missing sourcesdecreases. Secondly, some genuine sources may havebeen rejected at the eyeballing stage because they co-incide with cosmic rays etc.
To make a rough estimate of the degree of in-completeness due to these (and possibly other) effectswe have simulated a number of rasters and processedthem in an identical fashion as the survey rasters.The simulated data are constructed by adding scansof randomly placed sources onto real data extractedfrom several rasters (where the rasters and pixels arechosen at random). The detected sources were mergedin the same way as the real sources. For practical rea-sons the simulated detections were eyeballed by a sin-gle observer (AE). This could introduce a bias in the
c© 0000 RAS, MNRAS 000, 000–000
8 Andreas Efstathiou, Seb Oliver, Michael Rowan-Robinson, et al
Figure 4. Comparison of the fluxes of the QLA reliable detections with those derived from the MPIA pipeline.
completeness correction as we require confirmation(i.e. eyeballing class 1 or 2) by at least 3 observers fora detection to appear in our final list of real sources.To quantify the effect of this we can use the eyeballingexperience of the whole survey to find the number ofdetections confirmed by AE which finally appeared inthe combined list (186 out of 286). For comparison,the number of detections not confirmed by AE whichappeared in the combined list is 34. As the numberof detections confirmed by AE only (286), and by atleast 3 observers (186+34), are comparable we con-clude that there is not a significant bias introducedby using the eyeballing results of a single observer forthe purpose of estimating the completeness. In orderto simulate regions of multiple redundancy we simu-lated rasters with different steps in one of the rasterdimensions. Two possibilities were simulated: half anarray step, to simulate regions of single redundancy,and quarter array step, to simulate regions of tripleredundancy. The sources are calibrated in the sameway as the real sources.
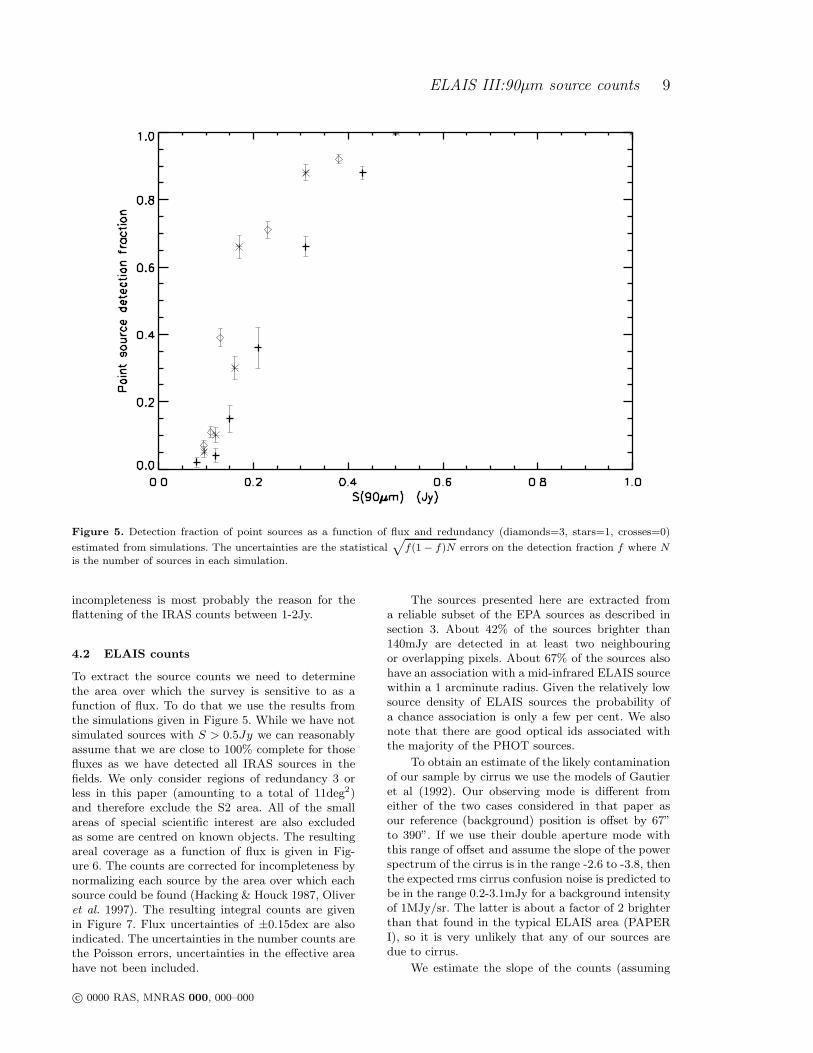
The results of this study are plotted in Figure5. The fraction of sources detected increases signif-icantly as we move from no redundancy to singleredundancy. Further redundancy improves the com-pleteness at faint fluxes.
4 SOURCE COUNTS
4.1 IRAS counts
We have extracted 90µm extragalactic counts atfluxes brighter than possible with ELAIS by usingthe PSCz catalogue (Saunders et al. 2000). We ap-plied a cut with galactic latitude (|b| > 20) whichlimits the areal coverage to 7.642 steradians (Rowan-Robinson et al. 1991) and the number of galaxies to11405. We also excluded galaxies with low IRAS flags(fqual < 3) at 100µm. The resulting sample consistsof 8529 galaxies. The 90µm flux of each galaxy is es-imated by linearly interpolating between the 60µmand 100µm fluxes (by design all galaxies in the PSCzcatalogue have reliable 60µm fluxes).
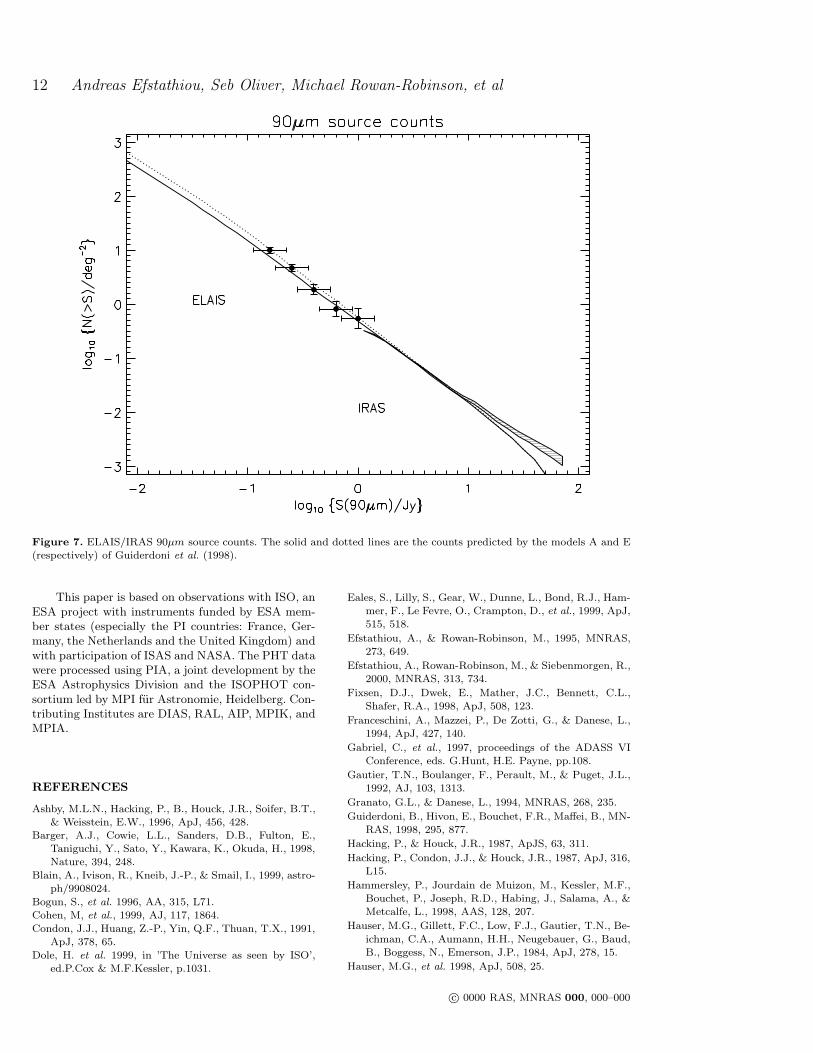
The IRAS counts are plotted in Figure 7. Thestructure in the counts above 5Jy, which is also evi-dent in the 60µm counts (Hacking, Condon & Houck1987), is probably due to a local excess in the sourcedensity dominated by the Virgo cluster.
The PSCz catalogue only includes galaxies withS(60) > 0.6Jy. IRAS galaxies are known to haveS(100)/S(60) ratios at least as high as 3.5 (e.g.Rowan-Robinson & Crawford 1989, Efstathiou et al.,in preparation). A 90µm sample drawn from PSCzis therefore bound to be incomplete below 2Jy. This
c© 0000 RAS, MNRAS 000, 000–000
ELAIS III:90µm source counts 9
Figure 5. Detection fraction of point sources as a function of flux and redundancy (diamonds=3, stars=1, crosses=0)
estimated from simulations. The uncertainties are the statistical√
f(1 − f)N errors on the detection fraction f where N
is the number of sources in each simulation.
incompleteness is most probably the reason for theflattening of the IRAS counts between 1-2Jy.
4.2 ELAIS counts
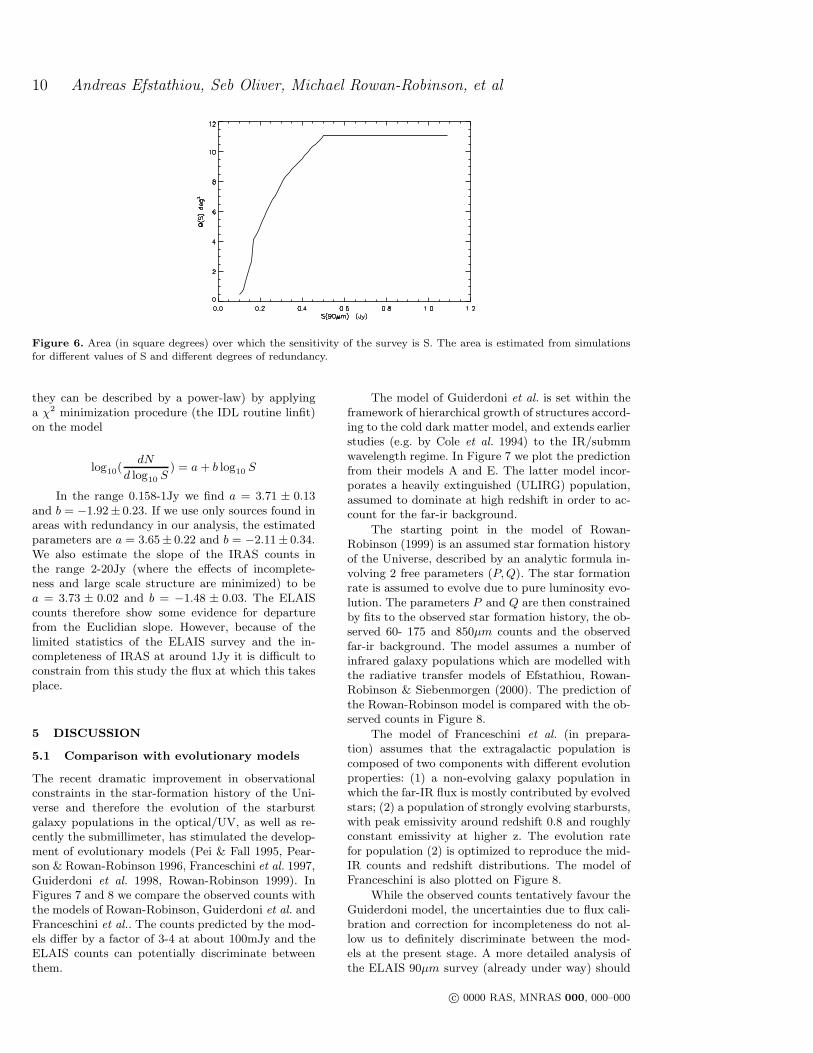
To extract the source counts we need to determinethe area over which the survey is sensitive to as afunction of flux. To do that we use the results fromthe simulations given in Figure 5. While we have notsimulated sources with S > 0.5Jy we can reasonablyassume that we are close to 100% complete for thosefluxes as we have detected all IRAS sources in thefields. We only consider regions of redundancy 3 orless in this paper (amounting to a total of 11deg2)and therefore exclude the S2 area. All of the smallareas of special scientific interest are also excludedas some are centred on known objects. The resultingareal coverage as a function of flux is given in Fig-ure 6. The counts are corrected for incompleteness bynormalizing each source by the area over which eachsource could be found (Hacking & Houck 1987, Oliveret al. 1997). The resulting integral counts are givenin Figure 7. Flux uncertainties of ±0.15dex are alsoindicated. The uncertainties in the number counts arethe Poisson errors, uncertainties in the effective areahave not been included.
The sources presented here are extracted froma reliable subset of the EPA sources as described insection 3. About 42% of the sources brighter than140mJy are detected in at least two neighbouringor overlapping pixels. About 67% of the sources alsohave an association with a mid-infrared ELAIS sourcewithin a 1 arcminute radius. Given the relatively lowsource density of ELAIS sources the probability ofa chance association is only a few per cent. We alsonote that there are good optical ids associated withthe majority of the PHOT sources.
To obtain an estimate of the likely contaminationof our sample by cirrus we use the models of Gautieret al (1992). Our observing mode is different fromeither of the two cases considered in that paper asour reference (background) position is offset by 67”to 390”. If we use their double aperture mode withthis range of offset and assume the slope of the powerspectrum of the cirrus is in the range -2.6 to -3.8, thenthe expected rms cirrus confusion noise is predicted tobe in the range 0.2-3.1mJy for a background intensityof 1MJy/sr. The latter is about a factor of 2 brighterthan that found in the typical ELAIS area (PAPERI), so it is very unlikely that any of our sources aredue to cirrus.
We estimate the slope of the counts (assuming
c© 0000 RAS, MNRAS 000, 000–000
10 Andreas Efstathiou, Seb Oliver, Michael Rowan-Robinson, et al
Figure 6. Area (in square degrees) over which the sensitivity of the survey is S. The area is estimated from simulationsfor different values of S and different degrees of redundancy.
they can be described by a power-law) by applyinga χ2 minimization procedure (the IDL routine linfit)on the model
log10(dN
d log10 S) = a + b log10 S
In the range 0.158-1Jy we find a = 3.71 ± 0.13and b = −1.92± 0.23. If we use only sources found inareas with redundancy in our analysis, the estimatedparameters are a = 3.65± 0.22 and b = −2.11± 0.34.We also estimate the slope of the IRAS counts inthe range 2-20Jy (where the effects of incomplete-ness and large scale structure are minimized) to bea = 3.73 ± 0.02 and b = −1.48 ± 0.03. The ELAIScounts therefore show some evidence for departurefrom the Euclidian slope. However, because of thelimited statistics of the ELAIS survey and the in-completeness of IRAS at around 1Jy it is difficult toconstrain from this study the flux at which this takesplace.
5 DISCUSSION
5.1 Comparison with evolutionary models
The recent dramatic improvement in observationalconstraints in the star-formation history of the Uni-verse and therefore the evolution of the starburstgalaxy populations in the optical/UV, as well as re-cently the submillimeter, has stimulated the develop-ment of evolutionary models (Pei & Fall 1995, Pear-son & Rowan-Robinson 1996, Franceschini et al. 1997,Guiderdoni et al. 1998, Rowan-Robinson 1999). InFigures 7 and 8 we compare the observed counts withthe models of Rowan-Robinson, Guiderdoni et al. andFranceschini et al.. The counts predicted by the mod-els differ by a factor of 3-4 at about 100mJy and theELAIS counts can potentially discriminate betweenthem.
The model of Guiderdoni et al. is set within theframework of hierarchical growth of structures accord-ing to the cold dark matter model, and extends earlierstudies (e.g. by Cole et al. 1994) to the IR/submmwavelength regime. In Figure 7 we plot the predictionfrom their models A and E. The latter model incor-porates a heavily extinguished (ULIRG) population,assumed to dominate at high redshift in order to ac-count for the far-ir background.
The starting point in the model of Rowan-Robinson (1999) is an assumed star formation historyof the Universe, described by an analytic formula in-volving 2 free parameters (P, Q). The star formationrate is assumed to evolve due to pure luminosity evo-lution. The parameters P and Q are then constrainedby fits to the observed star formation history, the ob-served 60- 175 and 850µm counts and the observedfar-ir background. The model assumes a number ofinfrared galaxy populations which are modelled withthe radiative transfer models of Efstathiou, Rowan-Robinson & Siebenmorgen (2000). The prediction ofthe Rowan-Robinson model is compared with the ob-served counts in Figure 8.
The model of Franceschini et al. (in prepara-tion) assumes that the extragalactic population iscomposed of two components with different evolutionproperties: (1) a non-evolving galaxy population inwhich the far-IR flux is mostly contributed by evolvedstars; (2) a population of strongly evolving starbursts,with peak emissivity around redshift 0.8 and roughlyconstant emissivity at higher z. The evolution ratefor population (2) is optimized to reproduce the mid-IR counts and redshift distributions. The model ofFranceschini is also plotted on Figure 8.
While the observed counts tentatively favour theGuiderdoni model, the uncertainties due to flux cali-bration and correction for incompleteness do not al-low us to definitely discriminate between the mod-els at the present stage. A more detailed analysis ofthe ELAIS 90µm survey (already under way) should
c© 0000 RAS, MNRAS 000, 000–000

ELAIS III:90µm source counts 11
be able to discriminate between the models. Furtherdiscrimination of the two models should be possiblewith the redshift distributions of the detected galax-ies. The models of Franceschini et al. and Rowan-Robinson predict that the vast majority of sourcesat S > 100mJy will be at redshifts less than 1.The Guiderdoni et al. model overpredicts the numberof high redshift galaxies in the North Ecliptic Pole(NEP) survey, although the counts in the latter areknown to be dominated by a supercluster (Ashby et
al. 1996). The ELAIS survey was specifically designed(PAPER I) to minimise the effects of large scale struc-ture.
5.2 Comparison with other Infrared and
submillimeter surveys
Until recently the deep IRAS 60µm in the NEP sur-vey (Hacking & Houck 1987) provided the deepest ex-tragalactic source counts in the infrared. Augmentedwith counts from shallower surveys (e.g. Rowan-Robinson et al. 1991) they provided the basis for stud-ies of the evolution of the starburst galaxy population(Hacking et al 1987, Oliver et al. 1992, 1995, Pear-son & Rowan-Robinson 1996). Unfortunately redshiftmeasurements of the redshift sources, which shouldhave been able to constrain further the form of evo-lution, discovered the presence of a z = 0.088 super-cluster in the NEP field (Ashby et al. 1996).
Oliver et al. (1997) confirmed the strong evolu-tion seen in IRAS surveys with deep counts at 6.7and 15µm in the Hubble Deep Field. Counts at 15µmwell in excess of no-evolution expectations were alsoreported by Elbaz et al. (1999). Serjeant et al. (2000,Paper II) found the evolving high-z population dom-inates over the local counts at S(15) < 10mJy.
With the advent of SCUBA, submillimeter sur-veys (at 850µm) which exploited the negative K-correction due to the spectral shape of starburstgalaxies, detected source densities 2-3 orders of mag-nitude higher than expected from non-evolving mod-els (Smail et al. 1997, Hughes et al. 1998, Barger et al.
1998, Eales et al. 1999). While the process of identify-ing and determining the properties of these SCUBAsources is still incomplete, it appears that a numberof them are similar to ULIRGs at z ∼ 2− 4. SCUBAsurveys appear to have resolved 94% and 34% of theCOBE-FIRAS background values at 850 and 450µmrespectively (Blain et al. 1999).
FIRBACK 175µm counts in the Marano 1 fieldalso appear to have shown an upturn in the counts(Puget et al. 1999). These counts are 3 times higherthan the models of Guiderdoni et al. and Franceschiniet al. However, 175µm counts in a larger area (Dole et
al. 1999) suggest that the counts in the Marano fieldmay have been anomalously high. It is also not clearwhether the excess in the counts, if any, is due to highredshift starbursts or local cold galaxies. Counts 3-10times higher than expected from no-evolution mod-
els were also found by Kawara et al. (1998) in their175µm survey of the Lockman Hole. More results areexpected from FIRBACK and ELAIS surveys at thiswavelength. Brighter counts are also expected fromthe ISO Serendipity survey (Bogun et al. 1996, Stickelet al. 1998).
The extensive multi-wavelength coverage andfollow-up programme of ELAIS ensures that, unlikeother far-ir surveys where resolution and sensitivitycan be a serious obstacle, the 90µm galaxies will bethoroughly studied (e.g. Morel et al. in preparation)and will therefore provide a firm basis for studyingthe evolution of dust-enshrouded galaxies.
A more detailed analysis of the ELAIS PHT sur-vey is underway and results will be presented in sub-sequent papers in this series.
CONCLUSIONS
We have presented 90µm source counts extractedfrom the catalogue produced by the ELAIS Prelim-inary Analysis and PSCz redshift survey. All butone of the sources brighter than 100mJy have beenconfirmed by an independent pipeline developed atMPIA, Heidelberg. We compare our estimated fluxeswith IRAS fluxes and models for standard stars andestimate the uncertainty in flux calibration to beabout 30-40%.
The ELAIS counts extend the IRAS counts by anorder of magnitude in flux. The slope of the countsin the 0.158-1Jy range shows some evidence for de-parture from the Euclidian slope. This is consistentwith the strong evolution seen in other infrared andsubmillimeter surveys.
Within the uncertainties associated with the fluxcalibration of the survey, the counts agree with thestrongly evolving models of Rowan-Robinson (1999),Guiderdoni et al. (1998) and Franceschini et al.. Weexpect the redshift distributions arising from thespectroscopic follow-up of the survey to allow us todiscriminate between these models.
ACKNOWLEDGMENTS
It is a pleasure to acknowledge Bernhard Schulz, Ul-rich Klaas, Uwe Herbstmeier and other members ofthe PHOT team for very useful discussions. We alsothank Peter Hammersley and Martin Cohen for mak-ing their stellar seds available to us. AE acknowledgessupport by PPARC. This research has made use of theNASA/IPAC Extragalactic Database (NED) whichis operated by the Jet Propulsion Laboratory, Cal-ifornia Institute of Technology, under contract withthe National Aeronautics and Space Administration.ELAIS is supported by EU TMR Network FMRX-CT96-0068 and PPARC grant GR/K98728. We alsothank an anonymous referee for useful comments andsuggestions.
c© 0000 RAS, MNRAS 000, 000–000
12 Andreas Efstathiou, Seb Oliver, Michael Rowan-Robinson, et al
Figure 7. ELAIS/IRAS 90µm source counts. The solid and dotted lines are the counts predicted by the models A and E(respectively) of Guiderdoni et al. (1998).
This paper is based on observations with ISO, anESA project with instruments funded by ESA mem-ber states (especially the PI countries: France, Ger-many, the Netherlands and the United Kingdom) andwith participation of ISAS and NASA. The PHT datawere processed using PIA, a joint development by theESA Astrophysics Division and the ISOPHOT con-sortium led by MPI fur Astronomie, Heidelberg. Con-tributing Institutes are DIAS, RAL, AIP, MPIK, andMPIA.
REFERENCES
Ashby, M.L.N., Hacking, P., B., Houck, J.R., Soifer, B.T.,& Weisstein, E.W., 1996, ApJ, 456, 428.
Barger, A.J., Cowie, L.L., Sanders, D.B., Fulton, E.,Taniguchi, Y., Sato, Y., Kawara, K., Okuda, H., 1998,Nature, 394, 248.
Blain, A., Ivison, R., Kneib, J.-P., & Smail, I., 1999, astro-ph/9908024.
Bogun, S., et al. 1996, AA, 315, L71.Cohen, M, et al., 1999, AJ, 117, 1864.
Condon, J.J., Huang, Z.-P., Yin, Q.F., Thuan, T.X., 1991,ApJ, 378, 65.
Dole, H. et al. 1999, in ’The Universe as seen by ISO’,ed.P.Cox & M.F.Kessler, p.1031.
Eales, S., Lilly, S., Gear, W., Dunne, L., Bond, R.J., Ham-mer, F., Le Fevre, O., Crampton, D., et al., 1999, ApJ,515, 518.
Efstathiou, A., & Rowan-Robinson, M., 1995, MNRAS,273, 649.
Efstathiou, A., Rowan-Robinson, M., & Siebenmorgen, R.,2000, MNRAS, 313, 734.
Fixsen, D.J., Dwek, E., Mather, J.C., Bennett, C.L.,Shafer, R.A., 1998, ApJ, 508, 123.
Franceschini, A., Mazzei, P., De Zotti, G., & Danese, L.,1994, ApJ, 427, 140.
Gabriel, C., et al., 1997, proceedings of the ADASS VIConference, eds. G.Hunt, H.E. Payne, pp.108.
Gautier, T.N., Boulanger, F., Perault, M., & Puget, J.L.,1992, AJ, 103, 1313.
Granato, G.L., & Danese, L., 1994, MNRAS, 268, 235.
Guiderdoni, B., Hivon, E., Bouchet, F.R., Maffei, B., MN-RAS, 1998, 295, 877.
Hacking, P., & Houck, J.R., 1987, ApJS, 63, 311.
Hacking, P., Condon, J.J., & Houck, J.R., 1987, ApJ, 316,L15.
Hammersley, P., Jourdain de Muizon, M., Kessler, M.F.,Bouchet, P., Joseph, R.D., Habing, J., Salama, A., &Metcalfe, L., 1998, AAS, 128, 207.
Hauser, M.G., Gillett, F.C., Low, F.J., Gautier, T.N., Be-
ichman, C.A., Aumann, H.H., Neugebauer, G., Baud,B., Boggess, N., Emerson, J.P., 1984, ApJ, 278, 15.
Hauser, M.G., et al. 1998, ApJ, 508, 25.
c© 0000 RAS, MNRAS 000, 000–000

ELAIS III:90µm source counts 13
Figure 8. ELAIS/IRAS 90µm source counts. The solid line gives the counts predicted by the model of Rowan-Robinson(1999). The dotted line shows the counts predicted by the model of Franceschini.
Hughes, D., et al., 1998, Nature, 394, 241.
Kessler, M., et al., 1996, AA, 315, 27.
Kawara, K., et al., 1998, AA, 336, L9.
Klaas, U., 1994, ISOPHOT observer’s manual, Version 3.1.
Krugel, E., Siebenmorgen, R., Zota, V., Chini, R., 1998,AA, 331, L9.
Lagache, G., Abergel, A., Boulanger, F., Puget, J.-L.,1998, AA, 333, 709.
Laureijs, R, 1999, http://isowww.estec.esa.nl/users/expl-lib/PHT-top.html
Lemke, D., et al., 1996, AA, 315, 64.
Madau, P., Ferguson, H.C., Dickinson, M.E., Giavalisco,M., Steidel, C.C., Fruchter, A., 1996, MNRAS, 283,1388.
Oliver, S., Rowan-Robinson, M., Saunders, W., 1992, MN-RAS, 256, 15p.
Oliver, S.J., et al., 1995, in ’Wide Field spectroscopy andthe distant universe’, World scientific, ed.S.J.Maddox& A.Aragon-Salamanca, p.274.
Oliver, S.J., et al., 2000, in press. astro-ph/0003263 PA-PER I
Pearson, C., & Rowan-Robinson, M., 1996, MNRAS, 283,174.
Pei, Y.C. & Fall, S.M., 1995, ApJ, 454, 69.
Pier, E, & Krolik, J., 1992, ApJ, 399, L23.
Puget, J.-L., Abergel, A., Bernard, J.-P., Boulanger, F.,Burton, W.B., Desert, D.-X., Hartmann, D., 1996, AA,308, L5.
Puget, J.-L., et al., 1999, AA, 345, 29Reach, W.T., Abergel, A., Boulanger, F., et al., 1996, AA,
315, L381.Rowan-Robinson, M., & Crawford, J., 1989, MNRAS, 238,
523.Rowan-Robinson, M., Saunders, W., Lawrence, A., &
Leech, K., 1991, MNRAS, 253, 485.Rowan-Robinson, M., 1999, astroph/9906308Rowan-Robinson, M., & Efstathiou, A., 1993, MNRAS,
263, 675.Saunders, W., et al., 2000, MNRAS, submitted, astro-
ph/0001117.Schlegel, D., Finkbeiner, D., & Davis, M., 1998, ApJ, 500,
525.Schulz,
B., et al. 1999, http://isowww.estec.esa.nl/users/expl-lib/PHT-top.html
Serjeant, S., et al., 1999, MNRAS, in press astro-ph/0003198 (PAPER II)
Smail, I., Ivison, R.J., & Blain, A.W., 1997, ApJ, 490, L5.Steidel, C.C., Giavalisco, M., Pettini, M., Dickinson, M.,
& Adelberger, K.,L., 1996, ApJ, 462, L17.1996Stickel, M., Lemke, D., Klaas, U., Toth, L.V., Herbst-
meier, UU., Richter, G., Assendorp, R., Laureijs, R.,Kessler, M.F., Burgdorf, M., Beichman, C.A., Rowan-Robinson, M., Efstathiou, A., 1998, AA, 336, 116.
c© 0000 RAS, MNRAS 000, 000–000
Copyright © 2022 FDOKUMEN