Inertial Confinement Fusion Research at LOS Alamos National Laboratory
Upload
georgetownCategory
view
0download
0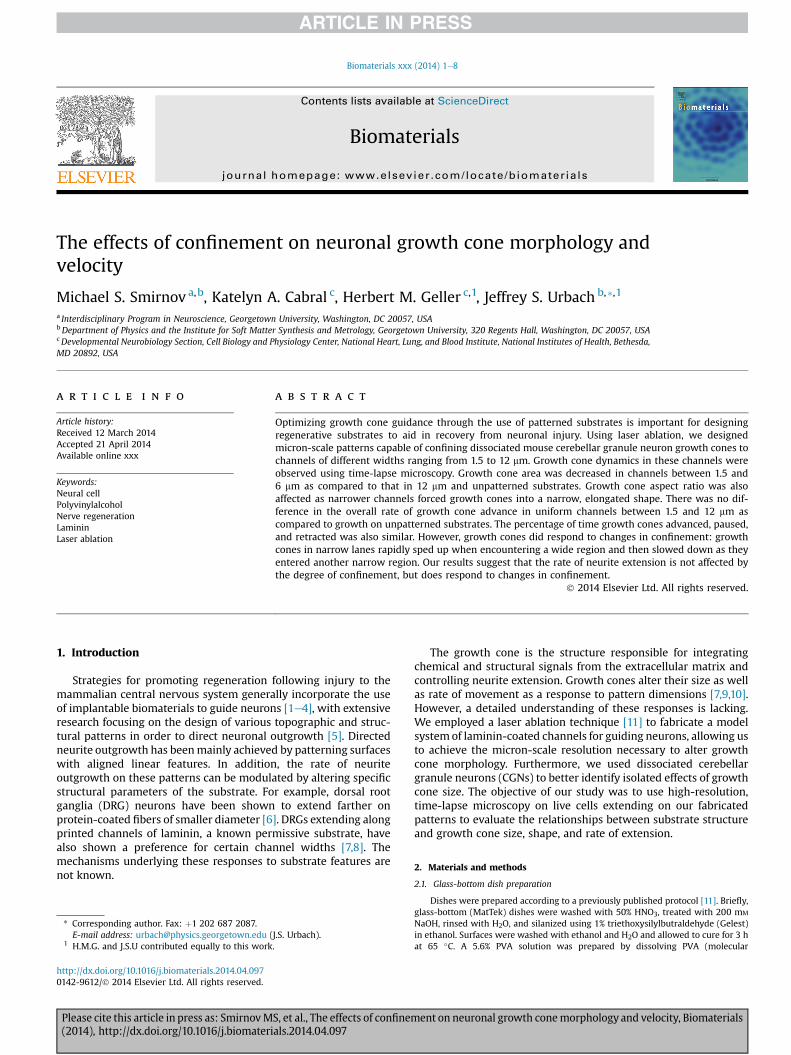
lable at ScienceDirect
Biomaterials xxx (2014) 1e8
Contents lists avai
Biomaterials
journal homepage: www.elsevier .com/locate/biomater ia ls
The effects of confinement on neuronal growth cone morphology andvelocity
Michael S. Smirnov a,b, Katelyn A. Cabral c, Herbert M. Geller c,1, Jeffrey S. Urbach b,*,1
a Interdisciplinary Program in Neuroscience, Georgetown University, Washington, DC 20057, USAbDepartment of Physics and the Institute for Soft Matter Synthesis and Metrology, Georgetown University, 320 Regents Hall, Washington, DC 20057, USAcDevelopmental Neurobiology Section, Cell Biology and Physiology Center, National Heart, Lung, and Blood Institute, National Institutes of Health, Bethesda,MD 20892, USA
a r t i c l e i n f o
Article history:Received 12 March 2014Accepted 21 April 2014Available online xxx
Keywords:Neural cellPolyvinylalcoholNerve regenerationLamininLaser ablation
* Corresponding author. Fax: þ1 202 687 2087.E-mail address: [email protected] (
1 H.M.G. and J.S.U contributed equally to this work
http://dx.doi.org/10.1016/j.biomaterials.2014.04.0970142-9612/� 2014 Elsevier Ltd. All rights reserved.
Please cite this article in press as: SmirnovM(2014), http://dx.doi.org/10.1016/j.biomateri
a b s t r a c t
Optimizing growth cone guidance through the use of patterned substrates is important for designingregenerative substrates to aid in recovery from neuronal injury. Using laser ablation, we designedmicron-scale patterns capable of confining dissociated mouse cerebellar granule neuron growth cones tochannels of different widths ranging from 1.5 to 12 mm. Growth cone dynamics in these channels wereobserved using time-lapse microscopy. Growth cone area was decreased in channels between 1.5 and6 mm as compared to that in 12 mm and unpatterned substrates. Growth cone aspect ratio was alsoaffected as narrower channels forced growth cones into a narrow, elongated shape. There was no dif-ference in the overall rate of growth cone advance in uniform channels between 1.5 and 12 mm ascompared to growth on unpatterned substrates. The percentage of time growth cones advanced, paused,and retracted was also similar. However, growth cones did respond to changes in confinement: growthcones in narrow lanes rapidly sped up when encountering a wide region and then slowed down as theyentered another narrow region. Our results suggest that the rate of neurite extension is not affected bythe degree of confinement, but does respond to changes in confinement.
� 2014 Elsevier Ltd. All rights reserved.
1. Introduction
Strategies for promoting regeneration following injury to themammalian central nervous system generally incorporate the useof implantable biomaterials to guide neurons [1e4], with extensiveresearch focusing on the design of various topographic and struc-tural patterns in order to direct neuronal outgrowth [5]. Directedneurite outgrowth has beenmainly achieved by patterning surfaceswith aligned linear features. In addition, the rate of neuriteoutgrowth on these patterns can be modulated by altering specificstructural parameters of the substrate. For example, dorsal rootganglia (DRG) neurons have been shown to extend farther onprotein-coated fibers of smaller diameter [6]. DRGs extending alongprinted channels of laminin, a known permissive substrate, havealso shown a preference for certain channel widths [7,8]. Themechanisms underlying these responses to substrate features arenot known.
J.S. Urbach)..
S, et al., The effects of confinemals.2014.04.097
The growth cone is the structure responsible for integratingchemical and structural signals from the extracellular matrix andcontrolling neurite extension. Growth cones alter their size as wellas rate of movement as a response to pattern dimensions [7,9,10].However, a detailed understanding of these responses is lacking.We employed a laser ablation technique [11] to fabricate a modelsystem of laminin-coated channels for guiding neurons, allowing usto achieve the micron-scale resolution necessary to alter growthcone morphology. Furthermore, we used dissociated cerebellargranule neurons (CGNs) to better identify isolated effects of growthcone size. The objective of our study was to use high-resolution,time-lapse microscopy on live cells extending on our fabricatedpatterns to evaluate the relationships between substrate structureand growth cone size, shape, and rate of extension.
2. Materials and methods
2.1. Glass-bottom dish preparation
Dishes were prepared according to a previously published protocol [11]. Briefly,glass-bottom (MatTek) dishes were washed with 50% HNO3, treated with 200 mM
NaOH, rinsed with H2O, and silanized using 1% triethoxysilylbutraldehyde (Gelest)in ethanol. Surfaces were washed with ethanol and H2O and allowed to cure for 3 hat 65 �C. A 5.6% PVA solution was prepared by dissolving PVA (molecular
ent on neuronal growth conemorphology and velocity, Biomaterials
PVAGlass
Laminin
Laminin
Laser Ablation
2
1
0 20 40 60 80orm
aliz
ed In
ten
A
B
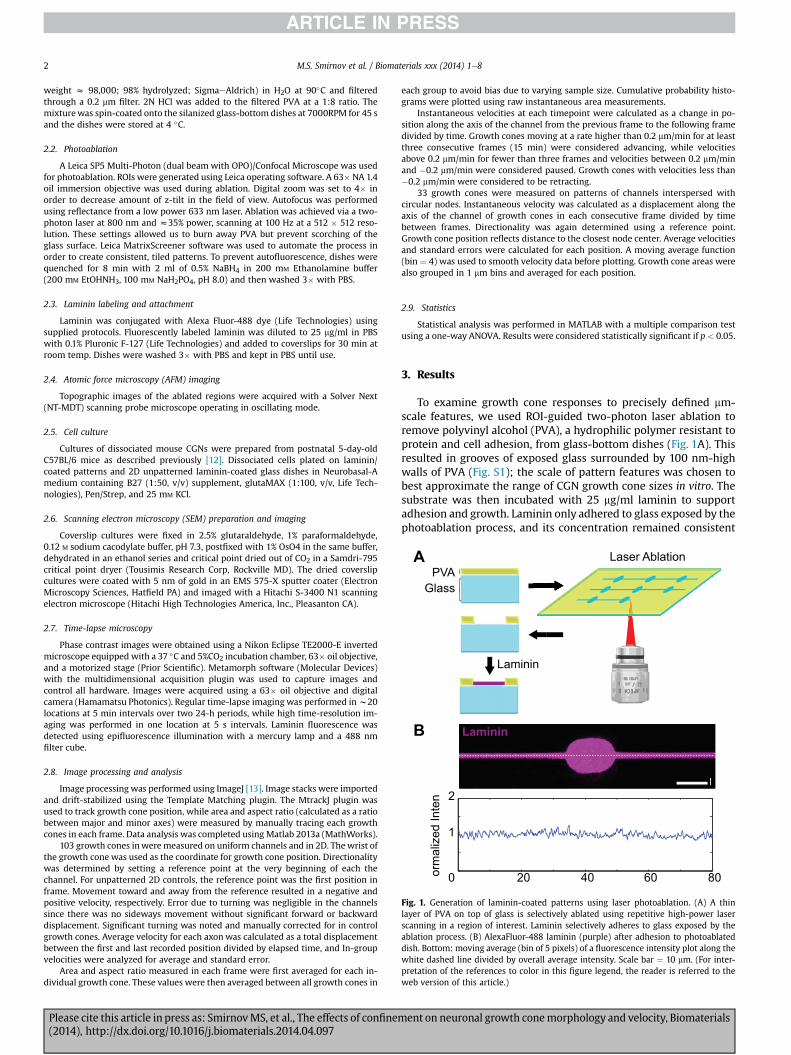
Fig. 1. Generation of laminin-coated patterns using laser photoablation. (A) A thinlayer of PVA on top of glass is selectively ablated using repetitive high-power laserscanning in a region of interest. Laminin selectively adheres to glass exposed by theablation process. (B) AlexaFluor-488 laminin (purple) after adhesion to photoablateddish. Bottom: moving average (bin of 5 pixels) of a fluorescence intensity plot along thewhite dashed line divided by overall average intensity. Scale bar ¼ 10 mm. (For inter-pretation of the references to color in this figure legend, the reader is referred to theweb version of this article.)
M.S. Smirnov et al. / Biomaterials xxx (2014) 1e82
weight z 98,000; 98% hydrolyzed; SigmaeAldrich) in H2O at 90�C and filteredthrough a 0.2 mm filter. 2N HCl was added to the filtered PVA at a 1:8 ratio. Themixturewas spin-coated onto the silanized glass-bottom dishes at 7000RPM for 45 sand the dishes were stored at 4 �C.
2.2. Photoablation
A Leica SP5 Multi-Photon (dual beam with OPO)/Confocal Microscope was usedfor photoablation. ROIs were generated using Leica operating software. A 63�NA 1.4oil immersion objective was used during ablation. Digital zoom was set to 4� inorder to decrease amount of z-tilt in the field of view. Autofocus was performedusing reflectance from a low power 633 nm laser. Ablation was achieved via a two-photon laser at 800 nm and z35% power, scanning at 100 Hz at a 512 � 512 reso-lution. These settings allowed us to burn away PVA but prevent scorching of theglass surface. Leica MatrixScreener software was used to automate the process inorder to create consistent, tiled patterns. To prevent autofluorescence, dishes werequenched for 8 min with 2 ml of 0.5% NaBH4 in 200 mM Ethanolamine buffer(200 mM EtOHNH3, 100 mM NaH2PO4, pH 8.0) and then washed 3� with PBS.
2.3. Laminin labeling and attachment
Laminin was conjugated with Alexa Fluor-488 dye (Life Technologies) usingsupplied protocols. Fluorescently labeled laminin was diluted to 25 mg/ml in PBSwith 0.1% Pluronic F-127 (Life Technologies) and added to coverslips for 30 min atroom temp. Dishes were washed 3� with PBS and kept in PBS until use.
2.4. Atomic force microscopy (AFM) imaging
Topographic images of the ablated regions were acquired with a Solver Next(NT-MDT) scanning probe microscope operating in oscillating mode.
2.5. Cell culture
Cultures of dissociated mouse CGNs were prepared from postnatal 5-day-oldC57BL/6 mice as described previously [12]. Dissociated cells plated on laminin/coated patterns and 2D unpatterned laminin-coated glass dishes in Neurobasal-Amedium containing B27 (1:50, v/v) supplement, glutaMAX (1:100, v/v, Life Tech-nologies), Pen/Strep, and 25 mM KCl.
2.6. Scanning electron microscopy (SEM) preparation and imaging
Coverslip cultures were fixed in 2.5% glutaraldehyde, 1% paraformaldehyde,0.12 M sodium cacodylate buffer, pH 7.3, postfixed with 1% OsO4 in the same buffer,dehydrated in an ethanol series and critical point dried out of CO2 in a Samdri-795critical point dryer (Tousimis Research Corp, Rockville MD). The dried coverslipcultures were coated with 5 nm of gold in an EMS 575-X sputter coater (ElectronMicroscopy Sciences, Hatfield PA) and imaged with a Hitachi S-3400 N1 scanningelectron microscope (Hitachi High Technologies America, Inc., Pleasanton CA).
2.7. Time-lapse microscopy
Phase contrast images were obtained using a Nikon Eclipse TE2000-E invertedmicroscope equipped with a 37 �C and 5%CO2 incubation chamber, 63� oil objective,and a motorized stage (Prior Scientific). Metamorph software (Molecular Devices)with the multidimensional acquisition plugin was used to capture images andcontrol all hardware. Images were acquired using a 63� oil objective and digitalcamera (Hamamatsu Photonics). Regular time-lapse imaging was performed inw20locations at 5 min intervals over two 24-h periods, while high time-resolution im-aging was performed in one location at 5 s intervals. Laminin fluorescence wasdetected using epifluorescence illumination with a mercury lamp and a 488 nmfilter cube.
2.8. Image processing and analysis
Image processing was performed using ImageJ [13]. Image stacks were importedand drift-stabilized using the Template Matching plugin. The MtrackJ plugin wasused to track growth cone position, while area and aspect ratio (calculated as a ratiobetween major and minor axes) were measured by manually tracing each growthcones in each frame. Data analysis was completed using Matlab 2013a (MathWorks).
103 growth cones inweremeasured on uniform channels and in 2D. Thewrist ofthe growth cone was used as the coordinate for growth cone position. Directionalitywas determined by setting a reference point at the very beginning of each thechannel. For unpatterned 2D controls, the reference point was the first position inframe. Movement toward and away from the reference resulted in a negative andpositive velocity, respectively. Error due to turning was negligible in the channelssince there was no sideways movement without significant forward or backwarddisplacement. Significant turning was noted and manually corrected for in controlgrowth cones. Average velocity for each axon was calculated as a total displacementbetween the first and last recorded position divided by elapsed time, and In-groupvelocities were analyzed for average and standard error.
Area and aspect ratio measured in each frame were first averaged for each in-dividual growth cone. These values were then averaged between all growth cones in
Please cite this article in press as: SmirnovMS, et al., The effects of confinem(2014), http://dx.doi.org/10.1016/j.biomaterials.2014.04.097
each group to avoid bias due to varying sample size. Cumulative probability histo-grams were plotted using raw instantaneous area measurements.
Instantaneous velocities at each timepoint were calculated as a change in po-sition along the axis of the channel from the previous frame to the following framedivided by time. Growth cones moving at a rate higher than 0.2 mm/min for at leastthree consecutive frames (15 min) were considered advancing, while velocitiesabove 0.2 mm/min for fewer than three frames and velocities between 0.2 mm/minand �0.2 mm/min were considered paused. Growth cones with velocities less than�0.2 mm/min were considered to be retracting.
33 growth cones were measured on patterns of channels interspersed withcircular nodes. Instantaneous velocity was calculated as a displacement along theaxis of the channel of growth cones in each consecutive frame divided by timebetween frames. Directionality was again determined using a reference point.Growth cone position reflects distance to the closest node center. Average velocitiesand standard errors were calculated for each position. A moving average function(bin ¼ 4) was used to smooth velocity data before plotting. Growth cone areas werealso grouped in 1 mm bins and averaged for each position.
2.9. Statistics
Statistical analysis was performed in MATLAB with a multiple comparison testusing a one-way ANOVA. Results were considered statistically significant if p < 0.05.
3. Results
To examine growth cone responses to precisely defined mm-scale features, we used ROI-guided two-photon laser ablation toremove polyvinyl alcohol (PVA), a hydrophilic polymer resistant toprotein and cell adhesion, from glass-bottom dishes (Fig. 1A). Thisresulted in grooves of exposed glass surrounded by 100 nm-highwalls of PVA (Fig. S1); the scale of pattern features was chosen tobest approximate the range of CGN growth cone sizes in vitro. Thesubstrate was then incubated with 25 mg/ml laminin to supportadhesion and growth. Laminin only adhered to glass exposed by thephotoablation process, and its concentration remained consistent
ent on neuronal growth conemorphology and velocity, Biomaterials
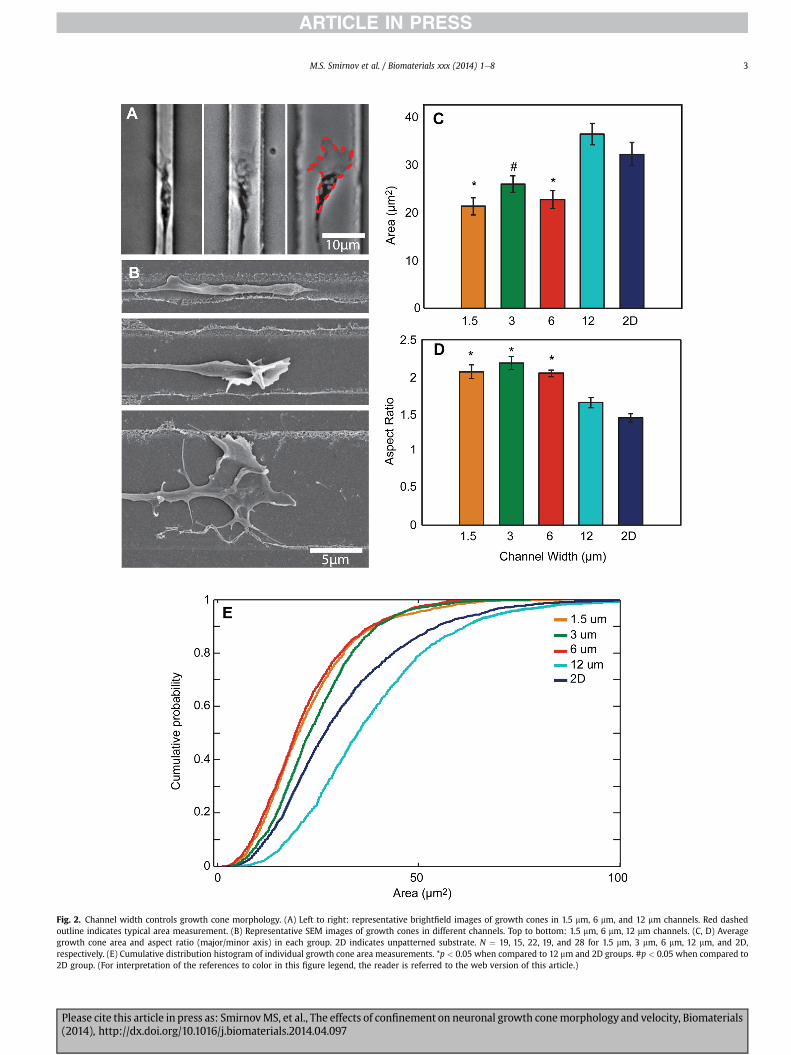
Fig. 2. Channel width controls growth cone morphology. (A) Left to right: representative brightfield images of growth cones in 1.5 mm, 6 mm, and 12 mm channels. Red dashedoutline indicates typical area measurement. (B) Representative SEM images of growth cones in different channels. Top to bottom: 1.5 mm, 6 mm, 12 mm channels. (C, D) Averagegrowth cone area and aspect ratio (major/minor axis) in each group. 2D indicates unpatterned substrate. N ¼ 19, 15, 22, 19, and 28 for 1.5 mm, 3 mm, 6 mm, 12 mm, and 2D,respectively. (E) Cumulative distribution histogram of individual growth cone area measurements. *p < 0.05 when compared to 12 mm and 2D groups. #p < 0.05 when compared to2D group. (For interpretation of the references to color in this figure legend, the reader is referred to the web version of this article.)
M.S. Smirnov et al. / Biomaterials xxx (2014) 1e8 3
Please cite this article in press as: SmirnovMS, et al., The effects of confinement on neuronal growth conemorphology and velocity, Biomaterials(2014), http://dx.doi.org/10.1016/j.biomaterials.2014.04.097
A
B
C
1.6
1.2
0.8
0.4
0.4
0.3
0.2
0.1
0
0
1.5 3 6 12 2D
1.5 3 6 12 2D
Velo
city
(μm
/min
)Ve
loci
ty (μ
m/m
in)
Velocity (um/min)
Channel Width (μm)
D 3
2.5
1.5
0.5
0
1
2
−0.8 −0.4 0 0.4 0.8
Den
sity
1.5 μm3 μm6 μm12 μm2D μm
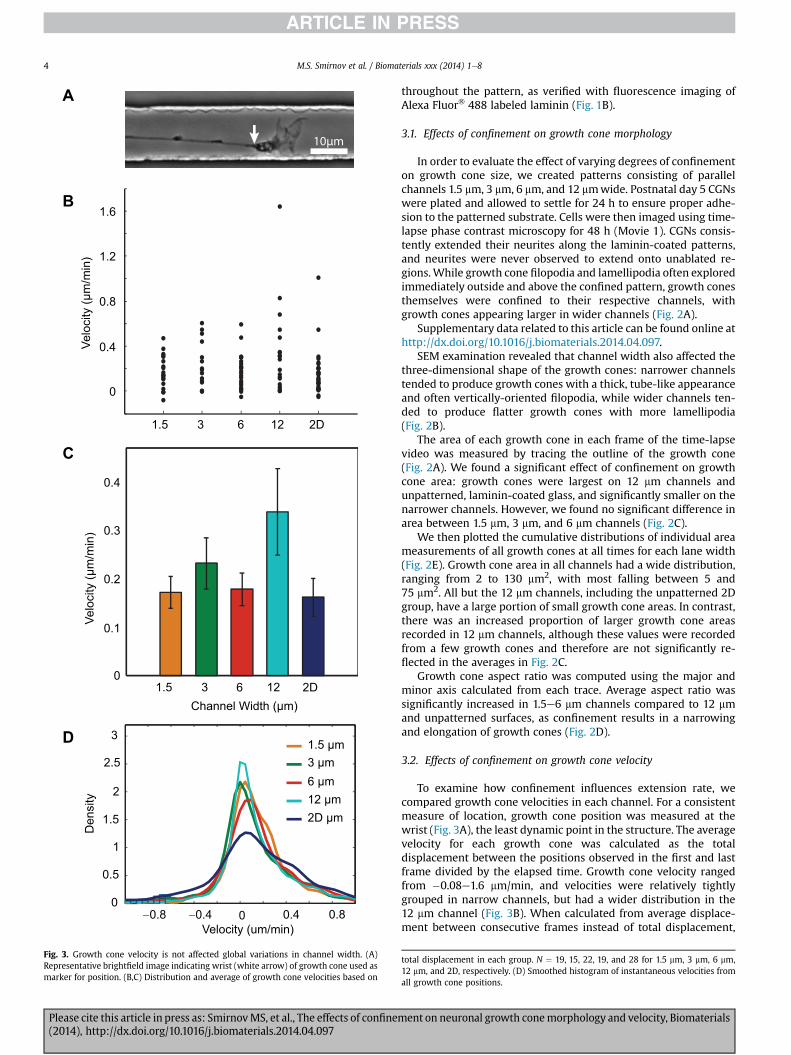
Fig. 3. Growth cone velocity is not affected global variations in channel width. (A)Representative brightfield image indicating wrist (white arrow) of growth cone used asmarker for position. (B,C) Distribution and average of growth cone velocities based on
M.S. Smirnov et al. / Biomaterials xxx (2014) 1e84
Please cite this article in press as: SmirnovMS, et al., The effects of confinem(2014), http://dx.doi.org/10.1016/j.biomaterials.2014.04.097
throughout the pattern, as verified with fluorescence imaging ofAlexa Fluor� 488 labeled laminin (Fig. 1B).
3.1. Effects of confinement on growth cone morphology
In order to evaluate the effect of varying degrees of confinementon growth cone size, we created patterns consisting of parallelchannels 1.5 mm, 3 mm, 6 mm, and 12 mmwide. Postnatal day 5 CGNswere plated and allowed to settle for 24 h to ensure proper adhe-sion to the patterned substrate. Cells were then imaged using time-lapse phase contrast microscopy for 48 h (Movie 1). CGNs consis-tently extended their neurites along the laminin-coated patterns,and neurites were never observed to extend onto unablated re-gions.While growth cone filopodia and lamellipodia often exploredimmediately outside and above the confined pattern, growth conesthemselves were confined to their respective channels, withgrowth cones appearing larger in wider channels (Fig. 2A).
Supplementary data related to this article can be found online athttp://dx.doi.org/10.1016/j.biomaterials.2014.04.097.
SEM examination revealed that channel width also affected thethree-dimensional shape of the growth cones: narrower channelstended to produce growth cones with a thick, tube-like appearanceand often vertically-oriented filopodia, while wider channels ten-ded to produce flatter growth cones with more lamellipodia(Fig. 2B).
The area of each growth cone in each frame of the time-lapsevideo was measured by tracing the outline of the growth cone(Fig. 2A). We found a significant effect of confinement on growthcone area: growth cones were largest on 12 mm channels andunpatterned, laminin-coated glass, and significantly smaller on thenarrower channels. However, we found no significant difference inarea between 1.5 mm, 3 mm, and 6 mm channels (Fig. 2C).
We then plotted the cumulative distributions of individual areameasurements of all growth cones at all times for each lane width(Fig. 2E). Growth cone area in all channels had a wide distribution,ranging from 2 to 130 mm2, with most falling between 5 and75 mm2. All but the 12 mm channels, including the unpatterned 2Dgroup, have a large portion of small growth cone areas. In contrast,there was an increased proportion of larger growth cone areasrecorded in 12 mm channels, although these values were recordedfrom a few growth cones and therefore are not significantly re-flected in the averages in Fig. 2C.
Growth cone aspect ratio was computed using the major andminor axis calculated from each trace. Average aspect ratio wassignificantly increased in 1.5e6 mm channels compared to 12 mmand unpatterned surfaces, as confinement results in a narrowingand elongation of growth cones (Fig. 2D).
3.2. Effects of confinement on growth cone velocity
To examine how confinement influences extension rate, wecompared growth cone velocities in each channel. For a consistentmeasure of location, growth cone position was measured at thewrist (Fig. 3A), the least dynamic point in the structure. The averagevelocity for each growth cone was calculated as the totaldisplacement between the positions observed in the first and lastframe divided by the elapsed time. Growth cone velocity rangedfrom �0.08e1.6 mm/min, and velocities were relatively tightlygrouped in narrow channels, but had a wider distribution in the12 mm channel (Fig. 3B). When calculated from average displace-ment between consecutive frames instead of total displacement,
total displacement in each group. N ¼ 19, 15, 22, 19, and 28 for 1.5 mm, 3 mm, 6 mm,12 mm, and 2D, respectively. (D) Smoothed histogram of instantaneous velocities fromall growth cone positions.
ent on neuronal growth conemorphology and velocity, Biomaterials
M.S. Smirnov et al. / Biomaterials xxx (2014) 1e8 5
velocities had a wider distribution in the 2D condition (Fig. 3D).However, we found that average velocity was independent ofchannel width (Fig. 3C). Therefore, altering growth cone areathrough confinement does not in itself alter average velocity.
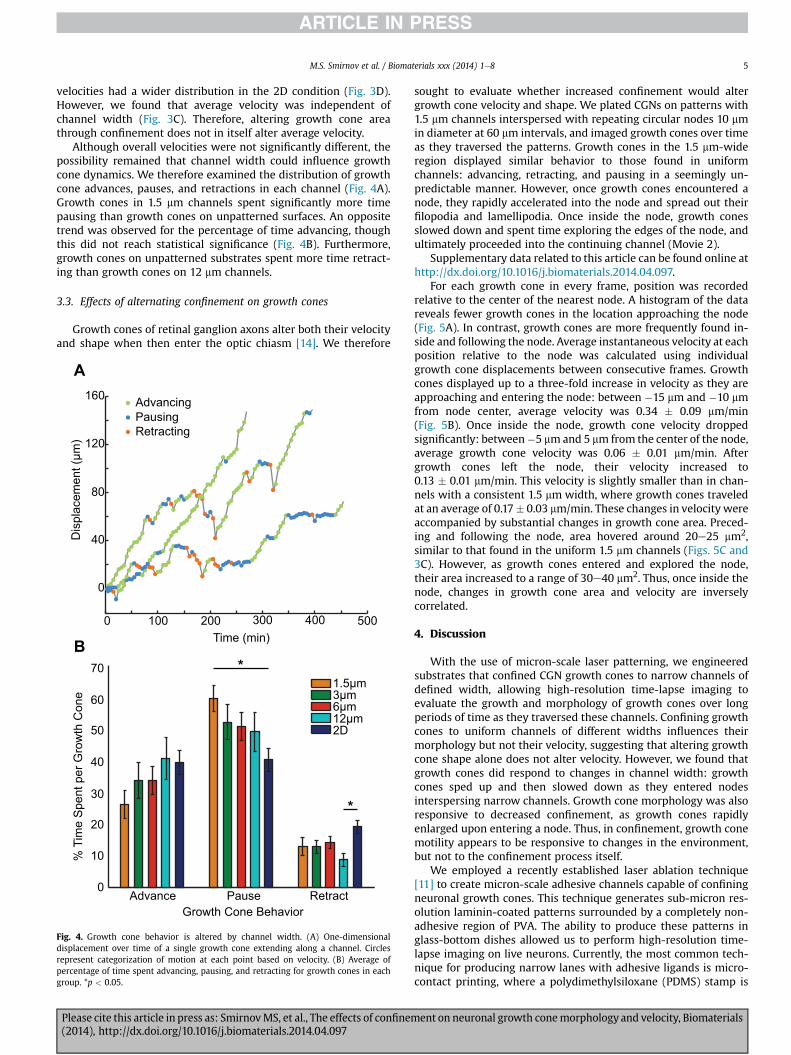
Although overall velocities were not significantly different, thepossibility remained that channel width could influence growthcone dynamics. We therefore examined the distribution of growthcone advances, pauses, and retractions in each channel (Fig. 4A).Growth cones in 1.5 mm channels spent significantly more timepausing than growth cones on unpatterned surfaces. An oppositetrend was observed for the percentage of time advancing, thoughthis did not reach statistical significance (Fig. 4B). Furthermore,growth cones on unpatterned substrates spent more time retract-ing than growth cones on 12 mm channels.
3.3. Effects of alternating confinement on growth cones
Growth cones of retinal ganglion axons alter both their velocityand shape when then enter the optic chiasm [14]. We therefore
A160
120
80
40
0
0 100 200 300 400 500Time (min)
Dis
plac
emen
t (µm
)
AdvancingPausingRetracting
70
60
50
40
30
20
10
0Advance Pause Retract
Growth Cone Behavior
% T
ime
Spe
nt p
er G
row
th C
one
B*
*
1.5µm3µm6µm12µm2D
Fig. 4. Growth cone behavior is altered by channel width. (A) One-dimensionaldisplacement over time of a single growth cone extending along a channel. Circlesrepresent categorization of motion at each point based on velocity. (B) Average ofpercentage of time spent advancing, pausing, and retracting for growth cones in eachgroup. *p < 0.05.
Please cite this article in press as: SmirnovMS, et al., The effects of confinem(2014), http://dx.doi.org/10.1016/j.biomaterials.2014.04.097
sought to evaluate whether increased confinement would altergrowth cone velocity and shape. We plated CGNs on patterns with1.5 mm channels interspersed with repeating circular nodes 10 mmin diameter at 60 mm intervals, and imaged growth cones over timeas they traversed the patterns. Growth cones in the 1.5 mm-wideregion displayed similar behavior to those found in uniformchannels: advancing, retracting, and pausing in a seemingly un-predictable manner. However, once growth cones encountered anode, they rapidly accelerated into the node and spread out theirfilopodia and lamellipodia. Once inside the node, growth conesslowed down and spent time exploring the edges of the node, andultimately proceeded into the continuing channel (Movie 2).
Supplementary data related to this article can be found online athttp://dx.doi.org/10.1016/j.biomaterials.2014.04.097.
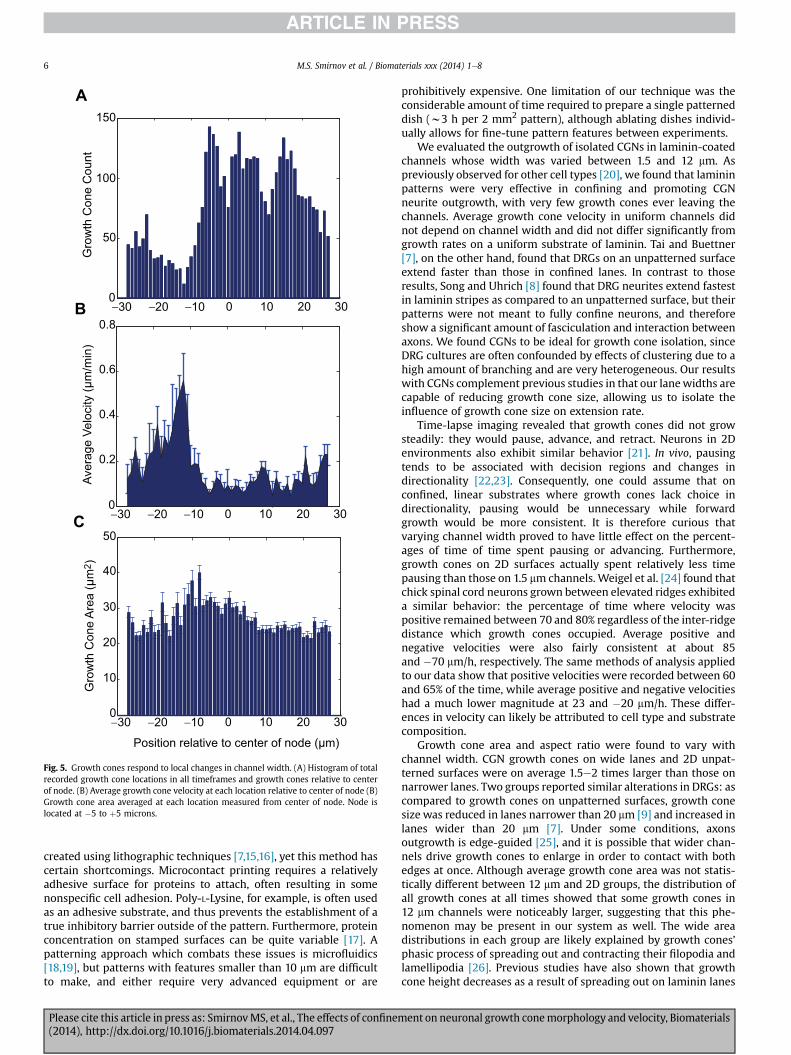
For each growth cone in every frame, position was recordedrelative to the center of the nearest node. A histogram of the datareveals fewer growth cones in the location approaching the node(Fig. 5A). In contrast, growth cones are more frequently found in-side and following the node. Average instantaneous velocity at eachposition relative to the node was calculated using individualgrowth cone displacements between consecutive frames. Growthcones displayed up to a three-fold increase in velocity as they areapproaching and entering the node: between �15 mm and �10 mmfrom node center, average velocity was 0.34 � 0.09 mm/min(Fig. 5B). Once inside the node, growth cone velocity droppedsignificantly: between�5 mmand 5 mm from the center of the node,average growth cone velocity was 0.06 � 0.01 mm/min. Aftergrowth cones left the node, their velocity increased to0.13 � 0.01 mm/min. This velocity is slightly smaller than in chan-nels with a consistent 1.5 mm width, where growth cones traveledat an average of 0.17� 0.03 mm/min. These changes in velocity wereaccompanied by substantial changes in growth cone area. Preced-ing and following the node, area hovered around 20e25 mm2,similar to that found in the uniform 1.5 mm channels (Figs. 5C and3C). However, as growth cones entered and explored the node,their area increased to a range of 30e40 mm2. Thus, once inside thenode, changes in growth cone area and velocity are inverselycorrelated.
4. Discussion
With the use of micron-scale laser patterning, we engineeredsubstrates that confined CGN growth cones to narrow channels ofdefined width, allowing high-resolution time-lapse imaging toevaluate the growth and morphology of growth cones over longperiods of time as they traversed these channels. Confining growthcones to uniform channels of different widths influences theirmorphology but not their velocity, suggesting that altering growthcone shape alone does not alter velocity. However, we found thatgrowth cones did respond to changes in channel width: growthcones sped up and then slowed down as they entered nodesinterspersing narrow channels. Growth cone morphology was alsoresponsive to decreased confinement, as growth cones rapidlyenlarged upon entering a node. Thus, in confinement, growth conemotility appears to be responsive to changes in the environment,but not to the confinement process itself.
We employed a recently established laser ablation technique[11] to create micron-scale adhesive channels capable of confiningneuronal growth cones. This technique generates sub-micron res-olution laminin-coated patterns surrounded by a completely non-adhesive region of PVA. The ability to produce these patterns inglass-bottom dishes allowed us to perform high-resolution time-lapse imaging on live neurons. Currently, the most common tech-nique for producing narrow lanes with adhesive ligands is micro-contact printing, where a polydimethylsiloxane (PDMS) stamp is
ent on neuronal growth conemorphology and velocity, Biomaterials
A150
100
50
0−30 −20 −10 0 10 20 30
−30 −20 −10 0 10 20 30
−30 −20 −10 0 10 20 30
Gro
wth
Con
e C
ount
0.8
0.6
0.4
0.2
0
Aver
age
Velo
city
(µm
/min
)G
row
th C
one
Are
a (µ
m2 )
50
40
30
20
10
0
Position relative to center of node (µm)
B
C
Fig. 5. Growth cones respond to local changes in channel width. (A) Histogram of totalrecorded growth cone locations in all timeframes and growth cones relative to centerof node. (B) Average growth cone velocity at each location relative to center of node (B)Growth cone area averaged at each location measured from center of node. Node islocated at �5 to þ5 microns.
M.S. Smirnov et al. / Biomaterials xxx (2014) 1e86
created using lithographic techniques [7,15,16], yet this method hascertain shortcomings. Microcontact printing requires a relativelyadhesive surface for proteins to attach, often resulting in somenonspecific cell adhesion. Poly-L-Lysine, for example, is often usedas an adhesive substrate, and thus prevents the establishment of atrue inhibitory barrier outside of the pattern. Furthermore, proteinconcentration on stamped surfaces can be quite variable [17]. Apatterning approach which combats these issues is microfluidics[18,19], but patterns with features smaller than 10 mm are difficultto make, and either require very advanced equipment or are
Please cite this article in press as: SmirnovMS, et al., The effects of confinem(2014), http://dx.doi.org/10.1016/j.biomaterials.2014.04.097
prohibitively expensive. One limitation of our technique was theconsiderable amount of time required to prepare a single patterneddish (w3 h per 2 mm2 pattern), although ablating dishes individ-ually allows for fine-tune pattern features between experiments.
We evaluated the outgrowth of isolated CGNs in laminin-coatedchannels whose width was varied between 1.5 and 12 mm. Aspreviously observed for other cell types [20], we found that lamininpatterns were very effective in confining and promoting CGNneurite outgrowth, with very few growth cones ever leaving thechannels. Average growth cone velocity in uniform channels didnot depend on channel width and did not differ significantly fromgrowth rates on a uniform substrate of laminin. Tai and Buettner[7], on the other hand, found that DRGs on an unpatterned surfaceextend faster than those in confined lanes. In contrast to thoseresults, Song and Uhrich [8] found that DRG neurites extend fastestin laminin stripes as compared to an unpatterned surface, but theirpatterns were not meant to fully confine neurons, and thereforeshow a significant amount of fasciculation and interaction betweenaxons. We found CGNs to be ideal for growth cone isolation, sinceDRG cultures are often confounded by effects of clustering due to ahigh amount of branching and are very heterogeneous. Our resultswith CGNs complement previous studies in that our lanewidths arecapable of reducing growth cone size, allowing us to isolate theinfluence of growth cone size on extension rate.
Time-lapse imaging revealed that growth cones did not growsteadily: they would pause, advance, and retract. Neurons in 2Denvironments also exhibit similar behavior [21]. In vivo, pausingtends to be associated with decision regions and changes indirectionality [22,23]. Consequently, one could assume that onconfined, linear substrates where growth cones lack choice indirectionality, pausing would be unnecessary while forwardgrowth would be more consistent. It is therefore curious thatvarying channel width proved to have little effect on the percent-ages of time of time spent pausing or advancing. Furthermore,growth cones on 2D surfaces actually spent relatively less timepausing than those on 1.5 mm channels. Weigel et al. [24] found thatchick spinal cord neurons grown between elevated ridges exhibiteda similar behavior: the percentage of time where velocity waspositive remained between 70 and 80% regardless of the inter-ridgedistance which growth cones occupied. Average positive andnegative velocities were also fairly consistent at about 85and �70 mm/h, respectively. The same methods of analysis appliedto our data show that positive velocities were recorded between 60and 65% of the time, while average positive and negative velocitieshad a much lower magnitude at 23 and �20 mm/h. These differ-ences in velocity can likely be attributed to cell type and substratecomposition.
Growth cone area and aspect ratio were found to vary withchannel width. CGN growth cones on wide lanes and 2D unpat-terned surfaces were on average 1.5e2 times larger than those onnarrower lanes. Two groups reported similar alterations in DRGs: ascompared to growth cones on unpatterned surfaces, growth conesize was reduced in lanes narrower than 20 mm [9] and increased inlanes wider than 20 mm [7]. Under some conditions, axonsoutgrowth is edge-guided [25], and it is possible that wider chan-nels drive growth cones to enlarge in order to contact with bothedges at once. Although average growth cone area was not statis-tically different between 12 mm and 2D groups, the distribution ofall growth cones at all times showed that some growth cones in12 mm channels were noticeably larger, suggesting that this phe-nomenon may be present in our system as well. The wide areadistributions in each group are likely explained by growth cones’phasic process of spreading out and contracting their filopodia andlamellipodia [26]. Previous studies have also shown that growthcone height decreases as a result of spreading out on laminin lanes
ent on neuronal growth conemorphology and velocity, Biomaterials

M.S. Smirnov et al. / Biomaterials xxx (2014) 1e8 7
[27]. While we were unable to quantify growth cone volume,growth cones in wider lanes appeared flatter when examined un-der SEM, suggesting a 3D cytoskeletal rearrangement in response toconfinement.
Growth cone area was also found to change as neuronsencountered increases and decreases in channel width. As theyentered a node, growth cones both grew larger and slowed down.Féréol et al. [28] observed a similar behavior in DRG growth coneswhich spread out and paused as they entered a laminin spot, yetremained highly dynamic while supposedly searching for theirnext target. After exiting a node, growth cone area again decreasedinside confined channels. This is reminiscent of the behavior ofretinal ganglion cells: growth cones tend to be small and stream-lined in the optic nerve, but as they reach the optic chiasm, theyoften become larger and tend to pause [14,29]. Similarly, Liu et al.[10] found that hippocampal growth cones increased in size whenleaving a 5 mm lane and entering an open, 2D region, at which pointthey were more likely to branch. It is worth noting, however, thatthe growth cone area measured in the nodes was equal to that ofgrowth cones continuously confined to channels of thewidth of thenode, suggesting that the spreading of the growth cone is notdependent on the previous state of confinement.
A lack of influence by substrate confinement, and thus growthcone area, on extension rate may seem puzzling due to the growthcone’s established role as the primary mechanistic center in axonextension. The most parsimonious explanation is that there exists afeedback mechanism that maintains the overall elongation rate.There are a wide range of factors that can modulate axon growthrate, for example laminin concentration [30,31]. While largergrowth cones might sense more laminin, smaller growth conesmight compensate with an alteration in integrin expression tosustain a necessary growth rate, as neurons have been shown tovary their expression levels of integrins based on laminin concen-tration in the substrate [32]. A feedback mechanism could alsooperate through the rate of tubulin polymerization or the organi-zation of microtubules in the neurite shaft, which is tightly regu-lated, in part through interaction with MAPs [33].
That there are actually differences in the growth cones indifferent width lanes is evidenced by the “jumping” behavior asgrowth cones encounter a node, suggesting that a sudden change insubstrate width disrupts an established steady state equilibrium,resulting in unusually quick growth as more laminin area isencountered in the node. This phenomenon is similar to the rapidmovement of DRG growth cones growing on fibronectin once theirfilopodia touch laminin [34]. There are several potential explana-tions for this behavior. The ‘jump’ could be a response to anincreased amount of laminin ahead of the growth cone, since re-ceptors on growth cone filopodia influence neurite outgrowthwhen contacting patterned ECM substrates [35,36]. The high lam-inin availability does not produce higher growth rates in axons thatare continually confined to the wider lanes, presumably becausethey have already adapted to the higher laminin availability.Integrins on filopodia couple with laminin to form highly dynamicpoint contacts [37] which are also involved in growth cone guid-ance [38,39]. Growth cones likely form more point contacts in thenode, and are therefore may be pulled forward as a result of theincrease in force that would arise from a transition to a larger areaof traction stresses, like those observed in DRG growth cones onuniform 2D substrates [40]. Further studies are clearly necessary toidentify those factors responsible for establishing this equilibrium.
5. Conclusions
Many different patterning techniques have been used to eval-uate growth cone dynamics in vitro. Laser-guided patterning has
Please cite this article in press as: SmirnovMS, et al., The effects of confinem(2014), http://dx.doi.org/10.1016/j.biomaterials.2014.04.097
the advantage of producing consistent, micron-scale patterns thatcan be easily modified to test specific hypotheses. While it has beenestablished that substrate feature size is capable of controllingneuronal outgrowth rates, we have shown that altering growthcone size, per se, will not modulate growth velocity. However, wedemonstrated that growth cones do respond to changes in theirenvironment with a change in size and axonal extension rate. Indecision regions, this change in growth cone size and velocity hasbeen linked to a change in sensitivity to guidance cues, and wepropose that our assay can provide a systematic test of thishypothesis.
Acknowledgments
Special thanks to Dr. Andrew Doyle as well as the NHLBI LightMicroscopy Core for their help with the photoablation process andto the NHLBI EM Core for their help in collecting SEM images.Funding was provided by National Institutes of Health (NIH) grant1R01NS064250 to J.S.U. and the NHLBI Intramural Research Pro-gram (H.M.G) (1 ZIA HL006021)
Appendix A. Supplementary data
Supplementary data related to this article can be found at http://dx.doi.org/10.1016/j.biomaterials.2014.04.097.
References
[1] Geller HM, Fawcett JW. Building a bridge: engineering spinal cord repair. ExpNeurol 2002;174:125e36.
[2] Norman LL, Stroka K, Aranda-Espinoza H. Guiding axons in the central ner-vous system: a tissue engineering approach. Tissue Eng Part B Rev 2009;15:291e305.
[3] Biazar E, Khorasani MT, Montazeri N, Pourshamsian K, Daliri M, Rezaei M,et al. Types of neural guides and using nanotechnology for peripheral nervereconstruction. Int J Nanomed 2010;5:839e52.
[4] Straley KS, Foo CWP, Heilshorn SC. Biomaterial design strategies for thetreatment of spinal cord injuries. J Neurotrauma 2010;27:1e19.
[5] Hoffman-Kim D, Mitchel JA, Bellamkonda RV. Topography, cell response, andnerve regeneration. Annu Rev Biomed Eng 2010;12:203e31.
[6] Xuejun W, Tresco PA. Effect of filament diameter and extracellular matrixmolecule precoating on neurite outgrowth and Schwann cell behavior onmultifilament entubulation bridging device in vitro. J Biomed Mater Res A2006;76:626e37.
[7] Tai HC, Buettner HM. Neurite outgrowth and growth cone morphology onmicropatterned surfaces. Biotechnol Prog 1998;14:364e70.
[8] Song M, Uhrich KE. Optimal micropattern dimensions enhance neuriteoutgrowth rates, lengths, and orientations. Ann Biomed Eng 2007;35:1812e20.
[9] Clark P, Britland S, Connolly P. Growth cone guidance and neuron morphologyon micropatterned laminin surfaces. J Cell Sci 1993;105(Pt 1):203e12.
[10] Liu W, Xing S, Yuan B, Zheng W, Jiang X. Change of laminin density stimulatesaxon branching via growth cone myosin II-mediated adhesion. Integr Biol(Camb) 2013;5:1244e52.
[11] Doyle AD. Generation of micropatterned substrates using micro photo-patterning. Curr Protoc Cell Biol; 2009 [Chapter 10:10.15.1-10.15.35].
[12] Wang H, Katagiri Y, McCann TE, Unsworth E, Goldsmith P, Yu Z-X, et al.Chondroitin-4-sulfation negatively regulates axonal guidance and growth.J Cell Sci 2008;121:3083e91.
[13] Schneider CA, Rasband WS, Eliceiri KW. NIH Image to ImageJ: 25 years ofimage analysis. Nat Methods 2012;9:671e5.
[14] Mason CA, Wang LC. Growth cone form is behavior-specific and, conse-quently, position-specific along the retinal axon pathway. J Neurosci 1997;17:1086e100.
[15] Ruiz A, Buzanska L, Gilliland D, Rauscher H, Sirghi L, Sobanski T, et al. Micro-stamped surfaces for the patterned growth of neural stem cells. Biomaterials2008;29:4766e74.
[16] Théry M, Piel M. Adhesive micropatterns for cells: a microcontact printingprotocol. Cold Spring Harb Protoc 2009;4(7). pdb.prot5255.
[17] Whitesides GM, Ostuni E, Takayama S, Jiang X, Ingber DE. Soft lithography inbiology and biochemistry. Annu Rev Biomed Eng 2001;3:335e73.
[18] Yuan B, Li Y, Wang D, Xie Y, Liu Y, Cui L, et al. A general approach forpatterning multiple types of cells using holey PDMS membranes and micro-fluidic channels. Adv Funct Mater 2010;20:3715e20.
[19] Kim P, Kwon K, Park M, Lee S, Kim S, Suh K. Soft lithography for microfluidics:a review 2008;2:1e11.
ent on neuronal growth conemorphology and velocity, Biomaterials

M.S. Smirnov et al. / Biomaterials xxx (2014) 1e88
[20] Hammarback J, McCarthy J, Palm S. Growth cone guidance by substrate-boundlaminin pathways is correlated with neuron-to-pathway adhesivity. Dev Biol1988;126:29e39.
[21] Argiro V, BungeM, JohnsonM. Correlation between growth form andmovementand their dependence on neuronal age. J Neurosci 1984;4:3051e62.
[22] Godement P, Wang L-C, Mason CA. Retinal axon divergence in the opticchiasm: dynamics of growth cone behavior at the midline. J Neurosci1994;14:7024e39.
[23] Skaliora I, Adams R, Blakemore C. Morphology and growth patterns ofdeveloping thalamocortical axons. J Neurosci 2000;20:3650e62.
[24] Weigel S, Osterwalder T, Tobler U, Yao L, Wiesli M, Lehnert T, et al. Surfacemicrostructures on planar substrates and textile fibers guide neuriteoutgrowth: a scaffold solution to push limits of critical nerve defect regen-eration? PLoS One 2012;7:e50714.
[25] Xing S, Liu W, Huang Z, Chen L, Sun K, Han D, et al. Development of neuronson micropatterns reveals that growth cone responds to a sharp change ofconcentration of laminin. Electrophoresis 2010;31:3144e51.
[26] Gallo G, Pollack ED. Cyclic remodelling of growth cone lamellae and the effectof target tissue. Brain Res Dev Brain Res 1995;85:140e5.
[27] Messa M, Canale C, Marconi E, Cingolani R, Salerno M, Benfenati F. Growthcone 3-D morphology is modified by distinct micropatterned adhesion sub-strates. IEEE Trans Nanobiosci 2009;8:161e8.
[28] Féréol S, Fodil R, Barnat M, Georget V, Milbreta U, Nothias F. MicropatternedECM substrates reveal complementary contribution of low and high affinityligands to neurite outgrowth. Cytoskeleton (Hoboken) 2011;68:373e88.
[29] Bovolenta P, Mason C. Growth cone morphology varies with position in thedeveloping mouse visual pathway from retina to first targets. J Neurosci1987;7:1447e60.
Please cite this article in press as: SmirnovMS, et al., The effects of confinem(2014), http://dx.doi.org/10.1016/j.biomaterials.2014.04.097
[30] Marquardt L, Willits RK. Neurite growth in PEG gels: effect of mechanicalstiffness and laminin concentration. J Biomed Mater Res A 2011;98:1e6.
[31] Swindle-Reilly KE, Papke JB, Kutosky HP, Throm A, Hammer JA, Harkins AB,et al. The impact of laminin on 3D neurite extension in collagen gels. J NeuralEng 2012;9:046007.
[32] Condic ML, Letourneau PC. Ligand-induced changes in integrin expressionregulate neuronal adhesion and neurite outgrowth. Nature 1997;389:852e6.
[33] Tymanskyj SR, Scales TME, Gordon-Weeks PR. MAP1B enhances microtubuleassembly rates and axon extension rates in developing neurons. Mol CellNeurosci 2012;49:110e9.
[34] Gomez TM, Letourneau PC. Filopodia initiate choices made by sensory neurongrowth cones at laminin/fibronetin borders in vitro 1994;74.
[35] Mortimer D, Fothergill T, Pujic Z, Richards LJ, Goodhill GJ. Growth conechemotaxis. Trends Neurosci 2008;31:90e8.
[36] Geraldo S, Gordon-Weeks PR. Cytoskeletal dynamics in growth-cone steering.J Cell Sci 2009;122:3595e604.
[37] Steketee MB, Tosney KW. Three functionally distinct adhesions in filopodia:shaft adhesions control lamellar extension. J Neurosci 2002;22:8071e83.
[38] Gomez TM, Roche FK, Letourneau PC. Chick sensory neuronal growth conesdistinguish fibronectin from laminin by making substratum contacts thatresemble focal contacts. J Neurobiol 1996;29:18e34.
[39] Myers JP, Gomez TM. Focal adhesion kinase promotes integrin adhesion dy-namics necessary for chemotropic turning of nerve growth cones. J Neurosci2011;31:13585e95.
[40] Koch D, Rosoff WJ, Jiang J, Geller HM, Urbach JS. Strength in the periphery:growth cone biomechanics and substrate rigidity response in peripheral andcentral nervous system neurons. Biophys J 2012;102:452e60.
ent on neuronal growth conemorphology and velocity, Biomaterials
Copyright © 2022 FDOKUMEN