The effect of salsalate on insulin action and glucose tolerance in obese non-diabetic patients:...
17
The effect of salsalate on insulin action and glucose tolerance in obese non-diabetic patients: results of a randomised double-blind placebo-controlled study J. Koska, E. Ortega, J. C. Bunt, A. Gasser, J. Impson, R. L. Hanson, J. Forbes, B. de Courten, and J. Krakoff J. Koska, E. Ortega, J. C. Bunt, J. Impson, R. L. Hanson, B. de Courten, J. Krakoff, Obesity and Diabetes Clinical Research Section, NIDDK/NIH/DHHS, 4212 N 16th Street, Phoenix, AZ, USA A. Gasser, J. Forbes, B. de Courten, Baker Heart Research Institute & International Diabetes Institute, Melbourne, VIC, Australia J. Koska: [email protected] Abstract Aim/hypothesis—Low-grade inflammation may contribute to obesity-related insulin resistance and has been associated with increased risk of type 2 diabetes mellitus. The present study evaluated whether treatment with salsalate, a traditional anti-inflammatory medication, would improve insulin action in obese non-diabetic individuals. Methods—The study was a randomised, double-blind, placebo-controlled, parallel trial conducted at the inpatient clinical research unit of the NIDKK (Phoenix, AZ, USA). Participants were 54 adults (18 to 45 years of age) with BMI≥30 kg/m 2 . The intervention was salsalate (3 g/day, n=28) or identical placebo (n=26) for 7 days. The allocation was kept concealed by giving the investigator only a number corresponding to a vial of placebo or salsalate sequentially randomised in blocks by sex. Main outcomes were changes in insulin action assessed as rate of glucose disposal (R d ) by euglycaemic– hyperinsulinaemic clamp (insulin infusion rate 40 mU m −2 min −1 ) and glucose tolerance by 75 g OGTT. Results—The study was completed by 47 participants, of which 40 were analysed (salsalate n=22, placebo n=18). Salsalate treatment resulted in decreased fasting plasma glucose concentration (mean [SD]; 4.83 [0.28] vs 5.11 [0.33] mmol/l, p=0.001) and glucose AUC during the OGTT (p=0.01), and in increased R d (20 [8] vs 18 [6] μmol [kg estimated metabolic body size] −1 min −1 , p=0.002), while there was no significant change in these variables with placebo (p>0.3 for all). The effect of salsalate on R d disappeared (p=0.9) after normalising to increased insulin concentrations (701 [285] vs 535 [201] pmol/l, p<0.0001) measured during the clamp. No side effects of salsalate were observed during the study. Correspondence to: J. Koska, [email protected]. J. Koska and E. Ortega contributed equally to this work. Electronic supplementary material The online version of this article (doi:10.1007/s00125-008-1239-x) contains supplementary material, which is available to authorised users. Duality of interest The authors declare that there is no duality of interest associated with this manuscript. Publisher's Disclaimer: Open Access This article is distributed under the terms of the Creative Commons Attribution Noncommercial License which permits any noncommercial use, distribution, and reproduction in any medium, provided the original author(s) and source are credited. NIH Public Access Author Manuscript Diabetologia. Author manuscript; available in PMC 2010 November 22. Published in final edited form as: Diabetologia. 2009 March ; 52(3): 385–393. doi:10.1007/s00125-008-1239-x. NIH-PA Author Manuscript NIH-PA Author Manuscript NIH-PA Author Manuscript
-
Upload
independent -
Category
Documents
-
view
1 -
download
0
Transcript of The effect of salsalate on insulin action and glucose tolerance in obese non-diabetic patients:...

The effect of salsalate on insulin action and glucose tolerance inobese non-diabetic patients: results of a randomised double-blindplacebo-controlled study
J. Koska, E. Ortega, J. C. Bunt, A. Gasser, J. Impson, R. L. Hanson, J. Forbes, B. deCourten, and J. KrakoffJ. Koska, E. Ortega, J. C. Bunt, J. Impson, R. L. Hanson, B. de Courten, J. Krakoff, Obesity andDiabetes Clinical Research Section, NIDDK/NIH/DHHS, 4212 N 16th Street, Phoenix, AZ, USA
A. Gasser, J. Forbes, B. de Courten, Baker Heart Research Institute & International DiabetesInstitute, Melbourne, VIC, AustraliaJ. Koska: [email protected]
AbstractAim/hypothesis—Low-grade inflammation may contribute to obesity-related insulin resistanceand has been associated with increased risk of type 2 diabetes mellitus. The present study evaluatedwhether treatment with salsalate, a traditional anti-inflammatory medication, would improve insulinaction in obese non-diabetic individuals.
Methods—The study was a randomised, double-blind, placebo-controlled, parallel trial conductedat the inpatient clinical research unit of the NIDKK (Phoenix, AZ, USA). Participants were 54 adults(18 to 45 years of age) with BMI≥30 kg/m2. The intervention was salsalate (3 g/day, n=28) or identicalplacebo (n=26) for 7 days. The allocation was kept concealed by giving the investigator only a numbercorresponding to a vial of placebo or salsalate sequentially randomised in blocks by sex. Mainoutcomes were changes in insulin action assessed as rate of glucose disposal (Rd) by euglycaemic–hyperinsulinaemic clamp (insulin infusion rate 40 mU m−2 min−1) and glucose tolerance by 75 gOGTT.
Results—The study was completed by 47 participants, of which 40 were analysed (salsalate n=22,placebo n=18). Salsalate treatment resulted in decreased fasting plasma glucose concentration (mean[SD]; 4.83 [0.28] vs 5.11 [0.33] mmol/l, p=0.001) and glucose AUC during the OGTT (p=0.01), andin increased Rd (20 [8] vs 18 [6] μmol [kg estimated metabolic body size]−1 min−1, p=0.002), whilethere was no significant change in these variables with placebo (p>0.3 for all). The effect of salsalateon Rd disappeared (p=0.9) after normalising to increased insulin concentrations (701 [285] vs 535[201] pmol/l, p<0.0001) measured during the clamp. No side effects of salsalate were observed duringthe study.
Correspondence to: J. Koska, [email protected]. Koska and E. Ortega contributed equally to this work.Electronic supplementary material The online version of this article (doi:10.1007/s00125-008-1239-x) contains supplementarymaterial, which is available to authorised users.Duality of interest The authors declare that there is no duality of interest associated with this manuscript.Publisher's Disclaimer: Open Access This article is distributed under the terms of the Creative Commons Attribution NoncommercialLicense which permits any noncommercial use, distribution, and reproduction in any medium, provided the original author(s) and sourceare credited.
NIH Public AccessAuthor ManuscriptDiabetologia. Author manuscript; available in PMC 2010 November 22.
Published in final edited form as:Diabetologia. 2009 March ; 52(3): 385–393. doi:10.1007/s00125-008-1239-x.
NIH
-PA Author Manuscript
NIH
-PA Author Manuscript
NIH
-PA Author Manuscript

Conclusions/interpretation—The glucose-lowering potential of salicylates appears to be due toeffects on insulin concentration rather than improved insulin action. Salicylate-based compoundsmay be useful for the treatment and prevention of type 2 diabetes.
KeywordsClinical science; Cytokines; Human; Insulin sensitivity and resistance; Prediction and prevention oftype 2 diabetes
IntroductionObesity is a condition characterised by chronic activation of the innate immune system [1].This subclinical activation has been implicated in the development of metabolic complicationsof obesity such as insulin resistance and type 2 diabetes mellitus [2-4]. Treatment ofinflammation is a potential novel strategy in prevention and treatment of type 2 diabetes [5].
Administration of salicylates, traditional anti-inflammatory drugs, has been known to reducehyperglycaemia in patients with pre-existing diabetes [6-8]. Indeed, not only do salicylatesreduce fasting systemic glucose concentrations, they also improve systemic glucoseconcentrations following oral glucose, a mixed meal and an intravenous insulin challenge indiabetic and non-diabetic patients [9-14]. Moreover, in diabetic and non-diabetic patients,improvement of glucose tolerance was observed within 1 week of treatment with aspirin(chemically, acetylsalicylic acid) [10,12]. In experimental animal models, salicylates loweredplasma glucose and insulin concentrations during an OGTT [15].
The mechanisms underlying the glucose-lowering effect of salicylates have not been definedand studies remain conflicting. In 3T3-L1 adipocytes and FaO hepatoma cells, pre-treatmentwith high doses of salicylates reversed TNF-α-induced cellular insulin resistance [15], whilein rats salicylates prevented hepatic and peripheral insulin resistance induced by lipid infusion[16,17]. Patients with type 2 diabetes showed decreased endogenous glucose production (EGP)and increased insulin-mediated glucose disposal when administered a high anti-inflammatorydose of acetylsalicylic acid [12]. In healthy participants, acute pre-treatment with aspirinattenuated lipid-induced impairment of insulin action [18], but had no effect on insulinresistance induced by prolonged fasting [19]. However, other studies in healthy individualsindicated that the stimulatory effect of salicylates on glucose utilisation is caused by increasedsystemic availability of insulin, in spite of unchanged or even decreased peripheral insulinsensitivity [20-22].
The nuclear factor-κB (NF-κB) has been proposed as a molecular target mediating the glucose-lowering effect of salicylates [5]. NF-κB is a transcription factor that stimulates expression ofnumerous genes whose products may alter insulin action [5]. NF-κB is maintained in thecytoplasm through interaction with inhibitory proteins, the IκBs, which are rapidly degradedupon phosphorylation by IκB kinase (IKK) [23]. The inhibitory effect of salicylates on NF-κB activation is presumed to be mediated via inhibition of IKKβ activity [24]. In fact,administration of salicylates prevented hepatic and peripheral insulin resistance in mice withgenetically increased IKKβ levels in the liver [25].
Since chronic low-grade inflammation is a hallmark of obesity [1] and contributes to increasedrisk of insulin resistance and type 2 diabetes [4], we investigated whether use of a commonanti-inflammatory dose of salsalate (3 g per day) in non-diabetic obese individuals (BMI≥30kg/m2) would improve insulin action as measured by the euglycaemic–hyperinsulinaemicclamp method and whether changes in insulin action were mediated via improvement ininflammation, specifically the NF-κB/IKKβ inflammatory pathway. Salsalate is a dimer of
Koska et al. Page 2
Diabetologia. Author manuscript; available in PMC 2010 November 22.
NIH
-PA Author Manuscript
NIH
-PA Author Manuscript
NIH
-PA Author Manuscript

salicylic acid with an established safety profile after many decades of use to treat rheumaticpain, including lower bleeding risk compared with aspirin.
MethodsStudy design
The study was double-blind and placebo-controlled in design. Eligible participants werebetween 18 and 45 years, had a BMI≥30 kg m−2 and were non-diabetic by OGTT (1999 WHOcriteria). All participants were non-smokers at the time of the study and, except for obesity,healthy according to medical history, physical examination and routine laboratory tests. Theprotocol was approved by the Institutional Review Board of the NIDDK and the Gila RiverIndian Community tribal council. All participants provided written informed consent beforeparticipation.
Study proceduresUpon admission to the clinical research unit at the NIDKK (Phoenix, AZ, USA), all participantswere placed on a weight-maintaining diet (containing 50% of energy as carbohydrate, 30% asfat and 20% as protein). Body composition was measured by dual-energy x-ray absorptiometry(GE/Lunar, Madison, WI, USA). At least 3 days after admission and after a 12 h overnight fasta 2-h 75 g OGTT was performed to exclude diabetes.
One day after the OGTT, a euglycaemic–hyperinsulinaemic clamp was performed to assessinsulin action at physiological hyperinsulinaemia [26]. Briefly, after an overnight fast a catheterwas placed in the antecubital vein and a primed (1.11 MBq) continuous (0.01 MBq/min)[3-3H]glucose infusion was started to determine EGP. A second catheter was insertedretrogradely into a vein on the dorsum of the hand for blood sampling and the hand was placedin a heated box (60°C) for the duration of the study. At least 2 h after starting the [3-3H]glucoseinfusion, a primed continuous intravenous insulin infusion was administered for 100 min at aconstant rate of 40 mU m−2 min−1. Arterialised blood samples were collected every 5 min forplasma glucose determination and a 20% glucose infusion was adjusted to maintain the plasmaglucose concentration at about 5.6 mmol/l. Blood samples for measurement of [3-3H] glucosespecific activity and plasma glucose and serum insulin concentrations were collected at theend of the basal period (22, 15, 8 and 1 min prior to insulin infusion) and every 10 min duringthe final 40 min of insulin infusion.
Under fasting conditions, the rate of glucose appearance (Ra) was calculated as the [3-3H]glucose infusion rate divided by the steady-state plasma [3-3H]glucose specific activity. Duringthe insulin clamp, Ra was calculated from Steele’s non-steady-state equation [27]. EGP wascalculated as the difference between Ra and the exogenous glucose infusion rate (GIR)corrected for changes in glucose concentrations. The rate of glucose disposal (Rd) was definedas the average sum of GIR and EGP during the last 40 min of the insulin infusion. Rd wasfurther corrected for individual variation in average plasma glucose and serum insulinconcentrations during the last 40 min of the clamp [26,28] by normalising to reference valuesof 5.55 mmol/l for glucose and 280 pmol/l for insulin (~ED50 of insulin-stimulated whole-body glucose disposal standardised to current insulin assay) [29]. GIR, EGP and Rd were furthernormalised to estimated metabolic body size (EMBS), which is directly derived from fat-freemass but takes into account the intercept of the relation between metabolic rate and fat-freemass (−17.7 kg in our laboratory [i.e. EMBS=fat-free mass+17.7 kg]) [30]. The metabolicclearance rate of insulin was defined as insulin infusion rate divided by incremental (clampminus basal) serum insulin concentration during the last 40 min of the insulin infusion.
Koska et al. Page 3
Diabetologia. Author manuscript; available in PMC 2010 November 22.
NIH
-PA Author Manuscript
NIH
-PA Author Manuscript
NIH
-PA Author Manuscript

RandomisationOne day after the clamp, participants were randomly assigned to receive orally 3 g/day salsalate(Salsalate; Pliva, Zagreb, Croatia) or identical placebo divided in two doses for 7 days.Participants and research personnel were blinded to the assignment. Tolerance of themedication was evaluated daily by questionnaire and monitoring vital signs. The OGTT wasrepeated on day 6 of medication and the euglycaemic–hyperinsulinaemic clamp was repeatedon day 7 with the last dose of the medication being administered 1 h prior to the start of theinsulin infusion. Serum salicylate concentrations were drawn 1 h prior to the final dose ofmedication. Out of 54 participants randomised, seven did not complete the second OGTT dueto voluntary withdrawal (n=3, one of which assigned to salsalate), toothache, indigestion, chestpain and minor infection (all assigned to placebo). Six participants did not complete secondclamp because of poor venous access (n=4, two from each treatment group), anaemia or excessdrop in glycaemia during insulin infusion (3.8 mmol/l) (both from the salsalate group). Oneparticipant from the salsalate group was not included in the analysis due to an error inpreparation of the isotope solution. Details on withdrawals, see Fig. 1 in the Electronicsupplementary material (ESM).
Laboratory measurementsPlasma glucose concentrations were determined by the glucose oxidase method (BeckmanInstruments, Fullerton, CA, USA). Insulin concentrations in plasma (OGTT) or serum (clamp)were measured by an automated immunoassay (Access; Beckman Instruments). CommercialELISA was used to determine concentrations of inflammatory markers (C-reactive protein[CRP] and monocyte chemoattracting protein 1) and adiponectin in plasma (Lincoplex;Millipore, Billerica, MA, USA), and NEFA in serum (Wako Chemicals, Richmond, VA, USA).Serum salicylate concentration was determined by a colorimetric assay from Dade Behring(Milton Keynes, UK).
The activity of the p65 subunit of NF-κB in isolated monocytes from peripheral blood wasmeasured in a subgroup of 20 participants (ten from each group). Briefly, peripheral bloodmononuclear cells (PBMC) were isolated from whole blood using Ficoll-Paque Plus densitycentrifugation (Amersham Biosciences, Uppsala, Sweden). The PBMC pellet was resuspendedin 90% fetal bovine serum with 10% DMSO (vol./vol) and stored at −80°C until shipment ondry ice. Thawed PBMC samples were washed in excess PBS (pH 7.4) and centrifuged (400×g,5 min, 4°C), to remove residual fetal bovine serum and DMSO. The supernatant fraction wasdiscarded and the pellets resuspended in 100 μl of triple detergent buffer (50 mmol/l Tris HClpH 8.0; 150 mmol/l NaCl; 0.02% NaN3; 0.1% SDS; 100 μg/ml PMSF; 1 μg/ml aprotinin; 1%nonidet P-40; 0.5% sodium deoxycholate (wt/vol.), in Milli-Q H2O [Millipore]). The sampleswere then sonicated for 1 min and centrifuged (400×g, 3 min, 4°C). The resulting supernatantfraction was used for the DNA binding assay outlined below to assess p65, NFκB activity. Theprotein concentration of all protein isolates was determined using a protein assay(Bicinchoninic Acid assay; Pierce, Rockford, IL, USA) performed according to manufacturer’sinstructions. The TransAM NF-κB DNA-binding activity assay (Active Motif, Carlsbad, CA,USA) was used to detect and quantify the activity of the p65 subunit of NF-κB. Nuclear extractsfrom PBMC (30 μg protein per well) were analysed for their binding capacity to an NF-κBconsensus sequence in labelled DNA in a 96-well plate format. The assays were performedaccording to manufacturer’s instructions. Absorbance was measured on a Victor3 Multilabelplate reader (Perkin Elmer, Wellesley, MA, USA). Results are expressed as ng p65 activity/μg protein.
Concentrations of adiponectin and inflammatory markers in plasma, and of NEFA andsalicylates in serum, as well as NF-κB activity in PBMC were measured from fasting blood
Koska et al. Page 4
Diabetologia. Author manuscript; available in PMC 2010 November 22.
NIH
-PA Author Manuscript
NIH
-PA Author Manuscript
NIH
-PA Author Manuscript

samples drawn at the baseline OGTT and just prior to the isotope bolus of the secondeuglycaemic–hyperinsulinaemic clamp.
Sample size calculationSample size was estimated using Rd values of obese non-diabetic participants who underwenta euglycaemic–hyperinsulinaemic clamp in a longitudinal study of the aetiology of type 2diabetes mellitus [31]. Based on recent data (J. C. Bunt, unpublished observation), the log-transformed mean and standard deviation of Rd in this study population was 1.15 and 0.12μmol [kgEMBS]−1 min−1, respectively, and the correlation between two measurements in thesame individual was 0.88. Assuming equal correlation between placebo and treatment groups,the SD of the difference in logarithms of Rd values was calculated as 0.059. To find a differenceof 0.06 in the log of Rd values, a sample size of 17 in each group was needed to have 80%power at an alpha of 0.05.
Statistical analysesStatistical analyses were performed using software of the SAS Institute (version 8.02; Cary,NC, USA). Since the primary outcome was the change in Rd from baseline between the salsalateand placebo group, only participants who completed both clamps were included in the analyses.Secondary outcomes were changes in inflammatory markers, glucose tolerance, insulinsecretion and hepatic insulin action, as well as the association between the markers ofinflammation and metabolic characteristics of the study population. Based on the datadistribution, parametric or non-parametric tests were used to compare baseline characteristicsof the two groups (unpaired test) and to compare the response to treatment within each group(paired test). The effect of two treatments was compared by analysis of covariance (ANCOVA)using the MIXED procedure in SAS. The values of non-normally distributed variables werelogarithmically transformed to approximate normal distribution. Spearman correlation wasused to test for simple associations between the variables. Two-tailed p values less than 0.05were considered to be statistically significant.
ResultsA total of 40 participants completed the study, 22 were assigned to salsalate and 18 to placebo.Baseline clinical characteristics of the two groups were not significantly different (Table 1),although it should be noted that there was a trend towards higher Rd in the placebo group. After7 days of treatment, serum salicylate concentration was increased in all participants receivingsalsalate (range 41–232 mg/l) and remained undetectable in all participants treated with placebo(<14 mg/l) (to convert plasma salicylate values in mg/l to mmol/l multiply by 0.00724).
Oral glucose tolerance testAfter the treatment, fasting plasma glucose concentration was significantly decreased in thesalsalate group (by mean 4.7 [SD 6.5]% vs baseline, p=0.001) and remained unchanged in theplacebo group (p=0.9) (p=0.002 for between-groups comparison). The 2 h plasma glucoseconcentration was not significantly changed in any treatment group (p=0.2 salsalate, p=0.6placebo; p=0.2 between-groups comparison) (Fig. 1). In repeated measures ANOVA weobserved a significant overall lowering of glucose concentrations after treatment in the salsalategroup (p=0.01); the effect of treatment on glucose concentration did not significantly varyacross the time course of glucose responses to OGTT, i.e. there was no significanttreatment×time interaction (Fig. 1). Administration of placebo or salsalate had no significanteffect on plasma insulin concentrations during OGTT (Fig. 1). The effect of salsalate on plasmaglucose and insulin concentrations was similar in men and women. Neither changes (follow-up vs baseline) in fasting plasma glucose concentration (r=0.11, p=0.6) nor changes in glucose
Koska et al. Page 5
Diabetologia. Author manuscript; available in PMC 2010 November 22.
NIH
-PA Author Manuscript
NIH
-PA Author Manuscript
NIH
-PA Author Manuscript
AUC during OGTT (r=0.01, p=1.0) were associated with follow-up serum salicylateconcentrations in the salsalate group (r=0.17, p=0.5).
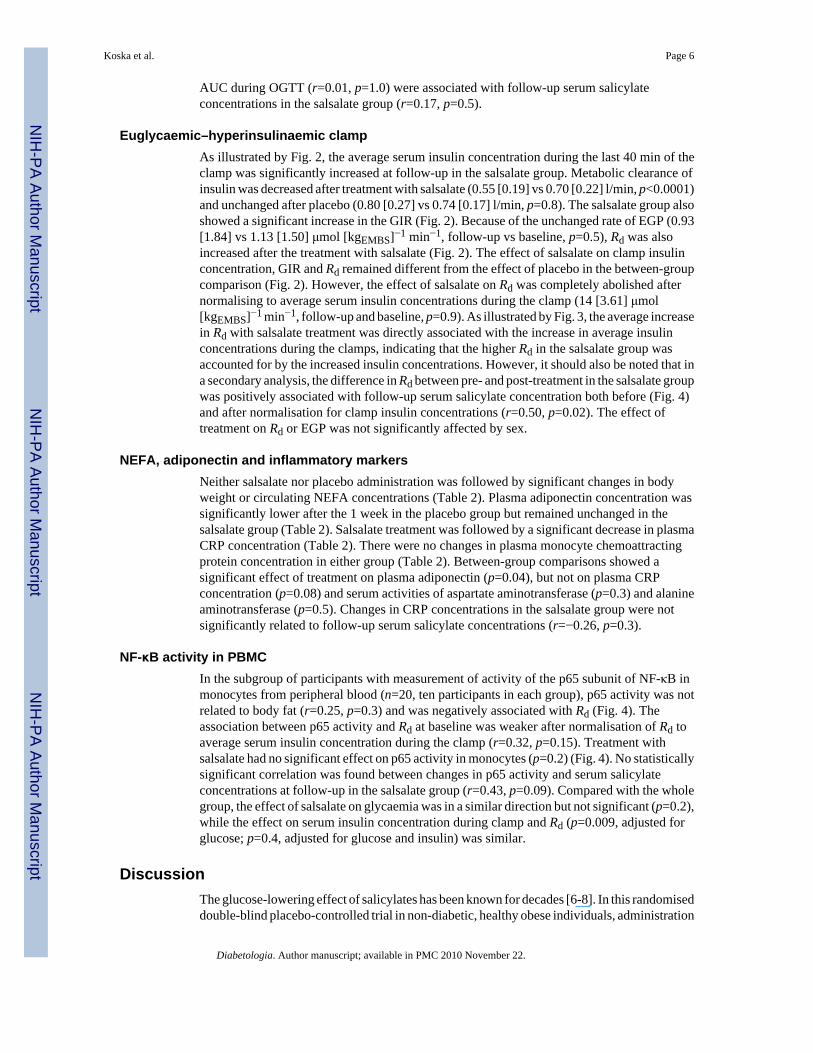
Euglycaemic–hyperinsulinaemic clampAs illustrated by Fig. 2, the average serum insulin concentration during the last 40 min of theclamp was significantly increased at follow-up in the salsalate group. Metabolic clearance ofinsulin was decreased after treatment with salsalate (0.55 [0.19] vs 0.70 [0.22] l/min, p<0.0001)and unchanged after placebo (0.80 [0.27] vs 0.74 [0.17] l/min, p=0.8). The salsalate group alsoshowed a significant increase in the GIR (Fig. 2). Because of the unchanged rate of EGP (0.93[1.84] vs 1.13 [1.50] μmol [kgEMBS]−1 min−1, follow-up vs baseline, p=0.5), Rd was alsoincreased after the treatment with salsalate (Fig. 2). The effect of salsalate on clamp insulinconcentration, GIR and Rd remained different from the effect of placebo in the between-groupcomparison (Fig. 2). However, the effect of salsalate on Rd was completely abolished afternormalising to average serum insulin concentrations during the clamp (14 [3.61] μmol[kgEMBS]−1 min−1, follow-up and baseline, p=0.9). As illustrated by Fig. 3, the average increasein Rd with salsalate treatment was directly associated with the increase in average insulinconcentrations during the clamps, indicating that the higher Rd in the salsalate group wasaccounted for by the increased insulin concentrations. However, it should also be noted that ina secondary analysis, the difference in Rd between pre- and post-treatment in the salsalate groupwas positively associated with follow-up serum salicylate concentration both before (Fig. 4)and after normalisation for clamp insulin concentrations (r=0.50, p=0.02). The effect oftreatment on Rd or EGP was not significantly affected by sex.
NEFA, adiponectin and inflammatory markersNeither salsalate nor placebo administration was followed by significant changes in bodyweight or circulating NEFA concentrations (Table 2). Plasma adiponectin concentration wassignificantly lower after the 1 week in the placebo group but remained unchanged in thesalsalate group (Table 2). Salsalate treatment was followed by a significant decrease in plasmaCRP concentration (Table 2). There were no changes in plasma monocyte chemoattractingprotein concentration in either group (Table 2). Between-group comparisons showed asignificant effect of treatment on plasma adiponectin (p=0.04), but not on plasma CRPconcentration (p=0.08) and serum activities of aspartate aminotransferase (p=0.3) and alanineaminotransferase (p=0.5). Changes in CRP concentrations in the salsalate group were notsignificantly related to follow-up serum salicylate concentrations (r=−0.26, p=0.3).
NF-κB activity in PBMCIn the subgroup of participants with measurement of activity of the p65 subunit of NF-κB inmonocytes from peripheral blood (n=20, ten participants in each group), p65 activity was notrelated to body fat (r=0.25, p=0.3) and was negatively associated with Rd (Fig. 4). Theassociation between p65 activity and Rd at baseline was weaker after normalisation of Rd toaverage serum insulin concentration during the clamp (r=0.32, p=0.15). Treatment withsalsalate had no significant effect on p65 activity in monocytes (p=0.2) (Fig. 4). No statisticallysignificant correlation was found between changes in p65 activity and serum salicylateconcentrations at follow-up in the salsalate group (r=0.43, p=0.09). Compared with the wholegroup, the effect of salsalate on glycaemia was in a similar direction but not significant (p=0.2),while the effect on serum insulin concentration during clamp and Rd (p=0.009, adjusted forglucose; p=0.4, adjusted for glucose and insulin) was similar.
DiscussionThe glucose-lowering effect of salicylates has been known for decades [6-8]. In this randomiseddouble-blind placebo-controlled trial in non-diabetic, healthy obese individuals, administration
Koska et al. Page 6
Diabetologia. Author manuscript; available in PMC 2010 November 22.
NIH
-PA Author Manuscript
NIH
-PA Author Manuscript
NIH
-PA Author Manuscript
of a therapeutic dose of salsalate for 1 week decreased fasting plasma glucose (by ~5 %) aswell as glucose, but not insulin concentrations during the OGTT. Salsalate improved apparentperipheral insulin action as measured by glucose disposal during the euglycaemic–hyperinsulinaemic clamp, but this effect was entirely due to increased serum insulinconcentrations during the clamp.
Intravenous administration of lysine acetylsalicylate increased insulin concentration in thefasting state and following various secretagogues [32]. A recent placebo-controlled study innon-diabetic individuals showed reduced C-peptide and unchanged insulin response duringOGTT in non-diabetic individuals receiving salsalate [13]. Although the authors of that studyinterpreted these results as improvement in insulin action, their findings could just as wellindicate decreased insulin clearance. Treatment with salsalate in our study significantlyincreased systemic insulin concentration during a euglycaemic–hyperinsulinaemic clampdespite no differences in insulin infusion rates. This is similar to the previously reported effectof aspirin [20], where increased insulin concentrations after aspirin were accompanied byunchanged C-peptide levels indicating lower insulin clearance. Although changes in insulinclearance appear to be the most plausible explanation of increased insulin concentration,incomplete suppression of endogenous insulin production may be an additional contributor. Infact, increasing the dose of the salicylate derivative triflusal was followed by reduced fastingplasma glucose concentration, unchanged insulin effectiveness and augmented insulinresponse during frequently sampled intravenous glucose tolerance test in a recent double-blindcrossover placebo-controlled study in obese non-diabetic individuals [33]. Furthermore, theauthors of that study performed additional in vitro experiments supporting a direct stimulatoryeffect of triflusal on insulin release from beta cells [33].
Normalisation for insulin concentration reflects the fact that whole-body glucose uptakeprogressively increases with higher rates of insulin infusions and the consequent rise insystemic insulin concentrations within the high physiological range [29,34,35]. In our study,Rd was clearly higher following salsalate administration, but normalisation to serum insulinconcentrations completely eliminated this difference. It must be noted that in prior studiesshowing improved insulin action after aspirin in humans the authors either did not report insulinconcentrations [18] or did not normalise the Rd, which was higher after aspirin treatmentcompared with baseline, to insulin concentrations [12]. In the latter study, the investigators didperform additional clamp studies in a small subgroup of participants with type 2 diabetesmatching the insulin concentrations during clamps performed on and off treatment with aspirin[12]. In this sub-study, they did find an increase in glucose disposal, indicating that theimprovement of insulin action might be independent of systemic insulin concentration. Themechanism, however, may not be an anti-inflammatory effect, but could have been secondaryto decreased glycaemia.
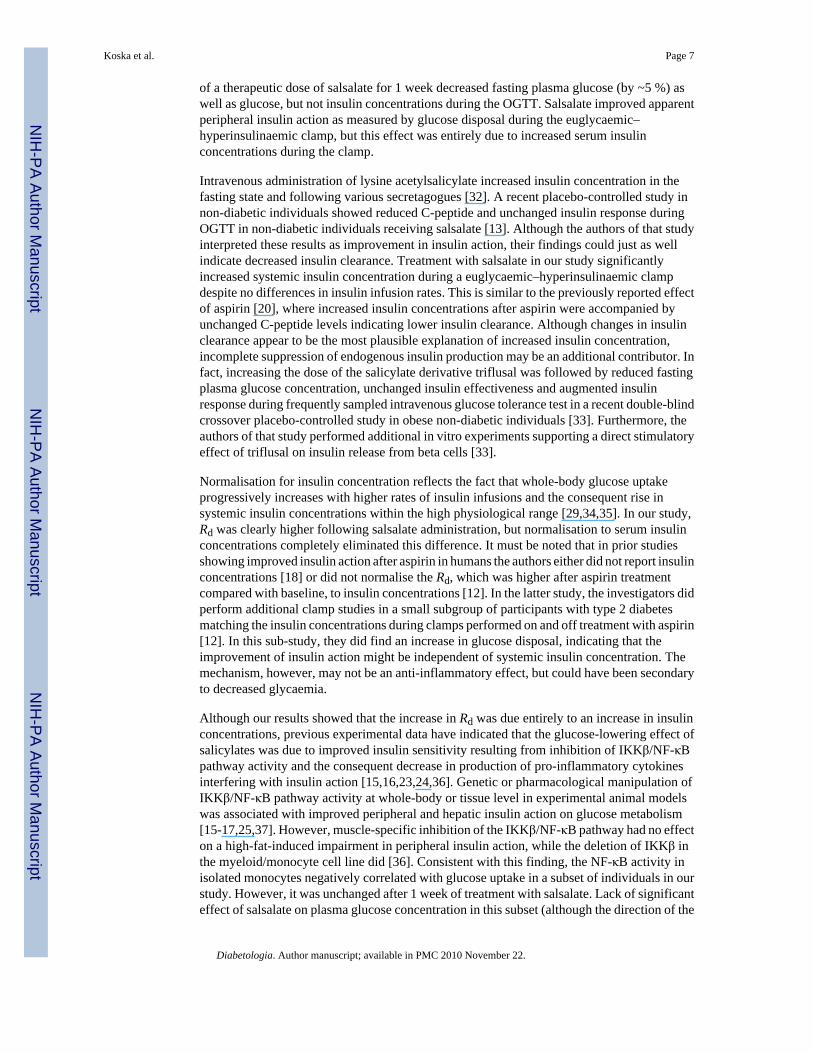
Although our results showed that the increase in Rd was due entirely to an increase in insulinconcentrations, previous experimental data have indicated that the glucose-lowering effect ofsalicylates was due to improved insulin sensitivity resulting from inhibition of IKKβ/NF-κBpathway activity and the consequent decrease in production of pro-inflammatory cytokinesinterfering with insulin action [15,16,23,24,36]. Genetic or pharmacological manipulation ofIKKβ/NF-κB pathway activity at whole-body or tissue level in experimental animal modelswas associated with improved peripheral and hepatic insulin action on glucose metabolism[15-17,25,37]. However, muscle-specific inhibition of the IKKβ/NF-κB pathway had no effecton a high-fat-induced impairment in peripheral insulin action, while the deletion of IKKβ inthe myeloid/monocyte cell line did [36]. Consistent with this finding, the NF-κB activity inisolated monocytes negatively correlated with glucose uptake in a subset of individuals in ourstudy. However, it was unchanged after 1 week of treatment with salsalate. Lack of significanteffect of salsalate on plasma glucose concentration in this subset (although the direction of the
Koska et al. Page 7
Diabetologia. Author manuscript; available in PMC 2010 November 22.
NIH
-PA Author Manuscript
NIH
-PA Author Manuscript
NIH
-PA Author Manuscript

effect was the same) and the relatively small numbers make some caution necessary wheninterpreting these data.
We cannot rule out the possibility that with a higher dose and/or longer treatment we mighthave observed inhibition of NF-κB activity and a possible improvement of insulin action viathis pathway. The salicylate concentrations in our study were below those reported in the studydescribing improvement of insulin action in participants with type 2 diabetes after 2 weeks oftreatment with, on average, 6.2 g of daily aspirin [12]. We did, however, find that changes inglucose disposal positively correlated with follow-up salicylate levels in participants receivingsalsalate. This association indicates that at higher serum salicylate concentrationsimprovements in insulin action may be partially mediated by pathways (such as NF-κB) otherthan increased concentrations of insulin in the circulation. However, as the salicylateconcentration achieved during treatment was not a randomised feature of the present study,potential confounding factors in this association are hard to exclude. The findings from therandomised treatment suggest that altered insulin clearance (or secretion) is the primary,clinically meaningful mediator of improvement in glycaemia and increase in Rd. Shouldsalicylates at high concentrations improve insulin action, the clinical relevance of this isunclear.
Experiments in rodents have shown that liver-specific inhibition of the IKKβ/NF-κB pathway[36] and treatment with salicylates [17] prevented hepatic insulin resistance. The dose of insulinused in our study was too high to accurately estimate hepatic insulin action. Almost half of allparticipants in both groups had complete suppression of EGP at baseline and follow-up.
A recent study reported that improvement of glucose tolerance after 4 weeks of treatment withsalsalate was accompanied by a significant increase in plasma adiponectin concentration[13]. In our study, adiponectin concentrations were unchanged compared with significantreductions in the placebo group. It is possible that a decrease in physical activity (activities inour inpatient unit during the study are restricted, so participants are more sedentary than infree-living conditions) accounted for the decline in adiponectin concentrations in the placebo,but this was prevented by administration of salsalate.
In conclusion, the results of our study indicate that the primary mechanism for the glucose-lowering effect of a common dose of salicylates appears to be alterations in systemic insulinconcentrations. Since reduction of glycaemia is the ultimate goal of treatment and preventionof diabetes, salicylate-based compounds may have potential for treatment or prevention of type2 diabetes. However, the mechanism by which salicylates increase insulin concentration andlower glucose remains to be determined. Furthermore, the glucose-lowering efficacy of apotential salicylate therapy would assume that the favourable metabolic effects of salicylateswould be maintained over a long period of time.
Supplementary MaterialRefer to Web version on PubMed Central for supplementary material.
AcknowledgmentsWe acknowledge P. A. Tataranni for an important contribution to study design and initiation, T. Brookshire and thenursing and dietary staffs for the care of the volunteers, and B. Anthony, S. Parrington and E. Spencer for excellentlaboratory assistance. We also thank our study participants and members of the Gila River Indian Community. Thestudy was funded by intramural programme of The National Institute of Diabetes and Digestive and Kidney Diseases.
Funding: Intramural research programme of the NIDDK/NIH/DHHS.
Koska et al. Page 8
Diabetologia. Author manuscript; available in PMC 2010 November 22.
NIH
-PA Author Manuscript
NIH
-PA Author Manuscript
NIH
-PA Author Manuscript
References1. Tataranni PA, Ortega E. A burning question: does an adipokine-induced activation of the immune
system mediate the effect of overnutrition on type 2 diabetes? Diabetes 2005;54:917–927. [PubMed:15793228]
2. Pickup JC, Crook MA. Is type II diabetes mellitus a disease of the innate immune system? Diabetologia1998;41:1241–1248. [PubMed: 9794114]
3. Hotamisligil GS. Inflammation and metabolic disorders. Nature 2006;444:860–867. [PubMed:17167474]
4. Vozarova B, Weyer C, Lindsay RS, Pratley RE, Bogardus C, Tataranni PA. High white blood cellcount is associated with a worsening of insulin sensitivity and predicts the development of type 2diabetes. Diabetes 2002;51:455–461. [PubMed: 11812755]
5. Shoelson SE, Lee J, Goldfine AB. Inflammation and insulin resistance. J Clin Invest 2006;116:1793–1801. [PubMed: 16823477]
6. Ebstein W. Zur Therapie des Diabetes mellitus, insbesondere über die Anwendung des salicylsaurenNatron bei demselben. Berliner Klinische Wochenschrift 1876;13:337–340.
7. Reid J, Macdougall AI, Andrews MM. Aspirin and diabetes mellitus. BMJ 1957;2:1071–1074.[PubMed: 13472052]
8. Williamson RT. On the treatment of glycosuria and diabetes mellitus with sodium salicylate. BMJ1901;1:760–762. [PubMed: 20759517]
9. Hecht A, Goldner MG. Reappraisal of the hypoglycemic action of acetylsalicylate. Metabolism1959;8:418–428. [PubMed: 13666386]
10. Micossi P, Pontiroli AE, Baron SH, et al. Aspirin stimulates insulin and glucagon secretion andincreases glucose tolerance in normal and diabetic subjects. Diabetes 1978;27:1196–1204. [PubMed:720774]
11. Prince RL, Larkins RG, Alford FP. The effect of acetylsalicylic acid on plasma glucose and theresponse of glucose regulatory hormones to intravenous glucose and arginine in insulin treateddiabetics and normal subjects. Metabolism 1981;30:293–298. [PubMed: 7010074]
12. Hundal RS, Petersen KF, Mayerson AB, et al. Mechanism by which high-dose aspirin improvesglucose metabolism in type 2 diabetes. J Clin Invest 2002;109:1321–1326. [PubMed: 12021247]
13. Fleischman A, Shoelson SE, Bernier R, Goldfine AB. Salsalate improves glycemia and inflammatoryparameters in obese young adults. Diabetes Care 2008;31:289–294. [PubMed: 17959861]
14. Gilgore SG, Rupp JJ. The long-term response of diabetes mellitus to salicylate therapy: report of acase. JAMA 1962;180:65–66. [PubMed: 13898587]
15. Yuan M, Konstantopoulos N, Lee J, et al. Reversal of obesity- and diet-induced insulin resistancewith salicylates or targeted disruption of Ikkbeta. Science 2001;293:1673–1677. [PubMed:11533494]
16. Kim JK, Kim YJ, Fillmore JJ, et al. Prevention of fat-induced insulin resistance by salicylate. J ClinInvest 2001;108:437–446. [PubMed: 11489937]
17. Park E, Wong V, Guan X, Oprescu AI, Giacca A. Salicylate prevents hepatic insulin resistance causedby short-term elevation of free fatty acids in vivo. J Endocrinol 2007;195:323–331. [PubMed:17951543]
18. Mohlig M, Freudenberg M, Bobbert T, et al. Acetylsalicylic acid improves lipid-induced insulinresistance in healthy men. J Clin Endocrinol Metab 2006;91:964–967. [PubMed: 16384847]
19. van der Crabben SN, Allick G, Ackermans MT, Endert E, Romijn JA, Sauerwein HP. Prolongedfasting induces peripheral insulin resistance, which is not ameliorated by high-dose salicylate. J ClinEndocrinol Metab 2008;93:638–641. [PubMed: 18056775]
20. Bratusch-Marrain PR, Vierhapper H, Komjati M, Waldhausl WK. Acetyl-salicylic acid impairsinsulin-mediated glucose utilization and reduces insulin clearance in healthy and non-insulin-dependent diabetic man. Diabetologia 1985;28:671–676. [PubMed: 3905478]
21. Newman WP, Brodows RG. Aspirin causes tissue insensitivity to insulin in normal man. J ClinEndocrinol Metab 1983;57:1102–1106. [PubMed: 6355137]
Koska et al. Page 9
Diabetologia. Author manuscript; available in PMC 2010 November 22.
NIH
-PA Author Manuscript
NIH
-PA Author Manuscript
NIH
-PA Author Manuscript

22. Giugliano D, Torella R, Siniscalchi N, Improta L, D’Onofrio F. The effect of acetylsalicylic acid oninsulin response to glucose and arginine in normal man. Diabetologia 1978;14:359–362. [PubMed:669099]
23. Karin M, Delhase M. The I kappa B kinase (IKK) and NF-kappa B: key elements of proinflammatorysignalling. Semin Immunol 2000;12:85–98. [PubMed: 10723801]
24. Yin MJ, Yamamoto Y, Gaynor RB. The anti-inflammatory agents aspirin and salicylate inhibit theactivity of IκB kinase-β. Nature 1998;396:77–80. [PubMed: 9817203]
25. Cai D, Yuan M, Frantz DF, et al. Local and systemic insulin resistance resulting from hepaticactivation of IKK-β and NF-κB. Nat Med 2005;11:183–190. [PubMed: 15685173]
26. Lillioja S, Mott DM, Howard BV, et al. Impaired glucose tolerance as a disorder of insulin action.Longitudinal and cross-sectional studies in Pima Indians. N Engl J Med 1988;318:1217–1225.[PubMed: 3283552]
27. Steele R. Influences of glucose loading and of injected insulin on hepatic glucose output. Ann N YAcad Sci 1959;82:420–430. [PubMed: 13833973]
28. Best JD, Taborsky GJ, Halter JB, Porte D. Glucose disposal is not proportional to plasma glucoselevel in man. Diabetes 1981;30:847–850. [PubMed: 6115785]
29. Yki-Jarvinen H, Mott D, Young AA, Stone K, Bogardus C. Regulation of glycogen synthase andphosphorylase activities by glucose and insulin in human skeletal muscle. J Clin Invest 1987;80:95–100. [PubMed: 3110217]
30. Lillioja S, Bogardus C. Obesity and insulin resistance: lessons learned from the Pima Indians. DiabetesMetab Rev 1988;4:517–540. [PubMed: 3061759]
31. Bogardus C, Lillioja S, Bennett PH. Pathogenesis of NIDDM in Pima Indians. Diabetes Care1991;14:685–690. [PubMed: 1914819]
32. Giugliano D, Cozzolino D, Ceriello A, et al. Studies on the mechanism of salicylate-induced increaseof insulin secretion in man. Diabete Metab 1988;14:431–436. [PubMed: 2906299]
33. Fernandez-Real JM, Lopez-Bermejo A, Ropero AB, et al. Salicylates increase insulin secretion inhealthy obese subjects. J Clin Endocrinol Metab 2008;93:2523–2530. [PubMed: 18460568]
34. Hother-Nielsen O, Henriksen JE, Holst JJ, Beck-Nielsen H. Effects of insulin on glucose turnoverrates in vivo: isotope dilution versus constant specific activity technique. Metabolism 1996;45:82–91. [PubMed: 8544782]
35. Thiebaud D, Jacot E, DeFronzo RA, Maeder E, Jequier E, Felber JP. The effect of graded doses ofinsulin on total glucose uptake, glucose oxidation, and glucose storage in man. Diabetes1982;31:957–963. [PubMed: 6757014]
36. Arkan MC, Hevener AL, Greten FR, et al. IKK-β links inflammation to obesity-induced insulinresistance. Nat Med 2005;11:191–198. [PubMed: 15685170]
37. Rohl M, Pasparakis M, Baudler S, et al. Conditional disruption of IκB kinase 2 fails to prevent obesity-induced insulin resistance. J Clin Invest 2004;113:474–481. [PubMed: 14755344]
Abbreviations
ANCOVA analysis of covariance
CRP C-reactive protein
EGP endogenous glucose production
EMBS estimated metabolic body size
GIR glucose infusion rate
IKK IκB kinase
NF-κB nuclear factor-κB
PBMC peripheral blood mononuclear cells
Ra rate of glucose appearance
Koska et al. Page 10
Diabetologia. Author manuscript; available in PMC 2010 November 22.
NIH
-PA Author Manuscript
NIH
-PA Author Manuscript
NIH
-PA Author Manuscript

Rd rate of glucose disposal
Koska et al. Page 11
Diabetologia. Author manuscript; available in PMC 2010 November 22.
NIH
-PA Author Manuscript
NIH
-PA Author Manuscript
NIH
-PA Author Manuscript

Fig. 1.Plasma glucose and insulin concentrations (means and SD) during an OGTT at baseline (whitecircles) and after 6 days of treatment (black circles) with placebo (a, c) or salsalate (b, d).Repeated-measures ANOVA was used to test for the effects of time (p<0.0001 all models) andvisit (follow-up vs baseline; glucose: p=0.2 after placebo, p=0.01 after salsalate; insulin: p=1.0both), and for the visit × time interaction within each treatment group (glucose: p=0.9 placebo,p=0.4 salsalate; insulin: p=1.0 both groups). Between-group comparison (ANCOVA): group(placebo vs salsalate) × visit, p=0.007; group × visit × time, p=0.8
Koska et al. Page 12
Diabetologia. Author manuscript; available in PMC 2010 November 22.
NIH
-PA Author Manuscript
NIH
-PA Author Manuscript
NIH
-PA Author Manuscript
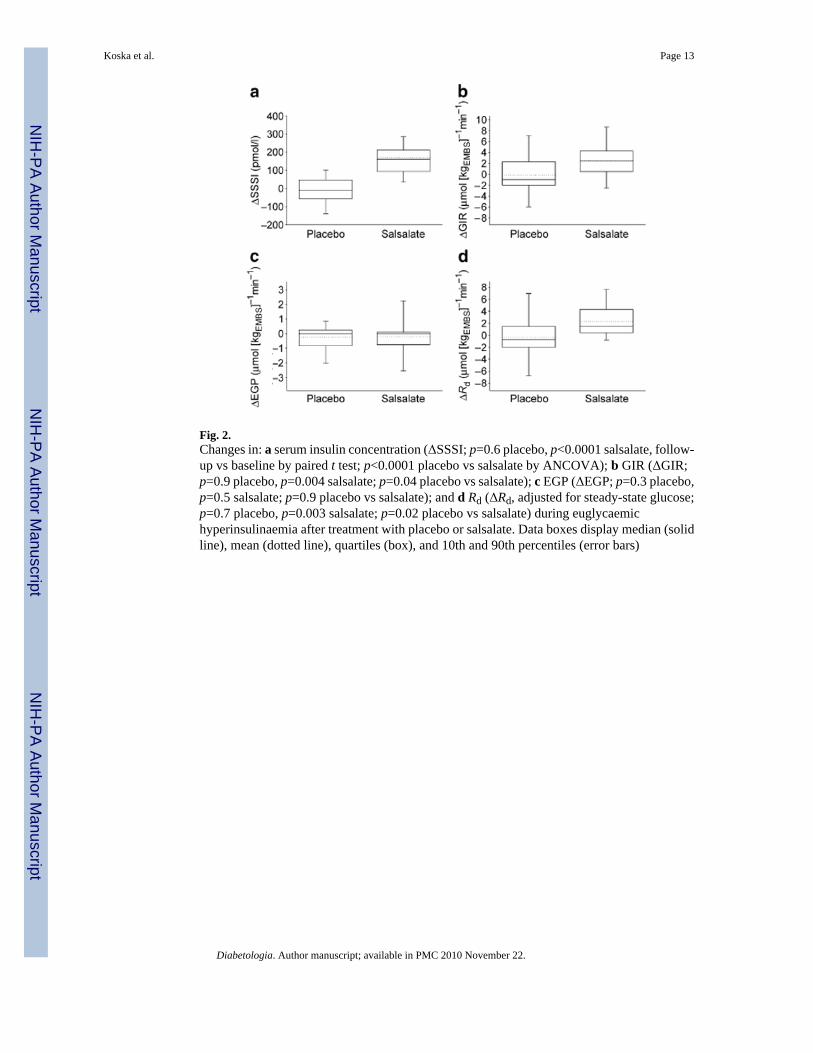
Fig. 2.Changes in: a serum insulin concentration (ΔSSSI; p=0.6 placebo, p<0.0001 salsalate, follow-up vs baseline by paired t test; p<0.0001 placebo vs salsalate by ANCOVA); b GIR (ΔGIR;p=0.9 placebo, p=0.004 salsalate; p=0.04 placebo vs salsalate); c EGP (ΔEGP; p=0.3 placebo,p=0.5 salsalate; p=0.9 placebo vs salsalate); and d Rd (ΔRd, adjusted for steady-state glucose;p=0.7 placebo, p=0.003 salsalate; p=0.02 placebo vs salsalate) during euglycaemichyperinsulinaemia after treatment with placebo or salsalate. Data boxes display median (solidline), mean (dotted line), quartiles (box), and 10th and 90th percentiles (error bars)
Koska et al. Page 13
Diabetologia. Author manuscript; available in PMC 2010 November 22.
NIH
-PA Author Manuscript
NIH
-PA Author Manuscript
NIH
-PA Author Manuscript

Fig. 3.Change in Rd and serum insulin concentration from fasting state to euglycaemichyperinsulinaemia at baseline (white circles) and after 7 days of treatment (black circles) withplacebo (a) or salsalate (b) demonstrating that the increase in Rd during the clamp is directlyassociated with the increase in insulin concentration. Fasting Rd was assumed to be equal tothe Ra (steady-state assumption) and clamp Rd was equal to M normalised to steady-stateplasma glucose concentration. Data are shown as means (SE)
Koska et al. Page 14
Diabetologia. Author manuscript; available in PMC 2010 November 22.
NIH
-PA Author Manuscript
NIH
-PA Author Manuscript
NIH
-PA Author Manuscript
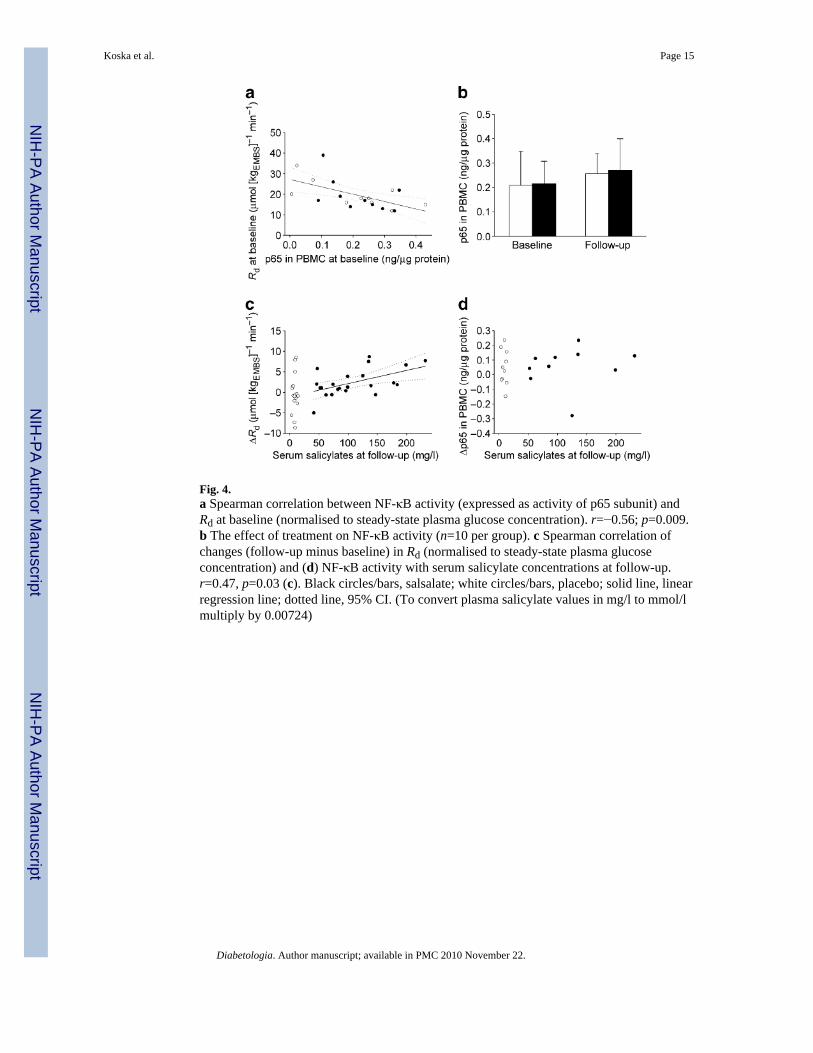
Fig. 4.a Spearman correlation between NF-κB activity (expressed as activity of p65 subunit) andRd at baseline (normalised to steady-state plasma glucose concentration). r=−0.56; p=0.009.b The effect of treatment on NF-κB activity (n=10 per group). c Spearman correlation ofchanges (follow-up minus baseline) in Rd (normalised to steady-state plasma glucoseconcentration) and (d) NF-κB activity with serum salicylate concentrations at follow-up.r=0.47, p=0.03 (c). Black circles/bars, salsalate; white circles/bars, placebo; solid line, linearregression line; dotted line, 95% CI. (To convert plasma salicylate values in mg/l to mmol/lmultiply by 0.00724)
Koska et al. Page 15
Diabetologia. Author manuscript; available in PMC 2010 November 22.
NIH
-PA Author Manuscript
NIH
-PA Author Manuscript
NIH
-PA Author Manuscript

NIH
-PA Author Manuscript
NIH
-PA Author Manuscript
NIH
-PA Author Manuscript
Koska et al. Page 16
Table 1
Baseline characteristics of the study population by treatment group
Characteristic Placebo Salsalate p value
n 18 22 –
Men/women (n) 9/9 10/12 1.0
Ethnicity (W/N/H) 3/14/1 3/19/0 0.6
Age (years) 33 (8) 29 (7) 0.2
BMI (kg/m2) 38 (6) 37 (5) 0.7
Body fat (%) 38 (7) 38 (6) 0.9
Fasting plasma glucose (mmol/l) 5.06 (0.33) 5.11 (0.33) 0.9
2 h plasma glucose (mmol/l) 6.61 (1.83) 6.67 (1.17) 0.9
Fasting plasma insulin (pmol/l) 63 (49, 90) 80 (56, 104) 0.3
Basal EGP (μmol [kgEMBS]−1 min−1) 11 (2) 10 (2) 0.2
Clamp EGP (μmol [kgEMBS]−1 min−1) 0 (0, 3) 0 (0, 2) 0.8
Clamp Rd (μmol [kgEMBS]−1 min−1)a 16 (13, 20) 13 (11, 15) 0.09
Unless otherwise stated, data are means (SD) or medians (25th, 75th percentile)
aRd normalised for steady-state plasma glucose and serum insulin concentrations
p values were determined by Mantel–Haenszel test on categories, Student’s t test on means and Wilcoxon’s U test on medians; W, Whites; N, NativeAmericans; H, Hispanics
Diabetologia. Author manuscript; available in PMC 2010 November 22.

NIH
-PA Author Manuscript
NIH
-PA Author Manuscript
NIH
-PA Author Manuscript
Koska et al. Page 17
Table 2
The effect of placebo or salsalate on metabolic characteristics and inflammatory markers
Characteristic Placebo (n=18) Salsalate (n=22)
Baseline Follow-up Baseline Follow-up
Body weight (kg) 103 (89, 118) 103 (89, 117) 109 (93, 114) 109 (93, 114)
NEFA (μmol/l) 385 (320, 430) 390 (320, 440) 345 (295, 500) 435 (385, 500)
Adiponectin (mg/l) 4.3 (3.7, 5.7) 3.5 (2.8, 5.1)a 5.2 (4.0, 7.5) 5.2 (3.2, 6.9)
hsCRP (ng/l) 55 (33, 120) 60 (20, 108) 63 (16, 89) 39 (12, 69)a
MCP-1 (ng/l) 118 (99, 152) 119 (110, 132) 109 (92, 165) 109 (80, 141)
Data are medians (25th, 75th percentile)
ap<0.05 (Wilcoxon’s signed ranks test)
hsCRP, high sensitivity C-reactive protein; MCP-1, monocyte chemoattracting protein 1
Diabetologia. Author manuscript; available in PMC 2010 November 22.